alternative wastewater treatment design for - csu, chico
TRANSCRIPT

1
Alternative Wastewater Treatment Design for
Panajachel, Guatemala
Sustainable Engineering and
Environmental Health for Development (SEEHD)
Student Group Department of Civil Engineering California State University, Chico
November 2010
Lead Author: Alyssa Stutz Collaborating Authors: (in Alphabetacle Order) Paul Anderson Tim Arnold Francis Booth Brendan Finn Kystle Galindo Lisa Hall Nicholas Mcgann Frank O´Connell Shane Salvador Editors: (in Alphabetacle Order)
Tim Arnold Stewart Oakley
ALL RIGHTS RESERVED. Copyright © 2010 SEEHD

Table of Contents Executive Summary .........................................................................................................................1
Figure 1: Proposed Anaerobic 2-Pond System with Facultative Pond ................................... 2 Figure 2: Three WSTR Batch Sequential System................................................................... 3
Table 1: Summary of Findings ............................................................................................... 4 Population Estimates........................................................................................................................5
Figure 3: Population Estimates Plotted on a Yearly Basis. .................................................... 5 Average Daily Flow Estimates ........................................................................................................5
Table 2: Flow Estimates.......................................................................................................... 6 Loading Estimates............................................................................................................................6
Preliminary Treatment .....................................................................................................................6 Bar Rack Design ..........................................................................................................................6
Table 3: Bar Rack Dimensions ............................................................................................... 6 Grit Chamber ...............................................................................................................................7
Table 4: Grit Chamber Dimensions ........................................................................................ 7 Figure 4: Parshall Flume Detail .............................................................................................. 7
Figure 5: Detail of Bar Rack................................................................................................... 8 Figure 6: 3-D and Scale Models of Grit Chamber and Parshall Flume .................................. 8
Available Land Area ........................................................................................................................9 Figure 7: Topographic Map of Basin Outlet........................................................................... 9
Table 5: Pump Efficiencies and Monthly Cost ....................................................................... 9 Wastewater Stabilization Ponds.....................................................................................................10
Feasibility of Facultative Pond ..................................................................................................10 Figure 8: Solar Insulation for Panajachel (data taken from CropWat and NASA) .............. 10
Table 6: Facultative Ponds in Parallel Summary.................................................................. 10 Feasibility of Anaerobic Pond ...................................................................................................10
Table 7: Anaerobic Pond Calculation Summary .................................................................. 11 Table 8: Methane Production................................................................................................ 12
Wastewater Storage and Treatment Reservoir (WSTR) for Type I Irrigation...............................12 Table 9: Fill-Rest-Use Example Cycle ................................................................................. 13

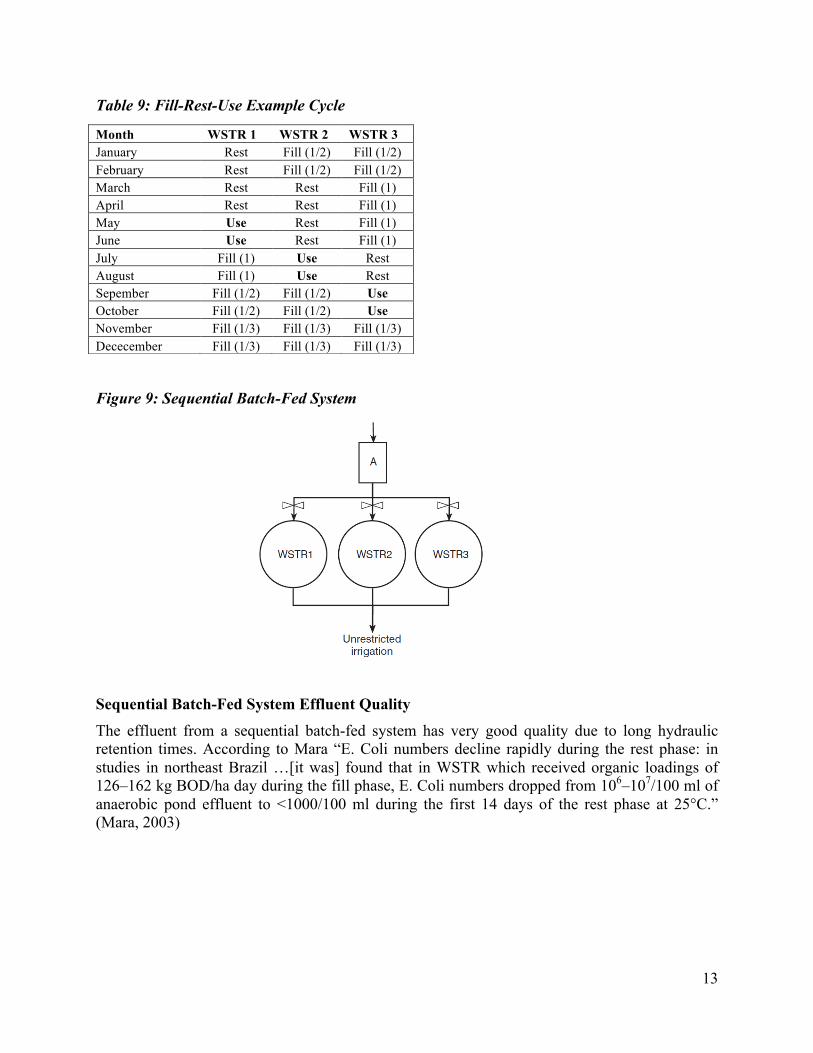
Figure 9: Sequential Batch-Fed System................................................................................ 13 Sequential Batch-Fed System Effluent Quality .........................................................................13
System Configuration ....................................................................................................................14 Figure 10: Route of Pressure Trunk Line ............................................................................. 14
Figure 11: Plan View of Anaerobic Pond System ................................................................ 14 Comparative Life Cycle Assessment of Operation for the Two Alternatives ...............................15
Activated Sludge System...........................................................................................................15 Anaerobic/facultative or no-pond system..................................................................................15
References......................................................................................................................................16
Appendix A: Population and Loading Rates .................................................................................17 Appendix B: Activated Sludge Calculations .................................................................................18
Appendix C: N and P Values, Methane, and Facultative and Anaerobic Pond Calculations.......19 Appendix D: Log Removal Calculations.......................................................................................20
Appendix E: WSTR Calculations ..................................................................................................21


1
Executive Summary Introduction / Objectives
The object of this project is to design the process for a natural wastewater treatment/reuse system for the city of Panajachel, Guatemala in order to protect the water quality of Lake Atitlan. This natural system will serve as a model for other cities within the lake’s drainage basin, and will use pumping for land disposal/irrigation in lieu of direct discharge into the lake. The final design will be compared to the currently proposed activated sludge/chemical precipitation system by using life cycle assessment. Population Estimates
The population estimates for the years 2011 and 2021 are 14,263 and 17,536, respectively. Average Daily Flowrate
The average daily flowrate used throughout the calculations of this project is 2,100 cubic meters per day.
Loading Rates The Total Suspended Solids (TSS) and the Biochemical Oxygen Demand (BOD5) loading rates each equate to 526 kilograms per day. Available Land Area and Pumping Head
The amount of pipe it would take to pump wastewater effluent from Panajachel to the basin outlet near Papaturro is approximately 18,875 meters and a static pump head (elevation difference) of approximately 30 meters. The pumping costs rely heavily on the efficiency of the pump. For a high pump efficiency (basically pumping pure water) the energy requirement would be near 80,000 kilowatt hours per year or around $17,800 dollars per year. If raw effluent is pumped, the efficiency of the pump decreases and the cost to pump goes up to roughly $39,890 dollars per year. Wastewater Stabilization Ponds
The total area required for a facultative pond serving the population of Panajachel is about 17,490 square meters – space that is not available in Panajachel. The total area required for an anaerobic pond is 438 square meters – space that is available in Panajachel. Ideally, two anaerobic ponds in parallel should be constructed so that while one pond is being desludged, the other can be in operation. The ponds would have to be desludged about every 2.8 years. For two ponds in parallel, and a length to width ratio of 2/1, the length and width for each pond are 21 meters and 10 meters, respectively. The hydraulic retention time is roughly 0.8 days (19.2 hours) which gives an E. Coli Log10 removal of about 0.5. The amount of methane these ponds would produce is about 67,200 cubic meters per year which equates to 668,232 kilowatt hours of usable energy per year. Once the wastewater passes through the anaerobic ponds, approximately 70 percent of the BOD will be removed. This means that a facultative pond following two anaerobic ponds in parallel would create a very efficient system. Constructing a facultative pond to follow the two anaerobic ponds would only require an additional 5,250 square meters which is available.

2
Figure 1: Proposed Anaerobic 2-Pond System with Facultative Pond
Wastewater Storage and Treatment Reservoir (WSTR) for Type I Irrigation The volume needed for the construction of one WSTR is 340,550 cubic meters, or in terms of area, 3.4 hectares at a depth of 10 meters. For a three WSTR sequential batch-fed system, a volume of 252,000 cubic meters or an area of 2.5 hectares (with a depth of 10 meters) is needed for each pond. A three WSTR sequential batch-fed system will produce a much higher quality effluent, yet will require three times the amount of surface area (2.5 ha x 3 ponds = 7.5 ha). The area is available though so a batch sequential system should be constructed.
2 Anaerobic Ponds each with
Length = 21 m and Width = 10 m
Facultative Pond with
Length = 125 m And Width = 42 m

3
Figure 2: Three WSTR Batch Sequential System
Activated Sludge System The energy required for aeration and mixing per year is 319,150 kilowatt hours. The annual cost to operate the plant for electricity alone is $72,396 per year. Ferric chloride will be required to operate the plant as well – a quantity of 82,070 kilograms per year. The carbon footprint of the plant based on the electricity consumption is 255,316,580 grams of CO2 equivalent per year. The chance of the activated sludge system succeeding is small.
Anaerobic Pond System or No pond system (near Panajachel) The energy required for pumping horizontally 18,875 meters and vertically 30 meters depends greatly on the pump efficiency. The efficiency of a pump pumping effluent from an anaerobic / facultative pond system will be greater than the efficiency of a pump pumping raw effluent. Also, the methane produced from the anaerobic ponds produces more energy than what is required to pump the effluent to the WSTRs. In either case (pond system or no pond system), the annual cost is still much less than the activated sludge system. The annual cost to operate the pumps with high and low efficiencies is $17,690 and $39,890, respectively.
Values for nitrogen and phosphorus produced by the effluent equate to $38,400 per year and $225,970 per year, respectively.
The likelihood of either alternative to succeed is much greater than that of installing an activated sludge plant.
Three WSTRs each with
Diameter = 179 m
4
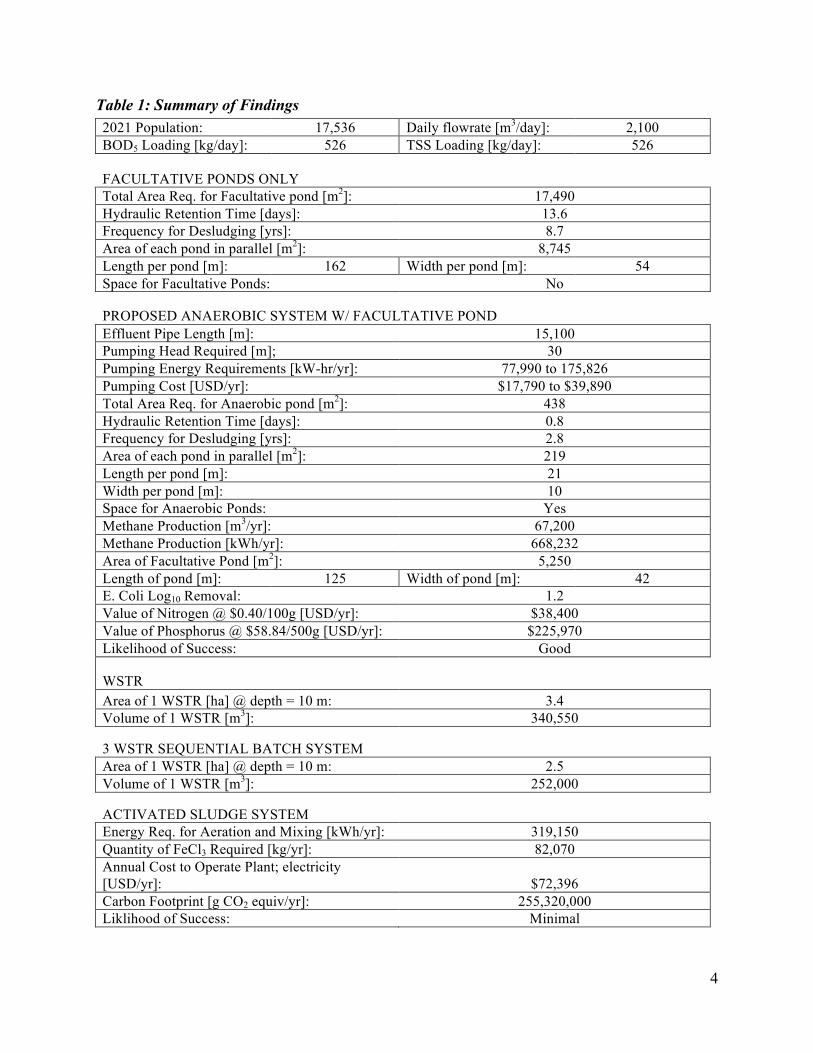
Table 1: Summary of Findings 2021 Population: 17,536 Daily flowrate [m3/day]: 2,100 BOD5 Loading [kg/day]: 526 TSS Loading [kg/day]: 526
FACULTATIVE PONDS ONLY Total Area Req. for Facultative pond [m2]: 17,490 Hydraulic Retention Time [days]: 13.6 Frequency for Desludging [yrs]: 8.7 Area of each pond in parallel [m2]: 8,745 Length per pond [m]: 162 Width per pond [m]: 54 Space for Facultative Ponds: No
PROPOSED ANAEROBIC SYSTEM W/ FACULTATIVE POND Effluent Pipe Length [m]: 15,100 Pumping Head Required [m]; 30 Pumping Energy Requirements [kW-hr/yr]: 77,990 to 175,826 Pumping Cost [USD/yr]: $17,790 to $39,890 Total Area Req. for Anaerobic pond [m2]: 438 Hydraulic Retention Time [days]: 0.8 Frequency for Desludging [yrs]: 2.8 Area of each pond in parallel [m2]: 219 Length per pond [m]: 21 Width per pond [m]: 10 Space for Anaerobic Ponds: Yes Methane Production [m3/yr]: 67,200 Methane Production [kWh/yr]: 668,232 Area of Facultative Pond [m2]: 5,250 Length of pond [m]: 125 Width of pond [m]: 42 E. Coli Log10 Removal: 1.2 Value of Nitrogen @ $0.40/100g [USD/yr]: $38,400 Value of Phosphorus @ $58.84/500g [USD/yr]: $225,970 Likelihood of Success: Good
WSTR Area of 1 WSTR [ha] @ depth = 10 m: 3.4 Volume of 1 WSTR [m3]: 340,550
3 WSTR SEQUENTIAL BATCH SYSTEM Area of 1 WSTR [ha] @ depth = 10 m: 2.5 Volume of 1 WSTR [m3]: 252,000
ACTIVATED SLUDGE SYSTEM Energy Req. for Aeration and Mixing [kWh/yr]: 319,150 Quantity of FeCl3 Required [kg/yr]: 82,070 Annual Cost to Operate Plant; electricity [USD/yr]: $72,396 Carbon Footprint [g CO2 equiv/yr]: 255,320,000 Liklihood of Success: Minimal
5
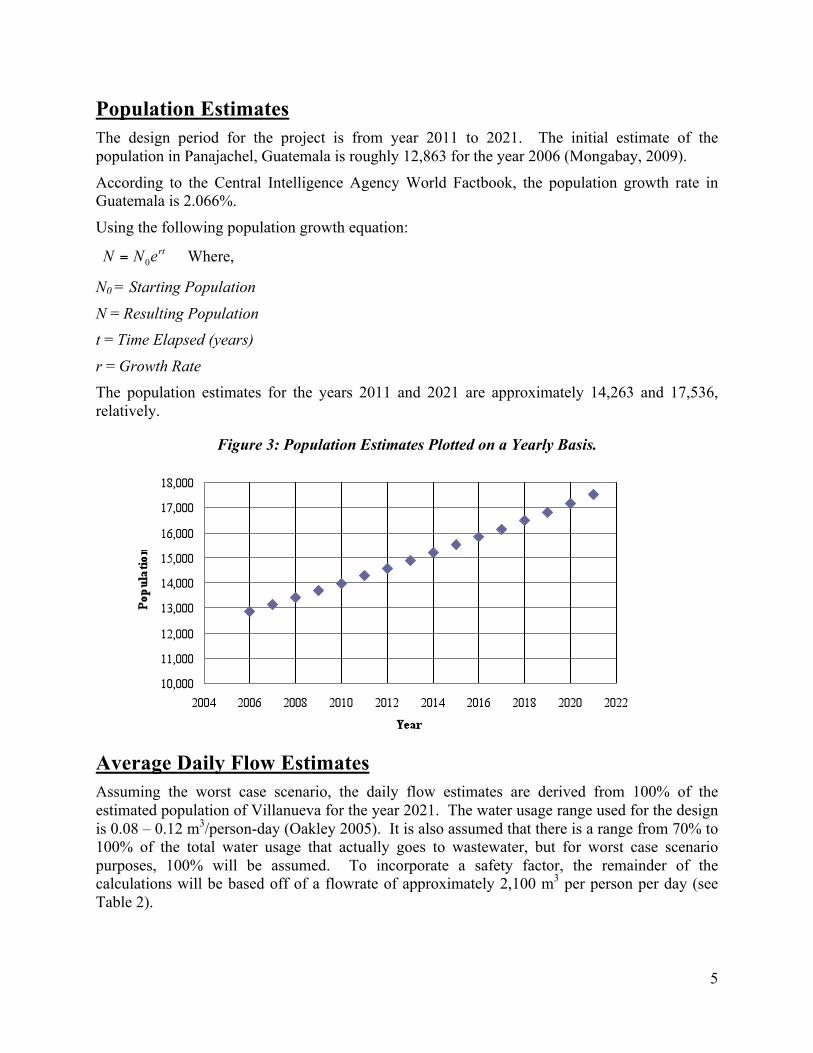
Population Estimates The design period for the project is from year 2011 to 2021. The initial estimate of the population in Panajachel, Guatemala is roughly 12,863 for the year 2006 (Mongabay, 2009).
According to the Central Intelligence Agency World Factbook, the population growth rate in Guatemala is 2.066%.
Using the following population growth equation:
Where,
N0 = Starting Population
N = Resulting Population t = Time Elapsed (years)
r = Growth Rate The population estimates for the years 2011 and 2021 are approximately 14,263 and 17,536, relatively.
Figure 3: Population Estimates Plotted on a Yearly Basis.
Average Daily Flow Estimates Assuming the worst case scenario, the daily flow estimates are derived from 100% of the estimated population of Villanueva for the year 2021. The water usage range used for the design is 0.08 – 0.12 m3/person-day (Oakley 2005). It is also assumed that there is a range from 70% to 100% of the total water usage that actually goes to wastewater, but for worst case scenario purposes, 100% will be assumed. To incorporate a safety factor, the remainder of the calculations will be based off of a flowrate of approximately 2,100 m3 per person per day (see Table 2).

6
Table 2: Flow Estimates
% Connected to Sewer 100% 2021 Pop. 17,536 Water Usage [m3/person-day] 0.08 0.10 0.12 100% of Water Used goes to Wastewater 1,403 1,754 2,104 90% of Water Used goes to Wastewater 1,263 1,578 1,894 80% of Water Used goes to Wastewater 1,122 1,403 1,683 70% of Water Used goes to Wastewater 982 1,228 1,473
Loading Estimates The total BOD5 and Total Suspended Solids loadings were calculated using an influent loading rate of 250 milligrams per liter. To calculate the BOD5 and TSS loadings, averages were taken from the “Wastewater Problems at Lago Atitlan” powerpoint (Salguero, Oakley and Henry, 2010). Both the BOD5 and TSS loadings were calculated to be 526 kilograms per day. Using a system with either two facultative or two anaerobic ponds gives BOD5 and TSS loading rates of 263 kilograms per day per pond.
Preliminary Treatment Bar Rack Design
The design for the Bar Rack was taken from Section 3 of the “Lagunas de estabilizacion en Honduras” manual (Oakley, 2005). The bar width, depth, spacing, and angle from horizontal were assumed values from Table 3-1 of the manual. Aluminum was chosen for the bar material over galvanized steel because it is less expensive and lighter. As long as the bar rack is maintained, aluminum will work just as well as steel. A length of 1.5 meters for the approach channel was chosen because it needed to be more than 1.35 meters in length. The depth of the approach channel is equivalent to the depth of the grit chamber (from Table 4).
Table 3: Bar Rack Dimensions Bar Width [mm]: 10 Bar Depth [mm]: 30 Space between Bars [mm]: 50 Bar Material: Aluminum Angle from Horiz. [deg]: 45 Length Appr. Chanl [m]: 1.5 Depth Appr. Chanl [m]: 0.136 Width of Approach Channel [m]: 0.358 Approach Velocity [m/s]: 0.45 Velocity through Bars: 0.5 Head loss through Bars: 0.008 Frequency of Cleaning: Daily Screenings disposal method: Bury
7
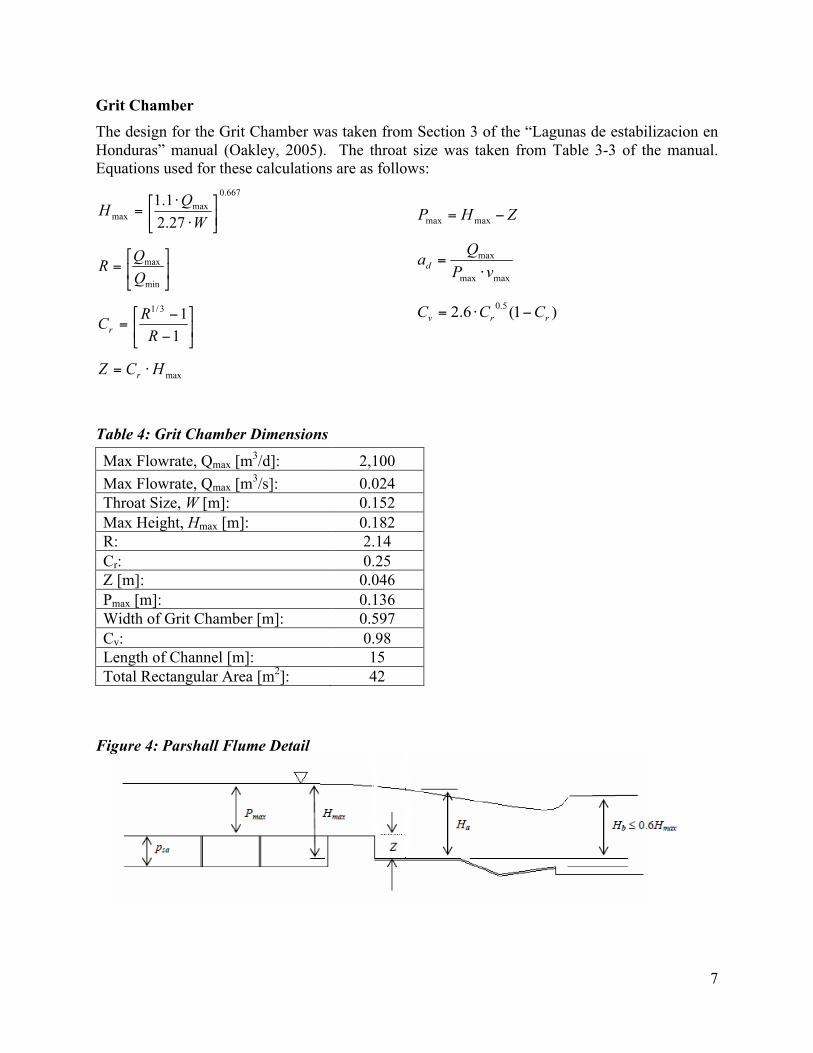
Grit Chamber The design for the Grit Chamber was taken from Section 3 of the “Lagunas de estabilizacion en Honduras” manual (Oakley, 2005). The throat size was taken from Table 3-3 of the manual. Equations used for these calculations are as follows:
Table 4: Grit Chamber Dimensions
Max Flowrate, Qmax [m3/d]: 2,100 Max Flowrate, Qmax [m3/s]: 0.024 Throat Size, W [m]: 0.152 Max Height, Hmax [m]: 0.182 R: 2.14 Cr: 0.25 Z [m]: 0.046 Pmax [m]: 0.136 Width of Grit Chamber [m]: 0.597 Cv: 0.98 Length of Channel [m]: 15 Total Rectangular Area [m2]: 42
Figure 4: Parshall Flume Detail

8
Figure 5: Detail of Bar Rack
Figure 6: 3-D and Scale Models of Grit Chamber and Parshall Flume
9
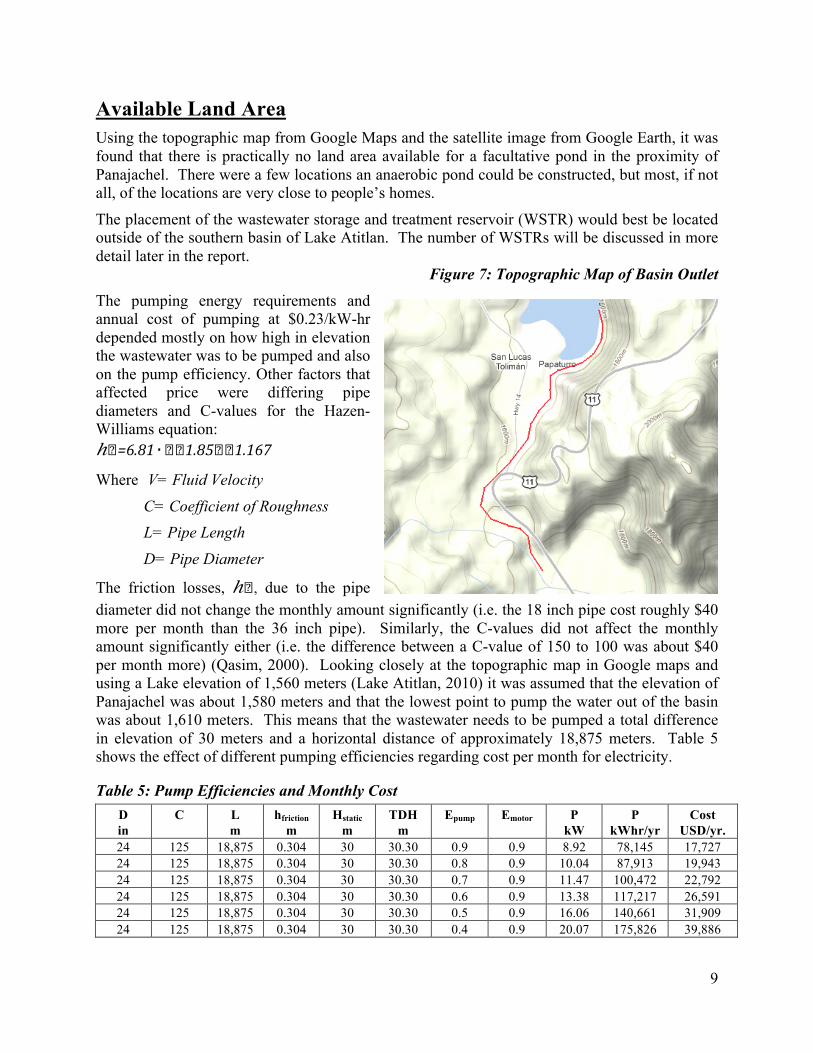
Available Land Area Using the topographic map from Google Maps and the satellite image from Google Earth, it was found that there is practically no land area available for a facultative pond in the proximity of Panajachel. There were a few locations an anaerobic pond could be constructed, but most, if not all, of the locations are very close to people’s homes.
The placement of the wastewater storage and treatment reservoir (WSTR) would best be located outside of the southern basin of Lake Atitlan. The number of WSTRs will be discussed in more detail later in the report. Figure 7: Topographic Map of Basin Outlet
The pumping energy requirements and annual cost of pumping at $0.23/kW-hr depended mostly on how high in elevation the wastewater was to be pumped and also on the pump efficiency. Other factors that affected price were differing pipe diameters and C-values for the Hazen-Williams equation: ℎ�=6.81⋅��1.85��1.167
Where V= Fluid Velocity
C= Coefficient of Roughness L= Pipe Length
D= Pipe Diameter
The friction losses, ℎ�, due to the pipe diameter did not change the monthly amount significantly (i.e. the 18 inch pipe cost roughly $40 more per month than the 36 inch pipe). Similarly, the C-values did not affect the monthly amount significantly either (i.e. the difference between a C-value of 150 to 100 was about $40 per month more) (Qasim, 2000). Looking closely at the topographic map in Google maps and using a Lake elevation of 1,560 meters (Lake Atitlan, 2010) it was assumed that the elevation of Panajachel was about 1,580 meters and that the lowest point to pump the water out of the basin was about 1,610 meters. This means that the wastewater needs to be pumped a total difference in elevation of 30 meters and a horizontal distance of approximately 18,875 meters. Table 5 shows the effect of different pumping efficiencies regarding cost per month for electricity.
Table 5: Pump Efficiencies and Monthly Cost D C L hfriction Hstatic TDH Epump Emotor P P Cost in m m m m kW kWhr/yr USD/yr. 24 125 18,875 0.304 30 30.30 0.9 0.9 8.92 78,145 17,727 24 125 18,875 0.304 30 30.30 0.8 0.9 10.04 87,913 19,943 24 125 18,875 0.304 30 30.30 0.7 0.9 11.47 100,472 22,792 24 125 18,875 0.304 30 30.30 0.6 0.9 13.38 117,217 26,591 24 125 18,875 0.304 30 30.30 0.5 0.9 16.06 140,661 31,909 24 125 18,875 0.304 30 30.30 0.4 0.9 20.07 175,826 39,886

10
Wastewater Stabilization Ponds Feasibility of Facultative Pond
A facultative pond in Panajachel would require an area of 17,500 square meters or 1.75 ha. Finding this amount of space would be very difficult to accomplish in Panajachel. If 1.75 ha were available for the installation of a facultative pond system then it is suggested that two facultative ponds be constructed in parallel so that while one is being desludged, the other can remain in operation. The pond area equations used to calculate the required area were taken from Section 5 of the “Lagunas de estabilizacion en Honduras” manual (Oakley, 2005). The CSm value was calculated using the lowest energy value from the CropWat / NASA data.
Figure 8: Solar Insulation for Panajachel (data taken from CropWat and NASA)
Table 6: Facultative Ponds in Parallel Summary
AF per pond [m2]: 8,743 Width per pond [m]: 54 Length per pond [m]: 162 HRT [days]: ~14 Sludge accumulation rate [m3/yr]: 820 Frequency of Desludging [yrs]: 8.7
Feasibility of Anaerobic Pond An anaerobic pond in Panajachel would require an area of 440 square meters or 0.04 hectares (1/40 of the area required for the facultative pond). It is suggested that two anaerobic ponds be constructed in parallel so that while one is being desludged, the other can remain in operation.

11
The ponds would have to be desludged about every 2.8 years. For two ponds in parallel, and a length to width ratio of 2/1, the length and width for each pond are 21 meters and 10 meters, respectively. The hydraulic retention time is roughly 0.8 days (19.2 hours) which gives an E. Coli Log10 removal of about 0.5. The amount of methane these ponds would produce is approximately 67,200 cubic meters per year which equates to 668,232 kilowatt hours. The rate for sludge accumulation in anaerobic ponds in warm climates is 0.04 cubic meters per person per day (Mara 2003). It is said that rates could be as low as 0.01 but the high value is used in this case as a factor of safety.
Once the effluent goes through the anaerobic ponds, approximately 70 percent of the BOD will be removed. This means that a facultative pond following two anaerobic ponds in parallel would create a very efficient system. If a facultative pond followed the two anaerobic ponds, the facultative pond would only require 5,250 square meters more of space (which is available).
Table 7 is a summary of the dimensions and volumes needed for an anaerobic system. The pond area equations used to calculate the required areas and volumes were taken from Section 5 of the “Lagunas de estabilizacion en Honduras” manual (Oakley, 2005).
Table 7: Anaerobic Pond Calculation Summary
Qmax [m3/day]: 2,100 BOD5 [mg/l]: 250 Volume [m3]: 1,750 Depth [m]: 4 Area required for Single Anaerobic Pond [m2]: 438 Area required for Single Anaerobic Pond [m2]: 0.044 Length [m]: 36 Width [m]: 12 Annual Accumulation Volume [m3/yr]: 819 1/3 Tdesludge [yrs]: 1.4 2/3 Tdesludge [yrs]: 2.8
Dimensions for 2 ponds in parallel: Area per pond [m2]: 219 Width [m]: 10 Length [m]: 21
Methane Production Methane is a very important subject when it comes to anaerobic ponds. The amount of methane produced by the ponds in question could supply roughly four times the amount of energy it takes to pump the effluent to the wastewater storage and treatment reservoirs. The amount of methane produced per hour equates to 7.7 cubic meters. This means that the amount of methane produced per day could supply energy to 800 2-inch burners for an hour (one 2-inch burner requires 0.23 cubic meters of methane per hour).

12
Table 8: Methane Production BOD5 [kg/day]: 526 Methane volume [m3/day]: 184 Methane volume [m3/hr]: 7.7 Methane volume [m3/yr]: 67,197 Energy [MJ/yr]: 2,405,635 Energy [kWh/yr]: 668,232
Wastewater Storage and Treatment Reservoir (WSTR) for Type I Irrigation The CropWat program was used to tabulate the monthly precipitation and reference evapo-transpiration at Panajachel to construct the WSTR for Type I irrigation. The vegetative cover selected was sugarcane which has a high KC value of 1.25. The design percolation rate from the soil data in the Lake Atitlan basin was assumed to be 180 millimeters per month. A water balance for a Type I reuse system was calculated and tabulated using the evapotranspiration values for each month, the monthly values of the hydraulic loading rate based on soil permeability, the annual volume of wastewater flow, the area requirements for irrigation, the monthly volumetric loading rates, and the monthly available wastewater volumes.
The volume of a single WSTR is required to be 340,550 cubic meters (this is the estimated maximum amount of storage required at any given time – see Appendix E). The area required for a volume this size is approximately 3.4 hectares for a depth of 10 meters or 6.8 hectares for a depth of 5 meters. According to Duncan Mara in his book Domestic Wastewater Treatment he states that “During the irrigation season, the WSTR contents are pumped out to the fields to be irrigated, while at the same time there is still a continuous inflow of anaerobic pond effluent. As the irrigation season progresses, there is a progressive deterioration in the quality of the WSTR contents as the retention time in the reservoir of the anaerobic pond effluent becomes correspondingly shorter… For unrestricted irrigation it would be a serious problem.” In essence the hydraulic retention time decreases causing the effluent to fall short of World Health Organization guidelines. Therefore, an alternative to constructing one huge WSTR is to construct a sequential batch-fed system. Using Mara’s guidance, three sequential batch-fed WSTRs can be used to store and treat the anaerobic pond effluent. As shown if Figure 9, the WSTR are in parallel and each is “operated on a cycle of ‘fill–rest–use’. As soon as the contents of one reservoir are used, another is brought into irrigation service and the one just emptied is refilled in readiness for the next irrigation season” (Mara, 2003).
13
Table 9: Fill-Rest-Use Example Cycle
Figure 9: Sequential Batch-Fed System
Sequential Batch-Fed System Effluent Quality
The effluent from a sequential batch-fed system has very good quality due to long hydraulic retention times. According to Mara “E. Coli numbers decline rapidly during the rest phase: in studies in northeast Brazil …[it was] found that in WSTR which received organic loadings of 126–162 kg BOD/ha day during the fill phase, E. Coli numbers dropped from 106–107/100 ml of anaerobic pond effluent to <1000/100 ml during the first 14 days of the rest phase at 25°C.” (Mara, 2003)
Month WSTR 1 WSTR 2 WSTR 3 January Rest Fill (1/2) Fill (1/2) February Rest Fill (1/2) Fill (1/2) March Rest Rest Fill (1) April Rest Rest Fill (1) May Use Rest Fill (1) June Use Rest Fill (1) July Fill (1) Use Rest August Fill (1) Use Rest Sepember Fill (1/2) Fill (1/2) Use October Fill (1/2) Fill (1/2) Use November Fill (1/3) Fill (1/3) Fill (1/3) Dececember Fill (1/3) Fill (1/3) Fill (1/3)
14
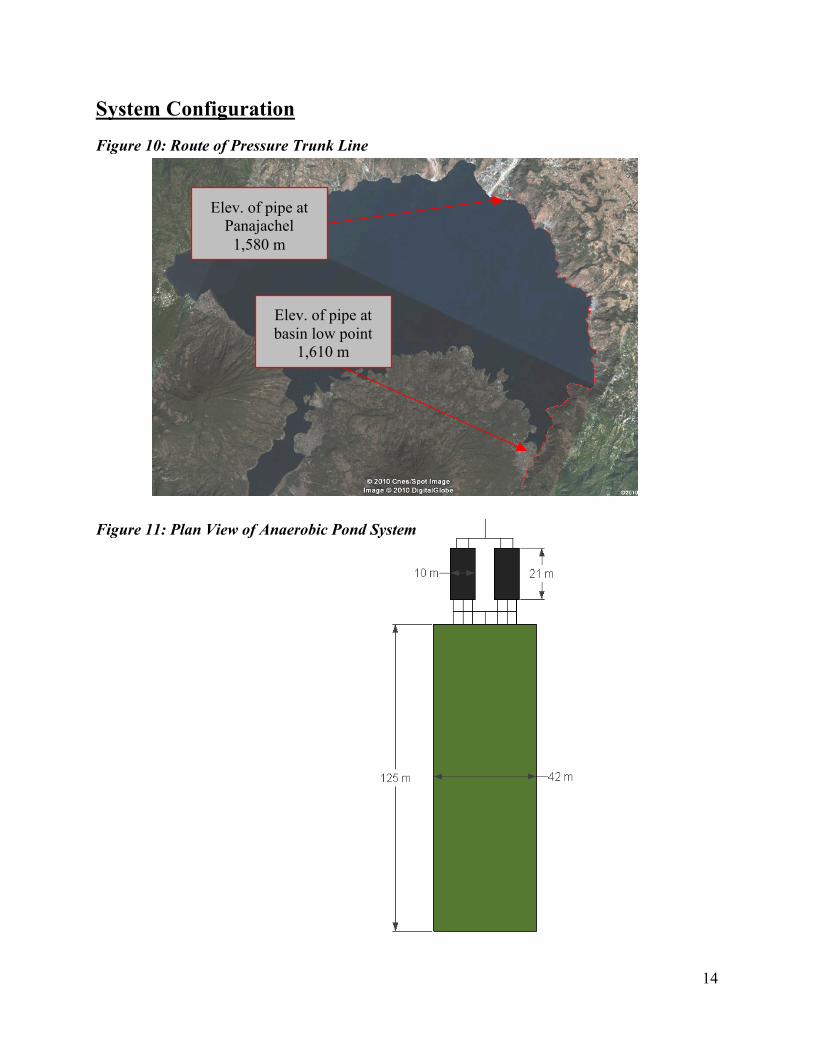
System Configuration
Figure 10: Route of Pressure Trunk Line
Figure 11: Plan View of Anaerobic Pond System
Elev. of pipe at Panajachel
1,580 m
Elev. of pipe at basin low point
1,610 m

15
Comparative Life Cycle Assessment of Operation for the Two Alternatives Activated Sludge System The energy requirement for aeration and mixing in kilowatt hours per year is about 319,150. This equates to a total cost (for electricity alone) of $72,400 to operate the plant on a yearly basis. The carbon footprint of the plant based on electricity consumption is 255,316,580 grams of CO2 equivalent per year. The quantity of ferric chloride required is 82,070 kilograms per year. The amount of sludge produced per year is 15,178 cubic meters – which will contain hazardous chemicals from the ferric chloride and will need to be buried. The likelihood of this activated sludge system succeeding is very low. The system will very costly to maintain and will introduce harmful chemicals to an already strained environment.
Anaerobic/facultative or no-pond system
The energy required for pumping horizontally 18,875 meters and vertically 30 meters depends greatly on the pump efficiency. The efficiency of a pump pumping effluent from an anaerobic / facultative pond system will be greater than the efficiency of a pump pumping raw effluent. Also, the methane produced from the anaerobic ponds produces more energy than what is required to pump the effluent to the WSTRs. In either case (pond system or no pond system), the annual cost is still much less than the activated sludge system. The annual costs to operate the pumps with high and low efficiencies are $17,690 and $39,890, respectively. The amount of methane produced by the ponds supplies roughly four times the energy it takes to pump the effluent to the wastewater storage and treatment reservoirs. The amount of methane produced per hour equates to 7.7 cubic meters. This means that the amount of methane produced per day could supply energy to 800 2-inch burners for an hour (one 2-inch burner requires 0.23 cubic meters of methane per hour).
The amount of sludge that accumulates in the anaerobic ponds is about 820 cubic meters per year which means the ponds need to be desludged once every 2.8 years (when they are 2/3 full).
Using a BOD/Nitrogen/Phosphorus ratio of 100/5/1, the amount of nitrogen and phosphorus accumulated in one day is 26 and 5 kilograms, respectively (Viessman, 2009). This means that the amount of nitrogen and phosphorus accumulated in one year equates to 9,600 and 1,920 kilograms, respectively, which leads to a value for nitrogen of $38,400 per year (at $0.40/100 g) and a value for phosphorus of $225,970 per year (at $58.84/500 g) (Nitrogen, 2010; Eni Generalic, 2003).
The likelihood of the anaerobic/facultative pond system succeeding is much higher than the likelihood for an activated sludge plant succeeding for several reasons. First of all, the monthly operational cost is much less; in fact, energy is actually produced from the pond system (via methane) as opposed to being consumed. The amount of energy needed per year to pump to the WSTR’s is roughly 90,000 kilowatt hours while the amount of energy produced from the methane is roughly 668,000 kilowatt hours per year. Also, the sludge from the anaerobic ponds can be dried and used as fertilizer while the sludge from the activated sludge plant will contain hazardous material from the ferric chloride and will need to be buried. Additionally, in the event of a natural disaster, the ponds will not be destroyed. An activated sludge plant may be completely lost and need to be rebuilt.
16
References CROPWAT 8.0 and CLIMWAT 2.0 for CROPWAT computer programs. Guidelines for the Safe Use of Wastewater, Excreta and Greywater. Volume 2. Geneva, Switzerland. World Health Organization, 2006. Print. pp. xvii. Hearne, Robert. An Analysis of the Feasibility of Irrigation District Transfer in Honduras. North Dakota State University. Aug 2004. pp 5 < http://ageconsearch umn.edu/bitstream/20078/1/sp04he04.pdf> Mara, Duncan. Domestic Treatment in Developing Countries. Sterling, VA: Earthscan. 2003. Print. pp. 105-112; 145-147. NASA. Surface Meteorology and Solar Energy. <http://eosweb.larc.nasa.gov/sse/>. Nitrogen. Chemicool Periodic Table. 9/15/2010 <http://www.chemicool.com /elements/nitrogen.html>. Oakley, Stewart M. “LAGUNAS DE ESTABILIZACIÓN EN HONDURAS: Manual de Diseño, Construcción, Operación y Mantenimiento, Monitoreo y Sostenibilidad.” Universidad Estatal de California. Junio 2005. Pp. 23, 28, 32, 189. Salguero, L., Oakley, S., Henry, B., “Wastewater Problems at Lago Atitlan: And Suggested Remedial Approach.” Powerpoint. Viessman, Warren, Mark Hammer, Elizabeth Perez, and Paul Chadik. Water Supply and Pollution Control. 8th ed. Upper Saddle River, NJ: Pearson Education, Inc., 2009. Print. pp. 521-522. World Factbook, The. “Central Intelligence Agency.” 2010. Web. 9 Sep 2010.<https: //www.cia.gov/library/publications/the-world-factbook/geos/ho.html>. Qasim, S.R., Motley, E. M., Zhu, G., 2000. Water Works Engineering. Prentice Hall, Upper Saddle River, New Jersey. Riddle, J. About Panajachel, Guatemala, Lake Atitlan. 2009. <http://www.panajachel.com/> .

17
Appendix A: Population and Loading Rates POPULATION Rate, r: 0.02066 Year Time, t Population 2006 0 12,863 2007 1 13,132 2008 2 13,406 2009 3 13,685 2010 4 13,971 2011 5 14,263 2012 6 14,561 2013 7 14,864 2014 8 15,175 2015 9 15,492 2016 10 15,815 2017 11 16,145 2018 12 16,482 2019 13 16,826 2020 14 17,177 2021 15 17,536
% Connected to Sewer 100% 2021 Pop. 17,536 Water Usage [m3/person-day] 0.08 0.10 0.12
100% of Water Used goes to Wastewater 1,403 1,754 2,104 90% of Water Used goes to Wastewater 1,263 1,578 1,894 80% of Water Used goes to Wastewater 1,122 1,403 1,683
Flow
[m3 /d
ay]
70% of Water Used goes to Wastewater 982 1,228 1,473
BOD5 Loadings [kg/day] 351 438 526
TSS Loadings [kg/day] 351 438 526
18
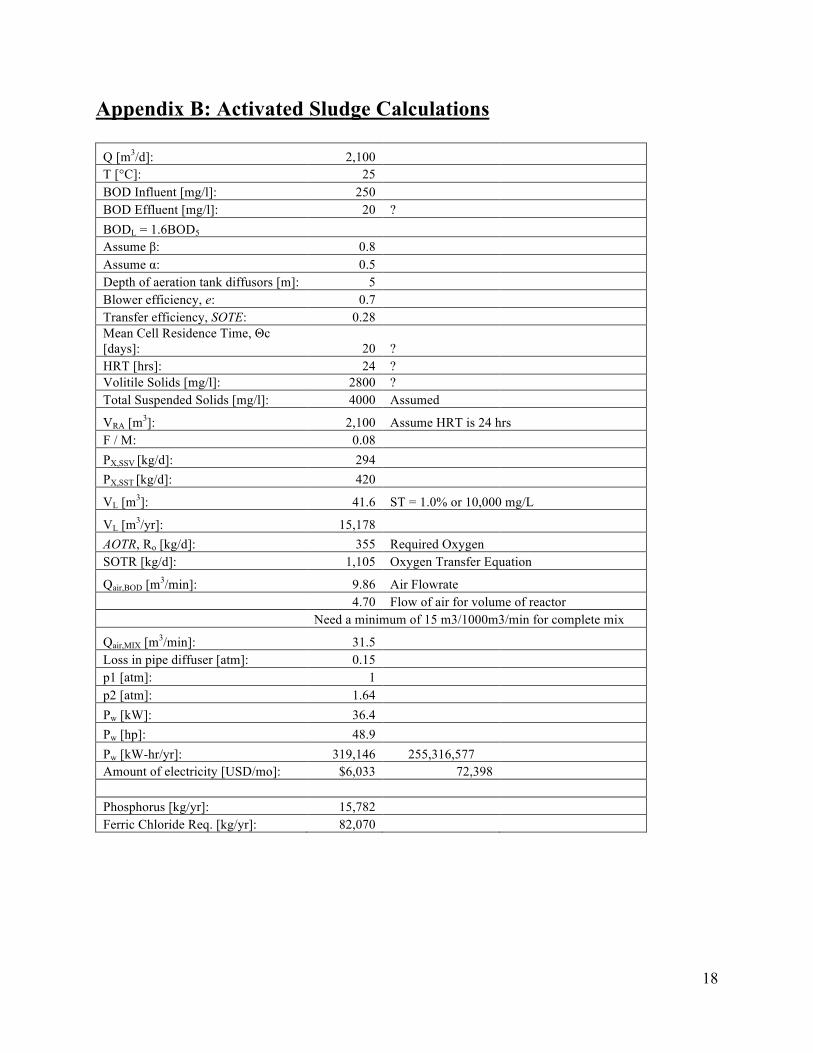
Appendix B: Activated Sludge Calculations
Q [m3/d]: 2,100 T [°C]: 25 BOD Influent [mg/l]: 250 BOD Effluent [mg/l]: 20 ? BODL = 1.6BOD5 Assume β: 0.8 Assume α: 0.5 Depth of aeration tank diffusors [m]: 5 Blower efficiency, e: 0.7 Transfer efficiency, SOTE: 0.28 Mean Cell Residence Time, Θc [days]: 20 ? HRT [hrs]: 24 ? Volitile Solids [mg/l]: 2800 ? Total Suspended Solids [mg/l]: 4000 Assumed
VRA [m3]: 2,100 Assume HRT is 24 hrs F / M: 0.08 PX,SSV [kg/d]: 294 PX,SST [kg/d]: 420
VL [m3]: 41.6 ST = 1.0% or 10,000 mg/L
VL [m3/yr]: 15,178 AOTR, Ro [kg/d]: 355 Required Oxygen SOTR [kg/d]: 1,105 Oxygen Transfer Equation
Qair,BOD [m3/min]: 9.86 Air Flowrate 4.70 Flow of air for volume of reactor Need a minimum of 15 m3/1000m3/min for complete mix
Qair,MIX [m3/min]: 31.5 Loss in pipe diffuser [atm]: 0.15 p1 [atm]: 1 p2 [atm]: 1.64 Pw [kW]: 36.4 Pw [hp]: 48.9 Pw [kW-hr/yr]: 319,146 255,316,577 Amount of electricity [USD/mo]: $6,033 72,398 Phosphorus [kg/yr]: 15,782 Ferric Chloride Req. [kg/yr]: 82,070
19
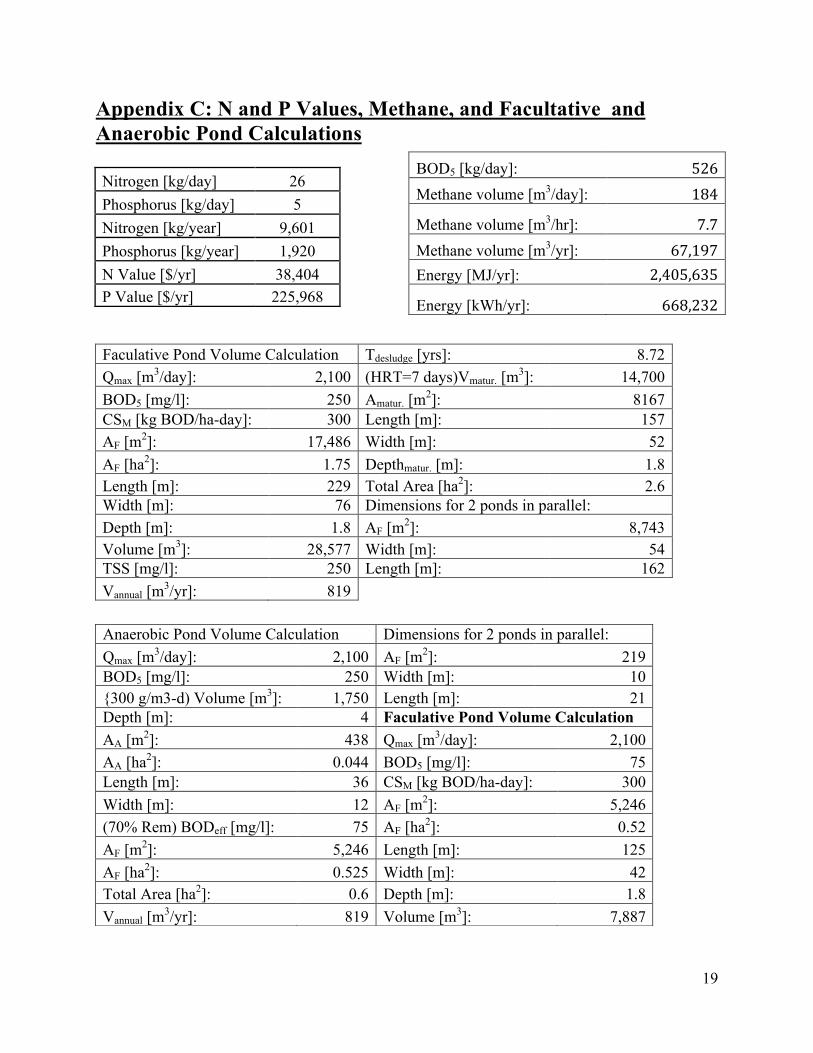
Appendix C: N and P Values, Methane, and Facultative and Anaerobic Pond Calculations Nitrogen [kg/day] 26 Phosphorus [kg/day] 5 Nitrogen [kg/year] 9,601 Phosphorus [kg/year] 1,920 N Value [$/yr] 38,404 P Value [$/yr] 225,968
Faculative Pond Volume Calculation Tdesludge [yrs]: 8.72 Qmax [m3/day]: 2,100 (HRT=7 days)Vmatur. [m3]: 14,700 BOD5 [mg/l]: 250 Amatur. [m2]: 8167 CSM [kg BOD/ha-day]: 300 Length [m]: 157 AF [m2]: 17,486 Width [m]: 52 AF [ha2]: 1.75 Depthmatur. [m]: 1.8 Length [m]: 229 Total Area [ha2]: 2.6 Width [m]: 76 Dimensions for 2 ponds in parallel: Depth [m]: 1.8 AF [m2]: 8,743 Volume [m3]: 28,577 Width [m]: 54 TSS [mg/l]: 250 Length [m]: 162 Vannual [m3/yr]: 819
BOD5 [kg/day]: 526 Methane volume [m3/day]: 184
Methane volume [m3/hr]: 7.7 Methane volume [m3/yr]: 67,197 Energy [MJ/yr]: 2,405,635
Energy [kWh/yr]: 668,232
Anaerobic Pond Volume Calculation Dimensions for 2 ponds in parallel: Qmax [m3/day]: 2,100 AF [m2]: 219 BOD5 [mg/l]: 250 Width [m]: 10 {300 g/m3-d) Volume [m3]: 1,750 Length [m]: 21 Depth [m]: 4 Faculative Pond Volume Calculation AA [m2]: 438 Qmax [m3/day]: 2,100 AA [ha2]: 0.044 BOD5 [mg/l]: 75 Length [m]: 36 CSM [kg BOD/ha-day]: 300 Width [m]: 12 AF [m2]: 5,246 (70% Rem) BODeff [mg/l]: 75 AF [ha2]: 0.52 AF [m2]: 5,246 Length [m]: 125 AF [ha2]: 0.525 Width [m]: 42 Total Area [ha2]: 0.6 Depth [m]: 1.8 Vannual [m3/yr]: 819 Volume [m3]: 7,887
20
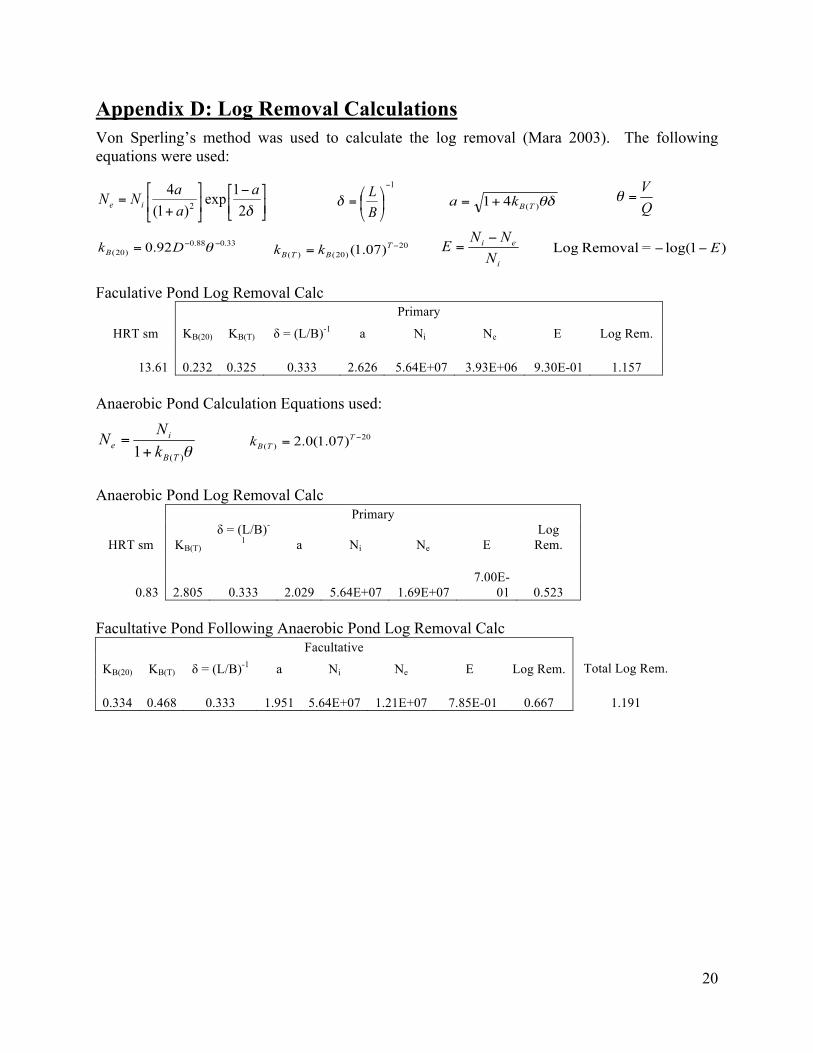
Appendix D: Log Removal Calculations Von Sperling’s method was used to calculate the log removal (Mara 2003). The following equations were used:
Faculative Pond Log Removal Calc
Primary
HRT sm KB(20) KB(T) δ = (L/B)-1 a Ni Ne E Log Rem.
13.61 0.232 0.325 0.333 2.626 5.64E+07 3.93E+06 9.30E-01 1.157 Anaerobic Pond Calculation Equations used: Anaerobic Pond Log Removal Calc
Primary
HRT sm KB(T) δ = (L/B)-
1 a Ni Ne E Log
Rem.
0.83 2.805 0.333 2.029 5.64E+07 1.69E+07 7.00E-
01 0.523 Facultative Pond Following Anaerobic Pond Log Removal Calc
Facultative
KB(20) KB(T) δ = (L/B)-1 a Ni Ne E Log Rem. Total Log Rem.
0.334 0.468 0.333 1.951 5.64E+07 1.21E+07 7.85E-01 0.667 1.191
21
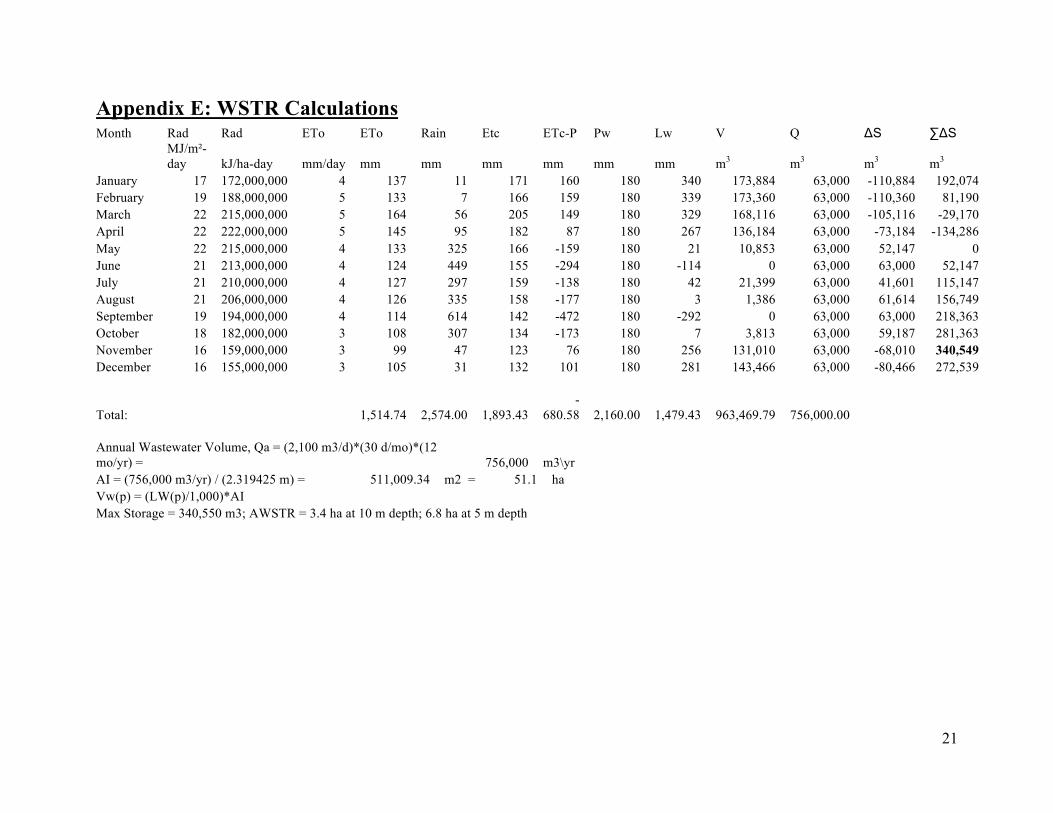
Appendix E: WSTR Calculations Month Rad Rad ETo ETo Rain Etc ETc-P Pw Lw V Q ΔS ∑ΔS
MJ/m²-day kJ/ha-day mm/day mm mm mm mm mm mm m3 m3 m3 m3
January 17 172,000,000 4 137 11 171 160 180 340 173,884 63,000 -110,884 192,074 February 19 188,000,000 5 133 7 166 159 180 339 173,360 63,000 -110,360 81,190 March 22 215,000,000 5 164 56 205 149 180 329 168,116 63,000 -105,116 -29,170 April 22 222,000,000 5 145 95 182 87 180 267 136,184 63,000 -73,184 -134,286 May 22 215,000,000 4 133 325 166 -159 180 21 10,853 63,000 52,147 0 June 21 213,000,000 4 124 449 155 -294 180 -114 0 63,000 63,000 52,147 July 21 210,000,000 4 127 297 159 -138 180 42 21,399 63,000 41,601 115,147 August 21 206,000,000 4 126 335 158 -177 180 3 1,386 63,000 61,614 156,749 September 19 194,000,000 4 114 614 142 -472 180 -292 0 63,000 63,000 218,363 October 18 182,000,000 3 108 307 134 -173 180 7 3,813 63,000 59,187 281,363 November 16 159,000,000 3 99 47 123 76 180 256 131,010 63,000 -68,010 340,549 December 16 155,000,000 3 105 31 132 101 180 281 143,466 63,000 -80,466 272,539
Total: 1,514.74 2,574.00 1,893.43 -
680.58 2,160.00 1,479.43 963,469.79 756,000.00 Annual Wastewater Volume, Qa = (2,100 m3/d)*(30 d/mo)*(12 mo/yr) = 756,000 m3\yr AI = (756,000 m3/yr) / (2.319425 m) = 511,009.34 m2 = 51.1 ha Vw(p) = (LW(p)/1,000)*AI Max Storage = 340,550 m3; AWSTR = 3.4 ha at 10 m depth; 6.8 ha at 5 m depth