alternative water solutions program 2014 annual...
TRANSCRIPT

4700 West 77th Street Minneapolis, MN 55435-4803 Phone: 952.832.2600 Fax: 952.832.2601
Alternative Water Solutions Program 2014 Annual Report
North Pole, Alaska
Prepared for Flint Hills Resources Alaska, LLC
February 25, 2015
Prepared by:
Barr Engineering Company 4700 West 77th Street Minneapolis, MN 55434
______________________________ Brian Angerman Vice President Qualified Person as defined by 18 AAC 75.990

Alternative Water Solutions Program 2014 Annual Report
North Pole, Alaska
February 25, 2015
Contents 1.0 Introduction ........................................................................................................................................ 1
1.1 Current Extent of Sulfolane Plume ............................................................................................ 1
1.1.1 Buffer Zone .................................................................................................................................................... 1
1.2 Annual Newsletter ..................................................................................................................... 2
1.3 Annual Report Organization ...................................................................................................... 2
2.0 AWS Program Data Summary ............................................................................................................. 3
2.1 AWS Property Information ........................................................................................................ 3
2.2 Private Well Water Data Summary ........................................................................................... 3
2.3 POE System Performance .......................................................................................................... 4
2.3.1 Treatment System Performance ........................................................................................................... 5
2.3.2 Volume of Water Treated ........................................................................................................................ 5
2.3.3 GAC Usage ..................................................................................................................................................... 6
2.4 Bottled and Bulk Water Supply Information ............................................................................. 6
2.4.1 Bottled Water ............................................................................................................................................... 6
2.4.2 Bulk Water Tanks ........................................................................................................................................ 6
2.4.3 Garden Tanks ................................................................................................................................................ 7
2.5 Commercial Greenhouse Locations........................................................................................... 7
2.6 City of North Pole Water Supply ............................................................................................... 7
3.0 AWS Program Updates ........................................................................................................................ 8
3.1 Description of Issues, Problems or Complaints ......................................................................... 8
3.2 AWS Program Changes .............................................................................................................. 8
4.0 Summary ............................................................................................................................................. 9
5.0 References ......................................................................................................................................... 10
i

List of Tables
Table 1 AWS Installation Summary Table 2 2014 Property Transactions Table 3 POE Treatment Systems Analytical Data Summary Table 4 POE Treatment Systems Water Usage Summary
List of Figures
Figure 1 2014 Sulfolane Plume and Monitoring Results Figure 2 2015 Buffer Zone and Resampling Area Figure 3 Potable Water Solutions Provided by Flint Hills Resources
List of Attachments
Attachment A 2014 Newsletters to Homeowners
ii

List of Abbreviations and Acronyms
ADEC Alaska Department of Environmental Conservation
AHL Arctic Home Living
ARCADIS ARCADIS, US, Inc.
AWS alternative water solutions
AWS-MP Alternative Water Solutions Program-Management Plan
Barr Barr Engineering Company
COC contaminants of concern
FHRA Flint Hills Resources Alaska, LLC
FS feasibility study
GAC granular activated carbon
IRMs interim remediation measures
NPR North Pole Refinery
POE Point-of-Entry
PWS public water system
PW-ID private well identification number
QA quality assurance
QC quality control
SWI Shannon & Wilson, Inc.
The City The City of North Pole, Alaska
WQA Water Quality Association
iii

1.0 Introduction On behalf of Flint Hills Resources Alaska, LLC (FHRA), Barr Engineering Co. (Barr) prepared this Alternative Water Solutions Program – 2014 Annual Report (annual report). This annual report has been prepared in accordance with the Alternative Water Solutions Program-Management Plan (AWS-MP, Barr 2014), to document identification, installation, and maintenance of alternative water solutions (AWS) in the North Pole area in 2014.
Previous investigations conducted by FHRA have determined that a plume of dissolved-phase sulfolane exists in the groundwater downgradient of the North Pole Refinery (NPR) in North Pole, Alaska. Working closely with ADEC, FHRA has initiated a comprehensive response plan which includes delineation of the extent of the sulfolane plume and implementation of onsite remediation measures. In addition to this response, FHRA has continued its commitment to the community in 2014 to providing these AWS to the affected and potentially affected community while ADEC reviews scientific information to determine a safe sulfolane drinking water cleanup level. These AWS options include long-term delivery of bottled water, bulk water tank systems, and Point-of-Entry (POE) in-home water treatment systems.
The data, analyses, and conclusions in this report are part of a collaborative effort among FHRA’s consulting team members. The team that provided assistance related to the AWS program includes qualified professionals from Shannon & Wilson, Inc. (SWI), ARCADIS U.S., Inc. (ARCADIS), and Barr. FHRA has engaged these consulting firms to perform various tasks on the project. This report, therefore, encompasses contributions from professionals from each firm in the text, tables, and figures presented.
1.1 Current Extent of Sulfolane Plume FHRA has installed a total of 159 active offsite monitoring wells to characterize the nature and extent of sulfolane impacts and permafrost depths offsite. The total numbers of wells reported above is different than in previous reports as monitoring wells in the MW-148 well nest are now being accounted as onsite wells. Since November 2009, groundwater samples have been collected from 852 private wells (667 inside search limits and 185 outside search limits) and analyzed for sulfolane. The approximate extent of dissolved sulfolane in offsite monitoring wells and private wells is shown on Figure 1.
1.1.1 Buffer Zone As described in the AWS-MP (Barr 2014), a Buffer Zone of properties with private wells has been established around the perimeter of the sulfolane plume. These properties have not had detections in their wells, but are located adjacent to or near properties with sulfolane detections. Due to their proximity to properties with sulfolane detections, the properties located within the designated Buffer Zone are provided interim bottled water and their wells are sampled annually. The Buffer Zone properties as determined for 2015 are shown on Figure 2. In addition to the Buffer Zone properties, Figure 2 also includes the 2015 planned annual resampling locations. FHRA has elected in 2015 to expand resampling to include several residences that are outside of the designated Buffer Zone. The AWS-MP (Barr 2014) describes search areas which are also included on Figure 2.
1

Locations with first detections of sulfolane in drinking water wells in 2014 are shown on Figure 2. These locations were either 1) offered interim bottled water, 2) were already on interim bottled water, or 3) a long-term AWS was selected as shown on Figure 3. One location remains vacant at this time.
There are several locations without detectable sulfolane that are within the plume and Buffer Zone areas but do not receive interim bottled water (see Figure 2). These locations are part of the annual resampling and FHRA has provided or offered bottled water to all these locations. The reasons for not receiving interim bottled water at present include the following: the residence is vacant (seasonally in some cases), the well is no longer active, the property owner has refused, the well is not used as a drinking-water source, or the property owner is providing their own water.
1.2 Annual Newsletter The AWS-MP (Barr 2014) specifies that an annual direct communication newsletter is to be distributed during the first quarter of each year to affected property owners with an AWS, and property owners within the Buffer Zone. FHRA distributed three newsletters in the first quarter of 2014 and they are provided as Attachment A. FHRA also gave a presentation to the Greater Fairbanks Board of Realtors in February 2014 as another means to ensure that potential property owners in the area have been advised of the AWS program.
1.3 Annual Report Organization This plan includes the following sections:
• Section 1 – Introduction: Provides an overview and background of the report including introduction of the current extent of the sulfolane plume and the Buffer Zone.
• Section 2 – AWS Program Data Summary: Provides a summary of the locations with an AWS, the results of monitoring at each well, and the source and delivery schedules for selected AWS. Also includes water usage at a greenhouse with an AWS and monitoring data for the City of North Pole.
• Section 3 – AWS Program Updates: Provides a summary of the issues that occurred within the year and FHRA’s mitigation activities. Also includes proposed changes for 2015.
• Section 4 – Summary: Provides a conclusion for the AWS program in 2014.
• Section 5 – References.
2
2.0 AWS Program Data Summary 2.1 AWS Property Information Through 2014, FHRA has provided 343 long-term AWS at 320 properties as shown in Table 1 (note that some properties have more than one AWS). New AWS installed in 2014 include 5 POE treatment systems, 4 bulk water tanks, and 1 long-term bottled water option. A map showing AWS installed to date, as listed below, is included on Figure 3.
• 165 POE treatment systems
• 117 bulk water tanks
• 33 long-term bottled water options
In 2010, 28 residences were connected to City water (Table 1).
In addition to the long-term solutions provided above, FHRA is currently providing interim bottled water to 236 addresses (some addresses have multiple residences) that are either affected properties inside the plume that have not selected a long-term AWS, properties that have not had a detection of sulfolane, or properties that are located within or near the Buffer Zone of the plume. FHRA has also provided 50 garden tanks to affected properties that do not have a City water connection.
As described in the AWS-MP (Barr 2014), currently FHRA conducts a series of tasks on a routine basis to identify new construction or property transactions within the plume or Buffer Zone area. Table 2 provides a summary of property transactions that were noted by FHRA in 2014.
2.2 Private Well Water Data Summary In 2014, FHRA completed monitoring of private wells through the following programs:
• Annual sampling of private wells within the Buffer Zone and resampling program;
• Initial sampling of private wells inside and outside the sulfolane plume that have never been sampled;
• Quarterly sampling of private wells that are part of the Deep Residential Well monitoring program;
• POE treatment system sampling during scheduled granular activated carbon (GAC) changeouts; and
• Focused sampling such as extended search areas or call-in requests from homeowners.
Results and/or laboratory reports for this monitoring were provided to ADEC in the routine quarterly groundwater monitoring reports.
3

As noted above, FHRA completes monitoring of private wells with POE systems during each GAC changeout. Table 3 provides a summary of monitoring results for sulfolane in private wells with POE systems. A summary map of private well locations was provided as Appendix B of the Fourth Quarter 2014 Offsite Groundwater Monitoring Reporting (ARCADIS, 2015). Included in Table 3 are results for raw water (Port A) and treated water (Port C or Port D), and commercial locations have been noted. Analytical laboratory reports and ADEC quality assurance/quality control (QA/QC) checklists for 2014 have been previously provided to ADEC in the quarterly groundwater monitoring reports submitted by FHRA, and are not duplicated in this report. Below are points of clarification for the results presented in Table 3:
• In some instances a raw water sample was collected without a treated water sample on the same date. These instances are related to collection of a raw water sample for a different purpose, such as the deep residential well monitoring program, outside of the POE system maintenance.
• High-frequency sampling was completed at select locations (PW-IDs 0157, 0225, 0232, 0657, 1098) in 2010 and 2011 as part of POE in-home pilot testing. These results have been submitted in previous reports including Appendix B of the AWS-MP (Barr 2014) and are not repeated in this report.
• In POE system monitoring results prior to 2012, FHRA was in development of the sampling protocol and sampled either Port C or Port D to confirm removal of sulfolane. Port C is located after the primary GAC vessel(s) and Port D is located after the redundant GAC vessel.
• In some locations (e.g., PW-IDs 0511, 1155, 1395) one raw water sample result is shown during each monitoring event, but multiple treated water results are shown (i.e. 1-C, 2-C, 3-C, 1-D, 2-D, and 3-D). This is due to the presence of multiple POE treatment systems, so the treated water is sampled at Port C and Port D of each system.
As further described in Section 3.2, in 2014 FHRA began collection of additional samples during each GAC vessel changeout that are referred to as C1, C2, D1, and D2. C1 and D1 samples are collected from sample ports C (primary vessel effluent) and D (treatment system effluent), respectively, prior to system maintenance activities. C2 and D2 samples are also collected from sample ports C and D, respectively, following system maintenance activities. D2 samples are only analyzed in the event of a C2 sample sulfolane detection. Samples marked as “D” will continue to be collected; D samples represent effluent conditions prior to a maintenance event where the redundant tank is not replaced.
This annual report includes data received approximately two weeks prior to the end of the fourth quarter 2014 (through December 15, 2014). The purpose of this data cut-off date is to allow appropriate time for data review and validation prior to submittal of results and laboratory data packets with the quarterly groundwater monitoring reports. This same data cut-off is used for this annual report to maintain consistency with data already submitted to ADEC.
2.3 POE System Performance FHRA has installed POE treatment systems which use sediment filters, a softener, UV filter, and GAC vessels to remove sulfolane. The POE treatment systems also include a water meter that transmits a
4

remote signal to allow tracking of the water usage to schedule routine maintenance, and a series of sampling ports that will allow sampling of the raw water and treated water during service visits. Arctic Home Living (AHL) of Fairbanks has been contracted by FHRA to provide maintenance of the POE treatment systems.
As noted in Section 2.2, data included within this report were received from the laboratory prior to December 15, 2014. However, FHRA is noting that after December 15, 2014, but prior to submittal of this report, results were received for two locations that had detectable concentrations of sulfolane in samples collected from sample port D, as described in the following section.
2.3.1 Treatment System Performance As shown in Table 3, the sulfolane results in the treated water samples have been below detection limits during each monitoring event in each POE system through December 15, 2014. These data verify that the POE systems are properly treating the groundwater and performing as designed. The data also confirm that proper operation and maintenance of the systems are being performed. As noted above, two sulfolane detections in treated water samples were received prior to submittal of this report. In each case, as described below, the concentrations reported were low-level and quickly mitigated.
The first sulfolane detection was reported in the D port sample collected from PW-0162 on 12/8/2014 (4.4 J µg/L). Upon receipt of the results FHRA immediately conducted interviews with the tenants and determined that the system was exhausted prior to regularly scheduled maintenance due to an unreported water leak that had previously occurred within the house, which resulted in excessive water usage and throughput through the GAC system. The primary GAC tank had been replaced during the planned maintenance activities on 12/8/2014. Upon receiving the results, the redundant GAC vessel was immediately replaced on 12/19/2014. Follow up samples from port D did not have detectable concentrations of sulfolane and these results will be included in the 2015 annual report. Note that the leak in the home was related to a non-POE system water pipe, and the leak was repaired by the homeowner.
The second noted detection occurred at 3.2 J µg/L in the D2 sample (collected immediately after GAC vessel changeout, as noted above) from PW-0648 on 12/09/2014. Upon evaluation it appears the detection was due to limited carbon-settling time and bedding of the vessel for the recently installed tanks. Follow up samples from port D did not have detectable concentrations of sulfolane. These results will be included in the 2015 annual report.
2.3.2 Volume of Water Treated Water usage monitoring was performed on a monthly basis at each POE system in 2014 to confirm water usage rates and to determine the GAC replacement schedule. This monitoring is completed via remote reading of a flow totalizer unit by AHL personnel. Water usage rates were calculated and compared to the treatment volumes included in the Water Quality Association (WQA) certification, as described in the AWS-MP (Barr 2014), and used to schedule GAC vessel replacements. Water usage in 2014 for each POE system is summarized in Table 4, and totals to approximately 7,800,000 gallons for 2014.
5

Through 2014, the POE systems have treated approximately 23,000,000 gallons of water.
2.3.3 GAC Usage As noted in Section 2.3.1, scheduling of GAC changeout is determined by the water usage rate and raw water sulfolane concentration in accordance with the WQA certification. In 2014, changeout was completed for 514 carbon vessels. Each vessel contains 2.5 cubic feet of GAC, for a total changeout of 1,285 cubic feet of GAC in 2014.
2.4 Bottled and Bulk Water Supply Information As described in Section 2.1, FHRA currently provides bottled or bulk water for residents who have selected these options as their AWS or are on interim bottled water. Additionally, water is provided to residences with a garden tank. The following sections provide a summary of the source and delivery schedule for the bottled and bulk water supplies.
2.4.1 Bottled Water In 2014, bottled water delivery was provided on a weekly basis by Spring Alaska. Spring Alaska receives the water from Twin Springs Water (Alaska Public Water System (PWS) ID # AK312813).
Spring Alaska contacts residents weekly to confirm the number of bottles required in advance of delivery. This allows residents receiving this service to manage delivery to their individual needs from week to week. In 2014, 105,675 gallons of water were delivered to these locations. This water volume is estimated based on water delivery invoiced in 2014. Currently, residents of 33 properties have selected long-term bottled water as their long-term AWS. FHRA is also currently providing interim bottled water to 236 residences that are either affected properties inside the plume that have not selected a long-term AWS or have not had a detection of sulfolane, or are located within or near the Buffer Zone of the plume.
2.4.2 Bulk Water Tanks In 2014, water deliveries for bulk tanks were completed by two local suppliers who are permitted by the State of Alaska; Pioneer Wells Inc. (Pioneer Wells) and H20 2 U, LLC (Water Wagon). Pioneer Wells sources their water from either a well in Fairbanks and treats the water in a water softener system prior to delivery to affected residents (PWS ID #AK2310714), or an untreated well (upon request from homeowners) located at Fox Spring (PWS ID #AK2312156). Water Wagon sources treated water from College Utilities in Fairbanks (PWS ID# AK2310900). Homeowners have the option of receiving water from Pioneer Wells or Water Wagon, depending upon their preference. There are currently 117 bulk water tanks installed, and FHRA provided a total of 3,319,741 gallons to these locations in 2014. Water volumes provided are estimated based on water deliveries invoiced in 2014.
The delivery schedule for commercial properties in 2014 was weekly depending upon usage. For residential properties, the delivery schedule was weekly or twice-monthly depending upon usage.
6

2.4.3 Garden Tanks For residents that have selected to have a garden tank installed, FHRA has provided up to 2,000 gallons per season. In 2014, the water was supplied by Pioneer Wells, with water sourced from an untreated well located at Fox Spring (PWS ID# AK2312156), untreated well located in Fairbanks (PWS ID# A2310714), or treated water from Fairbanks (PWS ID# AK2110714). There are currently 50 garden tanks installed, and FHRA provided a total of 27,607 gallons to these locations in 2014.
2.5 Commercial Greenhouse Locations There is currently one commercial greenhouse located within the impacted area; Hawks Greenhouse at 2260 Old Richardson Highway. FHRA has installed four bulk water tanks at this location with a total storage capacity of 10,000 gallons. The bulk water tanks are filled by Pioneer Wells, with water sourced from an untreated well located at Fox Spring (PWS ID# AK2312156). In 2014, the bulk water supplier, contracted by FHRA, provided a total of 93,165 gallons to this location. The delivery schedule was two or three times per week, dependent upon water usage, from April through August.
2.6 City of North Pole Water Supply The City of North Pole samples its water supply wells routinely and analyzes for sulfolane on a semi-annual basis (PWS ID# AK2310675). The City is responsible for submittal of the results to ADEC.
Water quality for the City of North Pole wells can be obtained through the ADEC website (http://dec.alaska.gov:8080/DWW/JSP/WaterSystemDetail.jsp?tinwsys_is_number=3699&tinwsys_st_code=AK&wsnumber=AK2310675); however, FHRA is not aware of the results as the website does not currently provide the source water sulfolane results.
7

3.0 AWS Program Updates 3.1 Description of Issues, Problems or Complaints FHRA has asked affected residents to contact the FHRA Groundwater Office if they have any problems or concerns with their chosen AWS. In 2014 very few complaints were made. A few complaints were received from individuals not receiving all the bottled water they requested. This was due to those individuals not returning all their empty bottles; issues have been resolved with personal contacts between the homeowners and the water delivery company.
In February 2014, one report of copper staining was reported and resolved by replacing the accessible copper pipe at the residence, after which there were no further complaints.
FHRA also learned some residents shut off power to their POE systems during high ground water events in the summer so that backwash would not add water to flooded septic systems. Upon learning this information, FHRA instructed AHL to contact the property owners, schedule and perform system wellness checks, and restart the systems. During that time, a few property owners commented to AHL about an odor issue, but did not contact FHR; no additional comments have been received regarding odor.
One bulk water customer was concerned about cloudy conditions in their tap water. Upon receiving notice of this issue, bottled water was provided by FHRA. To investigate, samples for visual observation were collected of the delivered water from Pioneer, the bulk tank water at the outlet of the domestic water pump, and at the tap. While the delivered water and the water in the bulk tank (collected at the pump) were clear, the tap water was perceived to be slightly cloudy. After review of the samples, the homeowner agreed that there was no information to indicate the water was not safe to use. Bottle service was discontinued and no complaints regarding that issue have been reported since then.
3.2 AWS Program Changes FHRA evaluated the sampling program in 2014 for potential data gaps. The sampling program was modified on November 12, 2014 to provide additional assurances that the POE systems are operating as designed immediately before and after GAC vessel changeouts. The samples added include C1 and D1 samples, which are collected from sample ports C and D, respectively, prior to system maintenance activities. Collection of C2 and D2 samples was also added following changeout of a GAC vessel. The D2 samples are only collected following a redundant tank change out and analyzed if there is detection of sulfolane in the C2 sample. Samples reported as D will continue to be collected; D samples represent effluent conditions prior to a maintenance event where the redundant tank is not replaced.
8

4.0 Summary In 2014, FHRA provided sulfolane-free drinking water to impacted residents and businesses of North Pole through delivery of bottled water (on an interim or long-term basis), delivery of bulk water, and operation of POE treatment systems. The following is a summary of the total volumes of clean water provided by alternative water solutions in 2014:
• 105,675 gallons of bottled water through delivery of bottled water on an interim or long-term basis.
• 3,440,513 gallons of bulk water, including delivery to residences, businesses, a greenhouse, and garden tanks.
• Treatment of approximately 7,800,000 gallons of water through POE treatment systems, with all sampling results reported through December 15, 2014, confirming non-detectable sulfolane concentrations in all treated water samples. Since initial installation, the POE treatment systems have treated approximately 23,000,000 gallons of water with non-detectable sulfolane concentrations in all treated water sampling results reported through December 15, 2014.
9

5.0 References Alaska Department of Environmental Conservation. 2015. Division of Environmental Health, Drinking
Water Program. http://dec.alaska.gov:8080/DWW/JSP/WaterSystemDetail.jsp?tinwsys_is_number=3699&tinwsys_st_code=AK&wsnumber=AK2310675
ARCADIS, 2015. Fourth Quarter 2014 Offsite Groundwater Monitoring Report, North Pole Refinery, Flint Hills Resources Alaska, LLC, January 2015.
Barr Engineering Company, 2014. Alternative Water Solutions Program – Management Plan, Flint Hills Resources Alaska, LLC, October 2014.
10

Tables
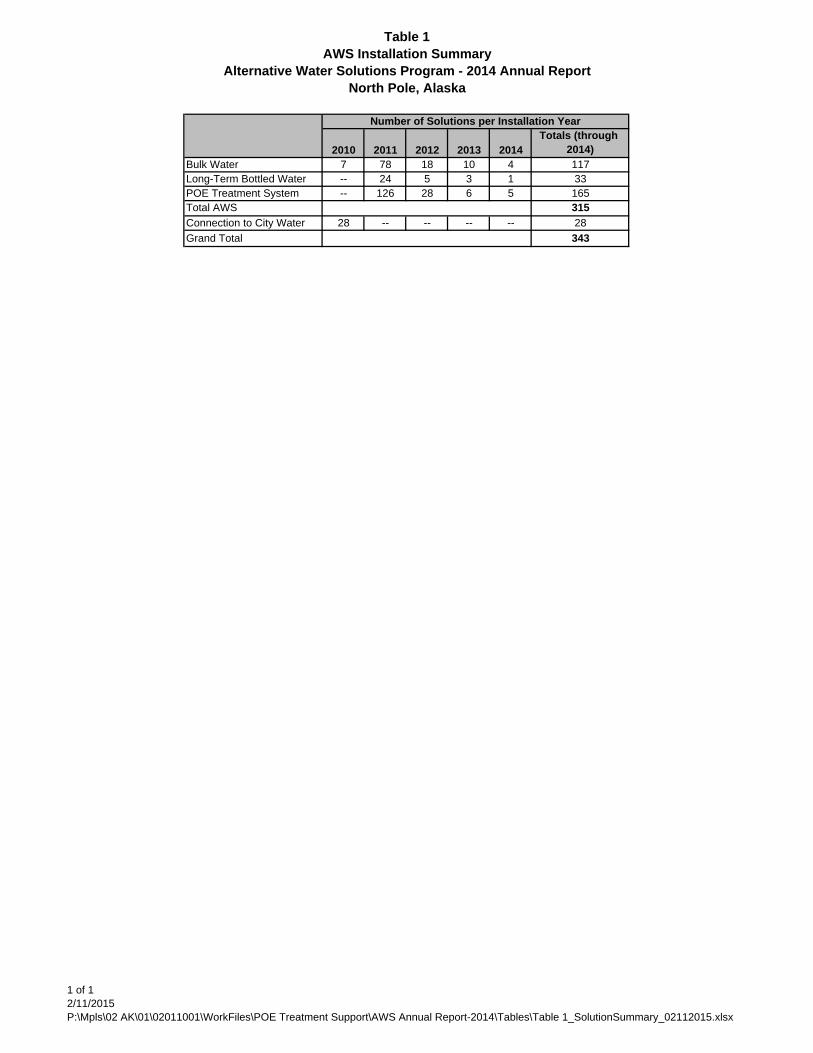
Table 1AWS Installation Summary
Alternative Water Solutions Program - 2014 Annual ReportNorth Pole, Alaska
2010 2011 2012 2013 2014Totals (through
2014)Bulk Water 7 78 18 10 4 117Long-Term Bottled Water -- 24 5 3 1 33POE Treatment System -- 126 28 6 5 165Total AWS 315Connection to City Water 28 -- -- -- -- 28Grand Total 343
Number of Solutions per Installation Year
1 of 12/11/2015P:\Mpls\02 AK\01\02011001\WorkFiles\POE Treatment Support\AWS Annual Report-2014\Tables\Table 1_SolutionSummary_02112015.xlsx

Table 2
2014 Property Transactions
Flint Hills Resources Alaska, LLC
North Pole, Alaska
Private Well Identification
Number (PW ID #)
1 466
2 542
3 543
4 546
5 561
6 637
7 701
8 725
9 734
10 735
11 745
12 746
13 748
14 768
15 769
16 795
17 801
18 853
19 856
20 938
21 948
22 1156
23 1157
24 1162
25 1172
26 1206
27 1232
1 of 1
2/4/2015
P:\Mpls\02 AK\01\02011001\WorkFiles\POE Treatment Support\AWS Annual Report-2014\Tables\Table 2_Property Transactions_2014_01262015.xlsx

Table 3POE Treatment Systems Analytical Data Summary
Alternative Water Solutions Program - 2014 Annual ReportNorth Pole, Alaska
C C1 D D1 D2 1-C 1-C1 1-C2 2-C 2-C1 2-C2 3-C 3-C1 3-C2 1-D 2-D 3-DDUP DUP
PW-ID Sample Date11/17/2014 37.1 <2.40 <2.40 <2.40 <2.4008/18/2014 44.0 47.8 <2.40 <2.40 <2.4005/23/2014 52.9 <2.00 <2.00 <2.0003/03/2014 53.3 54.1 <3.00 <3.00 <3.00J*11/26/2013 53.6 <3.10 <3.10 <3.1008/30/2013 68.9J* <3.10J* <3.10J* <3.10J*04/05/2013 78.5J* <3.10J* <3.10J* <3.10J*12/19/2012 103JH* <3.10J* <3.10J* <3.10J*07/02/2012 110JL* <3.10J* <3.10J* <3.10J*01/25/2012 114J* <3.10J* <3.10J* <3.10J*12/12/2011 115J* <3.10J* <3.10J*08/17/2011 129J* 3.40J*01/04/2010 95.4 90.611/14/2014 52.6 <2.40 <2.40 <2.4010/06/2014 <2.40 <2.4009/15/2014 51.0 <2.40 3.10J <2.4007/30/2013 94.2J* <3.10J* <3.10J* <3.10J*12/09/2011 202J* <3.10J* <3.10J* <3.10J*07/28/2011 213J* <3.10J*01/20/2010 21709/30/2014 43.7 44.9 <2.40 <2.40 <2.4008/26/2014 50.7 50.7 <2.40 <2.40 <2.4006/02/2014 71.3 69.7 <2.00 <2.00 <2.0003/14/2014 65.3 <3.00 <3.00 <3.0001/17/2014 81.3 74.8 <3.00 <3.00 <3.0011/19/2013 71.6 66.2 <3.10 <3.10 <3.1009/27/2013 70.0 71.6 <3.10 <3.10 <3.1008/20/2013 77.5J* <3.10J* <3.10J* <3.10J*05/28/2013 96.1J* <3.10J* <3.10J* <3.10J*03/12/2013 119J* <3.10J* <3.10J* <3.10J*12/18/2012 124JH* <3.10J* <3.10J* <3.10J*10/22/2012 115J* <3.10J* <3.10J* <3.10J*08/06/2012 141J* <3.10J* <3.10J* <3.10J*06/11/2012 <3.10 <3.1005/25/2012 152J* <3.10J* 26.4J* <3.10J*02/03/2012 167J* <3.10J* <3.10J* <3.10J*07/27/2011 233J* <3.10J*01/09/2010 25507/01/2014 157 <2.40 <2.40 <2.4002/03/2014 164 <3.00 <3.00 <3.0004/12/2013 255J* <3.10J* <3.10J* <3.10J*01/25/2012 360J* <3.10J* <3.10J* <3.10J*08/17/2011 326J* <3.10J*03/12/2011 21.2
DuplicatesA C2
0157
Sample Port
0158
0159
0160
Sulfolane (µg/l)
1 of 302/9/2015P:\Mpls\02 AK\01\02011001\WorkFiles\POE Treatment Support\AWS Annual Report-2014\Tables\Table 3_POE Sample Table_02022015.xlsx

Table 3POE Treatment Systems Analytical Data Summary
Alternative Water Solutions Program - 2014 Annual ReportNorth Pole, Alaska
C C1 D D1 D2 1-C 1-C1 1-C2 2-C 2-C1 2-C2 3-C 3-C1 3-C2 1-D 2-D 3-DDUP DUP
PW-ID Sample DateDuplicates
A C2Sample Port
Sulfolane (µg/l)11/04/2014 80.3 <2.40 <2.40 <2.4008/29/2014 84.9 88.1 <2.40 <2.40 <2.4005/30/2014 118 115 <2.00 <2.00 <2.0002/17/2014 129 <3.00 <3.00 <3.0011/22/2013 106 110 <3.10 <3.10 <3.1009/13/2013 110 <3.10 <3.10 <3.1006/14/2013 159J* <3.10J* <3.10J* <3.10J*03/29/2013 191J* <3.10J* <3.10J* <3.10J*01/08/2013 155J* <3.10J* <3.10J* <3.10J*10/16/2012 186J* <3.10J* <3.10J* <3.10J*06/28/2012 223J* <3.10J* <3.10J* <3.10J*03/15/2012 236J* <3.10J* <3.10J* <3.10J*11/02/2011 190J* <3.10J* <3.10J*06/21/2011 254J* <0.790J*01/23/2010 303 27710/21/2014 53.2 <2.40 <2.40 <2.40 <2.4003/10/2014 71.2 67.6 <3.00 <3.00 <3.0004/02/2013 102J* <3.10J* <3.10J* <3.10J*12/13/2011 166J* <3.10J* <3.10J* <3.10J*07/18/2011 210J* <0.790J*02/01/2010 24808/12/2014 67.7 75.0 <2.40 <2.40 <2.4012/27/2013 97.7 84.9 <3.00 <3.00 <3.0007/26/2013 114J* <3.10J* <3.10J* <3.10J*01/14/2013 143J* <3.10J* <3.10J* <3.10J*08/10/2011 220J* <3.10J*02/11/2010 25511/12/2014 14808/26/2014 145 14705/27/2014 14703/10/2014 15603/07/2014 138 150 <3.00 <3.00 <3.0011/19/2013 15309/05/2013 152
163164
05/17/2013 164J* <3.10J* <3.10J* <3.10J*03/11/2013 17307/18/2012 169J* <3.10J* <3.10J* <3.10J*09/22/2011 211J* <3.10J*04/14/2011 217JL* <5.00J*03/10/2011 15401/06/2010 10807/18/2014 136 128 <2.40 <2.40 <2.4007/26/2013 131J* <3.10J* <3.10J* <3.10J*06/28/2012 65.1J* <3.10J* <3.10J* <3.10J*01/06/2010 89.8
0164
0217 06/05/2013
0219
0161
0162
2 of 302/9/2015P:\Mpls\02 AK\01\02011001\WorkFiles\POE Treatment Support\AWS Annual Report-2014\Tables\Table 3_POE Sample Table_02022015.xlsx
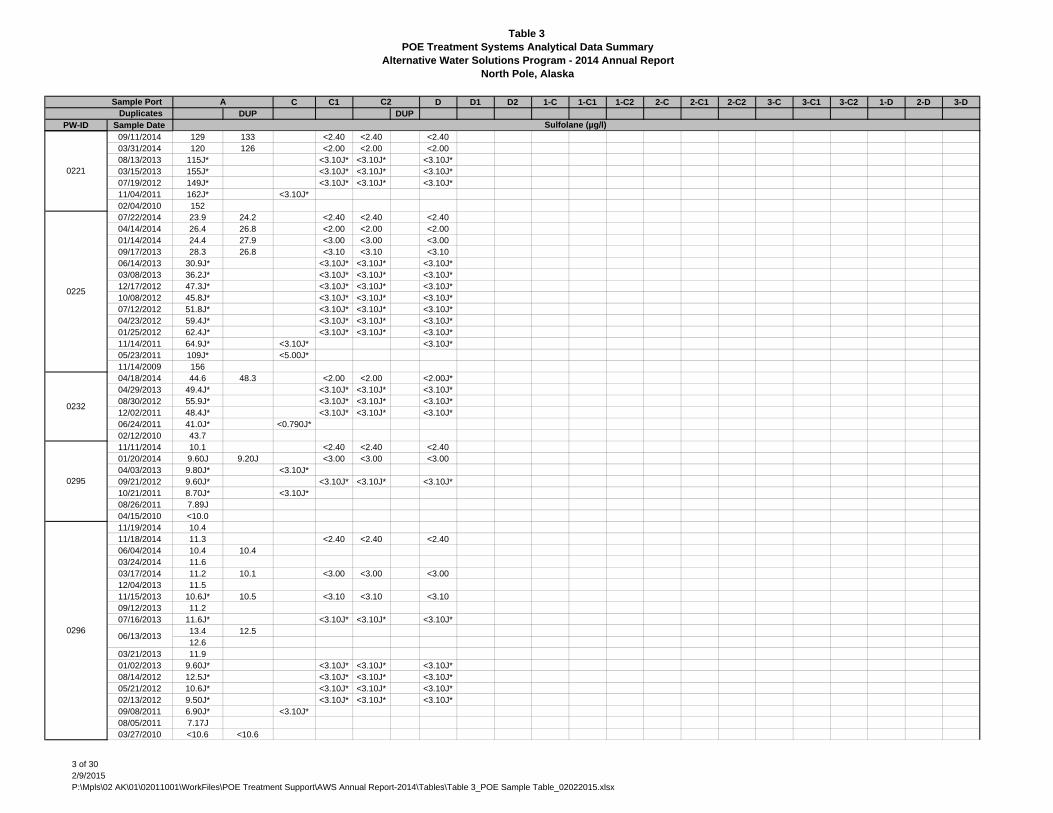
Table 3POE Treatment Systems Analytical Data Summary
Alternative Water Solutions Program - 2014 Annual ReportNorth Pole, Alaska
C C1 D D1 D2 1-C 1-C1 1-C2 2-C 2-C1 2-C2 3-C 3-C1 3-C2 1-D 2-D 3-DDUP DUP
PW-ID Sample DateDuplicates
A C2Sample Port
Sulfolane (µg/l)09/11/2014 129 133 <2.40 <2.40 <2.4003/31/2014 120 126 <2.00 <2.00 <2.0008/13/2013 115J* <3.10J* <3.10J* <3.10J*03/15/2013 155J* <3.10J* <3.10J* <3.10J*07/19/2012 149J* <3.10J* <3.10J* <3.10J*11/04/2011 162J* <3.10J*02/04/2010 15207/22/2014 23.9 24.2 <2.40 <2.40 <2.4004/14/2014 26.4 26.8 <2.00 <2.00 <2.0001/14/2014 24.4 27.9 <3.00 <3.00 <3.0009/17/2013 28.3 26.8 <3.10 <3.10 <3.1006/14/2013 30.9J* <3.10J* <3.10J* <3.10J*03/08/2013 36.2J* <3.10J* <3.10J* <3.10J*12/17/2012 47.3J* <3.10J* <3.10J* <3.10J*10/08/2012 45.8J* <3.10J* <3.10J* <3.10J*07/12/2012 51.8J* <3.10J* <3.10J* <3.10J*04/23/2012 59.4J* <3.10J* <3.10J* <3.10J*01/25/2012 62.4J* <3.10J* <3.10J* <3.10J*11/14/2011 64.9J* <3.10J* <3.10J*05/23/2011 109J* <5.00J*11/14/2009 15604/18/2014 44.6 48.3 <2.00 <2.00 <2.00J*04/29/2013 49.4J* <3.10J* <3.10J* <3.10J*08/30/2012 55.9J* <3.10J* <3.10J* <3.10J*12/02/2011 48.4J* <3.10J* <3.10J* <3.10J*06/24/2011 41.0J* <0.790J*02/12/2010 43.711/11/2014 10.1 <2.40 <2.40 <2.4001/20/2014 9.60J 9.20J <3.00 <3.00 <3.0004/03/2013 9.80J* <3.10J*09/21/2012 9.60J* <3.10J* <3.10J* <3.10J*10/21/2011 8.70J* <3.10J*08/26/2011 7.89J04/15/2010 <10.011/19/2014 10.411/18/2014 11.3 <2.40 <2.40 <2.4006/04/2014 10.4 10.403/24/2014 11.603/17/2014 11.2 10.1 <3.00 <3.00 <3.0012/04/2013 11.511/15/2013 10.6J* 10.5 <3.10 <3.10 <3.1009/12/2013 11.207/16/2013 11.6J* <3.10J* <3.10J* <3.10J*
13.4 12.512.6
03/21/2013 11.901/02/2013 9.60J* <3.10J* <3.10J* <3.10J*08/14/2012 12.5J* <3.10J* <3.10J* <3.10J*05/21/2012 10.6J* <3.10J* <3.10J* <3.10J*02/13/2012 9.50J* <3.10J* <3.10J* <3.10J*09/08/2011 6.90J* <3.10J*08/05/2011 7.17J03/27/2010 <10.6 <10.6
0225
0232
0295
029606/13/2013
0221
3 of 302/9/2015P:\Mpls\02 AK\01\02011001\WorkFiles\POE Treatment Support\AWS Annual Report-2014\Tables\Table 3_POE Sample Table_02022015.xlsx

Table 3POE Treatment Systems Analytical Data Summary
Alternative Water Solutions Program - 2014 Annual ReportNorth Pole, Alaska
C C1 D D1 D2 1-C 1-C1 1-C2 2-C 2-C1 2-C2 3-C 3-C1 3-C2 1-D 2-D 3-DDUP DUP
PW-ID Sample DateDuplicates
A C2Sample Port
Sulfolane (µg/l)09/16/2014 14.8 <2.40 <2.40 <2.4012/23/2013 11.1 9.90J <3.00 <3.00 <3.0004/16/2013 10.2J* <3.10J* <3.10J* <3.10J*10/26/2012 8.80J* <3.10J* <3.10J* <3.10J*04/19/2012 7.60J* <3.10J* <3.10J* <3.10J*09/13/2011 8.20J* <3.10J*07/26/2011 8.64J03/07/2011 <10.203/23/2010 <10.309/02/2014 16.4 16.0 <2.40 <2.40 <2.4008/20/2013 8.40J* <3.10J* <3.10J* <3.10J*06/16/2012 8.00J* <3.10J* <3.10J* <3.10J*02/06/2012 7.90J* <3.10J* <3.10J* <3.10J*08/03/2011 <3.10J* <3.10J*07/17/2011 7.00J04/15/2010 <10.309/22/2014 17.4 <2.40 <2.40 <2.4002/03/2014 13.5 14.2 <3.00 <3.00 <3.0009/23/2013 12.6 10.0J <3.10 <3.10 <3.1004/22/2013 10.3J* <3.10J* <3.10J* <3.10J*10/08/2012 9.80J* <3.10J* <3.10J* <3.10J*02/06/2012 8.70J* <3.10J* <3.10J* <3.10J*07/28/2011 9.80J* <3.10J*07/21/2011 8.26J02/23/2010 <10.908/01/2014 14.1 13.2 <2.40 <2.40 <2.4008/26/2013 8.20J* <3.10J* <3.10J* <3.10J*09/26/2012 9.30J* <3.10J*08/04/2011 8.64J05/12/2010 <10.408/12/2014 13.9 14.3 <2.40 <2.40 <2.4008/27/2013 11.4J* <3.10J* <3.10J* <3.10J*09/18/2012 7.30J* <3.10J* <3.10J* <3.10J*
6.90J*<3.10J*<3.10J*6.90J*
08/01/2011 6.77J04/15/2010 <10.909/30/2014 15.2 <2.40 <2.40 <2.4002/11/2014 15.0 13.9 <3.00 <3.00J* <3.0006/24/2013 14.1J* <3.10J* <3.10J* <3.10J*01/15/2013 11.4J* <3.10J* <3.10J* <3.10J*05/25/2012 12.2J* <3.10J* <3.10J* <3.10J* <3.10J*02/15/2012 11.2J* <3.10J* <3.10J* <3.10J*08/26/2011 10.8J* <3.10J*07/12/2011 12.603/16/2010 <10.312/21/2009 <10.3
10/26/2011
09/22/2011
0303
0298
0299
0300
0301
0302
4 of 302/9/2015P:\Mpls\02 AK\01\02011001\WorkFiles\POE Treatment Support\AWS Annual Report-2014\Tables\Table 3_POE Sample Table_02022015.xlsx

Table 3POE Treatment Systems Analytical Data Summary
Alternative Water Solutions Program - 2014 Annual ReportNorth Pole, Alaska
C C1 D D1 D2 1-C 1-C1 1-C2 2-C 2-C1 2-C2 3-C 3-C1 3-C2 1-D 2-D 3-DDUP DUP
PW-ID Sample DateDuplicates
A C2Sample Port
Sulfolane (µg/l)10/10/2014 26.1 <2.40 <2.40 <2.4003/10/2014 22.4 24.6 <3.00 <3.00 <3.00J*08/23/2013 19.6J* <3.10J* <3.10J* <3.10J*11/26/2012 23.4J* <3.10J* <3.10J* <3.10J*04/18/2012 19.7J* <3.10J*02/26/2010 13.906/27/2014 22.4 <2.40 <2.40 <2.4002/03/2014 17.5 19.1 <3.00 <3.00 <3.00J*07/16/2013 16.5J* <3.10J* <3.10J* <3.10J*02/01/2013 13.7J* <3.10J* <3.10J* <3.10J*10/26/2012 15.2J* <3.10J* <3.10J* <3.10J*07/13/2012 16.5J* <3.10J* <3.10J* <3.10J*10/05/2011 14.5J* <3.10J*08/19/2011 16.205/01/2010 <10.011/10/2014 17.8 <2.40 <2.40 <2.4008/08/2014 18.4 <2.40 <2.40 <2.4005/09/2014 17.4 <2.00 <2.00 <2.0001/31/2014 16.7 16.1 <3.00 <3.00 <3.00J*10/14/2013 12.2 12.3 <3.10 <3.10 <3.1007/08/2013 13.5J* <3.10J* <3.10J* <3.10J*03/29/2013 16.8J* <3.10J* <3.10J* <3.10J*12/11/2012 16.5J* <3.10J* <3.10J* <3.10J*08/29/2012 13.7J* <3.10J* <3.10J* <3.10J*03/19/2012 13.7J* <3.10J* <3.10J* <3.10J*09/20/2011 11.4J* <3.10J*07/26/2011 12.305/05/2010 <10.509/26/2014 4.90J 4.80J <2.40 <2.40 <2.4005/16/2014 3.10J 3.10J <2.00 <2.00 <2.0008/23/2013 5.50J* <3.10J* <3.10J* <3.10J*03/08/2013 7.20J* <3.10J* <3.10J* <3.10J*09/10/2012 7.20J* <3.10J* <3.10J* <3.10J*05/24/2012 7.10J* <3.10J*09/16/2011 7.19J04/16/2010 <10.006/09/2014 10.5 10.4 <2.40 <2.40 <2.4001/31/2014 9.70J*11/15/2013 9.70J <3.10 <3.10 <3.1009/24/2013 8.60J 8.80J <3.10 <3.10 <3.1007/09/2013 <3.10J* <3.10J*06/25/2013 10.2JL* <3.10J* <3.10J* <3.10J*04/22/2013 9.00J* <3.10J* <3.10J* <3.10J*01/29/2013 7.60J* <3.10J* <3.10J* <3.10J*11/16/2012 9.90J* <3.10J* <3.10J* <3.10J*06/11/2012 8.40J* <3.10J* <3.10J* <3.10J*04/23/2012 8.70J* <3.10J* <3.10J* <3.10J*10/18/2011 7.70J* <3.10J*08/29/2011 7.28J04/19/2010 <10.0
0307
0308
0309
0304
0305
5 of 302/9/2015P:\Mpls\02 AK\01\02011001\WorkFiles\POE Treatment Support\AWS Annual Report-2014\Tables\Table 3_POE Sample Table_02022015.xlsx
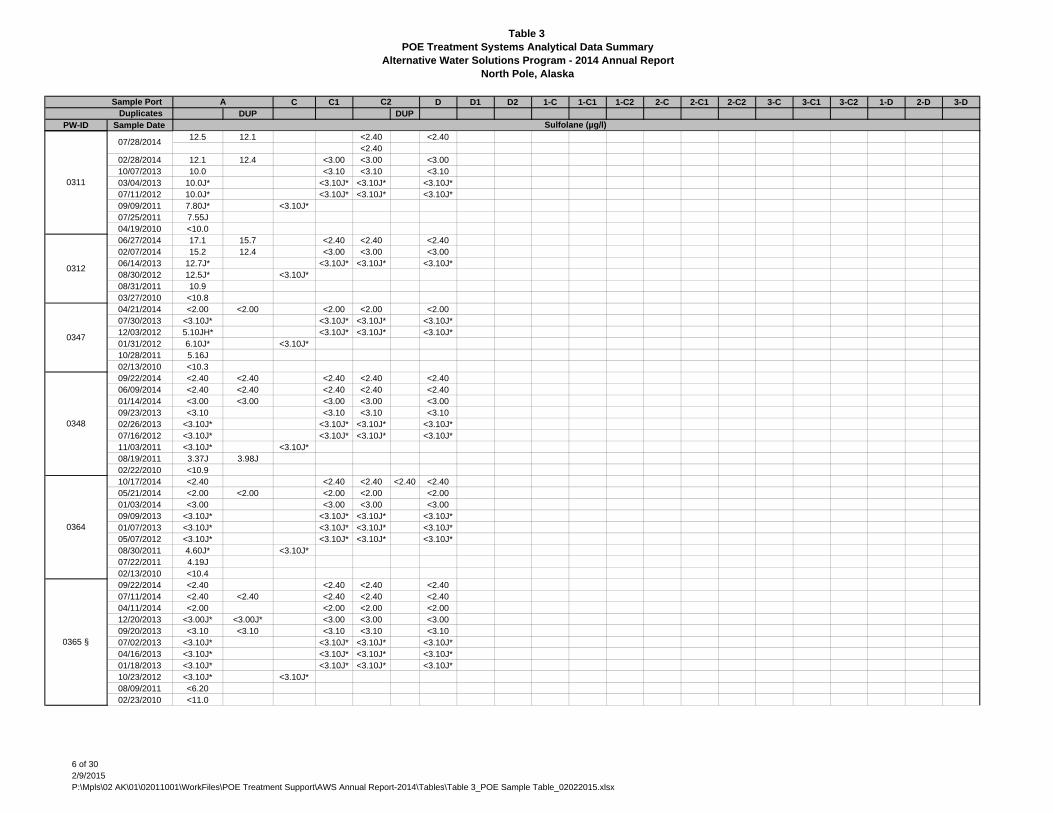
Table 3POE Treatment Systems Analytical Data Summary
Alternative Water Solutions Program - 2014 Annual ReportNorth Pole, Alaska
C C1 D D1 D2 1-C 1-C1 1-C2 2-C 2-C1 2-C2 3-C 3-C1 3-C2 1-D 2-D 3-DDUP DUP
PW-ID Sample DateDuplicates
A C2Sample Port
Sulfolane (µg/l)12.5 12.1 <2.40 <2.40
<2.4002/28/2014 12.1 12.4 <3.00 <3.00 <3.0010/07/2013 10.0 <3.10 <3.10 <3.1003/04/2013 10.0J* <3.10J* <3.10J* <3.10J*07/11/2012 10.0J* <3.10J* <3.10J* <3.10J*09/09/2011 7.80J* <3.10J*07/25/2011 7.55J04/19/2010 <10.006/27/2014 17.1 15.7 <2.40 <2.40 <2.4002/07/2014 15.2 12.4 <3.00 <3.00 <3.0006/14/2013 12.7J* <3.10J* <3.10J* <3.10J*08/30/2012 12.5J* <3.10J*08/31/2011 10.903/27/2010 <10.804/21/2014 <2.00 <2.00 <2.00 <2.00 <2.0007/30/2013 <3.10J* <3.10J* <3.10J* <3.10J*12/03/2012 5.10JH* <3.10J* <3.10J* <3.10J*01/31/2012 6.10J* <3.10J*10/28/2011 5.16J02/13/2010 <10.309/22/2014 <2.40 <2.40 <2.40 <2.40 <2.4006/09/2014 <2.40 <2.40 <2.40 <2.40 <2.4001/14/2014 <3.00 <3.00 <3.00 <3.00 <3.0009/23/2013 <3.10 <3.10 <3.10 <3.1002/26/2013 <3.10J* <3.10J* <3.10J* <3.10J*07/16/2012 <3.10J* <3.10J* <3.10J* <3.10J*11/03/2011 <3.10J* <3.10J*08/19/2011 3.37J 3.98J02/22/2010 <10.910/17/2014 <2.40 <2.40 <2.40 <2.40 <2.4005/21/2014 <2.00 <2.00 <2.00 <2.00 <2.0001/03/2014 <3.00 <3.00 <3.00 <3.0009/09/2013 <3.10J* <3.10J* <3.10J* <3.10J*01/07/2013 <3.10J* <3.10J* <3.10J* <3.10J*05/07/2012 <3.10J* <3.10J* <3.10J* <3.10J*08/30/2011 4.60J* <3.10J*07/22/2011 4.19J02/13/2010 <10.409/22/2014 <2.40 <2.40 <2.40 <2.4007/11/2014 <2.40 <2.40 <2.40 <2.40 <2.4004/11/2014 <2.00 <2.00 <2.00 <2.0012/20/2013 <3.00J* <3.00J* <3.00 <3.00 <3.0009/20/2013 <3.10 <3.10 <3.10 <3.10 <3.1007/02/2013 <3.10J* <3.10J* <3.10J* <3.10J*04/16/2013 <3.10J* <3.10J* <3.10J* <3.10J*01/18/2013 <3.10J* <3.10J* <3.10J* <3.10J*10/23/2012 <3.10J* <3.10J*08/09/2011 <6.2002/23/2010 <11.0
0312
0347
0348
0364
0365 §
0311
07/28/2014
6 of 302/9/2015P:\Mpls\02 AK\01\02011001\WorkFiles\POE Treatment Support\AWS Annual Report-2014\Tables\Table 3_POE Sample Table_02022015.xlsx

Table 3POE Treatment Systems Analytical Data Summary
Alternative Water Solutions Program - 2014 Annual ReportNorth Pole, Alaska
C C1 D D1 D2 1-C 1-C1 1-C2 2-C 2-C1 2-C2 3-C 3-C1 3-C2 1-D 2-D 3-DDUP DUP
PW-ID Sample DateDuplicates
A C2Sample Port
Sulfolane (µg/l)10/13/2014 <2.40 <2.40 <2.40 <2.40 <2.4008/15/2014 2.50J 2.50J <2.40 <2.40 <2.4005/02/2014 <2.00 <2.00 <2.00 <2.00 <2.0002/18/2014 <3.00 <3.00 <3.00 <3.00 <3.0001/07/2014 <3.00 3.40JH* <3.00 <3.00 <3.00
<3.10 <3.10 <3.10 <3.10J* <3.10<3.10
09/03/2013 <3.10J* <3.10J* <3.10J* <3.10J*07/18/2013 <3.10J* <3.10J* <3.10J*05/06/2013 <3.10J* <3.10J* <3.10J* <3.10J*03/18/2013 <3.10J* <3.10J* <3.10J* <3.10J*01/25/2013 <3.10J* <3.10J* <3.10J* <3.10J*11/16/2012 <3.10J* <3.10J* <3.10J* <3.10J*07/09/2012 <3.10J* <3.10J* <3.10J* <3.10J*04/10/2012 <3.10J* <3.10J* <3.10J* <3.10J*10/05/2011 <3.10J* <3.10J*05/26/2011 4.49J02/16/2010 <10.310/13/2014 5.20J <2.40 <2.40 <2.4006/09/2014 6.40J <2.40 <2.40 <2.4005/02/2014 6.90J <2.00 <2.00J* <2.0003/17/2014 7.10J 5.60J <3.00 <3.00 <3.00J*11/18/2013 6.00J 6.60J <3.10 <3.10 <3.1009/03/2013 9.00JL* <3.10J* <3.10J* <3.10J*05/06/2013 8.70J* <3.10J* <3.10J* <3.10J*12/18/2012 16.8JH* <3.10J* <3.10J* <3.10J*08/30/2012 9.10J* <3.10J* <3.10J* <3.10J*04/02/2012 10.8J* <3.10J* <3.10J* <3.10J*12/20/2011 10.3J* <3.10J* <3.10J* <3.10J*08/12/2011 12.5J* <3.10J*02/16/2010 11.908/29/2014 4.10J <2.40 <2.40 <2.4006/10/2014 <2.40 <2.40 <2.40 <2.4005/02/2014 4.00J 4.00J <2.00 <2.00 <2.0002/18/2014 <3.00 <3.00 <3.00 <3.0011/18/2013 4.00J <3.10 <3.10 <3.1009/03/2013 <3.10J* <3.10J* <3.10J* <3.10J*07/18/2013 4.50J* <3.10J* <3.10J* <3.10J*04/05/2013 5.60J* <3.10J* <3.10J* <3.10J*12/03/2012 6.40JH* <3.10J* <3.10J* <3.10J*07/09/2012 6.40J* <3.10J* <3.10J* <3.10J*12/19/2011 7.00J* <3.10J*06/16/2011 7.65J07/25/2014 7.10J 7.30J <2.40 <2.40 <2.4009/17/2013 8.30J <3.10 <3.10 <3.1006/05/2013 9.70J* <3.10J* <3.10J* <3.10J*03/11/2013 9.00J* <3.10J* <3.10J* <3.10J*01/22/2013 7.20J* <3.10J* <3.10J* <3.10J*07/13/2012 8.60J* <3.10J* <3.10J* <3.10J*12/09/2011 6.30J* <3.10J*10/15/2011 7.25J02/25/2010 <10.9
0376
11/18/2013
0377
0378
0390
7 of 302/9/2015P:\Mpls\02 AK\01\02011001\WorkFiles\POE Treatment Support\AWS Annual Report-2014\Tables\Table 3_POE Sample Table_02022015.xlsx
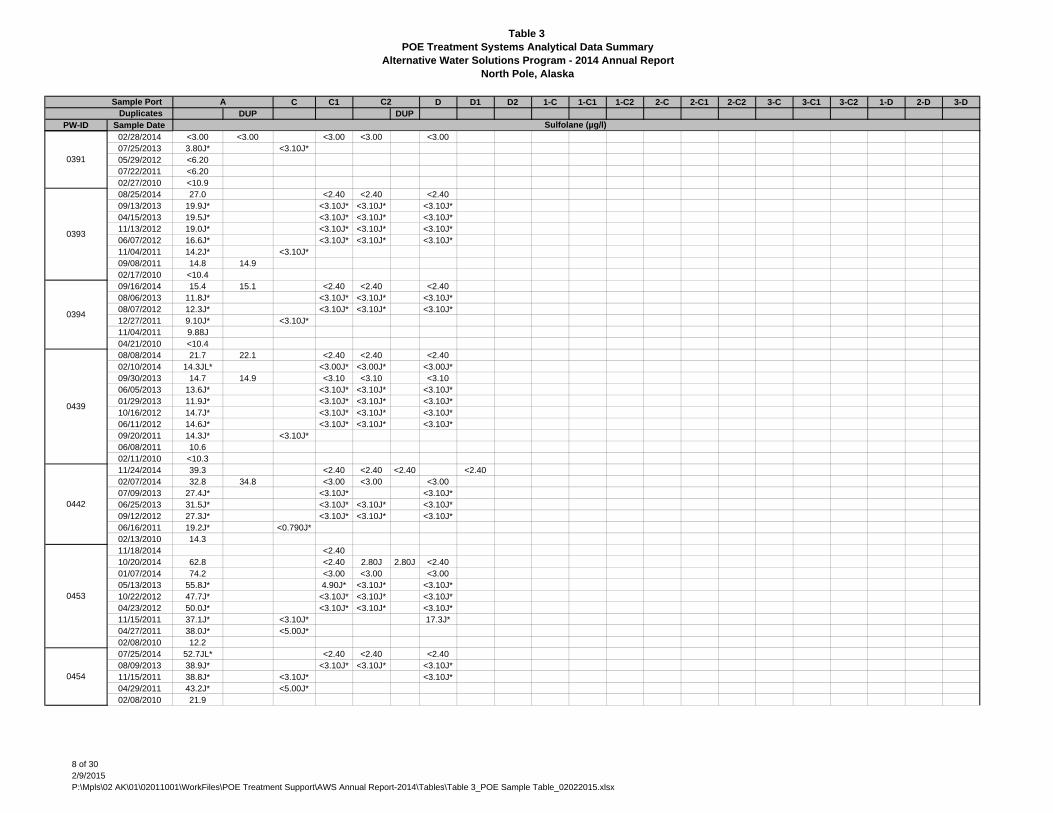
Table 3POE Treatment Systems Analytical Data Summary
Alternative Water Solutions Program - 2014 Annual ReportNorth Pole, Alaska
C C1 D D1 D2 1-C 1-C1 1-C2 2-C 2-C1 2-C2 3-C 3-C1 3-C2 1-D 2-D 3-DDUP DUP
PW-ID Sample DateDuplicates
A C2Sample Port
Sulfolane (µg/l)02/28/2014 <3.00 <3.00 <3.00 <3.00 <3.0007/25/2013 3.80J* <3.10J*05/29/2012 <6.2007/22/2011 <6.2002/27/2010 <10.908/25/2014 27.0 <2.40 <2.40 <2.4009/13/2013 19.9J* <3.10J* <3.10J* <3.10J*04/15/2013 19.5J* <3.10J* <3.10J* <3.10J*11/13/2012 19.0J* <3.10J* <3.10J* <3.10J*06/07/2012 16.6J* <3.10J* <3.10J* <3.10J*11/04/2011 14.2J* <3.10J*09/08/2011 14.8 14.902/17/2010 <10.409/16/2014 15.4 15.1 <2.40 <2.40 <2.4008/06/2013 11.8J* <3.10J* <3.10J* <3.10J*08/07/2012 12.3J* <3.10J* <3.10J* <3.10J*12/27/2011 9.10J* <3.10J*11/04/2011 9.88J04/21/2010 <10.408/08/2014 21.7 22.1 <2.40 <2.40 <2.4002/10/2014 14.3JL* <3.00J* <3.00J* <3.00J*09/30/2013 14.7 14.9 <3.10 <3.10 <3.1006/05/2013 13.6J* <3.10J* <3.10J* <3.10J*01/29/2013 11.9J* <3.10J* <3.10J* <3.10J*10/16/2012 14.7J* <3.10J* <3.10J* <3.10J*06/11/2012 14.6J* <3.10J* <3.10J* <3.10J*09/20/2011 14.3J* <3.10J*06/08/2011 10.602/11/2010 <10.311/24/2014 39.3 <2.40 <2.40 <2.40 <2.4002/07/2014 32.8 34.8 <3.00 <3.00 <3.0007/09/2013 27.4J* <3.10J* <3.10J*06/25/2013 31.5J* <3.10J* <3.10J* <3.10J*09/12/2012 27.3J* <3.10J* <3.10J* <3.10J*06/16/2011 19.2J* <0.790J*02/13/2010 14.311/18/2014 <2.4010/20/2014 62.8 <2.40 2.80J 2.80J <2.4001/07/2014 74.2 <3.00 <3.00 <3.0005/13/2013 55.8J* 4.90J* <3.10J* <3.10J*10/22/2012 47.7J* <3.10J* <3.10J* <3.10J*04/23/2012 50.0J* <3.10J* <3.10J* <3.10J*11/15/2011 37.1J* <3.10J* 17.3J*04/27/2011 38.0J* <5.00J*02/08/2010 12.207/25/2014 52.7JL* <2.40 <2.40 <2.4008/09/2013 38.9J* <3.10J* <3.10J* <3.10J*11/15/2011 38.8J* <3.10J* <3.10J*04/29/2011 43.2J* <5.00J*02/08/2010 21.9
0453
0454
0391
0393
0394
0439
0442
8 of 302/9/2015P:\Mpls\02 AK\01\02011001\WorkFiles\POE Treatment Support\AWS Annual Report-2014\Tables\Table 3_POE Sample Table_02022015.xlsx

Table 3POE Treatment Systems Analytical Data Summary
Alternative Water Solutions Program - 2014 Annual ReportNorth Pole, Alaska
C C1 D D1 D2 1-C 1-C1 1-C2 2-C 2-C1 2-C2 3-C 3-C1 3-C2 1-D 2-D 3-DDUP DUP
PW-ID Sample DateDuplicates
A C2Sample Port
Sulfolane (µg/l)10/03/2014 3.60J <2.40 <2.40 <2.4006/30/2014 6.10J <2.40 <2.40 <2.4003/17/2014 14.9 <3.00 <3.00 <3.0001/03/2014 12.4 7.00J* <3.00 <3.00J* <3.0009/02/2013 11.4JL* <3.10J* <3.10J* <3.10J*05/14/2013 15.5J* <3.10J*07/18/2011 9.17J02/10/2010 <10.611/11/2014 49.209/09/2014 45.008/15/2014 44.2 <2.40 <2.40 <2.4005/29/2014 40.403/28/2014 39.9 32.7 <2.00 <2.00 <2.0003/11/2014 36.212/16/2013 33.0 <3.10 <3.10 <3.1011/25/2013 39.409/12/2013 34.708/16/2013 26.6J* <3.10J* <3.10J* <3.10J*
33.233.3
04/08/2013 29.0J* <3.10J* <3.10J* <3.10J*04/04/2013 27.912/14/2012 35.1J* <3.10J* <3.10J* <3.10J*08/17/2012 29.4J* <3.10J* <3.10J* <3.10J*03/15/2012 27.1J* <3.10J* <3.10J* <3.10J*11/28/2011 26.7J* <3.10J* <3.10J*05/18/2011 25.8J* <5.00J*02/10/2010 25.111/12/2014 32.809/11/2014 33.2 33.3 <2.40 <2.40 <2.4009/10/2014 31.106/19/2014 30.4 31.403/11/2014 33.012/16/2013 31.411/01/2013 25.9 26.8 <3.10 <3.10 <3.1009/09/2013 29.5 29.0
26.826.6
04/18/2013 23.1 23.910/17/2012 20.6J* <3.10J*09/07/2011 14.402/09/2010 <10.708/29/2014 63.9 <2.40 <2.40 <2.4007/23/2013 83.5J* <3.10J* <3.10J* <3.10J*07/10/2012 116J* <3.10J* <3.10J* <3.10J*03/19/2012 111J* <3.10J* <3.10J* <3.10J*09/26/2011 115J* <3.10J*02/03/2010 78.7
0466
06/12/2013
0480
0456
046306/27/2013
9 of 302/9/2015P:\Mpls\02 AK\01\02011001\WorkFiles\POE Treatment Support\AWS Annual Report-2014\Tables\Table 3_POE Sample Table_02022015.xlsx
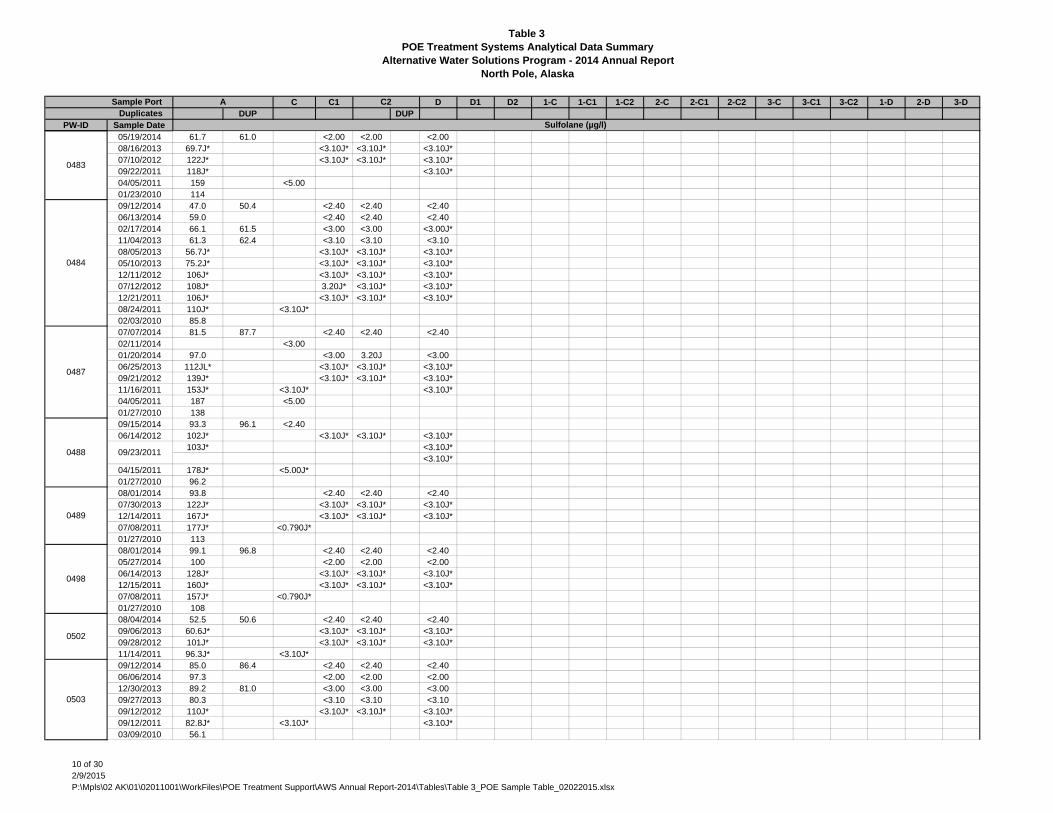
Table 3POE Treatment Systems Analytical Data Summary
Alternative Water Solutions Program - 2014 Annual ReportNorth Pole, Alaska
C C1 D D1 D2 1-C 1-C1 1-C2 2-C 2-C1 2-C2 3-C 3-C1 3-C2 1-D 2-D 3-DDUP DUP
PW-ID Sample DateDuplicates
A C2Sample Port
Sulfolane (µg/l)05/19/2014 61.7 61.0 <2.00 <2.00 <2.0008/16/2013 69.7J* <3.10J* <3.10J* <3.10J*07/10/2012 122J* <3.10J* <3.10J* <3.10J*09/22/2011 118J* <3.10J*04/05/2011 159 <5.0001/23/2010 11409/12/2014 47.0 50.4 <2.40 <2.40 <2.4006/13/2014 59.0 <2.40 <2.40 <2.4002/17/2014 66.1 61.5 <3.00 <3.00 <3.00J*11/04/2013 61.3 62.4 <3.10 <3.10 <3.1008/05/2013 56.7J* <3.10J* <3.10J* <3.10J*05/10/2013 75.2J* <3.10J* <3.10J* <3.10J*12/11/2012 106J* <3.10J* <3.10J* <3.10J*07/12/2012 108J* 3.20J* <3.10J* <3.10J*12/21/2011 106J* <3.10J* <3.10J* <3.10J*08/24/2011 110J* <3.10J*02/03/2010 85.807/07/2014 81.5 87.7 <2.40 <2.40 <2.4002/11/2014 <3.0001/20/2014 97.0 <3.00 3.20J <3.0006/25/2013 112JL* <3.10J* <3.10J* <3.10J*09/21/2012 139J* <3.10J* <3.10J* <3.10J*11/16/2011 153J* <3.10J* <3.10J*04/05/2011 187 <5.0001/27/2010 13809/15/2014 93.3 96.1 <2.4006/14/2012 102J* <3.10J* <3.10J* <3.10J*
103J* <3.10J*<3.10J*
04/15/2011 178J* <5.00J*01/27/2010 96.208/01/2014 93.8 <2.40 <2.40 <2.4007/30/2013 122J* <3.10J* <3.10J* <3.10J*12/14/2011 167J* <3.10J* <3.10J* <3.10J*07/08/2011 177J* <0.790J*01/27/2010 11308/01/2014 99.1 96.8 <2.40 <2.40 <2.4005/27/2014 100 <2.00 <2.00 <2.0006/14/2013 128J* <3.10J* <3.10J* <3.10J*12/15/2011 160J* <3.10J* <3.10J* <3.10J*07/08/2011 157J* <0.790J*01/27/2010 10808/04/2014 52.5 50.6 <2.40 <2.40 <2.4009/06/2013 60.6J* <3.10J* <3.10J* <3.10J*09/28/2012 101J* <3.10J* <3.10J* <3.10J*11/14/2011 96.3J* <3.10J*09/12/2014 85.0 86.4 <2.40 <2.40 <2.4006/06/2014 97.3 <2.00 <2.00 <2.0012/30/2013 89.2 81.0 <3.00 <3.00 <3.0009/27/2013 80.3 <3.10 <3.10 <3.1009/12/2012 110J* <3.10J* <3.10J* <3.10J*09/12/2011 82.8J* <3.10J* <3.10J*03/09/2010 56.1
0502
0503
0487
0488 09/23/2011
0489
0498
0483
0484
10 of 302/9/2015P:\Mpls\02 AK\01\02011001\WorkFiles\POE Treatment Support\AWS Annual Report-2014\Tables\Table 3_POE Sample Table_02022015.xlsx
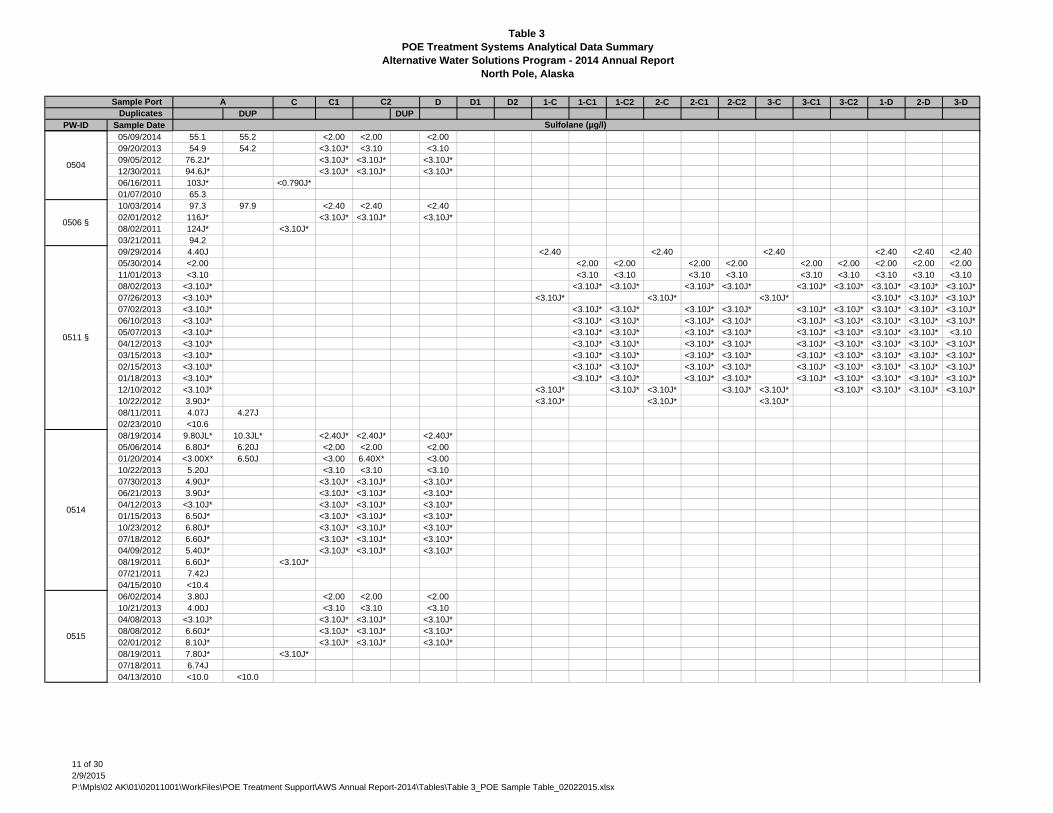
Table 3POE Treatment Systems Analytical Data Summary
Alternative Water Solutions Program - 2014 Annual ReportNorth Pole, Alaska
C C1 D D1 D2 1-C 1-C1 1-C2 2-C 2-C1 2-C2 3-C 3-C1 3-C2 1-D 2-D 3-DDUP DUP
PW-ID Sample DateDuplicates
A C2Sample Port
Sulfolane (µg/l)05/09/2014 55.1 55.2 <2.00 <2.00 <2.0009/20/2013 54.9 54.2 <3.10J* <3.10 <3.1009/05/2012 76.2J* <3.10J* <3.10J* <3.10J*12/30/2011 94.6J* <3.10J* <3.10J* <3.10J*06/16/2011 103J* <0.790J*01/07/2010 65.310/03/2014 97.3 97.9 <2.40 <2.40 <2.4002/01/2012 116J* <3.10J* <3.10J* <3.10J*08/02/2011 124J* <3.10J*03/21/2011 94.209/29/2014 4.40J <2.40 <2.40 <2.40 <2.40 <2.40 <2.4005/30/2014 <2.00 <2.00 <2.00 <2.00 <2.00 <2.00 <2.00 <2.00 <2.00 <2.0011/01/2013 <3.10 <3.10 <3.10 <3.10 <3.10 <3.10 <3.10 <3.10 <3.10 <3.1008/02/2013 <3.10J* <3.10J* <3.10J* <3.10J* <3.10J* <3.10J* <3.10J* <3.10J* <3.10J* <3.10J*07/26/2013 <3.10J* <3.10J* <3.10J* <3.10J* <3.10J* <3.10J* <3.10J*07/02/2013 <3.10J* <3.10J* <3.10J* <3.10J* <3.10J* <3.10J* <3.10J* <3.10J* <3.10J* <3.10J*06/10/2013 <3.10J* <3.10J* <3.10J* <3.10J* <3.10J* <3.10J* <3.10J* <3.10J* <3.10J* <3.10J*05/07/2013 <3.10J* <3.10J* <3.10J* <3.10J* <3.10J* <3.10J* <3.10J* <3.10J* <3.10J* <3.1004/12/2013 <3.10J* <3.10J* <3.10J* <3.10J* <3.10J* <3.10J* <3.10J* <3.10J* <3.10J* <3.10J*03/15/2013 <3.10J* <3.10J* <3.10J* <3.10J* <3.10J* <3.10J* <3.10J* <3.10J* <3.10J* <3.10J*02/15/2013 <3.10J* <3.10J* <3.10J* <3.10J* <3.10J* <3.10J* <3.10J* <3.10J* <3.10J* <3.10J*01/18/2013 <3.10J* <3.10J* <3.10J* <3.10J* <3.10J* <3.10J* <3.10J* <3.10J* <3.10J* <3.10J*12/10/2012 <3.10J* <3.10J* <3.10J* <3.10J* <3.10J* <3.10J* <3.10J* <3.10J* <3.10J* <3.10J*10/22/2012 3.90J* <3.10J* <3.10J* <3.10J*08/11/2011 4.07J 4.27J02/23/2010 <10.608/19/2014 9.80JL* 10.3JL* <2.40J* <2.40J* <2.40J*05/06/2014 6.80J* 6.20J <2.00 <2.00 <2.0001/20/2014 <3.00X* 6.50J <3.00 6.40X* <3.0010/22/2013 5.20J <3.10 <3.10 <3.1007/30/2013 4.90J* <3.10J* <3.10J* <3.10J*06/21/2013 3.90J* <3.10J* <3.10J* <3.10J*04/12/2013 <3.10J* <3.10J* <3.10J* <3.10J*01/15/2013 6.50J* <3.10J* <3.10J* <3.10J*10/23/2012 6.80J* <3.10J* <3.10J* <3.10J*07/18/2012 6.60J* <3.10J* <3.10J* <3.10J*04/09/2012 5.40J* <3.10J* <3.10J* <3.10J*08/19/2011 6.60J* <3.10J*07/21/2011 7.42J04/15/2010 <10.406/02/2014 3.80J <2.00 <2.00 <2.0010/21/2013 4.00J <3.10 <3.10 <3.1004/08/2013 <3.10J* <3.10J* <3.10J* <3.10J*08/08/2012 6.60J* <3.10J* <3.10J* <3.10J*02/01/2012 8.10J* <3.10J* <3.10J* <3.10J*08/19/2011 7.80J* <3.10J*07/18/2011 6.74J04/13/2010 <10.0 <10.0
0514
0515
0504
0506 §
0511 §
11 of 302/9/2015P:\Mpls\02 AK\01\02011001\WorkFiles\POE Treatment Support\AWS Annual Report-2014\Tables\Table 3_POE Sample Table_02022015.xlsx

Table 3POE Treatment Systems Analytical Data Summary
Alternative Water Solutions Program - 2014 Annual ReportNorth Pole, Alaska
C C1 D D1 D2 1-C 1-C1 1-C2 2-C 2-C1 2-C2 3-C 3-C1 3-C2 1-D 2-D 3-DDUP DUP
PW-ID Sample DateDuplicates
A C2Sample Port
Sulfolane (µg/l)07/14/2014 20.7 19.5 <2.40 <2.40 <2.4001/27/2014 15.2 17.0 <3.00 <3.00 <3.0007/29/2013 18.1J* <3.10J* <3.10J* <3.10J*02/05/2013 17.1J* <3.10J* <3.10J* <3.10J*08/30/2012 16.5J* <3.10J* <3.10J* <3.10J*02/15/2012 14.7J* <3.10J* <3.10J* <3.10J*08/01/2011 15.7J* <3.10J*04/09/2010 11.309/19/2014 15.4 15.4 <2.40 <2.40 <2.4005/19/2014 15.1 <2.00 <2.00 <2.0001/17/2014 16.2 <3.00 <3.00 <3.0008/19/2013 20.2J* <3.10J* <3.10J* <3.10J*04/01/2013 15.4J* <3.10J* <3.10J* <3.10J*10/19/2012 13.6J* <3.10J* <3.10J* <3.10J*05/22/2012 12.1J* <3.10J*04/30/2012 12.0J* <3.10J* <3.10J* <3.10J*12/02/2011 11.5J* <3.10J*06/06/2011 8.65J04/18/2010 <10.011/03/2014 <2.40 <2.4010/10/2014 18.5 18.1 <2.40 4.10J <2.4012/20/2013 14.1 <3.00 <3.00 <3.0007/09/2013 17.4J* <3.10J* <3.10J* <3.10J*01/16/2013 12.8J* <3.10J* <3.10J* <3.10J*04/03/2012 14.9J* <3.10J* <3.10J* <3.10J*09/06/2011 13.8J* <3.10J*04/10/2010 13.409/23/2014 19.7 19.6 <2.40 <2.40 <2.4006/20/2014 21.5 21.1 <2.40 <2.40 <2.4002/25/2014 19.2 <3.00 <3.00 <3.0011/05/2013 18.3 17.5 <3.10 <3.10 <3.1006/10/2013 17.9J* <3.10J* <3.10J* <3.10J*01/03/2013 16.2J* <3.10J* <3.10J* <3.10J*10/12/2012 19.6J* <3.10J* <3.10J* <3.10J*07/24/2012 20.2J* <3.10J* <3.10J* <3.10J*05/04/2012 18.0J* <3.10J* <3.10J* <3.10J*01/23/2012 18.6J* <3.10J* <3.10J* <3.10J*08/02/2011 18.6J* <3.10J*06/10/2011 18.304/10/2010 <10.404/15/2014 14.0 17.9 <2.00 <2.00 <2.0005/31/2013 14.2J* <3.10J* <3.10J* <3.10J*06/19/2012 16.5J* <3.10J*07/08/2011 14.004/17/2010 <10.0
0553
0554
0542
0544
0550
12 of 302/9/2015P:\Mpls\02 AK\01\02011001\WorkFiles\POE Treatment Support\AWS Annual Report-2014\Tables\Table 3_POE Sample Table_02022015.xlsx

Table 3POE Treatment Systems Analytical Data Summary
Alternative Water Solutions Program - 2014 Annual ReportNorth Pole, Alaska
C C1 D D1 D2 1-C 1-C1 1-C2 2-C 2-C1 2-C2 3-C 3-C1 3-C2 1-D 2-D 3-DDUP DUP
PW-ID Sample DateDuplicates
A C2Sample Port
Sulfolane (µg/l)05/06/2014 5.00J <2.00 <2.00 <2.0003/07/2014 6.80J <3.00 <3.00 <3.0011/19/2013 5.80J <3.10 <3.10 <3.1007/26/2013 5.00J* <3.10J* <3.10J* <3.10J*04/16/2013 5.00J* <3.10J* <3.10J* <3.10J*01/07/2013 5.80J* <3.10J* <3.10J* <3.10J*10/19/2012 7.40J* <3.10J* <3.10J* <3.10J*07/16/2012 8.10J* <3.10J* <3.10J* <3.10J*03/15/2012 7.50J* <3.10J*09/02/2011 8.02J04/15/2010 <10.411/11/2014 17.0 <2.40 <2.40 <2.4006/10/2014 14.0 15.4 <2.40 <2.40 <2.4012/30/2013 12.2 <3.00 <3.00 <3.0005/31/2013 11.1J* <3.10J* <3.10J* <3.10J*11/27/2012 17.8J* <3.10J* <3.10J* <3.10J*02/22/2012 13.1J* <3.10J* <3.10J* <3.10J*08/05/2011 14.9JL* <3.10J*07/08/2011 12.909/29/2010 <11.105/09/2014 20.5 20.1 <2.00 <2.00 <2.0007/29/2013 18.6J* <3.10J* <3.10J* <3.10J*01/14/2013 17.2J* <3.10J* <3.10J* <3.10J*02/20/2012 16.5J* <3.10J* <3.10J* <3.10J*08/08/2011 19.5J* <3.10J*04/14/2010 11.509/05/2014 18.8 16.8 <2.40 <2.40 <2.4005/23/2014 15.8 16.0 <2.00 <2.00 <2.0001/13/2014 15.3 <3.00 <3.00 <3.0008/26/2013 12.5J* <3.10J* <3.10J* <3.10J*04/29/2013 16.1J* <3.10J* <3.10J* <3.10J*12/17/2012 16.7J* <3.10J* <3.10J* <3.10J*08/08/2012 15.4J* <3.10J* <3.10J* <3.10J*03/15/2012 14.0J* <3.10J* <3.10J* <3.10J*11/28/2011 13.4J* <3.10J* <3.10J*06/06/2011 13.0J* <0.790J*04/15/2010 13.407/07/2014 23.0 <2.40 <2.40 <2.4001/27/2014 18.5 <3.00 <3.00 <3.0008/20/2013 18.4J* <3.10J* <3.10J* <3.10J*03/08/2013 18.6J* <3.10J* <3.10J* <3.10J*10/05/2012 15.8J* <3.10J* <3.10J* <3.10J*04/24/2012 19.8J* <3.10J* <3.10J* <3.10J*11/14/2011 13.7J* <3.10J* <3.10J*04/25/2011 20.5J* <5.00J*04/14/2010 12.4
0559
0560
0556
0557
0558
13 of 302/9/2015P:\Mpls\02 AK\01\02011001\WorkFiles\POE Treatment Support\AWS Annual Report-2014\Tables\Table 3_POE Sample Table_02022015.xlsx

Table 3POE Treatment Systems Analytical Data Summary
Alternative Water Solutions Program - 2014 Annual ReportNorth Pole, Alaska
C C1 D D1 D2 1-C 1-C1 1-C2 2-C 2-C1 2-C2 3-C 3-C1 3-C2 1-D 2-D 3-DDUP DUP
PW-ID Sample DateDuplicates
A C2Sample Port
Sulfolane (µg/l)04/04/2014 28.1 <2.00 <2.00 <2.0012/27/2013 27.1 <3.00 <3.00 <3.0009/02/2013 25.1JL* <3.10J* <3.10J* <3.10J*05/24/2013 23.1J* <3.10J* <3.10J* <3.10J*01/30/2013 21.3J* <3.10J* <3.10J* <3.10J*10/30/2012 24.3J* <3.10J* <3.10J* <3.10J*05/16/2012 24.0J* <3.10J* <3.10J* <3.10J*10/31/2011 <3.10J* <3.10J* <3.10J*05/11/2011 20.0J* <5.00J*04/24/2010 17.805/12/2014 16.7 <2.00 <2.00 <2.0005/03/2013 18.7J* <3.10J* <3.10J* <3.10J*06/07/2011 14.1J* <0.790J*04/14/2010 11.110/28/2014 17.5 <2.40 <2.40 <2.40 <2.4006/03/2014 18.0 18.3 <2.40 <2.40 <2.4012/09/2013 15.4 15.3 <3.10 <3.10 <3.1005/28/2013 18.7J* <3.10J*09/01/2011 17.904/18/2010 <10.610/31/2014 21.7 <2.4005/16/2014 9.00J <2.00 <2.00 <2.0011/15/2013 11.8 12.1 <3.10 <3.10 <3.1004/01/2013 14.6J* <3.10J* <3.10J* <3.10J*08/20/2012 18.4J* <3.10J* <3.10J* <3.10J*11/28/2011 15.6J* <3.10J* <3.10J*06/07/2011 14.1J* <0.790J*04/14/2010 11.4 11.210/27/2014 8.30J <2.40 <2.40 <2.40 <2.4004/28/2014 2.90JH* <2.00 <2.00 <2.00 <2.0008/12/2013 4.70J* <3.10J* <3.10J* <3.10J*11/30/2012 9.30JH* <3.10J*02/17/2012 5.50J* <3.10J* <3.10J* <3.10J*08/12/2011 7.90J* <3.10J*07/09/2011 7.49J04/16/2010 <10.4 <10.010/03/2014 19.5 20.0 <2.40 <2.40 <2.4006/23/2014 12.5 12.6 <2.40 <2.40 <2.4001/28/2014 12.5 11.8 <3.00 <3.00 <3.0009/02/2013 13.3JL* <3.10J* <3.10J* <3.10J*04/23/2013 7.40J* <3.10J* <3.10J* <3.10J*12/18/2012 16.4JH* <3.10J* <3.10J* <3.10J*08/06/2012 14.9J* <3.10J* <3.10J* <3.10J*06/07/2012 10.7J* <3.10J* <3.10J* <3.10J*03/16/2012 10.3J* <3.10J* <3.10J* <3.10J*12/20/2011 12.4J* <3.10J* <3.10J* <3.10J*08/31/2011 16.7J* <3.10J*07/08/2011 12.3 12.104/07/2010 <10.5
0561
0562
0563
0564
0565
0566
14 of 302/9/2015P:\Mpls\02 AK\01\02011001\WorkFiles\POE Treatment Support\AWS Annual Report-2014\Tables\Table 3_POE Sample Table_02022015.xlsx

Table 3POE Treatment Systems Analytical Data Summary
Alternative Water Solutions Program - 2014 Annual ReportNorth Pole, Alaska
C C1 D D1 D2 1-C 1-C1 1-C2 2-C 2-C1 2-C2 3-C 3-C1 3-C2 1-D 2-D 3-DDUP DUP
PW-ID Sample DateDuplicates
A C2Sample Port
Sulfolane (µg/l)07/29/2014 9.80J 9.00J <2.40 <2.40 <2.4001/06/2014 7.80J 8.00J <3.00 <3.00 <3.0008/06/2013 5.10J* <3.10J* <3.10J* <3.10J*04/02/2013 4.40J* <3.10J* <3.10J* <3.10J*09/10/2012 9.40J* <3.10J* <3.10J* <3.10J*02/20/2012 7.50J* <3.10J* <3.10J* <3.10J*08/18/2011 8.90J* <3.10J*07/08/2011 8.09J04/07/2010 <10.611/18/2014 15.5 <2.40 <2.40 <2.4009/05/2014 17.6 <2.40 <2.40 <2.4006/20/2014 18.8 <2.40 <2.40 <2.4004/14/2014 15.9 15.8 <2.00 <2.00 <2.0004/19/2013 14.6J* <3.10J* <3.10J* <3.10J*06/14/2012 19.6J* <3.10J* <3.10J* <3.10J*02/02/2012 17.0J* <3.10J* <3.10J* <3.10J*07/29/2011 20.1J* <3.10J*04/24/2010 13.0 16.108/22/2014 19.1 <2.40 <2.40 <2.4005/02/2014 15.0 <2.00 <2.00 <2.0005/14/2013 13.6J* <3.10J* <3.10J* <3.10J*09/12/2012 13.8J* <3.10J* <3.10J* <3.10J*12/07/2011 11.7J* <3.10J* <3.10J* <3.10J*05/31/2011 14.8J* <5.00J*05/18/2011 14.4J* 14.0J*01/23/2010 10.608/19/2014 12.6JL* <2.40J* <2.40J* <2.40J*05/23/2014 11.1 10.2 <2.00 <2.00 <2.0001/28/2014 <3.00 <3.00 <3.00 <3.0010/22/2013 8.00J 8.20J <3.10 <3.10 <3.1005/20/2013 9.10J* <3.10J* <3.10J* <3.10J*01/28/2013 7.30J* <3.10J* <3.10J* <3.10J*08/14/2012 8.40J* <3.10J* <3.10J* <3.10J*03/16/2012 8.20J* <3.10J* <3.10J* <3.10J*10/11/2011 6.40J* <3.10J*08/19/2011 7.97J04/17/2010 <10.010/28/2014 <2.40 <2.4009/19/2014 82.8 <2.40 3.90J <2.4007/22/2014 90.5 5.80J <2.40 <2.4006/06/2014 89.7 88.0 <2.00 <2.00 <2.0001/21/2014 89.8 91.6 <3.00 <3.00 <3.0012/31/2013 89.4 <3.00 <3.0008/06/2013 70.7J* <3.10J* <3.10J* <3.10J*06/27/2013 96.5JL* <3.10J* <3.10J*06/06/2013 88.3J* 6.80J* <3.10J* <3.10J*12/07/2012 123J* <3.10J* <3.10J* <3.10J*07/16/2012 111J* <3.10J* <3.10J* <3.10J*10/26/2011 95.5J* <3.10J*12/30/2009 49.7
0568
0570
0586
0597 §
0567
15 of 302/9/2015P:\Mpls\02 AK\01\02011001\WorkFiles\POE Treatment Support\AWS Annual Report-2014\Tables\Table 3_POE Sample Table_02022015.xlsx

Table 3POE Treatment Systems Analytical Data Summary
Alternative Water Solutions Program - 2014 Annual ReportNorth Pole, Alaska
C C1 D D1 D2 1-C 1-C1 1-C2 2-C 2-C1 2-C2 3-C 3-C1 3-C2 1-D 2-D 3-DDUP DUP
PW-ID Sample DateDuplicates
A C2Sample Port
Sulfolane (µg/l)08/04/2014 149 <2.40 <2.40 <2.4008/12/2013 135J* <3.10J* <3.10J* <3.10J*11/27/2012 192J* <3.10J* <3.10J* <3.10J*06/08/2012 24104/10/2012 182J* <3.10J* <3.10J* <3.10J*10/05/2011 183J* <3.10J* <3.10J*04/15/2011 206J* <5.00J*01/07/2010 14008/18/2014 116 <2.40 <2.40 <2.4003/14/2014 153 142 <3.00 <3.00 <3.0010/25/2013 140 135 <3.10 <3.10 <3.1006/10/2013 148J* <3.10J* <3.10J* <3.10J*07/03/2012 241JL* <3.10J*09/15/2014 66.4 <2.40 <2.4008/18/2014 70.7 4.40J 4.80J <2.4012/03/2013 62.5 <3.10 <3.10 <3.1008/20/2013 70.1J* <3.10J* <3.10J* <3.10J*12/26/2012 58.9J* <3.10J* <3.10J* <3.10J*07/10/2012 70.6J* <3.10J* <3.10J* <3.10J*12/13/2011 58.0J* <3.10J* <3.10J* <3.10J*07/13/2011 55.8J* <0.790J*02/28/2010 27.311/04/2014 110 <2.40 <2.40 <2.4009/23/2014 116 <2.40 <2.40 <2.4007/14/2014 147 136 <2.40 <2.40 <2.4005/15/2014 184 191 <2.00 <2.00 <2.0002/18/2014 216 210J* <3.00 <3.00 <3.0012/13/2013 152 158 <3.10 <3.10 <3.1003/11/2013 225J* <3.10J* <3.10J* <3.10J*09/15/2012 221J* <3.10J* <3.10J* <3.10J*03/27/2012 249J* <3.10J*02/01/2010 169 13410/31/2014 86.1 <2.40 <2.40 <2.40 <2.4007/08/2014 96.0 <2.40 <2.40 <2.4003/14/2014 89.4 100 <3.00 <3.00 <3.0010/21/2013 87.3 88.5 <3.10 <3.10 <3.1006/19/2013 104J* <3.10J* <3.10J* <3.10J*01/14/2013 91.7J* <3.10J* <3.10J* <3.10J*05/21/2012 108J* <3.10J* <3.10J* <3.10J*03/07/2012 97.2J* 4.70J* <3.10J* <3.10J*08/16/2011 87.6J* <3.10J*03/07/2010 57.808/29/2014 <2.40 <2.4007/21/2014 84.3 82.4 <2.40 4.70J <2.4008/19/2013 82.7JL* <3.10J* <3.10 <3.1009/05/2012 99.5J* <3.10J* <3.10J* <3.10J*06/11/2012 94.0J* <3.10J* <3.10J* <3.10J*03/12/2012 104J* <3.10J* <3.10J* <3.10J*09/16/2011 71.1J* <3.10J*
0599
0606
0607
0608
0609
0598
16 of 302/9/2015P:\Mpls\02 AK\01\02011001\WorkFiles\POE Treatment Support\AWS Annual Report-2014\Tables\Table 3_POE Sample Table_02022015.xlsx

Table 3POE Treatment Systems Analytical Data Summary
Alternative Water Solutions Program - 2014 Annual ReportNorth Pole, Alaska
C C1 D D1 D2 1-C 1-C1 1-C2 2-C 2-C1 2-C2 3-C 3-C1 3-C2 1-D 2-D 3-DDUP DUP
PW-ID Sample DateDuplicates
A C2Sample Port
Sulfolane (µg/l)08/25/2014 32.8 31.7 <2.40 <2.40 <2.4008/16/2013 28.4J* <3.10J* <3.10J* <3.10J*11/30/2012 37.0JH* <3.10J* <3.10J* <3.10J*11/28/2011 31.8J* <3.10J* <3.10J*06/01/2011 30.0J* <0.790J*03/07/2010 24.307/11/2014 114 122 <2.40 <2.40 <2.4002/14/2014 148 <3.00 <3.00 <3.0010/14/2013 115 <3.10 <3.10 <3.1005/03/2013 142J* <3.10J* <3.10J* <3.10J*12/19/2012 176JH* <3.10J* <3.10J* <3.10J*08/17/2012 143J* <3.10J* <3.10J* <3.10J*03/16/2012 126J* <3.10J* <3.10J* <3.10J*09/30/2011 121J* <3.10J* <3.10J*04/28/2011 116J* <10.0J*03/29/2011 120J*03/04/2010 65.3 60.508/22/2014 146 <2.40 <2.40 <2.4010/15/2013 143 <3.10 <3.10 <3.1011/09/2012 168J* <3.10J* <3.10J* <3.10J*02/07/2012 145J* <3.10J* <3.10J* <3.10J*07/20/2011 144J* <3.10J*03/04/2010 56.411/17/2014 40.9 <2.40 <2.40 <2.4007/21/2014 56.7 <2.40 <2.40 <2.4002/14/2014 10.2 9.70J <3.00J* <3.00 <3.0009/16/2013 33.7 <3.10 <3.10 <3.1005/03/2013 36.6J* <3.10J* <3.10J* <3.10J*11/02/2012 25.6J* <3.10J* <3.10J* <3.10J*05/21/2012 48.2J* <3.10J*04/27/2012 39.0J* <3.10J* <3.10J* <3.10J*11/17/2011 16.0J* <3.10J* <3.10J*05/19/2011 43.8J* <5.00J*02/22/2010 29.504/07/2014 92.8 93.0 <2.00 <2.00 <2.0012/13/2013 99.8 <3.10 <3.10 <3.1009/09/2013 89.5J* <3.10J* <3.10J* <3.10J*03/29/2013 94.8J* <3.10J* <3.10J* <3.10J*08/20/2012 66.4J* <3.10J* <3.10J* <3.10J*05/25/2012 58.5J* <3.10J*04/30/2012 56.8J* <3.10J* <3.10J* <3.10J*12/13/2011 49.2J* <3.10J* <3.10J* <3.10J*06/13/2011 46.0J* <0.790J*03/08/2010 33.3
0620
0610
0615
0617
0618
17 of 302/9/2015P:\Mpls\02 AK\01\02011001\WorkFiles\POE Treatment Support\AWS Annual Report-2014\Tables\Table 3_POE Sample Table_02022015.xlsx

Table 3POE Treatment Systems Analytical Data Summary
Alternative Water Solutions Program - 2014 Annual ReportNorth Pole, Alaska
C C1 D D1 D2 1-C 1-C1 1-C2 2-C 2-C1 2-C2 3-C 3-C1 3-C2 1-D 2-D 3-DDUP DUP
PW-ID Sample DateDuplicates
A C2Sample Port
Sulfolane (µg/l)10/20/2014 7.40J <2.40 <2.40 <2.40 <2.4008/22/2014 7.90J 8.00J <2.40 <2.40 <2.4007/01/2014 7.20J 7.20J <2.40 <2.40 <2.4004/18/2014 <2.00 <2.00 <2.00 <2.0002/04/2014 <3.00 <3.00 <3.00 <3.00 <3.00J*11/25/2013 6.80J 6.60J <3.10 <3.10 <3.1009/23/2013 7.90J 8.30J <3.10 <3.10 <3.1007/15/2013 8.20J* <3.10J* <3.10J* <3.10J*04/29/2013 6.30J* <3.10J* <3.10J* <3.10J*01/08/2013 <3.10J* <3.10J* <3.10 <3.10J*11/16/2012 8.80J* <3.10J* <3.10J* <3.10J*09/04/2012 11.2J* <3.10J* <3.10J* <3.10J*06/07/2012 9.60J* <3.10J* <3.10J* <3.10J*02/20/2012 6.40J* <3.10J* <3.10J* <3.10J*10/13/2011 9.40J* <3.10J*08/19/2011 11.401/14/2010 <10.6J*01/04/2010 <10.511/18/2014 38.1 <2.40 <2.40 <2.40 <2.4004/22/2014 26.1 23.7 <2.00 <2.00 <2.0007/08/2013 31.3J* <3.10J* <3.10J* <3.10J*09/28/2012 35.7J* <3.10J* <3.10J* <3.10J*05/16/2012 32.6J* <3.10J*04/27/2012 35.1J* <3.10J* <3.10J* <3.10J*10/25/2011 28.9J* <3.10J* <3.10J*05/05/2011 29.0J* <5.00J*03/05/2010 16.203/28/2014 23.0 <2.0012/14/2012 32.5J* <3.10J* <3.10J* <3.10J*10/27/2011 <3.10 <3.1005/10/2011 23.0J* <5.00J*03/06/2010 20.110/14/2014 147 146 <2.40 <2.40 <2.4006/03/2014 186 <2.40 <2.40 <2.4008/12/2013 153J* <3.10J* <3.10J* <3.10J*11/26/2012 198J* <3.10J* <3.10J* <3.10J*04/24/2012 181J* <3.10J* <3.10J* <3.10J*10/11/2011 158J* <3.10J*04/26/2011 190J* <5.00J*04/21/2011 180J* <5.00J*12/17/2009 153JL* 139JL*05/16/2014 24.6 31.7 <2.00 <2.00 <2.0008/19/2013 65.0J* <3.10J* <3.10J* <3.10J*12/19/2012 87.2JH* <3.10J* <3.10J* <3.10J*05/29/2012 87.6J* <3.10J* <3.10J* <3.10J*01/27/2012 81.5J* <3.10J* <3.10J* <3.10J*05/03/2011 84.0J* <5.00J*02/13/2010 49.9
0622
0624
0625
0636
0646
18 of 302/9/2015P:\Mpls\02 AK\01\02011001\WorkFiles\POE Treatment Support\AWS Annual Report-2014\Tables\Table 3_POE Sample Table_02022015.xlsx

Table 3POE Treatment Systems Analytical Data Summary
Alternative Water Solutions Program - 2014 Annual ReportNorth Pole, Alaska
C C1 D D1 D2 1-C 1-C1 1-C2 2-C 2-C1 2-C2 3-C 3-C1 3-C2 1-D 2-D 3-DDUP DUP
PW-ID Sample DateDuplicates
A C2Sample Port
Sulfolane (µg/l)09/08/2014 92.3 <2.40 <2.40 <2.4004/04/2014 62.2 69.7 <2.00 <2.00 <2.0011/12/2013 60.4 61.0 <3.10 <3.10 <3.1007/15/2013 <3.10J*06/21/2013 53.9J* <3.10J* 22.4J* <3.10J*02/01/2013 43.8J* <3.10J*08/06/2012 43.1J* <3.10J* <3.10J* <3.10J*12/07/2011 35.7J* <3.10J* <3.10J* <3.10J*05/12/2011 28.1J* <5.00J*02/07/2010 22.409/05/2014 <2.40 <2.4006/30/2014 116 114 <10.0 3.70J <10.011/22/2013 87.3 <3.10 3.30J <3.1004/19/2013 87.4J* <3.10J* <3.10J* <3.10J*12/11/2012 97.6J* <3.10J* <3.10J* <3.10J*08/29/2012 93.9J* <3.10J* <3.10J* <3.10J*04/24/2012 76.7J* <3.10J* <3.10J* <3.10J*12/08/2011 62.7J* <3.10J* <3.10J* <3.10J*07/12/2011 63.7J* <0.790J*02/09/2010 42.409/11/2014 55.6 <2.40 <2.40 <2.4011/11/2013 42.6 41.9 <3.10 <3.10 <3.1001/21/2013 31.4J* <3.10J* <3.10J* <3.10J*03/14/2012 30.5J* <3.10J* <3.10J* <3.10J*08/11/2011 23.4J* <3.10J*03/12/2011 11.802/07/2010 <10.906/17/2014 107 106 3.70J <2.40 <2.4006/10/2013 52.1J* <3.10J* <3.10J* <3.10J*11/15/2011 68.4J* <3.10J*01/14/2010 36.9JL*08/22/2014 103 106 <2.40 <2.40 <2.4012/16/2013 87.0 <3.1001/16/2010 33.8 33.911/11/2013 97.8 <3.10 <3.10 <3.1011/28/2011 82.5J* <3.10J*02/07/2010 47.009/12/2014 100 <2.40 <2.40 <2.4006/13/2014 99.1JH* 102 <2.40 <2.40 <2.4003/04/2014 86.7 <3.00 <3.00 <3.0012/09/2013 73.9 <3.10 <3.10 <3.1010/18/2013 72.5 74.6 <3.10 <3.10 <3.1007/15/2013 81.2J* <3.10J* <3.10J* <3.10J*04/19/2013 81.1J* <3.10J* <3.10J* <3.10J*01/02/2013 70.0J* <3.10J* <3.10J* <3.10J*10/12/2012 73.8J* <3.10J* <3.10J* <3.10J*07/09/2012 74.8J* <3.10J* <3.10J* <3.10J*02/17/2012 56.0J* <3.10J*11/22/2009 39.4
0651
0653
0656
0657
0647
0648
0649
19 of 302/9/2015P:\Mpls\02 AK\01\02011001\WorkFiles\POE Treatment Support\AWS Annual Report-2014\Tables\Table 3_POE Sample Table_02022015.xlsx
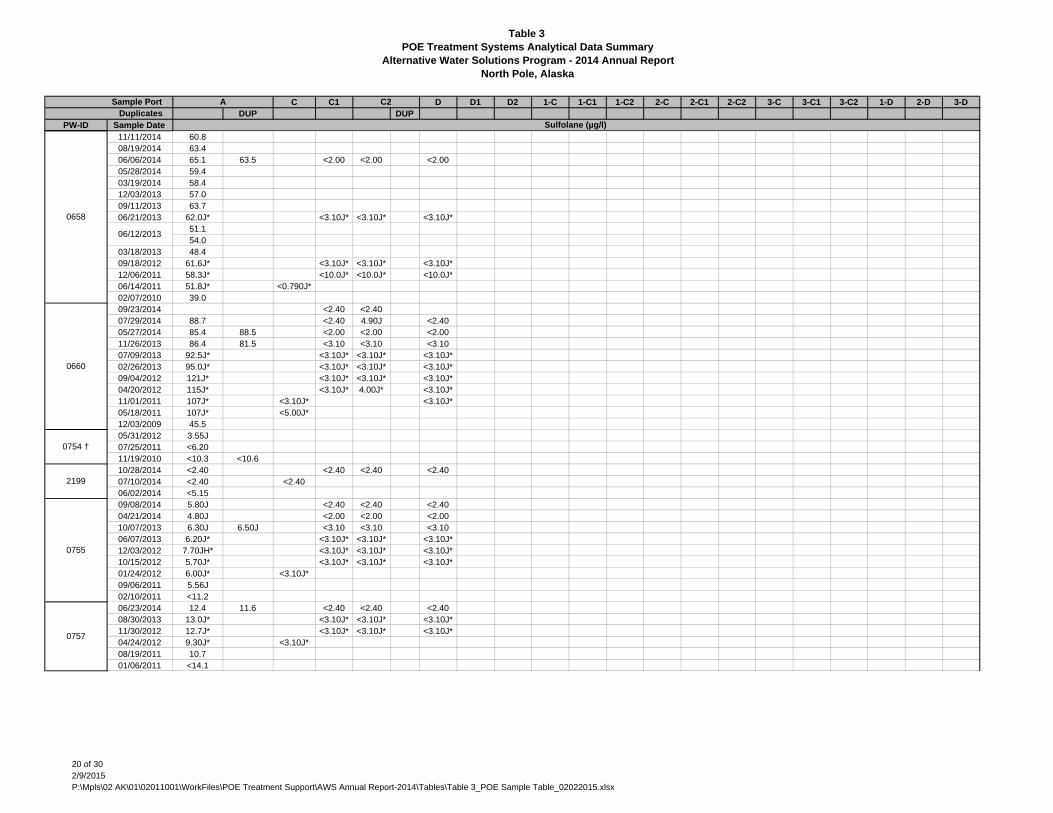
Table 3POE Treatment Systems Analytical Data Summary
Alternative Water Solutions Program - 2014 Annual ReportNorth Pole, Alaska
C C1 D D1 D2 1-C 1-C1 1-C2 2-C 2-C1 2-C2 3-C 3-C1 3-C2 1-D 2-D 3-DDUP DUP
PW-ID Sample DateDuplicates
A C2Sample Port
Sulfolane (µg/l)11/11/2014 60.808/19/2014 63.406/06/2014 65.1 63.5 <2.00 <2.00 <2.0005/28/2014 59.403/19/2014 58.412/03/2013 57.009/11/2013 63.706/21/2013 62.0J* <3.10J* <3.10J* <3.10J*
51.154.0
03/18/2013 48.409/18/2012 61.6J* <3.10J* <3.10J* <3.10J*12/06/2011 58.3J* <10.0J* <10.0J* <10.0J*06/14/2011 51.8J* <0.790J*02/07/2010 39.009/23/2014 <2.40 <2.4007/29/2014 88.7 <2.40 4.90J <2.4005/27/2014 85.4 88.5 <2.00 <2.00 <2.0011/26/2013 86.4 81.5 <3.10 <3.10 <3.1007/09/2013 92.5J* <3.10J* <3.10J* <3.10J*02/26/2013 95.0J* <3.10J* <3.10J* <3.10J*09/04/2012 121J* <3.10J* <3.10J* <3.10J*04/20/2012 115J* <3.10J* 4.00J* <3.10J*11/01/2011 107J* <3.10J* <3.10J*05/18/2011 107J* <5.00J*12/03/2009 45.505/31/2012 3.55J07/25/2011 <6.2011/19/2010 <10.3 <10.610/28/2014 <2.40 <2.40 <2.40 <2.4007/10/2014 <2.40 <2.4006/02/2014 <5.1509/08/2014 5.80J <2.40 <2.40 <2.4004/21/2014 4.80J <2.00 <2.00 <2.0010/07/2013 6.30J 6.50J <3.10 <3.10 <3.1006/07/2013 6.20J* <3.10J* <3.10J* <3.10J*12/03/2012 7.70JH* <3.10J* <3.10J* <3.10J*10/15/2012 5.70J* <3.10J* <3.10J* <3.10J*01/24/2012 6.00J* <3.10J*09/06/2011 5.56J02/10/2011 <11.206/23/2014 12.4 11.6 <2.40 <2.40 <2.4008/30/2013 13.0J* <3.10J* <3.10J* <3.10J*11/30/2012 12.7J* <3.10J* <3.10J* <3.10J*04/24/2012 9.30J* <3.10J*08/19/2011 10.701/06/2011 <14.1
0754 †
2199
0755
0757
0658
06/12/2013
0660
20 of 302/9/2015P:\Mpls\02 AK\01\02011001\WorkFiles\POE Treatment Support\AWS Annual Report-2014\Tables\Table 3_POE Sample Table_02022015.xlsx

Table 3POE Treatment Systems Analytical Data Summary
Alternative Water Solutions Program - 2014 Annual ReportNorth Pole, Alaska
C C1 D D1 D2 1-C 1-C1 1-C2 2-C 2-C1 2-C2 3-C 3-C1 3-C2 1-D 2-D 3-DDUP DUP
PW-ID Sample DateDuplicates
A C2Sample Port
Sulfolane (µg/l)07/08/2014 21.3 17.7 <2.40 <2.40 <2.4012/03/2013 15.7 14.7 <3.10 <3.10 <3.1004/19/2013 17.4J* <3.10J* <3.10J* <3.10J*07/24/2012 17.0J* <3.10J* <3.10J* <3.10J*12/07/2011 13.8J* <3.10J* <3.10J* <3.10J*06/24/2011 13.6J* <0.790J*01/06/2011 11.606/10/2014 3.20J <2.40 <2.40 <2.40 <2.4002/06/2014 6.40J 7.80J <3.00 <3.00 <3.0008/27/2013 5.00J* <3.10J* <3.10J* <3.10J*10/23/2012 3.20J* <3.10J* <3.10J* <3.10J*12/07/2011 3.40J* <3.10J*09/03/2011 3.92J10/30/2010 <10.809/26/2014 20.9 <2.40 <2.40 <2.4004/14/2014 20.0 <2.00 <2.00 <2.0002/07/2014 21.3 <3.00 <3.00 <3.0010/15/2013 15.3 16.3 <3.10 <3.10 <3.1006/18/2013 17.2J* <3.10J* <3.10J* <3.10J*01/28/2013 15.2J* <3.10J* <3.10J* <3.10J*11/02/2012 16.3J* <3.10J* <3.10J* <3.10J*07/20/2012 16.5J* <3.10J* <3.10J* <3.10J*03/13/2012 15.0J* <3.10J* <3.10J* <3.10J*11/09/2011 13.6J*11/08/2011 14.0J* <3.10J*05/24/2011 15.7J* <5.00J*05/11/2011 11.8J*02/27/2010 14.407/07/2014 26.8 25.7 <2.40 <2.40 <2.4008/13/2013 20.0J* <3.10J* <3.10J* <3.10J*11/09/2012 21.5J* <3.10J* <3.10J* <3.10J*11/09/2011 20.3J* <3.10J*11/08/2011 <3.10J*04/15/2011 21.6J* <5.00J*02/26/2010 14.711/18/2014 14.209/23/2014 13.8 13.5 <2.40 <2.40 <2.4009/11/2014 12.705/29/2014 11.704/03/2014 9.30J 9.89J02/24/2014 10.1 10.2 <3.00 <3.00 <3.0011/26/2013 8.80J 9.00J09/16/2013 8.05J08/06/2013 5.80J* <3.10J* <3.10J* <3.10J*
5.04J6.80J
06/18/2013 7.00J* <3.10J* <3.10J* <3.10J*03/20/2013 5.09J12/26/2012 <3.10J* <3.10J* <3.10J* <3.10J*07/27/2012 4.60J* <3.10J*05/24/2012 <6.32 3.37J07/14/2011 <6.6602/25/2010 <10.0 <10.4
0773
0929
0931
093206/19/2013
0758
21 of 302/9/2015P:\Mpls\02 AK\01\02011001\WorkFiles\POE Treatment Support\AWS Annual Report-2014\Tables\Table 3_POE Sample Table_02022015.xlsx
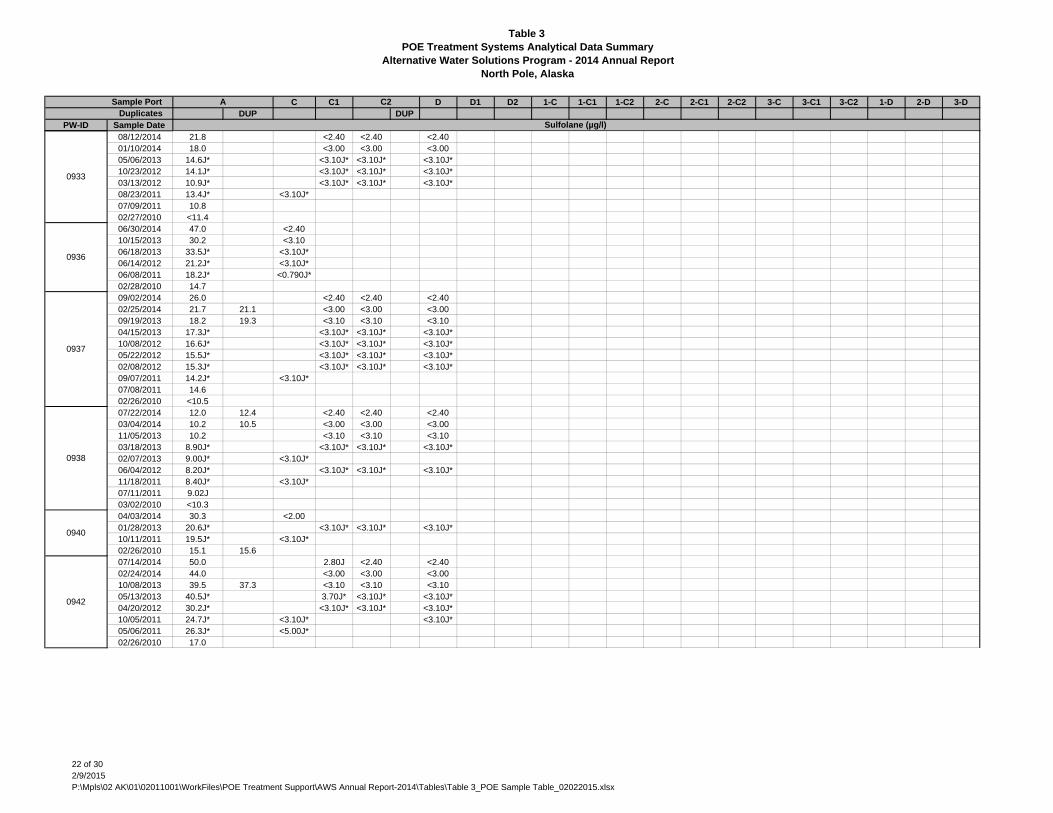
Table 3POE Treatment Systems Analytical Data Summary
Alternative Water Solutions Program - 2014 Annual ReportNorth Pole, Alaska
C C1 D D1 D2 1-C 1-C1 1-C2 2-C 2-C1 2-C2 3-C 3-C1 3-C2 1-D 2-D 3-DDUP DUP
PW-ID Sample DateDuplicates
A C2Sample Port
Sulfolane (µg/l)08/12/2014 21.8 <2.40 <2.40 <2.4001/10/2014 18.0 <3.00 <3.00 <3.0005/06/2013 14.6J* <3.10J* <3.10J* <3.10J*10/23/2012 14.1J* <3.10J* <3.10J* <3.10J*03/13/2012 10.9J* <3.10J* <3.10J* <3.10J*08/23/2011 13.4J* <3.10J*07/09/2011 10.802/27/2010 <11.406/30/2014 47.0 <2.4010/15/2013 30.2 <3.1006/18/2013 33.5J* <3.10J*06/14/2012 21.2J* <3.10J*06/08/2011 18.2J* <0.790J*02/28/2010 14.709/02/2014 26.0 <2.40 <2.40 <2.4002/25/2014 21.7 21.1 <3.00 <3.00 <3.0009/19/2013 18.2 19.3 <3.10 <3.10 <3.1004/15/2013 17.3J* <3.10J* <3.10J* <3.10J*10/08/2012 16.6J* <3.10J* <3.10J* <3.10J*05/22/2012 15.5J* <3.10J* <3.10J* <3.10J*02/08/2012 15.3J* <3.10J* <3.10J* <3.10J*09/07/2011 14.2J* <3.10J*07/08/2011 14.602/26/2010 <10.507/22/2014 12.0 12.4 <2.40 <2.40 <2.4003/04/2014 10.2 10.5 <3.00 <3.00 <3.0011/05/2013 10.2 <3.10 <3.10 <3.1003/18/2013 8.90J* <3.10J* <3.10J* <3.10J*02/07/2013 9.00J* <3.10J*06/04/2012 8.20J* <3.10J* <3.10J* <3.10J*11/18/2011 8.40J* <3.10J*07/11/2011 9.02J03/02/2010 <10.304/03/2014 30.3 <2.0001/28/2013 20.6J* <3.10J* <3.10J* <3.10J*10/11/2011 19.5J* <3.10J*02/26/2010 15.1 15.607/14/2014 50.0 2.80J <2.40 <2.4002/24/2014 44.0 <3.00 <3.00 <3.0010/08/2013 39.5 37.3 <3.10 <3.10 <3.1005/13/2013 40.5J* 3.70J* <3.10J* <3.10J*04/20/2012 30.2J* <3.10J* <3.10J* <3.10J*10/05/2011 24.7J* <3.10J* <3.10J*05/06/2011 26.3J* <5.00J*02/26/2010 17.0
0942
0933
0936
0937
0938
0940
22 of 302/9/2015P:\Mpls\02 AK\01\02011001\WorkFiles\POE Treatment Support\AWS Annual Report-2014\Tables\Table 3_POE Sample Table_02022015.xlsx

Table 3POE Treatment Systems Analytical Data Summary
Alternative Water Solutions Program - 2014 Annual ReportNorth Pole, Alaska
C C1 D D1 D2 1-C 1-C1 1-C2 2-C 2-C1 2-C2 3-C 3-C1 3-C2 1-D 2-D 3-DDUP DUP
PW-ID Sample DateDuplicates
A C2Sample Port
Sulfolane (µg/l)11/04/2014 40.608/19/2014 35.306/04/2014 33.905/13/2014 36.1 37.5 2.40J <2.00 <2.0003/03/2014 32.911/26/2013 29.610/12/2013 26.5 26.1 <3.10 <3.10 <3.1009/11/2013 30.3
25.8 25.624.4
04/19/2013 25.1J* <3.10J* <3.10J* <3.10J*03/12/2013 25.701/02/2013 23.8J* <3.10J* <3.10J* <3.10J*09/21/2012 25.0J* <3.10J* <3.10J* <3.10J*04/11/2012 21.4J* <3.10J*10/03/2011 21.403/07/2010 <10.011/17/2014 26.2 <2.40 <2.40 <2.4005/12/2014 19.5 19.7 <2.00 <2.00 <2.0012/13/2013 18.4 19.7 <3.10 <3.10 <3.1007/23/2013 18.4J* <3.10J* <3.10J* <3.10J*06/05/2013 15.8J* <3.10J* <3.10J* <3.10J*02/18/2013 14.3J* <3.10J* <3.10J* <3.10J*08/17/2012 19.7J* <3.10J* <3.10J* <3.10J*04/05/2012 15.5J* <3.10J* <3.10J* <3.10J*10/27/2011 17.8J* <3.10J*09/07/2011 18.403/05/2010 <10.508/04/2014 15.4 15.9 <2.40 <2.40 <2.4006/17/2014 14.3 <2.40 <2.40 <2.4011/22/2013 9.60J 10.1 <3.10 <3.10 <3.1010/19/2012 9.40J* <3.10J* <3.10J* <3.10J*10/21/2011 8.70J* <3.10J*07/25/2011 7.01J02/26/2010 <10.610/04/2014 30.8 29.0 <2.40 <2.40 <2.4009/21/2013 22.3 24.0 <3.10 <3.10 <3.10J*12/10/2011 17.5J* <3.10J* <3.10J* <3.10J*06/20/2011 18.7J* <0.790J*03/19/2010 18.304/21/2014 13.4 11.3 <2.00 <2.00 <2.0009/17/2013 11.0 12.1 <3.10 <3.10 <3.1001/25/2013 10.2J* <3.10J* <3.10J* <3.10J*06/12/2012 10.4J* <3.10J* <3.10J* <3.10J*10/05/2011 9.90J* <3.10J*05/26/2011 9.08J02/11/2010 <10.409/22/2014 14.2 14.3 <2.40 <2.40 <2.4009/17/2013 11.2 <3.10 <3.10 <3.1010/19/2011 9.00J* <3.10J*05/26/2011 9.44J02/11/2010 <10.0
0946
0947
0948
094306/06/2013
0944
0945
23 of 302/9/2015P:\Mpls\02 AK\01\02011001\WorkFiles\POE Treatment Support\AWS Annual Report-2014\Tables\Table 3_POE Sample Table_02022015.xlsx

Table 3POE Treatment Systems Analytical Data Summary
Alternative Water Solutions Program - 2014 Annual ReportNorth Pole, Alaska
C C1 D D1 D2 1-C 1-C1 1-C2 2-C 2-C1 2-C2 3-C 3-C1 3-C2 1-D 2-D 3-DDUP DUP
PW-ID Sample DateDuplicates
A C2Sample Port
Sulfolane (µg/l)05/27/2014 64.4 65.6 <2.00 <2.00 <2.0011/11/2013 72.5 71.0 <3.10 <3.10 <3.1006/24/2013 101J* <3.10J* <3.10J* <3.10J*01/22/2013 86.8J* <3.10J* <3.10J* <3.10J*09/10/2012 125J* <3.10J* <3.10J* <3.10J*04/20/2012 145J* <3.10J* <3.10J* <3.10J*12/09/2011 146J* <3.10J* <3.10J* <3.10J*07/12/2011 164J* <0.790J*02/07/2010 15709/26/2014 7.40J 7.80J <2.40 <2.40 <2.4005/19/2014 9.40J 9.30J <2.00 <2.00 <2.0011/12/2013 9.10J 9.80J <3.10 <3.10 <3.1007/09/2013 10.9J* <3.10J* <3.10J* <3.10J*01/07/2013 12.1J* <3.10J* <3.10J* <3.10J*07/11/2012 14.2J* <3.10J* <3.10J* <3.10J*12/02/2011 14.2J* <3.10J* <3.10J* <3.10J*06/15/2011 15.0J* <0.790J*03/11/2010 16.707/28/2014 4.10J <2.40 <2.40 <2.4008/12/2013 <3.10J* <3.10J* <3.10J* <3.10J*11/01/2011 4.80J* <3.10J*07/08/2011 4.06J02/26/2010 <10.406/20/2014 <2.40 <2.4005/13/2014 97.3 <2.00 2.10J <2.0010/07/2013 85.7 88.8 <3.10 <3.10 <3.1004/02/2013 92.5J* <3.10J* <3.10J* <3.10J*10/05/2012 89.0J* 6.20J* <3.10J* <3.10J*02/17/2012 83.6J* 5.10J* <3.10J* <3.10J*08/09/2011 87.6J* <3.10J*03/06/2010 46.809/29/2014 201 204 <2.40 <2.40 <2.4005/15/2014 282 <2.00 <2.00 <2.0009/30/2013 288 <3.10 <3.10 <3.1005/21/2013 346J* <3.10J* <3.10J* <3.10J*11/27/2012 463J* <3.10J* <3.10J* <3.10J*07/11/2012 421J* <3.10J* <3.10J* <3.10J*07/21/2011 402J* <3.10J*01/04/2010 11707/29/2013 296J* <3.10J* <3.10J* <3.10J*12/15/2011 348J* <3.10J* <3.10J* <3.10J*07/20/2011 440J* <3.10J*06/06/2011 32707/11/2014 245 <2.40 <2.40 <2.4012/20/2013 278 273 <3.00 <3.00 <3.0005/20/2013 353J* <3.10J* <3.10J* <3.10J*11/02/2012 358J* <3.10J*01/07/2010 87.0 98.9
0997 §
1086
1095
1096
1097
0988
0996
24 of 302/9/2015P:\Mpls\02 AK\01\02011001\WorkFiles\POE Treatment Support\AWS Annual Report-2014\Tables\Table 3_POE Sample Table_02022015.xlsx

Table 3POE Treatment Systems Analytical Data Summary
Alternative Water Solutions Program - 2014 Annual ReportNorth Pole, Alaska
C C1 D D1 D2 1-C 1-C1 1-C2 2-C 2-C1 2-C2 3-C 3-C1 3-C2 1-D 2-D 3-DDUP DUP
PW-ID Sample DateDuplicates
A C2Sample Port
Sulfolane (µg/l)11/18/2014 91.5 89.808/26/2014 101 <2.40 <2.40 <2.4008/18/2014 94.406/02/2014 96.803/24/2014 94.903/03/2014 99.5 <3.00 <3.00 <3.0012/02/2013 11309/26/2013 97.2 10409/24/2013 91.5 89.6 <3.10 <3.10 <3.10
97.4103
03/12/2013 107 10503/01/2013 98.9J* <3.10J* <3.10J* <3.10J*09/10/2012 96.8J* <3.10J*05/15/2014 196 210 <2.00 <2.00 <2.0009/06/2013 238J* <3.10J* <3.10J* <3.10J*02/04/2013 267J* <3.10J* <3.10J* <3.10J*08/23/2012 313J* <3.10J*05/24/2010 18506/30/2014 25.9 24.9 <2.40 <2.40 <2.4008/26/2013 16.7J* <3.10J* <3.10J* <3.10J*05/01/2013 <3.10J* <3.10J* <3.10J* <3.10J*10/15/2012 16.1J* <3.10J* <3.10J* <3.10J*05/02/2012 13.2J* <3.10J*09/02/2011 15.102/27/2010 <11.4 <10.006/23/2014 44.1 3.50J <2.40 <2.4001/10/2014 40.1 41.3 <3.00 <3.00 <3.0008/26/2013 30.3J* <3.10J* <3.10J* <3.10J*04/09/2013 26.0J* <3.10J* <3.10J* <3.10J*08/07/2012 28.8J* <3.10J*11/10/2014 63.9 <2.40 <2.40 <2.4011/25/2013 52.7 49.5 <3.10 <3.10 <3.1005/08/2012 40.9J* <3.10J*02/27/2010 27.309/08/2014 7.40J 7.10J <2.40 <2.40 <2.4011/12/2013 7.90J <3.10 <3.10 <3.1008/01/2013 6.10J* <3.10J* <3.10J* <3.10J*05/10/2013 7.90J* <3.10J* <3.10J* <3.10J*11/14/2012 6.20J* <3.10J* <3.10J* <3.10J*05/11/2012 7.30J* <3.10J*09/02/2011 6.72J03/27/2010 <10.306/16/2014 9.20J <2.40 <2.40 <2.4001/06/2014 10.4 <3.0002/24/2010 10.608/26/2014 22.0 21.4 <2.40 <2.40 <2.4006/16/2014 26.5 25.0 <2.40 <2.40 <2.4002/28/2014 27.1 <3.00 <3.00 <3.0012/20/2013 24.3 <3.1008/24/2011 13.402/24/2010 <10.4
1104
1105
1106 §
1107 §
1099
06/04/2013
1100
1101
1103
25 of 302/9/2015P:\Mpls\02 AK\01\02011001\WorkFiles\POE Treatment Support\AWS Annual Report-2014\Tables\Table 3_POE Sample Table_02022015.xlsx

Table 3POE Treatment Systems Analytical Data Summary
Alternative Water Solutions Program - 2014 Annual ReportNorth Pole, Alaska
C C1 D D1 D2 1-C 1-C1 1-C2 2-C 2-C1 2-C2 3-C 3-C1 3-C2 1-D 2-D 3-DDUP DUP
PW-ID Sample DateDuplicates
A C2Sample Port
Sulfolane (µg/l)11/11/2014 58.7 <2.40 <2.40 <2.4008/15/2014 63.8 63.3 <2.40 <2.40 <2.4004/21/2014 54.4 <2.00 <2.00 <2.0001/22/2014 59.1 <3.0002/25/2010 19.311/25/2014 22.609/16/2014 28.9 26.8 <2.40 <2.40 <2.4008/21/2014 25.706/03/2014 25.503/18/2014 28.212/17/2013 27.309/09/2013 26.208/09/2013 23.2J* <3.10J* <3.10J* <3.10J*
25.626.5
03/13/2013 24.606/01/2012 20.6J* <3.10J*08/29/2011 18.302/27/2010 <11.409/05/2014 5.70J 5.20J <2.40 <2.40 <2.4008/19/2013 4.70J* <3.10J* <3.10J* <3.10J*08/15/2012 5.20J* <3.10J*01/27/2012 4.31J
1111 ‡ 08/23/2012 28.9 25.707/18/2014 51.7 4.70J <2.40 <2.4002/10/2014 50.0JL* 49.4JL* <3.00J* <3.00J* <3.00J*09/16/2013 42.4 40.6 <3.10 <3.10 <3.1003/05/2013 39.4J* <3.10J* <3.10J* <3.10J*08/07/2012 40.1J* <3.10J* <3.10J* <3.10J*12/01/2011 35.4J* <3.10J* <3.10J* <3.10J*07/27/2011 40.7J* <3.10J*02/25/2010 22.211/14/2014 30.8 <2.40 <2.40 <2.40 <2.4006/17/2014 33.4 27.1 <2.40 <2.40 <2.4012/16/2013 26.5 <3.10 <3.10 <3.1004/08/2013 27.3J* <3.10J* <3.10J* <3.10J*06/12/2012 26.1J* <3.10J*06/21/2010 20.8 23.206/30/2014 12.3 <2.40 <2.40 <2.4004/15/2014 9.90J <2.00 <2.00 <2.0001/31/2014 10.5 <3.00 <3.00 <3.0003/12/2013 12.0J* <3.10J* <3.10J* <3.10J*11/13/2012 7.40J* <3.10J* <3.10J* <3.10J*08/07/2012 8.20J* <3.10J* <3.10J* <3.10J*04/13/2012 8.70J* <3.10J* <3.10J* <3.10J*09/28/2011 7.80J* <3.10J*07/08/2011 8.63J03/09/2010 <10.0
1118
1109
06/05/2013
1110
1114
1116
1108 §
26 of 302/9/2015P:\Mpls\02 AK\01\02011001\WorkFiles\POE Treatment Support\AWS Annual Report-2014\Tables\Table 3_POE Sample Table_02022015.xlsx

Table 3POE Treatment Systems Analytical Data Summary
Alternative Water Solutions Program - 2014 Annual ReportNorth Pole, Alaska
C C1 D D1 D2 1-C 1-C1 1-C2 2-C 2-C1 2-C2 3-C 3-C1 3-C2 1-D 2-D 3-DDUP DUP
PW-ID Sample DateDuplicates
A C2Sample Port
Sulfolane (µg/l)11/18/2014 <2.4011/04/2014 16911/03/2014 174 <2.40 2.50J <2.40 <2.40 <2.40 <2.40
193 <2.40 <2.40 <2.40<2.40
08/18/2014 18005/28/2014 18104/11/2014 190 190 2.90J <2.00 8.70J <2.00 <2.00 <2.0003/10/2014 17303/07/2014 184 <3.00 3.60J <3.00 <3.0012/13/2013 156 <3.10 <3.10 <3.10 <3.1011/25/2013 17309/11/2013 17209/02/2013 144JL* <3.10J* <3.10J* <3.10J* <3.10J*06/10/2013 163J* <3.10J* <3.10J* <3.10J* <3.10J*
166159
04/26/2013 155J* <3.10J* <3.10J* <3.10J* <3.10J* <3.10J* <3.10J*03/18/2013 16203/01/2013 143J* <3.10J* <3.10J* <3.10J* <3.10J*09/12/2012 151J* <10.0J* <10.0J* <10.0J* <10.0J*07/10/2012 146J* <3.10J* <3.10J* <3.10J* <3.10J* <3.10J* <3.10J*04/09/2012 143J* <3.10J* <3.10J* <3.10J* <3.10J*10/20/2011 118J* <3.10J* <3.10J*02/13/2010 55.410/31/2014 15.1 <2.40 <2.40 <2.40 <2.4009/08/2014 16.0 16.6 <2.40 <2.40 <2.4007/21/2014 15.6 15.9 <2.40 <2.40 <2.4005/13/2014 15.1 15.1 <2.00 <2.00 <2.0002/04/2014 18.3 <3.00 <3.00 <3.0009/20/2013 13.3 <3.10 <3.10 <3.1007/16/2013 10.9J* <3.10J* <3.10J* <3.10J*04/19/2013 7.60J* <3.10J* <3.10J* <3.10J*02/05/2013 13.0J* <3.10J* <3.10J* <3.10J*12/04/2012 20.8JH* <3.10J* <3.10J* <3.10J*08/20/2012 15.9J* <3.10J* <3.10J* <3.10J*04/13/2012 15.2J* <3.10J* <3.10J* <3.10J*12/14/2011 15.7J* <3.10J*08/31/2011 16.305/10/2010 <10.504/18/2010 <10.0J*04/07/2014 8.50J <2.00 <2.00 <2.0011/08/2013 <3.10 <3.1009/16/2013 6.60J 6.60J <3.10 <3.10 <3.1001/30/2013 6.20J* <3.10J* <3.10J* <3.10J*06/26/2012 7.10J* <3.10J* <3.10J* <3.10J*10/27/2011 6.00J* <3.10J*08/29/2011 5.92J04/15/2010 <10.0
1190
1155 §
08/25/2014
06/05/2013
1186 §
27 of 302/9/2015P:\Mpls\02 AK\01\02011001\WorkFiles\POE Treatment Support\AWS Annual Report-2014\Tables\Table 3_POE Sample Table_02022015.xlsx

Table 3POE Treatment Systems Analytical Data Summary
Alternative Water Solutions Program - 2014 Annual ReportNorth Pole, Alaska
C C1 D D1 D2 1-C 1-C1 1-C2 2-C 2-C1 2-C2 3-C 3-C1 3-C2 1-D 2-D 3-DDUP DUP
PW-ID Sample DateDuplicates
A C2Sample Port
Sulfolane (µg/l)07/28/2014 3.90J 4.10J <2.40 <2.40 <2.4002/10/2014 <3.00J* <3.00J* <3.00J* <3.00J* <3.00J*08/27/2013 4.60J* <3.10J* <3.10J* <3.10J*02/28/2013 <3.10J* <3.10J* <3.10J* <3.10J*07/17/2012 6.50J* <3.10J*08/29/2011 5.47J04/13/2010 <10.010/27/2014 162 <2.40 <2.40 <2.40 <2.4012/09/2013 162 174 <3.10 <3.10 <3.1007/02/2013 168J* <3.10J* <3.10J* <3.10J*12/07/2012 188J* <3.10J* <3.10J* <3.10J*05/04/2012 141J* <3.10J* <3.10J* <3.10J*11/07/2011 119J* <3.10J* <3.10J*05/12/2011 94.8J* <5.00J*04/19/2011 101JL* <5.00J*03/09/2010 69.710/21/2014 191 <2.40 <2.40 <2.40 <2.4008/08/2014 157 157 <2.40 <2.40 <2.4003/10/2014 164 <3.00 <3.00 <3.0011/08/2013 169 174 <3.10 <3.10 <3.1007/15/2013 147J* <3.10J* <3.10J* <3.10J*04/01/2013 189J* <3.10J* <3.10J* <3.10J*11/23/2012 <3.1011/09/2012 78.0J* <3.10J* 63.0J* <3.10J*07/18/2012 129J* <3.10J* <3.10J* <3.10J*02/28/2012 118J* <3.10J* <3.10J* <3.10J*09/15/2011 49.8J* <3.10J* <3.10J*04/05/2011 110 <5.0003/06/2010 72.005/21/2014 140 143 <2.00 <2.00 <2.0005/20/2013 118J* <3.10J* <3.10J* <3.10J*12/17/2012 120J* 8.60J* <3.10J* <3.10J*06/28/2012 107J* <3.10J* <3.10J* <3.10J*01/23/2012 96.1J* <3.10J* <3.10J* <3.10J*09/14/2011 66.8J* <3.10J* <3.10J*05/18/2011 76.3J* <5.00J*03/04/2010 51.010/17/2014 124 <2.40 <2.40 <2.40 <2.4002/11/2014 105 <3.00 <3.00 <3.0005/10/2013 92.1J* <3.10J* <3.10J* <3.10J*06/26/2012 83.6J* <3.10J* <3.10J* <3.10J*01/23/2012 79.7J* <3.10J* <3.10J* <3.10J*09/22/2011 63.8J* <3.10J*05/18/2011 60.7J* <5.00J*03/06/2010 42.702/18/2013 20.6J* <3.10J* <3.10J* <3.10J*09/28/2012 22.6J* <3.10J* <3.10J* <3.10J*04/19/2012 22.7J* <3.10J* <3.10J* <3.10J*11/09/2011 22.1J* <3.10J*09/07/2011 23.904/18/2010 <10.0J*
1375
1394
1276
1314
1315
1374
28 of 302/9/2015P:\Mpls\02 AK\01\02011001\WorkFiles\POE Treatment Support\AWS Annual Report-2014\Tables\Table 3_POE Sample Table_02022015.xlsx

Table 3POE Treatment Systems Analytical Data Summary
Alternative Water Solutions Program - 2014 Annual ReportNorth Pole, Alaska
C C1 D D1 D2 1-C 1-C1 1-C2 2-C 2-C1 2-C2 3-C 3-C1 3-C2 1-D 2-D 3-DDUP DUP
PW-ID Sample DateDuplicates
A C2Sample Port
Sulfolane (µg/l)09/19/2014 28.4 <2.40 <2.40 <2.40 <2.4005/21/2014 25.8 <2.00 <2.00 <2.00 <2.00 <2.00 <2.0002/14/2014 26.3 27.0 <3.00 <3.00 <3.00 <3.00 <3.00 <3.0012/13/2013 24.2 <3.10 <3.10 <3.10 <3.1009/03/2013 28.0JL* <3.10J* <3.10J* <3.10J* <3.10J*06/10/2013 24.0J* <3.10J* <3.10J* <3.10J* <3.10J*05/14/2013 25.7J* <3.10J* <3.10J* <3.10J* <3.10J* <3.10J* <3.10J*03/15/2013 29.4J* <3.10J* <3.10J*05/10/2010 20.004/09/2010 <10.607/25/2014 <2.40 <2.40 <2.40 <2.40 <2.4011/05/2013 <3.10 <3.10 <3.10 <3.10 <3.1003/05/2013 <3.10J* <3.10J* <3.10J* <3.10J*07/13/2012 <3.10J* <3.10J* <3.10J* <3.10J*06/29/2011 <0.790J* <0.790J*11/14/2009 3.26J 4.00J09/15/2014 <2.40 <2.40 <2.40 <2.40 <2.4011/25/2013 <3.10 <3.10 <3.10 <3.1003/12/2013 <3.10J* <3.10J* <3.10J* <3.10J*05/22/2012 <3.10J* <3.10J* <3.10J* <3.10J*09/07/2011 3.50J* <3.10J*07/26/2011 3.44J02/27/2010 <10.501/14/2014 <3.00 <3.00 <3.00 <3.0008/05/2013 <3.10J* <3.10J* <3.10J* <3.10J*10/19/2012 <3.10J* <3.10J* <3.10J* <3.10J*12/27/2011 <3.10J* <3.10J* <3.10J* <3.10J*06/28/2011 <0.790J* <0.790J*11/13/2009 9.04J06/10/2014 <2.40 <2.40 <2.40 2.40J*08/16/2013 <3.10J* <3.10J* <3.10J* <3.10J*10/16/2012 <3.10J* <3.10J* <3.10J* <3.10J*11/18/2011 <3.10J* <3.10J* <3.10J*05/25/2011 <5.00J* <5.00J*11/14/2009 4.46J08/29/2014 30.1 30.3 <2.40 <2.40 <2.4001/13/2014 28.6 28.6 <3.00 <3.00 <3.0004/02/2013 27.3J* <3.10J* <3.10J* <3.10J*03/20/2012 27.9J* <3.10J*02/12/2010 26.806/09/2014 15.9 <2.40 <2.40 <2.4001/21/2014 15.3 <3.00 <3.00 <3.0009/03/2013 13.5JL* <3.10J* <3.10J* <3.10J*04/23/2013 11.6J* <3.10J* <3.10J* <3.10J*12/26/2012 9.50J* <3.10J* <3.10J* <3.10J*09/05/2012 14.0J* <3.10J* <3.10J* <3.10J*05/21/2012 11.6J* <3.10J*04/30/2012 11.8J* <3.10J* <3.10J* <3.10J*01/31/2012 11.2J* <3.10J* <3.10J* <3.10J*10/04/2011 12.5J* <3.10J*08/23/2011 12.404/17/2010 <10.0
1407
1408
1435
1436
1395 §
1404
1406
29 of 302/9/2015P:\Mpls\02 AK\01\02011001\WorkFiles\POE Treatment Support\AWS Annual Report-2014\Tables\Table 3_POE Sample Table_02022015.xlsx

Table 3POE Treatment Systems Analytical Data Summary
Alternative Water Solutions Program - 2014 Annual ReportNorth Pole, Alaska
C C1 D D1 D2 1-C 1-C1 1-C2 2-C 2-C1 2-C2 3-C 3-C1 3-C2 1-D 2-D 3-DDUP DUP
PW-ID Sample DateDuplicates
A C2Sample Port
Sulfolane (µg/l)09/02/2014 22.6 <2.4006/26/2012 11.9J* <3.10J* <3.10J* <3.10J*11/14/2011 10.3J* <3.10J*08/29/2011 10.904/16/2010 <10.905/22/2014 18.0 <2.0006/28/2013 15.7 15.7
Notes: PW-ID Private-well identification number.§ Commercial location† System has been deactivated and moved to treating the new well for this location‡ System has been installed but has not been activated due to vacant structure
FlagsJ Estimated concentration; sulfolane was detected below the laboratory limit of quanitation (LOQ) and above the detection limit (DL). Flag applied by laboratory.J* Estimated concentration. Flag applied by Shannon & Wilson, Inc. due to quality control failures and/or lack of field duplicates (for older data).JL* Estimated concentration, biased low. Flag applied by Shannon & Wilson, Inc. due to quality control failures.JH* Estimated concentration, biased high. Flag applied by Shannon & Wilson, Inc. due to quality control failures.X* Sample switch suspected; however, not confirmed due to inability to confirm original results.< Sample not detected above concentration listed.
Sample PortsA Influent water directly from private-wellC Post primary treatment sample port (after two tanks on a duplex system or one tank on a simplex system); these samples are typically collected at system startup.C1 Sample collected from sample port "C" prior to a carbon tank change out.C2 Sample collected from sample port "C" after a carbon tank change out.D Post redundant treatment sample portD1 Sample collected from sample port "D" prior to a redundant tank change out.D2 Sample collected from sample port "D" after a redundant tank change out.1-X Unit 1 sample, where "X" indicates sample port; some locations may run several treatment units in parallel.2-X Unit 2 sample, where "X" indicates sample port; some locations may run several treatment units in parallel.3-X Unit 3 sample, where "X" indicates sample port; some locations may run several treatment units in parallel.
1437
1459
30 of 302/9/2015P:\Mpls\02 AK\01\02011001\WorkFiles\POE Treatment Support\AWS Annual Report-2014\Tables\Table 3_POE Sample Table_02022015.xlsx
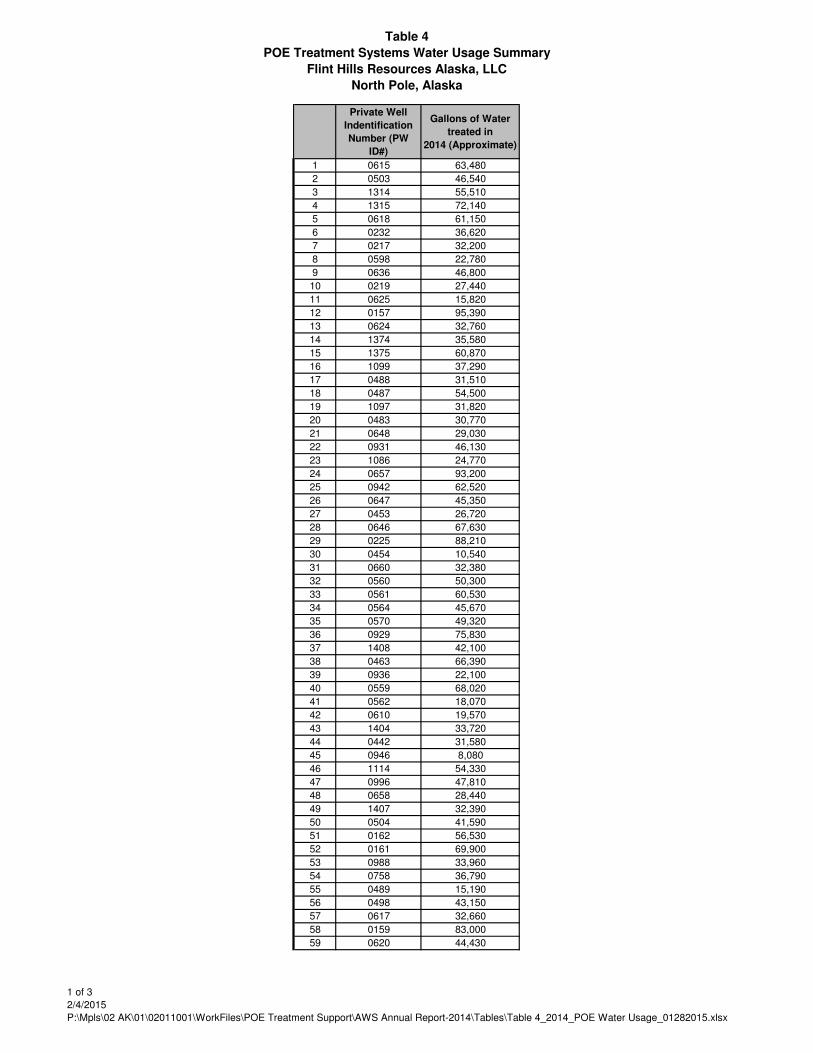
Table 4
POE Treatment Systems Water Usage Summary
Flint Hills Resources Alaska, LLC
North Pole, Alaska
Private Well
Indentification
Number (PW
ID#)
Gallons of Water
treated in
2014 (Approximate)
1 0615 63,480
2 0503 46,540
3 1314 55,510
4 1315 72,140
5 0618 61,150
6 0232 36,620
7 0217 32,200
8 0598 22,780
9 0636 46,800
10 0219 27,440
11 0625 15,820
12 0157 95,390
13 0624 32,760
14 1374 35,580
15 1375 60,870
16 1099 37,290
17 0488 31,510
18 0487 54,500
19 1097 31,820
20 0483 30,770
21 0648 29,030
22 0931 46,130
23 1086 24,770
24 0657 93,200
25 0942 62,520
26 0647 45,350
27 0453 26,720
28 0646 67,630
29 0225 88,210
30 0454 10,540
31 0660 32,380
32 0560 50,300
33 0561 60,530
34 0564 45,670
35 0570 49,320
36 0929 75,830
37 1408 42,100
38 0463 66,390
39 0936 22,100
40 0559 68,020
41 0562 18,070
42 0610 19,570
43 1404 33,720
44 0442 31,580
45 0946 8,080
46 1114 54,330
47 0996 47,810
48 0658 28,440
49 1407 32,390
50 0504 41,590
51 0162 56,530
52 0161 69,900
53 0988 33,960
54 0758 36,790
55 0489 15,190
56 0498 43,150
57 0617 32,660
58 0159 83,000
59 0620 44,430
1 of 3
2/4/2015
P:\Mpls\02 AK\01\02011001\WorkFiles\POE Treatment Support\AWS Annual Report-2014\Tables\Table 4_2014_POE Water Usage_01282015.xlsx
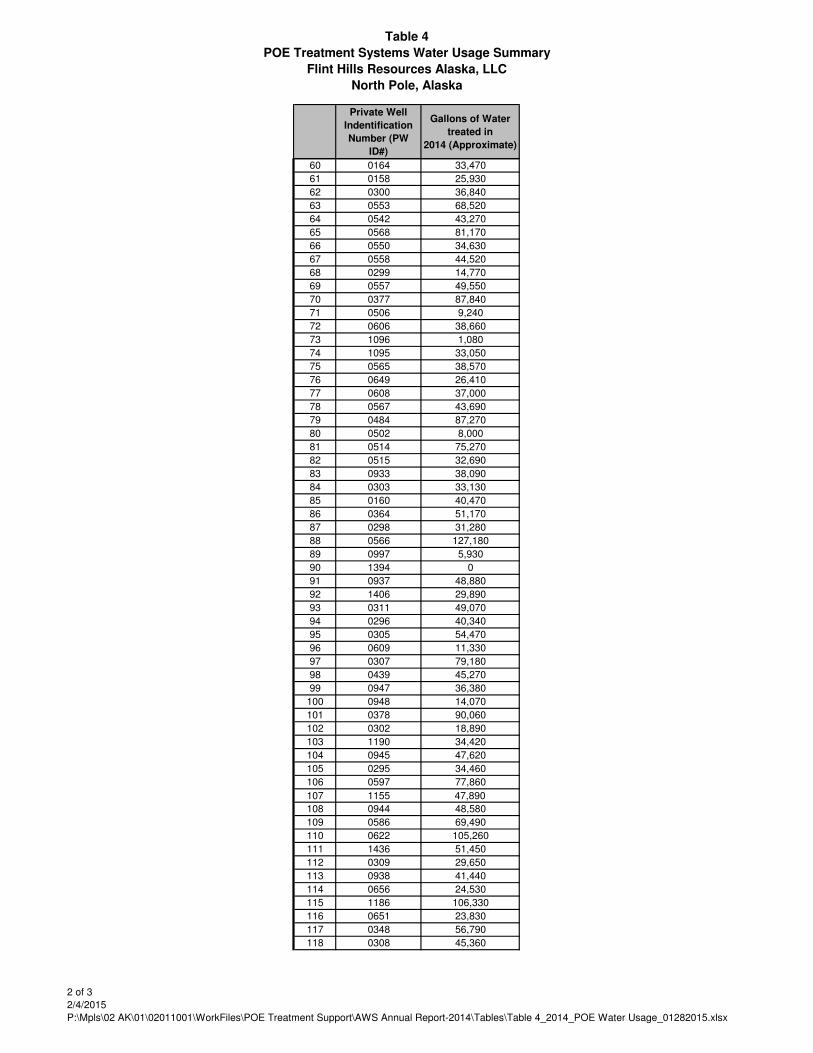
Table 4
POE Treatment Systems Water Usage Summary
Flint Hills Resources Alaska, LLC
North Pole, Alaska
Private Well
Indentification
Number (PW
ID#)
Gallons of Water
treated in
2014 (Approximate)
60 0164 33,470
61 0158 25,930
62 0300 36,840
63 0553 68,520
64 0542 43,270
65 0568 81,170
66 0550 34,630
67 0558 44,520
68 0299 14,770
69 0557 49,550
70 0377 87,840
71 0506 9,240
72 0606 38,660
73 1096 1,080
74 1095 33,050
75 0565 38,570
76 0649 26,410
77 0608 37,000
78 0567 43,690
79 0484 87,270
80 0502 8,000
81 0514 75,270
82 0515 32,690
83 0933 38,090
84 0303 33,130
85 0160 40,470
86 0364 51,170
87 0298 31,280
88 0566 127,180
89 0997 5,930
90 1394 0
91 0937 48,880
92 1406 29,890
93 0311 49,070
94 0296 40,340
95 0305 54,470
96 0609 11,330
97 0307 79,180
98 0439 45,270
99 0947 36,380
100 0948 14,070
101 0378 90,060
102 0302 18,890
103 1190 34,420
104 0945 47,620
105 0295 34,460
106 0597 77,860
107 1155 47,890
108 0944 48,580
109 0586 69,490
110 0622 105,260
111 1436 51,450
112 0309 29,650
113 0938 41,440
114 0656 24,530
115 1186 106,330
116 0651 23,830
117 0348 56,790
118 0308 45,360
2 of 3
2/4/2015
P:\Mpls\02 AK\01\02011001\WorkFiles\POE Treatment Support\AWS Annual Report-2014\Tables\Table 4_2014_POE Water Usage_01282015.xlsx

Table 4
POE Treatment Systems Water Usage Summary
Flint Hills Resources Alaska, LLC
North Pole, Alaska
Private Well
Indentification
Number (PW
ID#)
Gallons of Water
treated in
2014 (Approximate)
119 0607 98,690
120 0544 64,040
121 0390 23,450
122 0773 48,500
123 0304 40,320
124 0394 14,780
125 0376 94,710
126 0943 40,130
127 0221 57,360
128 0940 4,820
129 1437 5,680
130 0393 11,860
131 0347 30,890
132 0755 47,660
133 0480 6,780
134 1118 62,760
135 0556 85,690
136 1435 73,860
137 0757 33,630
138 1109 22,290
139 1101 25,760
140 1103 41,980
141 1105 61,260
142 1104 26,820
143 1116 53,840
144 0554 51,970
145 0599 27,800
146 1276 40,310
147 0932 38,190
148 0312 96,070
149 1110 37,870
150 1100 24,060
151 0301 36,760
152 0466 34,210
153 0511 69,950
154 0365 186,920
155 1395 96,870
156 0456 72,800
157 0563 51,060
158 0391 27,350
159 0653 50,310
160 1107 176,844
161 1108 143,760
162 1106 102,190
163 1459 41,050
164 1111 0
0754 0
2199 41,880
7,796,164Total
165
3 of 3
2/4/2015
P:\Mpls\02 AK\01\02011001\WorkFiles\POE Treatment Support\AWS Annual Report-2014\Tables\Table 4_2014_POE Water Usage_01282015.xlsx

Figures

@A
@A
@A
@A
@A@A
@A
@A
@A
@A
@A
@A
@A
@A
@A
@A
@A
@A
@A
@A
@A
@A
@A
@A
@A
@A
@A
@A
@A
@A
@A
@A
@A
@A
@A
@A
@A
@A
@A
@A
@A
@A
@A
@A
@A
@A
@A
@A
@A
@A
@A@A
@A
@A
@A
@A
@A
@A
@A
@A
@A
@A
@A
@A@A
@A
@A
@A
@A
@A
@A
@A
@A
@A
@A
@A
@A
@A
@A
@A
@A
@A
@A
@A
@A
@A
@A
@A
@A
@A
@A
@A
@A
@A
@A
@A
@A
@A
@A
@A
@A
@A
@A
@A
@A
@A
@A
@A
@A
@A
@A
@A@A
@A
@A
@A
#*
#*
#*
#*
#*
#*
#*
#*
#*
#*
#*
#*
#*
#*
#*
#*
#*
#*
#*
#*
#*
#*
#*
#*
#*
#*
#*
#*
#*
#*
#*
#*
#*
#*
#*
#*
#*
#*
#*
#*
#*
#*
#*
#*#*
#*
#*
#*
#*
#*
#*
#*
#*
#*
#*
#*
#*
#*
#*
#*
#*
#*
#*
#*
#*
#*
#*
#*
#*
#*
#*
#*
#*
#*#*
#*
#*
#*
#*
#*
#*
#*
#*
#*
#*
#*
#*
#*
#*
#*
#*
#*
#*
#*#*
#*
#*
#*
#*
#*
#*#*#*
#*
#*
#*
#*
#*
#*
#*
#*
#*
#*
#*
#*
#*
#*
#*
#*
#*
#*
#*
#*#*
#*
#*
#*
#*
#*
#*
#*
#*
#*
#*
#*
#*
#*
#*
#*
#*
#*
#*
#*
#*
#*
#*
#*
#*
#*
#*
#*
#*
#*
#*#*
#*
#*
#*
#*
#* #*
#*
#*
#*
#*
#*
#*
#*
#*
#*
#*
#*
#*#*
#*
#*
#*
#*
#*#*
#*
#*
#*
#*
#*
#*
#*
#*
#*
#* #*#*
#*
#* #*
#*
#*
#*
#*
#*
#*
#*
#*
#*
#*
#*
#*
#*
#*
#*
#*
#*
#*
#*
#*
#*
#*
#*
#*
#*
#*
#*
#*
#*
#*
#*
#*
#*
#*
#*
#*
#*
#*
#*
#*
#*
#*
#*
#*
#*
#*
#*
#*
#*
#*
#*
#*
#*
#*
#*
#*
#*
#*
#*
#*
#*
#*
#*
#*
#*
#*
#*
#*
#*
#*
#*
#*
#*
#*
#*
#*
#*
#*
#*
#*
#*
#*
#*
#*
#*
#*
#*
#*
#*
#*
#*
#*
#*
#*
#*
#*
#*
#*
#*
#*
#*
#*
#*#*
#*
#*
#*
#*
#*
#*
#*
#*
#*
#*
#*
#*
#*
#*
#*
#*
#*
#*
#*
#*
#*
#*
#*
#*
#*
#*
#*
#*
#*
#* #*
#*
#*
#*
#*
#*
#*
#*
#*
#*
#*
#*
#*
#*
#*
#*
#*
#*
#*
#*
#*
#*
#*
#*
#*
#*
#*
#*
#*
#*
#*
#*
#*
#*
#*
#*
#*
#*
#*#*#*
#*
#* #*
#*
#*
#*
#*#*
#*
#*
#*
#*
#*
#*
#*
#*
#*
#*
#*
#*
#*
#*
#*
#*
#*
#*
#*
#*
#*
#*
#*
#*
Alternative Water Solutions Program-2014 Annual ReportNorth Pole, Alaska
February 2015
2014 SULFOLANE PLUME ANDMONITORING RESULTS
Figure 131-1-11751-001
ND
LEGEND
Residential Well#* Sulfolane Not Detected
#* 2.50 - 100 µg/L
#* 100 - 1,000 µg/L
Monitoring Well@A Sulfolane Not Detected
@A 2.50 - 100 µg/L
@A 100 - 1,000 µg/L
Point-of-Entry Treatment SystemSample
Approximate Sulfolane Isoplethregardless of Depth
FHRA North Pole TerminalBoundary
ND Not Detected
Notes: -Image provided courtesy of Pictometry International 2012-Monitoring well data presented on this map was collected during foruth quarter of 2014
0 1 20.5
Miles
I
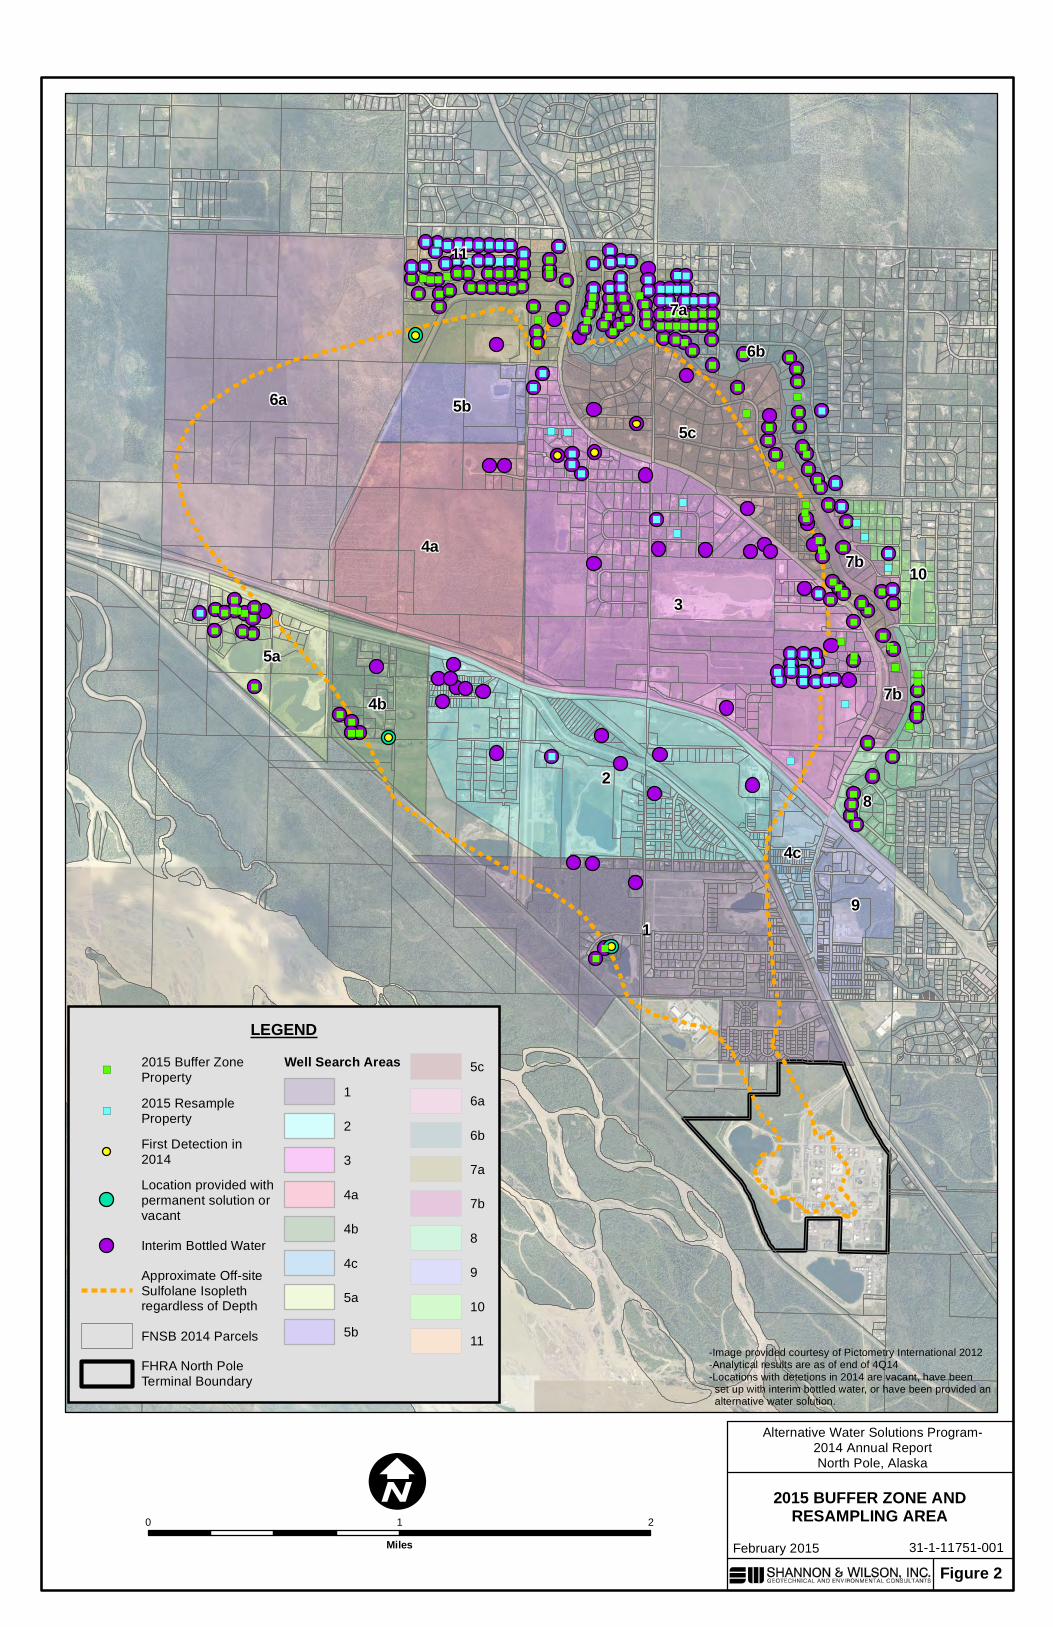
")
")
")
")
")
")
")")")
")
")
")
")
")
")
")
")")
")
")
")
")
")
")")
")")
")
")
")
")
")
")
")
")
")
")
")
")
")
")
")
")
")
")
")
")
")
")
")
")
")
")
")
")
")
")
")
")
")
")
")
")
")")")")
")
")
")")
")
")
")
")
")
")
")
")")
")
") ")")
")
")
")
")
")")
")
")
")
")
")
")
")
")
")
")
")
")
")
")
")
")
")
")
")
")
")
")
")
")
")
")
")
")
")
")
")
")
")
")
")
")
")
")
")
")
")
")
")
")
")
")
")
")
")
")
")
")
")
") ")
")
")
")
")
")
")
")
")
")
")
")
")
") ")
")
")
")
")
")
")
")
")
")
")
")
")
")
")
") ")
")
")
")") ")
")
")
")
")
")")
")")")
") ") ") ") ") ")")
")
")
")
")")
")
") ")") ")")
")")")")")") ") ")")")
")
")")
")
")
")3
2
1
6a
4a
5c
7a
9
8
6b
5a
4b
5b
4c
10
11
7b
7b
Alternative Water Solutions Program-2014 Annual ReportNorth Pole, Alaska
February 2015
2015 BUFFER ZONE ANDRESAMPLING AREA
Figure 231-1-11751-001
LEGEND
")2015 Buffer ZoneProperty
")2015 ResampleProperty
First Detection in2014
Location provided withpermanent solution orvacant
Interim Bottled Water
Approximate Off-siteSulfolane Isoplethregardless of Depth
FNSB 2014 Parcels
FHRA North PoleTerminal Boundary
Well Search Areas1
2
3
4a
4b
4c
5a
5b
5c
6a
6b
7a
7b
8
9
10
11-Image provided courtesy of Pictometry International 2012-Analytical results are as of end of 4Q14-Locations with detetions in 2014 are vacant, have been set up with interim bottled water, or have been provided an alternative water solution.
0 1 2
Miles
I

XX
&<
&<
&<
&<
&<
&<&<
&<&< &<&< &<&<
&<
&<&<
&<
&<
&<
&<
&<
&<&<&<
&<&<
&<&<
&<
&<
&< &<
&<
&<
&<
&<
&<
&<
&<
&<
&<
&<
&<&<
&<&<&<
&<
&<
&<
&<
&<
&<
&<
&<
&<
&<
&<&<
&<
&<
&<
&<
&<
&<
&<
&<&<
&<
&<
&<
&<
&<
&<
&<
&<
&<
&<
&<
&<&<
&<&<
&<&<
&<&<
&<&<
&<&<
&<&<
&<&<
&<&<
&<&<
&<&<&<&<
&<
&<
&<
&<
&<
&<
&<
&<
&<
&<&<
&<
&<
&<&<
&<
&<
&<
&<
&<
&<&<
&<
&<&<&<&<
&<&<&<&<
&<&<&<
&<
&<&<&<
&<&<
&<&<#*
#*
#*
#*
#*
#*
#*
#*
#*
#*
#*
#*
#*
#*
#*
#*
#*
#*
#*
#*
#*
#*
#*
#*
#*
#*#*
#*
#*
#*
#*
#* #*
#*
#*
#*
#*
#*
#*
#*
#*
#* #*
#*
#*
#*
#*
#*
#*
#*
#*
#*
#*
#*
#*
#*
#*
#*
#*
#*
#*
#*
#*
#*
#*
#*
#*
#*
#*
#*
#*
#*
#*
#*
#*
#*
#*
#*
#*
#*
#*
#*
#*
#*
#*
#*
#*
#*
#*
#*
#*
#*
#*
#*
#*
#*
#*
#*
#*
#*
#*
#*
#*
#* #*
#*
#*
#*
#*
#*
#*
#*
#*
#*
#*
#*
#*
#*
#*
#*
#*
#*
#*
#*
#*
#*
#*
#*
#*
#*
#*
#*
#*
#*
#*
#*
#*
#*
#*
#*
#*
#*
#*
#*
#*
#*
#*
#*
#*
#*
#*
#*
#*
#*#*
#*
#*
#*
#*
#*
#*
#*#*
#*
#*
#*
#*
#*
#*
#*
#*
#*
#*
#*
#*
#*
#*
#*
#*
#*
#*
#*
#*
#*
#*
#*
#*
#*
#*
#*
#*
#*
#*
#*
#*
#*
#*
#*
#*
#*
#*
#*
#*
#*
#*
#*
#*
#*
#*#*
#*
#*
#*
#*
#*
#*
#*
#*
#*
#*
#*
#*
#*
#*
#*
#*
#*
#*
#*
#*
#*
#*
#*
#*
#*
#*
#*#*
#*
#*
#*
#*
#*
#* #*
#*
#*
#*
#*#*
#*
#*
#*
#*
#*
#*
#*
#*
#*
#*#*
#*
#*
#*
#*
#*
#*
#*
#*
#*
#*
#*
#*
#*
#*
#*
#*
#*
#*
#*
#*
#*
#*
#*
#*
#*
#*
#*
#*
#*
#*
#*
#*
#*
#*
#*
#*
#*
#*
#*
#*
#*
#*
#*
#*
#*
#*
#*
#*
#*
#*
#*
#*
#*
#*
#*
#*
#*
#*
#*
#*
#*
#*
#*
#*
#*
#*
#*
#*
#*
#*
#*
#*
#*
#*
#*
#*
#*
#*
#*
#*
#*
#*
#*
#*
#*
#*
#*
#*
#*
#*
#*
#*
#*
#*#*
#*
#*
#*
#*
#*
#*
#*
#*
#*
#*
#*
#* #*#*
#*
#*
#*
#*
#*
#*
#*
#*
#*
#*
#*
#*
#*
#*#*
#*
#*
#* #*
#*
#*
#*
#*
#*
#*
#*
#*
#*
#*
#*
#*
#*
#*
#*
#*
#*
#*#*
#*
#*
#*
#*
#*
#*
#*
#*
#*
#*
#*
#*
#*
#*
#*
#*
#*
#*
#*
#*
#*
#*
#*
#*
#*
#*
#*
#*
#*
#*
#*#*
#*
#*
#*
#*
#*
#*
#*
#*
#*
#*
#*
#*
#*
#*
#*
#*#*
#*
#*
#*
#*
#*
#*
#*
#*
#*
#*
#*
#*
#*
#*
#*
#*
#*
#*
#*
#*
#*
#*
#*#*
#*
#*
#*#*
#*
#*
#*
#*
#*
#*
#*
#*
#*
#*
#*
#*
#*
#*
#*
#*
#*
#*
#*
#*
#*
#*
#*
#*
#*
#*
#*
#*
#*
#*
#*#*
#*
#*
#*
#*
#*
#*
#*
#*#*
#*
#*
#*
#*
#*
#*
#*
#*
#*
#*
#*
#*
#*
#*
#*
#*
#*
#*
#*
#*
#*
#*
#*
#*
#*#*
#*
#*
#*
#*
#*
#*
#*
#*
#*
#*
#*
#*
#*
#*
#*#*
#*
#*
#*
#*
#*
#*
#*
#*
#*
#*
#*
#*
#*
#*
#*
#*
#*
#*
#*
#*
#*
#*
#*
#*
#*
#*
#*
#*
#*
#*
#*
#*
#*
#*
#*
#*
#*
#*
#*
#*
#*
#*
#*
#*
#*
#*
#*
#*
#*
#*
#*
#*
#*
#*
#*
#*
#*#*
#*
#*
#*
#*
#*
#*
#*
#*
#*
#*
#*
#*
#*
#*
#*
#*
#*
#*#*
#*
#*
#*
#*
#*
#*
#*
#* #*
#*
#*
#*
#*
#*
#*
#*
#*
#*
#*
#*
#*
#*
#*
#*
#*
#*
#*
#*
#*
#*
#*
#*
#* #*
#*
#*
#*
#*
#*
#*
#*
#*
#*
#*
#*
#*
#*
#*
#*
#*
#*
#*
#*
#*
#*
#*
#*
#*
#*
#*
#*
#*
#*
#*
#*
#*
#*
#*
#*
#*
#*
#*
#*
#*
#*
#*
#*
#*
#*
#*
#*
#*
#*
#*
#*
#*
#*
#*
#*
#*
#*
#*
#*
#*
#*
#*
#*
#*
#*
#*
#*#*
#*
#*
#*
#*
#*
#*
#*
#*
#*
#* #*
#*
#*
#*
#*
#*
#*
#*
#*
#*
#*
#*
#*
#*
#*
#*
#*
#*
#*
#*
#*
#*
#*
#*
#*
#*
#*
#*
#*
#*
#*
#*
#*
#*
#*
#*
#*
#*
#*
#*
#*
#*
#*
#*
#*
#*
#*
#*
#*
#*
#*
#*
#*
#*
#*
#*
#*
#*
#*
#*
#*
#*
Tanana River
MW-187
MW-184
MW-189A/B
MW-193A/B
MW-194A/B
MW-191A/BMW-183A/B
MW-182A/BMW-168A/B
MW-167A/B
MW-166A/B
MW-165A/B
MW-163A/B
MW-162A/B
MW-158A/B
MW-157A/B
MW-156A/B
MW-172A/B
MW-171A/B
MW-155A/B
MW-153A/B
MW-335-41
MW-160AR/B
MW-185A/B/C
MW-181A/B/C
MW-164A/B/C
MW-159A/B/C
MW-169A/B/C
MW-152A/B/C
MW-151A/B/C
MW-349-15/45
MW-352-15/40
MW-343-15/50MW-350-15/50MW-341-15/40
MW-342-15/65
MW-339-15/50
MW-338-15/50
MW-329-15/66
MW-323-15/50
MW-317-15/71
MW-316-15/56
MW-311-15/46
MW-308-15/30
MW-328-15/151
MW-325-18/150
MW-318-20/135
MW-314-15/150
MW-170A/B/C/DMW-150A/B/C/D
MW-148A/B/C/D
MW-190A/BR/150
MW-16115/30/50
MW-346-15/65/150
MW-340-15/65/150
MW-347-20/65/150
MW-353-15/65/100MW-357-15/65/150
MW-332-15/41/75/110/150
REPP RD
HURST RD
ALASKA RAILROAD
PLACK RD
R/W LINE TANANA LEVEE
DAWS
ON R
D
OLD RICHARDSON HWY
BADGER RD
NEWB
Y RD
BEAR AVE
PERI
DOT S
T
FLIG
HT ST
OWNBY RD
MISSION RD
SAINT NICHOLAS DR
FINEL
L DR
HOLL
OWEL
L RD
TOPS
ST
RICHARDSON HWY
WILL
EDA S
T
BONA
ST
WYATT RD
GARNET DR
HOME
STEA
D DR
FRONTAGE RD
JUDY LN
LARI
X DR
LINEMAN AVE
BROC
K RD
OTTE
R DR
WOLL
RD
PERIMETER DR
RUBY DR
OUTS
IDE B
LVD
BOULDER AVE
MISTLETOE DR
MARIGOLD RD
ERMI
NE D
R
PIPELINE ACCESS RD
TAXIW
AY
DRUM AVE
SINGA
ST
SHARON RD
BUZBY RD
CONIFER DR
FIFTH (NP) AVEBLACKBURN WAY
MICA
H RD
DIXO
N RD
POPPY DR
PLATO WAY
VIRGINIA ST
REGAL AVE
SNOW
MAN
LN
SANDY RD
VOYA
GER
ST
PLAN
TERS
LN
NATE CIR
SANT
A CLA
US LN
STAR
LIT LN
PATRIOT DR
HOMER DR
GRAN
ITE D
R
AIRWAY DR
PARK WAY
KEENEY RD
EDWARD DR
ARLE
NE D
R
OUR ST
TURNER DRN.P.H.S. BLVD EIGHTH (NP) AVE BLAN
KET B
LVD
MY C
T
ATHE
NA C
IR W
POOL
ST
TOPAZ AVE
STOREY DR
LAKE DR
YELLOWSTONE RD
EDSS
ON AV
E
H&H
RD
VENU
S DR
JARRED DR
ATHE
NA C
IR E
FREE
-WRI
GHT L
N
MARS AVE
HER S
T
LIONS RD
SIXTH (NP) AVE
ELVIRA AVE
ATHENA CIR S
ATHENA CIR N
MISELTOE DR
JUPITER DR
BEEC
H DR
PIPER
ST
MOUN
T WRA
NGEL
L ST
KALTAG DR
CHRI
STIN
E DR
SCHU
TZEN
ST
DAVIS
BLV
D
GOLD
ENRO
D CI
R N
KIT B
LVD
SUNFLOWER LOOP
GOLDENROD CIR S
LIBERTY CT
SESA
ME ST
MAURICE AVE
QUINNELL LN
NORTH ST
AR DR
DILLON AVE
BEAV
ER B
LVD
MILE
S ST
WHITE SPRUCE DR
BROOKVIEW LN
JONY DAN LN
DEWI
TT D
R
CHAMPION AVE
DUND
EE LO
OP
LEW MYERS LN
MAULE LN
HORSESHOE WAY
BARBARA LEE DR
VICTORIA CIR
HIS CT
BEULAH CT
EVOLYN DR SEVOLYN DR N
KOONZ DR
EIGHTH (NP) AVE E
BURTIS AVE
KRIS KRINGLE DR
JULIE LN
SLAT
E CT
SHALE CT
EIRE S
T
STAT
EHOO
D ST
JAME
S ST KALISPELL LOOP
SAN A
UGUS
TIN D
R
COAC
HMAN
LN
JOSIE CT
JESS
ICA L
OOP
OUIDA WAY
WING CT
LORI
LN
GLACIER STATE DR
OSBO
RN C
T
QUIN
CY C
T
GLIDE CT
PRAI
SE LN
SATURN WAY
MOCKLER AVEOLD MISSION RD
MAHLEN CT
RALPH TRND
TAXILANE B
CREE
K DR
JUNE TRND
PERT
H CT
GRAN
THAM
LN
SPINNER CT
MAISIA CT
RUDDER CT
HALLELUJAH LN
SAMANTHA CT
MALLORY AVE
ARCT
IC C
ACHE
GARNET DR
AIRWAY DR
BADGER RD
TAXIW
AY
DRUM AVE
DAWS
ON R
D
NEWB
Y RD
Figure 3Potable Water Solutions
Provided byFlint Hills Resources
Private Well Results and Solutions as of
December 31, 2014
I0 1
Miles
Legend#* Sulfolane Not Detected
#* 2.50 - 100 µg/L
#* 100 - 1,000 µg/L
&< Monitoring Well
City Water Solutions
Long Term Alternative Water Solution -Residential Property
Long Term Alternative Water Solution -Commercial Property
Interim Bottled Water Solution
Water Tank Listed As Water Source DuringSurvey (Outside City Limits)
Auxiliary Well Sample, City Water Listed AsDrinking Water Source During Survey
City of North Pole Fire Wells
X New NP City Wells
Water Main New City Wells
North Pole City Boundary
ppb = parts per billion1 ppb = 1 µg/L (microgram per liter)1 µg/L = 0.000000001 g/L (gram per liter)
*The latest sulfolane result for a well is presented on this map.
Attachment A
2014 Newsletters to Homeowners

Alaska


BE IN THE KNOW, NORTH POLE.
The official newsletter keeping North Pole informed and
educated on sulfolane and the Flint Hills Resources
Alaska (FHRA) refinery.
ABOUTWelcome to the second issue of “Be in the Know,
North Pole.” The purpose of this monthly
newsletter is to educate and inform the residents
of North Pole on sulfolane in the community.
We will send regular newsletters to keep
residents in the know about sulfolane and how
it affects us all.
Learn more and subscribe to our email newsletter
at www.northpolegroundwater.com
STAY INFORMED
Stay informed on what is happening by visiting us
online at www.northpolegroundwater.com. This
website is a one-stop shop for residents, realtors
and others. While there, sign-up to receive our
monthly e-mail newsletter.
The Alaska Department of Environmental
Conservation has information online at
www.dec.alaska.gov.
Alaska

THIS ISSUE:
Pump and Treat System In this issue, we will focus on our pump and treat
system. In 2013 alone, this system treated about
200 million gallons of water. This year, we plan to
do even more by expanding the existing pump
and treat system.
FHRA’s North Pole Groundwater Office is located in
Polar Plaza, next to the North Pole Post Office, at 201
Santa Claus Lane. The staff there can send you the
most recent copy of your sulfolane test results and
answer any questions you have about sulfolane in
North Pole.
You can call FHRA directly at 488-0723. Marisa
Sharrah, Community Relations Manager, can be
reached at 488-5103 or [email protected].
To reach ADEC, contact Tamara Cardona, Project
Manager, Alaska Dept of Environmental Conservation,
at 451-2192.
Please remember: When selling a home in or near the affected area, homeowners are responsible for disclosure of the sulfolane issue. A licensed realtor is a great resource for assistance through that process.
FHRA TODAY:
This system:
• Is coming online this summer
• Is almost identical in technology to the proven system we brought online in June 2011
• Will further capture and remove sulfolane in groundwater under the refinery
• Will increase current gallons of water treated per day from about 500,000 to 800,000
The pump and treat system is actually quite simple. Here’s how it works:
The Flint Hills Resources North Pole Refinery is being
decommissioned. However, we will continue to work
on the North Pole groundwater project, which will
include resampling buffer-zones and adding to the
on-site remediation system this summer. Buffer-zone
testing will be conducted during that time on over
200 private wells to monitor the properties on the
leading edge of the plume. We will also be providing
alternative water to those residents and businesses
affected by sulfolane.
The Flint Hills North Pole Terminal will still be operating
as well - offloading fuels from the Flint Hills Anchorage
Terminal for distribution to our Interior Alaska retail
customers.
While we know the sulfolane contamination occurred
when Williams Companies owned the refinery and
the State of Alaska owned the land, neither of those
parties has taken any responsibility for responding to
this situation. As always, please contact FHRA to
request your most recent sulfolane test results or to
put in a request for testing. We’re here to answer your
questions about sulfolane in North Pole.
HERE TO HELP:
Sulfolane
It pumps water from the ground via a network
of wells
Water runs through a series of activated carbon vessels
to remove sulfolane
Treated water is monitored to ensure no detection
of sulfolane
The treated water is discharged to an on-site gravel pit, where it naturally returns to the aquifer.
Water is filtered to remove sediments
and hardness
zero
1.
3.
5.
2.
4.

BE IN THE KNOW, NORTH POLE.
The official newsletter keeping North Pole informed and
educated on sulfolane and the Flint Hills Resources
Alaska (FHRA) refinery.
ABOUTWelcome to the third issue of “Be in the Know,
North Pole.” The purpose of this monthly
newsletter is to educate and inform the residents
of North Pole on sulfolane in the community.
We will send regular newsletters to keep
residents in the know about sulfolane and how
it affects us all.
Learn more and subscribe to our email newsletter
at www.northpolegroundwater.com
STAY INFORMED
Stay informed on what is happening by visiting us
online at www.northpolegroundwater.com. This
website is a one-stop shop for residents, realtors
and others. While there, sign-up to receive our
monthly e-mail newsletter.
The Alaska Department of Environmental
Conservation has information online at
www.dec.alaska.gov.
Alaska

1977 North Pole refinery produces its first barrel of product (refinery owned by Earth Resources). The property on which the refinery is located is owned by the State of Alaska.
1980 Earth Resources sells a majority of its stock to MAPCO
1985 Sulfolane first used at North Pole refinery
1998 Williams Companies acquires MAPCO
2000-02 Sulfolane first discovered in on-site groundwater monitoring well
2002 ADEC determined that sufolane was not considered to be a regulated contaminant and not a compound of concern for the site
2004 Flint Hills Resources Alaska acquires the refinery as well as the property on which the refinery is located, and submits a Corrective Action Plan to address the on-site contamination
ADEC determined that sufolane will be a regulated contaminant and that its groundwater cleanup standard would be350 parts per billion (ppb)
Oct. 2009 FHRA discovers sulfolane had migrated off site and immediately alerts city/ADEC/local media
FHRA states they would provide testing and bottled water while working on a long-term plan for remediation
Nov. 2009 FHRA conducts first town hall meeting to discuss concerns of the community investigation and remediation plans of the company
2009-Now FHRA collected and analyzed samples from 815 private wells
Jan. 2010 FHRA develops a method with Ecowater Systems to remove sulfolane from water
Aug. 2010 FHRA spends $5 million to connect 29 homes to city water
FHRA starts work on two new city wells
Jan. 2011 Two new city wells become operational and are donated by FHRA to the City of North Pole
2011-Now FHRA installs 75 offsite monitoring wells to track the plume
FHRA provides solutions to 306 homes in the affected area
FHRA continues to monitor and test quarterly
FHRA analyzes 454 samples taken from the 184 active monitoring wells
FHRA collected and analyzed 669 private well samples
FHRA conducted an aerial survey to better understand the depth and thickness of permafrost in the plume area
Dec. 2013 FHRA submits on-site and off-site characterization reports to ADEC
THIS ISSUE:
FHRA History
FHRA’s North Pole Groundwater Office is located in
Polar Plaza, next to the North Pole Post Office, at 201
Santa Claus Lane. The staff there can send you the
most recent copy of your sulfolane test results and
answer any questions you have about sulfolane in
North Pole.
You can call FHRA directly at 488-0723. Marisa
Sharrah, Community Relations Manager, can be
reached at 488-5103 or [email protected].
To reach ADEC, contact Tamara Cardona, Project
Manager, Alaska Dept of Environmental Conservation,
at 451-2192.
Please remember: When selling a home in or near the affected area, homeowners are responsible for disclosure of the sulfolane issue. A licensed realtor is a great resource for assistance through that process.
HERE TO HELP:TIMELINE