altman: the role of distressed debt markets
DESCRIPTION
This paper explores the scope and importance of the distressed debt market and its market participantsTRANSCRIPT
1
The Role of Distressed Debt Markets, Hedge Funds and Recent Trends in Bankruptcy on the Outcomes of Chapter 11 Reorganizations
Edward I. Altman* This paper explores the scope and importance of the distressed debt market and its market participants and summarizes several relevant scholarly publications relating to how both these markets and participants have performed and contributed to the Chapter 11 bankruptcy-reorganization process. We also present new and potentially important data on recent trends in the outcomes of Chapter 11 bankruptcy reorganization filings, over the period 1981-2013, that will, we expect, contribute to the current investigation by the “bankruptcy industry” on the possible revision of the U.S. Bankruptcy Code. Such questions as to the relative success, or not, of the Chapter 11 process, the time in bankruptcy for various outcomes of the process, the impact of prepackaged restructuring on the outcomes and the recovery rate to various creditor classes will be examined. Key Words: Chapter 11, Bankruptcy-Reorganization, Hedge Funds, Distressed Debt
Markets, Recovery Rates *Max L. Heine Professor of Finance, NYU Stern School of Business, [email protected]. This paper was prepared for the ABI Law Review Symposium on “Hedge Funds in Chapter 11” at the St. John’s Law School, October 4, 2013. It will be published in the ABI Law Review, Vol. 21, Issue 2, 2013. The author would like to thank Brenda Kuehne, Apoorva Mehra, Chirag Choksey and Lourdes Tanglao of the NYU Salomon Center for their exceptional assistance in preparing this manuscript and Kerry Mastroianni of New Generation Research, Inc. for her data assistance.
2
The Role of Distressed Debt Markets, Hedge Funds and Recent Trends in Bankruptcy on the Outcomes of Chapter 11 Reorganizations
Edward I. Altman Max L. Heine Professor of Finance
NYU Stern School of Business Introduction In this paper we discuss and evaluate the scope and importance of the development and
growth of the Distressed and Defaulted Debt market and its market participants, particularly in
the United States. We also summarize a number of scholarly research publications that I, and
others, have contributed to better the understanding of how these markets have performed and
the important role they have played in our financial economic system. Finally, we present some
relevant trends in bankruptcy-reorganization filings and outcomes that will hopefully shed some
light on several controversial issues presently being discussed by the American Bankruptcy
Institute (ABI) and the bankruptcy profession. The background for my research and continued
study of these markets was originally motivated by having been commissioned by The Foothill
Group to prepare a series of “White Papers” on Distressed Debt Markets in 1990 and 1992.1
These studies provided the original analysis to the development of the Altman Defaulted Bond
and Bank Loan Indexes, now called the Altman-Kuehne NYU Salomon Center Defaulted
Bond and Defaulted Bank Loan Index, a well-known and respected benchmark of these
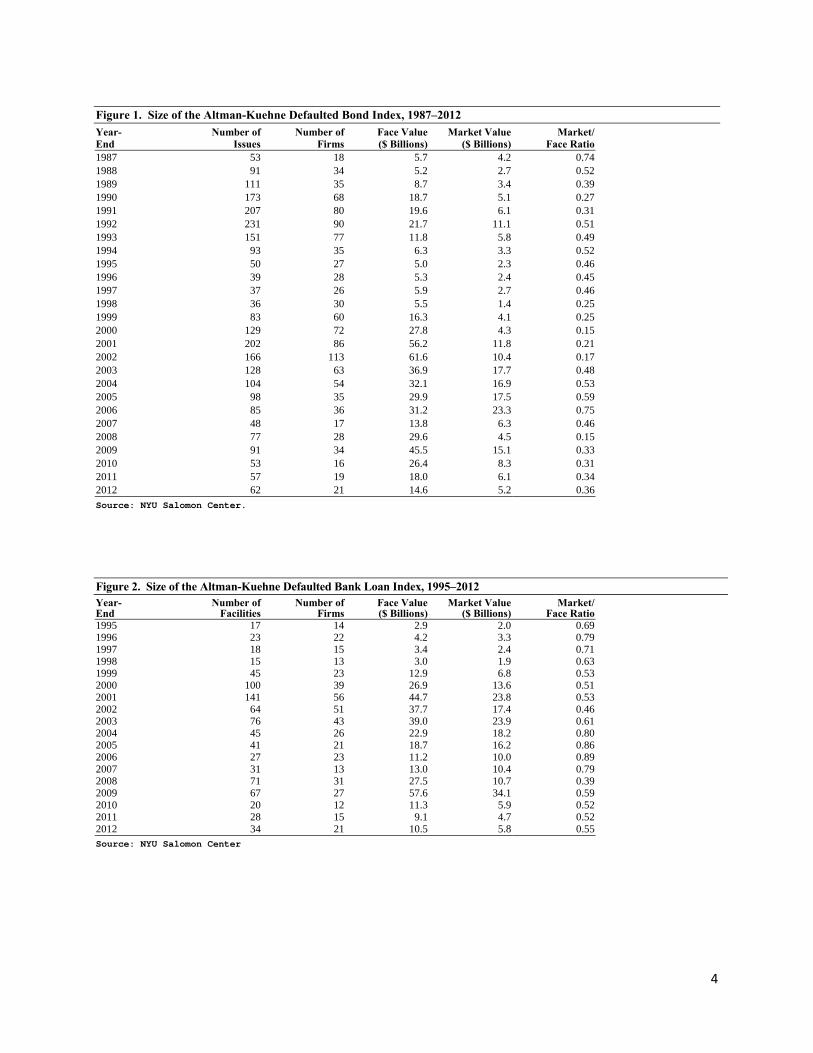
securities’ performance. Tables showing the size of these indexes over time
1 E. Altman, 1990, “Investing in Distressed Securities: The Anatomy of Defaulted Debt and Equities, “Foothill Group, Inc., Los Angeles, CA, April and “The Market for Distressed Securities and Bank Loans,” Altman‐Foothill Report II, Foothill, Los Angeles, 2002. The former was the basis for E. Altman (1991), Distressed Securities, Probus Press.
3
are shown in Figures 1-2. We estimate that there are, today, more than 200 financial institutions
investing between $400-450 billion in the distressed debt market in the U.S. and a substantial
number and amount operating in Europe and in other markets. Interestingly, the corporate bond
market usually becomes more liquid and volume increases as a firm becomes distressed and even
more so at the time that it defaults. Friewald, Jankowitsch, and Subrahmanyam (2012) and
Jankowitsch, Nagler and Subrahmanyam (2013) substantiate this assertion.
It is interesting to note that we expanded our analysis to distressed bank loans in 1995 as
these private transaction assets became more liquid and trading increased. Loans have become
subject to intense scrutiny by investors, providing the incentive to apply more sophisticated
valuation analytics to these heretofore essentially “buy and hold assets.” Also, the rating
agencies began rating large commercial loans in the mid-1990s, coincident with the tremendous
growth in the syndicated loan market and later as these assets were securitized into collateralized
loan obligations (CLO). As will be discussed, distressed debt investors have played an important
role in the depth and liquidity of the loan market, as well as the bond market, especially since the
late 1980s.
Important Institutional Investors
To address the question of the impact and role that institutional investors (e.g., Hedge
Funds) have had on the bankruptcy process, one can cite the impressive growth, scope and
specific actions that these investors, and others, have played in the evolution of the Chapter 11
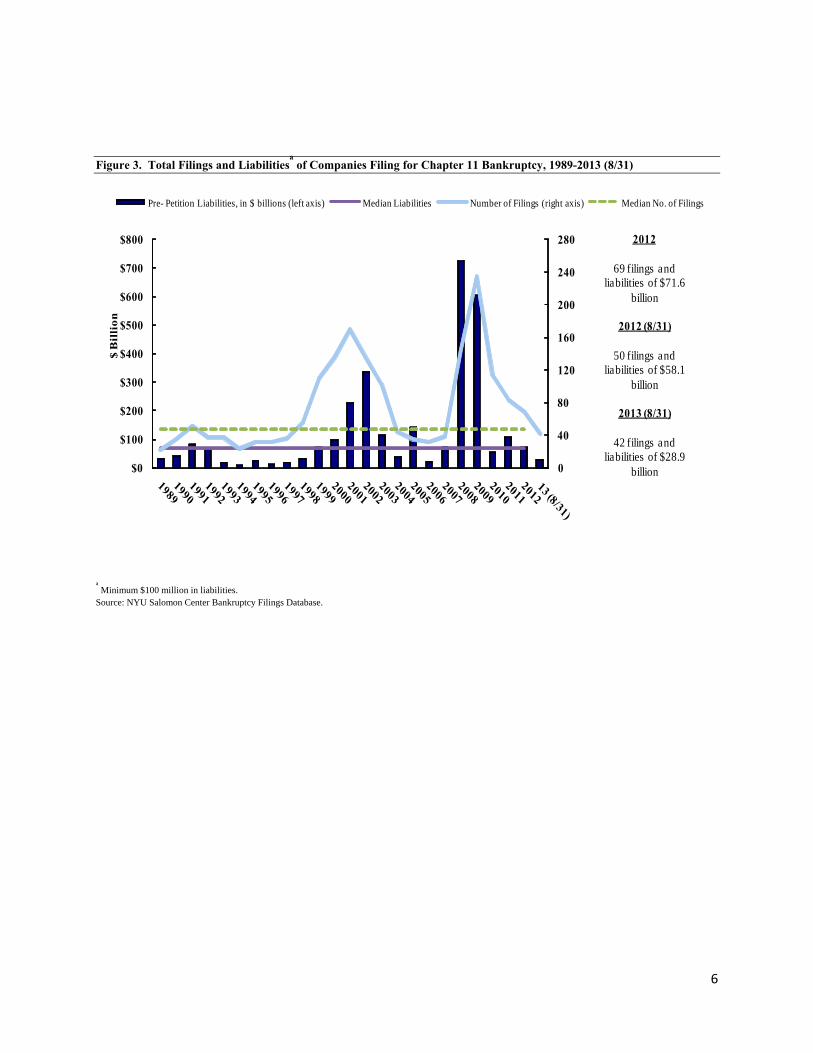
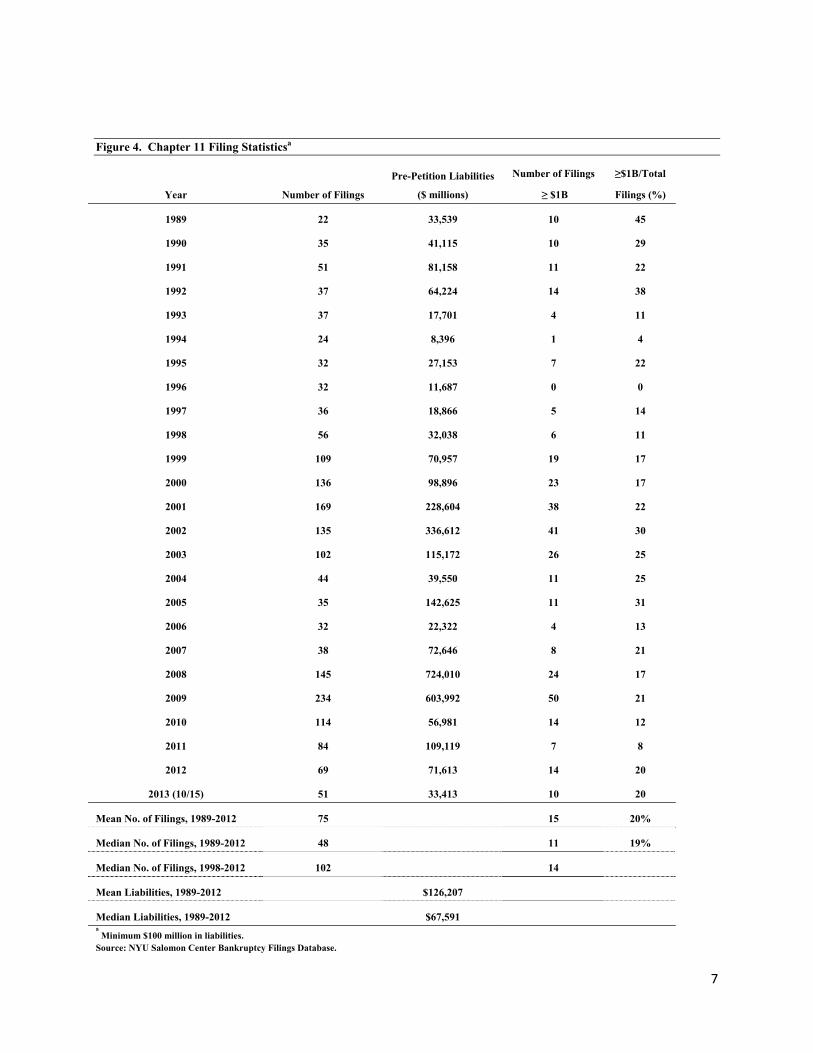
reorganization and post-reorganization process over the last 20-plus years. Figures 3 and 4 show
our calculations of the annual amounts of bankruptcy liabilities for Chapter 11 filings with
4
Figure 1. Size of the Altman-Kuehne Defaulted Bond Index, 1987–2012 Year- Number of Number of Face Value Market Value Market/ End Issues Firms ($ Billions) ($ Billions) Face Ratio 1987 53 18 5.7 4.2 0.74 1988 91 34 5.2 2.7 0.52 1989 111 35 8.7 3.4 0.39 1990 173 68 18.7 5.1 0.27 1991 207 80 19.6 6.1 0.31 1992 231 90 21.7 11.1 0.51 1993 151 77 11.8 5.8 0.49 1994 93 35 6.3 3.3 0.52 1995 50 27 5.0 2.3 0.46 1996 39 28 5.3 2.4 0.45 1997 37 26 5.9 2.7 0.46 1998 36 30 5.5 1.4 0.25 1999 83 60 16.3 4.1 0.25 2000 129 72 27.8 4.3 0.15 2001 202 86 56.2 11.8 0.21 2002 166 113 61.6 10.4 0.17 2003 128 63 36.9 17.7 0.48 2004 104 54 32.1 16.9 0.53 2005 98 35 29.9 17.5 0.59 2006 85 36 31.2 23.3 0.75 2007 48 17 13.8 6.3 0.46 2008 77 28 29.6 4.5 0.15 2009 91 34 45.5 15.1 0.33 2010 53 16 26.4 8.3 0.31 2011 57 19 18.0 6.1 0.34 2012 62 21 14.6 5.2 0.36 Source: NYU Salomon Center.
Figure 2. Size of the Altman-Kuehne Defaulted Bank Loan Index, 1995–2012 Year- Number of Number of Face Value Market Value Market/ End Facilities Firms ($ Billions) ($ Billions) Face Ratio 1995 17 14 2.9 2.0 0.69 1996 23 22 4.2 3.3 0.79 1997 18 15 3.4 2.4 0.71 1998 15 13 3.0 1.9 0.63 1999 45 23 12.9 6.8 0.53 2000 100 39 26.9 13.6 0.51 2001 141 56 44.7 23.8 0.53 2002 64 51 37.7 17.4 0.46 2003 76 43 39.0 23.9 0.61 2004 45 26 22.9 18.2 0.80 2005 41 21 18.7 16.2 0.86 2006 27 23 11.2 10.0 0.89 2007 31 13 13.0 10.4 0.79 2008 71 31 27.5 10.7 0.39 2009 67 27 57.6 34.1 0.59 2010 20 12 11.3 5.9 0.52 2011 28 15 9.1 4.7 0.52 2012 34 21 10.5 5.8 0.55 Source: NYU Salomon Center
5
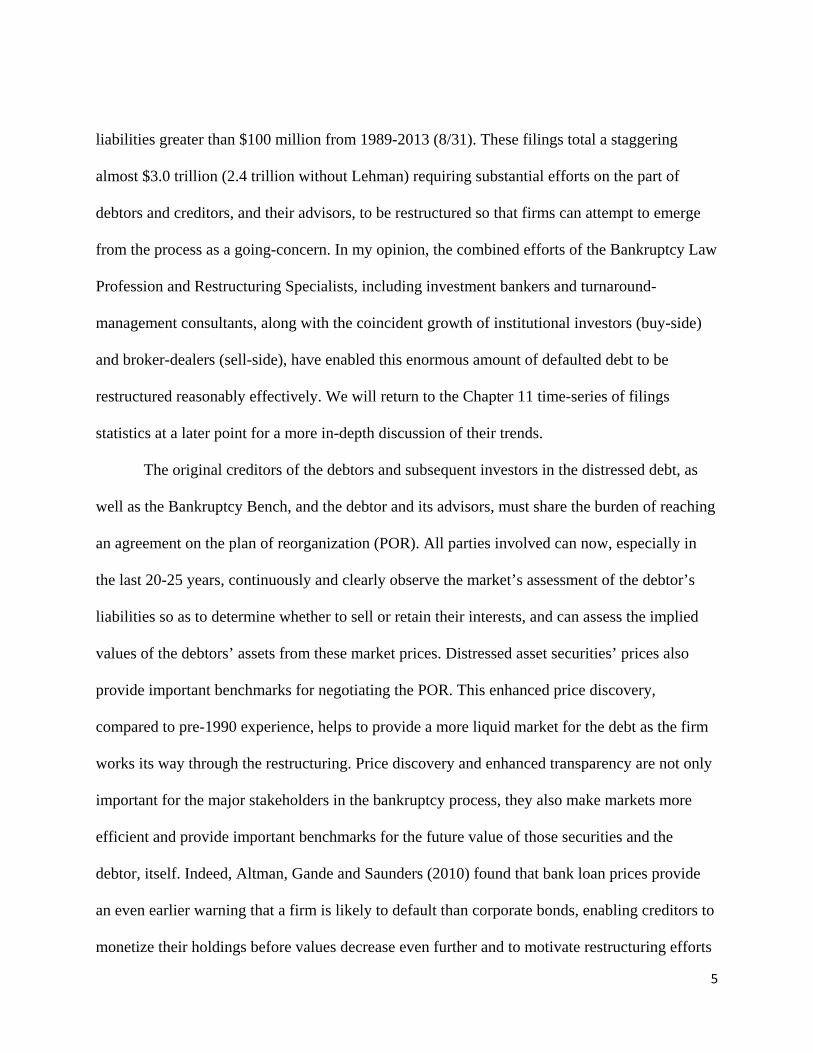
liabilities greater than $100 million from 1989-2013 (8/31). These filings total a staggering
almost $3.0 trillion (2.4 trillion without Lehman) requiring substantial efforts on the part of
debtors and creditors, and their advisors, to be restructured so that firms can attempt to emerge
from the process as a going-concern. In my opinion, the combined efforts of the Bankruptcy Law
Profession and Restructuring Specialists, including investment bankers and turnaround-
management consultants, along with the coincident growth of institutional investors (buy-side)
and broker-dealers (sell-side), have enabled this enormous amount of defaulted debt to be
restructured reasonably effectively. We will return to the Chapter 11 time-series of filings
statistics at a later point for a more in-depth discussion of their trends.
The original creditors of the debtors and subsequent investors in the distressed debt, as
well as the Bankruptcy Bench, and the debtor and its advisors, must share the burden of reaching
an agreement on the plan of reorganization (POR). All parties involved can now, especially in
the last 20-25 years, continuously and clearly observe the market’s assessment of the debtor’s
liabilities so as to determine whether to sell or retain their interests, and can assess the implied
values of the debtors’ assets from these market prices. Distressed asset securities’ prices also
provide important benchmarks for negotiating the POR. This enhanced price discovery,
compared to pre-1990 experience, helps to provide a more liquid market for the debt as the firm
works its way through the restructuring. Price discovery and enhanced transparency are not only
important for the major stakeholders in the bankruptcy process, they also make markets more
efficient and provide important benchmarks for the future value of those securities and the
debtor, itself. Indeed, Altman, Gande and Saunders (2010) found that bank loan prices provide
an even earlier warning that a firm is likely to default than corporate bonds, enabling creditors to
monetize their holdings before values decrease even further and to motivate restructuring efforts
6
Figure 3. Total Filings and Liabilitiesa of Companies Filing for Chapter 11 Bankruptcy, 1989-2013 (8/31)
0
40
80
120
160
200
240
280
$0
$100
$200
$300
$400
$500
$600
$700
$800
$ B
illi
on
Pre- Petition Liabilities, in $ billions (left axis) Median Liabilities Number of Filings (right axis) Median No. of Filings
2012
69 filings and liabilities of $71.6
billion
2012 (5/31)
36 filings and liabilities of $46.7
billion
2013 (5/31)
28 filings and liabilities of $16.9
billion
2012
69 filings and liabilities of $71.6
billion
2012 (5/31)
36 filings and liabilities of $46.7
billion
2013 (5/31)
28 filings and liabilities of $16.9
billion
2012
69 filings and liabilities of $71.6
billion
2012 (5/31)
36 filings and liabilities of $46.7
billion
2013 (5/31)
28 filings and liabilities of $16.9
billion
2012
69 filings and liabilities of $71.6
billion
2012 (8/31)
50 filings and liabilities of $58.1
billion
2013 (8/31)
42 filings and liabilities of $28.9
billion
a Minimum $100 million in liabilities. Source: NYU Salomon Center Bankruptcy Filings Database.
7
Figure 4. Chapter 11 Filing Statisticsa
Year Number of Filings
Pre-Petition Liabilities
($ millions)
Number of Filings
≥ $1B
≥$1B/Total
Filings (%)
1989 22 33,539 10 45
1990 35 41,115 10 29
1991 51 81,158 11 22
1992 37 64,224 14 38
1993 37 17,701 4 11
1994 24 8,396 1 4
1995 32 27,153 7 22
1996 32 11,687 0 0
1997 36 18,866 5 14
1998 56 32,038 6 11
1999 109 70,957 19 17
2000 136 98,896 23 17
2001 169 228,604 38 22
2002 135 336,612 41 30
2003 102 115,172 26 25
2004 44 39,550 11 25
2005 35 142,625 11 31
2006 32 22,322 4 13
2007 38 72,646 8 21
2008 145 724,010 24 17
2009 234 603,992 50 21
2010 114 56,981 14 12
2011 84 109,119 7 8
2012 69 71,613 14 20
2013 (10/15) 51 33,413 10 20
Mean No. of Filings, 1989-2012 75 15 20%
Median No. of Filings, 1989-2012 48 11 19%
Median No. of Filings, 1998-2012 102 14
Mean Liabilities, 1989-2012 $126,207
Median Liabilities, 1989-2012 $67,591 a Minimum $100 million in liabilities. Source: NYU Salomon Center Bankruptcy Filings Database.
8
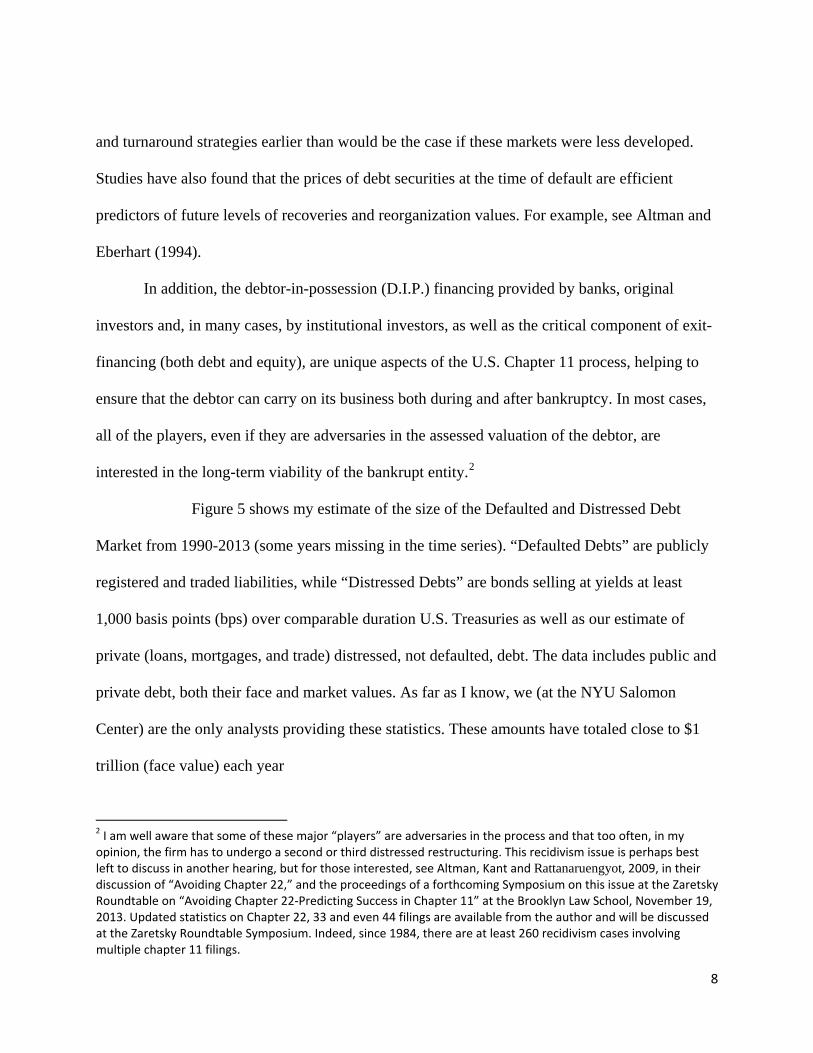
and turnaround strategies earlier than would be the case if these markets were less developed.
Studies have also found that the prices of debt securities at the time of default are efficient
predictors of future levels of recoveries and reorganization values. For example, see Altman and
Eberhart (1994).
In addition, the debtor-in-possession (D.I.P.) financing provided by banks, original
investors and, in many cases, by institutional investors, as well as the critical component of exit-
financing (both debt and equity), are unique aspects of the U.S. Chapter 11 process, helping to
ensure that the debtor can carry on its business both during and after bankruptcy. In most cases,
all of the players, even if they are adversaries in the assessed valuation of the debtor, are
interested in the long-term viability of the bankrupt entity.2
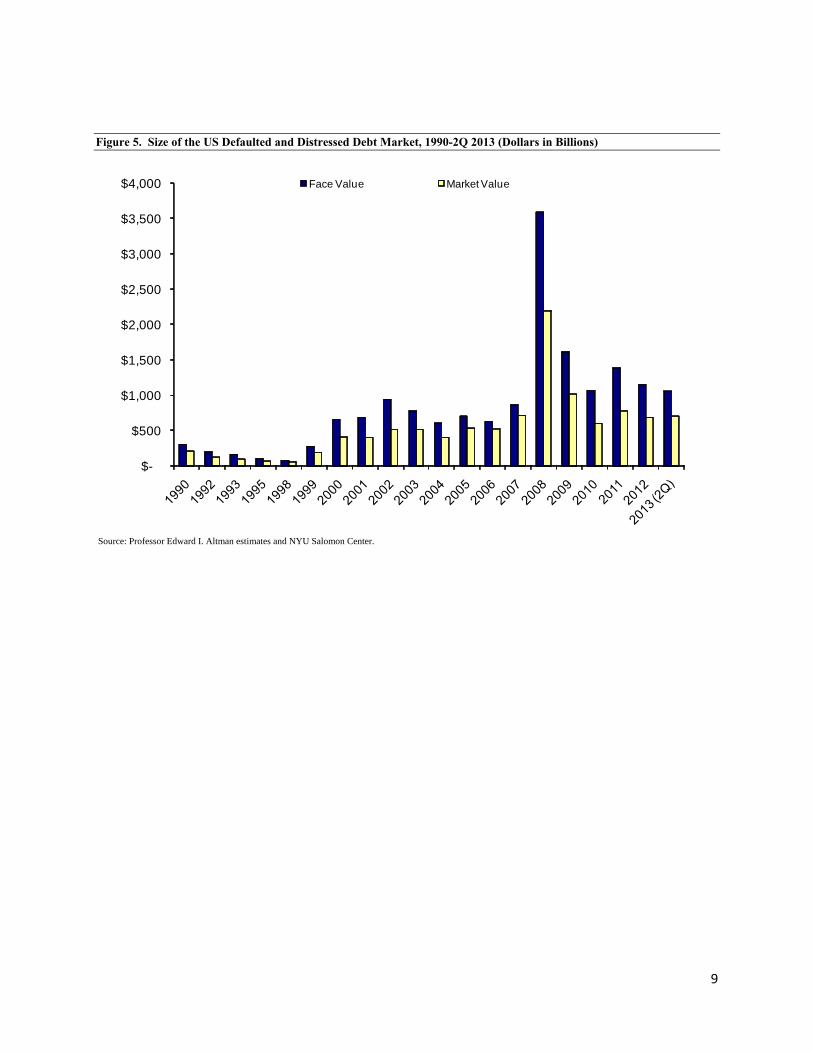
Figure 5 shows my estimate of the size of the Defaulted and Distressed Debt
Market from 1990-2013 (some years missing in the time series). “Defaulted Debts” are publicly
registered and traded liabilities, while “Distressed Debts” are bonds selling at yields at least
1,000 basis points (bps) over comparable duration U.S. Treasuries as well as our estimate of
private (loans, mortgages, and trade) distressed, not defaulted, debt. The data includes public and
private debt, both their face and market values. As far as I know, we (at the NYU Salomon
Center) are the only analysts providing these statistics. These amounts have totaled close to $1
trillion (face value) each year
2 I am well aware that some of these major “players” are adversaries in the process and that too often, in my opinion, the firm has to undergo a second or third distressed restructuring. This recidivism issue is perhaps best left to discuss in another hearing, but for those interested, see Altman, Kant and Rattanaruengyot, 2009, in their discussion of “Avoiding Chapter 22,” and the proceedings of a forthcoming Symposium on this issue at the Zaretsky Roundtable on “Avoiding Chapter 22‐Predicting Success in Chapter 11” at the Brooklyn Law School, November 19, 2013. Updated statistics on Chapter 22, 33 and even 44 filings are available from the author and will be discussed at the Zaretsky Roundtable Symposium. Indeed, since 1984, there are at least 260 recidivism cases involving multiple chapter 11 filings.
9
Figure 5. Size of the US Defaulted and Distressed Debt Market, 1990-2Q 2013 (Dollars in Billions)
$-
$500
$1,000
$1,500
$2,000
$2,500
$3,000
$3,500
$4,000 Face Value Market Value
Source: Professor Edward I. Altman estimates and NYU Salomon Center.

10
since 2000 and more than that figure since 2008. Market values have totaled from about $500
billion to close to $1 trillion each year for the last dozen years. Together, with our estimate of the
amount of distressed debt under management, discussed above, these statistics form the demand
and supply dynamics so critical for any viable financial market. These dynamics have provided
the incentive for a special breed of investors, experienced in distressed investing, to attract
capital and, as mentioned earlier, provide a potential outlet for original investors to monetize
their troubled assets over a period that can stretch from a year or more before the bankruptcy
filing, and lasting throughout the duration of the bankruptcy process. The length of this
bankruptcy-restructuring process will be discussed shortly. This liquidity is crucial to those other
investors who do not have the resources expertise or desire to hold their claims until the
resolution of the reorganization. Also, having the ability to estimate residual values in the event
of default, is crucial for non-investment grade firms to raise capital from the so-called “junk
bond and loan,” or leveraged-finance market, a market that is estimated now to be over $2
trillion; see Mead and Natarjan (2013).
Distressed Debt investing, and in some cases, additional investments into the equity of
distressed companies, generally can be categorized as (1) Passive, (2) Active and (3) Active-
Control. Passive investing generally involves the trading of distressed securities without any
direct influence on the bankruptcy process. Active-non-control investing can involve activities
whereby the investor, usually with a significant amount of the claims, can attempt to influence
the outcome of the bankruptcy process by directly or indirectly acting as a member of the
Creditors Committee or by any means that impacts the valuation of the debtor and its securities,
both before and after emerging from the bankruptcy process. The Active-Control strategy
involves having a direct impact on the management of the debtor, usually by owning a
11
significant amount of the post-restructured equity of the emerged entity. This sometimes results
in the distressed investor becoming the CEO or Chairman, or simply by owning a significant
enough stake in the company to gain control of the emerged firm. The latter strategy, in some
cases, is known as “loan to own” by the distressed investor.
Academic Literature
At this point, we introduce briefly the academic literature on the role and effectiveness of
the Active-Control, Distressed Investors. These works further support the role of distressed
investors in the governance of the firm and the reorganization process.
Hotchkiss and Mooradian (1997) investigated the role of “vulture investors” in the
governance and reorganization of a sample of 288 firms that defaulted on their public debt over
the period 1980-1993. They found evidence of vulture investing in 172 firms (60% of the
sample), whereby much of the time the investors held more than one-third of the amount of the
debt outstanding and/or pumped new equity into the restructured firms, thereby giving them
influence over the terms of the restructuring. The authors concluded that the improvement in
post-restructuring operations performance relative to pre-default levels was greater when the
vulture investor became CEO or Chairman or gained control of the target firm than compared to
when these Active-Control investors were not involved. My own observations and experience
tend to support their findings.3
Harner (2008) concludes that the precise impact of distressed debt investors in Chapter
11 cases is difficult to determine. While their investments in distressed companies are largely
unregulated and these investments are usually not disclosed, the results are often positive, as the
3 See Professor Hotchkiss’ testimony before the ABI Sub‐Committee’s Hearing on “Financing Chapter 11” (October 17, 2012).
12
studies cited above have shown. Some observers, e.g., Miller (2002), argue that distressed
investors are always trying to control the process at the expense of the debtor and even other
creditors and their objectives are usually short-term oriented. Others, e.g., Hotchkiss and
Mooradian (1997), Goldschmid (2005), and Kamensky (2013, in this issue), conclude that these
investors add value and may be the only source of financing for the debtor as it struggles to
emerge as a going concern. All of the above studies agree that the presence of distressed debt
investors and their critical role in the restructuring process of ailing companies will likely
continue as this credit strategy is now, as I have shown, a legitimate and viable hedge and private
equity Fund asset class, which is quite popular, albeit with cyclical volatility, for many limited
partner investors.
Empirically, Altman (1991), Harner (2008) and Altman and Kuehne (annually since
2007) have documented trends and performance of distressed debt investors. In so doing, these
studies highlight their objectives, strategies and results, adding to the transparency of this asset
class. It should be noted that this strategy is not a new phenomenon, as Altman’s earlier study
clearly documents.
A more recent study of the presence of hedge funds in the Chapter 11 process and their
impact on bankruptcy outcomes was provided by Jing, Li and Wang (2012). Their study
analyzed hedge funds (HF) involved in a comprehensive sample of 474 Chapter 11 cases from
1996-2007 and concluded that in close to 90% of the cases, there was clear evidence of publicly
observable involvement by HFs, confirming the general conclusion that HFs have become the
most active investors in the distressed debt market. The authors also updated earlier studies on
bankruptcy and provided additional insights on HFs as an emerging force in the Chapter 11
process.
13
The debate over the influence of debtors and creditors in Chapter 11 cases has been lively
and controversial in recent years. Some have been concerned with excessive creditor control and
its negative impact on the outcome of Chapter 11 cases, e.g., Miller and Weisman (2005), even
before the Code was revised in 2005. Others, such as Baird and Rasmussen (2006) argue for the
positive role played by creditors, and Skeel (2003) pointed out that the dominance once showed
by debtors in bankruptcy reorganizations was changing toward creditors, again even before the
distinctively creditor favorable changes after 2005.
The most recent empirical work on the role of Funds (Hedge, Private-Equity, others) in
the bankruptcy process was by Harner, et.al. (2013), in another article in this special edition of
the ABI Law Review. This study analyzed the results of cases where “Funds” were actively
involved (26% of the 490 cases analyzed) vs. those cases where Funds were not involved (74%
of the cases). Rather than summarize all of the findings of this important study, I refer the reader
to their companion-article in this issue. It should be noted, however, that the authors
acknowledge that due to the endogeneity issue of the cases chosen by Funds to invest in, it is not
possible to draw conclusions as to cause and effect of Fund involvement. They do suggest that
“the value of Fund participation in Chapter 11 cases likely depends on whom you ask and where
they sit in the particular debtor’s capital structure” (Abstract). With respect to the conclusion as
to whether Funds matter in Chapter 11 cases the answer is clear – yes! But, as to whether that
influence is positive or negative, the authors’ conclusion is uncertain.
As noted earlier, one of the unique aspects of the Bankruptcy process in the U.S. is the
post-Chapter 11 performance of the debtor and its owners. Usually, the new owners of the equity
are the “old” creditors, based on either the conversion of debt to equity or the injection of new
equity financing, the latter providing critical new liquidity for the debtor to compete. Eberhart,
14
Altman and Aggarwal (1999) conducted the first study on the performance of the new equity in
the post-reorganization period. We analyzed the stock return performance of 131 firms emerging
from Chapter 11 over the period 1980-1993 for 200 days, post-emergence and found consistent
evidence of significant abnormal (excess) returns on the 131- firm portfolio, averaging about
28% excess return over the appropriate stock index. Results such as these help to motivate
distressed investors to provide needed financing to firms exiting Chapter 11. We attributed the
significant positive returns to the fact that these firms performed far better than what the market
had expected. While these excess returns did not continue to manifest in all successive periods to
our initial study period, we have continued to observe extraordinary examples of positive post-
Chapter 11 performances for several years, e.g., K-mart, Lyondell, Delphi Corporation, GM.
Trends in Bankruptcy
Many of the issues and discussions at the ABI hearings these past several months center
on the impact of the New Bankruptcy Code (BAPCPA) of 2005 and the role of various
stakeholders, debtors and creditors, during the Chapter 11 proceedings. Questions such as the
trend in the number and size of filings, the duration of the reorganization process, whether the
result of the process was successful or not, the role of the prepackaged type of filing and the
recovery rate to various creditors and owners, seem to me, particularly relevant. While we will
make some observations from our trend data, the main purpose of the next sections is to provide
a comprehensive statistical backdrop for careful analysis and discussion of the bankruptcy
industry as it analyzes potential changes to our reorganization process.
I have chosen the period of 1981-2013 to analyze the above questions and, by necessity,
will concentrate only on publicly held firms for many of the data points. The number and size of
Chapter 11 filings for the more recent period 1989-2013 (8/31) is also analyzed for Chapter 11
15
filings greater than $100 million in liabilities, regardless if the firm was public or not when the
filing took place.4 Hence, LBO filings, sponsored by private equity firms, are also included. In
addition, we utilize the extensive database of New Generation Research on 3,460 Chapter 11
filings from 1978-2013 (really since 1981) for all filings and also a subset of 1,760 filings where
the assets (not liabilities) of publicly held firms were equal to or exceeded $100 million. The
sample period essentially covers Chapter 11 activity since the enactment of the modern Code in
1978, as well as the latest revision in October 2005.
Figures 3 and 4, presented earlier, showed the number of Chapter 11 filings by year from
1989-2013, as well as the amount of liabilities at the time of the bankruptcy petition. All of these
filings involve total liabilities equal to or greater than $100 million, as well as those greater than
$1 billion. For the period 1989-2012, the average annual number of filings was 75 per year and
the median was 48. Certain periods representing high economic stress, like 1999-2003 and again
2008-2010, are particularly noteworthy as involving more than 100 per year of these large
filings, as well as more than about $100 billion per year in liabilities in most years. The average
annual liability amount for the last 14 years was $126 billion and the median amount, lower at
$67.6 billion. In total, more than $1.75 trillion of liabilities have been restructured or liquidated
over this sample period. Of note, about 15 filings, on average, per year were greater than $1
billion in liabilities, representing about 20% of all Chapter 11 filings greater than $100 million in
liabilities, with 11 per year being the median.
As for trends, there is no surprise that both the number and liabilities amount of filings
has decreased since the “heady” years of 2008/2009, dropping to 114, 84, and 69 for 2010, 2011
and 2012, respectively. And, so far in 2013 through August (2/3 of the year), the number is 42,
4 Our own database of Chapter 11 filings at the NYU Salomon Center has always analyzed relatively large filings of equal to or greater than $100 million of liabilities (not assets).
16
so we can probably expect about 50-55 for the entire year 2013, again a decrease from 2012.
Still, the number, and amount of liabilities as well, has been greater in each of the last three to
four years than the median number (48) and median amount ($67.6 billion) compared to the
period 1989-2012, albeit slightly so. This can be seen graphically in Figure 3 wherein the
horizontal lines represent the median number and amount of liabilities. The largest bankruptcies,
those with liabilities equal to or greater than $1 billion, were just slightly below the average, but
mostly above the medians, in the last three years. So, the numbers do not support the contention
by some commentators that the Chapter 11 mechanism is either permanently, or even
temporarily, “dead” due to the incredible amounts of liquidity to refinance struggling entities
since 2010 or to the popular increase in out-of-court distressed exchanges since 2008.5 Not
surprisingly, almost half of these distressed exchanges only temporarily avoid a bankruptcy
filing since the restructurings do not affect operating problems.
To analyze a number of important characteristics and trends in Chapter 11 filings, we
have carefully examined the New Generation Research database on publicly held firms filing
for protection under Chapter 11, effectively from 1981-2013 (thru June). In this period, we
observe 3,460 filings of all sizes and 1,760 filings with assets greater than $100 million. We will
carefully point out that for some of our metrics, such as success or not, or time in bankruptcy, the
most recent two-three years (2011-2013) or, in some cases, even from further in the past, have
not had enough completed Chapter 11s to make any definitive statements. Still, we will attempt
to make some practical adjustments to analyze these most recent crucial years as well as data
from 2006 onward, where there are still many “unknown outcomes” of the reorganization
process.
5 About 60% of all distressed exchanges from 1984‐2012 have occurred in the last five years. See E. Altman and B. Kuehne (2013).
17
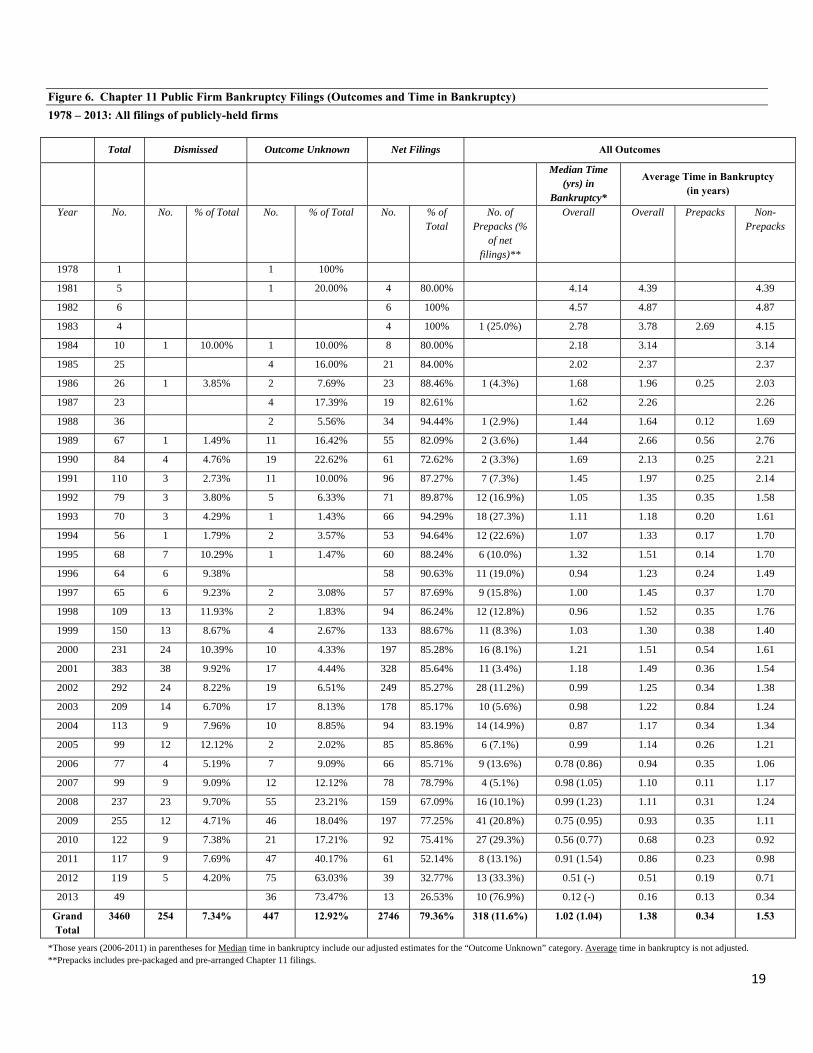
In Figure 6, we see that about 20% of all Chapter 11 filings were either dismissed (7.3%)
or that the outcome of the process is unknown (12.9%). Hence, for most of our results, we
analyzed 2,746 net filings, representing about 80% of all filings over the period and 100% of all
filings where we can ascertain the actual result of the Chapter 11 process. We also can observe
that 318 of net filings were characterized as either prepackaged or prearranged. In all of the last
five years (except 2011), the percent of filings that were either prepackaged or prearranged
(“Prepacks”) were greater than the 11.6% annual average. Indeed, in each year over 20% of all
net filings, except 2011, were prepacks.6 We will now discuss the success or not of Chapter 11
filings and their time-in-bankruptcy.
Success or Not
It is somewhat tricky to characterize the outcome of a Chapter 11 filing as successful or
not. For example, as we have written about several times, a Chapter 11 that emerges as a going-
concern, but slips after emergence and files again within a relatively short period of time (say,
five years) is in many ways an unsuccessful Chapter 11.7 For this study, however, we will first
characterize a Chapter 11 that either results in an emergence as a continuing entity or involving
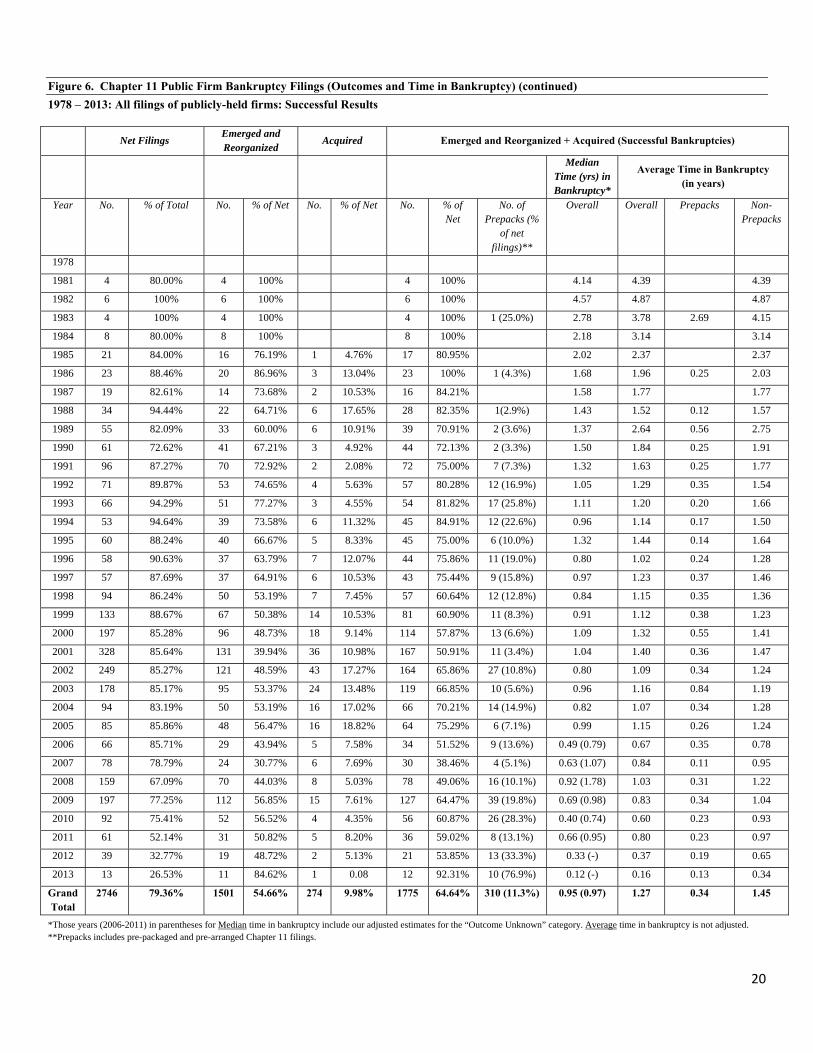
an acquisition of all or most of the assets as successful.8 From Figure 6, we see that of the 2,746
net filings, 1775 (64.6%) either emerged (1,501) or were “acquired” (274); hence were
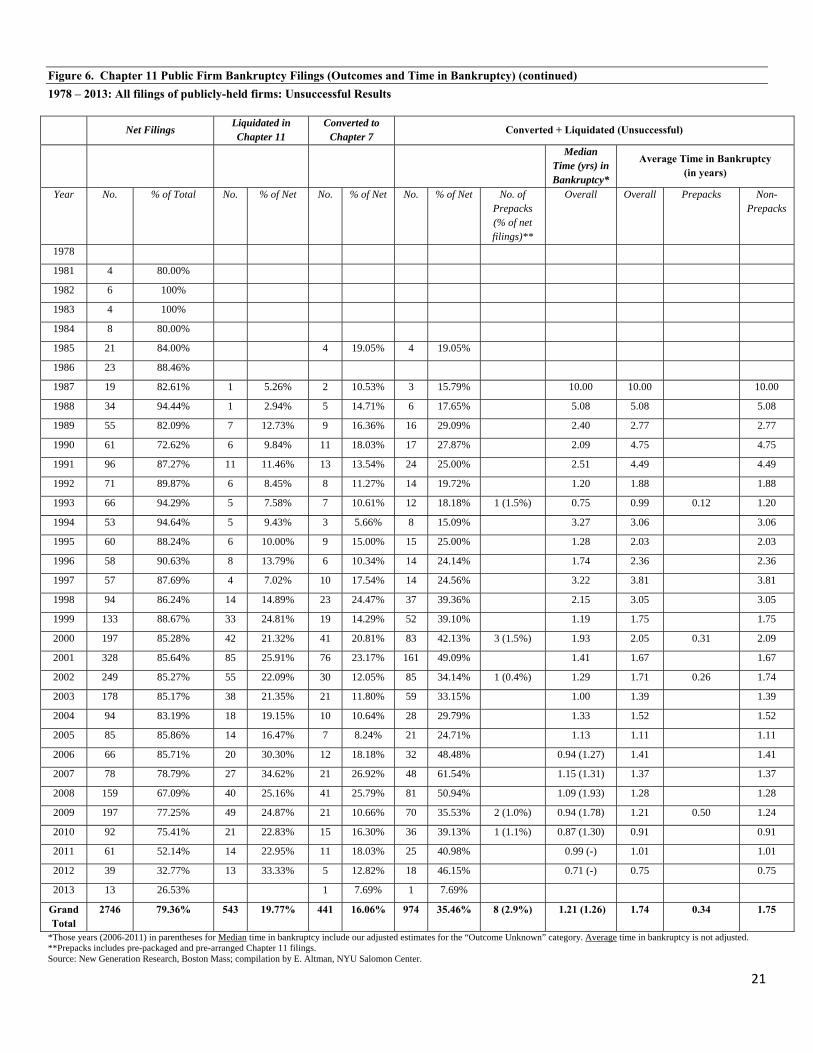
successful; 441 (16.1%) were converted to a Chapter 7 liquidation and 543 (19.8%) were
liquidated under Chapter 11, for a total of 984 or 35.8% of net filings that were “unsuccessful”.
6 When most of the “outcome unknown” filings will be resolved , i.e., the outcome becomes “known,” the percentage of filings that were prepackaged will decrease. 7 Our updated number of firms that have filed for Chapter 11 protection twice (Chapter 22), three times (Chapter 33) or four times (Chapter 44) is not trivial (about 260 since 1984). I will return to this factor in our adjusted “success” statistics. 8 The latter include 363 sales, such as Chrysler Corp. in 2009.

18
19
Figure 6. Chapter 11 Public Firm Bankruptcy Filings (Outcomes and Time in Bankruptcy) 1978 – 2013: All filings of publicly-held firms
Total Dismissed Outcome Unknown Net Filings All Outcomes
Median Time (yrs) in
Bankruptcy*
Average Time in Bankruptcy (in years)
Year No. No. % of Total No. % of Total No. % of Total
No. of Prepacks (%
of net filings)**
Overall Overall Prepacks Non- Prepacks
1978 1 1 100%
1981 5 1 20.00% 4 80.00% 4.14 4.39 4.39
1982 6 6 100% 4.57 4.87 4.87
1983 4 4 100% 1 (25.0%) 2.78 3.78 2.69 4.15
1984 10 1 10.00% 1 10.00% 8 80.00% 2.18 3.14 3.14
1985 25 4 16.00% 21 84.00% 2.02 2.37 2.37
1986 26 1 3.85% 2 7.69% 23 88.46% 1 (4.3%) 1.68 1.96 0.25 2.03
1987 23 4 17.39% 19 82.61% 1.62 2.26 2.26
1988 36 2 5.56% 34 94.44% 1 (2.9%) 1.44 1.64 0.12 1.69
1989 67 1 1.49% 11 16.42% 55 82.09% 2 (3.6%) 1.44 2.66 0.56 2.76
1990 84 4 4.76% 19 22.62% 61 72.62% 2 (3.3%) 1.69 2.13 0.25 2.21
1991 110 3 2.73% 11 10.00% 96 87.27% 7 (7.3%) 1.45 1.97 0.25 2.14
1992 79 3 3.80% 5 6.33% 71 89.87% 12 (16.9%) 1.05 1.35 0.35 1.58
1993 70 3 4.29% 1 1.43% 66 94.29% 18 (27.3%) 1.11 1.18 0.20 1.61
1994 56 1 1.79% 2 3.57% 53 94.64% 12 (22.6%) 1.07 1.33 0.17 1.70
1995 68 7 10.29% 1 1.47% 60 88.24% 6 (10.0%) 1.32 1.51 0.14 1.70
1996 64 6 9.38% 58 90.63% 11 (19.0%) 0.94 1.23 0.24 1.49
1997 65 6 9.23% 2 3.08% 57 87.69% 9 (15.8%) 1.00 1.45 0.37 1.70
1998 109 13 11.93% 2 1.83% 94 86.24% 12 (12.8%) 0.96 1.52 0.35 1.76
1999 150 13 8.67% 4 2.67% 133 88.67% 11 (8.3%) 1.03 1.30 0.38 1.40
2000 231 24 10.39% 10 4.33% 197 85.28% 16 (8.1%) 1.21 1.51 0.54 1.61
2001 383 38 9.92% 17 4.44% 328 85.64% 11 (3.4%) 1.18 1.49 0.36 1.54
2002 292 24 8.22% 19 6.51% 249 85.27% 28 (11.2%) 0.99 1.25 0.34 1.38
2003 209 14 6.70% 17 8.13% 178 85.17% 10 (5.6%) 0.98 1.22 0.84 1.24
2004 113 9 7.96% 10 8.85% 94 83.19% 14 (14.9%) 0.87 1.17 0.34 1.34
2005 99 12 12.12% 2 2.02% 85 85.86% 6 (7.1%) 0.99 1.14 0.26 1.21
2006 77 4 5.19% 7 9.09% 66 85.71% 9 (13.6%) 0.78 (0.86) 0.94 0.35 1.06
2007 99 9 9.09% 12 12.12% 78 78.79% 4 (5.1%) 0.98 (1.05) 1.10 0.11 1.17
2008 237 23 9.70% 55 23.21% 159 67.09% 16 (10.1%) 0.99 (1.23) 1.11 0.31 1.24
2009 255 12 4.71% 46 18.04% 197 77.25% 41 (20.8%) 0.75 (0.95) 0.93 0.35 1.11
2010 122 9 7.38% 21 17.21% 92 75.41% 27 (29.3%) 0.56 (0.77) 0.68 0.23 0.92
2011 117 9 7.69% 47 40.17% 61 52.14% 8 (13.1%) 0.91 (1.54) 0.86 0.23 0.98
2012 119 5 4.20% 75 63.03% 39 32.77% 13 (33.3%) 0.51 (-) 0.51 0.19 0.71
2013 49 36 73.47% 13 26.53% 10 (76.9%) 0.12 (-) 0.16 0.13 0.34
Grand Total
3460 254 7.34% 447 12.92% 2746 79.36% 318 (11.6%) 1.02 (1.04)
1.38 0.34 1.53
*Those years (2006-2011) in parentheses for Median time in bankruptcy include our adjusted estimates for the “Outcome Unknown” category. Average time in bankruptcy is not adjusted. **Prepacks includes pre-packaged and pre-arranged Chapter 11 filings.
20
Figure 6. Chapter 11 Public Firm Bankruptcy Filings (Outcomes and Time in Bankruptcy) (continued) 1978 – 2013: All filings of publicly-held firms: Successful Results
Net Filings
Emerged and Reorganized
Acquired Emerged and Reorganized + Acquired (Successful Bankruptcies)
Median Time (yrs) in Bankruptcy*
Average Time in Bankruptcy (in years)
Year No. % of Total No. % of Net No. % of Net No. % of Net
No. of Prepacks (%
of net filings)**
Overall Overall Prepacks Non- Prepacks
1978
1981 4 80.00% 4 100% 4 100% 4.14 4.39 4.39
1982 6 100% 6 100% 6 100% 4.57 4.87 4.87
1983 4 100% 4 100% 4 100% 1 (25.0%) 2.78 3.78 2.69 4.15
1984 8 80.00% 8 100% 8 100% 2.18 3.14 3.14
1985 21 84.00% 16 76.19% 1 4.76% 17 80.95% 2.02 2.37 2.37
1986 23 88.46% 20 86.96% 3 13.04% 23 100% 1 (4.3%) 1.68 1.96 0.25 2.03
1987 19 82.61% 14 73.68% 2 10.53% 16 84.21% 1.58 1.77 1.77
1988 34 94.44% 22 64.71% 6 17.65% 28 82.35% 1(2.9%) 1.43 1.52 0.12 1.57
1989 55 82.09% 33 60.00% 6 10.91% 39 70.91% 2 (3.6%) 1.37 2.64 0.56 2.75
1990 61 72.62% 41 67.21% 3 4.92% 44 72.13% 2 (3.3%) 1.50 1.84 0.25 1.91
1991 96 87.27% 70 72.92% 2 2.08% 72 75.00% 7 (7.3%) 1.32 1.63 0.25 1.77
1992 71 89.87% 53 74.65% 4 5.63% 57 80.28% 12 (16.9%) 1.05 1.29 0.35 1.54
1993 66 94.29% 51 77.27% 3 4.55% 54 81.82% 17 (25.8%) 1.11 1.20 0.20 1.66
1994 53 94.64% 39 73.58% 6 11.32% 45 84.91% 12 (22.6%) 0.96 1.14 0.17 1.50
1995 60 88.24% 40 66.67% 5 8.33% 45 75.00% 6 (10.0%) 1.32 1.44 0.14 1.64
1996 58 90.63% 37 63.79% 7 12.07% 44 75.86% 11 (19.0%) 0.80 1.02 0.24 1.28
1997 57 87.69% 37 64.91% 6 10.53% 43 75.44% 9 (15.8%) 0.97 1.23 0.37 1.46
1998 94 86.24% 50 53.19% 7 7.45% 57 60.64% 12 (12.8%) 0.84 1.15 0.35 1.36
1999 133 88.67% 67 50.38% 14 10.53% 81 60.90% 11 (8.3%) 0.91 1.12 0.38 1.23
2000 197 85.28% 96 48.73% 18 9.14% 114 57.87% 13 (6.6%) 1.09 1.32 0.55 1.41
2001 328 85.64% 131 39.94% 36 10.98% 167 50.91% 11 (3.4%) 1.04 1.40 0.36 1.47
2002 249 85.27% 121 48.59% 43 17.27% 164 65.86% 27 (10.8%) 0.80 1.09 0.34 1.24
2003 178 85.17% 95 53.37% 24 13.48% 119 66.85% 10 (5.6%) 0.96 1.16 0.84 1.19
2004 94 83.19% 50 53.19% 16 17.02% 66 70.21% 14 (14.9%) 0.82 1.07 0.34 1.28
2005 85 85.86% 48 56.47% 16 18.82% 64 75.29% 6 (7.1%) 0.99 1.15 0.26 1.24
2006 66 85.71% 29 43.94% 5 7.58% 34 51.52% 9 (13.6%) 0.49 (0.79) 0.67 0.35 0.78
2007 78 78.79% 24 30.77% 6 7.69% 30 38.46% 4 (5.1%) 0.63 (1.07) 0.84 0.11 0.95
2008 159 67.09% 70 44.03% 8 5.03% 78 49.06% 16 (10.1%) 0.92 (1.78) 1.03 0.31 1.22
2009 197 77.25% 112 56.85% 15 7.61% 127 64.47% 39 (19.8%) 0.69 (0.98) 0.83 0.34 1.04
2010 92 75.41% 52 56.52% 4 4.35% 56 60.87% 26 (28.3%) 0.40 (0.74) 0.60 0.23 0.93
2011 61 52.14% 31 50.82% 5 8.20% 36 59.02% 8 (13.1%) 0.66 (0.95) 0.80 0.23 0.97
2012 39 32.77% 19 48.72% 2 5.13% 21 53.85% 13 (33.3%) 0.33 (-) 0.37 0.19 0.65
2013 13 26.53% 11 84.62% 1 0.08 12 92.31% 10 (76.9%) 0.12 (-) 0.16 0.13 0.34
Grand Total
2746 79.36% 1501 54.66% 274 9.98% 1775 64.64% 310 (11.3%) 0.95 (0.97)
1.27 0.34 1.45
*Those years (2006-2011) in parentheses for Median time in bankruptcy include our adjusted estimates for the “Outcome Unknown” category. Average time in bankruptcy is not adjusted. **Prepacks includes pre-packaged and pre-arranged Chapter 11 filings.
21
Figure 6. Chapter 11 Public Firm Bankruptcy Filings (Outcomes and Time in Bankruptcy) (continued) 1978 – 2013: All filings of publicly-held firms: Unsuccessful Results
Net Filings
Liquidated in Chapter 11
Converted to Chapter 7
Converted + Liquidated (Unsuccessful)
Median Time (yrs) in Bankruptcy*
Average Time in Bankruptcy (in years)
Year No. % of Total No. % of Net No. % of Net No. % of Net No. of Prepacks (% of net filings)**
Overall Overall Prepacks Non- Prepacks
1978
1981 4 80.00%
1982 6 100%
1983 4 100%
1984 8 80.00%
1985 21 84.00% 4 19.05% 4 19.05%
1986 23 88.46%
1987 19 82.61% 1 5.26% 2 10.53% 3 15.79% 10.00 10.00 10.00
1988 34 94.44% 1 2.94% 5 14.71% 6 17.65% 5.08 5.08 5.08
1989 55 82.09% 7 12.73% 9 16.36% 16 29.09% 2.40 2.77 2.77
1990 61 72.62% 6 9.84% 11 18.03% 17 27.87% 2.09 4.75 4.75
1991 96 87.27% 11 11.46% 13 13.54% 24 25.00% 2.51 4.49 4.49
1992 71 89.87% 6 8.45% 8 11.27% 14 19.72% 1.20 1.88 1.88
1993 66 94.29% 5 7.58% 7 10.61% 12 18.18% 1 (1.5%) 0.75 0.99 0.12 1.20
1994 53 94.64% 5 9.43% 3 5.66% 8 15.09% 3.27 3.06 3.06
1995 60 88.24% 6 10.00% 9 15.00% 15 25.00% 1.28 2.03 2.03
1996 58 90.63% 8 13.79% 6 10.34% 14 24.14% 1.74 2.36 2.36
1997 57 87.69% 4 7.02% 10 17.54% 14 24.56% 3.22 3.81 3.81
1998 94 86.24% 14 14.89% 23 24.47% 37 39.36% 2.15 3.05 3.05
1999 133 88.67% 33 24.81% 19 14.29% 52 39.10% 1.19 1.75 1.75
2000 197 85.28% 42 21.32% 41 20.81% 83 42.13% 3 (1.5%) 1.93 2.05 0.31 2.09
2001 328 85.64% 85 25.91% 76 23.17% 161 49.09% 1.41 1.67 1.67
2002 249 85.27% 55 22.09% 30 12.05% 85 34.14% 1 (0.4%) 1.29 1.71 0.26 1.74
2003 178 85.17% 38 21.35% 21 11.80% 59 33.15% 1.00 1.39 1.39
2004 94 83.19% 18 19.15% 10 10.64% 28 29.79% 1.33 1.52 1.52
2005 85 85.86% 14 16.47% 7 8.24% 21 24.71% 1.13 1.11 1.11
2006 66 85.71% 20 30.30% 12 18.18% 32 48.48% 0.94 (1.27) 1.41 1.41
2007 78 78.79% 27 34.62% 21 26.92% 48 61.54% 1.15 (1.31) 1.37 1.37
2008 159 67.09% 40 25.16% 41 25.79% 81 50.94% 1.09 (1.93) 1.28 1.28
2009 197 77.25% 49 24.87% 21 10.66% 70 35.53% 2 (1.0%) 0.94 (1.78) 1.21 0.50 1.24
2010 92 75.41% 21 22.83% 15 16.30% 36 39.13% 1 (1.1%) 0.87 (1.30) 0.91 0.91
2011 61 52.14% 14 22.95% 11 18.03% 25 40.98% 0.99 (-) 1.01 1.01
2012 39 32.77% 13 33.33% 5 12.82% 18 46.15% 0.71 (-) 0.75 0.75
2013 13 26.53% 1 7.69% 1 7.69%
Grand Total
2746 79.36% 543 19.77% 441 16.06% 974 35.46% 8 (2.9%) 1.21 (1.26)
1.74 0.34 1.75
*Those years (2006-2011) in parentheses for Median time in bankruptcy include our adjusted estimates for the “Outcome Unknown” category. Average time in bankruptcy is not adjusted. **Prepacks includes pre-packaged and pre-arranged Chapter 11 filings. Source: New Generation Research, Boston Mass; compilation by E. Altman, NYU Salomon Center.

22
Only 8 of the 318 “prepacks” were among these unsuccessful Chapter 11s, and none of these
since 2010.9
An Adjustment For Recidivism to the “Success Rate” of Chapter 11 Reorganizations
As discussed above, we define success of a Chapter 11 reorganization as either an
emergence from the bankruptcy as a continuing entity or an acquisition of the assets of the
debtor. Liquidations under either Chapter 7 or 11 constitute our “unsuccessful” outcomes.
However, as noted in footnote 7 and the earlier discussion, when an emerged entity has to file
again (the recidivism problem) one could conclude that the original Chapter 11 was not very
successful. In order to account for recidivism, we can adjust the 65% success rate for those cases.
Since 1981, through June 2013, there have been approximately 260 cases of a Chapter
22, 33, or 44 among publicly held firms. If we add those 260 multi-filers to the number of
unsuccessful Chapter 11s and subtract from the successful ones, the percentage of successful
Chapter 11s drops to 55.2%. While still a majority of net Chapter 11 filings result in a successful
outcome, the results are less impressive and, in my opinion, can be improved by a more diligent
assessment of the recidivism potential by all parties involved.
Time in Bankruptcy
For all of the “Net Filings” (2,746) since 1981, the median time spent reorganizing or
liquidating was approximately one year (1.02 years). The average time was 1.38 years (16.6
months), with prepacks taking just 0.34 years (4 months), on average, and non-prepacks about
one and a half years (18.4 months). The duration of time spent in bankruptcy is significantly
lower for “successful” Chapter 11s, than for all filings and also less than for “unsuccessful” ones. 9 Three of the 8 unsuccessful prepacks were from the class of 2000.
23
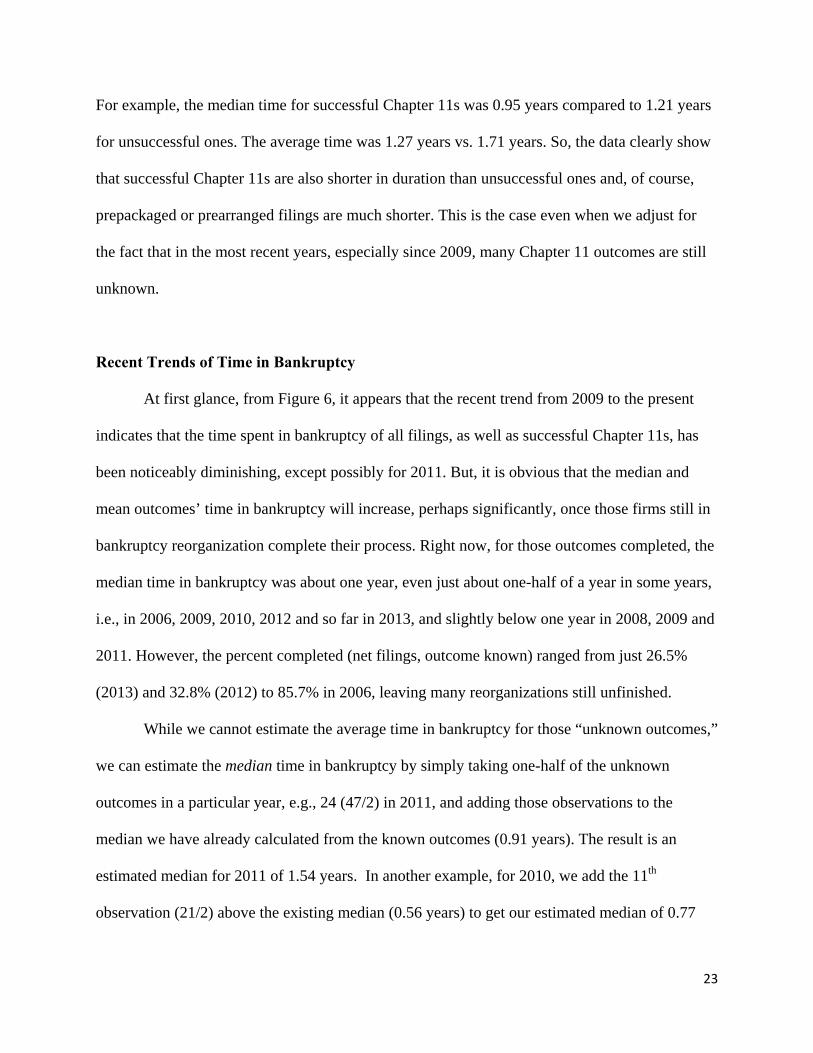
For example, the median time for successful Chapter 11s was 0.95 years compared to 1.21 years
for unsuccessful ones. The average time was 1.27 years vs. 1.71 years. So, the data clearly show
that successful Chapter 11s are also shorter in duration than unsuccessful ones and, of course,
prepackaged or prearranged filings are much shorter. This is the case even when we adjust for
the fact that in the most recent years, especially since 2009, many Chapter 11 outcomes are still
unknown.
Recent Trends of Time in Bankruptcy
At first glance, from Figure 6, it appears that the recent trend from 2009 to the present
indicates that the time spent in bankruptcy of all filings, as well as successful Chapter 11s, has
been noticeably diminishing, except possibly for 2011. But, it is obvious that the median and
mean outcomes’ time in bankruptcy will increase, perhaps significantly, once those firms still in
bankruptcy reorganization complete their process. Right now, for those outcomes completed, the
median time in bankruptcy was about one year, even just about one-half of a year in some years,
i.e., in 2006, 2009, 2010, 2012 and so far in 2013, and slightly below one year in 2008, 2009 and
2011. However, the percent completed (net filings, outcome known) ranged from just 26.5%
(2013) and 32.8% (2012) to 85.7% in 2006, leaving many reorganizations still unfinished.
While we cannot estimate the average time in bankruptcy for those “unknown outcomes,”
we can estimate the median time in bankruptcy by simply taking one-half of the unknown
outcomes in a particular year, e.g., 24 (47/2) in 2011, and adding those observations to the
median we have already calculated from the known outcomes (0.91 years). The result is an
estimated median for 2011 of 1.54 years. In another example, for 2010, we add the 11th
observation (21/2) above the existing median (0.56 years) to get our estimated median of 0.77
24
years. All of the adjustments are in parentheses for the period 2006-2011. When we perform this
estimate for the years 2006-2011 (we cannot as yet do this for 2012 and 2013 due to insufficient
known observations), we get a revised median time in bankruptcy for the entire time series of
1.04 years. When we finally are able to assess those reorganizations from 2012/2013, the median
time overall will increase but more than likely to no more than 1.06 years (12.7 months).
If we analyze the trend since the new Bankruptcy Code was put in place in late 2005
(2006-2013), we do observe a small reduction (perhaps one month) in the time in bankruptcy,
except in 2008 and 2011. This is to be expected since the new Code established a cap of 18
months in which a debtor has the exclusive right to file a plan that then needs to be ratified by the
various creditor classes. Again, we are not able to completely assess the results for 2012/2013.
The percentage of Chapter 11 filings that have been completed with a successful result
seems to be diminishing slightly in the period 2010-2012 compared to the longer-time median
over the period 1981-2012. For example, the percent of successful outcomes were 60.9%, 59.0%,
and 53.9% in 2010, 2011 and 2012, respectively, of the known outcomes, and only 51.5%,
38.5% and 49.1% in 2006-2008, compared to about 65.0% for the entire period, 1978-2013.
Assuming that the proportion of successful vs. unsuccessful outcomes will not change from the
already calculated means, once the unknown cases become known, the proportion of successful
outcomes will probably decrease slightly from what appears now in Figure 6.
Results for Larger Chapter 11 Filings
The results reported above are for all Chapter 11 filings of publicly-held firms and
number 3,460 events. Of those, 1,760 were for firms with total assets greater than $100 million
(about 50%). Next, we will observe if the results discussed above for all filings, regardless of
25
size, vary at all for larger Chapter 11s. We do have several expectations, or hypotheses, with
respect to larger vs. smaller corporate bankruptcies on such issues as case dismissals, whether the
outcome becomes known or not, whether the outcome of a reorganization in bankruptcy will be
successful or not and time that these filings spend in the bankruptcy process.
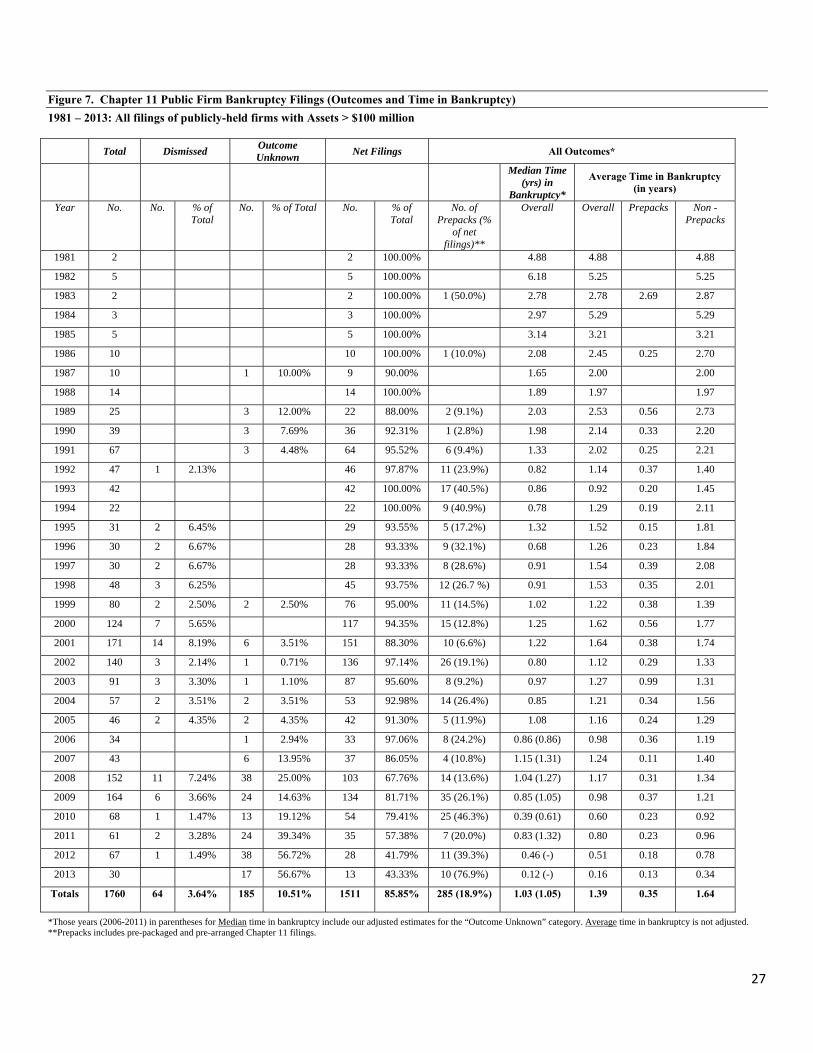
Figure 7 lists the results of bankruptcy filings of firms with at least $100 million in assets
at the time of filings from 1981-2013. While we believe that, in many ways, total liabilities is a
more meaningful measure of corporate size when it comes to a bankrupt firm, total assets is also
a reasonable metric in many cases and, more importantly, is the one used by New Generation
Research in their categorization of bankruptcy statistics. As noted above, about half of all filings
of publicly-held firms were for firms with at least $100 million in assets since the Bankruptcy
Act of 1938.
Dismissals and Unknown Outcomes
Comparing our results for all filings in Figure 6 with those for the larger-firm sample in
Figure 7, we find, not surprisingly, that a smaller proportion of the gross filings (1760 firms)
were Dismissed (3.6%) or the outcome is Unknown at this time (10.5%), for a total of 14.1%, vs.
about 20.4% for all filings (7.3% + 12.9%). It is reasonable that firms with more substantial
assets have a better chance of moving ahead in the bankruptcy reorganization process than do
smaller entities and it is more likely that the proceedings will be more easily traced as to the
outcome. The latter may not be the case for the most recent filings in 2011-2013, which simply
have not had enough time to finish the process, except in the case of Prepacks. A prepackaged or
prearranged filing is far more likely for larger firms than smaller ones. Indeed, for the entire time
series from 1981-2013, 285 of the 318 Prepacks (89.6%) were from our larger firm sample.
26
Indeed, all but five (5) of the 99 Prepacks since 2009 are from firms with assets greater than
$100 million. So, for these firms, the outcome is essentially always known.
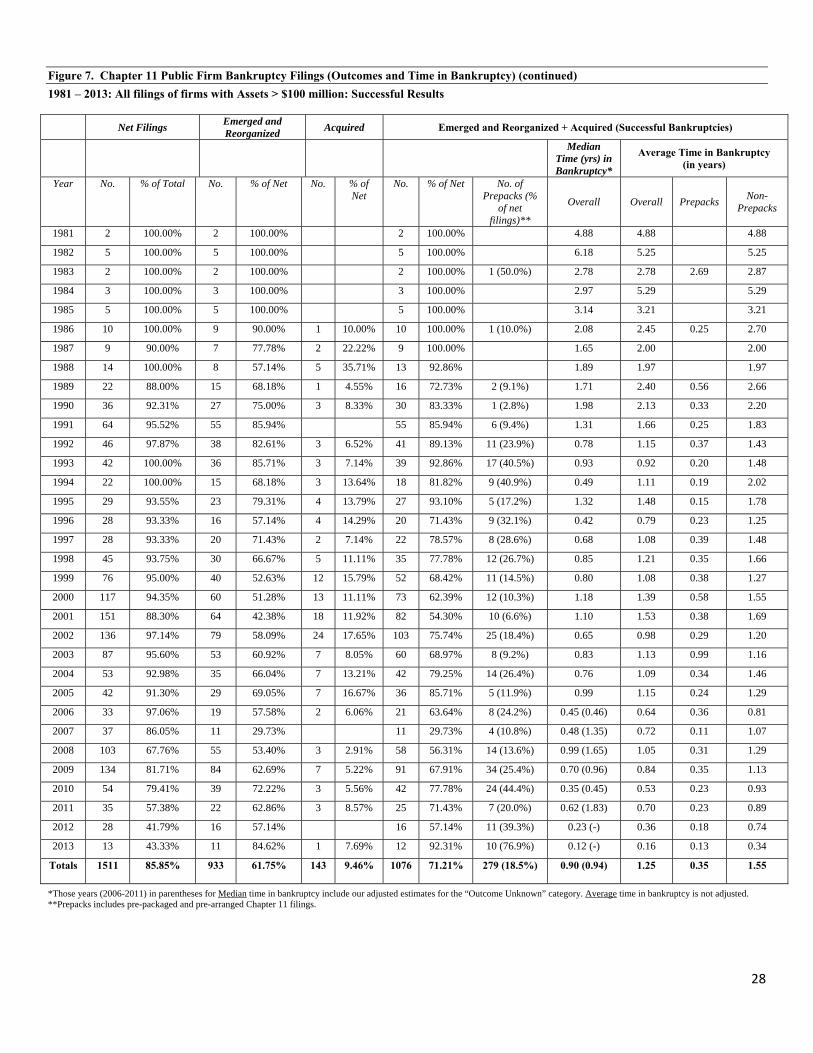
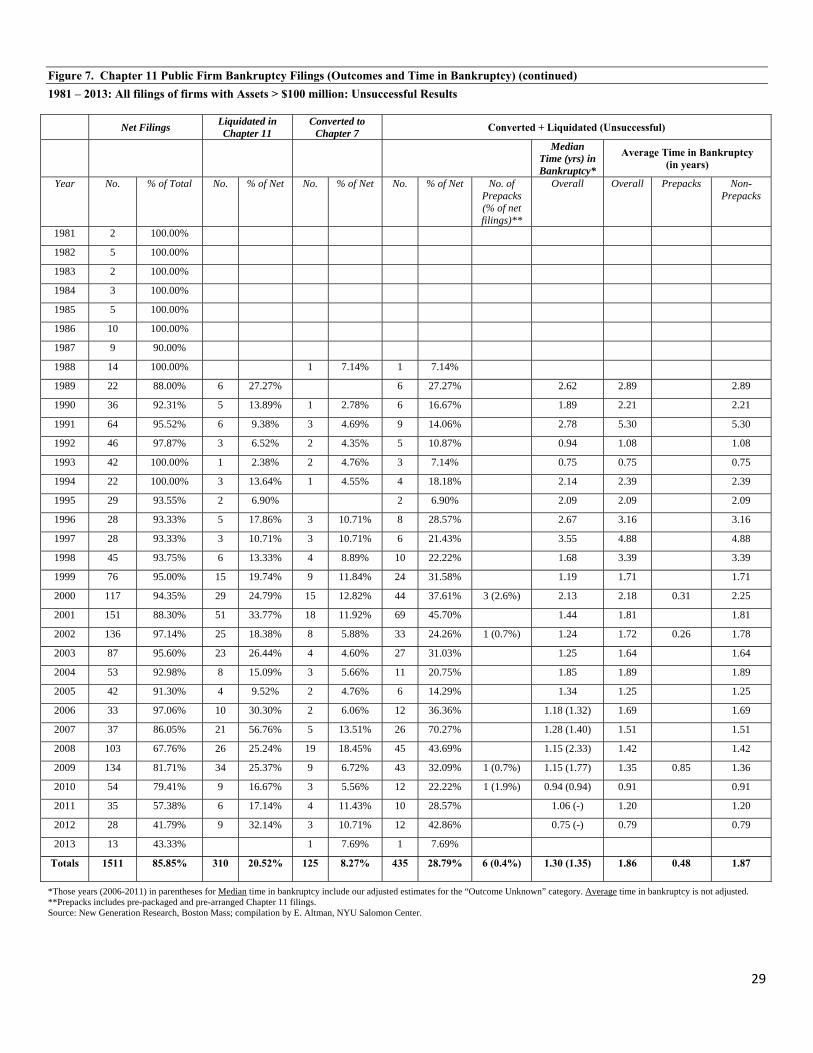
Successful vs. Unsuccessful Outcomes
We observe that 71.2% of the Net Filings result in a successful outcome (1,076/1,511) for
firms with assets >$100 million vs. just 64.64% (974/2,746) for all firms. The differential is, of
course, considerably greater when you compare those successful filings with less than $100
million (56.62%) vs. those >$100 million in assets (71.21%). The opposite is the case with
respect to unsuccessful Chapter 11s by size of firm, with only 28.8% unsuccessful for larger
firms vs. 43.4% for smaller publicly-held entities. Recall that our definition of a successful
Chapter 11 is either a reorganization that ends in an emerged firm or the debtor is acquired. The
unsuccessful process is either a filing converted into a Chapter 7 liquidation or a liquidation
under Chapter 11.
Time in Bankruptcy
While we find distinct differences for several of our metrics between larger and smaller
firm Chapter 11s, the time in bankruptcy metric is very similar across the firms of different size.
Indeed, the adjusted median time in bankruptcy for all outcomes, whether successful or not, was
essentially the same for all filings (1.04 years, Figure 6) vs. 1.05 years for firms with assets
greater than $100 million (Figure 7). Average (not median) time in bankruptcy was slightly
longer for the larger firms for both Prepacks (0.35 years) and Non-Prepacks (1.64 years).
27
Figure 7. Chapter 11 Public Firm Bankruptcy Filings (Outcomes and Time in Bankruptcy) 1981 – 2013: All filings of publicly-held firms with Assets > $100 million
Total Dismissed Outcome Unknown Net Filings All Outcomes*
Median Time (yrs) in
Bankruptcy*
Average Time in Bankruptcy (in years)
Year No. No. % of Total
No. % of Total No. % of Total
No. of Prepacks (%
of net filings)**
Overall Overall Prepacks Non -Prepacks
1981 2 2 100.00% 4.88 4.88 4.88
1982 5 5 100.00% 6.18 5.25 5.25
1983 2 2 100.00% 1 (50.0%) 2.78 2.78 2.69 2.87
1984 3 3 100.00% 2.97 5.29 5.29
1985 5 5 100.00% 3.14 3.21 3.21
1986 10 10 100.00% 1 (10.0%) 2.08 2.45 0.25 2.70
1987 10 1 10.00% 9 90.00% 1.65 2.00 2.00
1988 14 14 100.00% 1.89 1.97 1.97
1989 25 3 12.00% 22 88.00% 2 (9.1%) 2.03 2.53 0.56 2.73
1990 39 3 7.69% 36 92.31% 1 (2.8%) 1.98 2.14 0.33 2.20
1991 67 3 4.48% 64 95.52% 6 (9.4%) 1.33 2.02 0.25 2.21
1992 47 1 2.13% 46 97.87% 11 (23.9%) 0.82 1.14 0.37 1.40
1993 42 42 100.00% 17 (40.5%) 0.86 0.92 0.20 1.45
1994 22 22 100.00% 9 (40.9%) 0.78 1.29 0.19 2.11
1995 31 2 6.45% 29 93.55% 5 (17.2%) 1.32 1.52 0.15 1.81
1996 30 2 6.67% 28 93.33% 9 (32.1%) 0.68 1.26 0.23 1.84
1997 30 2 6.67% 28 93.33% 8 (28.6%) 0.91 1.54 0.39 2.08
1998 48 3 6.25% 45 93.75% 12 (26.7 %) 0.91 1.53 0.35 2.01
1999 80 2 2.50% 2 2.50% 76 95.00% 11 (14.5%) 1.02 1.22 0.38 1.39
2000 124 7 5.65% 117 94.35% 15 (12.8%) 1.25 1.62 0.56 1.77
2001 171 14 8.19% 6 3.51% 151 88.30% 10 (6.6%) 1.22 1.64 0.38 1.74
2002 140 3 2.14% 1 0.71% 136 97.14% 26 (19.1%) 0.80 1.12 0.29 1.33
2003 91 3 3.30% 1 1.10% 87 95.60% 8 (9.2%) 0.97 1.27 0.99 1.31
2004 57 2 3.51% 2 3.51% 53 92.98% 14 (26.4%) 0.85 1.21 0.34 1.56
2005 46 2 4.35% 2 4.35% 42 91.30% 5 (11.9%) 1.08 1.16 0.24 1.29
2006 34 1 2.94% 33 97.06% 8 (24.2%) 0.86 (0.86) 0.98 0.36 1.19
2007 43 6 13.95% 37 86.05% 4 (10.8%) 1.15 (1.31) 1.24 0.11 1.40
2008 152 11 7.24% 38 25.00% 103 67.76% 14 (13.6%) 1.04 (1.27) 1.17 0.31 1.34
2009 164 6 3.66% 24 14.63% 134 81.71% 35 (26.1%) 0.85 (1.05) 0.98 0.37 1.21
2010 68 1 1.47% 13 19.12% 54 79.41% 25 (46.3%) 0.39 (0.61) 0.60 0.23 0.92
2011 61 2 3.28% 24 39.34% 35 57.38% 7 (20.0%) 0.83 (1.32) 0.80 0.23 0.96
2012 67 1 1.49% 38 56.72% 28 41.79% 11 (39.3%) 0.46 (-) 0.51 0.18 0.78
2013 30 17 56.67% 13 43.33% 10 (76.9%) 0.12 (-) 0.16 0.13 0.34
Totals 1760
64 3.64% 185 10.51% 1511 85.85% 285 (18.9%) 1.03 (1.05)
1.39 0.35 1.64
*Those years (2006-2011) in parentheses for Median time in bankruptcy include our adjusted estimates for the “Outcome Unknown” category. Average time in bankruptcy is not adjusted. **Prepacks includes pre-packaged and pre-arranged Chapter 11 filings.
28
Figure 7. Chapter 11 Public Firm Bankruptcy Filings (Outcomes and Time in Bankruptcy) (continued) 1981 – 2013: All filings of firms with Assets > $100 million: Successful Results
Net Filings Emerged and Reorganized Acquired Emerged and Reorganized + Acquired (Successful Bankruptcies)
Median Time (yrs) in Bankruptcy*
Average Time in Bankruptcy (in years)
Year No. % of Total No. % of Net No. % of Net
No. % of Net No. of Prepacks (%
of net filings)**
Overall Overall Prepacks Non- Prepacks
1981 2 100.00% 2 100.00% 2 100.00% 4.88 4.88 4.88
1982 5 100.00% 5 100.00% 5 100.00% 6.18 5.25 5.25
1983 2 100.00% 2 100.00% 2 100.00% 1 (50.0%) 2.78 2.78 2.69 2.87
1984 3 100.00% 3 100.00% 3 100.00% 2.97 5.29 5.29
1985 5 100.00% 5 100.00% 5 100.00% 3.14 3.21 3.21
1986 10 100.00% 9 90.00% 1 10.00% 10 100.00% 1 (10.0%) 2.08 2.45 0.25 2.70
1987 9 90.00% 7 77.78% 2 22.22% 9 100.00% 1.65 2.00 2.00
1988 14 100.00% 8 57.14% 5 35.71% 13 92.86% 1.89 1.97 1.97
1989 22 88.00% 15 68.18% 1 4.55% 16 72.73% 2 (9.1%) 1.71 2.40 0.56 2.66
1990 36 92.31% 27 75.00% 3 8.33% 30 83.33% 1 (2.8%) 1.98 2.13 0.33 2.20
1991 64 95.52% 55 85.94% 55 85.94% 6 (9.4%) 1.31 1.66 0.25 1.83
1992 46 97.87% 38 82.61% 3 6.52% 41 89.13% 11 (23.9%) 0.78 1.15 0.37 1.43
1993 42 100.00% 36 85.71% 3 7.14% 39 92.86% 17 (40.5%) 0.93 0.92 0.20 1.48
1994 22 100.00% 15 68.18% 3 13.64% 18 81.82% 9 (40.9%) 0.49 1.11 0.19 2.02
1995 29 93.55% 23 79.31% 4 13.79% 27 93.10% 5 (17.2%) 1.32 1.48 0.15 1.78
1996 28 93.33% 16 57.14% 4 14.29% 20 71.43% 9 (32.1%) 0.42 0.79 0.23 1.25
1997 28 93.33% 20 71.43% 2 7.14% 22 78.57% 8 (28.6%) 0.68 1.08 0.39 1.48
1998 45 93.75% 30 66.67% 5 11.11% 35 77.78% 12 (26.7%) 0.85 1.21 0.35 1.66
1999 76 95.00% 40 52.63% 12 15.79% 52 68.42% 11 (14.5%) 0.80 1.08 0.38 1.27
2000 117 94.35% 60 51.28% 13 11.11% 73 62.39% 12 (10.3%) 1.18 1.39 0.58 1.55
2001 151 88.30% 64 42.38% 18 11.92% 82 54.30% 10 (6.6%) 1.10 1.53 0.38 1.69
2002 136 97.14% 79 58.09% 24 17.65% 103 75.74% 25 (18.4%) 0.65 0.98 0.29 1.20
2003 87 95.60% 53 60.92% 7 8.05% 60 68.97% 8 (9.2%) 0.83 1.13 0.99 1.16
2004 53 92.98% 35 66.04% 7 13.21% 42 79.25% 14 (26.4%) 0.76 1.09 0.34 1.46
2005 42 91.30% 29 69.05% 7 16.67% 36 85.71% 5 (11.9%) 0.99 1.15 0.24 1.29
2006 33 97.06% 19 57.58% 2 6.06% 21 63.64% 8 (24.2%) 0.45 (0.46) 0.64 0.36 0.81
2007 37 86.05% 11 29.73% 11 29.73% 4 (10.8%) 0.48 (1.35) 0.72 0.11 1.07
2008 103 67.76% 55 53.40% 3 2.91% 58 56.31% 14 (13.6%) 0.99 (1.65) 1.05 0.31 1.29
2009 134 81.71% 84 62.69% 7 5.22% 91 67.91% 34 (25.4%) 0.70 (0.96) 0.84 0.35 1.13
2010 54 79.41% 39 72.22% 3 5.56% 42 77.78% 24 (44.4%) 0.35 (0.45) 0.53 0.23 0.93
2011 35 57.38% 22 62.86% 3 8.57% 25 71.43% 7 (20.0%) 0.62 (1.83) 0.70 0.23 0.89
2012 28 41.79% 16 57.14% 16 57.14% 11 (39.3%) 0.23 (-) 0.36 0.18 0.74
2013 13 43.33% 11 84.62% 1 7.69% 12 92.31% 10 (76.9%) 0.12 (-) 0.16 0.13 0.34
Totals 1511 85.85% 933 61.75% 143 9.46% 1076 71.21% 279 (18.5%) 0.90 (0.94)
1.25 0.35 1.55
*Those years (2006-2011) in parentheses for Median time in bankruptcy include our adjusted estimates for the “Outcome Unknown” category. Average time in bankruptcy is not adjusted. **Prepacks includes pre-packaged and pre-arranged Chapter 11 filings.
29
Figure 7. Chapter 11 Public Firm Bankruptcy Filings (Outcomes and Time in Bankruptcy) (continued) 1981 – 2013: All filings of firms with Assets > $100 million: Unsuccessful Results
Net Filings Liquidated in Chapter 11
Converted to Chapter 7 Converted + Liquidated (Unsuccessful)
Median Time (yrs) in Bankruptcy*
Average Time in Bankruptcy (in years)
Year No. % of Total No. % of Net No. % of Net No. % of Net No. of Prepacks (% of net filings)**
Overall Overall Prepacks Non- Prepacks
1981 2 100.00%
1982 5 100.00%
1983 2 100.00%
1984 3 100.00%
1985 5 100.00%
1986 10 100.00%
1987 9 90.00%
1988 14 100.00% 1 7.14% 1 7.14%
1989 22 88.00% 6 27.27% 6 27.27% 2.62 2.89 2.89
1990 36 92.31% 5 13.89% 1 2.78% 6 16.67% 1.89 2.21 2.21
1991 64 95.52% 6 9.38% 3 4.69% 9 14.06% 2.78 5.30 5.30
1992 46 97.87% 3 6.52% 2 4.35% 5 10.87% 0.94 1.08 1.08
1993 42 100.00% 1 2.38% 2 4.76% 3 7.14% 0.75 0.75 0.75
1994 22 100.00% 3 13.64% 1 4.55% 4 18.18% 2.14 2.39 2.39
1995 29 93.55% 2 6.90% 2 6.90% 2.09 2.09 2.09
1996 28 93.33% 5 17.86% 3 10.71% 8 28.57% 2.67 3.16 3.16
1997 28 93.33% 3 10.71% 3 10.71% 6 21.43% 3.55 4.88 4.88
1998 45 93.75% 6 13.33% 4 8.89% 10 22.22% 1.68 3.39 3.39
1999 76 95.00% 15 19.74% 9 11.84% 24 31.58% 1.19 1.71 1.71
2000 117 94.35% 29 24.79% 15 12.82% 44 37.61% 3 (2.6%) 2.13 2.18 0.31 2.25
2001 151 88.30% 51 33.77% 18 11.92% 69 45.70% 1.44 1.81 1.81
2002 136 97.14% 25 18.38% 8 5.88% 33 24.26% 1 (0.7%) 1.24 1.72 0.26 1.78
2003 87 95.60% 23 26.44% 4 4.60% 27 31.03% 1.25 1.64 1.64
2004 53 92.98% 8 15.09% 3 5.66% 11 20.75% 1.85 1.89 1.89
2005 42 91.30% 4 9.52% 2 4.76% 6 14.29% 1.34 1.25 1.25
2006 33 97.06% 10 30.30% 2 6.06% 12 36.36% 1.18 (1.32) 1.69 1.69
2007 37 86.05% 21 56.76% 5 13.51% 26 70.27% 1.28 (1.40) 1.51 1.51
2008 103 67.76% 26 25.24% 19 18.45% 45 43.69% 1.15 (2.33) 1.42 1.42
2009 134 81.71% 34 25.37% 9 6.72% 43 32.09% 1 (0.7%) 1.15 (1.77) 1.35 0.85 1.36
2010 54 79.41% 9 16.67% 3 5.56% 12 22.22% 1 (1.9%) 0.94 (0.94) 0.91 0.91
2011 35 57.38% 6 17.14% 4 11.43% 10 28.57% 1.06 (-) 1.20 1.20
2012 28 41.79% 9 32.14% 3 10.71% 12 42.86% 0.75 (-) 0.79 0.79
2013 13 43.33% 1 7.69% 1 7.69%
Totals 1511 85.85% 310 20.52% 125 8.27% 435 28.79% 6 (0.4%) 1.30 (1.35)
1.86 0.48 1.87
*Those years (2006-2011) in parentheses for Median time in bankruptcy include our adjusted estimates for the “Outcome Unknown” category. Average time in bankruptcy is not adjusted. **Prepacks includes pre-packaged and pre-arranged Chapter 11 filings. Source: New Generation Research, Boston Mass; compilation by E. Altman, NYU Salomon Center.
30
Mega Bankruptcies
Earlier in this paper, we observed in Figure 4 that about 20% of all “large” Chapter 11 filings with
liabilities greater than $100 million from 1989-2013 were truly huge with liabilities greater than $1
billion. We also saw, in Figures 6 and 7, that about half of all filings since 1981 had assets greater than
$100 million (1,760 out of a total of 3,460 total gross filings of all sizes). In order to focus on a segment
of all filings that we now call “mega-bankruptcies,” with assets greater than $500 million, we see that
since 1981 there has been 701 of these very large filings, or 20% of all filings, and about 40% of those
greater than $100 million in assets. We list these results in Appendix A.
We observe from Appendix A that about 86.5% of the mega-bankruptcies since 1981 have
outcomes that are known (net filings) where most of the unknown outcomes are naturally since 2008, and
especially since 2011. Of the 606 net filings, the median (unadjusted) time in bankruptcy is somewhat
longer (1.10 years) than for both all filings (1.03 years) and those greater than $100 million in assets (1.03
years). The adjusted median time in bankruptcy for our mega sample is also somewhat longer (1.19 years)
than the smaller size samples. Likewise, the average time in bankruptcy for all mega-bankruptcies (1.47
years or 17.6 months) is longer than the greater than $100 million asset sample (1.38 years). These results
are not surprising since larger bankruptcies are more complex, oftentimes involving both public and
private creditors and shareholders. Keep in mind that regardless of the creditor profiles, all of our
observations, regardless of size, are for publicly owned enterprises.
Interestingly, 20.3% of all net filings (123/606) were either prepackaged or prearranged Chapter
11s for our mega-bankruptcy sample, compared to 18.9% for the >$100 million asset sample and 11.6%
for all Chapter 11 filings. I had expected an even higher proportion for the mega filings. Indeed, 6 of 14
(43%) of the 2013 (through June 30) mega sample are “prepacks,” with the consequent shorter time in
bankruptcy (0.31 year) for all 123 prepacks since 1989 amongst mega-bankruptcies.
31
The “successful” Chapter 11 mega-bankruptcies were 78.4%, compared to 71.2% for those filings
with assets greater than $100 million and 64.6% for all filings, regardless of size.
For the successful Chapter 11s amongst the largest mega-bankruptcy sample, the median time in
bankruptcy was slightly longer (1.04 years) than for the >$100 million (0.90 years), with the same
comparison for average time in bankruptcy (1.36 years vs. 1.25 years). Again, the complexity factor, no
doubt, affected these differences.
Finally, since the new revisions to the Code went into effect in late 2005, the proportion of mega-
bankruptcies, relative to the entire sample from 1981-2013, was about the same 37.4% (262/701)
compared to the >$100 million in asset sample (35.2%, 619/1760). And, there is no evidence that the time
in bankruptcy since 2005 is getting shorter. Indeed, the median time in bankruptcy for three of the years,
2006 (1.20 years), 2008 (1.44 years), and 2011 (1.49 years) was greater than the median for the entire
sample (1.19 years); three years (2007,2009 and 2010) were shorter and it is too early to tell for the last
two years (2012 and 2013).
Creditor Recoveries
One important indicator of the effectiveness of the Bankruptcy process, and the relative influence
of the various stakeholders in the process, is the default recovery rate, especially if we evaluate recoveries
by seniority over time. There are two main types of recoveries to creditors - the value of the outstanding
securities just after default/bankruptcy and the value when the
reorganization process is completed. The latter is often referred to as the “ultimate recovery” in the
emergence-year from bankruptcy. One can also postulate that the value of corporate bonds and loans at
the time of bankruptcy is an unbiased estimate of the present value of the ultimate recovery, although one
of the important unknowns is the expected time in bankruptcy. Earlier,
32
we showed that the expected time for non-prepackaged Chapter 11s is about one and a half years and for
prepacks, about four months.
A relevant and also somewhat controversial aspect of the revised Bankruptcy Code is the relative
influence of some creditors vs. other creditor classes and debtors in the bankruptcy reorganization
process. The U.S. Corporate Bankruptcy process has for a long time been known as relatively more
debtor-friendly compared to other countries’ bankruptcy experience as well as when compared to earlier
years in the 20th century. That perception has changed somewhat with the revisions to the Bankruptcy
Code in the BAPCPA Act of 2005, and the pendulum, it is alleged by some, has swung toward the
creditor, particularly the secured creditor, in the U.S. In other countries, however, particularly European
nations, Bankruptcy revisions seem to have shifted toward being more debtor-friendly as many countries,
e.g., Germany, France, and Italy, have adopted new provisions similar to the U.S. Chapter 11 system.10
One study by Wood (2011) argued that there was a significant decline in the recoveries to unsecured
creditors and shareholders in large public company bankruptcies in 2009/2010 in the aftermath of great
financial crisis of 2008, compared to a long-ago period of 1991-1996. Based on a relatively small sample
of 42 Chapter 11 cases that emerged in the two years, noted above, his results were compared to those
recorded by LoPucki (2004) essentially following the earlier study’s methodology. Wood does note that
one should expect reduced recoveries during and just after a recession since they do fluctuate over time (I
will demonstrate this quite clearly below), and he concluded that the 2009/2010 results could be “an
anomaly” (p.430). But, the author goes on to suggest that due to significantly higher actual and expected
recoveries to senior secured creditors, particularly due to second and third lien securities growth, that
unsecured creditors and equity holders “should not expect significant recoveries in Chapter 11 cases.” I
will return to this line of reasoning and conclusion shortly. But, I find no conclusive evidence that senior 10 For example, a recent conference in Florence, Italy (May 28, 2013) on “Comparing Chapter 11 in the U.S. to the new Italian Bankruptcy Code” sponsored by the city of Florence and the CESIFIN Foundation, explored those issues now that the Italian Bankruptcy system adopted significant changes in September 2012.
33
secured bondholders have received consistently higher recoveries to the detriment of unsecured creditors
since the new Code went into effect in late 2005, and since the recession of 2008/2009. Essentially, both
classes of creditors usually receive above average recoveries in benign credit periods, e.g., low default
rates, and below average recoveries in stressed economic and default periods. And, there have been
periods when recoveries have increased for unsecured creditors when those for secured creditors have
declined!
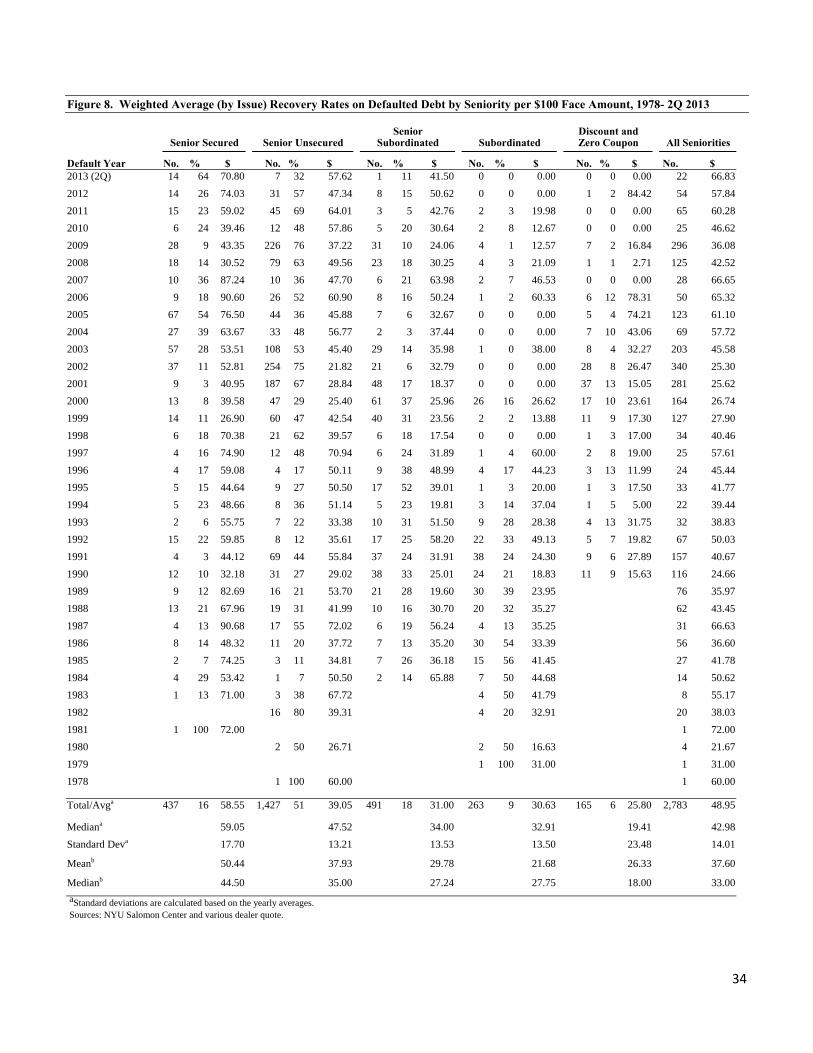
Figure 8 shows the time series of default recoveries by seniority of bond creditor claims at the
time of default from 1978-2013 (Q2). Not surprisingly, the median annual recovery rate on
senior secured bonds (59.05%)11 is greater than senior unsecured (47.52%), than senior-subordinated
(34.00%) and subordinated (32.91%). Effectively, the last category has
disappeared, of late, and even the senior-subordinated claim has become a rare occurrence.
At first glance, it appears that in most years since the enactment of the recent Code in 2005, the
recovery rate on the senior secured category is greater than the historic average, or median, of 59%. This
is also the case, for the senior unsecured claims. One cannot jump to the conclusion, however, that the
most senior claimants have been favored by the new Code since many of these recent years are coincident
with benign credit periods (e.g., 2006/2007 and 2011-2013). We have established that recovery rates are
substantially influenced by the credit cycle and default rates (see Altman, Brady, Resti and Sironi, 2005).
Thus, in benign periods like 2006/2007 and 2011-2013, we should expect high recoveries across the board
of the seniority spectrum and the reverse during stressed period, like 2008/2009, when recovery rates
were, as expected, below the norm.
11 The median for senior secured creditor recoveries was somewhat less, at 50.2%, when it is calculated based on all recoveries rather than the median of each year’s average. The other classes’ recoveries are essentially the same, regardless of the calculation method.
34
Figure 8. Weighted Average (by Issue) Recovery Rates on Defaulted Debt by Seniority per $100 Face Amount, 1978- 2Q 2013
Senior Secured Senior Unsecured Senior
Subordinated Subordinated Discount and Zero Coupon All Seniorities
Default Year No. % $ No. % $ No. % $ No. % $ No. % $ No. $ 2013 (2Q) 14 64 70.80 7 32 57.62 1 11 41.50 0 0 0.00 0 0 0.00 22 66.832012 14 26 74.03 31 57 47.34 8 15 50.62 0 0 0.00 1 2 84.42 54 57.842011 15 23 59.02 45 69 64.01 3 5 42.76 2 3 19.98 0 0 0.00 65 60.282010 6 24 39.46 12 48 57.86 5 20 30.64 2 8 12.67 0 0 0.00 25 46.622009 28 9 43.35 226 76 37.22 31 10 24.06 4 1 12.57 7 2 16.84 296 36.082008 18 14 30.52 79 63 49.56 23 18 30.25 4 3 21.09 1 1 2.71 125 42.522007 10 36 87.24 10 36 47.70 6 21 63.98 2 7 46.53 0 0 0.00 28 66.652006 9 18 90.60 26 52 60.90 8 16 50.24 1 2 60.33 6 12 78.31 50 65.322005 67 54 76.50 44 36 45.88 7 6 32.67 0 0 0.00 5 4 74.21 123 61.102004 27 39 63.67 33 48 56.77 2 3 37.44 0 0 0.00 7 10 43.06 69 57.722003 57 28 53.51 108 53 45.40 29 14 35.98 1 0 38.00 8 4 32.27 203 45.582002 37 11 52.81 254 75 21.82 21 6 32.79 0 0 0.00 28 8 26.47 340 25.302001 9 3 40.95 187 67 28.84 48 17 18.37 0 0 0.00 37 13 15.05 281 25.622000 13 8 39.58 47 29 25.40 61 37 25.96 26 16 26.62 17 10 23.61 164 26.741999 14 11 26.90 60 47 42.54 40 31 23.56 2 2 13.88 11 9 17.30 127 27.901998 6 18 70.38 21 62 39.57 6 18 17.54 0 0 0.00 1 3 17.00 34 40.461997 4 16 74.90 12 48 70.94 6 24 31.89 1 4 60.00 2 8 19.00 25 57.611996 4 17 59.08 4 17 50.11 9 38 48.99 4 17 44.23 3 13 11.99 24 45.441995 5 15 44.64 9 27 50.50 17 52 39.01 1 3 20.00 1 3 17.50 33 41.771994 5 23 48.66 8 36 51.14 5 23 19.81 3 14 37.04 1 5 5.00 22 39.441993 2 6 55.75 7 22 33.38 10 31 51.50 9 28 28.38 4 13 31.75 32 38.831992 15 22 59.85 8 12 35.61 17 25 58.20 22 33 49.13 5 7 19.82 67 50.031991 4 3 44.12 69 44 55.84 37 24 31.91 38 24 24.30 9 6 27.89 157 40.671990 12 10 32.18 31 27 29.02 38 33 25.01 24 21 18.83 11 9 15.63 116 24.661989 9 12 82.69 16 21 53.70 21 28 19.60 30 39 23.95 76 35.971988 13 21 67.96 19 31 41.99 10 16 30.70 20 32 35.27 62 43.451987 4 13 90.68 17 55 72.02 6 19 56.24 4 13 35.25 31 66.631986 8 14 48.32 11 20 37.72 7 13 35.20 30 54 33.39 56 36.601985 2 7 74.25 3 11 34.81 7 26 36.18 15 56 41.45 27 41.781984 4 29 53.42 1 7 50.50 2 14 65.88 7 50 44.68 14 50.621983 1 13 71.00 3 38 67.72 4 50 41.79 8 55.171982 16 80 39.31 4 20 32.91 20 38.031981 1 100 72.00 1 72.001980 2 50 26.71 2 50 16.63 4 21.671979 1 100 31.00 1 31.001978 1 100 60.00 1 60.00
Total/Avga 437 16 58.55 1,427 51 39.05 491 18 31.00 263 9 30.63 165 6 25.80 2,783 48.95
Mediana 59.05 47.52 34.00 32.91 19.41 42.98Standard Deva
17.70 13.21 13.53 13.50 23.48 14.01
Meanb 50.44 37.93 29.78 21.68 26.33 37.60
Medianb 44.50 35.00 27.24 27.75 18.00 33.00 aStandard deviations are calculated based on the yearly averages. Sources: NYU Salomon Center and various dealer quote.

35
36
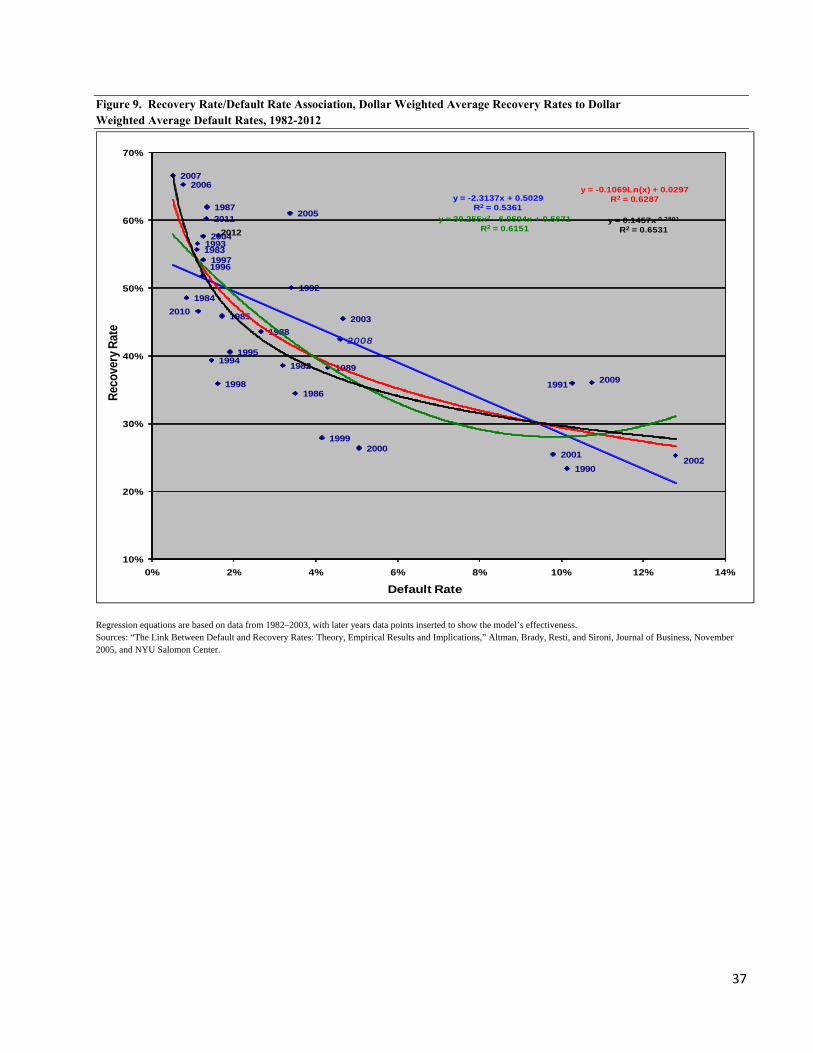
In order to assess whether the recovery rate on high-yield corporate defaults has been different in
the years since the Bankruptcy Code was revised in late 2005, we can observe the trend-line-
regression analytic results from our default rate-recovery rate model of 2005 (Altman, et.al,
2005), updated for data through 2012 in Figure 9. Note that the recovery rate used in this model
is the weighted-average price of defaults just after the default date - - not the ultimate recovery
rate. Essentially, these linear and non-linear representations show the “expected” relationship
between default and recovery rates, based on data since 1982. So, if we observe consistent
patterns of above (or below) expected recovery rates on creditor securities in recent years, we
can conclude that bond creditors, in this case, are doing better than what one would have
expected given the typical demand-supply induced relationship. From Figure 9, we can observe
that the weighted average recovery rate on corporate bond defaults in every year since 2005, with
the exceptions of 2008 and 2010, has been higher than one would have expected from the longer
term historical relationship between default and recovery rates. In 2008, the recovery rate
(42.5%) was just about what one should expect in an average default year. And in 2010, the
recovery rate (46.6%) was slightly below what one could expect in a benign, low default rate
year. Since 2010, and continuing into 2013, the recovery rates have been above expectations, as
they also were in 2006/2007. Even in 2009, when the recovery rate was “only” 36%, it was
above what one normally recovers in very stressful years; in this case when the default rate was
the second highest ever, almost 11% (see Altman & Kuehne, 2013 for a more complete analysis
of default and recovery rates in the high-yield bond market).12
12 In order to see if these relationships hold across the seniority spectrum, we plan to run similar regressions of the relationship between default and recovery rates.
37
Figure 9. Recovery Rate/Default Rate Association, Dollar Weighted Average Recovery Rates to Dollar Weighted Average Default Rates, 1982-2012
2005
2004
2003
20022001
20001999
1998
19971996
19951994
1993
1992
1991
1990
1989
1988
1987
1986
1985
1984
1983
1982
20062007
2008
2009
2010
20112012
y = -2.3137x + 0.5029R2 = 0.5361
y = -0.1069Ln(x) + 0.0297R2 = 0.6287
y = 30.255x2 - 6.0594x + 0.5671R2 = 0.6151
y = 0.1457x-0.2801
R2 = 0.6531
10%
20%
30%
40%
50%
60%
70%
0% 2% 4% 6% 8% 10% 12% 14%
Reco
very
Rat
e
Default Rate
Regression equations are based on data from 1982–2003, with later years data points inserted to show the model’s effectiveness. Sources: “The Link Between Default and Recovery Rates: Theory, Empirical Results and Implications,” Altman, Brady, Resti, and Sironi, Journal of Business, November 2005, and NYU Salomon Center.
38
Figure 10. Average Ultimate Recovery Rates on Defaulted U.S. Corporate Loans and Bonds (By Emergence and Default Years: 1987-2012)
Lien Position 2012 2011 2010 2009 2008 2007 2006 2005 2004 2003 2002 2001 2000 1999 1998 1997 1996 1995 1994 1993 1992 1991 1990 1989 1988 1987 1987-2012Loans 100.0% 63.1% 82.3% 67.0% 74.5% 93.2% 86.9% 86.6% 73.4% 66.2% 72.1% 74.9% 84.7% 72.2% 93.8% 80.1% 92.6% 84.4% 80.7% 90.4% 87.6% 83.2% 75.2% 71.7% 100.0% N/A 77.5%BondsSenior Secured Bonds 73.1% 51.7% 54.2% 56.1% 73.9% 82.1% 61.2% 60.4% 84.1% 27.2% 64.5% 38.2% 46.0% 42.3% 69.4% 51.3% 76.6% 62.3% 59.1% 66.1% 74.2% 96.0% 40.3% N/A 53.6% N/A 61.5%Senior Unsecured Bonds 23.7% 7.4% 44.1% 18.1% 62.5% 58.2% 44.2% 37.1% 59.6% 21.4% 30.3% 25.0% 24.5% 43.5% 40.4% 72.3% 45.9% 88.9% 33.1% 28.7% 40.0% 63.4% 39.8% N/A N/A N/A 41.4%Subordinated Bonds N/A 0.0% 23.2% 10.5% 16.3% 42.5% 31.6% 14.1% 21.9% 15.4% 12.2% 17.0% 26.5% 12.9% 14.0% 16.7% 47.8% 26.1% 18.4% 28.0% 24.9% 18.2% 14.1% 28.4% 18.1% N/A 20.6%
Lien Position 2012 2011 2010 2009 2008 2007 2006 2005 2004 2003 2002 2001 2000 1999 1998 1997 1996 1995 1994 1993 1992 1991 1990 1989 1988 1987 1987-2012Loans 6 23 132 120 50 69 68 96 176 211 204 99 68 33 30 29 26 18 30 44 69 21 15 2 3 0 1642BondsSenior Secured Bonds 3 3 9 19 20 62 52 17 43 101 31 5 13 5 9 6 29 18 13 27 41 16 6 0 1 0 549Senior Unsecured Bonds 7 6 55 62 32 56 55 30 202 161 116 35 29 20 23 14 3 39 30 34 21 14 13 0 0 0 1057Subordinated Bonds 0 1 32 32 10 17 18 16 58 81 90 37 41 11 16 23 20 26 50 70 80 28 43 4 1 0 805
Lien Position 2012 2011 2010 2009 2008 2007 2006 2005 2004 2003 2002 2001 2000 1999 1998 1997 1996 1995 1994 1993 1992 1991 1990 1989 1988 1987 1987-2012Loans 100.0% 80.7% 76.4% 75.1% 67.3% 93.0% 92.3% 85.4% 85.9% 76.4% 71.1% 68.9% 74.8% 84.2% 70.9% 86.7% 83.7% 89.0% 88.6% 85.0% 87.0% 86.4% 79.9% 80.3% 87.4% 89.8% 77.5%BondsSenior Secured Bonds 59.7% 68.7% 43.9% 59.2% 49.2% 70.4% 90.7% 91.2% 82.7% 74.6% 38.1% 68.5% 35.2% 49.7% 41.3% 57.1% 65.4% 65.7% 69.6% 88.3% 88.3% 69.2% 51.3% 42.5% 97.1% N/A 61.5%Senior Unsecured Bonds 47.3% 24.4% 19.9% 32.9% 13.2% 68.4% 41.7% 56.2% 37.8% 66.7% 28.9% 43.4% 27.2% 36.3% 36.7% 60.7% 21.0% 71.8% 41.2% 53.7% 40.1% 76.8% 12.1% 35.8% 72.5% N/A 41.4%Subordinated Bonds N/A N/A 19.9% 16.3% 14.6% 25.1% 49.8% 24.9% 26.2% 29.9% 13.1% 10.2% 16.2% 25.2% 3.8% 25.1% 34.3% 15.7% 38.4% 37.6% 28.2% 15.4% 16.1% 15.9% 16.1% 18.5% 20.6%
Lien Position 2012 2011 2010 2009 2008 2007 2006 2005 2004 2003 2002 2001 2000 1999 1998 1997 1996 1995 1994 1993 1992 1991 1990 1989 1988 1987 1987-2012Loans 1 8 54 165 75 22 36 63 95 157 215 210 142 68 24 28 39 36 21 29 49 48 32 12 9 4 1642BondsSenior Secured Bonds 2 2 6 20 10 9 9 52 18 37 150 34 14 14 7 3 17 16 7 17 21 29 24 15 16 0 549Senior Unsecured Bonds 1 6 8 97 18 6 14 48 35 92 238 190 47 45 23 12 6 20 10 37 22 39 20 14 9 0 1057Subordinated Bonds 0 0 14 36 15 9 15 12 17 50 70 88 69 37 9 17 18 20 13 44 70 76 43 31 27 5 805
Emergence Year
Emergence Year
Default Year
Default Year
Count of Instruments (Sample Size)
Count of Instruments (Sample Size)
Source: Moody’s Ultimate Recovery Database.

39
40
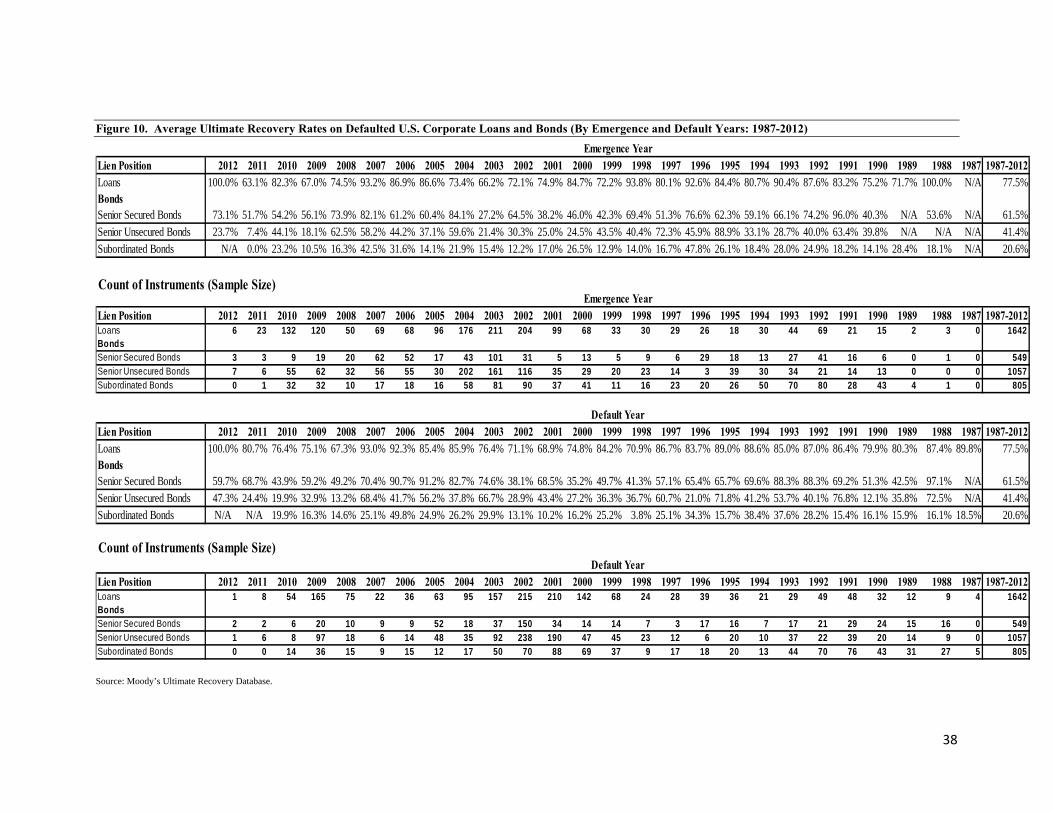
We have also observed ultimate recovery rates on corporate bonds and loans based on
Moody’s estimates in Figure 10. We list the annual ultimate recovery rate based on both the year
of default and the ultimate recovery year. If we are trying to assess the impact of the Revised
Bankruptcy Code of 2005 on creditor recoveries, perhaps the data based on the “default-years” is
more relevant, e.g., 2006-2013. This is particularly true for those years just after 2005, because if
we assessed data based on the “ultimate-years,” it was likely that the relevant Bankruptcy Code
that guided the proceedings was from prior to the Revisions of 2005. Probably, both the default-
years and the ultimate-years are relevant since 2009, since the bankruptcy more than likely took
place after October 2005.
From Figure 10, the strongest evidence on ultimate recoveries at the time of emergence is
that for bankruptcies since 2005, the bank loan recoveries were above the average over the
period 1987-2012 (77.5%) in every year except 2008, when recoveries (67.3%) were below the
average. These loans are essentially senior secured, although the number of loans that have
emerged in the most recent years of 2011 and 2012 are very small (8 and 1 respectively). For
senior secured bonds, the results are mixed, with above average recoveries in 2006, 2007 and
2011, about average in 2009, and 2012 and below the average in 2008 and 2010. Senior
unsecured bonds’ ultimate recoveries since 2005 seem to be below the historical average (41.4%)
in five of the seven years. Subordinated bonds, essentially non-existent since 2011, had a
noticeable decline in recoveries to below average (20.6%) levels in 2008-2010, although above
average in 2006 and 2007. Again, all of these are ultimate recoveries in the default year from
bankruptcies since the new Code went into effect. We also list ultimate recoveries based on the
year of emergence in Figure 10.
41
Recoveries and the Business Cycle
Much has been said about the recent trend in recovery rates to creditors in general, and
especially to the various seniority classes. Indeed, as mentioned earlier, Wood (2011) has
attempted to show empirically that there has been a noticeable decline in unsecured creditors and
shareholder recoveries in s 2009/2010 compared to those in 1991-1996. It is difficult to put much
credence in the five-year period in the early 1990s except that it was a convenient set of data to
compare to since another researcher (LoPucki (2000) had provided some data on recoveries, not
to mention the small sample (42 observations) used for the 2009/2010 unsecured creditors.
The truth of the matter is that recoveries, whether at default or upon emergence from
bankruptcy (ultimate recoveries), are quite sensitive to the economic cycle and the default rate
coincident to the measurement of recoveries. From Figures 11 and 12, we see that the recovery
rate on bonds at default and upon emergence is highly negatively correlated to the business cycle
and default rates, with quite low recoveries near the end and shortly after the recession periods
and peaks of default rates. The data also shows that we can expect extremely high recoveries in
benign credit cycles and low default rates. This is exactly what Altman et al (2005) found in an
earlier study.
From Figure 8, we can observe some extraordinary high recovery rates in many years
since the revisions to the Bankruptcy Code in 2005 for both senior secured and senior unsecured
bonds. Indeed, in 2006 (90.6%), 2007 (87.2%), 2012 (74.0%) and 2013 (70.8%), the recoveries
at default in senior secured bonds were much above the historical average from 1981-2013
(50.4%).13 But, in 2008 (30.5%), 2009 (43.3%) and 2010 (39.5%), default recoveries on senior
secured bonds were much below average. For senior unsecured bonds (and senior subordinated
bonds), the results were much the same, with every year in the 2006-2013 period above the 13 These recoveries were also above the median (44.5%) of all bonds.
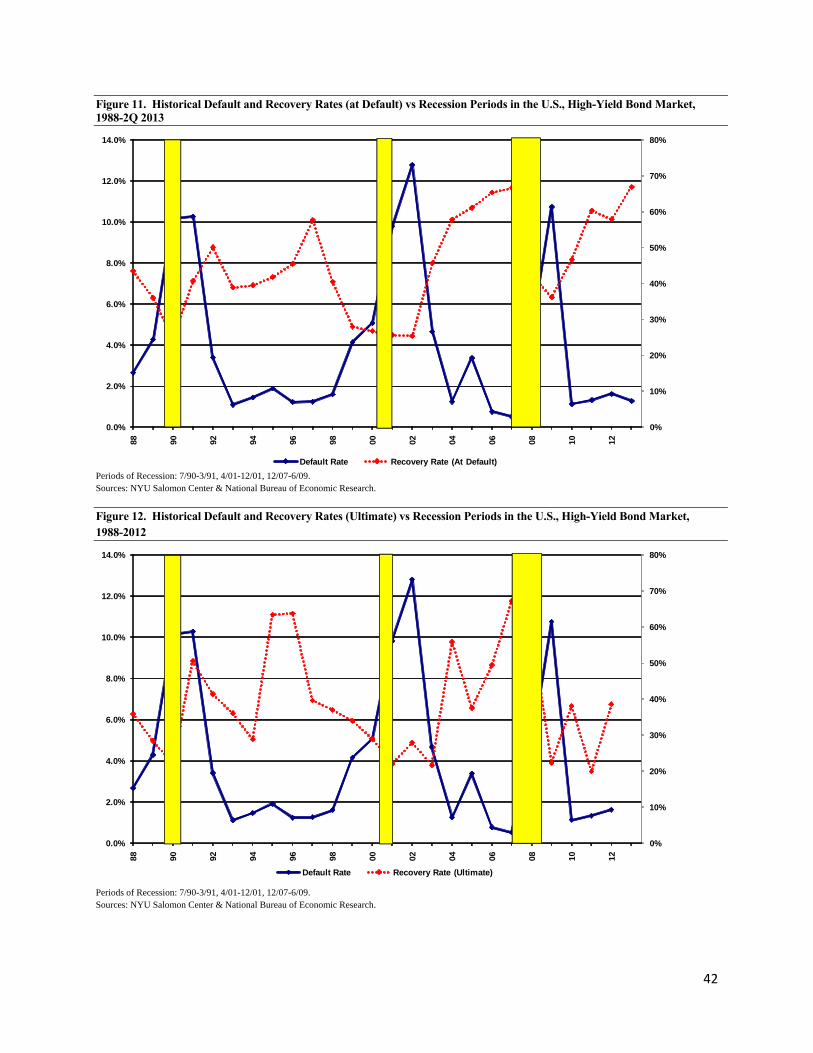
42
Figure 11. Historical Default and Recovery Rates (at Default) vs Recession Periods in the U.S., High-Yield Bond Market, 1988-2Q 2013
0%
10%
20%
30%
40%
50%
60%
70%
80%
0.0%
2.0%
4.0%
6.0%
8.0%
10.0%
12.0%
14.0%88 90 92 94 96 98 00 02 04 06 08 10 12
Default Rate Recovery Rate (At Default) Periods of Recession: 7/90-3/91, 4/01-12/01, 12/07-6/09. Sources: NYU Salomon Center & National Bureau of Economic Research.
Figure 12. Historical Default and Recovery Rates (Ultimate) vs Recession Periods in the U.S., High-Yield Bond Market, 1988-2012
0%
10%
20%
30%
40%
50%
60%
70%
80%
0.0%
2.0%
4.0%
6.0%
8.0%
10.0%
12.0%
14.0%
88 90 92 94 96 98 00 02 04 06 08 10 12
Default Rate Recovery Rate (Ultimate)
Periods of Recession: 7/90-3/91, 4/01-12/01, 12/07-6/09. Sources: NYU Salomon Center & National Bureau of Economic Research.

43
historical average (37.9%) or median (35.0%), except perhaps 2009. And, in some years like
2008 and 2010, senior unsecured bonds actually realized higher recoveries than did the senior
secured bonds. So, I see no evidence that unsecured bonds have suffered with respect to
historical averages in recent years. They still do well, especially in benign credit years when
default rates are low.
It is true that the above data is only on bonds, so we need to observe the Moody’s data in
Figure 10 for evidence on loans and for ultimate recovery rates. While the differences in
recovery rates can be substantial in a given year whether one looks at recoveries at default or
ultimate recoveries, it is usually the case that recovery rates at default are unbiased estimates of
the discounted value of recoveries when the firm emerges from bankruptcy. And, again, Altman
& Eberhart (1994) found that both senior secured and senior unsecured bonds had much higher
returns, in the period between default and emergence, than did subordinated bonds, and likely
equity stakeholders. And, that was a study covering recoveries from 1980-1992. So, the fact that
senior secured bonds have high recoveries and do well during the restructuring period is really
nothing new.
It is true that senior secured bonds and loans have increased of late as a proportion of new
issues of junk bonds and loans, as investors favor these classes for greater protection in the event
of default and issuers, especially low quality ones, find the market far more receptive of secured
issues, even if they are second or third lien securities. This probably implies that should these
issuers get into trouble in the future, they will have less assets that they can use as security for
additional financing.
Ultimate recoveries in the emergence year on loans, mostly secured, were above average
(77.5%) in four of the last seven years (Figure 10), but below average especially in 2009 and
44
2011. The same is true for senior secured bonds, although not as much, with above average
(61.5%) ultimate recoveries in 2007, 2008 and 2012 and below average in 2009, 2010 and 2011.
The latter two years (2011 and 2012) had very few data points for secured and unsecured loans
and bonds.
Some Conclusions
The main objectives of this paper were to comment on the role of the distressed debt
market and its investors and to present comprehensive and relevant statistics over the past several
decades on corporate bankruptcy filings under Chapter 11 of the Bankruptcy Code. The former’s
bond and loan markets play an increasingly important role in the eventual performance of the
bankruptcy process and impact both the wealth of the relevant stakeholders of bankrupt firms as
well as the functioning of our economic system, where leveraged-financings now exceed $2
trillion in the corporate sphere. We have also, when relevant, attempted to comment on recent
trends of Chapter 11 filings, especially since there is much discussion about what impact the
revisions to the Bankruptcy Code of 2005 have had on the functioning of the Bankruptcy system
and on recoveries to creditors of bankrupt entities. With respect to recoveries to unsecured
creditors since the new revisions went into effect in late 2005, we find no convincing evidence
that this class has suffered vis-à-vis senior secure creditors. More important than my
commentaries, however, is the objective to provide the bankruptcy community with
comprehensive and objective data to reach informed opinions and suggestions, if any, to improve
upon the Chapter 11 process.
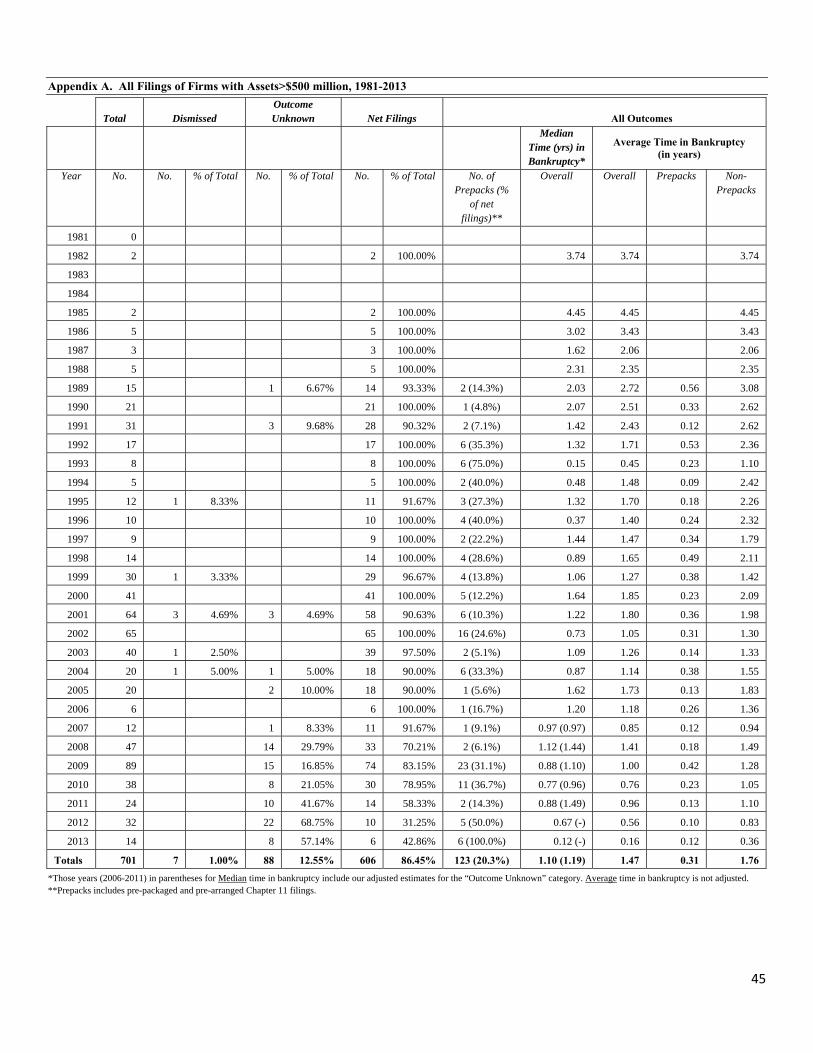
45
Appendix A. All Filings of Firms with Assets>$500 million, 1981-2013
Total Dismissed Outcome Unknown Net Filings All Outcomes
Median
Time (yrs) in Bankruptcy*
Average Time in Bankruptcy (in years)
Year No. No. % of Total No. % of Total No. % of Total No. of Prepacks (%
of net filings)**
Overall Overall Prepacks Non- Prepacks
1981 0
1982 2 2 100.00% 3.74 3.74 3.74
1983
1984
1985 2 2 100.00% 4.45 4.45 4.45
1986 5 5 100.00% 3.02 3.43 3.43
1987 3 3 100.00% 1.62 2.06 2.06
1988 5 5 100.00% 2.31 2.35 2.35
1989 15 1 6.67% 14 93.33% 2 (14.3%) 2.03 2.72 0.56 3.08
1990 21 21 100.00% 1 (4.8%) 2.07 2.51 0.33 2.62
1991 31 3 9.68% 28 90.32% 2 (7.1%) 1.42 2.43 0.12 2.62
1992 17 17 100.00% 6 (35.3%) 1.32 1.71 0.53 2.36
1993 8 8 100.00% 6 (75.0%) 0.15 0.45 0.23 1.10
1994 5 5 100.00% 2 (40.0%) 0.48 1.48 0.09 2.42
1995 12 1 8.33% 11 91.67% 3 (27.3%) 1.32 1.70 0.18 2.26
1996 10 10 100.00% 4 (40.0%) 0.37 1.40 0.24 2.32
1997 9 9 100.00% 2 (22.2%) 1.44 1.47 0.34 1.79
1998 14 14 100.00% 4 (28.6%) 0.89 1.65 0.49 2.11
1999 30 1 3.33% 29 96.67% 4 (13.8%) 1.06 1.27 0.38 1.42
2000 41 41 100.00% 5 (12.2%) 1.64 1.85 0.23 2.09
2001 64 3 4.69% 3 4.69% 58 90.63% 6 (10.3%) 1.22 1.80 0.36 1.98
2002 65 65 100.00% 16 (24.6%) 0.73 1.05 0.31 1.30
2003 40 1 2.50% 39 97.50% 2 (5.1%) 1.09 1.26 0.14 1.33
2004 20 1 5.00% 1 5.00% 18 90.00% 6 (33.3%) 0.87 1.14 0.38 1.55
2005 20 2 10.00% 18 90.00% 1 (5.6%) 1.62 1.73 0.13 1.83
2006 6 6 100.00% 1 (16.7%) 1.20 1.18 0.26 1.36
2007 12 1 8.33% 11 91.67% 1 (9.1%) 0.97 (0.97) 0.85 0.12 0.94
2008 47 14 29.79% 33 70.21% 2 (6.1%) 1.12 (1.44) 1.41 0.18 1.49
2009 89 15 16.85% 74 83.15% 23 (31.1%) 0.88 (1.10) 1.00 0.42 1.28
2010 38 8 21.05% 30 78.95% 11 (36.7%) 0.77 (0.96) 0.76 0.23 1.05
2011 24 10 41.67% 14 58.33% 2 (14.3%) 0.88 (1.49) 0.96 0.13 1.10
2012 32 22 68.75% 10 31.25% 5 (50.0%) 0.67 (-) 0.56 0.10 0.83
2013 14 8 57.14% 6 42.86% 6 (100.0%) 0.12 (-) 0.16 0.12 0.36
Totals 701 7 1.00% 88 12.55% 606 86.45% 123 (20.3%) 1.10 (1.19) 1.47 0.31 1.76 *Those years (2006-2011) in parentheses for Median time in bankruptcy include our adjusted estimates for the “Outcome Unknown” category. Average time in bankruptcy is not adjusted. **Prepacks includes pre-packaged and pre-arranged Chapter 11 filings.
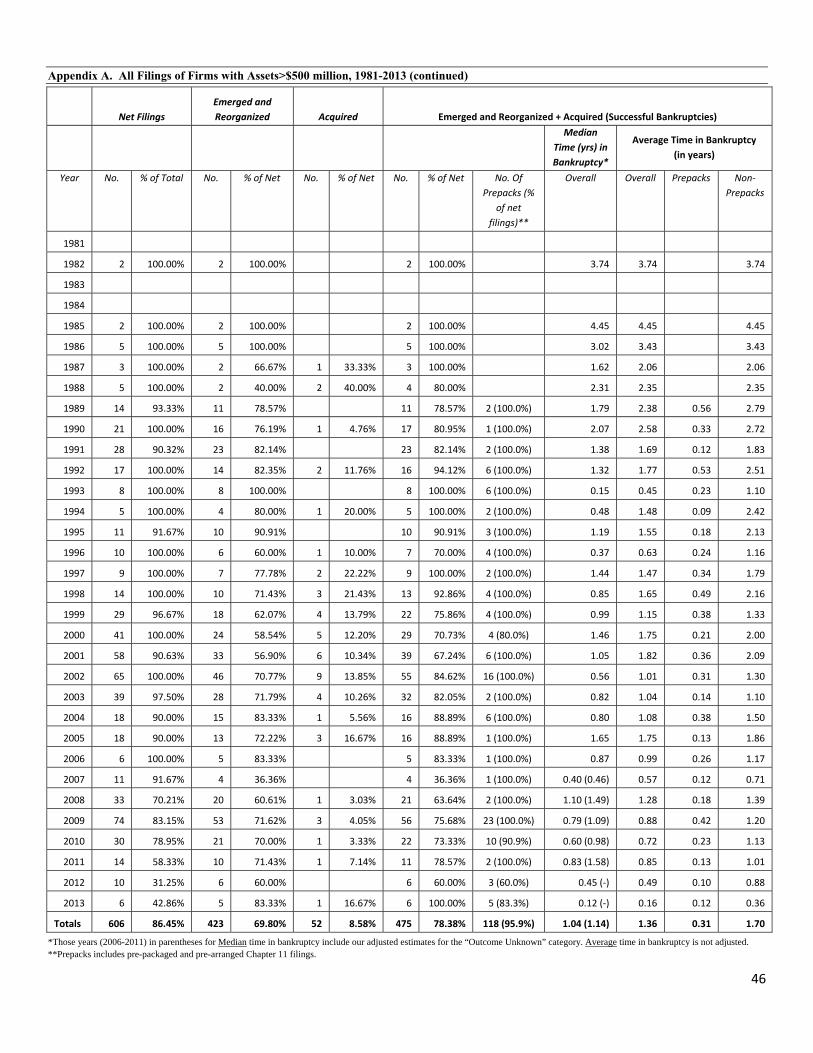
46
Appendix A. All Filings of Firms with Assets>$500 million, 1981-2013 (continued)
Net Filings Emerged and Reorganized Acquired Emerged and Reorganized + Acquired (Successful Bankruptcies)
Median Time (yrs) in Bankruptcy*
Average Time in Bankruptcy (in years)
Year No. % of Total No. % of Net No. % of Net No. % of Net No. Of Prepacks (%
of net filings)**
Overall Overall Prepacks Non‐ Prepacks
1981
1982 2 100.00% 2 100.00% 2 100.00% 3.74 3.74 3.74
1983
1984
1985 2 100.00% 2 100.00% 2 100.00% 4.45 4.45 4.45
1986 5 100.00% 5 100.00% 5 100.00% 3.02 3.43 3.43
1987 3 100.00% 2 66.67% 1 33.33% 3 100.00% 1.62 2.06 2.06
1988 5 100.00% 2 40.00% 2 40.00% 4 80.00% 2.31 2.35 2.35
1989 14 93.33% 11 78.57% 11 78.57% 2 (100.0%) 1.79 2.38 0.56 2.79
1990 21 100.00% 16 76.19% 1 4.76% 17 80.95% 1 (100.0%) 2.07 2.58 0.33 2.72
1991 28 90.32% 23 82.14% 23 82.14% 2 (100.0%) 1.38 1.69 0.12 1.83
1992 17 100.00% 14 82.35% 2 11.76% 16 94.12% 6 (100.0%) 1.32 1.77 0.53 2.51
1993 8 100.00% 8 100.00% 8 100.00% 6 (100.0%) 0.15 0.45 0.23 1.10
1994 5 100.00% 4 80.00% 1 20.00% 5 100.00% 2 (100.0%) 0.48 1.48 0.09 2.42
1995 11 91.67% 10 90.91% 10 90.91% 3 (100.0%) 1.19 1.55 0.18 2.13
1996 10 100.00% 6 60.00% 1 10.00% 7 70.00% 4 (100.0%) 0.37 0.63 0.24 1.16
1997 9 100.00% 7 77.78% 2 22.22% 9 100.00% 2 (100.0%) 1.44 1.47 0.34 1.79
1998 14 100.00% 10 71.43% 3 21.43% 13 92.86% 4 (100.0%) 0.85 1.65 0.49 2.16
1999 29 96.67% 18 62.07% 4 13.79% 22 75.86% 4 (100.0%) 0.99 1.15 0.38 1.33
2000 41 100.00% 24 58.54% 5 12.20% 29 70.73% 4 (80.0%) 1.46 1.75 0.21 2.00
2001 58 90.63% 33 56.90% 6 10.34% 39 67.24% 6 (100.0%) 1.05 1.82 0.36 2.09
2002 65 100.00% 46 70.77% 9 13.85% 55 84.62% 16 (100.0%) 0.56 1.01 0.31 1.30
2003 39 97.50% 28 71.79% 4 10.26% 32 82.05% 2 (100.0%) 0.82 1.04 0.14 1.10
2004 18 90.00% 15 83.33% 1 5.56% 16 88.89% 6 (100.0%) 0.80 1.08 0.38 1.50
2005 18 90.00% 13 72.22% 3 16.67% 16 88.89% 1 (100.0%) 1.65 1.75 0.13 1.86
2006 6 100.00% 5 83.33% 5 83.33% 1 (100.0%) 0.87 0.99 0.26 1.17
2007 11 91.67% 4 36.36% 4 36.36% 1 (100.0%) 0.40 (0.46) 0.57 0.12 0.71
2008 33 70.21% 20 60.61% 1 3.03% 21 63.64% 2 (100.0%) 1.10 (1.49) 1.28 0.18 1.39
2009 74 83.15% 53 71.62% 3 4.05% 56 75.68% 23 (100.0%) 0.79 (1.09) 0.88 0.42 1.20
2010 30 78.95% 21 70.00% 1 3.33% 22 73.33% 10 (90.9%) 0.60 (0.98) 0.72 0.23 1.13
2011 14 58.33% 10 71.43% 1 7.14% 11 78.57% 2 (100.0%) 0.83 (1.58) 0.85 0.13 1.01
2012 10 31.25% 6 60.00% 6 60.00% 3 (60.0%) 0.45 (‐) 0.49 0.10 0.88
2013 6 42.86% 5 83.33% 1 16.67% 6 100.00% 5 (83.3%) 0.12 (‐) 0.16 0.12 0.36
Totals 606 86.45% 423 69.80% 52 8.58% 475 78.38% 118 (95.9%) 1.04 (1.14) 1.36 0.31 1.70
*Those years (2006-2011) in parentheses for Median time in bankruptcy include our adjusted estimates for the “Outcome Unknown” category. Average time in bankruptcy is not adjusted. **Prepacks includes pre-packaged and pre-arranged Chapter 11 filings.
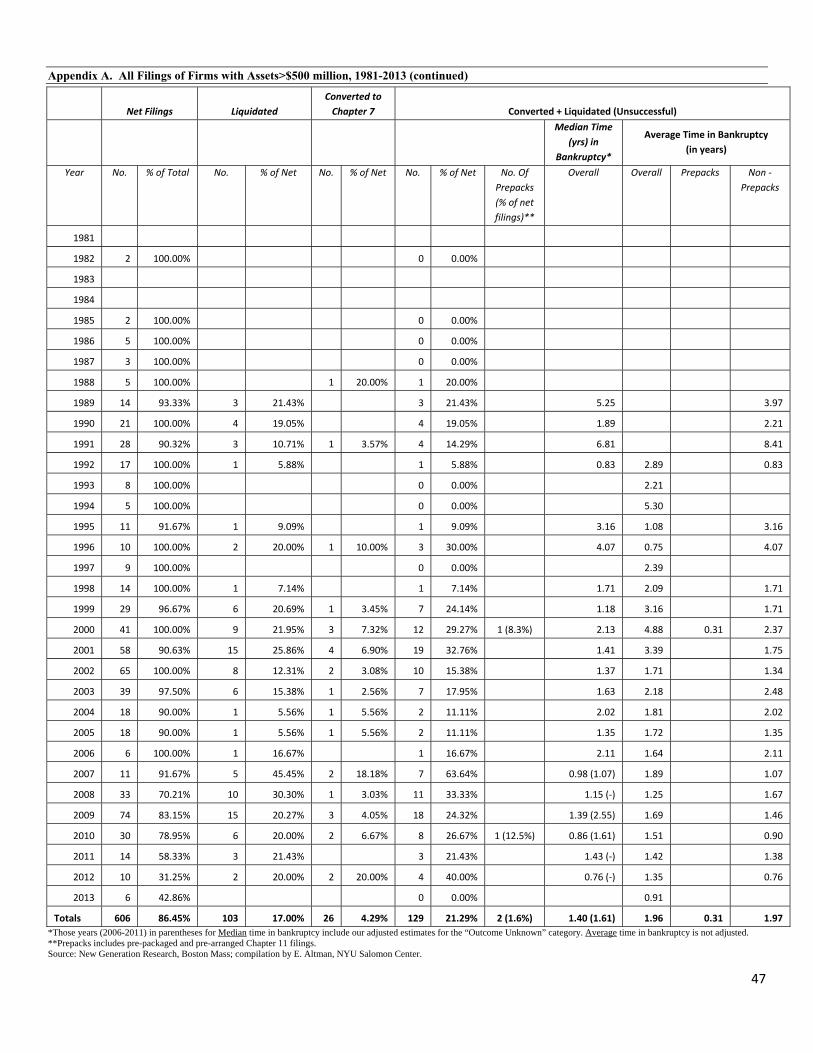
47
Appendix A. All Filings of Firms with Assets>$500 million, 1981-2013 (continued)
Net Filings Liquidated Converted to Chapter 7 Converted + Liquidated (Unsuccessful)
Median Time
(yrs) in Bankruptcy*
Average Time in Bankruptcy (in years)
Year No. % of Total No. % of Net No. % of Net No. % of Net No. Of Prepacks (% of net filings)**
Overall Overall Prepacks Non ‐Prepacks
1981
1982 2 100.00% 0 0.00%
1983
1984
1985 2 100.00% 0 0.00%
1986 5 100.00% 0 0.00%
1987 3 100.00% 0 0.00%
1988 5 100.00% 1 20.00% 1 20.00%
1989 14 93.33% 3 21.43% 3 21.43% 5.25 3.97
1990 21 100.00% 4 19.05% 4 19.05% 1.89 2.21
1991 28 90.32% 3 10.71% 1 3.57% 4 14.29% 6.81 8.41
1992 17 100.00% 1 5.88% 1 5.88% 0.83 2.89 0.83
1993 8 100.00% 0 0.00% 2.21
1994 5 100.00% 0 0.00% 5.30
1995 11 91.67% 1 9.09% 1 9.09% 3.16 1.08 3.16
1996 10 100.00% 2 20.00% 1 10.00% 3 30.00% 4.07 0.75 4.07
1997 9 100.00% 0 0.00% 2.39
1998 14 100.00% 1 7.14% 1 7.14% 1.71 2.09 1.71
1999 29 96.67% 6 20.69% 1 3.45% 7 24.14% 1.18 3.16 1.71
2000 41 100.00% 9 21.95% 3 7.32% 12 29.27% 1 (8.3%) 2.13 4.88 0.31 2.37
2001 58 90.63% 15 25.86% 4 6.90% 19 32.76% 1.41 3.39 1.75
2002 65 100.00% 8 12.31% 2 3.08% 10 15.38% 1.37 1.71 1.34
2003 39 97.50% 6 15.38% 1 2.56% 7 17.95% 1.63 2.18 2.48
2004 18 90.00% 1 5.56% 1 5.56% 2 11.11% 2.02 1.81 2.02
2005 18 90.00% 1 5.56% 1 5.56% 2 11.11% 1.35 1.72 1.35
2006 6 100.00% 1 16.67% 1 16.67% 2.11 1.64 2.11
2007 11 91.67% 5 45.45% 2 18.18% 7 63.64% 0.98 (1.07) 1.89 1.07
2008 33 70.21% 10 30.30% 1 3.03% 11 33.33% 1.15 (‐) 1.25 1.67
2009 74 83.15% 15 20.27% 3 4.05% 18 24.32% 1.39 (2.55) 1.69 1.46
2010 30 78.95% 6 20.00% 2 6.67% 8 26.67% 1 (12.5%) 0.86 (1.61) 1.51 0.90
2011 14 58.33% 3 21.43% 3 21.43% 1.43 (‐) 1.42 1.38
2012 10 31.25% 2 20.00% 2 20.00% 4 40.00% 0.76 (‐) 1.35 0.76
2013 6 42.86% 0 0.00% 0.91
Totals 606 86.45% 103 17.00% 26 4.29% 129 21.29% 2 (1.6%) 1.40 (1.61) 1.96 0.31 1.97 *Those years (2006-2011) in parentheses for Median time in bankruptcy include our adjusted estimates for the “Outcome Unknown” category. Average time in bankruptcy is not adjusted. **Prepacks includes pre-packaged and pre-arranged Chapter 11 filings. Source: New Generation Research, Boston Mass; compilation by E. Altman, NYU Salomon Center.
48
References
Altman, E. (1990), Investing in Distressed Securities: The Anatomy of Defaulted Debt and Equities, Foothill Group, Los Angeles, CA. Altman, E. (1991), Distressed Securities, Analyzing and Evaluating Market Potential and Investment Risk, Probus Publishing, Chicago, IL, reprinted and available from Beard Books, Washington, D.C., 1999. Altman, E. (1992), The Market for Distressed Securities and Bank Loans, Foothill Group, Los Angeles, CA. Altman, E. and A. Eberhart (1994), “Do Seniority Provisions Protect Bondholders’ Investment,” Journal of Portfolio Management, Summer, p. 67. Altman, E., B. Brady, A. Resti and A. Sironi (2005), “The Link Between Default Rate and Recovery Rates: Implications for Credit Risk Models and Procyclicality,” Journal of Business, Vol. 78, No. 6, November, p.2203; reprinted in Recovery Risk, Risk Books, London, England, 2005. Altman, E., T. Rattanaruengyot and P. Kant (2009), “Post Chapter 11 Performance: How
to Avoid Chapter 22,” Journal of Applied Corporate Finance, Vol. 11, No. 3, p. 51, Summer.
Altman, E. and B. Karlin (2009), “The Re-emergence of Distressed Exchanges in Corporate Restructuring,” Journal of Credit Risk, Vol. 5, No. 2, p. 43. Altman, E. and B. Kuehne (2013), “Defaults & Returns in the High-Yield Bond and Distressed Debt Markets: 2012 in Review,” NYU Salomon Center Special Report & Paulson & Company, February. Altman, E. and B. Kuehne (annually since 2007 and annually since 2000, just E. Altman),
“The Investment Performance and Market Dynamic of Defaulted Bonds and Bank Loans,” NYU Salomon Center Annual Reports,
and Paulson Co. (since 2010), February. Baird, D. and R. Rasmussen (2006), “Private Debt and the Missing Lever of Corporate Governance,” 154 University of PA Law Review, p. 1209. Eberhart, A., E. Altman and R. Aggarwal (1999), “The Equity Performance of Firms Emerging from Bankruptcy,” The Journal of Finance, Vol. LIV, No. 5, p. 1855. Friewald, N., R. Jankowitsch and M. Subrahmanyam (2012), “Illiquidity, or Credit Deterioration: A. Study of Liquidity in the U.S. Bond Market during Financial
49
Crises,” Journal of Financial and Economics, Vol. 105, No. 1, p. 18. Gande, A., E. Altman and A. Saunders (2010), “Bank Debt vs. Bond Debt: Evidence from Secondary Market Prices,” Journal of Money, Credit & Banking, Vol. 42, No. 4, p. 755. Goldschmid, P. (2005), “More Phoenix Than Vulture: The Case for Distressed Investor Presence in the Bankruptcy Reorganization Process,” Columbia Business Law Review, Vol. 191, p. 259. Harner, M. (2008), “Trends in Distressed Debt Investing: An Empirical Study of Investors’ Objectives,” ABI Law Review, Vol. 16, p. 69. Harner, M. J. Griffin and J. Ivey-Crickenberger (2013), “Activist Investors, Distressed
Companies and Value Uncertainty,” ABI Law Review, Vol. 21, No. 2, forthcoming. Hotchkiss, E., and R. Mooradian (1997), “Vulture Investors and the Market for Control
of Distressed Firms,” Journal of Financial Economics, Vol. 43, No. 2, p. 401. Jankowitsch, R., F. Nagler and M. Subrahmanyam (2013), “The Determinants of Recovery Rates in the U.S. Corporate Bond Market,” Working Paper, NYU Stern School of Business and Vienna University. Jiang, W. K. Li and W. Wang (2012) “Hedge Funds and Chapter 11,” The Journal of Finance, Vol. LXVII, No. 2, pa. 573. Kamensky, D. (2013) “Furthering the Goals of Chapter 11: Considering the Positive Role
of Hedge Funds in the Reorganization Process,” ABI Law Review, Vol. 21, No. 2, forthcoming.
LoPucki, L. (2004), “The Myth of the Residual Owner: An Empirical Study,” 82, Washington University Law Quarterly, 1341. Mead, C. and S. Natarajan (2013), “Leveraged Debt Exceeds $2 Trillion in Repression: Credit Markets,” Bloomberg News, August 26. Miller, H. (2002), “Chapter 11 Reorganization Cases and the Delaware Myth, “
Vanderbilt Law Review, Vol. 55, p. 1987. Miller, H. and S. Waisman (2005), “Is Chapter 11 Bankrupt,” B.C. L. Rev., Vol. 47. p. 129. Skeel, D. (2003), “Doctrines and Markets: Creditors’ Ball, The “New” New Corporate
50
Governance in Chapter 11, U. PA. L. Rev., Vol. 152, p. 917. Wood, A. (2011), “The Decline of Unsecured Creditor and Shareholder Recoveries in Large Public Company Bankruptcies,” American Bankruptcy Law Journal, 85, Fall, 429.