altruistic behavior in a representative dictator experiment1
TRANSCRIPT
1
Altruistic Behavior in a Representative Dictator Experiment1
April 14, 2007
Jeffrey Carpenter♣ Cristina Connolly♦ Caitlin Myers♠
Abstract
We conduct a representative dictator game in which students and random members of
the community chose both what charity to support and how much to donate to the
charity. We find systematic differences between the choices of students and community
members. Community members are much more likely to write in their own charity,
community members donate significantly more ($17), on average, and community
members are much more likely (32%) to donate the entire $100 endowment. Based on
this evidence, it does not appear that student behavior is very representative in the
context of the charitable donations and the dictator game.
1. Introduction
Economists conducting behavioral research have often struggled with the extent
to which convenience samples of college students are representative of larger,
more general, populations. It could be, for example, that behavior is correlated
with demographics but that researchers fail to identify such relationships because
of the lack of variation in the student population. Another possible issue is that
students simply may have little experience with many of the sorts of decision-
making environments that interest economists. This worry has recently led a few
economists to conduct experiments in the field with participants who either have
more experience in the decision-making environment under investigation or are
1 We thank the NSF (SES-Career 0092953) for funding. ♣ Department of Economics, Middlebury College & IZA, [email protected]. ♦ Department of Economics Middlebury College, [email protected]. ♠ Department of Economics, Middlebury College & IZA, [email protected].
2
more representative of the broader population of decision-makers. 2 In general,
these experiments have been well-received.
However, making sure that the participants in an experiment are
representative of the populations to which one wishes to generalize the results is
only one of two criteria set out by Egon Brunswik when he formulated the notion
of a representative design in psychology (Brunswik, 1956). Economists have been
less interested in incorporating the second criterion into their experiments
(Hogarth, 2005). Brunswik’s second criterion is that the situations faced by
decision-makers are also representative of their environments.
A good example of a non-representative design is the standard double blind
dictator game (Forsythe et al., 1994) played by college students. This experiment
has been used extensively to study and measure altruism. In the dictator game
two people, who typically do not know each other, are charged with splitting a
monetary pie. The dictator has full control over how the pie will be split – she
can allocate any amount to the recipient and keep the rest. The amount given to
the recipient is taken as a measure of altruism. Clearly, the fact that college
students are often the participants in the dictator game means that the results
may not be very representative; however, there are now a growing number of
field studies in which other populations have been sampled from.
Carpenter et al. (2005a) for example show that although typical college
students are sensitive to the fact that the recipient cannot veto the dictator’s
allocation, a more generally representative slice of participants who work in a
warehouse facility in Kansas are not. In fact, the distribution of warehouse
worker offers in the dictator game is indistinguishable from the distribution
generated by an ultimatum game in which the recipient can reject the offer of the
other player resulting in both players receiving $0. In a much more ambitious
project, Henrich et al. (2006) report on dictator games conducted in 15 diverse
populations around the globe. Unlike the standard $10 game played with
students where allocations are often close to uniformly distributed on the interval
[$0, $5], there is a lot of variation in the Henrich et al. data and the variation
2 Harrison and List (2004) refer to these as “artefactual” field experiments.
3
tends to correlate with the willingness of members of a population to enforce
distribution norms.
The other problem with the standard dictator game is that the decision task
is relatively unnatural and therefore may not be representative. 3 While people
routinely give money to strangers who are obviously less well off in face-to-face
interactions and they give to established charities with even more regularity, how
often are you asked to give money to an anonymous stranger without any
context or means of assessing exactly how deserving the stranger is (Camerer and
Thaler, 1995; Camerer, 2003)? Just as dictator game research has been conducted
with more representative populations, there have been a few studies that have
examined more representative protocols. In the first, Eckel and Grossman (1996)
used a convenience sample of students, but changed the protocol so that the
recipient was the American Red Cross. This manipulation had the expected
result of increasing average allocations. In another experiment, Fong (2005),
again using student dictators, recruited people who qualify for welfare to play the
role of the recipient in another modified dictator experiment. Her treatments
varied the degree to which the recipients appeared willing to “pull themselves up
by their bootstraps” and she found some evidence that recipient industriousness
mattered.
Our contribution is to conduct a dictator experiment that is representative in
both domains. We start by designing, what we consider to be, an even more
representative version of the Eckel and Grossman (1996) dictator game. In this
game, participants were allowed to choose among thirteen reputable charities to
take the role of the recipient instead of being forced to give to the American Red
Cross. By changing the game in this way, we can be more sure that the
participants felt some attachment to whatever charity they picked. In fact, the
3 We consider the notion of representativeness to be related to, but not the same as, external
validity. For us experimental behavior is externally valid if it correlates with behaviors measured
in more naturally occurring contexts, regardless of the representativeness of the design. For
example, if giving in a context-free student dictator experiment predicts real charitable donations,
it is externally valid despite the design of the experiment not being particularly representative
(Benz and Meier, 2005).
4
game is clearly more representative because the participants could also write in
whatever charity they wanted if they did not want to pick one of the thirteen on
the list. We then conducted this experiment with two populations: a sample of
students from Middlebury College, a residential liberal arts college in Vermont,
and a sample of Vermonters drawn from the broader population.
Our experiment was embedded in a broader survey so that we could also
contribute by collecting the data necessary to test hypotheses about why student
behavior might not be representative. Specifically, we collected information on a
number of demographic characteristics (e.g., age, sex and education) that have
been shown to matter in similar settings (as in List, 2004 or Botelho et al., 2005),
we collected standard survey measures of altruism to test the construct validity
of our protocol, and we collected data that may shed light on the source and
acquisition of altruistic traits.
To preview our main results, we find that student behavior is not
representative of the behavior of members of the broader community. Students
tended to be significantly less likely to write in their own choice of a charity and
given this choice, they allocated significantly less as dictators. The robust
demographic determinants of allocations include age, student status and sex. We
also find evidence that the representative dictator game correlates with other
measures of altruism and that altruistic traits are acquired (at least partially)
from mothers and friends.
We proceed by describing our representative dictator protocol in the next
section. We then provide an overview of our data, examine the choice of charity
and the choice of how much to allocate to charity. We conclude by discussing
how our results dovetail with other similar findings.
2. Designing a representative dictator experiment
Taking Eckel and Grossman (1996) as our starting point, we created a $100
dictator game in which participants first chose among the following 13 charities
to take the role of the recipient: the American Cancer Society (ACS), the
American Diabetes Association (ADA), Amnesty International (AI), Doctors
without Borders (DwoB), the Humane Society (HS), Habitat for Humanity
5
(HforH), the Nature Conservancy (NC), The United Nations Children's Fund
(UNICEF), the United Service Organizations (USO), the United Way (UW), the
Vermont Land Trust (VLT) or Vermont Public Radio (VPR). If the participant
did not like any of the 13 choices she could write in her own choice on a
fourteenth line.
Once the participant chose a charity, she was then asked to divide $100
between the charity and herself. The participants were told that after all the
responses were collected we would pick 10% randomly and implement the
allocation decision. In expectation, our game matched the $10 stakes used in
many previous dictator experiments and Carpenter et al. (2005b) show that
changing the stakes from $10 to $100 has no effect on the distribution of
allocations. When all the responses were received we wrote checks directly to
each of the charities for the total amounts that had been donated and, to keep
the responses as anonymous as possible, we sent unnamed VISA gift cards to the
dictators in the amounts that they had chosen to keep for themselves. The exact
wording of the instructions for the experiment appears in the appendix.
To learn more about how altruistic traits might be formed, we asked each
participant three additional questions. We asked them how much they thought a
random participant would allocate to charity, how much they thought that their
mothers would allocate, and how much they thought that their best friends
would allocate. The motivation behind the second and third of the questions was
to test to what degree altruistic traits are transmitted from mother to child or
from friend to friend. Of course the skeptic might think that the answers to these
two questions might be confounded by what psychologists refer to as projection
bias whereby participants project their own motives and views onto the
anticipated behavior of others. For this reason we included the first question to
control for projection bias. If the second two questions predict allocations,
controlling for the first, we feel comfortable interpreting the second two as
avenues of trait transmission.
The student data were collected in the spring of 2006 via an online survey
developed at Middlebury College. Over the course of the summer of 2006 we
purchased a sample of 2000 addresses in the state of Vermont. The sample was
6
drawn randomly on all but one criterion, sex. Because this data is a component
of a larger project on altruism and volunteerism in which we are also collecting
data from volunteer firefighters and because firefighters are predominately male,
we over-sampled males in the community survey.
To get as many responses as possible, the community members could
choose to complete the experiment and survey online, like the students, or they
could return a paper version of the protocol that had been mailed to them with a
stamped return envelope and a cover letter. 4 Whether responding by mail or
online, participants used an alphanumeric response code that helped to maintain
a sense of anonymity while allowing us to prevent multiple responses from a
single participant.
Four hundred and ten community members and one hundred and fourteen
students responded. The community response rate (21%) is particularly good
considering surveyors are often impressed with a 10% response. Although there is
a lot of demographic variation in our community data we can compare our
sample to weighted Current Population Survey (CPS) data from December 2006
to assess how representative our responses are. Both the U.S. and Vermont are
composed of 49% males and 51% females. Our community responses are
distributed 67% male and 33% female for the reason mentioned above. While this
appears to be a problem, we got back responses in exactly the proportion in
which we sent surveys out indicating that there was no male-female sample
selection bias.
Our Vermont community respondents seem to be older (the mean age is 50
compared to a mean of 38 in the state as a whole and 35 in the U.S.). One
explanation for this is that our sample was restricted to respondents who were at
least 18 years old. When we restrict the CPS in the same way, we find more
comparable means: 46 years old in both the U.S. and Vermont. Lastly, only our
community respondents were asked to report their weekly earnings (using the
same questions used in the CPS). Weekly earnings are also comparable across the
three groups. In the U.S. overall mean weekly earnings were $743, in Vermont
4 90% of the community participants responded to the paper version of the protocol.
7
they were $615 and our community sample mean is $758. 5 Based on a few
obvious demographics characteristics, our community sample appears to be
similar to both the state of Vermont and the U.S. more generally.
3. An overview of the data
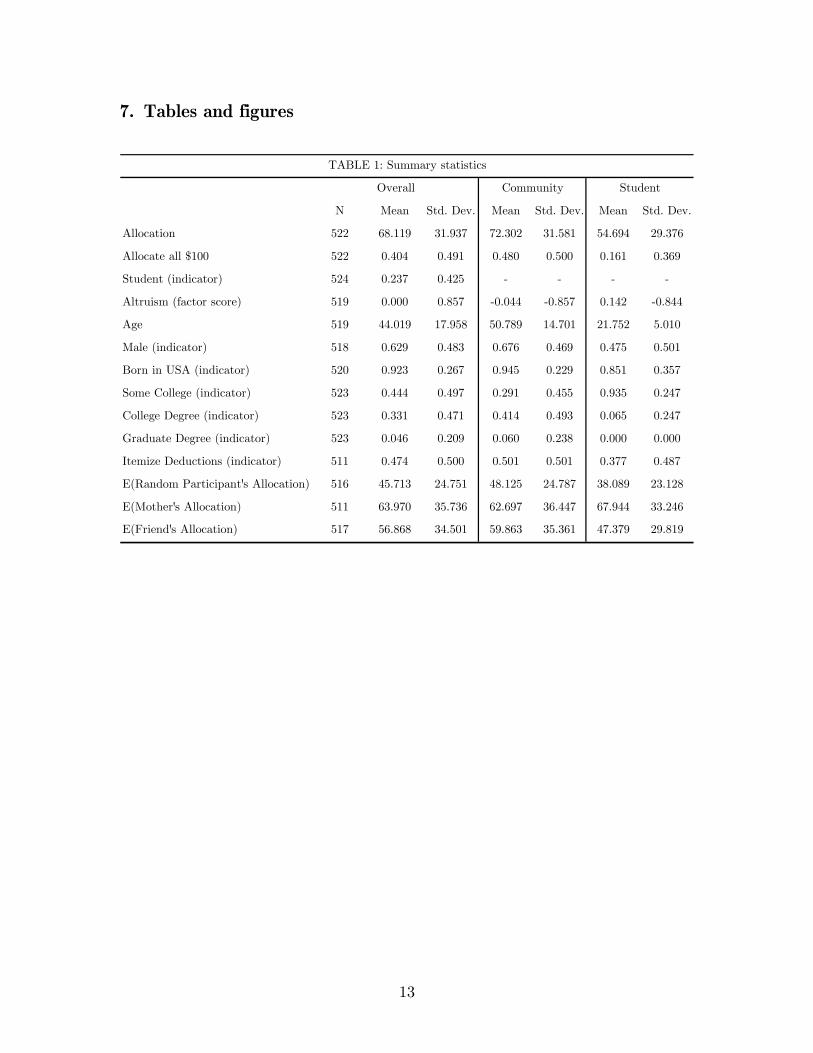
Table 1 describes the variables that are common to both the student and the
community samples. Contrary to the standard, neutrally framed dictator game
(and the Eckel and Grossman, 1996 experiment), our participants were quite
generous. Overall, people allocated $68.12 to the charity of their choice, on
average. However, the average community member gave almost $20 more than a
student. From the second row of Table 1 we can see that this difference is largely
driven by the fact that community members were three times more likely to give
away all $100.
In row four of Table 1 we report the factor score as a summary of the ten
altruism and empathy statements that the participants responded to in the
survey. The statements, which are listed in the appendix, were taken from the
NEO Personality Inventory for altruism (Costa and McCrae, 1992) and Barchard
(2004). In general, these statements have high Cronbach alpha scores indicating
that the items tend to be correlated and represent some latent characteristic –
altruism. In our survey, the alpha score is 0.68 which is comparable to other
implementations. By construction, the mean altruism factor score for the entire
pool of respondents is zero, but it is interesting that the mean score is actually
higher (|t|=2.11, p=0.03) for students.
We collected standard demographic information including age, sex,
whether or not the respondent was born in the U.S., education level and whether
or not the respondent itemizes deductions for tax purposes. It is hard to get
reliable income data from students because it is not clear whether one should
collect the student’s income or the family’s income. With that in mind, we chose
to ask about itemization as a crude proxy of the participant’s income.
5 Neither of the earnings differences (our community sample versus Vermont or the U.S.) are
statistically significant.
8
In the last three rows of Table 1 we summarize the responses of our
participants to how much they thought that a random participant, their mother
and their best friend would allocate to charity. For both respondent groups
people attributed the most altruism to their mothers and the least to a random
participant. It is interesting that, on average, students attribute less altruism to
random participants (|t|=3.99, p<0.01) and their friends (|t|=3.44, p<0.01) but
relatively more to their mothers (|t|=1.42, p=0.15). Of particular interest is the
students’ pessimistic view of their friends which will be proven rational in the
next section.
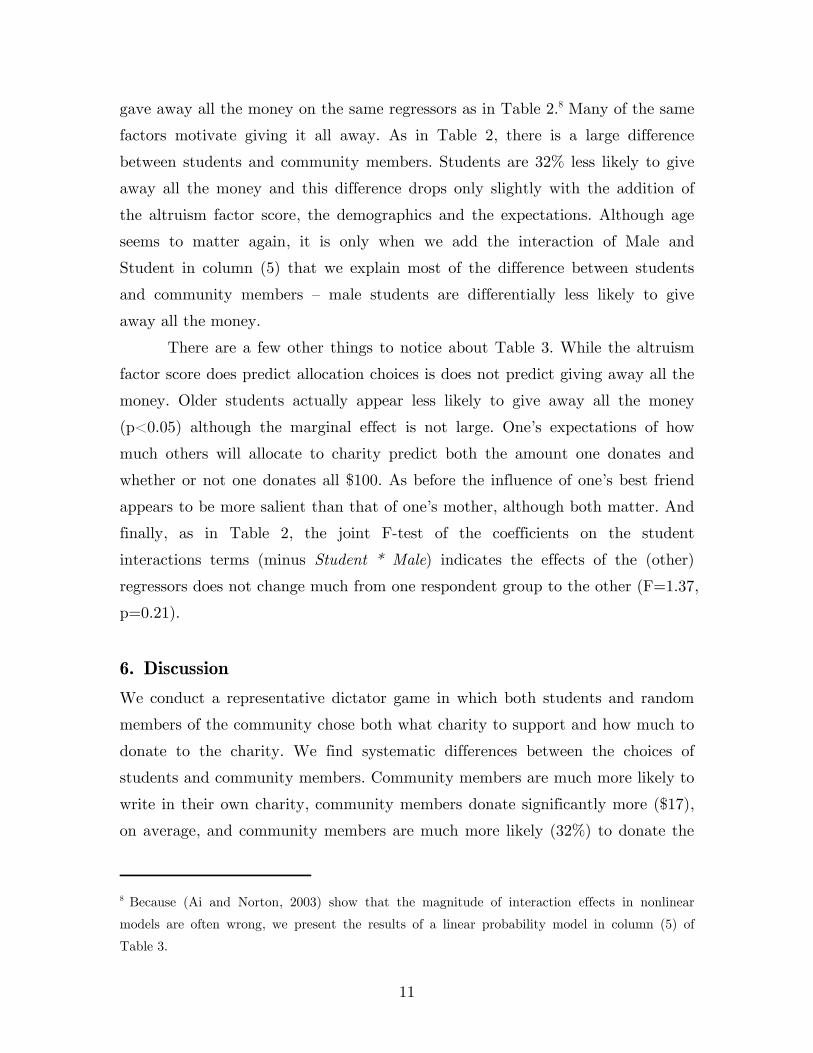
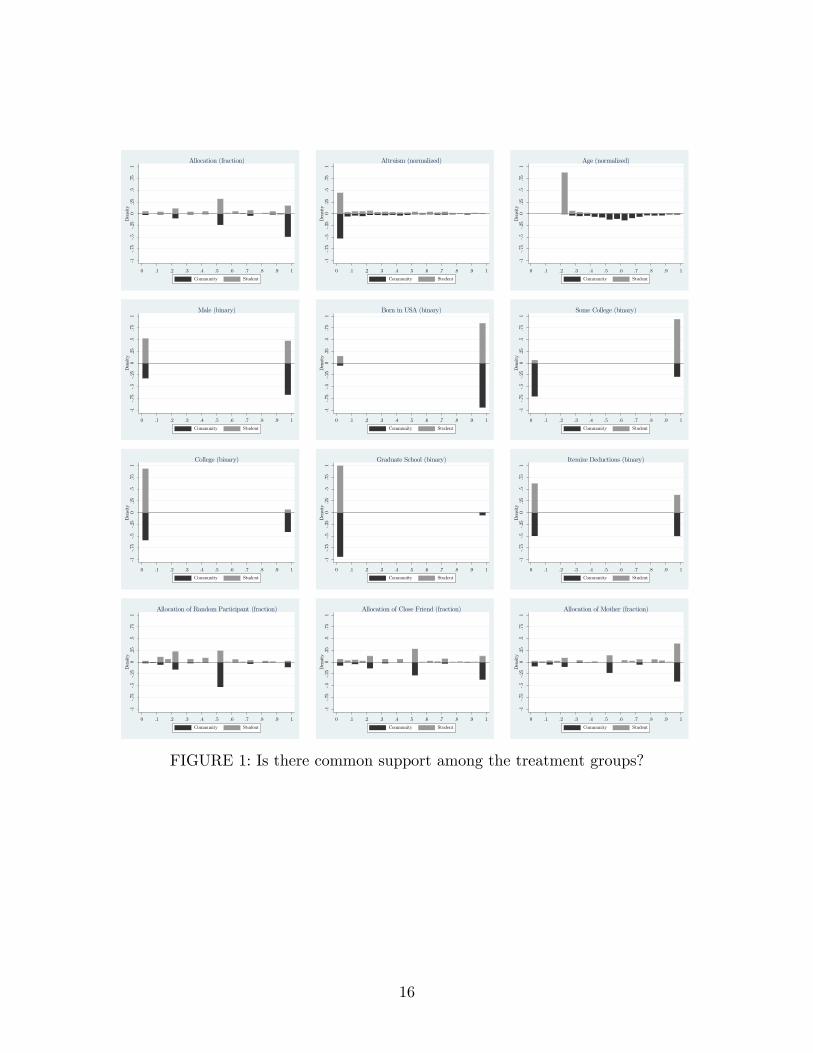
To get accurate population level estimates of the effects of the regressors
listed in Table 1, it is important that there is some common support across the
two populations. To examine the overlap in support, Figure 1 provides
histograms by respondent group. The lighter histogram in each figure projecting
upwards represents the student data and the dark histograms projecting
downwards are for the community members. In general, there is considerable
overlap in the distributions. In the upper left corner we see the two histograms of
allocations to charity. The modal allocation is 50% of the money while the mode
for the community members is to actually give it all away. Another thing to
notice about Figure 1 is the fact that while most of the students are in their early
20s we were able to collect a few older students from the community
implementation of the experiment.
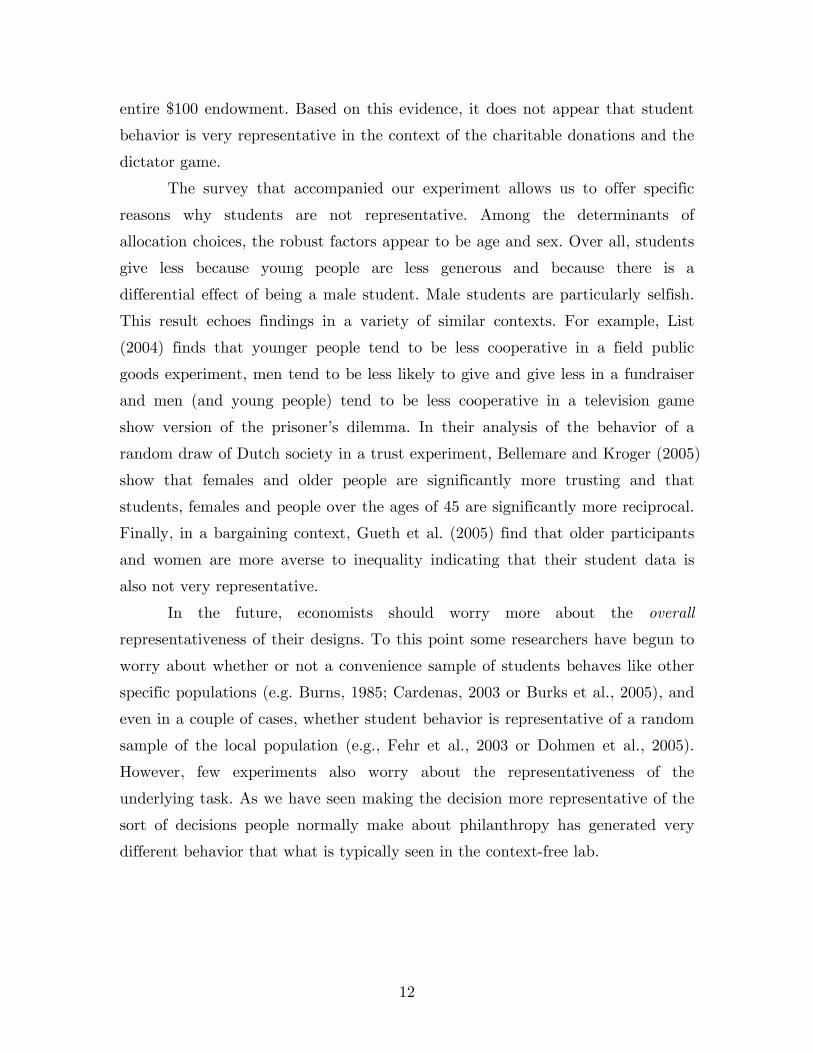
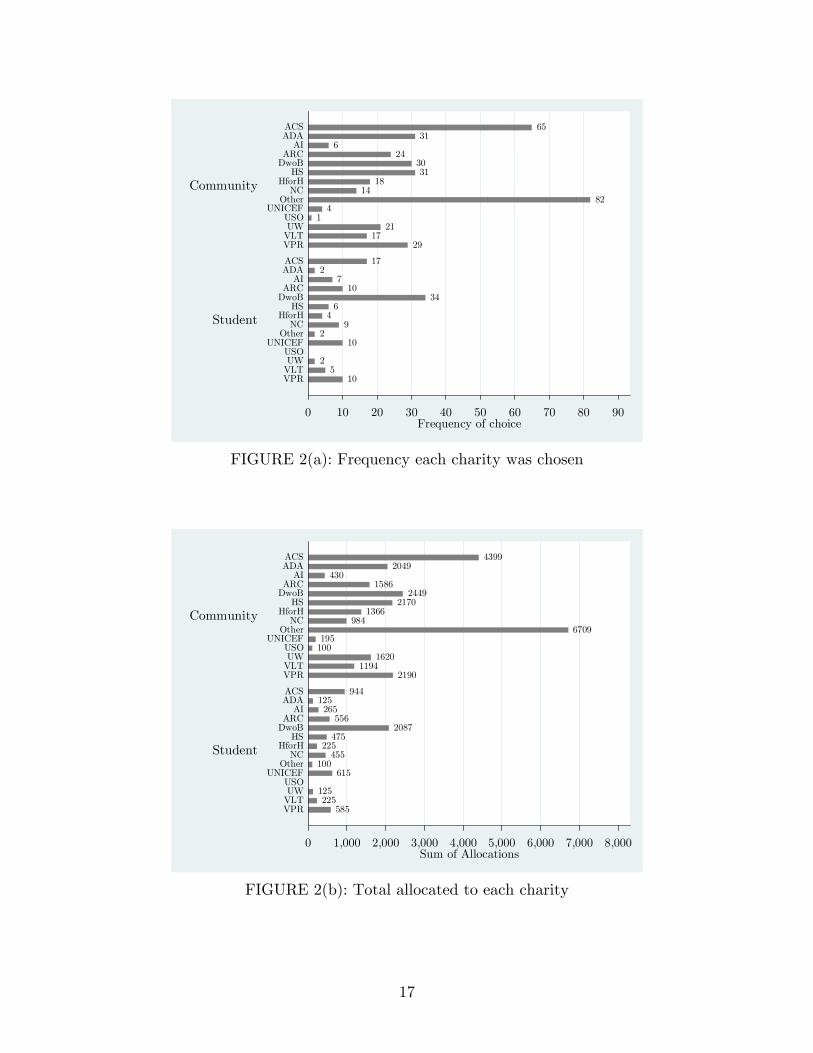
4. Charity choice
There is a lot of variation in the choices that participants made about the
charities to which money should be donated, suggesting the importance of choice.
To get a better sense of these choices, Figure 2(a) reports the frequencies with
which each charity was chosen by participant group. Interestingly, although
every charity has some support, community members chose to write in their own
charities more than they chose any of the provided choices. At the same time, the
students only chose to write in a charity twice. For the students the most
popular charity was Doctors without Borders. These differences are both
significant at the 1% level. Based on probit regressions of choice, the students
9
were 19% less likely to write in a charity but they were 21% more likely to pick
Doctors without Borders.
In Figure 2(b) we report the total amount of money allocated to each of
the charities. The important fact about this figure is that it looks very similar in
shape to Figure 2(a). This suggests that the mean allocation does not vary that
much from one charity to another. In other words there do not appear to be
certain charities that were allocated more money on average than others. Indeed,
the Kruskal-Wallis test indicates that the average donations (within a respondent
group) come from a common population. For the community members the chi-
squared statistic is 10.11 (p=0.61) and for the students the chi-squared is 19.02
(p=0.12). This result has implications for the next section in which we regress
allocation decisions on the regressors reported in Table 1. One could imagine that
we need to control for charity choice in these regressions, however adding charity
fixed effect never affects the other coefficients appreciably.
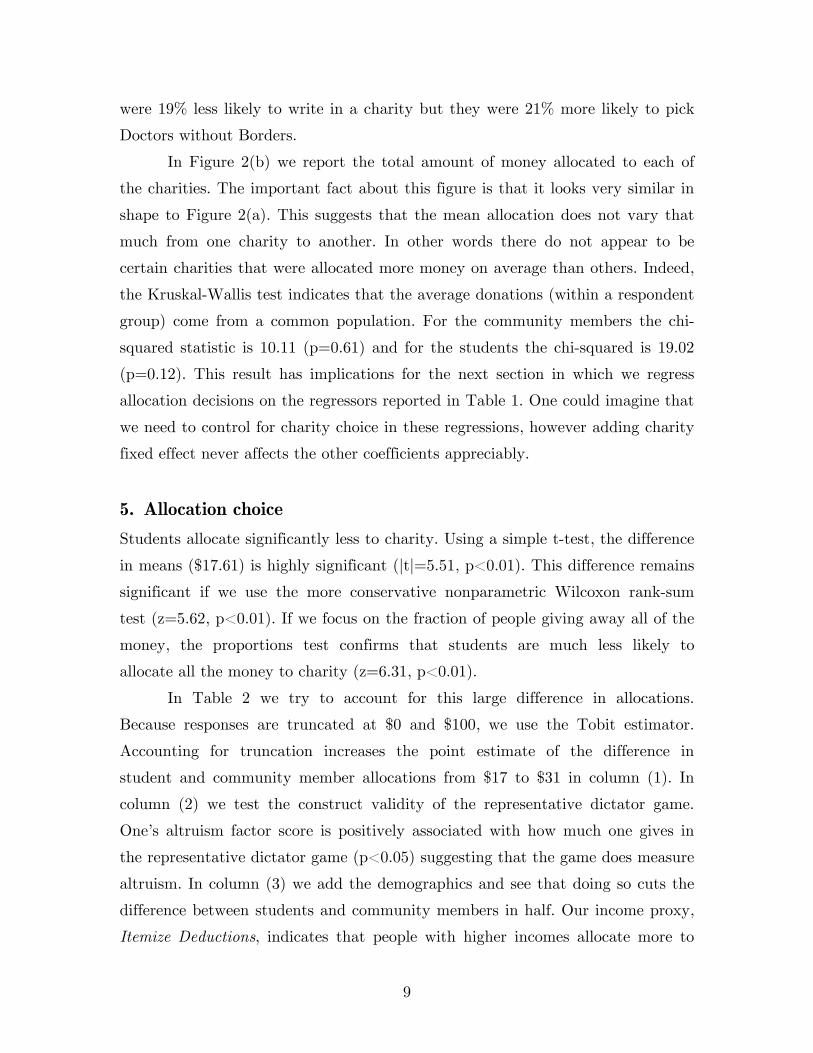
5. Allocation choice
Students allocate significantly less to charity. Using a simple t-test, the difference
in means ($17.61) is highly significant (|t|=5.51, p<0.01). This difference remains
significant if we use the more conservative nonparametric Wilcoxon rank-sum
test (z=5.62, p<0.01). If we focus on the fraction of people giving away all of the
money, the proportions test confirms that students are much less likely to
allocate all the money to charity (z=6.31, p<0.01).
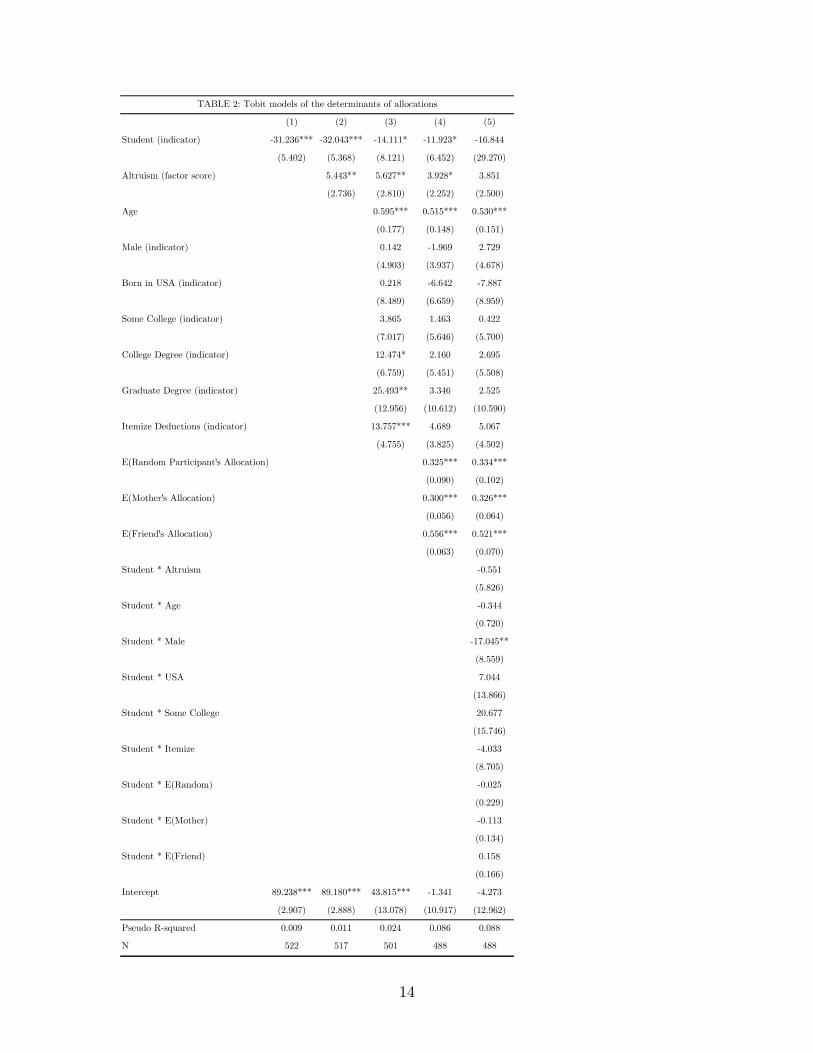
In Table 2 we try to account for this large difference in allocations.
Because responses are truncated at $0 and $100, we use the Tobit estimator.
Accounting for truncation increases the point estimate of the difference in
student and community member allocations from $17 to $31 in column (1). In
column (2) we test the construct validity of the representative dictator game.
One’s altruism factor score is positively associated with how much one gives in
the representative dictator game (p<0.05) suggesting that the game does measure
altruism. In column (3) we add the demographics and see that doing so cuts the
difference between students and community members in half. Our income proxy,
Itemize Deductions, indicates that people with higher incomes allocate more to
10
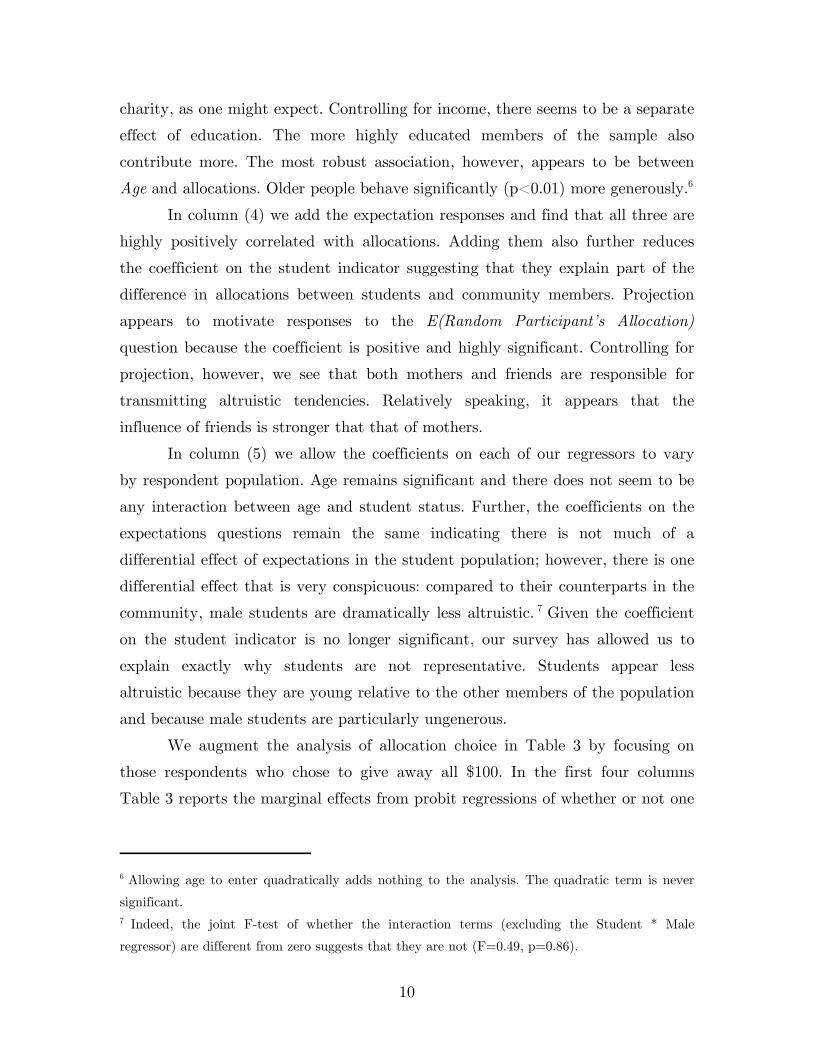
charity, as one might expect. Controlling for income, there seems to be a separate
effect of education. The more highly educated members of the sample also
contribute more. The most robust association, however, appears to be between
Age and allocations. Older people behave significantly (p<0.01) more generously.6
In column (4) we add the expectation responses and find that all three are
highly positively correlated with allocations. Adding them also further reduces
the coefficient on the student indicator suggesting that they explain part of the
difference in allocations between students and community members. Projection
appears to motivate responses to the E(Random Participant’s Allocation)
question because the coefficient is positive and highly significant. Controlling for
projection, however, we see that both mothers and friends are responsible for
transmitting altruistic tendencies. Relatively speaking, it appears that the
influence of friends is stronger that that of mothers.
In column (5) we allow the coefficients on each of our regressors to vary
by respondent population. Age remains significant and there does not seem to be
any interaction between age and student status. Further, the coefficients on the
expectations questions remain the same indicating there is not much of a
differential effect of expectations in the student population; however, there is one
differential effect that is very conspicuous: compared to their counterparts in the
community, male students are dramatically less altruistic. 7 Given the coefficient
on the student indicator is no longer significant, our survey has allowed us to
explain exactly why students are not representative. Students appear less
altruistic because they are young relative to the other members of the population
and because male students are particularly ungenerous.
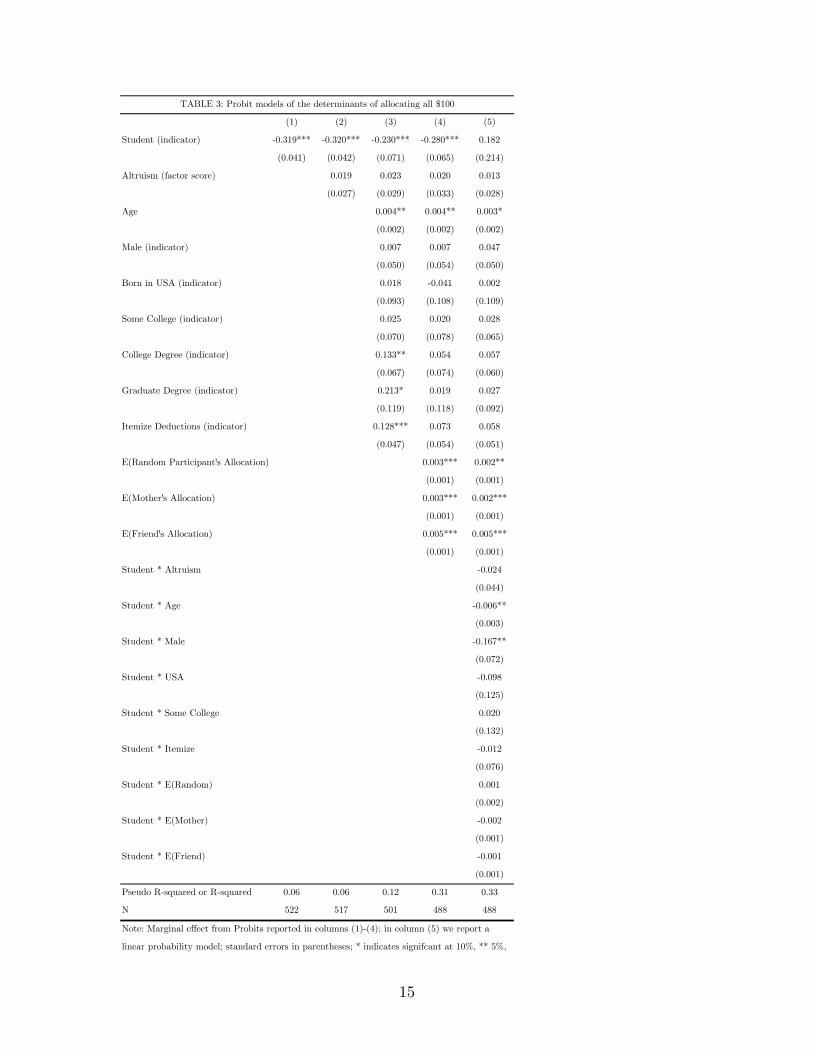
We augment the analysis of allocation choice in Table 3 by focusing on
those respondents who chose to give away all $100. In the first four columns
Table 3 reports the marginal effects from probit regressions of whether or not one
6 Allowing age to enter quadratically adds nothing to the analysis. The quadratic term is never
significant. 7 Indeed, the joint F-test of whether the interaction terms (excluding the Student * Male
regressor) are different from zero suggests that they are not (F=0.49, p=0.86).
11
gave away all the money on the same regressors as in Table 2.8 Many of the same
factors motivate giving it all away. As in Table 2, there is a large difference
between students and community members. Students are 32% less likely to give
away all the money and this difference drops only slightly with the addition of
the altruism factor score, the demographics and the expectations. Although age
seems to matter again, it is only when we add the interaction of Male and
Student in column (5) that we explain most of the difference between students
and community members – male students are differentially less likely to give
away all the money.
There are a few other things to notice about Table 3. While the altruism
factor score does predict allocation choices is does not predict giving away all the
money. Older students actually appear less likely to give away all the money
(p<0.05) although the marginal effect is not large. One’s expectations of how
much others will allocate to charity predict both the amount one donates and
whether or not one donates all $100. As before the influence of one’s best friend
appears to be more salient than that of one’s mother, although both matter. And
finally, as in Table 2, the joint F-test of the coefficients on the student
interactions terms (minus Student * Male) indicates the effects of the (other)
regressors does not change much from one respondent group to the other (F=1.37,
p=0.21).
6. Discussion
We conduct a representative dictator game in which both students and random
members of the community chose both what charity to support and how much to
donate to the charity. We find systematic differences between the choices of
students and community members. Community members are much more likely to
write in their own charity, community members donate significantly more ($17),
on average, and community members are much more likely (32%) to donate the
8 Because (Ai and Norton, 2003) show that the magnitude of interaction effects in nonlinear
models are often wrong, we present the results of a linear probability model in column (5) of
Table 3.
12
entire $100 endowment. Based on this evidence, it does not appear that student
behavior is very representative in the context of the charitable donations and the
dictator game.
The survey that accompanied our experiment allows us to offer specific
reasons why students are not representative. Among the determinants of
allocation choices, the robust factors appear to be age and sex. Over all, students
give less because young people are less generous and because there is a
differential effect of being a male student. Male students are particularly selfish.
This result echoes findings in a variety of similar contexts. For example, List
(2004) finds that younger people tend to be less cooperative in a field public
goods experiment, men tend to be less likely to give and give less in a fundraiser
and men (and young people) tend to be less cooperative in a television game
show version of the prisoner’s dilemma. In their analysis of the behavior of a
random draw of Dutch society in a trust experiment, Bellemare and Kroger (2005)
show that females and older people are significantly more trusting and that
students, females and people over the ages of 45 are significantly more reciprocal.
Finally, in a bargaining context, Gueth et al. (2005) find that older participants
and women are more averse to inequality indicating that their student data is
also not very representative.
In the future, economists should worry more about the overall
representativeness of their designs. To this point some researchers have begun to
worry about whether or not a convenience sample of students behaves like other
specific populations (e.g. Burns, 1985; Cardenas, 2003 or Burks et al., 2005), and
even in a couple of cases, whether student behavior is representative of a random
sample of the local population (e.g., Fehr et al., 2003 or Dohmen et al., 2005).
However, few experiments also worry about the representativeness of the
underlying task. As we have seen making the decision more representative of the
sort of decisions people normally make about philanthropy has generated very
different behavior that what is typically seen in the context-free lab.
13
7. Tables and figures
N Mean Std. Dev. Mean Std. Dev. Mean Std. Dev.
Allocation 522 68.119 31.937 72.302 31.581 54.694 29.376
Allocate all $100 522 0.404 0.491 0.480 0.500 0.161 0.369
Student (indicator) 524 0.237 0.425 - - - -
Altruism (factor score) 519 0.000 0.857 -0.044 -0.857 0.142 -0.844
Age 519 44.019 17.958 50.789 14.701 21.752 5.010
Male (indicator) 518 0.629 0.483 0.676 0.469 0.475 0.501
Born in USA (indicator) 520 0.923 0.267 0.945 0.229 0.851 0.357
Some College (indicator) 523 0.444 0.497 0.291 0.455 0.935 0.247
College Degree (indicator) 523 0.331 0.471 0.414 0.493 0.065 0.247
Graduate Degree (indicator) 523 0.046 0.209 0.060 0.238 0.000 0.000
Itemize Deductions (indicator) 511 0.474 0.500 0.501 0.501 0.377 0.487
E(Random Participant's Allocation) 516 45.713 24.751 48.125 24.787 38.089 23.128
E(Mother's Allocation) 511 63.970 35.736 62.697 36.447 67.944 33.246
E(Friend's Allocation) 517 56.868 34.501 59.863 35.361 47.379 29.819
Student
TABLE 1: Summary statistics
Overall Community
14
(1) (2) (3) (4) (5)
Student (indicator) -31.236*** -32.043*** -14.111* -11.923* -16.844
(5.402) (5.368) (8.121) (6.452) (29.270)
Altruism (factor score) 5.443** 5.627** 3.928* 3.851
(2.736) (2.810) (2.252) (2.500)
Age 0.595*** 0.515*** 0.530***
(0.177) (0.148) (0.151)
Male (indicator) 0.142 -1.969 2.729
(4.903) (3.937) (4.678)
Born in USA (indicator) 0.218 -6.642 -7.887
(8.489) (6.659) (8.959)
Some College (indicator) 3.865 1.463 0.422
(7.017) (5.646) (5.700)
College Degree (indicator) 12.474* 2.160 2.695
(6.759) (5.451) (5.508)
Graduate Degree (indicator) 25.493** 3.346 2.525
(12.956) (10.612) (10.590)
Itemize Deductions (indicator) 13.757*** 4.689 5.067
(4.755) (3.825) (4.502)
E(Random Participant's Allocation) 0.325*** 0.334***
(0.090) (0.102)
E(Mother's Allocation) 0.300*** 0.326***
(0.056) (0.064)
E(Friend's Allocation) 0.556*** 0.521***
(0.063) (0.070)
Student * Altruism -0.551
(5.826)
Student * Age -0.344
(0.720)
Student * Male -17.045**
(8.559)
Student * USA 7.044
(13.866)
Student * Some College 20.677
(15.746)
Student * Itemize -4.033
(8.705)
Student * E(Random) -0.025
(0.229)
Student * E(Mother) -0.113
(0.134)
Student * E(Friend) 0.158
(0.166)
Intercept 89.238*** 89.180*** 43.815*** -1.341 -4.273
(2.907) (2.888) (13.078) (10.917) (12.962)
Pseudo R-squared 0.009 0.011 0.024 0.086 0.088
N 522 517 501 488 488
TABLE 2: Tobit models of the determinants of allocations
15
(1) (2) (3) (4) (5)
Student (indicator) -0.319*** -0.320*** -0.230*** -0.280*** 0.182
(0.041) (0.042) (0.071) (0.065) (0.214)
Altruism (factor score) 0.019 0.023 0.020 0.013
(0.027) (0.029) (0.033) (0.028)
Age 0.004** 0.004** 0.003*
(0.002) (0.002) (0.002)
Male (indicator) 0.007 0.007 0.047
(0.050) (0.054) (0.050)
Born in USA (indicator) 0.018 -0.041 0.002
(0.093) (0.108) (0.109)
Some College (indicator) 0.025 0.020 0.028
(0.070) (0.078) (0.065)
College Degree (indicator) 0.133** 0.054 0.057
(0.067) (0.074) (0.060)
Graduate Degree (indicator) 0.213* 0.019 0.027
(0.119) (0.118) (0.092)
Itemize Deductions (indicator) 0.128*** 0.073 0.058
(0.047) (0.054) (0.051)
E(Random Participant's Allocation) 0.003*** 0.002**
(0.001) (0.001)
E(Mother's Allocation) 0.003*** 0.002***
(0.001) (0.001)
E(Friend's Allocation) 0.005*** 0.005***
(0.001) (0.001)
Student * Altruism -0.024
(0.044)
Student * Age -0.006**
(0.003)
Student * Male -0.167**
(0.072)
Student * USA -0.098
(0.125)
Student * Some College 0.020
(0.132)
Student * Itemize -0.012
(0.076)
Student * E(Random) 0.001
(0.002)
Student * E(Mother) -0.002
(0.001)
Student * E(Friend) -0.001
(0.001)
Pseudo R-squared or R-squared 0.06 0.06 0.12 0.31 0.33
N 522 517 501 488 488
TABLE 3: Probit models of the determinants of allocating all $100
Note: Marginal effect from Probits reported in columns (1)-(4); in column (5) we report a
linear probability model; standard errors in parentheses; * indicates signifcant at 10%, ** 5%,
16
-1-.75
-.5-.2
50
.25
.5.7
51
Den
sity
0 .1 .2 .3 .4 .5 .6 .7 .8 .9 1
Community Student
Allocation of Mother (fraction)
-1-.75
-.5-.2
50
.25
.5.7
51
Den
sity
0 .1 .2 .3 .4 .5 .6 .7 .8 .9 1
Community Student
Allocation (fraction)
-1-.75
-.5-.2
50
.25
.5.7
51
Den
sity
0 .1 .2 .3 .4 .5 .6 .7 .8 .9 1
Community Student
Altruism (normalized)
-1-.75
-.5-.2
50
.25
.5.7
51
Den
sity
0 .1 .2 .3 .4 .5 .6 .7 .8 .9 1
Community Student
Age (normalized)
-1-.7
5-.5
-.25
0.2
5.5
.75
1D
ensity
0 .1 .2 .3 .4 .5 .6 .7 .8 .9 1
Community Student
Male (binary)
-1-.7
5-.5
-.25
0.2
5.5
.75
1D
ensity
0 .1 .2 .3 .4 .5 .6 .7 .8 .9 1
Community Student
Born in USA (binary)
-1-.7
5-.5
-.25
0.2
5.5
.75
1D
ensity
0 .1 .2 .3 .4 .5 .6 .7 .8 .9 1
Community Student
Some College (binary)
-1-.7
5-.5
-.25
0.2
5.5
.75
1D
ensity
0 .1 .2 .3 .4 .5 .6 .7 .8 .9 1
Community Student
College (binary)
-1-.7
5-.5
-.25
0.2
5.5
.75
1D
ensity
0 .1 .2 .3 .4 .5 .6 .7 .8 .9 1
Community Student
Graduate School (binary)
-1-.7
5-.5
-.25
0.2
5.5
.75
1D
ensity
0 .1 .2 .3 .4 .5 .6 .7 .8 .9 1
Community Student
Itemize Deductions (binary)
-1-.75
-.5-.2
50
.25
.5.7
51
Den
sity
0 .1 .2 .3 .4 .5 .6 .7 .8 .9 1
Community Student
Allocation of Random Participant (fraction)
-1-.75
-.5-.2
50
.25
.5.7
51
Den
sity
0 .1 .2 .3 .4 .5 .6 .7 .8 .9 1
Community Student
Allocation of Close Friend (fraction)
FIGURE 1: Is there common support among the treatment groups?
17
FIGURE 2(a): Frequency each charity was chosen
585225
125
615100
455225
4752087
556265
125944
21901194
1620100195
6709984
13662170
24491586
4302049
4399
0 1,000 2,000 3,000 4,000 5,000 6,000 7,000 8,000Sum of Allocations
Student
Community
VPRVLTUWUSO
UNICEFOther
NCHforH
HSDwoBARC
AIADAACS
VPRVLTUWUSO
UNICEFOther
NCHforH
HSDwoBARC
AIADAACS
FIGURE 2(b): Total allocated to each charity
105
2
102
94
634
107
217
2917
211
482
1418
3130
246
3165
0 10 20 30 40 50 60 70 80 90Frequency of choice
Student
Community
VPRVLTUWUSO
UNICEFOther
NCHforH
HSDwoBARC
AIADAACS
VPRVLTUWUSO
UNICEFOther
NCHforH
HSDwoBARC
AIADAACS
18
8. Appendix - Experimental Protocol
Section 2: Splitting $100
We begin the survey with a three-part decision-making task that involves real money. In this task
you will allocate $100 between yourself and a charity of your choice. You will simply decide how
much of the $100 you want us to send directly to you and how much you want us to send to the
charity. The funds for this part of the survey have been provided by the National Science
Foundation. We expect that 500 people will respond to this survey. When we have collected 500
responses we will randomly pick 50 people and implement their decisions. This means that you
have a 1 in 10 chance of having your choice implemented. In other words, for 1 in 10 people we
will send you and/or the charity that you select actual money. Therefore, you should consider your
choices carefully.
The first thing that you will do is choose a charity. Then you will choose how to allocate $100
between yourself and the charity that you picked. If you are one of the 50 chosen participants,
your choice will be implemented and you and/or your charity of choice will receive the amounts of
money that you have selected.
Part A:
Please choose the charity that you want to receive your donation. Pick one of the following
charities or write in a charity at the bottom:
o American Red Cross
o United Way
o Vermont Public Radio
o Amnesty International
o American Cancer Society
o Doctors without Borders
o United Service Organizations (USO)
o UNICEF
o Vermont Land Trust
o Humane Society of the United States
o Habitat for Humanity
o The Nature Conservancy
o American Diabetes Association
o Other:_______________________________________
Part B:
Choose the amount of money that you want us to allocate to the charity of your choice. The
remaining money will be sent in the form of an anonymous VISA gift card directly to you.
19
Allocate ________________ of the $100 to my charity of choice and send the rest to me.
Section 3: Attitudes
Part A:
On the following pages there are phrases describing people’s behaviors. Please use the rating scale
below to indicate how accurately each statement describes you. Describe yourself as you generally
are now, not as you wish to be in the future.
1. Make people feel welcome.
2. Like to help others.
3. Feel sympathy for those who are worse off than myself.
4. Believe that criminals should receive help rather than punishment.
5. Believe that the poor deserve our sympathy.
6. Am indifferent to the feelings of others.
7. Make people feel uncomfortable.
8. Turn my back on others.
9. Don’t like to get involved in other people’s problems.
10. Have little sympathy for the unemployed.
20
9. Bibliography
Ai, Chunfong and Norton, Edward, 2003. Interaction terms in logit and probit
models. Economics Letters, 80, 123-129.
Barchard, Kimberly, 2004. The Nature and Measurement of Emotional
Intelligence Abilities: Basic Dimensions and Their Relationships with
Other Cognitive Ability and Personality Variables. Educational and
Psychological Measurement, 64(3), 437-462.
Bellemare, C. and Kroger, S., 2005, On representative social capital, CIRPEE
Working Paper 05-04.
Benz, Matthias and Meier, Stephan, 2005, Do People Behave in Experiments as
in Real Life? Evidence from donations, University of Zurich, Institute for
Empirical Research in Economics Working Paper No. 248.
Botelho, Anabela, Harrison, Glenn, Hirsch, Marc and Rutstrom, Elisabet, 2005,
Bargaining Behavior, Demographics and Nationality: What can the
experimental evidence show? In: Jeffrey Carpenter, Glenn Harrison and
John List (Eds.), Field Experiments in Economics. JAI Press, Greenwich,
Conn. and London, pp. 337-372.
Brunswik, Egon, 1956, Perception and the representative design of experiments.
University of California Press, Berkeley.
Burks, Stephen, Carpenter, Jeffrey and Goette, Lorenz, 2005, Performance Pay
and the Erosion of Worker Cooperation: Field experimental evidence,
Department of Economics, Middlebury College Working Paper.
Burns, Penny, 1985, Experience and decision making: A comparison of students
and businessmen in a simulated progressive auction. In: Vernon Smith
(Ed.), Research in Experimental Economics. JAI Press, Greenwich, CT.
Camerer, Colin, 2003, Behavioral Game Theory: Experiments on Strategic
Interaction. Princeton University Press, Princeton.
Camerer, Colin and Thaler, Richard, 1995. Anomalies: ultimatums, dictators
and manners. Journal of Economic Perspectives, 9(2, Spring), 209-219.
21
Cardenas, Juan Camilo, 2003, Bringing the Lab to the Field: More than
Changing Subjects, Department of Economics, Javeriana University
Working Paper.
Carpenter, Jeffrey, Burks, Stephen and Verhoogen, Eric, 2005a, Comparing
Students to Workers: The Effects of Social Framing on Behavior in
Distribution Games. In: Jeffrey Carpenter, Glenn Harrison and John List
(Eds.), Field Experiments in Economics. Research in Experimental
Economics. JAI/Elsevier, Greenwich, Conn. and London, pp. 261-290.
Carpenter, Jeffrey, Verhoogen, Eric and Burks, Stephen, 2005b. The Effect of
Stakes in Distribution Experiments. Economics Letters, 86(3), 393-398.
Costa, P. T. and McCrae, R. R., 1992, Revised NEO Personality Inventory
(NEO-PI-R) and NEO Five-Factor Inventory (NEO-FFI) professional
manual. Psychological Assessment Resources, Odessa, FL.
Dohmen, Thomas, Falk, Armin, Huffman, David, Sunde, Uwe, Schupp, Jurgen et
al., 2005, Individual risk Attitudes: New evidence from a large,
representative, experimentally-validated survey, IZA DP No. 1730.
Eckel, C. and Grossman, P., 1996. Altruism in Anonymous Dictator Games.
Games and Economic Behavior, 16, 181-191.
Fehr, Ernst, Fischbacher, Urs, Rosenbladt, Bernhard von, Schupp, Jurgen and
Wagner, Gert, 2003, A Nation-Wide Laboratory Examining Trust and
Trustworthiness by Integrating Behavioral Experiments into
Representative Surveys, University of Zurich, Institute for Empirical
Research in Economics Working Paper #141.
Fong, Christina, 2005, Empathic Responsiveness: Evidence from a Randomized
Experiment on Giving to Welfare Recipients, Carnegie Mellon,
Department of Social and Decision Sciences Working Paper.
Forsythe, R., Horowitz, J., Savin, N.E. and Sefton, M., 1994. Fairness in Simple
Bargaining Experiments. Games and Economic Behavior, 6, 347-369.
Gueth, Werner, Schmidt, Carsten and Sutter, Matthias, 2005. Bargaining outside
the lab: A newspaper experiment of a three-person ultimatum game. The
Economic Journal, forthcoming.
22
Harrison, Glenn and List, John, 2004. Field Experiments. Journal of Economic
Literature, 42(December), 1009-1055.
Henrich, Joseph, McElreath, Richard, Barr, Abigail, Ensminger, Jean, Barrett,
Clark et al., 2006. Costly Punishment Across Human Societies. Science,
312(23 June 2006), 1767-1770.
Hogarth, Robin, 2005. The challenge of representative design in psychology and
economics. Journal of Economic Methodology, 12(2), 253-263.
List, John, 2004. Young, Selfish and Male: Field Evidence of Social Preferences.
The Economic Journal, 114(January), 121-149.