aluminium content of spanish infant fdadun.unav.edu/bitstream/10171/45632/1/navarroandalvarez2003...
TRANSCRIPT
ALUMINIUM CONTENT OF SPANISH INFANT FORMULA
Navarro-Blasco I. and Alvarez-Galindo J.I.
University of Navarra, Faculty of Sciences, Department of Chemistry, Pamplona (Navarra), E-31.080, Spain
Nº of pages: 38
Nº of tables: 7
Nº of figures: 5
Keywords: Aluminium, Infant formula, Drinking water, Daily Intake, Provisional Tolerable Weekly Intake.
Short title: Aluminium content of Spanish Infant Formula
Please, send all correspondence to:
Dr. Iñigo Navarro-Blasco Dpto. de Química y Edafología Fac. de Ciencias Universidad de Navarra C/ Irunlarrea s/n 31.080 Pamplona (Navarra) Spain Phone: +34 948 42 56 00 Fax: +34 948 42 56 49 E-mail: [email protected]

2
Aluminium Content of Spanish Infant Formula
Navarro-Blasco I. and Alvarez-Galindo J.I. University of Navarra, Faculty of Sciences, Department of Chemistry, Pamplona (Navarra), E-31.080, Spain
Abstract
Aluminium toxicity has been relatively well documented in infants with impaired renal
function and premature neonates.
The aims of this study were to analyse the concentration of aluminium in the majority of
infant formulae sold commercially in Spain, to determine the influence of aluminium
content in the tap water in reconstituted powder formulae and to estimate the theoretical
toxic aluminium intake in comparison with the PTWI, and lastly, to discuss the possible
interactions of certain essential trace elements added to formulation with aluminium
according to type or main protein based infant formula.
A total of 82 different infant formulae from 9 different manufacturers were studied.
Sample digestion was simulated in a closed acid-decomposition microwave system.
Aluminium concentration was determined by atomic absorption spectrophotometry with
graphite furnace.
In general, the infant formulae studied provide an aluminium level higher than that found
in human milk, especially in the case of soya, preterm or hydrolysed casein-based
formulae.
Standard formulae provide lower aluminium intakes amounting to about 4 % PTWI.
Specialised and preterm formulae result in moderate intake (11 – 12 % and 8 – 10 %
PTWI, respectively). Soya formulae contribute the highest intake (15 % PTWI).
Aluminium exposure from drinking water used for powder formula reconstitution is not
considered a clear potential risk.
In accordance with the present state of knowledge about aluminium toxicity, it seems
prudent to call for continued efforts to standardise routine quality control and reduce
aluminium levels in infant formula as well as to keep the aluminium concentration under
300 g l-1 for all infant formulae, most specifically those formulae for premature and low
birth neonates.

3
Introduction
Aluminium is the most abundant metallic element, constituting about 8 % of
earth’s crust. It occurs naturally under several inorganic or organic chemical forms.
Aluminium has an omnipresent character in nature. It is found in the environment
both as a result of natural processes and from anthropogenic sources.
Exposure of adults to aluminium occurs through drinking water, food additives
and antacids or buffered analgesics. However, aluminium and its compounds appear to be
poorly absorbed and it is eliminated effectively in the urine. It has also been reported that
neonates are more susceptible to exposure because of their greater intestinal absorption as
a consequence of the immature gastrointestinal tract (Sedman et al.1985).
Aluminium toxicity is associated with dementing encephalopathy, osteomalacia
and anaemia in patients with renal failure who were receiving dialysis or oral aluminium
containing phosphate binders.
In infants, aluminium toxicity has been relatively well documented in the case of
neonates with impaired renal function, and ill premature or low birth weight neonates
(Sedman et al.1984a, b, Moreno et al. 1994, Puntis et al. 1986, Bishop et al. 1997). High
aluminium levels in infant formulae have been implicated in aluminium intoxication in two
infants with neonatal uraemia (Freundlich et al. 1985, 1990).
In this respect, it is clear that infants, and especially preterm neonates, display a
narrow tolerance to aluminium because of immaturity in the tissues and organs involved in
its metabolism. Thus, human milk does represent the pattern of non essential elements
most suitable for infants at term. Knowledge of the aluminium content in human milk
serves as the basis for formulating appropriate substitutes.
Regardless of the wide variability, the aluminium content in human milk is lower
that that found in infant formulae, between 3 and 160 times according to data from
bibliographical references (Koo et al. 1988, Baxter et al. 1991, Simmer et al. 1990,
Krachler et al. 2000, Coni et al. 1990, Ballabriga et al. 1994, Fernández-Lorenzo et al.
1999). It is thus possible to suggest a reference aluminium range of 3 - 79 g l-1 to be
expected in human milk. Ballabriga et al. (1994) and Fernández-Lorenzo et al. (1999)
obtained an aluminium content in Spanish human milk of 6.5 ± 5.3 g l-1 (n = 16, range 0.9
– 19.8 g l-1) and 23.9 ± 9.6 g l-1 (n = 45, range 7 - 42 g l-1), respectively.

4
In this respect, given the evident toxicological impact of aluminium on neonates it
is desirable that infant formulae should be proportionally similar or inferior in aluminium
concentrations to those in human milk.
The high aluminium content found in certain infant formulae with complex
manufacturing processes, has led to a call for an evaluation of aluminium levels, mainly in
both soya and preterm formulae, from international paediatric organisms (AAP 1996).
The aims of this study were to analyse the concentration of aluminium in the
majority of infant formulae sold commercially in Spain, to determine the influence of
aluminium content in the tap water on final concentration in reconstituted powder
formulae, to estimate the theoretical toxic aluminium intake in comparison with the
Provisional Tolerable Weekly Intake (PTWI) established by the joint FAO/WHO Expert
Committee on Food Additives (WHO 1989), and finally, to discuss the possible
interactions of certain essential trace elements added to formulae with aluminium
according to type or main protein based infant formula.
Material and Methods
Sample collection
Infant formula
Most infant formulae were purchased directly from manufacturers, and the rest of
them in a distribution company in Pamplona (Spain). A total of 82 different infant
formulae from 9 different manufacturers were studied. Formulae included both powder (n
= 61) and ready-to-use preparations (n = 14), such as those based on cow’s milk (n = 68)
or soy-based formulae (n = 7). Cow’s milk-based formulae included: preterm formula (n =
7), starter formula (adapted (n = 16) and non adapted (n = 4)), follow-up formula (n = 19)
and specialised formula (hypoallergenic (n = 12), designed for lactose intolerant (n = 7), or
inborn errors of metabolism (n = 10) formulae).
Infant formulae were stored in accordance with the directions on the label.
Containers were kept in the in the absence of light at room temperature in a humidity
controlled room.
Drinking water

5
Samples of drinking water were collected in duplicate from the Community of
Navarra (Spain) in both urban and rural areas.
Thirty-nine tap water sampling points were selected according to a population
census provided by the local office of the National Statistical Institute and piping
information obtained from several public water treatment plants in the Community.
Eighteen samples were taken from populations in rural areas and twenty one samples in
Pamplona (capital of province).
A strict protocol was thus established to carry out tap water sampling.
Sample treatment
Special care was devoted to this phase to minimise the risk of adventitious
contamination when handling. Handling rules were adopted to minimise every possible
source of contamination from the sampling step onwards, since any mistake in handling
would nullify the validity of the results.
All plastic material (low density polyethylene) or implements used which came
into contact with the samples (infant formulae or tap water) were cleaned previously in 5
% nitric acid solution (Merck, Darmstadt, Germany) for six days and later rinsed three
times with ultrapure water before utilisation.
Infant formula containers were opened in the clean laboratory under flow laminar
bench, using vinyl talc-free gloves (Rotiprotect, Carl Roth, Karlsruhe, Germany) and
plastic material (Plastibrand, Brand, Wertheim, Germany) to perform the sampling.
Infant formula samples were placed in high pressure Teflon digestion bombs and
digested with subboiling nitric acid (Merck, Darmstadt, Germany) in a closed acid-
decomposition microwave system (Milestone MLS 1200, Millestone s.r.l., Sorisole, Italy).
The solutions obtained were then diluted with ultrapure deionised water and kept
in frozen storage at -20 ºC until analysis. Samples were digested in triplicate. Sampling
and treatment operations have been described previously in greater detail (Navarro and
Alvarez 2002).
In the case of drinking water samples, to avoid flocculation or losses by
adsorption to the plastic walls in sampling containers always after measuring pH, 1 mL of
subboiling nitric acid per litre was added until approximately pH = 2, and the solution was
stored at 4 ºC until analysis.
6
Analytical methods
Aluminium concentration was determined by graphite furnace atomic absorption
spectrometry (GFAAS, GBC GF 2000, Dandenong, Victoria, Australia). The operating
parameters and optimising temperature program of the instrument are given in table 1.
[Insert table 1 about here]
Digested samples were diluted in matrix modifier solution. Injections (20 L)
were made in triplicate on L’vov platforms positioned inside pyrolytically coated tubes.
Samples were quantified by reference to a calibration curve obtained for aqueous
standards. Working standard solutions (0 to 80 g l-1) were made up each day by dilution
from stock 1000 mg l-1 standard solution (Merck, Darmstadt, Germany) in enough
subboiling nitric acid to a final acid concentration similar to prepared samples. All
solutions were kept in the covered carousel throughout the analyses to prevent any
contamination.
Two blanks reagents, an aqueous internal standard, and a replicate of infant
formula control, as well as ten infant formula samples were included in each analytical
batch to provide on-going quality control information.
The results of the quality control program, repeatability (precision for triplicates
with a run) and reproducibility (day to day precision), expressed as coefficient of variation,
are presented in table 2.
[Insert table 2 about here]
Analytical blanks were used to correct for any possible contamination during
analysis. When expressed in terms of infant formula, aluminium content was 2.3 ± 0.3 g l-
1. The detection limit was defined as the average of three times the standard deviation of
the reagent blanks and corresponded to 3.3 g l-1 (wet weight) for the infant formulae. In
the case of drinking water, blank reagents consisted of ultrapure water which was
subjected to the same procedures of treatment, storing and mixing with matrix modifier.
Aluminium level in analytical blanks was 0.2 ± 0.5 g l-1, resulting in a detection limit of
1.7 g l-1.
Reference infant formulae were run throughout the course of the study (174.8 ±
4.2 g l-1). The control sample was previously analysed by the standard addition
calibration to minimise matrix effects and an aluminium value of 176 ± 7 g l-1 was

7
obtained. Recovery assays of spiked aluminium at different concentrations in this in-house
control formula were satisfactory, ranging from 96 to 104 %.
An internal aqueous quality control (20 g l-1) was run concurrently with
analytical samples. The mean ± s.d. of aluminium determined was 20.0 ± 1.1 g l-1 (n =
34), with a range of 18.2 – 22.3. The acceptable range established in the quality program
was 17.6 – 22.4 g l-1.
Given the unavailability of adequate reference material based on milk powder
with certified values, IAEA (International Atomic Energy Agency) 155 whey powder was
analysed to provide an estimate of accuracy and to guard against instrument bias. The
obtained result (43.2 ± 2.6 mg kg-1) shows an acceptable agreement with the information
value (non certified) provided from the reference material (53 mg kg-1, ranged 38 – 68).
Iron and zinc concentrations in digested acid solutions were analysed by flame
atomic absorption spectrophotometry (FAAS, GBC GF 2000, Dandenong, Victoria,
Australia) and inductively coupled plasma atomic emission spectrometry with Meinhard
nebulizer (ICP-AES, Jobin Ybon JY 38S Plus Sequential) was used for manganese.
Iron, zinc and manganese calibration curves were accomplished using direct
calibration against aqueous standards. Details of measurements, operating parameters and
trace element quantification have been described elsewhere (Navarro et al. 1996, Navarro
et al. 2000).
The IAEA milk powder A11 was assayed as standard reference material to
validate the analytical method. Standard A11 was mineralised and analysed as stated above
for infant formulae. The values determined (12 independent analytical runs) were: iron,
3.62 ± 0.09 g g-1; zinc, 37.10 ± 0.38 g g-1 and manganese, 0.250 ± 0.021 g g-1; in
comparison with certified values (confidence intervals): iron, 3.65 g g-1 (2.89 – 4.41);
zinc, 38.9 g g-1 (36.6 – 41.2) and manganese 0.257 g g-1 (0.248 – 0.266).
Chemicals
Suprapure nitric acid was purchased from Merck (Merck, Darmstadt, Germany)
and distilled by subboiling before use.
Ultrapure deionised water type Milli Q was used for preparation and/or dilution of
treated sample and standard solutions.
8
Magnesium nitrate was used as matrix modifier for aluminium determination (1,4
g of Mg(NO3)2.6H20 (Merck, Darmstadt, Germany) and 2 ml of Triton X-100 (Sigma, St.
Louis, USA) were diluted in 1 L with ultrapure water).
Statistical Analysis
Statistical analysis was performed with SPSS v.9.0 for windows. Different groups
of samples were compared through non parametric Kruskal-Wallis and Mann Whitney U-
tests or Wilcoxon test for paired groups, with statistical significance set at p < 0.05; and
observed tendencies in some trace element contents with regard to aluminium were
analysed with the Spearman coefficient.
Results and Discussion
Aluminium contents in infant formula
Table 3 shows the aluminium concentrations for each of the types of infant
formulae studied. Aluminium concentration found in powdered infant formula was
calculated according to the manufacturer’s dilution instructions to express the content in
g l-1.
[Insert table 3 about here]
The wide variability in aluminium content found in some of the formulations
included in this study is of special relevance. Because of this, both mean and median
values were included in the results table, although we have only used the median value as
the most representative parameter.
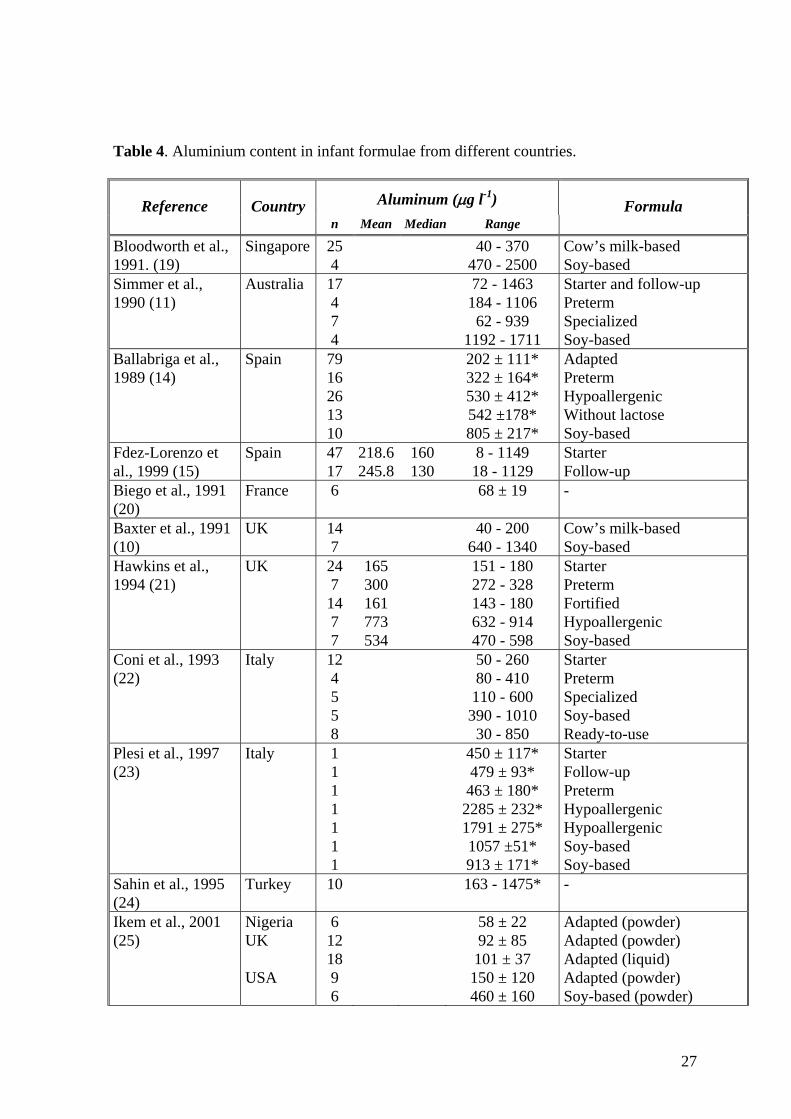
In this sense, the range of aluminium determined in analysed formulae reflects
findings reported in the literature by several researchers listed in table 4.
[Insert table 4 about here]
This notorious variability is a result of the way aluminium is incorporated in
infant formulae. Obviously the total aluminium content comes from: a) the source of raw
material, that is cow’s milk or isolated soy protein; b) it could be included during
processing from metallic surfaces of equipment or utensils; c) it could be contributed by
the additives or mineral supplements added, and lastly, d) it might be transferred from the

9
container during storage. Each of these factors could explain by itself the high variability
in the aluminium concentrations found in the different infant formulae studied.
In a first view of aluminium levels in different types of infant formula, it is easy to
observe the lower aluminium values determined in standard formulae (starter and follow-
up formulae) in comparison with specialised, preterm and soya formulae. Subsequently,
this fact was verified by the Kruskal-Wallis test (p = 0.003).
As previous studies have reported (Koo et al. 1988, Baxter et al. 1991, Simmer et
al. 1990, Ballabriga et al. 1994, Bloodworth et al. 1991, Ikem et al. 2002, Dabeka and
Mckenzie 1990), the lower aluminium values were detected in milk based formulae, to be
more specific in this study, in starter formulae (adapted, 196 ± 152 g l-1 and non adapted
231 ± 128 g l-1) and follow-up formulae (272 ± 189 g l-1). These levels are in agreement
with those found by other American and European researchers (Ballabriga et al. 1994,
Fernández-Lorenzo et al. 1999, Hawkins et al. 1994, Coni et al. 1993, Ikem et al. 2002).
Lower levels found in raw cow’s milk show that this by itself is not necessarily the
greatest source of aluminium. However, large aluminium ranges observed in standard
formulae are indicative of the potential for contamination during manufacture.
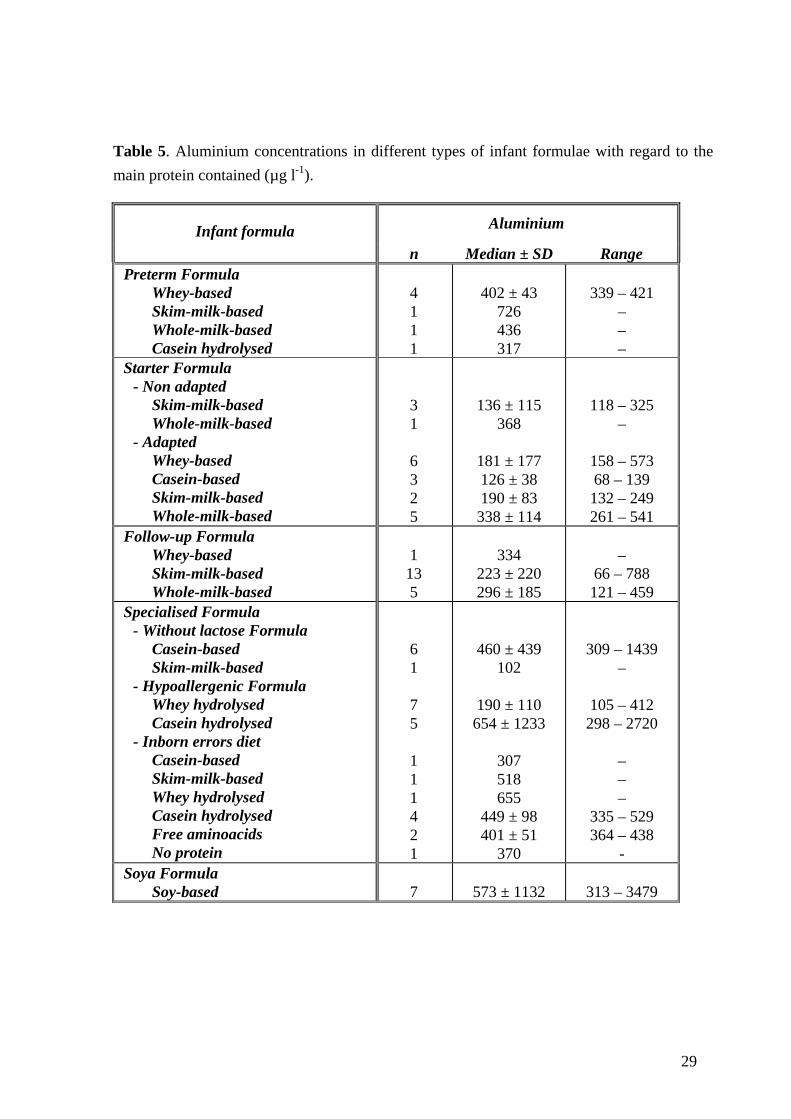
It is well known that aluminium is associated with proteins. Table 5 summarises
aluminium levels found in different infant formulae, focusing on the main protein
contained.
[Insert table 5 about here]
In this respect, there is clear evidence about the involvement of intrinsic
aluminium coming from a protein source on the final level found in standard formulae. The
highest aluminium content is provided by those formulae based on whole milk (adapted
starter formulae: 338 ± 114 g l-1, non adapted starter formulae: 368 g l-1 and follow-up
formulae: 296 ± 185 g l-1), followed by skim-milk-based formulae (adapted starter
formulae: 190 ± 83 g l-1, non adapted starter formulae: 136 ± 115 g l-1 and follow-up
formulae: 223 ± 220 g l-1) and lastly, formulae that include whey proteins (adapted starter
formulae: 181 ± 177 g l-1) or casein (adapted starter formulae: 126 ± 38 g l-1) in its
composition (Table 5).
The present tendency to reduce the protein content, and to replace different
proteins with whey protein to be rather like the protein profile found in human milk, may
determine the aluminium content in infant formula, which is advantageous in this respect,
in the newer formulations.
10
Nevertheless, the complex manufacturing process of specialised formulae seems
to play an important role in the degree of aluminium contamination. The highest
aluminium value was determined in formulae designed for inborn errors of metabolism
(443 ± 112 g l-1), an intermediate level was found for formulae without lactose (399 ±
451 g l-1) and finally, the lowest content was supplied for hypoallergenic formulae (294 ±
945 g l-1).
The probable source of aluminium contamination might be mainly a consequence
of the formula ingredients added (calcium and phosphate salts, vitamins and other
minerals) and in second place, the complex processing in which infant formulae come into
contact with aluminium-containing surfaces and equipment for the long time that their
preparation requires.
A large amount of aluminium in formulae designed for diverse pathologies is an
additional source of aluminium for infants fed on these. Although this is unclear, it may
represent a health hazard for this risk group of infants. Among the formulae without
lactose, mainly casein-based formulae, one formula with a high aluminium level bring out
(1439 g l-1). Similarly, there were two hypoallergenic formulae with aluminium values of
2649 and 2720 g l-1, both based on hydrolysed protein (casein hydrolysate) and from the
same manufacturer (Figure 1).
[Insert figure 1 about here]
If table 5 is carefully observed, it is possible to see that aluminium content in
casein hydrolysed hypoallergenic formulae (654 ± 1233 g l-1) is significantly higher (p =
0,015, Mann Whitney U test) than in whey hydrolysed hypoallergenic formulae (190 ± 110
g l-1). These contents are explained by the necessity for aggressive treatment in order to
modify highly the raw material which means that formulae may be exposed to a significant
amount of aluminium during manufacture from the chemicals used, machinery and dust
particles.
Specialised formulae also contain greater quantities of substances such as
calcium, iron, and citrate complexes that may enhance aluminium absorption from the
gastrointestinal tract by unknown mechanisms (Sahin et al. 1995). Thus, it is reasonable to
understand both the increased bioavailability of aluminium and the elevated plasma
concentration noted in the infants fed on casein hydrolysed formulae (Hawkins et al.
1994). These may turn out to be recognised risk factors that must be taken into
consideration.

11
Aluminium content in premature formulae (421 ± 137 g l-1) is significantly
higher than that determined in formulae for infants at term (non adapted starter, p = 0.042
and adapted starter, p = 0.010). This tendency has been supported by many researchers
who provide a similar range of aluminium concentrations (Ballabriga et al. 1994, Hawkins
et al. 1994, Coni et al. 1993, Plessi et al. 1997). They try to explain these high levels as a
consequence of the type of processing or food additives used which contain aluminium.
Aluminium toxicity and the potential impact of these formulae on premature infants’
health is one of the main concerns of international paediatric organisations (WHO 1989).
To date, preterm infant formulae are regarded as a potential source of aluminium
exposure. The risk of aluminium accumulating in these formulae may be raised especially
in preterm infants with renal immaturity linked to a low aluminium clearance due to
decreased urine excretion (Sedman et al. 1984b). Moreover, the hypothesis that aluminium
overload may be due to an increased intestinal absorption during the first weeks of neonate
life has been reported. Both increased absorption and low excretion could explain the high
plasma values observed in healthy premature and low birth weight newborns (Sedman et
al. 1984b, Puntis et al. 1986, Stockhausen et al. 1990).
Aluminium absorption in infancy has been investigated in a previous study on
antacids (Chedid et al. 1991), and the risk of toxicity as a result of exposure to drugs
containing aluminium or aluminium contamination of infant formulae has been confirmed.
In addition, adverse effects on bone mineralization associated with high plasma aluminium
levels in infants have been reported (Bougle et al. 1997). Although direct inhibiting effects
of aluminium on bone mineralization have not fully been explained, they seem to be a
consequence of interactions with both calcium and phosphorus enhanced by the high
aluminium content in premature formulae.
In spite of this, in view of our present knowledge and taking into account the
nutritional benefits of premature formulae, it is necessary to keep up to date with these
formulations and request from manufacturers the need for a total restructuring of older
production processes in order to achieve a further reduction in the aluminium levels in this
kind of infant formula.
Concentrations of aluminium in the soya formulae ranged from 313 – 3479 g l-1,
median (573 ± 1132 g l-1). Undoubtedly, these formulae provide the highest aluminium
levels of all studied formulae and as table 3 reveals, the aluminium content is significantly
higher than in standard formulae (adapted formulae, p = 0.001; non adapted formulae, p =
0.024 and follow-up formulae, p = 0.004). High levels have also been reported by other

12
studies (Table 4), calling into question the nutritional safety of soya formulae for neonate
feeding.
Aluminium is naturally present in soy beans, and aluminium impurities which are
contained in other basic components of the soya formulae or caused by contamination
during manufacture represent the most probable reasons for such high aluminium levels in
soya formulae.
Regarding the manufacture of soya formulae, its preparation requires crushing,
refining and washing procedures to isolate the soy protein from soya bean. A strong
treatment with calcium hydroxide, which often contains high amount of aluminium as an
impurity, is carried out.
It therefore seems likely that an important part of the final aluminium
concentration in soya formulae may be attributed to adventitious contamination during the
isolation more than the intrinsic aluminium content of soya beans.
Among the soya formulae, we detected one formula with a very high aluminium
value (3479 g l-1) with respect to other infant formulae. This aluminium level is not
surprising if we compare it with values determined in other national or international
studies, where similar ranges are found or even several formulae have a higher aluminium
concentration of anything up to 5076 g l-1 (Woollard et al. 1990).
In order to know the influence of the aggregation state on the amount of
aluminium found in infant formula, we evaluated statistically the aluminium contents in
both powder and ready-to-use liquid formulae.
The industrial production process of milk-based powder formulae involves several
operations (warming, centrifugation, drying, homogenising, bleeding, sterilisation,
packing, etc.), which bring it into contact it with metallic surfaces of industrial machinery.
In the case of ready-to-use formulae, processing is quite different. From the
perspective of this study, the critical process for liquid formulae is the treatment in cationic
interchange columns, besides the addition of vitamins or mineral salts.
Considering the 14 pairs of infant formulae with both commercially available
formulae (powder and liquid forms), the aluminium content did not differ significantly (p =
0.060, Wilcoxon’s test) between powder and liquid data groups, although the aluminium

13
content in ready-to-use formulae had a tendency to be lower than in powder formulae, as in
recent studies (Ikem et al. 2002) and in contrast to earlier findings (Gruskin 1991).
Aluminium levels for both powder and liquid formulae over the different types of
infant formulae are summarised in table 6. At first glance, the difference found in
aluminium could be surprising but we must keep in mind the fact that liquid formulae
started to be sold in Spain during the past decade, and were manufactured with a more
novel and, in principle, purified process of handling and preparation, in contrast to older
powder infant formulae.
[Insert table6 about here]
Manufacturer and determined values
In general, the manufacturing process has been described as an important source
of exogenous aluminium contamination.
It is obvious that commercial brands do not include any value for aluminium in
the information label. Nevertheless, it is to be expected that this metal should be included
in the quality control program and manufacturers should try to obtain the lowest
aluminium concentration in infant formula as far as possible.
In order to compare, figure 1 shows concentrations of aluminium determined in
the different infant formula belonging to the nine manufacturers evaluated.
The meticulous care shown by manufacturers 7 and 2 (150 ± 90 g l-1, n = 5 y 142
± 929 g l-1, n = 14, respectively) is curious, while manufacturers 3 and 6 (436 ± 67 g l-1,
n = 7 y 416 ± 126 g l-1, n = 8) show quite the opposite with a large range of aluminium
concentration (338 – 541 g l-1 y 261 – 573 g l-1, respectively). It is also necessary to
mention manufacturer 8 which includes numerous (n = 16) and complex formulations in its
stock with a discrete aluminium contribution from prepared infant formulae.
When the different infant formulae were considered as a whole, median
aluminium content was 340 g l-1 (where percentiles 25 and 75 were 177 and 478 g l-1,
respectively). However, seen separately median aluminium values of different commercial
households ranged from 142 to 436 g l-1.

14
Considering both points, it would not be imprudent to recommend an upper limit
to be set in infant formulae around 300 – 400 g l-1, which manufacturers could take on
without excessive economic cost.
In view of these results and taking into consideration the program to reduce the
level of aluminium in infant formula launched by the manufacturing industry in other
European countries (Baxter et al. 1991), it seems suitable to call for an effort a) to control
as far as possible the critical points of aluminium contamination, b) to modify the
industrial handling process in order to obtain formulations in which the concentration of
aluminium is less than 300 g l-1 in premature and standard formulae, and 400 g l-1 in the
other formulae, a criterion which is a little more restrictive than the recommendation
suggested by Simmer et al. (1990), and c) to analyse frequently or routinely the aluminium
contents, especially in those formulae with potential impact such as premature or soya
formulae.
Estimated dietary aluminium intake
The possibility that aluminium could cause health problems in infants justifies the
comparison of estimated dietary intake provided by infant formulae studied with the
Provisional Tolerable Weekly Intake (PTWI, 7 µg kg-1 of weigh) established by the Joint
FAO/WHO Expert Committee on Food Additives (WHO 1989).
Considering that the newborn in each age period observes a similar feeding
regimen, in comparison with the PTWI, we have worked out a weekly aluminium intake
for infants fed on different types of infant formulae, observing separately the special case
of preterm newborns. The daily intake of formulae is estimated according to recommended
doses and the feeding tables specified by the manufacturers.
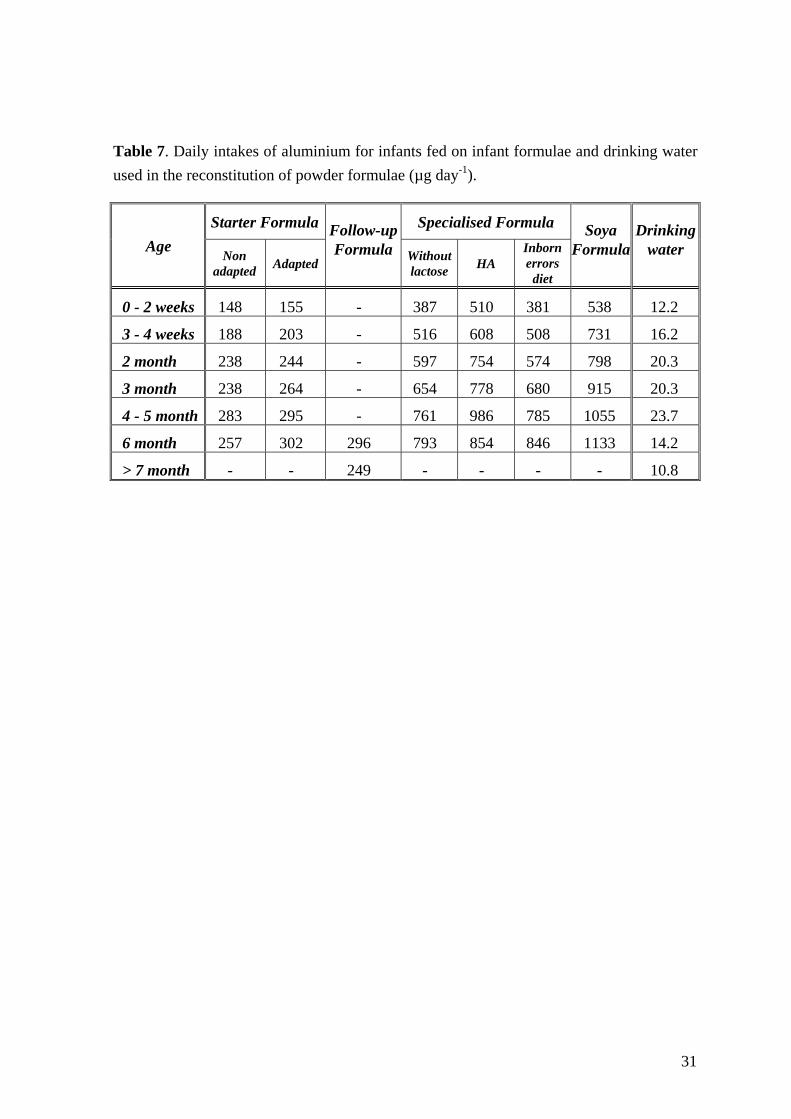
Table 7 shows the daily amount of aluminium supplied by different infant
formulae.
[Insert table 7 about here]
Dietary aluminium intake estimated by Dabeka and Mckenzie (1990) through
human milk was 2 µg day-1 and 3 µg day-1 for Canadian infants 0 – 1 and 1 – 3 months old,
respectively. If we estimate a human milk reference value from published levels (3 – 79 µg
l-1), assuming a daily milk intake of 200 ml kg-1, the range determined implies a daily

15
aluminium intake of 2.4 – 63.2 µg day-1 (0.6 – 15.8 µg kg-1 day-1), slightly higher than
previous estimated intakes.
The great difference observed in comparison with the aluminium supply from
human milk is well known. This fact explains the special interest aroused in Paediatric
organisations in reducing the aluminium content in artificial feeding for infants.
Figure 2 compares weekly the aluminium intake (percentage of the PTWI)
estimated for each type of infant formulae studied. The differences between standard
formulae and soya or specialised formulae observed before, are reflected clearly.
[Insert figure 2 about here]
Starter and follow-up formulae provide the lowest aluminium intake, about 4 % of
the PTWI. Specialised formulae, with hypoallergenic formulae in the first place, yield an
intermediate intake (11 – 12% of the PTWI). Finally, soya formulae contribute the highest
intake (15 % of the PTWI).
Preterm intakes were calculated taking into account the paediatric specifications
or manufacturers guidelines and infant weight. Figure 3 contains the estimated weekly
aluminium intake by infants fed on preterm formulae.
[Insert figure 3 about here]
These formulae provide a toxic intake similar to special formulae, around 8 – 10
%. This PTWI percentage is far from that supplied by Spanish human milk (0.1 %) and the
theoretical value found with the upper limit human milk reference (1.3 %). Once again, the
need is highlighted to monitor aluminium contents in this kind of infant formula, because
of the risk of developing aluminium toxicity, with the only objective of obtaining a
maximum aluminium level similar to the upper limit for human milk. Further studies are
therefore required to ensure the safety of formulae for preterm and low weight infants.
Finally, it is possible to evaluate the hypothetical case of an infant formula
exceeding the aluminium limit to find the PTWI. This formula should contain an
aluminium level ranging from 6000 – 8000 g l-1. None of the formulae analysed provides
more than this interval of values.
If we consider the highest aluminium level determined in the infant formulae
analysed (3479 g l-1, soya formula), daily aluminium intakes would be approximately 45
– 55 % of PTWI.

16
In spite of everything, it is necessary to be prudent when establishing permissible
aluminium intakes, since the absolute calculations must be taken as an approximate
estimate, although they are certainly useful to evaluate and make a conservative
recommendation about aluminium content in infant formulae.
Complementary contribution to daily aluminium intake from drinking water
Aluminium concentration in natural waters varies significantly depending on
numerous physicochemical, mineralogical and geochemical factors.
Water treatment in purifying plants includes a coagulation process using
aluminium sulphate to remove organic matter. The beneficial effect of the use of this metal
in treated water is recognised. Nevertheless, in spite of good operating conditions, a
residual amount is retained and supplied in drinking water. European Community
legislation (Directive 80/778/EEC) and WHO guidelines have established an acceptable
aluminium concentration of 200 g l-1 in drinking water (Commission of the European
Communities 1980, WHO 1998).
This authorised aluminium level is similar to that found in standard infant
formula. As a consequence, it is interesting to evaluate aluminium exposure from tap water
and its relative contribution to dietary intake of infants fed on reconstituted powder
formulae.
In accordance with the legislation currently in force, taking into consideration the
marked daily intake of newborns, tap water used in prepared formulae could supply similar
aluminium amounts to those provided by infant formulae on their own.
Aluminium content determined is 22.6 ± 4.5 g l-1 (range 4.5 – 172.4 g l-1).
There is no significant difference between aluminium levels found in rural (24.2 ± 9.3 g l-
1) and urban groups (22.3 ± 2.2 g l-1). The mean aluminium value was used to establish
the influence of aluminium content in drinking water on the final concentration of
reconstituted infant formulae.
The amount provided by tap water used in reconstitution of premature formulae is
similar to the lower limit found in human milk, approximately 0.05 – 0.06 % of the ISTP.
At the same time, aluminium supply to another infant formulae, is also low, about 10 % of
standard formulae and 2 – 3 % of special and soya formulae (table 7).

17
Our results indicate that aluminium exposure from tap water used for formula
preparation is not a clear potential risk. Although it is necessary to know that aluminium
concentration in drinking water can vary significantly depending on the geographic and
geochemical medium where the water supply or spring are sited.
Interactions between aluminium and other trace elements
The levels of trace elements in infant formulae are generally higher than in human
milk. In recent years, considerable changes in the levels of these elements in infant
formulae have been instituted in the light of improved knowledge of infant requirements.
Trace elements normally added to the raw material (cow milk or soy) are supplied
in an inorganic form, sometimes in a high level to compensate for the lower bioavailability
of infant formulae (Brätter 1996). There is little information on the impact of these
changes and added elements on the final concentration of potential toxic trace elements,
including aluminium.
In order to observe the tendency in the levels of certain essential trace elements in
relation to the aluminium level in infant formulae, since some toxic metals and
nutritionally essential elements share common chemical characteristics, a comparative
statistical analysis using the Spearman coefficient between the aluminium and different
trace element contents was carried out.
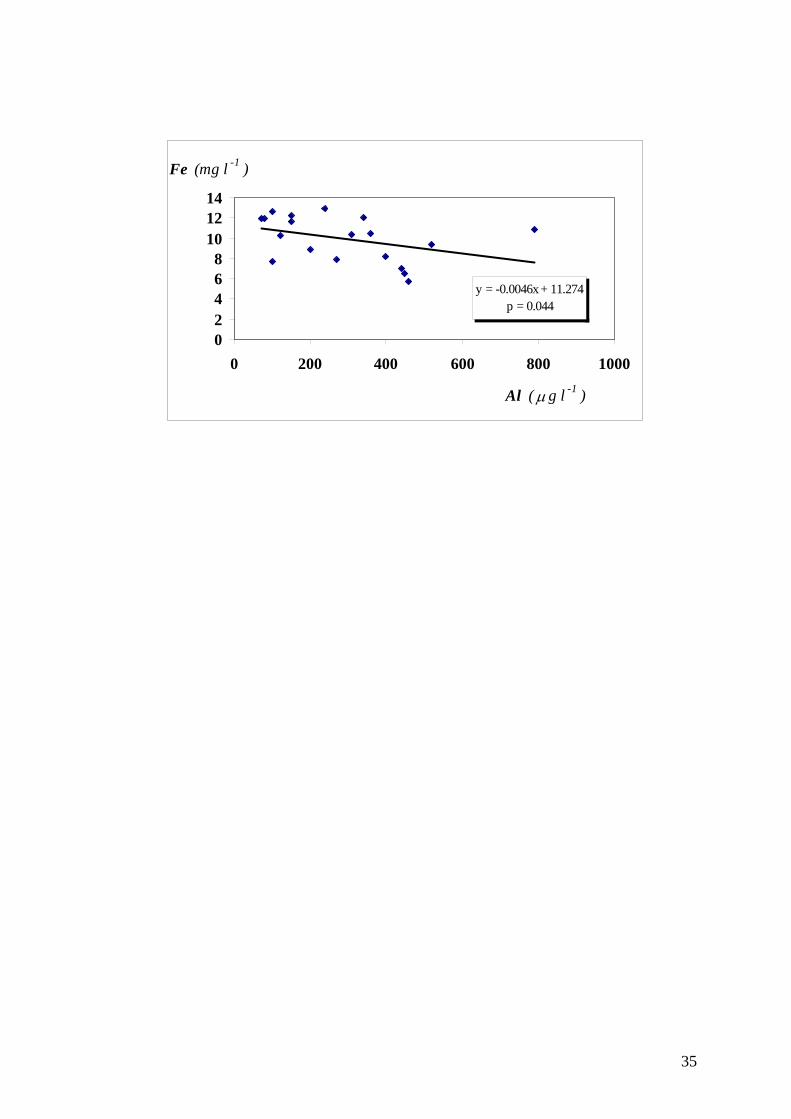
Aluminium behaves similarly to iron in many biological systems (Goyer 1997).
As can be observed in figure 4, an inverse correlation was established for follow-up
formulae between both concentration values (p = 0.044). Cow milk is a very poor source
of iron. 14 % of iron occurs in milk fat, about 24 % is bound to casein, while 29 % is
bound to whey protein and 32 % is associated with a low molecular weight fraction
(Fransson and Lonnerdal 1983). The studied follow-up formulae are mainly based on skim
and whole cow milk. This interaction could be attributed to the lower amount of iron added
to whole-milk-based formulae, which is linked to a higher aluminium content as was
discussed above. On the other hand, for those follow-up formulae based on skim-milk, the
iron supplementation to find the requirement is most important but the manufacturing
process is simpler.
[Insert figure 4 about here]

18
Furthermore, the distribution of iron added to infant formula depends on the
chemical form of iron supplement used. Supplementation with Fe (II) results in a formula
with high iron content in the fat fraction (Hegenauer et al. 1979) whereas if Fe(III) is used,
the iron is bound to casein micelles (Demott and Dincer, 1976). Probably, the existing
correlation in whole-milk-based formulae (p = 0.010) could correspond with the different
chemical form used in iron supplementation and the technological process used by
manufacturers. The same consideration might be established for formulae designed for
inborn errors of metabolism (p = 0.013), although the complexity in formulations included
in these groups does not allow a clear explanation.
Another negative correlation (p = 0.004) was found between zinc and aluminium
concentrations in standard infant formulae (figure 5). This corresponds to changes in
protein profile by manufacturers, since as in cow milk most of the zinc is in the skim milk
fraction and 95 % is associated with casein micelles (Blakeborough et al. 1983, Sing et al.
1989). Lower aluminium and higher zinc concentration were found in casein-based
formulae, followed by intermediate values of both elements in whey and skim-milk-based
formulae and finally, whole-milk-based formulae provide the highest aluminium and
lowest zinc added concentrations. This same tendency is observed for starter and follow-up
formulae by themselves with a statistical significance correlation p = 0.004 and p = 0.030,
respectively.
[Insert figure 5 about here]
Finally, a positive correlation was established in hypoallergenic formulae between
manganese and aluminium contents (p = 0.006). Manganese is distributed in cow milk, 67
% binding to casein, 18 % to low molecular weight proteins and 1 % to lipid fraction
(Lonnerdal et al. 1985). This fits with both higher aluminium and manganese contents
found in hydrolysed-casein-based formulae and lower values of these elements in
hydrolysed-whey-based formulae.
Conclusions
Commercial infant formulae should provide an efficient alternative to human
milk, providing a nutritional source that is safe and adequate to neonate needs when the
human milk supply is not possible or is insufficient.

19
In this regard, human milk is still the reference for micronutrients and non-
essential trace element contents, given that these data may not be obtained from healthy
neonates for ethical reasons.
According to our results, the infant formulae studied provide an aluminium level
that is higher than that found in human milk, especially those formulae of high
technological complexity (premature, specialised and soya formulae).
International paediatric organisations (AAP 1996) request from manufacturers
continued efforts to reduce the aluminium level in infant formulae, bearing in mind mainly
soya and preterm formulae. In this sense, specialised formulae based on hydrolysed protein
like casein must be incorporated in the risk formulae group, due to their high aluminium
content.
High aluminium infant formulae should be evaluated by manufacturers, who
should routinely monitor aluminium concentrations, especially in those formulations
prepared to feed premature or low birth neonates.
In accordance with the present state of knowledge about aluminium toxicity, it is
appropiate to set a maximum guide value for infant formula at 300 g l-1. Firstly, this level
is possible for manufacturers, and in second place, a recent study (Hawkins et al. 1994)
indicated that most infants who consumed infant formulae containing more than this limit,
had a raised plasma aluminium concentration and so may be at risk of aluminium toxicity.
For these reasons, the safe and adequate aluminium level in infant formulae
requires further study. Speciation studies are required in order to establish and characterise
the chemical forms in which aluminium is present in human milk and infant formulae
(Brätter et al. 1998), with the goal of determining the real toxicity of aluminium
compounds and evaluating the true risk of feeding neonates on infant formulae.
References
AAP. American Academy of Pediatrics, 1996, Aluminum toxicity in infants and children.
Pediatrics, 97, 413-416.
Ballabriga, A., Moreno, A., and Domínguez, C., 1994, Aluminium. Annales Nestlé, 52,
118-131.
20
Baxter, M. J., Burrell, J. A., Crews, H., and Massey, R. C., 1991, Aluminium levels in milk
and infant formulae. Food Additives and Contaminants, 8, 653-660.
Biego, G. H,, Joyeux, M., Hartemann, P., and Debry, G., 1998, Determination of mineral
contents in different kinds of milk and estimation of dietary intake in infants. Food
Additives and Contaminants, 15, 775-781.
Bishop, H. J., Moley, R., Chir, B., Day, J. P., and Lucas, A., 1997, Aluminium
neurotoxicity in preterm infants receiving intravenous-feeding solutions. New
England Journal of Medicine, 336, 1557-1561.
Blakeborough, P., Salter, D. N. And Gurr, M. I., 1983, Zinc binding in cow’s and human
milk. Biochemical Journal, 209,505-512.
Bloodworth, B. C., Hock, C. T., and Boon, T. O., 1991, Aluminium content in milk
powders by inductively-coupled argon plasma-optical emission spectrometry. Food
Additives and Contaminants, 8, 749-754.
Bougle, D., Bureau, F., Morello, R., Guillois, B., and Sabatier, J. P., 1997, Aluminium in
the premature infant. Trace Elements and Electrolytes, 14, 24-26.
Brätter, P., 1996, Essential trace elements in the nutrition of infants. Therapeutic Uses of
Trace Elements, edited by J. Nève, P. Chappuis and M. Lamand (New York and
London: Plenun Press), pp. 59-62.
Brätter, P., Navarro, I., Negretti de Brätter, V., and Raab, A., 1998, Speciation as an
analytical aid in trace element research in infant nutrition. Analyst,123, 821-826.
Chedid, F., Fudge, A., Teubner, J., James, S. L., and Simmer, K., 1991, Aluminium
absorption in infancy. Journal of Paediatrics and Child Health, 27, 164-166.
Commission of the European Communities, 1980, Council Directive of 15 July 1980
relating to the quality of water intended for water consumption (80/778/EEC).
Official Journal of European Communities Legislation, L229, 11-29.
Coni, E., Bellomonte, G., and Caroli, S., 1993, Aluminium content of infant formulas.
Journal of Trace Elements and Electrolytes in Health and Disease, 7, 83-86.
Coni, E., Falconieri, P., Ferrante, E., Semeraro, P., Beccaloni, E., Stacchini, A., and Caroli,
S., 1990, Reference values for essential and toxic elements in human milk. Annali
dell’Istituto Superiore di Sanità, 26, 119-130.
21
Dabeka, R. W., and Mckenzie, A. D., 1990, Aluminium levels in Canadian infant formulae
and estimation of aluminium intakes from formulae by infants 0-3 months old. Food
Additives and Contaminants, 7, 275-282.
Demott, B. J., and Dincer, B., 1976, Binding added iron to various milk proteins. Journal
of Dairy Science, 59, 1557-1559.
Fernández-Lorenzo, J. R., Cocho, J. A., Rey-Goldar, M. L., Couce, M., and Fraga, J. M.
1999, Aluminum contents of human milk, cow’s milk and infant formulas. Journal
of Pediatric Gastroenterology and Nutrition, 28(3): 270-275.
Fransson, G. B. and Lonnerdal, B., 1983, Distributions of trace elements and minerals in
human and cow’s milk. Pediatric Research, 17, 912-915.
Freundlich, M., Zilleruelo, G., Abitbol, C., Strauss, J., Faugere, M. C., and Malluche, H.
H., 1985, Infant formula as a cause of aluminum toxicity in neonatal uraemia.
Lancet, ii, 527-529.
Freundlich, M., Zilleruelo, G., Strauss, J., Abitol, C., and Malluche, H. H., 1990, More on
aluminum toxic effects in children with uraemia. The Journal of Pediatrics, 117,
1007-1009.
Goyer, R. A., 1997, Toxic and essential metal interactions. Annual Review of Nutrition, 17,
37-50.
Gruskin, A. B., 1991, Aluminium toxicity in infants and children. Trace Elements in
Nutrition of Children II, edited by R. J. Chandra (New York: Raven Press), pp. 15-
25.
Hawkins, N. M., Coffey, S., Lawson, M. S, and Delves, T., 1994, Potential aluminium
toxicity in infant fed special infant formula. Journal of Pediatric Gastroenterology
and Nutrition, 19, 377-381.
Hegenauer, J., Saltman P., Ludwig, D., Ripley, L., and Bajo, P., 1979, Effects of
supplemental iron and copper on lipid oxidation in milk. I. Comparison of metal
complexes in emulsified and homogenized milk. Journal of Agricultural and Food
Chemistry, 27, 860-867.
Ikem, A., Nwankwoala, A., Odueyungbo, S., Nyavor, K., and Egiebor, N., 2002, Levels of
26 elements in infant formula from USA, UK, and Nigeria by microwave digestion
and ICP-OES. Food Chemistry, 77, 439-447.

22
Koo, W. W., Kaplan, L. A., and Krug-Wispe, S. K., 1988, Aluminium contamination of
infant formulas. Journal of Parenteral and Enteral Nutrition, 12, 170-173.
Krachler, M., Prohaska, T., Koellensperger, G., Rossipal, E., and Stingeder, G., 2000,
Concentrations of selected trace elements in human milk and in infant formulas
determined by magnetic sector field inductively coupled plasma-mass spectrometry.
Biological Trace Element Research, 76: 97-112.
Lonnerdal, B., Keen, C. L., and Hurley, L. S., 1985, Manganese binding proteins in human
and cow’s milk. American Journal of Clinical Nutrition, 41, 550-559.
Moreno, A., Domínguez, C., and Ballabriga, A., 1994, Aluminium in neonate related to
parenteral nutrition. Acta Paediatrica, 83, 25-29.
Navarro, I., and Alvarez, J.I., 2002, Selenium content of Spanish infant formula and human
milk: Influence of protein matrix, interactions with other trace elements and
estimation of dietary intake by infants. Journal of Trace Elements in Medicine and
Biology, in press.
Navarro, I., Martín, A., and Villa, I., 1996, Dietary intake of esential trace elements in
infant nutrition. Prenatal and Neonatal Medicine, 1 (suppl.1), 365.
Navarro I., Alvarez, J.I., and Martín, A., 2000, Estimated daily intakes and concentrations
of essential trace elements in infant formulas. Trace Elements in Man and Animals
(TEMA 10), edited by A.M. Roussel, R.A.Anderson and A.E. Favier (New York:
Kluwer Academic / Plenun Publishers),pp.247.
Plessi, M., Bertelli, D., and Monzani, A., 1997, Determination of aluminium and zinc in
infant formulas and infant foods. Journal of Food Composition and Analysis, 10, 36-
42.
Puntis, J. W., Hall, K., Booth, I. W., 1986, Plasma aluminium and prolonged parenteral
nutrition in infancy. Lancet, ii, 1332-1333.
Sahin, G., Aydin, A., Isimer, A., Özalp, I., and Duru, S., 1995, Aluminium content of
infant formulas used in Turkey. Biological Trace Element Research, 50, 87-96.
Sedman, A. B., Klein, G. C., Merrit, R. J., Miller, K. O., Weber, W., Gill, W. L., Anaud,
H., and Alfrey, A. C., 1985, Evidence of aluminum loading in infants receiving
intravenous therapy. New England Journal of Medicine, 312, 1337-1343.

23
Sedman, A. B., Miller, N. L., Warady, B. A., Lum, G. M., and Alfrey, A. C., 1984,
Aluminum loading in children with chronic renal failure. Kidney International, 26:
201-204.
Sedman, A. B., Wilkening, G. N., Warady, B. A., Lum, G. M., and Alfrey, A. C., 1984,
Encephalopathy in childhood secondary to aluminum toxicity. The Journal of
Pediatrics, 105, 836-838.
Simmer, K., Fudge, A., Teubner, J., and James, S. L., 1990, Aluminium concentrations in
infant formulae. Journal of Paediatrics and Child Health, 26, 9-11.
Sing, H., Flynn, A. And Fox, P. F., 1989, Zinc binding in bovine milk. Journal of Dairy
Research, 56 249-263.
Stockhausen, H. B., Scchrod, L., Brätter, P., and Rösick, U., 1990, Aluminium loading in
premature infants during intensive care as related to clinical aspects Journal of Trace
Elements and Electrolytes in Health and Disease, 4, 209-213.
WHO. World Health Organization, 1989, Evaluation of certain food additives and
contaminants: thirty-third report of the Joint FAO/WHO Expert Committee on Food
Additives. WHO Technical Representative Series, 776, 1-64.
WHO. World Health Organization, 1998, Aluminium. Guidelines for drinking-water
quality, 2nd edition (Geneva: WHO), pp. 3-13.
Woollard, D. C., Pybus, J., and Woollard, G. A., 1990, Aluminium concentrations in infant
formulae. Food Chemistry, 37, 81-94.

24
Table 1. Instrumental parameters and optimising furnace program for aluminium
determination.
Instrumental parameters
Wavelength (nm) Slit width (nm) Lamp current (mA) Sample volume (L) Measurement Mode Source Background correction
309.3 1.0 10 20
Peak area Hollow cathode lamp
Deuterium lamp
Temperature program
Step Temperature (ºC)
Ramp (s)
Hold (s)
Argon flow (ml min-1)
Read on
Drying 1 110 5 15 300 -
Drying 2 250 10 15 300 -
Charring 1500 20 5 300 -
Atomization 2500 1 4 300 -
Cleaning 2600 1 5 0 Yes
Cooling 20 5 3 300 -

25
Table 2. Results of quality control program for aluminium analysis in infant formulae.
Quality program n Mean ± SD (µg l-1)
Repeatability (%)
Reproducibility(%)
Blank reagents
Infant formulae
Drinking water
34
8
2.3 ± 0.3
0.2 ± 0.5
13.9
-
15.5
-
Internal Standard* 34 20.0 ± 1.1 1.6 2.6
Infant formula Control# 34 174.8 ± 4.2 2.4 2.7
Recovery assay (%)
Infant formula Control
34
96 –104
Detection limit (µg l-1)
Infant formulae
Drinking water
34
8
3.3
1.7
IAEA 155 Whey powder (mg kg-1)
Determined level
Information level
12
43.2 ± 2.6
53 (38-68)
* Aqueous internal standard: 20 µg l-1 # Infant formula control: 176 ± 7 (analysed by standard addition method) ¶ Calculated as Mb ± 3 s.d.b (Mb: blank mean, s.d.b: standard deviation of blank)

26
Table 3. Aluminium content in different types of studied infant formulae (µg l-1).
Infant formula n Mean Median ± SD Range
Preterm Formula 7 449 421 ± 137 317 – 726
Starter Formula
- Non adapted
- Adapted
4
16
237
252
231 ± 128
196 ± 152
118 – 368
68 – 573
Follow-up Formula 19 292 272 ± 189 66 – 788
Specialised Formula
- Without lactose Formula
- Hypoallergenic Formula
- Inborn errors diet
7
12
10
574
687
453
399 ± 451
294 ± 945
443 ± 112
102 – 1439
105 – 2720
307 – 655
Soya Formula 7 930 573 ± 1132 313 – 3479
27
Table 4. Aluminium content in infant formulae from different countries.
Reference Country Aluminum (g l-1) Formula n Mean Median Range
Bloodworth et al., 1991. (19)
Singapore 25 4
40 - 370 470 - 2500
Cow’s milk-based Soy-based
Simmer et al., 1990 (11)
Australia 17 4 7 4
72 - 1463 184 - 1106 62 - 939
1192 - 1711
Starter and follow-up Preterm Specialized Soy-based
Ballabriga et al., 1989 (14)
Spain 79 16 26 13 10
202 ± 111* 322 ± 164* 530 ± 412* 542 ±178* 805 ± 217*
Adapted Preterm Hypoallergenic Without lactose Soy-based
Fdez-Lorenzo et al., 1999 (15)
Spain 47 17
218.6245.8
160 130
8 - 1149 18 - 1129
Starter Follow-up
Biego et al., 1991 (20)
France 6 68 ± 19 -
Baxter et al., 1991 (10)
UK 14 7
40 - 200 640 - 1340
Cow’s milk-based Soy-based
Hawkins et al., 1994 (21)
UK 24 7 14 7 7
165 300 161 773 534
151 - 180 272 - 328 143 - 180 632 - 914 470 - 598
Starter Preterm Fortified Hypoallergenic Soy-based
Coni et al., 1993 (22)
Italy 12 4 5 5 8
50 - 260 80 - 410 110 - 600 390 - 1010 30 - 850
Starter Preterm Specialized Soy-based Ready-to-use
Plesi et al., 1997 (23)
Italy 1 1 1 1 1 1 1
450 ± 117* 479 ± 93* 463 ± 180* 2285 ± 232* 1791 ± 275* 1057 ±51* 913 ± 171*
Starter Follow-up Preterm Hypoallergenic Hypoallergenic Soy-based Soy-based
Sahin et al., 1995 (24)
Turkey 10 163 - 1475* -
Ikem et al., 2001 (25)
Nigeria UK USA
6 12 18 9 6
58 ± 22 92 ± 85 101 ± 37 150 ± 120 460 ± 160
Adapted (powder) Adapted (powder) Adapted (liquid) Adapted (powder) Soy-based (powder)

28
Koo et al., 1988 (9)
USA -
0.014 - 0.453**0.60 - 2.3** 15 - 108*
342 - 1377*
Cow’s milk-based (liquid) Soy-based (liquid) Cow’s milk-based (powder)Soy-based (powder)
Dabeka and Mckenzie, 1990 (26)
Canada 6 4 9 7 9 4
0.13 1.98 97
12740.22 1.41
0.0910.84 68
1126 0.18 1.21
0.010 - 0.36** 0.40-6.4** 26-336*
425-2430* 0.017-0.56** 0.59-2.29**
Cow’s milk-based (liquid) Soy-based (liquid) Cow’s milk-based (powder)Soy-based (powder) Cow’s milk-based (conc.) Soy-based (concentrated)
Woolard et al., 1991 (27)
Various countries
30755
189 2484
22-519* 1404-5076*
Cow’s milk-based Soy-based
*Recalculated aluminium concentration (according to dilution 13.5 %) and expressed in µg l-1 ** Expressed by authors “as sold” basis in g g-1
29
Table 5. Aluminium concentrations in different types of infant formulae with regard to the
main protein contained (µg l-1).
Infant formula Aluminium
n Median ± SD Range Preterm Formula
Whey-based Skim-milk-based Whole-milk-based Casein hydrolysed
4 1 1 1
402 ± 43
726 436 317
339 – 421
– – –
Starter Formula - Non adapted
Skim-milk-based Whole-milk-based
- Adapted Whey-based Casein-based Skim-milk-based Whole-milk-based
3 1 6 3 2 5
136 ± 115
368
181 ± 177 126 ± 38 190 ± 83 338 ± 114
118 – 325
–
158 – 573 68 – 139 132 – 249 261 – 541
Follow-up Formula Whey-based Skim-milk-based Whole-milk-based
1 13 5
334
223 ± 220 296 ± 185
–
66 – 788 121 – 459
Specialised Formula - Without lactose Formula
Casein-based Skim-milk-based
- Hypoallergenic Formula Whey hydrolysed Casein hydrolysed
- Inborn errors diet Casein-based Skim-milk-based Whey hydrolysed Casein hydrolysed Free aminoacids No protein
6 1 7 5 1 1 1 4 2 1
460 ± 439 102
190 ± 110 654 ± 1233
307 518 655
449 ± 98 401 ± 51
370
309 – 1439 –
105 – 412 298 – 2720
– – –
335 – 529 364 – 438
- Soya Formula
Soy-based 7
573 ± 1132
313 – 3479

30
Table 6. Aluminium levels (µg l-1) from different types of infant formulae studied attending
to aggregation state (powder or liquid formulae).
Formula Powder Ready-to-use
n Mean Median Range n Mean Median Range
Preterm Formula 6 467 428 ± 20 317 – 726 1 340 – –
Starter Formula
Non adapted 3 271 325 ± 18 118 – 368 1 140 – –
Adapted 12 273 215 ± 26 130 – 573 4 187 172 ± 14 68 – 340
Follow-up Formula 13 313 340 ± 46 66 – 788 6 245 223 ± 14 150 – 460
Specialised Formula
Hypoallergenic 10 784 338 ± 1014 120 – 2720 2 201 201 ± 19 105 – 300
31
Table 7. Daily intakes of aluminium for infants fed on infant formulae and drinking water
used in the reconstitution of powder formulae (µg day-1).
Age
Starter Formula Follow-up Specialised Formula Soya Drinking
Non adapted
Adapted Formula Without
lactose HA
Inborn errors
diet
Formula water
0 - 2 weeks 148 155 - 387 510 381 538 12.2
3 - 4 weeks 188 203 - 516 608 508 731 16.2
2 month 238 244 - 597 754 574 798 20.3
3 month 238 264 - 654 778 680 915 20.3
4 - 5 month 283 295 - 761 986 785 1055 23.7
6 month 257 302 296 793 854 846 1133 14.2
> 7 month - - 249 - - - - 10.8

32
Manufacturer 9
Manufacturer 8
Manufacturer 7
Manufacturer 6
Manufacturer 5
Manufacturer 4
Manufacturer 3
Manufacturer 2
Manufacturer 1
Al (g l-1)1200
800
400
0
Soya F.
* (3479) Soya F.
* (1439) W. lactose F.
* (2720) HA F. * (2649) HA F.

33
0
2
4
6
8
10
12
14
16
18
20
PT
WI
(%)
0-2 weeks 3-4 weeks 2 month 3 month 4-5 month 6 month >7 month
Age
Follow up F. Non adap. S. F. Adapted S. F. W. lactose F. HA F. Diet F. Soya F.

34
0,0
0,5
1,0
1,5
2,0
2,5
3,0
Wee
kly
inta
ke (
mg)
2,0 – 2,5 2,5 – 3,0 3,0 – 3,5 3,5 – 4,0 4,0 – 5,0
Weight (kg)
Human milk (lower limit)Spanish human milkHuman milk (upper limit)Premature Formula
35
y = -0.0046x + 11.274p = 0.044
02468
101214
0 200 400 600 800 1000
Al ( g l -1 )
Fe (mg l -1 )

36
y = -0.0029x + 4.7799p = 0.004
0
2
4
6
8
0 200 400 600 800 1000
Al ( g l -1 )
Zn (mg l -1 )

37
Figure 1. Aluminium distributions in infant formulae provided by different manufacturers
(µg l-1)
Figure 2. Percentages of PTWI for aluminium estimated from infant formulae.
Figure 3. Weekly dietary aluminium intake for infant fed on premature infant formulae
and human milk (mg week-1).
Figure 4. Iron versus aluminium in follow-up infant formulae.
Figure 5. Zinc versus aluminium in standard infant formulae (starter and follow-up
formulae).

38
Acknowledgements
Authors wish to thank to Gobierno de Navarra for financial support.