alzheimer’s disease facts and figures in california · factor for alzheimer’s disease is older...
TRANSCRIPT

Current Status and Future Projections
2008588,208 families in California
living with Alzheimer’s disease
2015678,446 families in California
living with Alzheimer’s disease
20301,149,560 families in California living with Alzheimer’s disease
Alzheimer’s DiseaseFacts and Figuresin California

Alzheimer’s Disease Facts and Figures in California:
Current Status and Future Projections
Leslie K. Ross, Ph.D.Christine Brennan, B.A.
Jennifer Nazareno, M.S.W.Patrick Fox, Ph.D.
Prepared for the Alzheimer’s Association, California CouncilFebruary 2009
Institute for Health & AgingSchool of Nursing
University of CaliforniaSan Francisco, CA 94143-0646
ACKNOWLEDGEMENTS
The authors wish to acknowledge The Rosalinde and Arthur Gilbert Foundation and the State of California Department of Public Health whose support was essential to this report. We also want to thank the California Council and the California Southland Chapter of the Alzheimer’s Association for their efforts in support of this project. We especially acknowledge the important contributions of Dr. Debra Cherry, Jackie McGrath, Barbra McLendon, and Dr. Elizabeth Edgerly whose suggestions and editorial comments were immensely helpful. Thanks also to Katie Maslow of the Alzheimer’s Association and Professor Wendy Max of the UCSF Institute for Health & Aging for their guidance and suggestions, as well as Paul Tang of the UCSF Institute for Health & Aging for his editorial assistance.
Funding for this report was provided by The Rosalinde and Arthur Gilbert Foundation (www.thegilbertfoundation.org).

icalifornia alzheimer’s disease data report
Executive Summary
Over the next 20 years, the impact of Alzheimer’s disease on the State
of California will increase dramatically. The leading edge of the baby
boomer generation turned 62 this year. This enormous demographic
bulge has defined its times in the past and the graying of the boomers
can soon define California’s future. Individuals are also living longer,
resulting in a growing population of older adults. Since the primary risk
factor for Alzheimer’s disease is older age, we can expect a substantial
increase in the numbers of people who will be living with the disease.
This report was drawn from a variety of data sources. It details the
broad and significant implications that this increased prevalence
of Alzheimer’s disease and related conditions will have on
California’s businesses, public programs, and affected families.
Executive Summary

ii california alzheimer’s disease data report
Prevalence of Alzheimer’s Disease in California
Between now and 2030 there will be a doubling in the number of Californians living with Alzheimer’s disease. This dramatic increase will affect all race and ethnic groups as well as all regions of the state. The data reveal that:
Currently, there are 588,208 Californians 55 and over living with Alzheimer’s dis-ease; one-tenth of the nation’s Alzheimer’s patients reside in this state.
By 2030, this number will nearly double in California; growing to over 1.1 million.
Due to a rapidly aging population, the num-ber of California’s Latinos and Asians living with Alzheimer’s disease will triple by 2030.
The number of African-Americans living with Alzheimer’s disease will double in this timeframe.
Lifetime Risk for Alzheimer’s in California
Among California’s baby boomers aged 55 and over:
One in eight will develop Alzheimer’s disease.
One in six will develop a dementia.
Deaths from Alzheimer’s Disease in California
Alzheimer’s disease is now the sixth lead-ing cause of death in California.
Compared to other leading causes of death in California, Alzheimer’s disease showed the greatest increase (58.3% from 2000–2004).
•
•
•
•
•
•
•
•
Caregiving for People with Alzheimer’s Disease in California
There are 1.1 million Californians caring for people living with Alzheimer’s disease and other dementias, about 11% of our nation’s caregivers. While caregiving has its satisfactions, for many, the burden of care is substantial.
In every case, Alzheimer’s disease results in a pro-gressive decline in one’s ability to care for oneself, ulti-mately leaving the individual dependent on others for help with basic activities of living. As a result, caring for a person with Alzheimer’s is often very difficult and poses physical, emotional, and economic challenges. This is particularly true because, contrary to common belief, most care is delivered at home by families.
Traditionally, most caregivers have been the wives or adult daughters of the individual with dementia. With more women participating in the workforce, there has been a decrease in the number of women available to fill these caregiving roles. In addition, family members are increasingly likely to live far apart from one another. These changes have significant implications for families, busi-nesses and society at large. Who will care for our aged?
Caregiving negatively impacts the individual’s ability to work outside the home. Disproportionately high percentages of these caregivers report being forced to miss work (21%), reduce their work hours (8%), quit their jobs (11%) or change jobs due to caregiving demands (4%).
California caregivers provide 952 million hours of unpaid care per year with an economic value of slightly more than $10 billion.
•
•

iiicalifornia alzheimer’s disease data report
Families provide almost three-quarters of the value of informal (unpaid) and formal care for individuals living with Alzheimer’s disease in the community and in facilities—$72.7 billion out of an estimated total cost of $104 billion.
Informal care services, those typically provided for by family members, will double between now and 2030—increasing in value from $37.2 billion to $72.7 billion in unpaid care.
Compared to other family caregivers, those who care for people with severe memory problems are more likely to: experience financial hardship, report health difficulties, experience emotional stress (depres-sion or anxiety), and suffer from sleep disturbance.
•
•
Cost of Caregiving in CaliforniaWhile the burden of care falls primarily on families,
the rapid growth in the prevalence of Alzheimer’s will also impact California’s healthcare costs, causing them to rise significantly. In particular, Alzheimer’s disease and other dementias are a major contributor to Medi-Cal costs.
The cost to the Medi-Cal program for an in-dividual with Alzheimer’s disease or a related dementia is 2.5 times greater than the cost for an individual not having a diagnosis of dementia.
Most of the Medi-Cal cost difference is accounted for by nursing home expenditures, which are almost three times greater for individuals with Alzheimer’s disease or other dementias compared to other patients.
Long-term care costs in California are increasing more rapidly than in the rest of the nation, 44% from 2004 to 2008, as compared to a nationwide cost increase of 17%.
Other formal care services, including traditional medical and social services, are expected to double in cost between now and 2030—increasing from $16 billion to $31.3 billion.
California businesses will also be significantly impacted by the growth in the number of individuals living with Alzheimer’s disease. Among employed care-givers, 71% work full-time and 29% are part-time em-ployees. Because many caregivers miss work, reduce their work hours, or change jobs, California’s employers experience an estimated $1.4 billion in lost productiv-ity annually from full-time employed caregivers alone.
•
•
•
•

iv california alzheimer’s disease data report

vcalifornia alzheimer’s disease data report
Recommendations
The impact of Alzheimer’s disease is already being felt across
all sectors of society but the numbers tell us that the worst is
yet to come. This report offers a number of recommendations
that would help California better meet the growing demand
for support and services that meaningfully address the
needs of individuals with Alzheimer’s disease and related
dementias and their families. The order in which the following
recommendations are presented does not reflect their order
of importance. Each of these recommendations is an essential
component to building an effective system of support and
care for individuals and families living with Alzheimer’s. All
references to Alzheimer’s also refer to the related dementias.
Recommendations

vi california alzheimer’s disease data report
People living with Alzheimer’s disease have medical and social needs that must both be addressed if the individual is to maintain the highest quality of life possible throughout the course of the disease. Given the high cost of caring for these individuals as well as the limited availability of state and federal funding, it is imperative that both the public and private sectors be engaged to develop a comprehensive network of services. Such a network would extend from diagnosis to end-of-life care and include the following:
Implementation of evidence-based guidelines and provider training in all health care settings to facilitate:
Earlier detection of patients with the warning signs of possible Alzheimer’s,
Increased access to accurate and complete diagnosis,
Comprehensive dementia care management for integration of the medical and social support components of the patient and family caregiver’s needs, and
Improved linkage of patients and their families to appropriate community-based services and supports.
Expanded availability of affordable home and com-munity-based services that meet the needs of indi-viduals across the spectrum of the disease—from individuals under the age of 65 diagnosed with early-onset Alzheimer’s to the more traditional client in the mid and late stages of the disease.
Support for individuals as they transition be-tween settings such as their home, the hospi-tal and residential or nursing home care.
Appropriate end-of-life care.
•
•
•
•
•
•
•
•
Build an integrated and comprehensive health and long term care service network for those
living with Alzheimer’s funded from both the private and public sectors. The trend to community-based care must
include a thoughtful and comprehensive policy for family caregivers that would include:
Assessment of the caregiver in addition to the individual diagnosed with Alzheimer’s disease,
Increased availability of respite care,
Inclusion of the family caregiver in developing a family and patient care plan,
Increased availability of caregiver education on issues such as managing challenging behaviors, and
Development of financial incentives, such as tax credits, that would support families in their efforts to keep their loved one at home.
•
•
•
•
•
Support the development of a geriatrically trained workforce prepared to handle the unique needs of the growing population of older adults.
The U.S. will experience an imminent short-age of formal care providers, and it is estimated that 200,000 new direct-care workers will need to be recruited each year to meet future demand among the 78 million baby boomers as they age. To achieve this growth, these workers must be adequately reimbursed, trained and supervised.
While California did implement a rate increase for nursing homes specifically to improve pay rates as well as staffing training on a variety of topics, there has been limited oversight to ensure that facilities are complying with these requirements. So it is not enough to call for the development of public policies and educational and provider practices that help to elevate these jobs to recog-
•
•
Develop and implement robust family caregiver policies and a network of publicly and privately funded services.

viicalifornia alzheimer’s disease data report
Encourage the private sector to implement supportive services and policies for caregivers.
Improve access to diagnostic and supportive services for rural communities.
Improve the availability of transporta-tion services that cross over county lines and are “dementia friendly,” and
Increase availability of both caregiver and professional education to build local capac-ity to deliver dementia-capable services.
•
•
Improve access to care for diverse racial and ethnic groups.
The Alzheimer’s Association has developed a number of successful models for serving diverse communities that address barriers such as language differences; cultural values and beliefs about dementia and the role of the caregiver; limited income, health insurance, and educa-tion. The Association’s work has clearly demonstrated that these communities will access services if they are delivered in a way that is culturally relevant; as such, these models should be more broadly implemented.
The business community also has a role to play in imple-menting caregiver friendly programs and policies that respond to caregivers’ needs to take time off from work to attend to the needs of the care recipient. By proactively implementing and making available eldercare resources, costs to California businesses can be better controlled. Eldercare resources may include: flextime; telecommut-ing and job-sharing; programs that provide respite care; adult day services and caregiver support groups; informa-tion, referral and educational programs; and employee and/or employer funded long-term care insurance.
nized, valued professions. The State must combine these requirements with adequate oversight.
Less than 1% of California physicians have ge-riatric training and this percentage is declining. Policymakers at the federal, state and local levels must work together to provide financial incentives for geriatric training, such as tuition relief, to en-courage individuals to pursue careers in geriatrics. The state can also provide leadership on this issue by including geriatric training requirements in medi-cal school curriculums as well as licensing exams.
Public employees such as Adult Protective Service workers, Police and Emergency Medical Technicians often come into contact with indi-viduals with dementia at a time of extreme cri-sis. Unfortunately, all too often the special needs of these individuals are not well understood and the results can be tragic. Training on the management of people with Alzheimer’s would greatly improve the ability of these first respond-ers to take appropriate action and thereby en-sure the health and safety of these individuals.
•
•

viii california alzheimer’s disease data report
Invest more funding in research. Accelerating state research funding will hasten
the day when people will be able to delay the debilitat-ing symptoms of Alzheimer’s. A delay of just 5 years could cut prevalence rates in half. Such a decline in the number of people diagnosed with dementia would sig-nificantly reduce the cost of the Medi-Cal program.
Expedite development of a State Alzheimer’s Disease Plan.
Not since 1987 has California conducted a thorough review of policies and practices related to families living with Alzheimer’s and related dementias. The number of Americans living with Alzheimer’s has more than doubled since 1980, and 95% of what we know about the disease has been discovered in the last twenty years. California must prepare for the impending epidemic of Californians living with dementia by bringing together a broad array of stakeholders to develop recommendations for effective strategies and systems for ensuring that appropriate program and policy changes are made to meaningfully support individuals with Alzheimer’s and their families.
Develop policies and programs that address the unique needs of people under age 65 who are diagnosed with Alzheimer’s disease.
As diagnosis and early detection of Alzheimer’s disease improves, more people will be diagnosed under the age of 65 and at earlier stages of the disease. Many of these individuals find themselves unable to access services in the community or pay for health care because they do not meet the age-based eligibility requirements of many publicly-funded programs. Even in cases where their age is not a barrier, the programs may not be designed to meet their unique needs. In addition, many of these individuals have the added burden of needing to continue to provide for their families, which may include caring for children as well as aging parents. To enhance care and support for these individuals, the public and private sectors must work together to:
Remove age-related barriers that reduce ac-cess to the network of community-based services and assisted living communities that provide services to older adults, and
Improve employer-based understand-ing of the unique needs of individuals di-agnosed with Alzheimer’s and the need for disability services and supports.
•
•
Implement a public health approach to disease identification, surveillance, and prevention.
Health planning for people with Alzheimer’s and other dementia disorders is seriously hampered by the lack of California data. Adding questions to existing statewide health surveys, e.g. the Behavioral Risk Factor Surveillance System (BRFSS) and the California Health Interview Survey (CHIS), is a possible avenue for collecting this data. The availability of such data would provide impor-tant guidance to cities, counties and the state in setting priorities for the enhancement of existing services as well as identifying the need for new policies and programs.
�california alzheimer’s disease data report
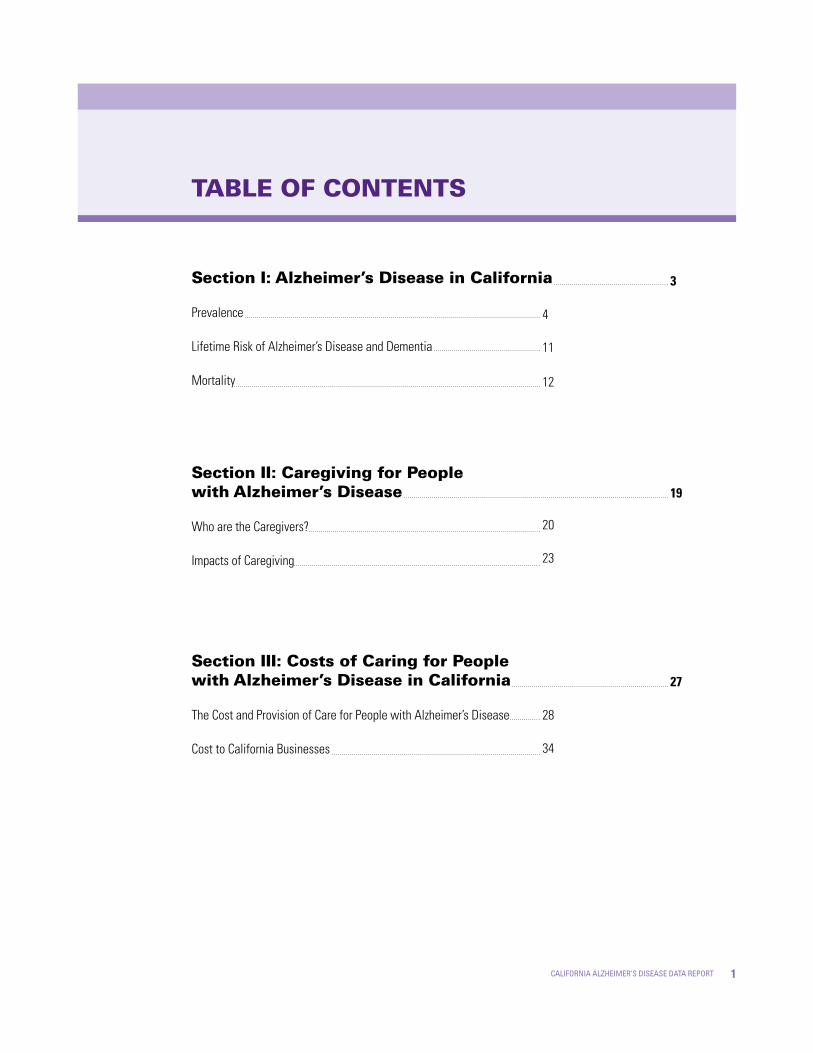
Section II: Caregiving for People with Alzheimer’s Disease
Who are the Caregivers?
Impacts of Caregiving
TABLE OF CONTENTS
Section I: Alzheimer’s Disease in California
Prevalence
Lifetime Risk of Alzheimer’s Disease and Dementia
Mortality
�9
4
11
Section III: Costs of Caring for People with Alzheimer’s Disease in California
The Cost and Provision of Care for People with Alzheimer’s Disease
Cost to California Businesses
28
27
3
12
20
23
34

2 california alzheimer’s disease data report
Figure 1: Percent Increase in the Population of California and in Californians with Alzheimer’s Disease: 2008, 2015, 2030
Figure 2: Estimated Number of People 55+ with Alzheimer’s Disease; 2008, 2015, 2030
Figure 3: Age Distribution of Californians with Alzheimer’s Disease; 2008, 2015, 2030
Figure 4: Estimated Number of Californians 55+ with Alzheimer’s Disease by Race/Ethnicity; 2008, 2015, 2030
Figure 5: Percentage Change in Leading Causes of Death in California; 2000 to 2004
Figure 6: Percent Change in Deaths Due to Alzheimer’s Disease by Race/Ethnicity; 2000 to 2004 (crude death rates)
Figure 7: Alzheimer’s Disease 2005 Death Rates by Race/Ethnicity and Age Group
Figure 8: Alzheimer’s Disease Death Rates by Race/Ethnicity; 2001-2005
Figure 9: Average Alzheimer’s Disease Death Rates for All California Counties: 2003-2005
Figure 10: Differences in Care Recipient Needs for Individuals with Severe Memory Problems/Dementia Compared to Individuals with Problems Other Than Memory/Dementia
Figure 11: Formal and Informal Community Care Costs for People with Alzheimer’s Disease 55+; 2008, 2015, 2030
Figure 12 Formal and Informal Institutional Care Costs for People with Alzheimer’s Disease 55+; 2008, 2015, 2030
Figure 13: Medi-Cal Costs per Beneficiary 60+ with Alzheimer’s Disease and Other Dementias Compared to Other Medi-Cal Beneficiaries: 2007 Dollars*
Figures
4
5
5
7
13
14
15
15
17
22
28
29
31

3california alzheimer’s disease data report
Section IAlzheimer’s Diseasein California
IntroductionA Alzheimer’s disease is the most common form of dementia.
Dementia is a clinical syndrome of loss or decline in memory
and other thinking abilities. It is caused by various diseases and
conditions that affect the brain. These conditions result in damage to
brain cells and lead to distinct symptom patterns and distinguishing
brain abnormalities. Alzheimer’s disease accounts for 70% of all
causes of dementia, and vascular disease is the second most
common cause, accounting for 17% of all dementing disorders.
More detailed information about Alzheimer’s disease and other
dementias can be found in Appendix A at the end of this report.
Adapted with permission from: 2008 Alzheimer’s Disease Facts and Figures, Chicago, IL: Alzheimer’s Association, 2008.
A

� california alzheimer’s disease data report
PrevalenceB,C
As California’s population increases in the future, the number of older persons will grow dramatically as the baby boomers, those born between 1946-1964, reach age 65. The first wave of baby boomers turns 65 in 2011. The largest growth in people living with Alzheimer’s disease will occur between the years 2015 and 2030, as a greater percentage of the baby boomers age.
Factors that are likely to increase the number of people with Alzheimer’s disease in the future include this growth in the state’s older population—especially the population age 80 and over—and reduced mortality from other causes. If California residents experience an increase in average years of education or have healthier lifestyles in the future, we may see a slower increase in the total number of people with Alzheimer’s disease because higher population educational levels or people engaging in healthy behaviors are associated with decreased risk of developing the disease. However, due to advances in medicine and medical technology, the number of individu-als living into their 80s and 90s is also expected to grow, as will the number of people with Alzheimer’s disease. Figure 1 highlights the growth in the number of
people with Alzheimer’s disease compared to overall growth of the population of California. Relative to the 2008 population, by 2030 the population of the state will increase by 28%, whereas people with Alzheimer’s disease will increase by 95%. In other words, by 2030, the number of people living with Alzheimer’s dis-ease in California will nearly double, compared to an overall population growth of less than one-third.
Information from several sources is used to describe the preva-lence of Alzheimer’s disease within the State of California. The numbers of people living with Alzheimer’s disease from differ-ent studies varies, depending on how each study was conducted.
Prevalence information discussed in this section primar-ily refers to estimates of Californians 55+ who will develop Alzheimer’s disease. Appendix B contains prevalence estimates for Californians 65+ who will develop Alzheimer’s disease.
B
C
By 2030, the number of people living with Alzheimer’s disease in California will nearly double.
100%
80%
60%
40%
20%
02008 20�5 2030
Figure �: Percent Increase in the Population of California and in Californians with Alzheimer’s Disease: 2008, 20�5, 2030
Source: State of California, Department of Finance Race/Ethnic, Population with Age Sex Detail, 2000–2050. Sacramento, CA, July 2007, accessible at http://www.dof.ca.gov/html/DEMOGRAP/Data/RaceEthnic/Population-00-50/RaceData_2000-2050.php. See Appendix F for methodology used to estimate California Alzheimer’s disease prevalence.
people with alzheimer’s population

5california alzheimer’s disease data report
As shown in Figure 2, the expected increase in people with Alzheimer’s disease will grow exponentially between 2008, 2015 and 2030. The percentage of Californians 55 years of age and over with Alzheimer’s disease is projected to increase by 15% between 2008 to 2015, from 588,208 to 678,446. Between 2015 and 2030, the percent of indi-viduals 55 years of age and over living with Alzheimer’s disease is projected to increase by 69%, from 678,446 to 1,149,560. In summary, between 2008 and 2030 the number of Californians 55 years of age and older who are pro-jected to acquire Alzheimer’s disease will almost double. A similar projection from 2008-2030 is anticipated for individuals 65 years and older (see Appendix B, Table B6).
As displayed in Figure 3, the majority of people with Alzheimer’s disease are 75 years of age and older. In 2008, this age group constitutes 85% of the total number of peo-ple over the age of 55 years who have this disease. By 2030, approximately twice as many persons 75 years of age and older will have Alzheimer’s disease, amounting to over one million persons. However, growth in the number of people living with Alzheimer’s disease is not limited to older adults, as we also project considerable increases in the number of individuals with Alzheimer’s disease between the ages of 55-74. Currently, there are 76,420 persons within this age group who have Alzheimer’s disease. By 2030 this number will almost double to 139,532 people. D
Appendix B lists the Alzheimer’s disease frequency changes from 2008-2030 for California counties and shows dramatic differences in in-creases across all counties, ranging from 54 percent to 212 percent.
D
1,200,000
1,000,000
800,000
600,000
400,000
200,000
2008
Figure 3: Age Distribution of Californians with Alzheimer’s Disease; 2008, 20�5, 2030
20�5 2030
55-74 75+ 55-74 75+ 55-74 75+
1,200,000
1,000,000
800,000
600,000
400,000
200,000
2008 2015 2030
Figure 2: Estimated Number of People 55+ with Alzheimer’s Disease; 2008, 20�5, 2030
� california alzheimer’s disease data report
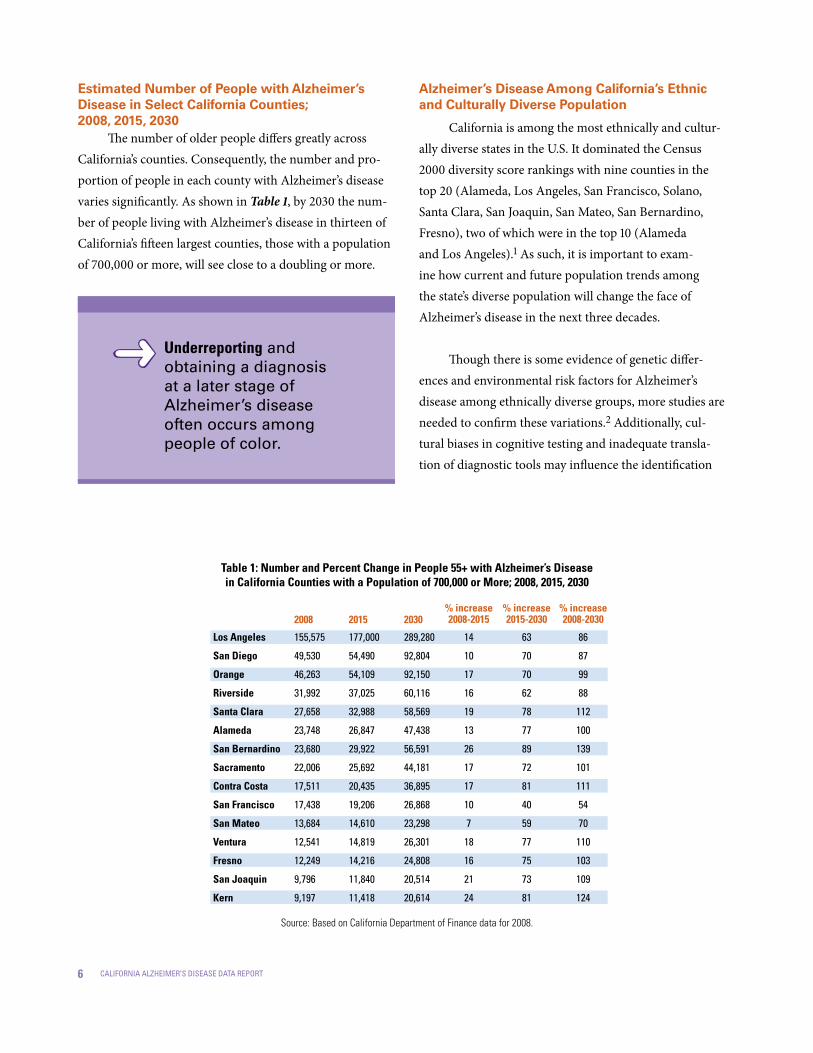
Estimated Number of People with Alzheimer’s Disease in Select California Counties; 2008, 2015, 2030
The number of older people differs greatly across California’s counties. Consequently, the number and pro-portion of people in each county with Alzheimer’s disease varies significantly. As shown in Table 1, by 2030 the num-ber of people living with Alzheimer’s disease in thirteen of California’s fifteen largest counties, those with a population of 700,000 or more, will see close to a doubling or more.
Alzheimer’s Disease Among California’s Ethnic and Culturally Diverse Population
California is among the most ethnically and cultur-ally diverse states in the U.S. It dominated the Census 2000 diversity score rankings with nine counties in the top 20 (Alameda, Los Angeles, San Francisco, Solano, Santa Clara, San Joaquin, San Mateo, San Bernardino, Fresno), two of which were in the top 10 (Alameda and Los Angeles).1 As such, it is important to exam-ine how current and future population trends among the state’s diverse population will change the face of Alzheimer’s disease in the next three decades.
Though there is some evidence of genetic differ-ences and environmental risk factors for Alzheimer’s disease among ethnically diverse groups, more studies are needed to confirm these variations.2 Additionally, cul-tural biases in cognitive testing and inadequate transla-tion of diagnostic tools may influence the identification
Los Angeles
San Diego
Orange
Riverside
Santa Clara
Alameda
San Bernardino
Sacramento
Contra Costa
San Francisco
San Mateo
Ventura
Fresno
San Joaquin
Kern
155,575
49,530
46,263
31,992
27,658
23,748
23,680
22,006
17,511
17,438
13,684
12,541
12,249
9,796
9,197
177,000
54,490
54,109
37,025
32,988
26,847
29,922
25,692
20,435
19,206
14,610
14,819
14,216
11,840
11,418
289,280
92,804
92,150
60,116
58,569
47,438
56,591
44,181
36,895
26,868
23,298
26,301
24,808
20,514
20,614
14
10
17
16
19
13
26
17
17
10
7
18
16
21
24
63
70
70
62
78
77
89
72
81
40
59
77
75
73
81
86
87
99
88
112
100
139
101
111
54
70
110
103
109
124
2008 2030% increase2008-20�520�5
% increase20�5-2030
% increase2008-2030
Source: Based on California Department of Finance data for 2008.
Table �: Number and Percent Change in People 55+ with Alzheimer’s Diseasein California Counties with a Population of 700,000 or More; 2008, 20�5, 2030
Underreporting and obtaining a diagnosis at a later stage of Alzheimer’s disease often occurs among people of color.

7california alzheimer’s disease data report
of dementia in ethnically diverse populations. Coupled with the lack of bilingual professionals in this field na-tionwide, testing and diagnosis of non-English, mono-lingual-speaking elders is especially challenging.
While significant progress has been made in devel-oping culturally sensitive tools, they have not been stan-dardized or normed across diverse populations, nor are they being widely used outside of academic or specialized research settings. As a consequence, underreporting and obtaining a diagnosis at a later stage of Alzheimer’s disease often occurs among people of color. This not only limits our understanding of the impact of Alzheimer’s disease within the racially and culturally diverse communities of the state but can directly impact the individual living with Alzheimer’s disease, since the effectiveness of medications, psychological or social interventions depends upon early intervention. Figure 4 displays the current and projected number of people who have, and will develop, Alzheimer’s disease in the future among Caucasian/non-Latino, Latino/Hispanic, African-American, Asian/Pacific Islander, American Indian, and multiracial population groups.
600,000
550,000
500,000
450,000
400,000
350,000
300,000
250,000
200,000
150,000
100,000
50,000
Figure �: Estimated Number of Californians 55+ with Alzheimer’s Disease by Race/Ethnicity; 2008, 20�5, 2030
caucasian latino/hispanic asian/pacific islander
african-american
native american
200820152030

8 california alzheimer’s disease data report
CaucasiansIn California, 66% of older persons with Alzheimer’s
disease are Caucasian/non-Latino. This population sub-group will experience the largest absolute growth in the number of people living with Alzheimer’s disease between 2008-2030 due to the aging of the predominantly Caucasian baby boomers. However, the proportional increase relative to the entire Caucasian/non-Latino population will not be as steep compared to California’s other ethnic sub-populations, primarily due to lower fertility rates among the baby boom-ers. Other related reasons for this include, but are not limited to, lower risks associated with developing Alzheimer’s dis-ease because of higher educational levels, associated health factors (e.g., lower rates of diabetes and vascular disease than other population sub-groups), and generally better ac-cess to, and use of, health services among this population.
Latinos/HispanicsIn California, Latinos/Hispanics are the second
largest population group and are fast becoming the state’s majority ethnic group. Similar to national trends, in California the number of Latinos/Hispanics living with Alzheimer’s disease will triple between 2008 and 2030. We currently estimate that 92,242 Latinos/Hispanics have Alzheimer’s disease and by 2030, 276,821 Latinos/Hispanics will be living with Alzheimer’s disease in this state.
While research is only beginning to uncover the im-pact of Alzheimer’s disease among Latinos, what we have learned to date suggests that this population may be at greater risk of developing Alzheimer’s disease and dementia than other ethnic or cultural groups due to the following:3
Age is the most significant risk factor for developing Alzheimer’s disease. The prevalence doubles every 5 years beyond the age of 65, and reaches 47% for people 85 years of age and older. It is projected that the average life expectancy of Latinos/Hispanics will increase to age 87 by 2050, surpassing all other ethnic groups in the United States.
Education appears to have some protective effect against Alzheimer’s disease. Latinos/Hispanics have the lowest education levels of any group in the U.S. Currently, one in ten Latino/Hispanic elders has no formal education, and over one-half have eight years or less of formal education.
A growing body of evidence indicates that vascular disease risk factors—including diabetes—may also be risk factors for Alzheimer’s disease and stroke-related dementia. Latinos/ Hispanics have high rates of each of these risk factors.4 The high incidence of diabetes—64% higher than Caucasian/non-Latino Americans— is a matter of particular concern.
•
•
•
Latinos/Hispanics living with Alzheimer’s disease will triple between 2008 and 2030.
African-Americans living with Alzheimer’s disease will double by 2030.
Asian/Pacific Islanders living with Alzheimer’s disease will triple between 2008 and 2030.

9california alzheimer’s disease data report
There is a substantial body of evidence, reinforced by clinical experience, that Latinos/Hispanics with dementia are low users of formal health care ser-vices. For example, among adults with diabetes, high blood pressure, or heart disease—all potential risk factors for dementia—Latinos/Hispanics are less likely to receive services to help monitor and control those conditions. They are less likely than non-Latinos/Hispanics to see a physician and much less likely to use services provided by other health professionals—both of which may increase the risk of dementia. Furthermore, by not accessing health-care services, there may be delays in the identifica-tion and diagnosis of dementia. Like pharmacologic interventions, non-pharmacologic approaches are most beneficial at the earlier stages of the disease.
• African-AmericansIn California, the number of African-Americans liv-
ing with Alzheimer’s disease will double by the year 2030, with an estimated increase from 26,521 to 52,369 people. These may be underestimates because screening and as-sessment tools and the design of clinical trials do not address the unique presentation of Alzheimer’s disease in African-Americans.5 Ethnic and cultural bias in current screening and assessment tools is well documented. As a result, African-Americans who are evaluated have a much higher rate of false-positive results. At the same time, there is substantial evidence of under-reporting of dementia among this population. Like their Latino/Hispanic coun-terparts, African-Americans tend to be diagnosed at a later stage of Alzheimer’s disease—limiting the effectiveness of interventions that are generally more beneficial in the early stages of the disease. In addition, African-Americans are seriously under-represented in current clinical trials of potential treatments for Alzheimer’s disease, particularly in trials conducted by drug companies. This has occurred even though evidence of genetic differences and response to drugs varies significantly by race and ethnicity. 5

�0 california alzheimer’s disease data report
Age is a key risk factor for Alzheimer’s dis-ease in all racial and ethnic groups.5 However, ad-ditional risk factors may influence the dramatic in-crease in Alzheimer’s disease in African-Americans:
There is a greater familial risk of Alzheimer’s in African-Americans where the cumulative risk of dementia among first-degree relatives of persons with Alzheimer’s disease is 43.7%.5
Genetic and environmental factors may work differently to cause Alzheimer’s disease in African-Americans. Genetic risk factors seem different in African-Americans and Caucasian/non-Latino Americans. APOE genotype alone does not explain the increased frequency of Alzheimer’s disease in older African-Americans. For spouses (who share environmental but not genetic backgrounds), the cumulative risk was 18.4%. These findings of familial risk, reported in January 2002, are based on family histories of the largest number of African-American families ever studied for Alzheimer’s disease.5
Persons with a history of either high blood pressure or high cholesterol levels—both relatively common among African-Americans—are twice as likely to get Alzheimer’s disease. Those with both risk factors are four times as likely to become demented.5
65% of African-American Medicare benefi-ciaries have hypertension, compared to 51% of Caucasian/non-Latino beneficiaries. They are also at higher risk of stroke and vascular demen-tia than Caucasian/non-Latino Americans.5
African-Americans have a 60% higher risk of type 2 diabetes, a condition that contrib-utes directly to vascular disease, which is a risk factor for developing Alzheimer’s disease.5
•
•
•
•
•
Years of education seems to be a particularly important factor in explaining why African-Americans are more likely than Caucasian/non-Latino Americans to have Alzheimer’s disease and dementia. Some researchers point out that quality of education and socioeconomic factors that affect access to education are probably also important in understanding why African-Americans are more likely to have Alzheimer’s disease and dementia.5
Asian/Pacific IslandersAsian/Pacific Islanders are another group that is
experiencing significant population growth in California and will have a corresponding increase in the number of individuals living with Alzheimer’s disease. However, far from being a homogeneous group, Asian/Pacific Islanders encompass immigrants and their descendants from a large number of countries with widely vary-ing histories, cultures, traditions, and languages.
•

��california alzheimer’s disease data report
Alzheimer’s disease in this group will almost triple between 2008–2030, increasing from approximately 72,075 to 194,266. This may also be an underestimate, since studies suggest that Asian/Pacific Islander Americans may not re-port symptoms of dementia to medical professionals unless family caregivers require medical assistance with behav-ioral issues.6 Also, as with other ethnic groups of elders in general and Asian/Pacific Islanders in particular, they are unlikely to receive a diagnosis of Alzheimer’s disease until the disease has progressed to the later stages, when com-bined bio-psycho-social interventions are less beneficial. While this community has a keen awareness of Alzheimer’s disease, beliefs regarding the disorder may be influenced at least as strongly by folk wisdom and cultural beliefs.6
Some of the risk factors for Alzheimer’s disease within this community include: genetic risk factors and hypertension. A study within San Francisco’s Asian com-munity found that 69% of adults suffered from hyperten-sion, compared to 29% nationwide.7 This study also found that compared to the U.S. population, a lower percentage of the Asian adults took medications to treat their hy-pertension. Cultural and language barriers, low health literacy, economic difficulties, limited health access, lack of health insurance, and related reasons were considered to be major factors contributing to the low frequency of antihypertensive medication use and control. Also, as with the general population, the incidence of diabetes is grow-ing within the Asian/Pacific Islander community.8,9,10
Lifetime Risk of Alzheimer’s Disease and Dementia
The “lifetime risk” of a disease or condition is the like-lihood that a person will develop the disease or condition at any time in his or her life. Currently, there is no informa-tion to calculate risk from birth for Alzheimer’s disease or dementia. National estimates of lifetime risk indicate that one in six women and one in ten men who live to be at least age 55 will develop Alzheimer’s disease in their remaining lifetime. Higher proportions, one in five women and one in seven men who reach age 55, will develop some type of de-mentia, including Alzheimer’s disease. The risk of develop-ing Alzheimer’s disease and dementia is higher for women than men because women live longer, on average, than men. As deaths from other causes decrease in the future, the average lifespan for the U. S. population will increase, thus increasing the lifetime risk of Alzheimer’s disease and other dementias. Even without that increase, about 10 million of the 78 million baby boomers in the U. S. who are alive today can expect to develop Alzheimer’s disease. About 14 million baby boomers who are alive today can expect to develop some form of dementia, including Alzheimer’s disease.2
These figures for remaining lifetime risk are con-servative because the study on which they are based, the Framingham Heart Study, used a relatively high thresh-old for including an individual as a person with demen-tia. The study criteria required that the individual must have dementia specified as at least moderate and that the dementia symptoms must have been present for at least six months. Thus, people who had very early or mild demen-tia and individuals with moderate dementia of less than six months’ duration were not counted as having demen-tia. If these people had been counted as having dementia, the figures for remaining lifetime risk would be higher.2
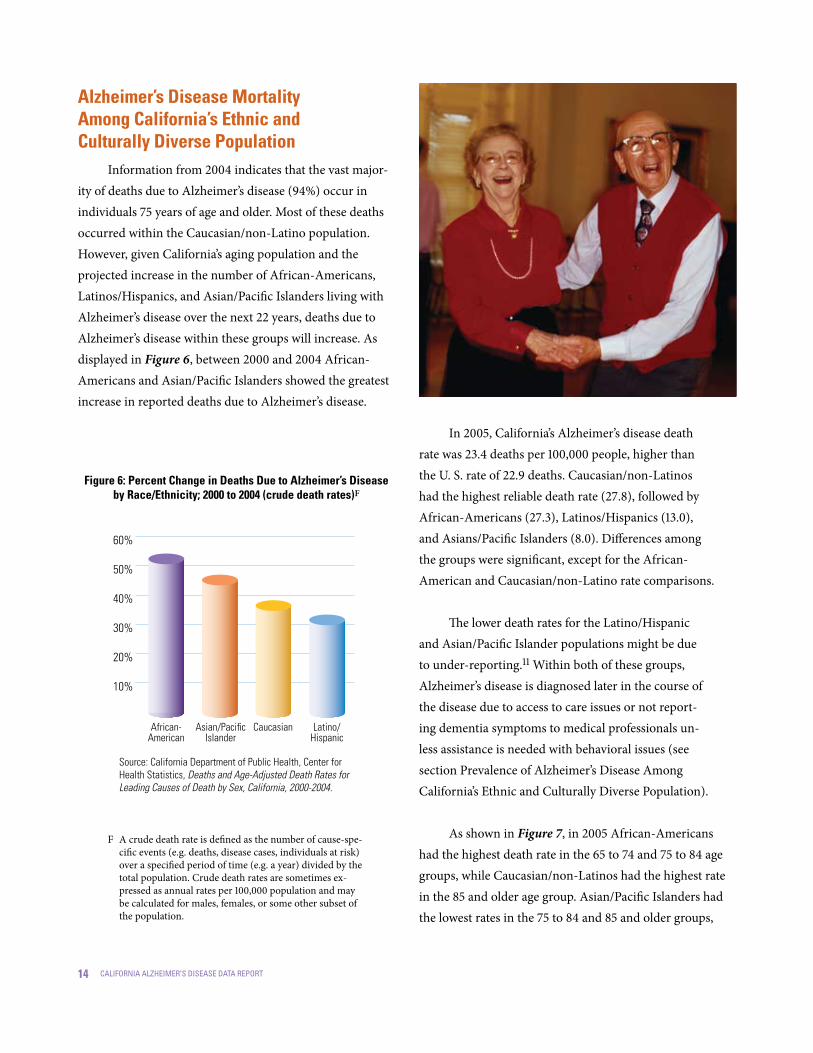
Between 2000 and 200�, African-Americans and Asian/Pacific Islanders showed the greatest increase in reported deaths due to Alzheimer’s disease.

�2 california alzheimer’s disease data report
True lifetime risk for baby boomers will also be greater because the number of deaths due to heart disease, cancer and stroke (the three leading causes of death) is decreasing, while the number of deaths due to Alzheimer’s disease is increasing (refer to the next section of this re-port, Mortality, for additional discussion of Alzheimer’s disease and other leading causes of death). As a result, people will be living longer, increasing their probability of developing Alzheimer’s disease and other dementias.
Lifetime Risk and California’s Baby Boomer Population
The baby boomers are people living in the U. S. now who were born from 1946 through 1964. In 2008, the old-est baby boomers, people born in 1946, are 62. The young-est baby boomers, people who were born in 1964, are 44.
The remaining lifetime risks of Alzheimer’s disease and dementia apply to baby boomers who are already age 55 or over. The remaining lifetime risks of Alzheimer’s disease and other dementias also apply to baby boomers who are under age 55, assuming that they live to be at least age 55.2
California’s baby boomer population now in-cludes over 9 million people, of whom over 3 million are ages 55–62 and approximately 6 million are ages 44–54. Applying the national proportions to California’s popu-lation, it is estimated that 1.2 million of California baby boomers can expect to develop Alzheimer’s disease in their remaining lifetime. Similarly, about 1.6 million can expect to develop dementia, including Alzheimer’s dis-ease. The lifetime risk for developing Alzheimer’s disease
for a California baby boomer who lives to be 55 is one in eight. The lifetime risk is one in six for developing de-mentia, including Alzheimer’s disease, for people who live to be 55 (see Appendix C for county-specific rates).
MortalityE
Alzheimer’s disease remained the seventh lead-ing cause of death in the United States in 2005. However, in California Alzheimer’s disease moved from the eighth leading cause of death in 2004 to sixth in 2005 as the number of deaths increased from 6,962 to 7,694 people.
As shown in Figure 5 and Table 2, comparing Alzheimer’s disease to other leading causes of death in California between 2000 and 2004, Alzheimer’s disease showed the greatest increase (58.3%). The only other ill-nesses to show an increase in deaths during this time period were those associated with malignant neoplasms (cancers) and diabetes mellitus. The other leading causes of death—heart disease, cerebrovascular disease, chronic lower re-spiratory disease, and influenza and pneumonia—actually show declines. As medical treatments and other interven-tions become more effective in preventing, curing, or better managing chronic illnesses and people live longer, they are at greater risk of developing Alzheimer’s disease. Thus, in the future the deaths due to this disease may continue to increase relative to other illnesses. Also, a likely factor con-tributing to the increased number of reported Alzheimer’s disease deaths is more accurate protocols for its diagnosis.
In California, Alzheimer’s disease moved from the eighth leading cause of death in 2004 to sixth in 2005.

�3california alzheimer’s disease data report
Even though deaths attributed to Alzheimer’s disease are increasing, the number does not fully capture the disease’s public health impact. Numerous studies have suggested that death certificates substantially under-report Alzheimer’s disease as a cause of death for people living in the community because most individuals with Alzheimer’s disease are age 65 and older and tend to have other seri-
ous coexisting medical conditions such as heart disease or stroke. Given these multiple medical issues, physicians may tend to attribute death primarily to one of these other condi-tions even when Alzheimer’s disease is present. In the large percentage of cases where the medical record fails to reflect an Alzheimer’s disease diagnosis, the certifying physician may not even be aware that the individual had the disease.2
In 2008 the California Office of Health Information and Research (OHIR) published a report on Alzheimer’s Disease Deaths California for 2005.11 Alzheimer’s disease data were extracted from vital statis-tics records with deaths attributed to Alzheimer’s disease as defined by the International Classification of Diseases, Tenth Revision (ICD-10) code G30 in accordance with the National Center for Health Statistics (NCHS). The OHIR report calculated age-specific death rates. Age-spe-cific death rates are the number of deaths per 100,000 people in a specif-ic age group, and are used along with standard population proportions to develop a weighted average rate. The weighted average rate is referred to as an age-adjusted death rate and removes the effect of different age structures of the populations whose rates are being compared. Age-ad-justed death rates therefore provide the preferred method for compar-ing different race/ethnic groups, sexes, and geographic areas, and for measuring death rates over time. Unless otherwise noted, all death rates in this report are age-adjusted. When possible, information from the OHIR report is used in this section. However, there are additional issues that this report highlights that were not addressed in the OHIR report. In these instances, 2004 Death Record information from the California Department of Public Health was used to augment the OHIR findings.
E
Source: California Department of Public Health, Center for Health Statistics, Deaths and Age-Adjusted Death Rates for Leading Causes of Death by Sex, California, 2000-2004.
Figure 5: Percentage Change in Leading Causes of Death in California; 2000 to 200�
60%
50%
40%
30%
20%
10%
0
-10%
-20%Alzheimer’s Disease58.3%
Diabetes Mellitus14.8%
Malignant Neoplasms1.3%
Chronic Lower Respiratory Disease-1.8%
Heart Disease-5.1%
Cerebrovascular Disease-6.7%
Influenza & Pneumonia-12.39%
heart disease
malignant neoplasms
cerebrovascular disease
chronic lower respiratory disease
influenza & pneumonia
diabetes mellitus
alzheimer’s disease
68,533
53,005
18,090
12,754
8,355
6,203
4,398
2000 200� % change
65,002
53,708
16,884
12,519
7,331
7,119
6,962
-5.1
1.3
-6.7
-1.8
-12.3
14.8
58.3
Source: California Department of Public Health, Center for Health Statistics, Deaths and Age-Adjusted Death Rates for Leading Causes of Death by Sex, California, 2000-2004.
Table 2: Number of Deaths and Percent Change in Leading Causes of Death in California: 2000 to 200�
�� california alzheimer’s disease data report
Alzheimer’s Disease Mortality Among California’s Ethnic and Culturally Diverse Population
Information from 2004 indicates that the vast major-ity of deaths due to Alzheimer’s disease (94%) occur in individuals 75 years of age and older. Most of these deaths occurred within the Caucasian/non-Latino population. However, given California’s aging population and the projected increase in the number of African-Americans, Latinos/Hispanics, and Asian/Pacific Islanders living with Alzheimer’s disease over the next 22 years, deaths due to Alzheimer’s disease within these groups will increase. As displayed in Figure 6, between 2000 and 2004 African-Americans and Asian/Pacific Islanders showed the greatest increase in reported deaths due to Alzheimer’s disease.
In 2005, California’s Alzheimer’s disease death rate was 23.4 deaths per 100,000 people, higher than the U. S. rate of 22.9 deaths. Caucasian/non-Latinos had the highest reliable death rate (27.8), followed by African-Americans (27.3), Latinos/Hispanics (13.0), and Asians/Pacific Islanders (8.0). Differences among the groups were significant, except for the African-American and Caucasian/non-Latino rate comparisons.
The lower death rates for the Latino/Hispanic and Asian/Pacific Islander populations might be due to under-reporting.11 Within both of these groups, Alzheimer’s disease is diagnosed later in the course of the disease due to access to care issues or not report-ing dementia symptoms to medical professionals un-less assistance is needed with behavioral issues (see section Prevalence of Alzheimer’s Disease Among California’s Ethnic and Culturally Diverse Population).
As shown in Figure 7, in 2005 African-Americans had the highest death rate in the 65 to 74 and 75 to 84 age groups, while Caucasian/non-Latinos had the highest rate in the 85 and older age group. Asian/Pacific Islanders had the lowest rates in the 75 to 84 and 85 and older groups,
60%
50%
40%
30%
20%
10%
Figure �: Percent Change in Deaths Due to Alzheimer’s Disease by Race/Ethnicity; 2000 to 200� (crude death rates)F
Source: California Department of Public Health, Center for Health Statistics, Deaths and Age-Adjusted Death Rates for Leading Causes of Death by Sex, California, 2000-2004.
Caucasian Latino/Hispanic
African-American
Asian/Pacific Islander
A crude death rate is defined as the number of cause-spe-cific events (e.g. deaths, disease cases, individuals at risk) over a specified period of time (e.g. a year) divided by the total population. Crude death rates are sometimes ex-pressed as annual rates per 100,000 population and may be calculated for males, females, or some other subset of the population.
F

�5california alzheimer’s disease data report
but the rate was unreliable in the 65 to 74 age group. The generally low death rate within this latter group is prob-ably due to under-reporting of Alzheimer’s disease on death certificates due to its either being diagnosed later in the course of the disease, not reporting dementia symptoms to medical professionals unless needing assistance with behavioral issues, or health provider under-reporting.
As displayed in Figure 8, Alzheimer’s disease death rates for California residents for the past five years in-creased by 39.3% from 16.8 deaths per 100,000 in 2001 to 23.4 deaths in 2005. All population sub-groups showed significant increases in rates over this time period. African-Americans had the largest increase in death rates (69.6%), followed by Latinos/Hispanics (64.6%), Asians (63.3%), and Caucasian/non-Latinos (41.1%). The reasons for increased death rates due to Alzheimer’s disease might be due to fewer people dying from other illnesses such as heart disease and the fact that individuals are living longer, as increased age is the most significant risk factor for developing the disease.
30
25
20
15
10
5
0
Figure 8: Alzheimer’s Disease Death Rates by Race/Ethnicity; 200�-2005
Source: Jew-Lochman, S. (2008). Alzheimer’s Disease Deaths California, 2005. California Department of Public Health, Office of Health Information and Research.
asian/pacific islander
2001 2002 2003 2004 2005
16.8
19.7
16.1
7.9
4.9
18 21.3
17.5
9 5.1
21.2
25.2
21.1
11.5
5.7
21.8
25.8
25.1
11.6
7.3
23.4
27.8
27.3
13 8
Age-Adjusted Death Rates Per 100,000
caucasian african-american latino/hispanictotal
1200
1000
800
600
400
200
0
Figure 7: Alzheimer’s Disease 2005 Death Rates by Race/Ethnicity and Age Group
Source: Jew-Lochman, S. (2008). Alzheimer’s Disease Deaths California, 2005. California Department of Public Health, Office of Health Information and Research.
65-74years of age
75-84years of age
85+years of age
Caucasian
Death Rates Per 100,000
African- American
Latino/Hispanic
Asian/Pacific Islander
1,10
5.5
500.
335
0
22.6
23.9
11 3.8
201 24
1.5
97.4
49.1
951.
6

�� california alzheimer’s disease data report
Alzheimer’s Disease Mortality in California Counties
As displayed in Table 3, Los Angeles, San Diego, and Orange counties have the highest number of deaths due to Alzheimer’s disease, given their large numbers of older adults. Complete California county information for Alzheimer’s disease deaths from 2003 to 2005 can be found in Appendix D.G The county Alzheimer’s disease death rates were calculated using 2004 mid-year population denomi-nators and are presented as rates per 100,000 population.
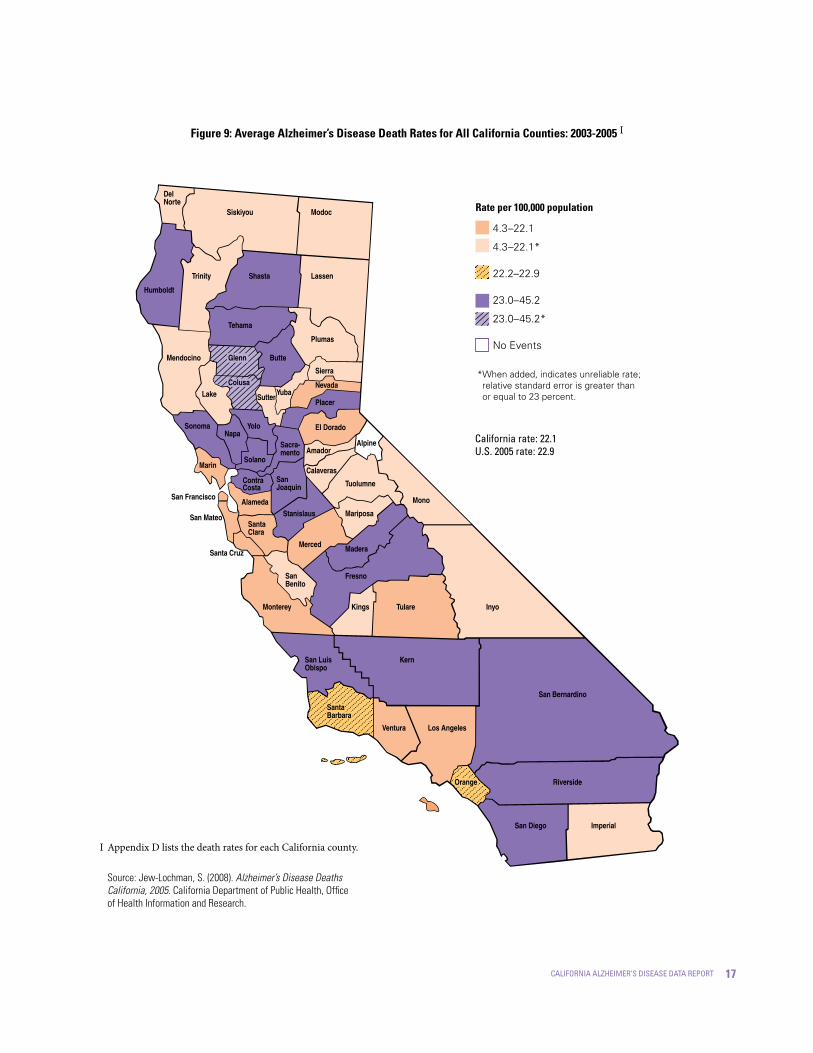
There are likely to be many reasons that contrib-ute to the variability in death rates between counties in California. One influence might be the differences in the racial/ethnic composition of the counties. Eight of the counties listed in Table 3 are considered to be in the top 20 for racial/ethnic diversity, based on the United States 2000 census (Alameda-2nd, Los Angeles-9th, San Francisco-11th, Santa Clara-13th, San Mateo-18th, San Bernadino-19th and Fresno-20th).1 Some of the wide range in death rates among the counties may be due to differ-ent risk factors associated with Alzheimer’s disease such as level of education, health status, and access to health care. As noted earlier, there is also likely to be variabil-ity among counties in the reporting of Alzheimer’s dis-ease as a cause of death. Figure 9 shows a thematic map of the Alzheimer’s disease death rates for all California counties.11 Appendix D lists the death rates by county.
* County age-adjusted rate is significantly different from the state age-adjusted rate.
CALIFORNIA
Los Angeles*
San Diego*
Orange
Riverside*
Santa Clara
San Bernardino*
Sacramento
Contra Costa
Alameda*
San Mateo
Fresno
Sonoma*
Kern*
Ventura
San Francisco*
2003-2005 Deaths (Average)
200� Population
Rate per �00,000 Population
Percent of Total Population
Table 3: California Counties with the Greatest Number of Alzheimer’s Disease Deaths in 2005
7,080.3
1,391.7
1,068.0
564.7
474.3
311.0
299.3
283.0
229.7
212.3
156.0
153.0
150.0
140.3
136.0
134.3
100.0
19.7
15.1
8.0
6.7
4.4
4.2
4.0
3.2
3.0
2.2
2.2
2.1
2.0
1.9
1.9
36,525,947
10,152,410
3,031,055
3,038,670
1,845,185
1,747,295
1,922,467
1,357,367
1,014,992
1,497,316
720,229
874,745
477,419
744,489
808,735
793,564
22.1
16.3
38.6
22.2
28.6
20.8
26.1
24.5
23.9
15.8
18.9
23.4
27.5
31.4
20.0
13.3
H
Source: Jew-Lochman, S. (2008). Alzheimer’s Disease Deaths California, 2005. California Department of Public Health,
Office of Health Information and Research.
Age-specific death rates are the number of deaths per 100,000 people in a specific age group, and are used along with standard popula-tion proportions to develop a weighted average rate. The weighted average rate is referred to as an age-adjusted death rate and removes the effect of different age structures of the populations whose rates are being compared. Age-adjusted death rates therefore provide the preferred method for comparing different race/ethnic groups, sex-es, and geographic areas, and for measuring death rates over time.
G Appendix D includes age-adjusted and crude death rates for each California county.
H
�7california alzheimer’s disease data report
Figure 9: Average Alzheimer’s Disease Death Rates for All California Counties: 2003-2005 I
Source: Jew-Lochman, S. (2008). Alzheimer’s Disease Deaths California, 2005. California Department of Public Health, Office of Health Information and Research.
Appendix D lists the death rates for each California county.I
4.3–22.1
4.3–22.1*
22.2–22.9
23.0–45.2
23.0–45.2*
No Events
*When added, indicates unreliable rate; relative standard error is greater than or equal to 23 percent.
Rate per �00,000 population
california rate: 22.1U.s. 2005 rate: 22.9
Del Norte
Siskiyou Modoc
Humboldt
Trinity Shasta Lassen
Mendocino
Tehama
Plumas
Butte
Lake
Sierra
Nevada
Placer
El Dorado
Sacra-mento
YoloNapa
Sonoma
Marin
San Francisco
Solano
SanJoaquin
Amador
Tuolumne
Mariposa
ContraCosta
Alameda
SutterYuba
StanislausSantaClara
San Mateo
Merced
Mono
Alpine
Madera
Fresno
Inyo
Santa Cruz
San Benito
Calaveras
Kings TulareMonterey
San Luis Obispo
Kern
San Bernardino
Los AngelesVentura
Riverside
San Diego Imperial
Santa Barbara
Orange
Glenn
Colusa

�8 california alzheimer’s disease data report

�9california alzheimer’s disease data report
Section IICaregiving for Peoplewith Alzheimer’s Diseaseand Other Dementias

20 california alzheimer’s disease data report
Who are the Caregivers?An Alzheimer’s caregiver is anyone who provides
assistance to someone else who is, in some degree, inca-pacitated and needs help due to having Alzheimer’s disease. Examples include a husband who must help his wife to dress and bathe; a wife who takes over bill paying and other chores that her husband can no longer complete; a daughter who brings one of her parents to live in her home because the parent is no longer safe living alone. Caregivers of people with other dementias also face these challenges.
Informal caregiver and family caregiver are terms that refer to unpaid individuals such as family members, friends, and neighbors who provide care. These individuals can be primary or secondary caregivers, provide full- or part-time care, and can live with the person being cared for or live sep-arately. Formal caregivers—sometimes called professional caregivers—are care providers associated with a health care or social service system, or hired independent providers.
Nationally, almost 10 million Americans pro-vide unpaid care for a person with Alzheimer’s disease or another dementia.2 These unpaid caregivers are pri-marily family members, but also include friends and neighbors. Many people living with Alzheimer’s disease and other dementias will have more than one unpaid caregiver. For example, people who live with their pri-mary caregiver and receive help from another relative, friend, or neighbor. In addition, family caregivers are often managing other serious medical conditions, such as diabetes or congestive heart failure, in themselves and/or in the person living with Alzheimer’s disease.
Caring for a person with Alzheimer’s disease or another dementia is often very difficult and poses physi-cal, emotional and economic challenges for the fam-ily. However, it does not mean that there will no longer be times of joy, shared laughter, and companionship. Alzheimer’s disease develops gradually, which means that there is time to plan ahead, time to adjust to the diagnosis, and time to enjoy being with each other.
About �.� million Californians provide unpaid care for a person with Alzheimer’s disease or dementia.

2�california alzheimer’s disease data report
Who are California’s Caregivers?About 1.1 million CaliforniansJ provide unpaid
care for a persion with Alzheimer’s disease or demen-tia. While specific information on these individuals is not available, there is information describing caregiv-ers for care recipients who are older than 50 years of age. These California caregiver characteristics are similar to national studies that have provided information about caregivers of people living with Alzheimer’s disease.
California caregivers caring for individuals 50 years or older have an average age of 51 years, which is slightly older than caregivers nationally. Women tend to shoulder the vast majority of caregiving—75% are women, 60% are married, and 31% have children under the age of 18 living at home (as compared with 41% nationally). 61% are Caucasian/non-Latino, 25% are Latino/Hispanic, 6% African-American, and 5% Asian/Pacific Islander. Most caregivers were born in the U.S. (86%), but a notable number (6%) report Mexico as their country of origin. About half of California’s caregiv-ers are employed—71% full-time and 29% part-time. Three-fourths of caregivers (74%) evaluate their health as good, very good, or excellent, with 26% indicating their health is fair or poor; 28% report health or emotional problems.12
The Alzheimer’s Association in California and the Caregiver Resource Centers (CRCs) are two non-profit organizations that provide a single point of entry for support services for caregivers throughout the state. Appendix H and Appendix I provide a list of Alzheimer’s Association and Caregiver Resource Centers in California.
The Alzheimer’s Association in California has five chapters and 20 service offices to meet the needs of fam-ily caregivers and the growing number of people liv-ing with Alzheimer’s disease or a related dementia. The Association provides disease education, support, fam-ily care consultations, information and referral, sup-port groups and a wanderer’s identification program called Medic Alert®+Safe Return®. The Alzheimer’s Association serves 105,201 caregivers and families each year but lacks resources to fully meet their needs.
California also has a statewide network of 11 Caregiver Resource Centers (CRCs), operating under the California Department of Mental Health, that provide support ser-vices to help family and informal caregivers continue their care and avoid premature institutionalization of their loved ones. Data from California’s CRCs indicate that the average caregiver served by the program is a 59-year-old woman who has been caring for her father or husband with Alzheimer’s disease for three to four years. Nearly half are 60 or older—those who are at highest risk of health problems themselves. Most are women (77%), most often an adult child of the care receiver (47%). 35% are spouses, and 9% have another (non-family) relation-ship with the care receiver. Most caregivers served by the CRC system are likely to live with the care receiver (71%).13
The number of caregivers of people living with Alzheimer’s disease in California is gathered from a number of sources that use varying methodologies to arrive at an estimate of caregivers. The Alzheimer’s Association Alzheimer’s Disease Facts and Figures, 2008 report es-timates that there are 1.1 million California caregivers caring for in-dividuals living with Alzheimer’s disease or related dementia.2
J

22 california alzheimer’s disease data report
What are the Characteristics of Care Recipients?
Fewer care recipients with memory problems/de-mentia live alone in their own home or apartment than do care recipients without these problems (27% vs. 37%). Approximately one-third of both groups reside with a care-giver. However, caregivers of people with severe memory problems/dementia spend an average of 53.7 hours per week providing help, as opposed to 34.1 hours spent by caregivers of people without memory problems/dementia.12
As displayed in Figure 10, people living with Alzheimer’s disease need more help with personal care tasks known as Activities of Daily Living (ADL) and Instrumental Activities of Daily Living (IADL) (e.g.,
transportation, shopping, managing finances and cook-ing) compared to physically impaired individuals.12 Care recipients with memory problems or dementia require significantly more assistance with IADLs than care re-cipients with problems other than memory/dementia.14
Some family and other unpaid caregivers who live with a person who has Alzheimer’s disease or another dementia provide supervision and help 24 hours a day, seven days a week, getting up with the person at night and assisting with all daily activities. Such around-the-clock care is needed when a person cannot be left alone because of risk of wan-dering, getting lost, and other unsafe activities. These addi-tional needs result in caregivers of people with Alzheimer’s disease and other dementias providing more hours of help,
100
90
80
70
60
50
40
30
20
10
0
Figure �0: Differences in Care Recipient Needs for Individuals with Severe Memory Problems/ Dementia Compared to Individuals with Problems Other Than Memory/Dementia
Source: Scharlach, A., Sirotnik, B., Bockman, S., Neiman, M., Ruiz, C., & Dal Santo, T. (2003). A Profile of Family Caregivers: Results of the California Statewide Survey of Caregivers. Center for the Advanced Study of Aging Services, University of California, Berkeley.
dressing, eating, bathing or getting to the bathroom
Severe Memory Problems/Dementia Problems Other Than Memory/Dementia
financial matters
medical needs arranging for care or services
preparing meals, doing laundry or cleaning house
Going shopping
82% 70% 56% 39% 47% 32%91% 82% 79% 69% 68% 58%

23california alzheimer’s disease data report
on average, than caregivers for physically impaired individu-als. Not surprisingly, given these additional needs, the costs of caring for an individual living with Alzheimer’s disease in the community in the U. S. are approximately 31% more than caring for a person with a serious physical ailment.14
The average number of hours of unpaid care pro-vided for people with Alzheimer’s disease and other dementias increases as the person’s disease progresses.15 The number of hours of unpaid care is also greater, on average, for people with coexisting medical conditions in addition to Alzheimer’s disease or another dementia.16
Long-Distance Caregivers
National estimates indicate that 10% of the 9.8 mil-lion family and other unpaid caregivers of people with Alzheimer’s disease and other dementias live more than two hours from the person for whom they provide care, and another 4% live one to two hours from the person.2 Depending on the definition of “long-distance caregiv-ing,” living more than two hours or between one and two hours from the person receiving care, and apply-ing these estimates to the 1.1 million unpaid Alzheimer’s disease caregivers in California, an estimated 110,307 to 154,430 caregivers of people with Alzheimer’s disease and other dementias are “long-distance caregivers.”
Duration of CaregivingBecause Alzheimer’s disease and other demen-
tias usually progress slowly, most caregivers spend many years in the caregiving role. At least 25% of California family and other unpaid caregivers have been provid-ing care for six years or more to someone age 50 or old-er, and 75% have been providing care for five years or less. California caregivers as a whole typically spend 14 hours a week (median) and get about 10 hours of help weekly from other unpaid family members, friends or volunteers (median, with average not available).12
The national figures of family and other unpaid caregivers for people with Alzheimer’s disease who have been providing help for five years or longer is 32%, and 39% have been providing care for one to four years. In contrast, 27% of caregivers of other older people have been providing help for five years or longer, and 32% have been providing care for one to four years.2
Both state and national figures highlight the greater amount of time caregivers spend caring for peo-ple living with dementia or Alzheimer’s disease com-pared to other older individuals without dementia.
Impacts of CaregivingCaring for a person with Alzheimer’s or another
dementia poses special challenges. Although memory loss is the best-known symptom, this disease can also cause loss of judgment, orientation, ability to understand and communicate effectively and, frequently, changes in personality and behavior. Individuals require increasing levels of supervision and personal care, and many caregiv-ers experience high levels of stress and negative effects on their health, employment, income and financial security.
Caregivers of people with severe memory problems/dementia spend an average of 53.7 hours per week providing help.

2� california alzheimer’s disease data report
Emotional Well-Being While it is not uncommon to hear about the “bur-
den” of caregiving, the vast majority of caregivers do not find caregiving as burdensome as some might be-lieve. Many report that the caregiving experience has enriched their lives in various ways such as feeling that they are contributing to the family, feeling as if they are setting an example for the children in the family, feel-ing as if caregiving has brought the family closer to-gether, and feeling good about being able to help.12
Most family and other unpaid caregivers are proud of the help they provide, and some manage caregiving tasks with little difficulty. However, there is substantial evidence that caregiving can exact a toll on emotional health and cause stress and depression, especially for caregivers of people living with Alzheimer’s disease. On a scale of one to five, with five being “very emotionally stressful” and one being “not at all stressful,” 41% of Alzheimer’s caregiv-ers rate their situation as a four or five, compared to 31% of other caregivers. Caregiving is rated as a physical strain, a four or five on a similar scale, for 22% of Alzheimer’s care-givers while non-Alzheimer’s caregivers are less likely to rate their situation as a four or five (13%).17 About one-third of family caregivers of people with Alzheimer’s disease and other dementias have symptoms of depression.18
In the Caregiver Resource Center system, assessments of caregivers show:13
High caregiver burden (54%)—an average score of 18 on the Adapted Zarit Interview, a standardized tool measuring caregiver bur-den (scores may range from 0 to 48, with higher scores showing higher burden and a score above 16 indicating “high burden”).
Many are depressed—almost half (45%) ap-pear to have mild to moderate depression, with a score of 16 or higher on the Center for
•
•
Epidemiologic Studies Depression scale (CES-D), a standardized tool to measure depression.
Most (63.4%) report experiencing anxi-ety or depression in the past 12 months.
Most report themselves to be in excel-lent (13.4%) or good (52.6%) health.
But, almost a third (29.4%) say their health is worse than it was six months ago.
As shown in Table 4, more caregivers of people with cognitive impairment felt the negative impacts of emotional stress, sleep interruption, physical strain, and financial hardship; and fewer enjoyed excellent or very good health than caregivers of people with other types of problems.12
•
•
•
Source: Scharlach, A., Sirotnik, B., Bockman, S., Neiman, M., Ruiz, C., & Dal Santo, T. (2003). A Profile of Family Caregivers: Results of the California Statewide Survey of Caregivers. Center for the Advanced
Study of Aging Services, University of California, Berkeley.
Table �: Impact on Caregivers of Individuals with Severe Memory Problems/Dementia Compared to Caregivers of Individuals with
Problems Other Than Memory/Dementia
Severe Memory Problems/Dementia
Problems Other Than Memory/
DementiaEmotionally stressful
Sleep interrupted
Physical strain
Financial hardship
Excellent or very good health
Person receiving care has:
Impact on Caregiver
44%
32%
24%
19%
36%
26%
22%
13%
11%
44%

25california alzheimer’s disease data report
Health There are a significant number of caregivers for
whom the stresses and strains of caregiving negatively impact their health. While almost 75% of California caregivers describe their health as excellent or good, 25% consider their health fair or poor. These propor-tions do not differ significantly among non-Alzheimer’s caregivers.12 National estimates are similar, with nearly three quarters of Alzheimer’s disease and other caregiv-ers reporting that caring for their relative has had no effect on their own health. However, 18% of Alzheimer’s disease caregivers perceive a link between caregiv-ing responsibilities and a decline in their own health compared to 12% of non-Alzheimer’s caregivers.17
Income and Financial SecurityMany caregivers of people with Alzheimer’s dis-
ease and other dementias have to quit work, reduce their work hours, or take time off because of caregiving responsibilities. Significantly more California caregiv-ers who provide care to someone age 50 or over with memory problems or dementia changed their work schedules (reduced the number of work hours) than did those not dealing with this condition.12 In the two weeks before the survey, 21% of employed caregivers had missed work—from arriving late or leaving early to taking three or more days off. One half of these employees missed at least 16 hours of work during this two-week period.12
Family and other unpaid caregivers who turn down promotions, reduce their work hours, and quit work, lose job-related income and benefits including employer contri-butions to their own retirement savings. In addition, peo-ple with Alzheimer’s disease and other dementias use sub-stantial amounts of paid care.19 Some of this care is covered by public programs and private insurance, but the person and family must pay out-of-pocket for much of the care.2
About one-half of California’s caregivers caring for an individual 50 years of age or older are employed outside the home. Among employed caregivers, 71% are full-time and 29% are part-time employees.12 Of non-employed caregivers, about half (49%) said they were retired and 8% were taking a leave of absence. Asked how caregiving activities affected their job status, 13% reported reduc-ing work hours, 4% had changed jobs, and 6% reported other job impacts. As shown in Table 5, at least one-fourth of California’s caregivers have very low annual house-
Grouped
Table 5: Income of Caregivers Caring for an Individual 50 Years of Age and Older
Respondents were asked whether their annual income was above or below $30,000, then asked to specify their income more precisely. While most answered the more specific question, a small percentage responded only to the first question.
Source: Scharlach, A., Sirotnik, B., Bockman, S., Neiman, M., Ruiz, C., & Dal Santo, T. (2003). A Profile of Family Caregivers: Results of the California Statewide Survey of Caregivers. Center for the Advanced Study of Aging Services, University of California, Berkeley.
Under $�0,000
$�0,000–$20,000
$20,00�–$30,000
< $30,000 (unspecified)*
$30,00�–$39,999
$�0,000–$50,000
$50,00�–$80,000
Over $80,000
> $30,000 (unspecified)*
Percentage200� Household Income9%
16%
13%
2%
11%
12%
17%
17%
3%
25%
26%
49%
*
The costs of caring for an individual with Alzheimer’s disease are approximately 31% more than caring for a person with a serious physical ailment.

2� california alzheimer’s disease data report
hold incomes—$20,000 or less.12 A large proportion of caregivers live in lower-middle-income households, with annual incomes between $20,000 and $40,000.
Data from California’s eleven Caregiver Resource Centers (CRCs) indicate that more than one-half (56%) of the care recipients have a degenerative illness, primar-ily Alzheimer’s disease (31%).13 Among the caregivers served by the CRCs who are under the age of 65, a simi-lar picture emerges in that about one-half are employed, with about 31% of them full-time employees and 18% part-time.13 When all caregivers were asked whether their employment status had changed due to caregiv-ing activities, 8% said they had reduced work hours, 11% quit their job, and 16% reported other types of job im-pacts.20 As Table 6 displays, the CRC system tends to serve a less affluent population, with only 31% of re-spondents reporting income above $40,000 a year (com-pared to 49% of caregivers in the state as a whole).20
Caregivers’ lives change forever when their loved ones fall ill. With enormous dedication, families are providing care at home for as long as they can, as an alternative to the institutionalization of the person they care for. The CRCs provide an invaluable resource to caregivers. However, the need for the type of ser-vices provided by the CRCs greatly exceeds their cur-rent capabilities. At the end of 2006-07 fiscal year, 5,697 family caregivers were on respite waiting lists at CRCs in California. The average client wait-time for CRC respite assistance was 24 months, representing a de-crease from the previous year of about two months.13
Table �: Income of Caregivers Served by the Caregiver Resource Centers
Source: Family Caregiver Alliance Fact Sheet: California Caregivers: A Profile. (2007), accessible at http://caregiver.org/caregiver/jsp/
content_node.jsp?nodeid=1961.
Under $9,000
$9,000–$��,999
$�2,000–$�9,999
$20,000–$39,999
$�0,000–$59,999
$�0,000–$79,999
$80,000–$99,999
$�00,000 or above
Percentage200� Household Income Grouped5%
4%
17%
43%
17%
8%
3%
3%
26%
43%
31%
27california alzheimer’s disease data report
Section IIICosts of Caring for People with Alzheimer’s Disease in California
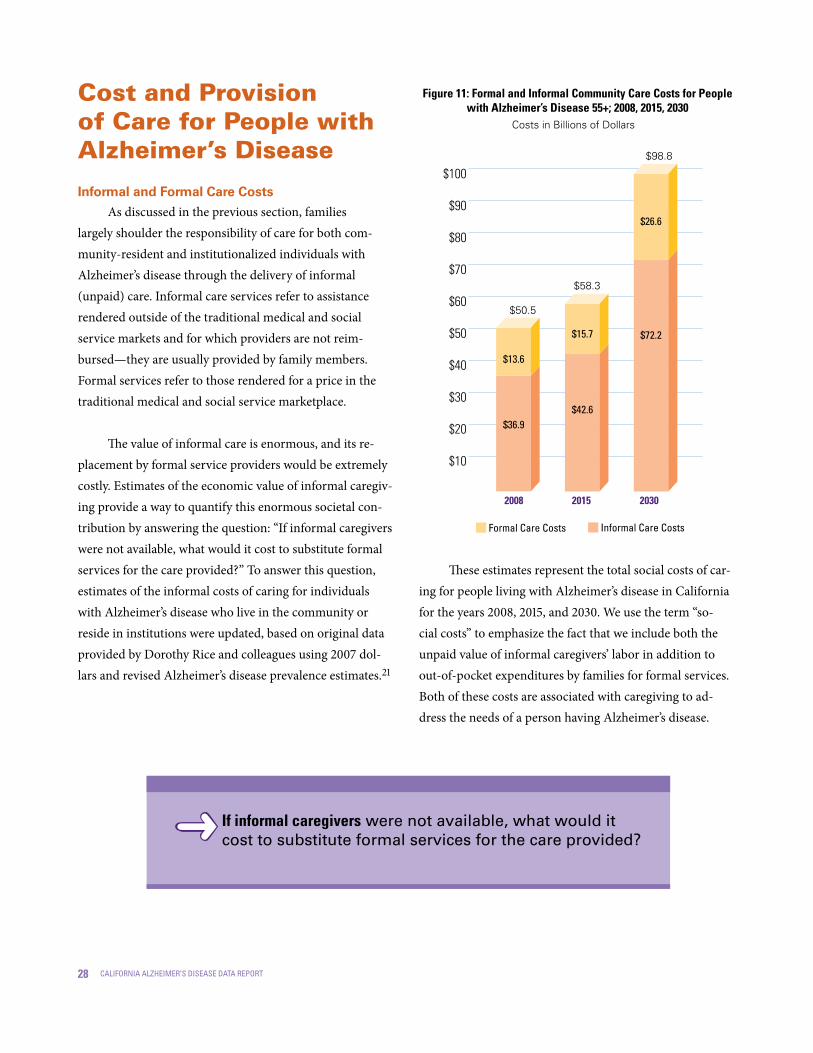
28 california alzheimer’s disease data report
Cost and Provision of Care for People with Alzheimer’s Disease
Informal and Formal Care Costs
As discussed in the previous section, families largely shoulder the responsibility of care for both com-munity-resident and institutionalized individuals with Alzheimer’s disease through the delivery of informal (unpaid) care. Informal care services refer to assistance rendered outside of the traditional medical and social service markets and for which providers are not reim-bursed—they are usually provided by family members. Formal services refer to those rendered for a price in the traditional medical and social service marketplace.
The value of informal care is enormous, and its re-placement by formal service providers would be extremely costly. Estimates of the economic value of informal caregiv-ing provide a way to quantify this enormous societal con-tribution by answering the question: “If informal caregivers were not available, what would it cost to substitute formal services for the care provided?” To answer this question, estimates of the informal costs of caring for individuals with Alzheimer’s disease who live in the community or reside in institutions were updated, based on original data provided by Dorothy Rice and colleagues using 2007 dol-lars and revised Alzheimer’s disease prevalence estimates.21
These estimates represent the total social costs of car-ing for people living with Alzheimer’s disease in California for the years 2008, 2015, and 2030. We use the term “so-cial costs” to emphasize the fact that we include both the unpaid value of informal caregivers’ labor in addition to out-of-pocket expenditures by families for formal services. Both of these costs are associated with caregiving to ad-dress the needs of a person having Alzheimer’s disease.
$100
$90
$80
$70
$60
$50
$40
$30
$20
$10
Figure ��: Formal and Informal Community Care Costs for People with Alzheimer’s Disease 55+; 2008, 20�5, 2030
2008 20�5 2030
Costs in Billions of Dollars
$98.8
$50.5
$58.3
$13.6
$36.9
$15.7
$42.6
$26.6
$72.2
informal care costsformal care costs
If informal caregivers were not available, what would it cost to substitute formal services for the care provided?

29california alzheimer’s disease data report
In thinking about the economic value (or cost) of informal care and the cost of formal care, it is prudent to keep in mind that a reduction in costs in one type of care will reflect an increase in costs in the other type of care. So, for example, if we reduce formal care costs, we in-crease informal care costs, and vice versa. This is because the care needs of people living with Alzheimer’s disease will remain, regardless of which long-term care sector (i.e., informal or formal) provides the assistance. Since the value of informal care is imputed, it therefore represents a social cost rather than an actual out-of-pocket expen-diture for the care of people with Alzheimer’s disease.
As displayed in Figures 11 and 12, between 2008 and 2030 it is estimated that the total cost of caring for community-resident (Figure 11) and institutionalized (Figure 12) individuals 55 years and older living with Alzheimer’s disease in California will increase from $53.2 billion to $104 billion. This near doubling in cost paral-lels the doubling in the number of people 55 years of age and older who will be living with Alzheimer’s disease,
largely due to the aging of the baby boomers. Family members’ labor will contribute almost three-quarters of the total cost of care for community-resident and institu-tionalized individuals living with Alzheimer’s disease.
In the next 20 years, the total costs of caring for people with Alzheimer’s disease in California who live in the community are estimated to increase 49%, from $50.5 billion in 2008 to $98.8 billion in 2030. A simi-lar increase will occur for individuals living in institu-tions, such as skilled nursing facilities, from $2.7 billion in 2008 to $5.2 billion in 2030. However, compared to community-resident individuals, the majority of costs for institutionalized individuals with Alzheimer’s dis-ease are due to skilled nursing facility expenditures.
Given the projected increases in the number of Californians living with Alzheimer’s disease, the economic impact of the disease in the future will be substantial in terms of formal costs alone. Since a high proportion of costs for institutional care are borne by the federal and state gov-ernments, the costs to taxpayers will be high. The impact on families will be even more dramatic, since the majority of care for individuals is provided for through informal sourc-es, typically the family. The informal and formal costs are estimated to double between now and 2030. Informal care costs, currently estimated to be $37 billion, will exceed $72 billion by 2030. Formal care costs are estimated to increase from $16 billion (2008) to more than $31 billion (2030).
As would be expected, there is a higher total cost of caring for people with severe Alzheimer’s disease. The rela-tive increased cost of informal care for individuals with Alzheimer’s disease living in the community with severe cognitive impairment compared to those having mild or moderate impairment is 12%; whereas the cost increase for providing formal care services is significantly greater, a more than doubling of estimated costs for caring for a per-son with severe Alzheimer’s disease compared to someone with mild or moderate impairments (see Appendix E).
Figure �2 Formal and Informal Institutional Care Costs for People with Alzheimer’s Disease 55+; 2008, 20�5, 2030
Costs in Billions of Dollars
$6
$5
$4
$3
$2
$1
2008 20�5 2030
$2.4
$0.5
$5.2
$2.7
$0.3
$3.1
$0.3
$2.8
$4.7
informal care costsformal care costs

30 california alzheimer’s disease data report
Although informal care costs represent an im-puted value rather than an actual dollar expenditure, if unpaid caregivers were not available, caregiving ser-vices would probably be purchased from paid provid-ers, or else people living with Alzheimer’s disease now cared for in the community would be placed in institu-tions such as skilled nursing facilities. Smaller family size, coupled with the increasing labor force participation of those who provide most of the care—women— will result in fewer available informal caregivers for people with Alzheimer’s disease in the future. Therefore, more of these imputed costs may become actual expenditures.
Costs to the Medi-Cal Program
People living with Alzheimer’s disease and related dementias are high users of health care and long-term care services, and all people who have these conditions will eventually need end-of-life care unless they die sud-denly of another cause. Medi-Cal pays for skilled nurs-ing facility and other long-term care services in the com-munity, and high use of these services by people living with dementia translates into high costs for Medi-Cal.
The care of people with Alzheimer’s disease and other dementias is a significant contributor to Medi-Cal costs. Lack of community-based services may increase hospitalization rates and may contribute to people be-ing placed into nursing homes earlier than necessary, thereby driving up Medi-Cal costs. In addition to nurs-ing home care, other services are often needed when caring for people living with Alzheimer’s disease, such as psychiatric visits, adult day health care, home health, hospice, psychological services, durable medi-cal equipment, lab and x-ray, and ambulance services.
We examined costs to the Medi-Cal program by up-dating figures reported by Joseph Menzin and colleagues in 1999 by adjusting costs to reflect 2007 dollars.22 To deter-mine Medi-Cal costs, the Menzin study obtained detailed Medi-Cal enrollment and claims data using a retrospective cohort design to document the cost of Alzheimer’s disease and related dementias to Medi-Cal in 1995. Expenditures for an Alzheimer’s disease and related dementias group and a comparison group were documented, and differences between these two groups in Medi-Cal service utilization and costs were estimated. The diagnostic breakdown of the Alzheimer’s disease and related dementias group included 28% having Alzheimer’s disease, 16% with cerebral degenera-tion, and 50% diagnosed with senile or pre-senile dementia.
As shown in Figure 13, there will be a significant increase in cost to the Medi-Cal program in per-person spending for individuals diagnosed with Alzheimer’s disease and other dementias compared to other Medi-Cal beneficiaries without these diagnoses. The cost to the Medi-Cal programs for an individual with Alzheimer’s disease or related dementia is 2.5 times greater than the cost for an individual not having these diagnoses. The majority of this cost difference is accounted for by skilled nursing facility expenditures. For an individual with a diagnosis of Alzheimer’s disease or other dementia, the skilled nursing facility expenditures are almost three times greater as compared to an individual without dementia.

3�california alzheimer’s disease data report
Trends in Formal Long-Term Care Provision and Costs
Most people with dementia live at home, usually with help from family and friends. Typically, these care-givers provide more help to their loved ones than caregiv-ers of people with physical disabilities. As the dementia progresses, caregivers provide more and more care un-til they can no longer manage care responsibilities on their own, often because of their own health decline.
When caregiving responsibilities exceed capac-ity, families begin to explore long-term care options ranging from hiring home care workers to plac-ing their loved ones in assisted living residences or skilled nursing facilities. The following are some of the types of long-term care services available:23
Homemaker services allow people to continue to live in their own homes or to return to their homes by helping them complete household tasks that they can no longer manage alone. Homemaker service aides may clean clients’ houses, cook meals or run errands.
Home health aides, personal and home aides, pro-vide more extensive personal care than family or friends are able to or have the time or resources to provide. They help those who are elderly, disabled, or ill con-tinue to live in their own homes or in residential care facilities instead of in skilled nursing facilities. There are two categories of home health aides: Medicare certified and non-Medicare certified, licensed. Medicare certi-fied agencies can accept Medicare reimbursements while non-Medicare certified, licensed agencies cannot.
Adult Day Care/Health Care centers can of-fer a much-needed break to caregivers. This type of care provides services at a community-based con-gregate center for adults who need assistance or su-pervision during the day but who do not need round the clock care. The centers may provide health ser-vices, therapeutic services and social activities.
Assisted Living Facilities, known in California as Residential Care Facilities, are living arrangements that provide personal care and health services for people who may need assistance with ADLs (activities of daily living), but who wish to live as independently as possible and who do not need the level of care provided by a skilled nurs-ing facility. Assisted living is not an alternative to a nurs-ing home, but an intermediate level of long-term care.
Skilled Nursing Facility Care is for people who may need nursing care or a higher level of supervi-sion and personal care than in an assisted living facil-ity. They offer residents personal care, room and board, supervision, medication, therapies and rehabilita-tion, as well as skilled nursing care 24 hours a day.
$25,000
$20,000
$15,000
$10,000
$5,000
Figure �3: Medi-Cal Costs per Beneficiary �0+ with Alzheimer’s Disease and Other Dementias
Compared to Other Medi-Cal Beneficiaries: 2007 Dollars*
AD and Other Dementias
Group without Dementia
*Note: The source for these figures, which have been updated using 2007 dollars, is Menzin, Freidman, Cummings (1999). The Economic Cost of Alzheimer’s Disease and Related Dementias to the California Medicaid Program (Medi-Cal) in 1995. American Journal of Geriatric Psychiatry, 7, 300. Refer to “Use End Notes-Methods” appendix for methods used to update the Medi-Cal costs to 2007 dollars.
nursing home
inpatient hospital
other medi-cal services

32 california alzheimer’s disease data report
For the past five years, Genworth Financial, Inc. has conducted a survey of long-term care service provid-ers across the country within 90 regions. Each year, using a consistent methodology, the cost of care in more than 10,000 nursing homes, assisted living facilities and among home care providers in all 50 states and 90 geographic re-gions including the District of Columbia are surveyed. It is the most comprehensive cost analysis in the industry, and the only one that provides comparative data for the past five years. For the first time, this year’s survey also includes adult day health care costs. Based on these survey results, some trends have emerged across the long-term care ser-vices landscape. Overall, the cost of care within facility-based providers has steadily increased while non-skilled home care costs have remained relatively flat.23 Long-term care costs in California increased as much as 44% over the past five years (2004-2008) compared to a nation-wide costs increase of 17% during the same time period.
While there are a number of long-term care options available to people living with dementia and their families, paying for these services for very long is not affordable for most people. As shown in Table 7, in California home care can cost between $44,822 and $86,692 annually and assisted living averages $36,000 annually. Skilled nursing facility care is even more expensive ranging between $64,068 and $72,919 annually.23 In California for 2007, there were ap-proximately 37,000 individuals living with dementia who spent some time in a nursing home, approximately 6% of all people with Alzheimer’s disease.24, 25, 26 Medi-Cal will cover the skilled nursing facility stays that most people with
dementia will need, but this program requires beneficia-ries to be poor to receive coverage. Private long-term care insurance is only an option for those healthy and wealthy enough to purchase policies before developing dementia.
The cost of long-term care is expected to rise over the years, simply due to inflation. What these estimates do not take into consideration are market forces that may significantly contribute to the rising costs of care. The U. S. will experience an imminent shortage of for-mal caregivers, and it is estimated that 200,000 new direct-care workers will need to be recruited each year to meet future demand among the 78 million baby boom-ers as they age.27 This is further aggrevated by the lack of health professionals who have geriatric training. Although California-specific data are not available, the state will surely feel the impact of this shortage. At the same time, the caregiver workforce is dwindling and faces issues of retention and quality. This gap has the potential to nega-tively impact Californians and the California health care
* Annual cost estimates do not reflect Medi-Cal reimbursement rates, which are generally lower.
Source: http://www.genworth.com/content/content/genworth/www_genworth_com/web/us/en/products_we_offer/long_term_care_insurance/long_term_care_overview/what_is_the_cost_of_long_term_care/interactive_cost_of_care_map.html, accessed July 16, 2008.
Table 7: Annual Cost of Long-Term Care in California: Assuming 5% Annual Inflation*
Skilled Nursing Facility
Assisted Living Facility
Adult Day Health Care Facility1
Home Care2
2008$72,919$64,068
$35,870
$18,923
$86,692
$47,384$44,822
$102,604$90,150
$50,473
$26,627
$121,984
$66,674$63,069
20�5 2030Private RoomSemi-Private Room
Private, 1-Bedroom
Adult Day Health Care
Home Health Aide(Medicare-Certified & Licensed)Home Health Aide (Licensed Only)Homemaker Services (Licensed Only)
$213,307$187,416
$104,929
$55,355
$253,597
$138,611$131,116
1 Based on 8 hours a day, 5 days a week of care2 Based on 44 hours per week of care
In California, home care can cost between $44,822 and $86,692 annually.
33california alzheimer’s disease data report
system in two ways: the costs of health care may rise significantly as the workforce supply diminishes, and the quality and availability of care providers may decrease, placing added pressures on family members and friends to care for loved ones who may require long term care.
Policymakers at the federal, state and local levels will need to work together to provide financial incen-tives along with some basic job training and support services, to prevent the decline in the number of qualified long term care workers in relation to the growing need for their services. This is true for both the paid caregiv-ing workforce as well as the millions of unpaid family caregivers who make great personal and financial sac-rifices in order to care for their loved ones. Successful solutions revolve around addressing the recruitment and retention of workers while providing adequate sup-port systems for both paid and unpaid caregivers.
In 2000, California responded to this worker short-age by funding the Caregiver Training Initiative (CTI), as part of the Governor’s Aging with Dignity Initiative. The goals of the CTI project were to address urgent caregiver workforce shortages through innovative ap-proaches for recruiting, training, and retaining care-
givers in the healthcare industry and to enhance the earning potential of these workers to ensure that:
California’s communities have well-trained caregivers necessary for all lev-els of care for the elderly population;
Communities have caregivers necessary for continuity of long-term care; and
Caregivers have opportunities for entry-level employment, and for career advancement.
Twelve Regional Collaboratives throughout California were awarded grants and the primary participants in the program were Workforce Investment Act (WIA) clients and Welfare-to-Work (WtW) clients. Sites participat-ing in the project implemented recruitment and train-ing approaches that either were novel to the site or used approaches in a novel manner. Some of the approaches included initiating collaborations to improve efficiency by reducing redundant tasks; targeting unique populations (military corpsmen, migrant worker family members, and non-English speaking home care workers); new screen-ing and assessment techniques to determine qualification of health care workers; supportive services (e.g., child-care, transportation and tutoring, to tuition reimburse-ment, books, uniforms, and lodging); fast-track training; and coordinating services not previously coordinated.
An evaluation of the CTI program indicated that it exceeded expectations by significantly increasing the supply of entry-level and advanced-level healthcare workers.28 The initiative demonstrated that a long-term care worker short-age can be addressed by supporting programs to recruit, train, and retain individuals not currently in the workforce or who are underemployed. However, these programs may be costly due to pre-training preparation, training, and supportive services needed for individual and program success, thus, a greater focus is needed on the study of fac-tors leading to increasing retention of this workforce.
•
•
•

3� california alzheimer’s disease data report
Cost to California Businesses
Today about 588,000 Californians are living with Alzheimer’s disease. Approximately 26,651 (4.53%) of these individuals live in skilled nursing facilities, while the majority live at home in their communities, being cared for by family and friends. Their illness has an im-mense impact on their families. As noted earlier, one of these impacts is that caregiving causes employees to miss work with resultant losses in economic productivity.
Productivity Losses to California BusinessK
As shown in Table 8, the estimated cost to California employers in lost productivity annually from full-time employed caregivers is $1.4 billion. Studies suggest a wide variation of replacement costs depending upon the sta-tus of the worker, the size of the company, and external factors related to supply and demand of skilled workers. We used a national estimate of 3.7 years for the aver-age length of time employed caregivers provide care. Estimating 11% of caregivers quit their jobs, the percent-age of caregivers leaving the workplace on an annual basis is 3%, or 11,582 California employees. The loss of these workers costs California businesses an estimated loss in economic productivity in excess of $318 million annually. This monetary loss does not take into consid-eration part-time employed caregivers who can no lon-ger work due to significant caregiving responsibilities.
Absenteeism is particularly costly to California busi-nesses. Approximately 21% of employed caregivers (81,076) miss work from arriving late to taking three or more days off, and half of these employees missed at least 16 hours of work during a two-week period.12 This resulted in an estimated 400 hours of work missed annually by caregivers. Using the median wage of $16.91, this resulted in $548 mil-lion in caregiver absenteeism costs to California businesses.
In the coming years, as the baby boomers age and life expectancy increases, more workers will be taking on the responsibility of caregiving for loved ones. The costs to California businesses will continue to rise if proactive measures are not taken, such as making eldercare resources available. These resources may include flextime; telecom-muting and job-sharing; programs that provide respite care; adult day services and caregiver support groups; informa-tion, referral and educational programs; and employee and/or employer funded long-term care insurance.29 An interesting resource for businesses to determine their pro-ductivity cost for working caregivers is the Eldercare cal-culator developed by MetLife and the National Alliance for Caregiving: http://www.eldercarecalculator.org/ECalc.asp.
Table 8: Total Estimated Cost to California Businesses of Full-Time Employed Caregivers
Cost per Employee
Total Employer Cost
Replacing Employees
Absenteeism
Workday Interruptions
Elder Crisis
Supervisor Time
Unpaid Leave
Full-Time to Part-Time
Total
$825
$1,420
$379
$244
$103
$189
$346
$ 3,506
$318,512,329
$548,398,064
$146,239,371
$94,010,807
$39,630,499
$73,119,516
$133,665,090
$1,353,575,676
To estimate the productivity losses to California businesses, several sources of data were used. 12, 29, 35, 36, 37 Also, refer to Appendix F for an explanation of the methodology used for these calculations. The California median hourly wage used in these calculations was obtained from the May 2007 United States Department of Labor Bureau of Labor Statistics.35 Productivity losses are based on the 70 percent of California caregivers who work full-time which translates to 386,076 caregivers.12 To calculate the different components effecting businesses, we followed the model used in “The MetLife Caregiving Cost Study: Productivity Losses to U.S. Business” (2006).29
K

35california alzheimer’s disease data report
Appendix A: Overview of Alzheimer’s Disease and Other Dementias
Appendix B: State and County Alzheimer’s Disease Prevalence Estimates
Appendix C: State and County Alzheimer’s Disease and Dementia Lifetime Risk Estimates
Appendix D: State and County Alzheimer’s Disease Mortality Estimates
Appendix E: State Formal and Informal Alzheimer’s Disease Cost of Care Projections
Appendix F: Methodological Notes and Data Sources
Appendix G: References
Appendix H: Alzheimer’s Association Chapters and Offices in California
Appendix I: Caregiver Resource Centers in California
Appendix J: Alzheimer’s Disease Research Centers of California
Appendix K: 2008 California Guideline for Alzheimer’s Disease Management
Appendices
37
45
63
65
69
73
79
83
85
87
91
Appendices

3� california alzheimer’s disease data report
37california alzheimer’s disease data report
Appendix AOverview of Alzheimer’s Disease and Other DementiasL
L Portions of this report contain information reprinted with permission from the Alzheimer’s Association, 2008 Alzheimer’s Disease Facts and Figures, p. 4.2
Overview of Alzheimer’s Disease and Other DementiasThis section provides information about the definition of dementia,
the characteristics of specific types of dementia, and the symptoms and risk factors for, and treatment of, Alzheimer’s disease. Alzheimer’s disease is the most common cause of dementia. More detailed information on these topics is available at www.alz.org. Specific information for each of the Alzheimer’s Association California chapters can also be accessed through this website and Appendix H lists the California Alzheimer’s Association chapters and offices.

38 california alzheimer’s disease data report
Dementia: Definition and Specific TypesDementia is a clinical syndrome of loss or de-
cline in memory and other cognitive abilities. It is caused by various diseases and conditions that re-sult in damaged brain cells. To be classified as demen-tia, the syndrome must meet the following criteria:
It must include a decline in memory and impairment in at least one of the following cognitive abilities:
Ability to generate coherent speech and understand spoken or written language;
Ability to recognize or identify objects, assuming intact sensory function;
Ability to execute motor activi-ties, assuming intact motor abili-ties, sensory function and compre-hension of the required task; and
Ability to think abstractly, make sound judgments and plan and carry out complex tasks.
The decline in cognitive abilities must be severe enough to interfere with daily life (e.g., tasks at work; functioning in social situations).
Different types of dementia have been associated with distinct symptom patterns and distinguishing mi-croscopic brain abnormalities. Increasing evidence from long-term epidemiological observation and autopsy studies suggests that many people have microscopic brain abnor-malities associated with more than one type of dementia. The symptoms of different types of dementia also over-lap and can be further complicated by coexisting medical conditions. Table A1 (on the following pages) provides information about the most common types of dementia.
•
•
•
•
•
•
Causes of DementiaM
As shown in Figure A1, Alzheimer’s disease is the most common type of dementia. Nationally, Alzheimer’s accounts for 70% of all cases of dementia in Americans age 71 and over. Vascular dementia accounts for 17% of cases of dementia, and other diseases and conditions, including Parkinson’s disease, Lewy body disease, frontotemporal dementia and normal pressure hydrocephalus, account for the remaining 13%.
Portions of this report contain information reprinted with permis-sion from Alzheimer’s Association, 2008 Alzheimer’s Disease Facts and Figures, p. 13.2
Figure A�: Causes of Dementia in People 7� Years of Age and Older: ADAMS, 2002
Source: Plassman, BL; Langa, KM; Fisher, GG; Heeringa, SG; Weir, DR; Ofstedal, MB, et al. “Prevalence of Dementia in the United States: The Aging Demographics, and Memory Study.” Neuroepidemiology 2007; 29:125-132.31
Vascular dementia
�7%
other dementia
�3%
alzheimer’s disease
70%
M

39california alzheimer’s disease data report
Mild cognitive impairment is a condition in which a person has problems with memory, language or an-other essential cognitive function that is severe enough to be noticeable to others and show up on psychomet-ric tests, but not severe enough to interfere with daily life. Some people with mild cognitive impairment go on to develop dementia. For others, the symptoms of mild cognitive impairment do not progress to dementia, and some people who have mild cognitive impairment at one point in time later revert to normal cognitive sta-tus. Due to differences in how mild cognitive impair-ment is defined, the incidence and prevalence is not yet understood—research actively continues in this area.

�0 california alzheimer’s disease data report
Considered the second most common type of dementia.
Impairment is caused by decreased blood flow to parts of the brain, often due to a series of small strokes that block arteries.
Symptoms often overlap with those of Alzheimer’s, although memory may not be as seriously affected.
Type of Dementia
Most common type of dementia; accounts for 60 to 80 percent of cases.
Difficulty remembering names and recent events is often an early clinical symptom; later symptoms may include impaired judgment, disorientation, confusion, behavior changes and trouble speaking, swallowing and walking.
Hallmark abnormalities are deposits of the protein fragment beta-amyloid (plaques) and twisted strands of the protein tau (tangles).
Pattern of decline may be similar to Alzheimer’s, including problems with memory, judgment and behavior changes.
Alertness and severity of cognitive symptoms may fluctuate daily.
Visual hallucinations, muscle rigidity and tremors are common.
Hallmarks include Lewy bodies (abnormal deposits of the protein alpha-synuclein) that form inside nerve cells in the brain.
Characterized by the presence of the hallmark abnormalities of Alzheimer’s and another type of dementia, most commonly vascular dementia, but also other types, such as dementia with Lewy bodies, frontotemporal dementia and normal pressure hydrocephalus.
Dementia with Lewy bodies
Mixed dementia
Vascular dementia (also known as multi-infarct or post-stroke dementia or vascular cognitive impairment)
Alzheimer’s disease
Characteristics
Table A�: Common Types of Dementia and Their Typical Characteristics N
Portions of this report contain information reprint-ed with permission from Alzheimer’s Association, 2008 Alzheimer’s Disease Facts and Figures, p. 5-8.2
N

��california alzheimer’s disease data report
Caused by the buildup of fluid in the brain.
Symptoms include difficulty walking, memory loss and inability to control urine.
Can sometimes be corrected with surgical installation of a shunt in the brain to drain excess fluid.
Rapidly fatal disorder that impairs memory and coordination and causes behavior changes.
“Variant Creutzfeldt-Jakob disease” is believed to be caused by consumption of products from cattle affected by “mad cow disease.”
Caused by the misfolding of prion protein throughout the brain.
Involves damage to brain cells, especially in the front and side regions of the brain.
Typical symptoms include changes in personality and behavior and difficulty with language.
No distinguishing microscopic abnormality is linked to all cases.
Pick’s disease, characterized by “Pick’s bodies,” is one type of frontotemporal dementia.
20–30 percent of people who have Parkinson’s disease develop dementia in the later stages of the disease.31
The hallmark abnormality is Lewy bodies (abnormal deposits of the protein alpha-synuclein) that form inside nerve cells in the brain.
Normal pressure hydrocephalus
Creutzfeldt-Jakob disease
Frontotemporal dementia
Parkinson’s disease
Type of Dementia Characteristics
Table A�, con’t.

�2 california alzheimer’s disease data report
More about Alzheimer’s DiseaseIn Alzheimer’s disease, as in other types of dementia,
increasing numbers of nerve cells deteriorate and die. A healthy adult brain has 100 billion nerve cells, or neurons, with long branching extensions connected at 100 trillion points. At these connections, called synapses, information flows in tiny chemical pulses released by one neuron and taken up by the receiving cell. Different strengths and pat-terns of signals move constantly through the brain’s circuits, creating the cellular basis of memories, thoughts and skills.
In Alzheimer’s disease, information transfer at the synapses begins to fail, the number of synapses de-clines and eventually cells die. In a brain with advanced Alzheimer’s, there is dramatic shrinkage from cell loss and widespread debris from dead and dying neurons.
Scientists do not yet fully understand the pro-cesses that result in the catastrophic brain damage as-sociated with Alzheimer’s disease. According to a lead-ing theory, called the “amyloid hypothesis,” the prime suspect is a tiny protein fragment called beta-amyloid. Trouble begins when yet-to-be-identified factors trig-ger overproduction of beta-amyloid or reduce the brain’s ability to dispose of it. The excess jams signaling at the synapses, blocking information flow and leading to a cascade of damaging events ending in cell death.
Beta-amyloid fragments gradually accumulate into the microscopic “plaques” considered to be one patho-logical hallmark of Alzheimer’s. The other hallmark is “tangles,” formed when a different protein called tau twists into strands inside dead and dying neurons. Other ab-normalities seen in Alzheimer brain tissue include in-flammation and oxidative damage due to highly reactive oxygen-containing products of cellular metabolism.
Symptoms of Alzheimer’s DiseaseAlzheimer’s disease can affect individuals differently,
but the most common symptom pattern begins with a gradual difficulty in remembering new information. This is because disruption of brain cells usually begins in regions involved in forming new memories. As damage spreads, in-dividuals also experience confusion, disorganized thinking, impaired judgment, difficulty expressing themselves and disorientation to time, space and location. As the disease progresses, these symptoms may lead to wandering and difficulty with social interactions. In advanced Alzheimer’s, people need help with bathing, dressing, using the bath-room, eating and other daily activities. Those in the final stages of the disease lose their ability to communicate, fail to recognize loved ones and become bed-bound and reli-ant on 24/7 care. Alzheimer’s disease is ultimately fatal.
An estimated 75% of people living with Alzheimer’s are cared for at home. While families provide most of the care, some also use home and community-based resources like home care agencies, adult day care, and Caregiver Resource Centers (www.californiacrc.org; see Appendix I for the Caregiver Resource Centers in California). For many families there is a challenge for finding sufficient and affordable community resources to allow them to con-tinue caring for their loved one with Alzheimer’s disease at home. In the later stages of the disease, as more assistance is needed than family caregivers can provide, caregivers may decide to move individuals with Alzheimer’s dis-ease into a continuing care retirement community hav-ing multiple levels of care, a residential care facility for the elderly (assisted living, board and care) or a nursing home.
�3california alzheimer’s disease data report
Risk Factors for Alzheimer’s DiseaseAlthough the cause or causes of Alzheimer’s disease
are not yet known, most experts agree that Alzheimer’s, like other common chronic conditions, probably develops as a result of multiple factors rather than a single cause. The greatest risk factor for Alzheimer’s disease is advanc-ing age. Most Americans with Alzheimer’s disease are age 65 or older, although individuals younger than age 65 can also develop the disease. When Alzheimer’s or another type of dementia is recognized in a person under age 65, these conditions are referred to as “early-onset” Alzheimer’s or “earlier-onset” dementia. Since ‘early-onset’ may be confused with ‘early diagnosis’ of Alzheimer’s disease or dementia, the term ‘younger-onset’ is preferred in this report when referring to individuals who are diagnosed with Alzheimer’s disease or dementia before the age of 65.
The Alzheimer’s Association estimates that be-tween 220,000 and 640,000 people nationwide are liv-ing with younger-onset Alzheimer’s.32 While this is a plausible estimate, it is generally acknowledged that significantly more Americans are living with younger-onset Alzheimer’s disease but are yet to be diagnosed. Additional research is needed to refine these estimates.
A small percentage of Alzheimer’s disease, probably less than five percent, is caused by rare genetic variations found in a small number of families worldwide. In these inherited forms of Alzheimer’s, the disease tends to develop before age 65, sometimes in individuals as young as 30.
A genetic factor in Alzheimer’s disease that de-velops after age 65 is Apolipoprotein E-e4 (APOE-e4). APOE-e4 is one of three common forms of the APOE gene, which provides the blueprint for a protein that car-ries cholesterol in the bloodstream. Everyone inherits one form of the APOE gene from each of his or her parents. Those who inherit one APOE e4 gene have increased risk of developing Alzheimer’s disease. Those who inherit two APOE e4 genes have an even higher risk, but there is still no certainty that they will develop Alzheimer’s.
In addition to genetic risk factors, recent re-search identifies lifestyle factors that may reduce risk for Alzheimer’s disease and vascular dementia including: aerobic exercise; a diet rich in fruits, vegetables, and anti-oxidents but low in saturated fats; a lifetime of intellectual and cognitive stimulation; social engagement; and, overall maintenance of health. Some data indicate that manage-ment of cardiovascular risk factors, such as high choles-terol, type 2 diabetes, high blood pressure and weight, may help avoid or delay cognitive decline. Additional evidence points to a significant role for regular physical exercise in maintaining lifelong cognitive health. Many scientists consider the emerging field of risk reduction one of the most exciting recent developments in the demen-tia research arena. A growing body of evidence suggests that the health of the brain—one of the body’s most highly vascular organs—is closely linked to the overall health of the heart and blood vessels. Attempts to reduce specific risk factors for Alzheimer’s disease should also consider methods to disseminate these recommendations to un-derserved populations who may not have access to this information or the economic means to implement them.

�� california alzheimer’s disease data report
Treatment and Prevention of Alzheimer’s Disease
No treatment is available to delay or stop the dete-rioration of brain cells in Alzheimer’s disease. The U.S. Food and Drug Administration has so far approved five drugs that temporarily slow worsening of symptoms for about six to 12 months, on average, for about half of the individuals who take them. Based on deepening insight into the underlying biology of Alzheimer’s and emerging conceptual frameworks for understanding the disease, researchers have identified several new treat-ment strategies that may have the potential to change its course. A number of experimental therapies based on the amyloid hypothesis and other targets have reached various stages of clinical testing in human volunteers.
Despite the current lack of disease-modifying thera-pies, studies have consistently shown that active medical and social interventions, and providing a biopsychosocial model of care, of Alzheimer’s and other dementias can significantly improve quality of life through all stages of the disease for diagnosed individuals and their caregivers. Best practices model includes ongoing assessment of symptoms, appropriate use of available treatment options, effective integration of coexisting conditions into the treatment plan and utilization by the patient and family caregiver of sup-portive services, such as counseling, activity and support groups and adult day programs. The California Guideline for Alzheimer’s Disease Management, a State-supported practice guideline for primary care providers, recom-mends that people with Alzheimer’s disease be referred to community support organizations such as the Alzheimer’s Association (www.alz.org) (Appendix H), the Caregiver Resource Centers (www.californiacrc.org) (Appendix I) or the Family Caregiver Alliance (www.caregiver.org) for patient and caregiver education and support (see Appendix J for a listing of Alzheimer’s disease Research Centers of California and Appendix K for a copy of the California Guidelines for Alzheimer’s Disease Management).

�5california alzheimer’s disease data report
Appendix BState and County Alzheimer’s Disease Prevalence Estimates

�� california alzheimer’s disease data report
Table B�: Estimated Number and Percent Change in People 55+ with Alzheimer’s Disease: 2008, 20�5 and 2030, California and Counties
Alameda
Alpine
Amador
Butte
Calaveras
Colusa
Contra Costa
Del Norte
El Dorado
Fresno
Glenn
Humboldt
Imperial
Inyo
Kern
Kings
Lake
Lassen
Los Angeles
Madera
Marin
Mariposa
Mendocino
Merced
Modoc
Mono
Monterey
Napa
Nevada
Orange
Placer
Plumas
Riverside
23,748
33
1,040
4,900
1,275
364
17,511
535
3,287
12,249
557
2,341
2,563
554
9,197
1,458
1,700
502
155,575
2,312
5,632
478
1,868
3,105
272
179
6,676
3,092
2,441
46,263
6,834
603
31,992
26,847
53
1,293
5,172
1,671
421
20,435
650
4,094
14,216
656
2,661
3,444
618
11,418
1,839
2,056
645
177,000
3,002
6,194
614
2,149
3,764
319
266
7,592
3,236
2,769
54,109
8,401
722
37,025
47,438
103
2,182
8,175
2,820
704
36,895
1,108
7,944
24,808
1,036
4,452
5,949
893
20,614
3,371
3,386
1,199
289,280
6,274
10,557
1,106
3,594
6,461
544
538
12,465
5,123
4,914
92,150
14,174
1,048
60,116
13
61
24
6
31
16
17
21
25
16
18
14
34
12
24
26
21
28
14
30
10
28
15
21
17
49
14
5
13
17
23
20
16
77
94
69
58
69
67
81
70
94
75
58
67
73
44
81
83
65
86
63
109
70
80
67
72
71
102
64
58
77
70
69
45
62
100
212
110
67
121
93
111
107
142
103
86
90
132
61
124
131
99
139
86
171
87
131
92
108
100
201
87
66
101
99
107
74
88
2008% change 20�5-2030
% change 2008-2030
% change 2008-20�5203020�5

�7california alzheimer’s disease data report
Sacramento
San Benito
San Bernardino
San Diego
San Francisco
San Joaquin
San Luis Obispo
San Mateo
Santa Barbara
Santa Clara
Santa Cruz
Shasta
Sierra
Siskiyou
Solano
Sonoma
Stanislaus
Sutter
Tehama
Trinity
Tulare
Tuolumne
Ventura
Yolo
Yuba
CALIFORNIA
22,006
719
23,680
49,530
17,438
9,796
6,082
13,684
8,148
27,658
3,763
3,870
103
1,283
6,113
8,902
7,575
1,592
1,365
368
5,586
1,684
12,541
2,571
1,016
588,208
25,692
904
29,922
54,490
19,206
11,840
6,831
14,610
8,682
32,988
3,931
4,540
117
1,458
7,458
9,169
9,286
2,035
1,585
475
6,692
2,033
14,819
3,042
1,289
678,446
44,181
1,759
56,591
92,804
26,868
20,514
10,836
23,298
13,209
58,569
7,699
7,482
171
2,126
14,139
15,799
16,138
3,642
2,320
817
11,733
3,229
26,301
5,712
2,204
1,149,560
17
26
26
10
10
21
12
7
7
19
4
17
14
14
22
3
23
28
16
29
20
21
18
18
27
15
72
95
89
70
40
73
59
59
52
78
96
65
46
46
90
72
74
79
46
72
75
59
77
88
71
69
101
145
139
87
54
109
78
70
62
112
105
93
66
66
131
77
113
129
70
122
110
92
110
122
117
95
2008% change 20�5-2030
% change 2008-2030
% change 2008-20�5203020�5
Table B2: Estimated Number and Percent Change in People 55+ with Alzheimer’s Disease by Race: 2008, 20�5 and 2030, California
Caucasian/non-Latino
Latino/Hispanic
African-American
Asian/Pacific Islander
American Indian
Multirace
386,251
92,242
26,521
72,075
3,219
7,899
399,324
128,887
31,569
101,113
4,945
12,608
590,160
276,821
52,369
194,266
10,591
25,353
3
40
19
40
54
60
48
115
66
92
114
101
53
200
97
170
229
221
2008% change 20�5-2030
% change 2008-2030
% change 2008-20�5203020�5

�8 california alzheimer’s disease data report
Table B3: Estimated Number of People 55+ with Alzheimer’s Disease by Race and County, 2008
Alameda
Alpine
Amador
Butte
Calaveras
Colusa
Contra Costa
Del Norte
El Dorado
Fresno
Glenn
Humboldt
Imperial
Inyo
Kern
Kings
Lake
Lassen
Los Angeles
Madera
Marin
Mariposa
Mendocino
Merced
Modoc
Mono
Monterey
Napa
Nevada
Orange
Placer
Plumas
Riverside
12,875
29*
963
4,450
1,166
265
12,892
463
3,002
7,961
457
2,081
848
465
6,447
894
1,467
428
79,477
1,657
4,985
427
1,642
2,052
239
155
4,475
2,622
2,297
33,834
6,071
554
24,647
2,250
0*
42*
169
62*
72
1,404
20*
126
2,561
65
75
1,529
33
1,657
355
91
30
36,934
453
308
22*
88
703
11*
11*
1,259
260
72
5,069
396
17*
4,535
2,992
0*
4*
53*
11*
5*
986
1*
15*
423
3*
13*
68
0*
346
76
66*
13*
12,058
72*
76
3*
11*
104
1*
1*
154
33*
5*
303
36*
5*
1,199
5,145
0*
7*
91
10*
11*
1,941
7*
73
1,048
13*
32*
60*
3*
454
93
20*
2*
24,559
55*
207
4*
25*
173
3*
3*
655
123
23*
6,396
228
5*
1,123
92
4*
13*
54*
13*
6*
70
31*
22*
98
9*
90
41*
43*
106
17*
26*
17*
442
41*
7*
12*
68
23*
13*
8*
43*
14*
13*
158
35*
13*
137
394
0*
12*
82*
14*
4*
218
13*
49*
159
10*
51*
17*
10*
188
23*
30*
12*
2,104
34*
50*
11*
33*
50*
4*
2*
90
40*
31*
503
67*
10*
350
CaucasianNative
American Multirace
Asian/Pacific
IslanderAfrican-
AmericanLatino/
Hispanic

�9california alzheimer’s disease data report
CaucasianNative
American Multirace
Asian/Pacific
IslanderAfrican-
AmericanLatino/
HispanicSacramento
San Benito
San Bernardino
San Diego
San Francisco
San Joaquin
San Luis Obispo
San Mateo
Santa Barbara
Santa Clara
Santa Cruz
Shasta
Sierra
Siskiyou
Solano
Sonoma
Stanislaus
Sutter
Tehama
Trinity
Tulare
Tuolumne
Ventura
Yolo
Yuba
15,207
444
15,216
37,349
7,299
5,927
5,435
9,014
6,377
16,776
3,019
3,527
94
1,127
3,843
7,696
5,462
1,147
1,219
332
3,816
1,557
9,415
1,915
753
2,250
219
5,185
6,074
1,619
1,810
369
1,402
1,218
4,001
439
105
5*
52*
492
667
1,477
210
82
7*
1,311
73
2,024
371
101
1,159
7*
1,484
1,064
1,174
416
45*
435
118
393*
27
26*
0*
25*
495
76
90
23*
5*
1*
72*
5*
147
67*
34*
2,771
33*
1,326
4,335
7,035
1,371
121
2,625
309
6,100
206
65*
0*
12*
1,118
295
349
164
8*
1*
235
10*
762
158
72*
123
7*
147
306
46*
64
36*
35*
48*
108
22*
67*
1*
34*
41*
58
66
18*
24*
14*
60*
16*
59*
24*
19*
495
9*
322
401
266
209
78*
173
79*
279
50*
80*
2*
34*
124
110
130
31*
26*
12*
92
23*
135
37*
38*
*Estimate is unreliable; race/ethnicity population for specified group is less than 1,000 individuals.

50 california alzheimer’s disease data report
Table B�: Estimated Number of People 55+ with Alzheimer’s Disease by Race and County, 20�5
Alameda
Alpine
Amador
Butte
Calaveras
Colusa
Contra Costa
Del Norte
El Dorado
Fresno
Glenn
Humboldt
Imperial
Inyo
Kern
Kings
Lake
Lassen
Los Angeles
Madera
Marin
Mariposa
Mendocino
Merced
Modoc
Mono
Monterey
Napa
Nevada
Orange
Placer
Plumas
Riverside
12,667
44*
1,152
4,539
1,470
265
13,836
513
3,657
8,143
491
2,261
884
475
7,342
1,011
1,736
513
78,318
1,973
5,225
519
1,781
2,208
263
217
4,457
2,507
2,523
35,278
7,268
637
25,357
3,126
1*
71*
220
102
112
2,028
43*
177
3,767
108
109
2,307
54*
2,519
537
125
53*
47,796
750
498
39*
136
1,079
20*
23*
1,875
415
116
7,517
570
32*
7,251
3,136
0*
9*
71*
22*
6*
1,196
3*
23*
490
5*
24*
78
0*
475
101
73*
20*
13,575
79*
88
4*
17*
117
2*
2*
145
49*
8*
441
57*
7*
1,627
7,178
0*
15*
120
21*
19*
2,918
15*
117
1,443
20*
55*
85
5*
654
119
33*
5*
33,360
77*
292
8*
46*
232
5*
5*
892
178
41*
9,866
338
9*
1,939
138
7*
23*
87
25*
12*
110
52*
38*
133
14*
126
61*
71*
140
32*
41*
31*
610
65*
16*
24*
112
40*
19*
15*
68*
25*
27*
216
58*
20*
216
603
1*
23*
134
31*
8*
347
23*
82
240
17*
86
30*
14*
288
38*
48*
22*
3,341
59*
75
21*
58*
88
10*
5*
155
63*
55*
792
110
17*
635
CaucasianNative
American Multirace
Asian/Pacific
IslanderAfrican-
AmericanLatino/
Hispanic
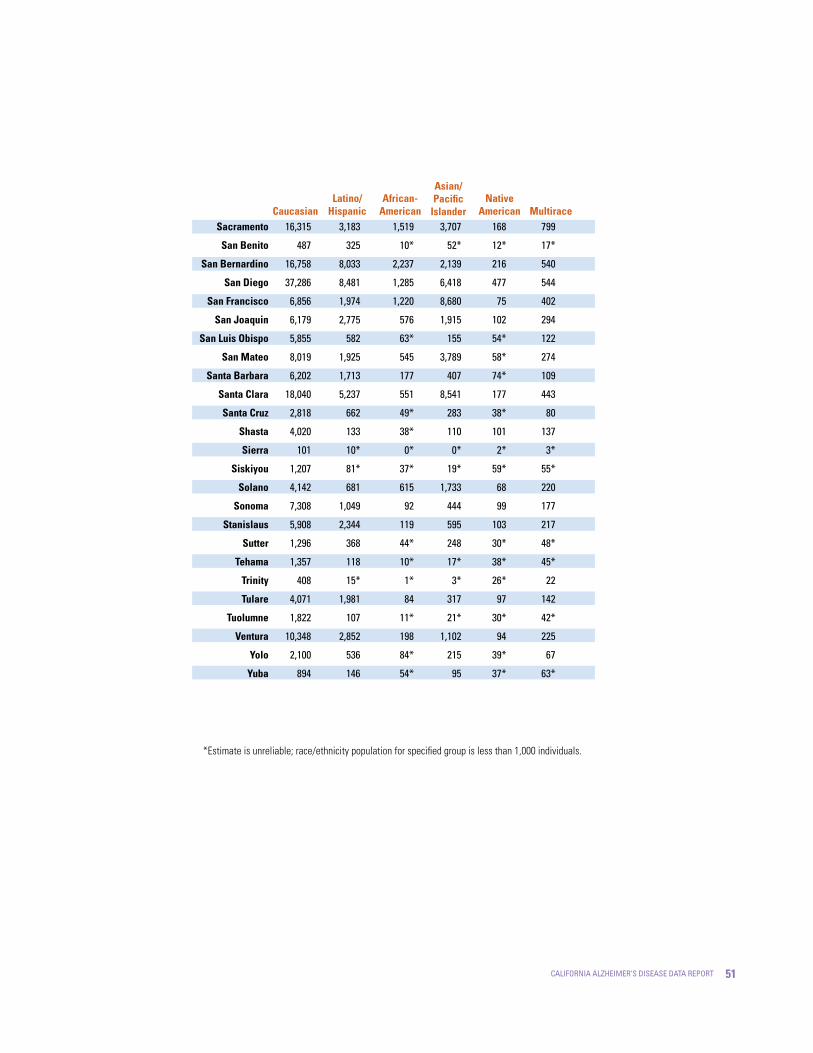
5�california alzheimer’s disease data report
CaucasianNative
American Multirace
Asian/Pacific
IslanderAfrican-
AmericanLatino/
HispanicSacramento
San Benito
San Bernardino
San Diego
San Francisco
San Joaquin
San Luis Obispo
San Mateo
Santa Barbara
Santa Clara
Santa Cruz
Shasta
Sierra
Siskiyou
Solano
Sonoma
Stanislaus
Sutter
Tehama
Trinity
Tulare
Tuolumne
Ventura
Yolo
Yuba
16,315
487
16,758
37,286
6,856
6,179
5,855
8,019
6,202
18,040
2,818
4,020
101
1,207
4,142
7,308
5,908
1,296
1,357
408
4,071
1,822
10,348
2,100
894
3,183
325
8,033
8,481
1,974
2,775
582
1,925
1,713
5,237
662
133
10*
81*
681
1,049
2,344
368
118
15*
1,981
107
2,852
536
146
1,519
10*
2,237
1,285
1,220
576
63*
545
177
551
49*
38*
0*
37*
615
92
119
44*
10*
1*
84
11*
198
84*
54*
3,707
52*
2,139
6,418
8,680
1,915
155
3,789
407
8,541
283
110
0*
19*
1,733
444
595
248
17*
3*
317
21*
1,102
215
95
168
12*
216
477
75
102
54*
58*
74*
177
38*
101
2*
59*
68
99
103
30*
38*
26*
97
30*
94
39*
37*
799
17*
540
544
402
294
122
274
109
443
80
137
3*
55*
220
177
217
48*
45*
22
142
42*
225
67
63*
*Estimate is unreliable; race/ethnicity population for specified group is less than 1,000 individuals.

52 california alzheimer’s disease data report
Table B5: Estimated Number of People 55+ with Alzheimer’s Disease by Race and County, 2030
Alameda
Alpine
Amador
Butte
Calaveras
Colusa
Contra Costa
Del Norte
El Dorado
Fresno
Glenn
Humboldt
Imperial
Inyo
Kern
Kings
Lake
Lassen
Los Angeles
Madera
Marin
Mariposa
Mendocino
Merced
Modoc
Mono
Monterey
Napa
Nevada
Orange
Placer
Plumas
Riverside
20,151
81*
1912
6,950
2,429
406
22,550
788
6,972
11,570
724
3,691
958
625
11,278
1,592
2,848
914
102,136
3,542
8,461
907
2,801
3,026
429
400
6,335
3,492
4,454
49,398
11,911
876
32,426
7,032
4*
122
536
162
210
4,783
109
428
8,705
191
190
4,511
107*
6,197
1,186
182
108
97,704
2,215
1,126
88*
298
2,540
49*
81
4,186
944
174
18,578
1,008
68*
17,845
4,681
0*
18*
98
35*
5*
2,205
13*
59*
937
9*
57*
114
1*
1,036
239
84*
29*
19,420
96*
132
7*
36*
143
6*
6*
120
85*
19*
1,033
99*
8*
3,196
9,784
1*
32*
239
45
54
4,867
34
210
3,478
55
105
978
26
2,057
343
62
30
55,539
499
556
19
114
762
10
19
1,605
421
71
15,816
671
18
6,236
322
16*
52
168
56
26
205
98
105
265
31
222
118
110
268
77
99
75
1,303
136
57
46
234
93
31
27
129
61
65
485
122
41
476
1,339
2*
50
223
90
22
664
59
179
400
32
165
60
32
437
79
107
49
6,550
158
190
37
119
189
21
11
332
128
119
1,596
243
36
1,512
CaucasianNative
American Multirace
Asian/Pacific
IslanderAfrican-
AmericanLatino/
Hispanic

53california alzheimer’s disease data report
CaucasianNative
American Multirace
Asian/Pacific
IslanderAfrican-
AmericanLatino/
HispanicSacramento
San Benito
San Bernardino
San Diego
San Francisco
San Joaquin
San Luis Obispo
San Mateo
Santa Barbara
Santa Clara
Santa Cruz
Shasta
Sierra
Siskiyou
Solano
Sonoma
Stanislaus
Sutter
Tehama
Trinity
Tulare
Tuolumne
Ventura
Yolo
Yuba
25,417
819
25,600
58,291
9,568
9,734
8,862
10,478
8,410
29,539
5,029
6,513
140
1,680
7,070
11,695
8,869
2,021
1,892
669
5,836
2,834
17,114
3,652
1,394
7,222
734
19,224
17,511
3,171
5,522
1,238
3,871
3,464
8,953
1,669
235
18*
136
1,475
2,392
4,935
812
186
36*
4,720
145
6,003
1,148
332
2,848
38*
4,976
2,390
1,634
1,220
99*
909
326
1,213
103
69*
1*
49*
1,180
169
292
87*
20*
5*
115
34*
369
116
82*
5451
186
6,916
10,906
6,862
2,823
405
5,198
1,057
12,529
707
203
2
43
2,560
1,065
1,739
452
56
10
1,320
48
2,491
543
156
374
29
494
1,180
155
193
114
128
137
415
100
171
6
114
149
191
193
73
85
53
175
75
172
94
102
1,646
40
1,135
956
701
447
240
459
192
1,130
221
257
6
103
465
344
418
106
93
45
257
89
438
203
133
*Estimate is unreliable; race/ethnicity population for specified group is less than 1,000 individuals.

5� california alzheimer’s disease data report
Table B�: Estimated Number and Percent Change in People �5+ with Alzheimer’s Disease: 2008, 20�5 and 2030, California and Counties
Alameda
Alpine
Amador
Butte
Calaveras
Colusa
Contra Costa
Del Norte
El Dorado
Fresno
Glenn
Humboldt
Imperial
Inyo
Kern
Kings
Lake
Lassen
Los Angeles
Madera
Marin
Mariposa
Mendocino
Merced
Modoc
Mono
Monterey
Napa
Nevada
Orange
Placer
Plumas
Riverside
22,347
32
989
4,688
1,211
346
16,446
508
3,072
11,570
533
2,200
2,440
531
8,634
1,369
1,616
470
147,140
2,181
5,298
453
1,756
2,937
259
164
6,325
2,951
2,304
43,644
6,516
574
30,545
25,192
51
1,236
4,909
1,599
397
19,190
615
3,818
13,353
624
2,506
3,263
592
10,645
1,715
1,961
607
166,540
2,821
5,861
584
2,039
3,542
305
247
7,186
3,080
2,609
50,896
7,985
692
34,949
45,590
102
2,127
7,862
2,753
677
35,735
1,081
7,688
23,771
1,000
4,320
5,682
876
19,726
3,200
3,294
1,164
278,806
5,954
10,361
1,076
3,508
6,168
529
521
12,101
4,984
4,768
88,639
13,721
1,029
57,460
13
59
25
5
32
15
17
21
24
15
17
14
34
11
23
25
21
29
13
29
11
29
16
21
18
51
14
4
13
17
23
21
14
81
100
72
60
72
71
86
76
101
78
60
72
74
48
85
87
68
92
67
111
77
84
72
74
73
111
68
62
83
74
72
49
64
104
219
115
68
127
96
117
113
150
105
88
96
133
65
128
134
104
148
89
173
96
138
100
110
104
218
91
69
107
103
111
79
88
2008% change 20�5-2030
% change 2008-2030
% change 2008-20�5203020�5

55california alzheimer’s disease data report
Sacramento
San Benito
San Bernardino
San Diego
San Francisco
San Joaquin
San Luis Obispo
San Mateo
Santa Barbara
Santa Clara
Santa Cruz
Shasta
Sierra
Siskiyou
Solano
Sonoma
Stanislaus
Sutter
Tehama
Trinity
Tulare
Tuolumne
Ventura
Yolo
Yuba
CALIFORNIA
20,774
673
22,166
46,889
16,711
9,277
5,806
12,976
7,785
26,053
3,503
3,671
98
1,226
5,716
8,368
7,175
1,513
1,307
347
5,277
1,609
11,771
2,417
963
556,121
24,138
844
27,883
51,004
18,440
11,174
6,503
13,792
8,228
30,956
3,634
4,301
112
1,396
6,964
8,586
8,775
1,933
1,514
453
6,301
1,949
13,884
2,845
1,220
638,435
42,587
1,692
54,245
88,834
25,546
19,811
10,601
22,413
12,720
56,270
7,416
7,258
168
2,087
13,664
15,396
15,601
3,520
2,250
797
11,253
3,165
25,481
5,478
2,112
1,106,640
16
25
26
9
10
20
12
6
6
19
4
17
14
14
22
3
22
28
16
31
19
21
18
18
27
15
76
100
95
74
39
77
63
63
55
82
104
69
50
49
96
79
78
82
49
76
79
62
84
93
73
73
105
151
145
89
53
114
83
73
63
116
112
98
71
70
139
84
117
133
72
130
113
97
116
127
119
99
2008% change 20�5-2030
% change 2008-2030
% change 2008-20�5203020�5
Table B7: Estimated Number and Percent Change in People �5+ with Alzheimer’s Disease by Race: 2008, 20�5 and 2030, California
Caucasian/non-Latino
Latino/Hispanic
African-American
Asian/Pacific Islander
American Indian
Multirace
367,445
85,497
24,749
67,931
2,992
7,507
378,104
118,626
29,334
95,663
4,638
12,070
573,571
260,417
50,365
187,322
10,229
24,736
3
39
19
41
55
61
52
120
72
96
121
105
56
205
103
176
242
230
2008% change 20�5-2030
% change 2008-2030
% change 2008-20�5203020�5

5� california alzheimer’s disease data report
Table B8: Estimated Number of People �5+ with Alzheimer’s Disease by Race and County, 2008
Alameda
Alpine
Amador
Butte
Calaveras
Colusa
Contra Costa
Del Norte
El Dorado
Fresno
Glenn
Humboldt
Imperial
Inyo
Kern
Kings
Lake
Lassen
Los Angeles
Madera
Marin
Mariposa
Mendocino
Merced
Modoc
Mono
Monterey
Napa
Nevada
Orange
Placer
Plumas
Riverside
12,147
27*
916
4,263
1,108
254
12,166
440
2,807
7,594
438
1,956
818
447
6,092
845
1,392
400
75,977
1,574
4,693
405
1,546
1,960
227
142
4,263
2,509
2,168
32,184
5,793
527
23,753
2,087
0*
39*
157
59*
67*
1299
18*
116
2,347
61*
70*
1,446
32*
1,515
327
87*
28*
34,218
413
290
21*
81*
647
10*
10*
1,161
242
67*
4,629
378
16*
4,175
2,815
0*
4*
51*
11*
5*
908
1*
14*
394
3*
12*
65*
0*
321
70*
65*
12*
11,325
69*
70*
2*
11*
98*
1*
1*
150*
32*
5*
265
34*
5*
1,110
4,845
0*
7*
86*
9*
11*
1,805
7*
69*
991
12*
30*
56*
2*
427
89*
19*
2*
23,206
53*
192
4*
24*
162
3*
2*
627
117*
22*
5,943
214
4*
1,046
84
4*
12*
51*
12*
6*
64*
30*
20*
90*
9*
84*
39*
41*
98*
16*
24*
16*
410
39*
6*
11*
63*
21
12*
7*
41*
13*
12*
146
33*
12*
127
368
0*
11*
79*
13*
4*
205
12*
46*
152*
9*
48*
16*
9*
181
22*
29*
12*
2,005
32*
47*
11*
32*
48*
4*
2*
85*
38*
30*
476
63*
9*
335
CaucasianNative
American Multirace
Asian/Pacific
IslanderAfrican-
AmericanLatino/
Hispanic
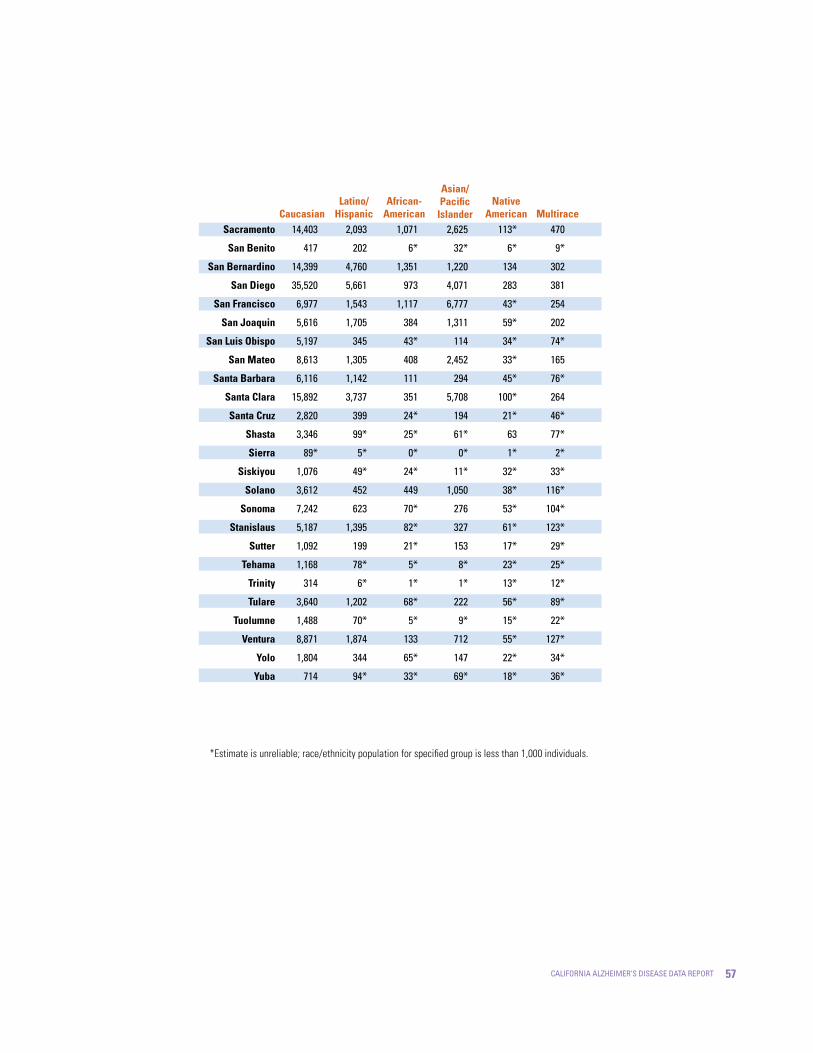
57california alzheimer’s disease data report
CaucasianNative
American Multirace
Asian/Pacific
IslanderAfrican-
AmericanLatino/
HispanicSacramento
San Benito
San Bernardino
San Diego
San Francisco
San Joaquin
San Luis Obispo
San Mateo
Santa Barbara
Santa Clara
Santa Cruz
Shasta
Sierra
Siskiyou
Solano
Sonoma
Stanislaus
Sutter
Tehama
Trinity
Tulare
Tuolumne
Ventura
Yolo
Yuba
14,403
417
14,399
35,520
6,977
5,616
5,197
8,613
6,116
15,892
2,820
3,346
89*
1,076
3,612
7,242
5,187
1,092
1,168
314
3,640
1,488
8,871
1,804
714
2,093
202
4,760
5,661
1,543
1,705
345
1,305
1,142
3,737
399
99*
5*
49*
452
623
1,395
199
78*
6*
1,202
70*
1,874
344
94*
1,071
6*
1,351
973
1,117
384
43*
408
111
351
24*
25*
0*
24*
449
70*
82*
21*
5*
1*
68*
5*
133
65*
33*
2,625
32*
1,220
4,071
6,777
1,311
114
2,452
294
5,708
194
61*
0*
11*
1,050
276
327
153
8*
1*
222
9*
712
147
69*
113*
6*
134
283
43*
59*
34*
33*
45*
100*
21*
63
1*
32*
38*
53*
61*
17*
23*
13*
56*
15*
55*
22*
18*
470
9*
302
381
254
202
74*
165
76*
264
46*
77*
2*
33*
116*
104*
123*
29*
25*
12*
89*
22*
127*
34*
36*
*Estimate is unreliable; race/ethnicity population for specified group is less than 1,000 individuals.

58 california alzheimer’s disease data report
Table B9: Estimated Number of People �5+ with Alzheimer’s Disease by Race and County, 20�5
Alameda
Alpine
Amador
Butte
Calaveras
Colusa
Contra Costa
Del Norte
El Dorado
Fresno
Glenn
Humboldt
Imperial
Inyo
Kern
Kings
Lake
Lassen
Los Angeles
Madera
Marin
Mariposa
Mendocino
Merced
Modoc
Mono
Monterey
Napa
Nevada
Orange
Placer
Plumas
Riverside
11,913
43*
1,100
4,313
1,405
251
13,063
484
3,410
7,738
468
2,127
852
453
6,900
949
1,652
480
74,517
1,872
4,949
491
1,692
2,104
250
202
4,250
2,393
2,373
33,491
6,913
609
24,184
2,870
1*
68*
200
98*
103*
1,855
40*
160
3,446
101*
103*
2,172
51*
2,281
493
119*
51*
43,870
681
471
38*
124
987
19*
20*
1,727
387
110*
6,801
544
31*
6,637
2,953
0*
9*
69*
22*
5*
1,103
3*
22*
450
4*
23*
73*
0*
436
91*
72*
19*
12,727
77*
82*
4*
16*
110*
2*
2*
139*
47*
8*
387
54*
7*
1,494
6,762
0*
14*
114*
20*
18*
2,735
14*
111*
1,364
20*
53*
79*
5*
616
113*
32*
4*
31,648
74*
274
8*
44*
218
5*
5*
857
169
39*
9,262
314
9*
1,821
127
7*
22*
82*
24*
12*
103*
51*
36*
123
14*
118*
58*
69*
131
31*
39*
30*
570
61*
14*
23*
105*
38*
19*
14*
65*
24*
26*
201
55*
19*
202
568
0*
23*
131*
30*
8*
330
23*
79*
232
17*
83*
29*
14*
281
37*
47*
22*
3,207
56*
72*
20*
57*
85*
9*
4*
146
61*
53*
754
105*
17*
611
CaucasianNative
American Multirace
Asian/Pacific
IslanderAfrican-
AmericanLatino/
Hispanic

59california alzheimer’s disease data report
CaucasianNative
American Multirace
Asian/Pacific
IslanderAfrican-
AmericanLatino/
HispanicSacramento
San Benito
San Bernardino
San Diego
San Francisco
San Joaquin
San Luis Obispo
San Mateo
Santa Barbara
Santa Clara
Santa Cruz
Shasta
Sierra
Siskiyou
Solano
Sonoma
Stanislaus
Sutter
Tehama
Trinity
Tulare
Tuolumne
Ventura
Yolo
Yuba
15,373
458
15,798
35,000
6,577
5,811
5,578
7,604
5,905
17,029
2,612
3,807
96*
1,154
3,877
6,845
5,591
1,230
1,296
388
3,879
1,745
9,738
1,969
847
2,939
299
7,343
7,839
1,869
2,620
548
1,784
1,594
4,861
598
124
10*
78*
620
979
2,213
351
112*
14*
1,813
104*
2,625
495
133
1,390
10*
2,040
1,151
1,154
527
61*
512
167
494
46*
37*
0*
36*
554
84*
106
43*
9*
1*
80*
11*
181
81*
52*
3,516
50*
1,991
6,061
8,384
1,836
147
3,573
387
7,988
266
104*
0*
18*
1,641
416
561
234
16*
2*
300
20*
1,037
199
91*
155
11*
198
441
71*
95*
51*
56*
71*
166
36*
96*
2*
57*
63*
92*
96*
29*
37*
26*
91*
28*
89*
37*
35*
765
16*
512
512
385
285
118*
264
105*
418
76*
133
3*
54*
208
170
209
46*
44*
22*
138
41*
214
62*
61*
*Estimate is unreliable; race/ethnicity population for specified group is less than 1,000 individuals.

�0 california alzheimer’s disease data report
Table B�0: Estimated Number of People �5+ with Alzheimer’s Disease by Race and County, 2030
Alameda
Alpine
Amador
Butte
Calaveras
Colusa
Contra Costa
Del Norte
El Dorado
Fresno
Glenn
Humboldt
Imperial
Inyo
Kern
Kings
Lake
Lassen
Los Angeles
Madera
Marin
Mariposa
Mendocino
Merced
Modoc
Mono
Monterey
Napa
Nevada
Orange
Placer
Plumas
Riverside
19,631
80*
1,862
6,703
2,373
393
22,076
768
6,749
11,256
702
3,586
937
614
10,930
1,523
2,769
886
99,541
3,385
8,338
880
2,752
2,946
415
390
6,247
3,423
4,318
48,287
11,535
860
31,365
6,511
4*
119*
490
154
196
4,416
105*
402
8,155
180
179
4,286
104*
5,770
1,110
172
105*
92,640
2,066
1,077
87*
276
2,348
48*
75*
3,959
895
168
17,081
970
67*
16,630
4,527
0*
18*
95*
35*
5*
2,132
13*
58*
889
9*
55*
107*
1*
987
222
83*
29*
18,829
94*
126
7*
35*
138
6*
6*
116*
84*
19*
987
97*
8*
3,032
13,322
0*
28*
193
48*
34*
6,258
40*
198
2,820
47*
124*
177
17*
1,349
193
66*
23*
60,163
124*
579
21*
105*
456
8*
14*
1,328
397
81*
20,271
759
18*
4,487
306
15*
51*
161
55*
26*
196
96*
104*
253
30*
213
116*
108*
258
75*
98*
73*
1,260
131*
56*
45*
223
92*
31*
26*
126*
60*
64*
466
120*
41*
458
1,293
2*
49*
221
88*
22*
658
58*
178*
397
32*
162
59*
32*
431
77*
106*
49*
6,374
154*
186
37*
118*
188*
20*
10*
326
125*
118*
1,547
239
36*
1,488
CaucasianNative
American Multirace
Asian/Pacific
IslanderAfrican-
AmericanLatino/
Hispanic

��california alzheimer’s disease data report
CaucasianNative
American Multirace
Asian/Pacific
IslanderAfrican-
AmericanLatino/
HispanicSacramento
San Benito
San Bernardino
San Diego
San Francisco
San Joaquin
San Luis Obispo
San Mateo
Santa Barbara
Santa Clara
Santa Cruz
Shasta
Sierra
Siskiyou
Solano
Sonoma
Stanislaus
Sutter
Tehama
Trinity
Tulare
Tuolumne
Ventura
Yolo
Yuba
24,648
807
24,979
56,091
8,859
9,443
8,695
10,158
8,158
28,660
4,896
6,318
138*
1,648
6,883
11,493
8,628
1,955
1,838
651
5,689
2,777
16,757
3,539
1,343
6,836
683
17,980
16,413
3,000
5,275
1,188
3,632
3,273
8,474
1,551
225
18*
132*
1,358
2,258
4,723
781
173
35*
4,420
141*
5,632
1,068
303
2,708
37*
4,731
2,271
1,583
1,153
97*
872
308
1,160
100*
68*
1*
49
1,146
160
274
85*
20*
4*
111*
34*
356
110*
79*
6,430
98*
4,975
12,011
11,282
3,315
272
7,172
656
16,499
555
226
1*
44*
3,683
965
1,381
522
44*
9*
612
52*
2,141
473
156
362
28*
477
1,127
148
185
113*
125*
134*
397
96*
166
6*
113*
143
183
185
72*
84*
52*
168
74*
167
92*
99*
1,603
40*
1,103
921
675
439
237
454
190
1,081
218
254
6*
102*
451
338
410
104*
92*
45*
253
88*
427
196
131*
*Estimate is unreliable; race/ethnicity population for specified group is less than 1,000 individuals.

�2 california alzheimer’s disease data report

�3california alzheimer’s disease data report
Appendix CState and CountyAlzheimer’s Disease and Dementia Lifetime Risk Estimates
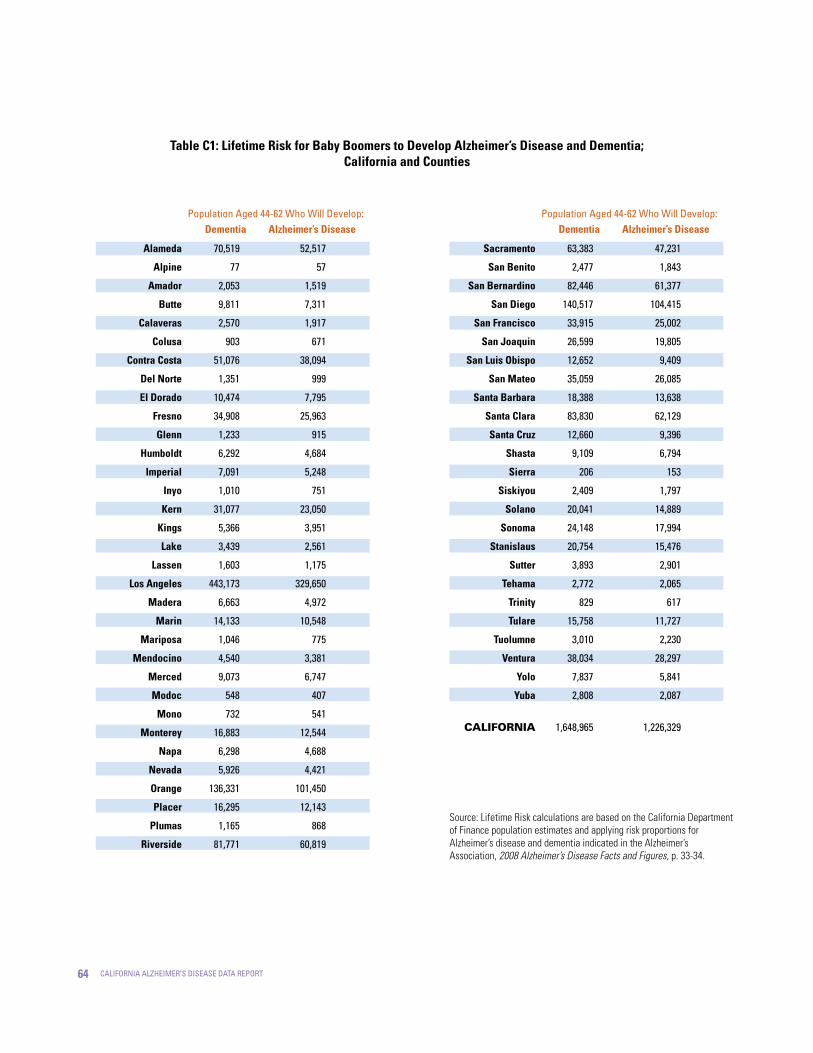
�� california alzheimer’s disease data report
Table C�: Lifetime Risk for Baby Boomers to Develop Alzheimer’s Disease and Dementia; California and Counties
Alameda
Alpine
Amador
Butte
Calaveras
Colusa
Contra Costa
Del Norte
El Dorado
Fresno
Glenn
Humboldt
Imperial
Inyo
Kern
Kings
Lake
Lassen
Los Angeles
Madera
Marin
Mariposa
Mendocino
Merced
Modoc
Mono
Monterey
Napa
Nevada
Orange
Placer
Plumas
Riverside
70,519
77
2,053
9,811
2,570
903
51,076
1,351
10,474
34,908
1,233
6,292
7,091
1,010
31,077
5,366
3,439
1,603
443,173
6,663
14,133
1,046
4,540
9,073
548
732
16,883
6,298
5,926
136,331
16,295
1,165
81,771
52,517
57
1,519
7,311
1,917
671
38,094
999
7,795
25,963
915
4,684
5,248
751
23,050
3,951
2,561
1,175
329,650
4,972
10,548
775
3,381
6,747
407
541
12,544
4,688
4,421
101,450
12,143
868
60,819
Dementia Alzheimer’s Diseasepopulation aged 44-62 Who Will develop:
Source: Lifetime Risk calculations are based on the California Department of Finance population estimates and applying risk proportions for Alzheimer’s disease and dementia indicated in the Alzheimer’s Association, 2008 Alzheimer’s Disease Facts and Figures, p. 33-34.
Sacramento
San Benito
San Bernardino
San Diego
San Francisco
San Joaquin
San Luis Obispo
San Mateo
Santa Barbara
Santa Clara
Santa Cruz
Shasta
Sierra
Siskiyou
Solano
Sonoma
Stanislaus
Sutter
Tehama
Trinity
Tulare
Tuolumne
Ventura
Yolo
Yuba
CALIFORNIA
63,383
2,477
82,446
140,517
33,915
26,599
12,652
35,059
18,388
83,830
12,660
9,109
206
2,409
20,041
24,148
20,754
3,893
2,772
829
15,758
3,010
38,034
7,837
2,808
1,648,965
47,231
1,843
61,377
104,415
25,002
19,805
9,409
26,085
13,638
62,129
9,396
6,794
153
1,797
14,889
17,994
15,476
2,901
2,065
617
11,727
2,230
28,297
5,841
2,087
1,226,329
Dementia Alzheimer’s Diseasepopulation aged 44-62 Who Will develop:
�5california alzheimer’s disease data report
Appendix DState and CountyAlzheimer’s Disease Mortality Estimates

�� california alzheimer’s disease data report
Table D�: Alzheimer’s Disease Deaths in California: 2003-2005, By County
Los Angelesº
San Diegoº
Orange
Riversideº
Santa Clara
San Bernardinoº
Sacramento
Contra Costa
Alamedaº
San Mateo
Fresno
Sonomaº
Kernº
Ventura
San Franciscoº
San Joaquin
Solanoº
Santa Barbara
Stanislaus
Butteº
Placer
San Luis Obispo
Napaº
Marinº
Humboldtº
Montereyº
Shasta
Santa Cruz
Maderaº
El Dorado
Yolo
Tulareº
Merced
1,391.70
1,068.00
564.7
474.3
311
299.3
283
229.7
212.3
156
153
150
140.3
136
134.3
126.3
119
107.3
94
85.3
85
79.7
73
57.7
52.3
50
46.3
42.3
41
36.7
33
29
27.3
19.7
15.1
8
6.7
4.4
4.2
4
3.2
3
2.2
2.2
2.1
2
1.9
1.9
1.8
1.7
1.5
1.3
1.2
1.2
1.1
1
0.8
0.7
0.7
0.7
0.6
0.6
0.5
0.5
0.4
0.4
10,152,410
3,031,055
3,038,670
1,845,185
1,747,295
1,922,467
1,357,367
1,014,992
1,497,316
720,229
874,745
477,419
744,489
808,735
793,564
645,560
418,097
416,662
499,864
213,143
302,199
259,709
132,753
251,812
130,859
423,137
177,465
259,942
139,398
172,320
186,751
406,003
237,550
13.7
35.2
18.6
25.7
17.8
15.6
20.8
22.6
14.2
21.7
17.5
31.4
18.8
16.8
16.9
19.6
28.5
25.8
18.8
40
28.1
30.7
55
22.9
40
11.8
26.1
16.3
29.4
21.3
17.7
7.1
11.5
16.3
38.6
22.2
28.6
20.8
26.1
24.5
23.9
15.8
18.9
23.4
27.5
31.4
20
13.3
25
38.3
22.2
24
29.6
24.1
23.4
39.1
16.8
42
13.6
23.2
17.4
35.5
22
24.1
10
17.6
15.4
36.3
20.4
26.1
18.5
23.2
21.7
20.8
13.6
15.9
19.7
23
26.2
16.6
11.1
20.6
31.4
18
19.2
23.3
19
18.3
30
12.4
30.6
9.8
16.5
12.1
24.6
14.8
15.9
6.3
11
2003-2005 Deaths
(Average)
Age-Adjusted
Rate‡
95% Confidence LimitsCrude
Rate†200�
Population%17.1
41
24
31.2
23.2
29.1
27.4
26.9
17.9
21.9
27.1
31.9
36.6
23.4
15.6
29.3
45.2
26.4
28.9
35.9
29.3
28.6
48.2
21.2
53.4
17.3
29.9
22.7
46.3
29.1
32.3
13.6
24.1
Lower Upper
Source: Jew-Lochman, S. (2008). Alzheimer’s Disease Deaths California, 2005. California Department of Public Health, Office of Health Information and Research.
State of California, Department of Finance. Race/Ethnic Population with Age and Sex Detail, 2000-2005, July 2007. State of California, Department of Public Health, Death Records.

�7california alzheimer’s disease data report
21.3
19.7
13.3
13
12.7
12.7
11.7
10.7
10.3
10
9
8.7
7
5.3
5
4.3
3.3
3
3
2.7
2
1.3
1
0.3
0
7,080.3
0.3
0.3
0.2
0.2
0.2
0.2
0.2
0.2
0.1
0.1
0.1
0.1
0.1
0.1
0.1
0.1
a
a
a
a
a
a
a
a
-
100.0
98,436
59,942
57,186
143,970
62,994
89,966
87,881
159,844
45,644
37,507
44,243
20,927
28,115
66,682
29,162
21,478
57,307
18,066
10,178
35,626
13,961
18,923
13,727
3,716
1,304
36,525,947
21.7
32.8
23.3*
9.0*
20.1*
14.1*
13.3*
6.7*
22.6*
26.7*
20.3*
41.4*
24.9*
8.0*
17.1*
20.2*
5.8*
16.6*
29.5*
7.5*
14.3*
7.0*
7.3*
9.0*
-
19.4
16.2
27.8
15.4*
17.6*
14.8*
12.3*
14.3*
9.5*
15.1*
19.3*
14.0*
45.2*
23.4*
11.7*
18.2*
14.9*
8.9*
12.2*
21.9*
11.3*
10.6*
4.3*
12.9*
4.4*
-
22.1
9.3
15.5
7.1
8
6.6
5.5
6.1
3.7
5.9
7.3
4.8
15.1
6
1.7
2.2
0.8
0
0
0
0
0
0
0
0
-
21.6
2003-2005 Deaths
(Average)
Age-Adjusted
Rate‡
95% Confidence LimitsCrude
Rate†200�
Population%23.1
40.1
23.6
27.2
22.9
19.1
22.6
15.2
24.2
31.2
23.2
75.4
40.7
21.6
34.2
29
18.4
26
46.7
25
25.2
11.5
38.3
19.4
-
22.6
Lower Upper
Nevada
Tehama
Tuolumne
Kings
Lake
Mendocino
Sutter
Imperial
Siskiyou
Amador
Calaveras
Colusa
Glenn
Yuba
Del Norte
Plumas
San Benito
Mariposa
Modoc
Lassen
Trinity
Inyo
Mono
Sierra
Alpine
CALIFORNIA
Note: Rates are per 100,000 population. ICD-10 codes G30. Year 2000 U.S. Standard Population is used for age-adjusted rates.
º County age-adjusted rate is significantly different from the state age-adjusted rate.
* Death rate unreliable, relative standard error is greater than or equal to 23 percent.
a Represents a percentage of more than zero but less than 0.05.
- Percentages, rates, and confidence limits are not calculated for zero events.
A crude death rate is defined as the number of cause-specific events (e.g. deaths, disease cases, individuals at risk) over a specified period of time (e.g. a year) divided by the total population. Crude death rates are sometimes expressed as annual rates per 100,000 population and may be calculated for males, females, or some other subset of the population.
The OHIR report calculated age-specific death rates. Age-specific death rates are the number of deaths per 100,000 people in a specific age group, and are used along with standard population proportions to develop a weighted average rate. The weighted average rate is referred to as an age-adjusted death rate and removes the effect of different age structures of the populations whose rates are being compared. Age-adjusted death rates therefore provide the preferred method for comparing different race/ethnic groups, sexes, and geographic areas, and for measuring death rates over time.
‡†

�8 california alzheimer’s disease data report
Table D2: Alzheimer’s Disease Deaths in California: 2005, By Race/Ethnicity
Caucasian
Latino/Hispanic
African-American
Asian/Pacific Islander
CALIFORNIA*
6,429
577
394
267
7,694
83.6
7.5
5.1
3.6
100.0
16,408,477
12,905,840
2,255,281
4,263,720
36,957,436
39.2
4.5
17.5
6.3
20.8
27.8
13.0
27.3
8.0
23.4
27.1
11.9
24.6
7.1
22.9
2003-2005 Deaths
(Average)
Age-Adjusted
Rate
95% Confidence LimitsCrude
Rate2005
Population%28.5
14.0
30.1
9.0
23.9
Lower Upper
Note: Rates are per 100,000 population. ICD-10 codes G30. Year 2000 U.S. Standard Population is used for age-adjusted rates. Caucasian/non-Latino, African-American and Asian/Pacific Islander exclude Hispanic ethnicity. Hispanic includes any race category.
Source: Jew-Lochman, S. (2008). Alzheimer’s Disease Deaths California, 2005. California Department of Public Health, Office of Health Information and Research.
State of California, Department of Finance. Race/Ethnic Population with Age and Sex Detail, 2000-2005, July 2007. State of California, Department of Public Health, Death Records.

�9california alzheimer’s disease data report
Appendix EState Formal and Informal Alzheimer’s Disease Cost of Care Projections

70 california alzheimer’s disease data report
Note: An assumption of these calculations is that the distributions will remain constant into the future. We applied the 2007 per capita AD formal and informal cost estimates to AD prevalence estimates by residence. We made all cost projections in 2007 dollars which assumes no inflation from 2008-2030. The value of informal care is based on the replacement cost approach and therefore does not represent an actual expenditure, but rather the cost to replace informal caregivers’ labor.
references:
Rice, DR, Fox, P J, Max, W, Webber, P, Lindeman, D, Hauck, W, & Segura, E (1993). The Economic Burden of Alzheimer’s Disease Care. Health Aff., 12, 165-76.
Fox, PJ, Kohatsu, N, Max, W & Arnsberger, P (2001). Estimating the Costs of Caring for People with Alzheimer Disease in California: 2000-2040. J Public Health Policy, 22, 88-97.
US Department of Labor. Bureau of Labor Statistics. Hourly Compensation in the Business Sector. http://data.bls.gov/cgi-bin/regate. Accessed 3/6/08.
US Census Bureau, Statistical Abstract of the United States: 2003. Table No. 715. Consumer Price Indexes for all Urban Consumers (CPI-U) for Selected Items and Groups: 1980 - 2002 ; Bureau of Labor Statistics, News. Table 1. Consumer Price Index for All Urban Consumers (CPI-U): US City Average, by Expenditure Catetory, http://www.bls.gov/news.release/cip.t01.htm. Accessed on 3/6/08.
Table E�: Projections of the Cost of Caring for Community-Resident and Institutionalized People with Alzheimer’s Disease
in California 55+ (2007 $US): 2008, 20�5, 2030
563,143
649,507
1,100,760
25,065
28,939
48,800
588,208
678,446
1,149,560
mild-mod
severe
mild-mod
severe
mild-mod
severe
$62,916
$71,686
$62,916
$71,686
$62,916
$71,686
$10,918
$10,918
$10,918
$246.3
$123.1
$284.2
$141.8
$480.3
$241.8
$2.7
$3.2
$5.3
$372.1
$429.2
$727.4
# of Individuals
Cost ($�00,000,000
million)Cost per
Individual
2008
2015
2030
2008
2015
2030
2008
2015
2030
ImpairmentLevel
391,461
171,681
451,763
197,746
763,429
337,332
# of Individualsby Impairment
Level
$17,936
$38,309
$17,936
$38,309
$17,936
$38,309
$96,675
$96,675
$96,675
$70.2
$65.8
$81.0
$75.8
$136.9
$129.2
$24.2
$28.0
$47.2
$160.2
$184.8
$313.3
Cost ($�00,000,000
million)Cost per
Individual
Informal Care Formal Care
$505.3
$582.8
$988.3
$2.7
$3.1
$5.3
$532.3
$613.9
$1040.8
Total Cost ($�00,000,000
million)COMMUNITY
INSTITUTIONALIzED
ALL SETTINGS

7�california alzheimer’s disease data report
Note: An assumption of these calculations is that the distributions will remain constant into the future. We applied the 2007 per capita AD formal and informal cost estimates to AD prevalence estimates by residence. We made all cost projections in 2007 dollars which assumes no inflation from 2008-2030. The value of informal care is based on the replacement cost approach and therefore does not represent an actual expenditure, but rather the cost to replace informal caregivers’ labor.
references:
Rice, DR, Fox, P J, Max, W, Webber, P, Lindeman, D, Hauck, W, & Segura, E (1993). The Economic Burden of Alzheimer’s Disease Care. Health Aff., 12, 165-76.
Fox, PJ, Kohatsu, N, Max, W & Arnsberger, P (2001). Estimating the Costs of Caring for People with Alzheimer Disease in California: 2000-2040. J Public Health Policy, 22, 88-97.
US Department of Labor. Bureau of Labor Statistics. Hourly Compensation in the Business Sector. http://data.bls.gov/cgi-bin/regate. Accessed 3/6/08.
US Census Bureau, Statistical Abstract of the United States: 2003. Table No. 715. Consumer Price Indexes for all Urban Consumers (CPI-U) for Selected Items and Groups: 1980 - 2002 ; Bureau of Labor Statistics, News. Table 1. Consumer Price Index for All Urban Consumers (CPI-U): US City Average, by Expenditure Catetory, http://www.bls.gov/news.release/cip.t01.htm. Accessed on 3/6/08.
Table E2: Projections of the Cost of Caring for Community-Resident and Institutionalized People with Alzheimer’s Disease
in California �5+ (2007 $US): 2008, 20�5, 2030
532,708
611,557
1,060,050
23,413
26,878
46,590
556,121
638,435
1,106,640
mild-mod
severe
mild-mod
severe
mild-mod
severe
$62,916
$71,686
$62,916
$71,686
$62,916
$71,686
$10,918
$10,918
$10,918
$231.3
$118.3
$265.5
$135.9
$460.5
$235.5
$2.6
$2.9
$5.1
$352.2
$404.3
$701.1
# of Individuals
Cost ($�00,000,000
million)Cost per
Individual
2008
2015
2030
2008
2015
2030
2008
2015
2030
ImpairmentLevel
367,622
165,086
422,036
189,522
731,541
328,510
# of Individualsby Impairment
Level
$17,936
$38,309
$17,936
$38,309
$17,936
$38,309
$96,675
$96,675
$96,675
$66.9
$63.2
$75.7
$72.6
$131.2
$125.8
$22.6
$26.0
$45.0
$152.7
$174.3
$302.0
Cost ($�00,000,000
million)Cost per
Individual
Informal Care Formal CareTotal Cost
($�00,000,000 million)COMMUNITY
INSTITUTIONALIzED
ALL SETTINGS
$479.7
$549.7
$953.0
$25.2
$28.9
$50.1
$504.9
$578.6
$1003.1

72 california alzheimer’s disease data report

73california alzheimer’s disease data report
Appendix FMethodological Notesand Data Sources

7� california alzheimer’s disease data report
Methodological Notes and Data Sources
F�. Alzheimer’s Disease Prevalence Projection Methods
The prevalence of Alzheimer’s disease in residents aged 65 and older in California and its counties was calcu-lated using prevalence rates published by the Alzheimer’s Association19 that were based upon published studies con-ducted in Chicago by Hebert and colleagues (2003)33—refer to p. 5 of the Alzheimer’s Disease Facts and Figures, 2007 report. The age breakdown of the prevalence rates are: (a) 2 percent for age 65-74, (b) 19 percent for age 75-84 and (c) 42 percent for age 85 and older. These prevalence rates were applied to California Department of Finance popu-lation projections for the years 2008, 2015, and 2030.34
For California residents under the age of 65, es-timates of Alzheimer’s disease were calculated using prevalence rates published in the Alzheimer’s Association 2006 report Early Onset Dementia: A National Challenge, A Future Crisis32 and the Alzheimer’s Disease Facts and Figures, 2007 report.19 An estimate of the number of in-dividuals with dementia was first calculated and then the number of individuals with Alzheimer’s disease was com-puted. The Early Onset Dementia: A National Challenge, A Future Crisis report indicates the proportion of people be-tween the age of 55-59 with disabling cognitive impairment was 1.9 percent and the prevalence increased slightly to 2.2 percent for people age 60-64. The California prevalences for dementia for individuals age 55-59 and 60-64 were de-termined using these figures on the California Department of Finance population projections for the years 2008, 2015, and 2030.34 The Alzheimer’s Disease Facts and Figures, 2007 report indicated that a conservative estimate of the number of individuals younger than 65 with dementia who
are likely to have Alzheimer’s disease ranges between 40 to 50 percent. To arrive at an approximation of the number of Californians with Alzheimer’s disease between 55-64 of age, we applied the lower range of this estimate, 40 per-cent, to the previously calculated dementia frequencies.
F2. Lifetime Risk of Alzheimer’s Disease and Dementia Projection Methods
The estimate of the lifetime risk of Alzheimer’s disease and dementia for California baby boomers, in-dividuals born between 1946 through 1964, was arrived at using figures published in the Alzheimer’s Disease Facts and Figures, 2008 report2—refer to p. 33-34. The Alzheimer’s Disease Facts and Figures, 2008 report indicated that 17 percent of women and 9 percent of men will develop Alzheimer’s disease in their remain-ing lifetime if they lived to be at least age 55; and that 21 percent of women and 14 percent of men will de-velop dementia in their remaining lifetime if they lived to be at least age 55. These figures were applied to the California Department of Finance population projections for baby boomers for the years 2008, 2015, and 2030.34
F3. Formal and Informal Caregiving CostsData on the formal and informal costs of car-
ing for people with AD were derived using figures from a California study by Rice and colleagues con-ducted in 1993.21 Formal and informal costs of caring were calculated separately for people with mild/moder-ate Alzheimer’s disease and severe Alzheimer’s disease (MMSE <=17 is severe; above 17 mild/moderate).

75california alzheimer’s disease data report
Annual costs for each category were converted in 2007 dollars by using economic indices reported by the United States Department of Labor and the United States Census Bureau [U.S. Department of Labor. Bureau of Labor Statistics. Hourly Compensation in the Business Sector. http://data.bls.gov/cgi-bin/regate . Accessed 3/6/08; U.S. Census Bureau, Statistical Abstract of the United States: 2003. Table No. 715. Consumer Price Indexes for all Urban Consumers (CPI-U) for Selected Items and Groups: 1980-2002 ; Bureau of Labor Statistics, News. Table 1. Consumer Price Index for All Urban Consumers (CPI-U): US City Average, by Expenditure Category, http://www.bls.gov/news.release/cip.t01.htm. Accessed on 3/6/08].
Informal costs were converted using changes in the hourly compensation in the business sector (U.S. Department of Labor). Formal costs were converted using Consumer Price Indexes for hospital and related services; medical care services; professional services (physicians); medical care commodities; and medical care services (U.S. Census Bureau). Each component of costs from the Rice et al. (1993) study was converted into 2007 dollars as follows:
Hourly compensation in the business sector – informal services (1.97)
Hospital – hospital and related services (2.90)
Nursing Home – medical care services (2.32)
Physician visits – professional services (1.95)
Medications – medical care commodities (1.80)
Medical items – medical care commodities (1.80)
Social services – medical care services (2.32)
Other – medical care services (2.32)
•
•
•
•
•
•
•
•
Determining the percentage of individuals with mild/moderate Alzheimer’s disease and severe Alzheimer’s disease was based on data from the California Department of Public Health’s Alzheimer’s disease Research Centers of California (ARCCs) Minimum Uniform Data Set for the years 1998-2008 for patients 65 years and older who were diagnosed with Alzheimer’s disease. The ARCCs are state-funded clinics located primarily at univer-sity medical centers within California. The sites include the University of Southern California (2 sites), Stanford University, and the University of California at Davis (2 sites), Irvine, Los Angeles, San Diego, and San Francisco (2 sites). The ARCC sites have been closely collaborating and using a standardized research data collection proto-col (Minimum Uniform Data Set [MUDS]) for over 10 years. Demographic, diagnostic, and medication data are collected using the MUDS. Data are processed centrally through the Institute for Health and Aging at the University of California in San Francisco. To increase inter-site reli-ability and accuracy, training and recalibration exercises are held with case reports, videos, and autopsy findings.
The various severity cost components were applied to the California prevalence rates as follows: severely im-paired patients evaluated—30.9 percent of the total; mild/moderately impaired patients—69.01 percent of the total.

7� california alzheimer’s disease data report
F�. Cost to the Medi-Cal ProgramIn 1999 Menzin and colleagues published a study
looking at California Medi-Cal administrative claims data for the purposes of evaluating the costs to the Medi-Cal program for individuals with Alzheimer’s disease and other dementias compared to individuals without dementia.22 To obtain the Medi-Cal estimates discussed in this report, we extracted the costs reported by Menzin and colleagues, that were in 1995 dollars, and updated the costs to 2007 dollars using United States Census Bureau reported price indices—see method note F3 for the listing of indices used [U.S. Census Bureau, Statistical Abstract of the United States: 2003. Table No. 715. Consumer Price Indexes for all Urban Consumers (CPI-U) for Selected Items and Groups: 1980-2002; Bureau of Labor Statistics, News. Table 1. Consumer Price Index for All Urban Consumers (CPI-U): U.S. City Average, by Expenditure Category, http://www.bls.gov/news.release/cip.t01.htm. Accessed on 3/6/08].
F5. Costs to California BusinessesTo calculate the different components effecting
businesses, we followed the model used in The MetLife Caregiving Cost Study: Productivity Losses to U.S. Business.29 To estimate the productivity losses to California businesses, several sources of data were used.29, 12, 35, 36, 37 Productivity losses are based on the 70 percent of California caregivers who work full-time which translates to 386,076 caregivers. This figure is derived from the Alzheimer’s Disease Facts and Figures, 2008 report estimating that there are approximately 1,103,073 Alzheimer and dementia caregivers in California. Scharlach and colleagues estimated that 50 percent of caregivers work outside of the home and that 70 percent of these caregivers work full-time.12
Replacement CostsTo estimate the number of caregivers who leave the
workplace on an annual basis, we used the Alzheimer’s Association Fact Sheet California Caregivers: Who Are California’s Informal Caregivers?20 which estimates that approximately 11 percent of caregivers leave the workplace over the course of caregiving, and the average length of time providing care for employed caregivers is 3.7 years.29 Thus, the estimated number of caregivers leaving the workplace on an annual basis is 2.97 percent. The median income was based on information from the California Department of Finance website, http://www.dof.ca.gov/HTML/FS_DATA/LatestEconData/FS_Income.htm (last accessed on August 18, 2008), item #2 Census Bureau’s measure of money income. The latest year for median income data was 2006 when the median income was $55,000—50 percent of this salary was used to calculate replacement cost.
Absenteeism Costs
To estimate absenteeism costs we used the figures reported by Scharlach and colleagues that 21 percent of employed caregivers missed work from arriving late to taking 3 or more days off, and 50 percent missed at least 16 hours of work in 2 weeks prior to the study inter-view. This resulted in 81,076 employed caregivers miss-ing approximately 400 hours per year. The costs were then derived by applying the California median hourly wage, $16.91, obtained from the May 2007 United States Department of Labor Bureau of Labor Statistics.35

77california alzheimer’s disease data report
Workday InterruptionsThe MetLife Caregiving Cost Study: Productivity
Losses to U.S. Business estimates that 44.8% of employed caregivers experience workday interruptions and the number of interrupted hours is 50 per year.29 The costs were then derived by applying the California median hourly wage, $16.91, obtained from the May 2007 United States Department of Labor Bureau of Labor Statistics.35
Elder Crisis
The MetLife Caregiving Cost Study: Productivity Losses to U.S. Business estimates that 60% of employed caregiv-ers experience an occasional crisis when they have to take off a few days to make arrangements for services, move a loved one to a different living situation, or deal with a hospitalization which results in an estimated 3 days (24 hours) per year loss of work.29 The costs due to elder cri-sis were then derived by applying the California median hourly wage, $16.91, obtained from the May 2007 United States Department of Labor Bureau of Labor Statistics.35
Reducing Time From Full-time to Part-time Status
These costs were estimated separately for small businesses (0-499 employees) and large businesses (500+ employees). Scharlach and colleagues estimated that 13 percent of caregivers need to reduce their hours of em-ployment.12 The California Employment Development Department estimates that 79.1% of Californians are employed in small businesses and approximately 20.8% are employed in large businesses (California Employment Development Dept, Labor Market Information Division, Third Quarter 2006, http://www.labormarketinfo.edd.ca.gov/?pageid=138, accessed July 11, 2008). Using these estimates results in 39,650 caregivers employed in small
businesses and 10,540 caregivers in large businesses who will likely reduce the amount of time that they work due to caregiver responsibilities. 50% of the average monthly salary for small and large businesses was obtained to calculate the costs associated with going from full- to part-time employment—$2,532 for small businesses and $3,408 for large businesses (http://www.payscale.com/research/US/State=California/Salary/show_all).
Supervision Costs
The MetLife Caregiving Cost Study: Productivity Losses to U.S. Business estimates that 45.9% of employed caregivers have supportive supervisors. This resulted in 177,556 caregivers with supportive supervisors. Similar to the procedures in The MetLife Caregiving Cost Study we took the California median hourly wage and increased this by 10% to estimate a supervisors’ wage. It is estimated that supervisors spent one hour per month (12 hours per year) supervising these employees.29
Unpaid Leave Costs
The MetLife Caregiving Cost Study: Productivity Losses to U.S. Business estimates that 16% of employed caregivers take unpaid leave—61,772 California care-givers—for a total of 10 days per year. The California median hourly wage was used to calculate the cost of unpaid leave based on a seven hour day.

78 california alzheimer’s disease data report

79california alzheimer’s disease data report
Appendix GReferences

80 california alzheimer’s disease data report
1. Claritas Study Ranks Racial/Ethnic Diversity in Counties; Nationwide; Analysis Shows California Leads Nation in Diversity Among Counties of 100,000-Plus Population: Business Wire. July 23, 2001.; 2001.
2. Alzheimer’s Association. 2008 Alzheimer’s Disease Facts and Figures. Alzheimer’s & Dementia. Mar 2008;4(2):110-133, accessible at http://www.alz.org/national/documents/report_alzfactsfigures2008.pdf.
3. Alzheimer’s Association. 2004 Hispanics/Latinos and Alzheimer’s Disease: accessible at http://www.alz.org/national/documents/report_hispanic.pdf; 2004.
4. Latino Coalition for a Healthy California. Latino Coalition for a Healthy California (January 2005): Research Brief. http://www.lchc.org/documents/LatinoHealthinCA.pdf, accessed on July 6, 2008.
5. Alzheimer’s Association. 2002 African Americans and Alzheimer’s Disease Report: The Silent Epidemic: accessible at http://www.alz.org/national/documents/report_africanamericanssilentepidemic.pdf; 2002.
6. Jones RS, Chow TW, Gatz M. Asian Americans and Alzheimer’s disease: Assimilation, culture and beliefs. Journal of Aging Studies. 2006; 20(1):11-25.
7. Lau DS, Lee G, Wong CC, Fung GL, Cooper BA, Mason DT. Characterization of systemic hypertension in the San Francisco Chinese community. Am J Cardiol. Aug 15, 2005; 96(4):570-573.
8. Farrer LA, Cupples LA, Haines JL, et al. Effects of age, sex, and ethnicity on the association between apolipoprotein E genotype and Alzheimer disease. A meta-analysis. APOE and Alzheimer Disease Meta Analysis Consortium. Jama. Oct 22-29, 1997; 278(16):1349-1356.
9. Havlik RJ, Izmirlian G, Petrovitch H, et al. APOE-epsilon4 predicts incident AD in Japanese-American men: the Honolulu-Asia aging study. Neurology. Apr 11, 2000; 54(7):1526-1529.
10. Office of Minority Health and Disparities. Asian American Populations: CDC, Office of Minority Health and Disparities. http://www.cdc.gov/omhd/populations/AsianAm/AsianAm.htm, accessed on August 12, 2008.
11. Jew-Lochman S. Alzheimer’s Disease Deaths California, 2005: California Department of Public Health, Office of Health Information and Research. Accessible at http://www.cdph.ca/gov/pubsforms/Pubs/OHIRalzheimer2005.pdf; 2008.
12. Scharlach A, Sirotnik B, Bockman S, Neiman M, Ruiz C, Dal Santo T. A Profile of Family Caregivers: Results of the California Statewide Survey of Caregivers: Center for the Advanced Study of Aging Services, University of California, Berkeley; 2003.
13. Family Caregiver Alliance. Caregiver Resource Center: California Caregiver Resource Center System Program Highlights Fiscal Year 2006-07: Family Caregiver Alliance, accessible at http://www.caregiver.org/caregiver/jsp/content_node.jsp?nodeid=2179; 2008.
14. Mature Market Institute. The MetLife Study of Alzheimer’s Disease: The Caregiving Experience: Mature Market Institute, accessible at http://www.maturemarketinstitute.com; August 2006.
15. Family Caregiver Alliance. Family Caregiver Alliance Fact Sheet: Selected Caregiver Statistics: Family Caregiver Alliance, accessible at http://www.caregiver.org/caregiver/jsp/content_node.jsp?nodeid=439.
16. California Department of Health Care Services. Medi-Cal Beneficiary Profiles by County 2007: State of California, Department of Health Care Services (Sacramento, CA, October 2007), accessible at http://www.dhs.ca.gov/mcss/RequestedData/Profiles/profiles.htm; 2007.
17. Alzheimer’s Association and National Alliance for Caregiving. Families Care: Alzheimer’s Caregiving in the United States 2004: Alzheimer’s Association and National Alliance for Caregiving, accessible at http://www.caregiving.org/data/alzcaregivers04.pdf.
18. Yaffe K, Fox P, Newcomer R, et al. Patient and caregiver characteristics and nursing home placement in patients with dementia. Jama. Apr 24, 2002; 287(16):2090-2097.
19. Alzheimer’s Association. Alzheimer’s Disease Facts and Figures, 2007: Washington, D.C.: Alzheimer’s Association, accessible at http://alz.org/national/documents/report_alzfactsfigures2007.pdf; 2007.
References

8�california alzheimer’s disease data report
20. Family Caregiver Alliance. Family Caregiver Alliance Fact Sheet: California Caregivers – A Profile: Who are California’s Informal Caregivers?: Family Caregiver Alliance, accessible at http://caregiver.org/caregiver/jsp/content_node.jsp?nodeid=1961), accessed on July 19, 2008; 2007.
21. Rice DP, Fox PJ, Max W, et al. The economic burden of Alzheimer’s disease care. Health Aff. Summer 1993;12(2):164-176.
22. Menzin J, Lang K, Friedman M, Neumann P, Cummings JL. The economic cost of Alzheimer’s disease and related dementias to the California Medicaid program (“Medi-Cal”) in 1995. Am J Geriatr Psychiatry. Fall 1999;7(4):300-308.
23. Genworth Financial Inc. GENWORTH FINANCIAL 2008 COST OF CARE SURVEY: Home Care Providers, Adult Day Health Care Facilities, Assisted Living Facilities and Nursing Homes: Genworth Financial, Inc. (2008, April). Accessed at http://www.genworth.com/content/genworth/www_genworth_com/web/us/en/products_we_offer/long_term_care_insurance/long_term_care_overview/what_is_the_cost_of_long_term_care.html, last accessed August 13, 2008; 2008.
24. Centers for Medicare & Medicaid Services. CMS Annual Nursing Home Data Compendium, 2007: Centers for Medicare & Medicaid Services; 2007.
25. Centers for Medicare & Medicaid Services. Medical Condition–Mental Status CMS OSCAR Data Current Surveys, June 2008 CMS OSCAR Form 672: F78, F108 - F114 American Health Care Association - Health Services Research and Evaluation: Centers for Medicare & Medicaid Services (June, 2008). Accessed at www.ahcancal.org/research_data/oscar_data/NursingFacilityPatientCharacteristics/MC_mental_status_Jun2008.pdf, last accessed August 13, 2008
26. AHCA/NCAL. Nursing Facility State Occupancy Rate and Median Facility Occupancy Rate for Certified Beds CMS OSCAR Data Current Surveys, June 2008, CMS OSCAR Form 671: L18, L37, L38, L39 and Form 672: F78: American Health Care Association/National Center for Assisted Living, Accessed at www.ahcancal.org/.../Nursing%20Facility%20Operational%20Characteristics/NF_State_Occupancy_RateJun2008.pdf, last accessed August 13, 2008; 2008.
27. Genworth Financial Inc. A Workforce to Care for Our Aging.: Genworth Financial, Inc.. Accessed at http://www.genworth.com/content/genworth/www_genworth_com/web/us/en/products_we_offer/long_term_care_insurance/long_term_care_overview/what_is_the_cost_of_long_term_care.html, last accessed August 13, 2008; 2008.
28. Matthias R, Chapman S, Rickles J, et al. Caregiver Training Initiative: FINAL PROCESS AND OUTCOME EVALUATION REPORT: California Employment Development Department; 2003.
29. MetLife Mature Market Institute. The MetLife Caregiving Cost Study: Productivity Losses to U.S. Business: Metlife Mature Market Insitute & National Alliance for Caregiving. Accessed at http://www.metlife.com/Applications/Corporate/WPS/CDA/PageGenerator/0,4773,P8899,00.html, August 13, 2008; 2006.
30. Fox PJ, Kohatsu N, Max W, Arnsberger P. Estimating the costs of caring for people with Alzheimer disease in California: 2000-2040. J Public Health Policy. 2001; 22(1):88-97.
31. Plassman BL, Langa KM, Fisher GG, et al. Prevalence of dementia in the United States: the aging, demographics, and memory study. Neuroepidemiology. 2007; 29(1-2):125-132.
32. Alzheimer’s Association. Early Onset Dementia: A National Challenge, A Future Crisis: Washington, D.C.: Alzheimer’s Association, June 2006, accessible at http://alz.org/national/documents/report_earlyonset_full.pdf; 2006.
33. Hebert LE, Scherr PA, Bienias JL, Bennett DA, Evans DA. Alzheimer disease in the U.S. population: prevalence estimates using the 2000 census. Arch Neurol. Aug 2003; 60(8):1119-1122.
34. California Department of Finance. Race/Ethnic Population with Age and Sex Detail, 2000-2050. Sacramento, CA: State of California, Department of Finance (July 2007), accessible at: http://www.dof.ca.gov/HTML/DEMOGRAP/Data/RaceEthnic/Population-00-50/RaceData_2000-2050.php; 2007.
35. U.S. Department of Labor Bureau of Labor Statistics. Accessed July 11, 2008.
36. California Employment Development Department. http://www.labormarketinfo.edd.ca.gov/?pageid=138, accessed on July 11, 2008.
37. Payscale. http://www.payscale.com/research/US/State=California/Salary/show_all, accessed on July 11, 2008.

82 california alzheimer’s disease data report
83california alzheimer’s disease data report
Appendix HAlzheimer’s Association Chapter Offices in California

8� california alzheimer’s disease data report
CALIFORNIA SOUTHLAND5900 Wilshire Blvd., Ste. 1100Los Angeles, CA 90036(323) 938-3379
Greater East Los Angeles133 North Sunol Drive, Ste. 233Los Angeles, CA 90063(323) 881-0574
Greater San Fernando Valley16933 Parthenia St., Ste. 200Northridge, CA 91343(818) 830-8590
Inland Empire9213 Archibald Ave.Rancho Cucamonga, CA 91730 (909) 944 9680
Coachella Valley69730 Hwy 111, Ste. 202Rancho Mirage, CA 92270(760) 328-6767
NORTHERN CALIFORNIA1060 La AvenidaMountain View, CA 94043(650) 962-8111
North Valley–Chico2105 Forest Avenue, Ste. 130Chico, CA 95928(530) 895-9661
Sacramento Valley530 Bercut Drive, Ste. ASacramento, CA 95811(916) 930-9080
North Bay–Santa Rosa1211 North Dutton Ave., Ste. ASanta Rosa, CA 95401(707) 573-1210
North Bay–San Rafael4340 Redwood Hwy, Ste. D314San Rafael, CA 94903(415) 472-4340
East Bay–Lafayette251 Lafayette Circle, Ste. 250Lafayette, CA 94549(925) 284-7942
Santa Cruz1777 A-Capitola RoadSanta Cruz, CA 95062(831) 464-9982
Monterey182 El Dorado StreetMonterey, CA 93940(831) 647-9890
CENTRAL COAST1528 Chapala Street, Ste. 204Santa Barbara, CA 93101(805) 892-4259
Santa Barbara North528 South BroadwaySanta Maria, CA 93454(805) 636-6432
San Luis Obispo3480 South Higuera St., Ste. 120San Luis Obispo, CA 93401(805) 547-3830
Ventura County1339 Del Norte Rd.Camarillo, CA 93010(805) 485-5597
ORANGE COUNTY17771 Cowan, Ste. 200Irvine, CA 92614(949) 955-9000
SAN DIEGO/IMPERIAL4950 Murphy Canyon Rd., Ste. 250San Diego, CA 92123(858) 492-4400
Imperial Valley584 E. Main StreetEl Centro, CA 92243(760) 335-3725
The Alzheimer’s Association is the leading voluntary health organization in Alzheimer care, support and research. Their mission is to eliminate Alzheimer’s disease through the advancement of research; to provide and enhance care and support for all affected; and to reduce the risk of dementia through the promotion of brain health.
Alzheimer’s Association Chapters and the Regions They Serve
NATIONAL HEADQUARTERS Alzheimer’s Association225 N. Michigan Ave., Fl. 17 Chicago, IL 60601website: www.alz.org
24/7 HELPLINEContact us for information, referral and support.tel: 1.800.272.3900tdd: 1.866.403.3073 e-mail: [email protected]
The core services of the Alzheimer’s Association are: • Information & Referral• Family Care Consultations• Medic Alert®+Safe Return® wanderer’s registry & I.D.• Caregiver Education• Support Groups• Professional Training• Early Stage Programs
Alzheimer’s Association Chapters and Service Offices

85california alzheimer’s disease data report
Appendix ICaregiver Resource Centers in California

8� california alzheimer’s disease data report
Bay Area Caregiver Resource Center/Family Caregiver AllianceStatewide Resources Consultant180 Montgomery Street, Suite 1100San Francisco, California 94104Phone: (415) 434-3388 or (800) 445-8106Website: www.caregiver.org E-mail: [email protected] Alameda, Contra Costa, Marin, San Francisco, San Mateo & Santa Clara Counties
Caregiver Resource Center of Orange County2767 E. Imperial Hwy., 2nd FloorBrea, CA 92821Phone: (714) 870-3530 or (800) 543-8312Website: www.caregiveroc.org E-mail: [email protected] Orange County
Coast Caregiver Resource Center1528 Chapala Street, Suite 302Santa Barbara, CA 93101Phone: (805) 962-3600 or (800) 443-1236Website: www.coastcrc.org E-mail: [email protected] San Luis Obispo, Santa Barbara & Ventura Counties
Del Mar Caregiver Resource Center736 Chestnut Street, Suite FSanta Cruz, California 95060Phone: (831) 459-6639 or (800) 624-8304Website: www.delmarcaregiver.org E-mail: [email protected] Monterey, San Benito & Santa Cruz Counties
Del Oro Caregiver Resource Center5723A Marconi AvenueCarmichael, California 95608Phone: (916) 971-0893 or (800) 635-0220Website: www.deloro.org E-mail: [email protected] Alpine, Amador, Calaveras, Colusa, El Dorado, Nevada, Placer, Sacramento, San Joaquin, Sierra, Sutter, Yolo & Yuba Counties
Inland Caregiver Resource Center1420 East Cooley Drive, Suite 100Colton, California 92324Phone: (909) 514-1404 or (800) 675-6694Website: www.inlandcaregivers.com E-mail: [email protected] Inyo, Mono, Riverside & San Bernardino Counties
Los Angeles Caregiver Resource Center3715 McClintock AvenueLos Angeles, California 90089-0191Phone: (213) 821-7777 or (800) 540-4442Website: www.losangelescrc.org E-mail: [email protected] Los Angeles County
Mountain Caregiver Resource Center2491 Carmichael Drive, Suite 400Chico, California 95928Phone: (530) 898-5925 or (800) 995-0878Website: www.caregiverresources.org/MCRC_home E-mail: [email protected] Butte, Glenn, Lassen, Modoc, Plumas, Shasta, Siskiyou, Tehama & Trinity Counties
Redwood Caregiver Resource Center141 Stony Circle, Suite 200Santa Rosa, California 95401Phone: (707) 542-0282 or (800) 834-1636Website: www.redwoodcrc.org E-mail: [email protected] Del Norte, Humboldt, Lake, Mendocino, Napa, Solano & Sonoma Counties
Southern Caregiver Resource Center3675 Ruffin Road, Suite 230San Diego, California 92123Phone: (858) 268-4432 or (800) 827-1008Website: www.scrc.signonsandiego.com E-mail: [email protected] San Diego & Imperial Counties
Valley Caregiver Resource Center3845 North Clark Street, Suite 201Fresno, California 93726Phone: (559) 224-9154 or (800) 541-8614Website: www.valleycrc.org E-mail: [email protected] Fresno, Kern, Kings, Madera, Mariposa, Merced, Stanislaus, Tulare & Tuolumne Counties
Wherever you live, there’s help, information, education, respite, care planning and support for families and friends caring for adults with chronic, disabling health conditions.
• Specialized Information• Family Consultation & Planning• Respite
Caregiver Resource Centers (CRC)
Caregiver Resource Centers and the Regions They Serve
www.californiacrc.org
• Legal & Financial Consultation• Education• Professional Training
• Counseling• Support Groups
87california alzheimer’s disease data report
Appendix JAlzheimer’s DiseaseResearch Centers of California
Alzheimer’s Disease Research Centers of California (ARCCs)
How is California helping persons with Alzheimer’s disease and their families?
In 1984, legislation was enacted which established the Alzheimer’s Disease Program. The mission of the Program is to reduce the human burden and economic cost associated with Alzheimer’s disease and related disorders, and to assist in ultimately discovering the cause and cure of these diseases by:
Providing diagnostic and treatment services
Improving the quality of care for persons with Alzheimer’s disease
Providing education and support to the families of persons with Alzheimer’s disease
Increasing and improving the training of health care professionals with respect to Alzheimer’s disease
Increasing research to discover the cause of and cure for Alzheimer’s disease—collecting and analyzing accurate and standardized information relative to the disease
Translating research findings and technical advances into clinical practice, medical education, and the community
•
•
•
•
•
•
88 california alzheimer’s disease data report
What are the Alzheimer’s Disease Research Centers of California?
To accomplish the above objectives, the Alzheimer’s Disease Program has established and administers ten ARCCs at university medical centers through-out California. These Centers are dedicated to im-proving the quality of life of persons affected with Alzheimer’s disease and their families by providing:
Comprehensive assessment of individuals with memory problems, typically including medical, neurological, psychological and psychosocial evaluations
In-home assessment of functional abilities and safety concerns
Family conference and treatment planning following the evaluation
Information and referrals to community health and social services
Appropriate follow-up
Support groups for caregivers
Training and education for professionals and lay audiences
Medical, pharmacological, social and behavioral research
•
•
•
•
•
•
•
•
Who provides these services at the Centers?
Services are provided by multi-disciplinary teams which may include neurologists, psychiatrists, physi-cian assistants, psychologists, nurse specialists, neu-ropsychologists and social workers. Patients continue to see their private physician for primary care.
Who is eligible for these services?Any individual with symptoms of memo-
ry loss, disorientation and confusion may con-tact one of the Centers for an evaluation. Patients may be self-referred or referred by a family mem-ber, private physician or community agency.
Are these services covered by insurance?Most of the costs of the services and diagnos-
tic tests are covered by insurance. Medicare, Medi-Cal and supplemental or private insurance are accepted. Unless prior arrangements for financial assistance are made with the Center, patients or their families are responsible for fees not covered by insurance.
89california alzheimer’s disease data report
Northern California Centers:
Fresno ARCC UC San Francisco/Fresno Alzheimer’s and Memory Center3313 North Hilliard LaneFresno, California 93726PH: 559-227-4810FX: 559-227-4167Email: [email protected] Website: http://fserve.fresno.ucsf.edu/alzheimer/
Sacramento ARCCUC Davis/Sacramento4860 Y Street, Suite 3900Sacramento, CA 95817PH: 916-734-5496FX: 916-456-9350Website: http://alzheimer.ucdavis.edu/
Martinez ARCC UC, Davis/Martinez 150 Muir Road (127A)Martinez, CA 94553 PH: 925-372-2485FX: 925-372-2884Website: http://alzheimer.ucdavis.edu/
San Francisco ARCCUC, San Francisco 350 Parnassus Avenue, Suite 905San Francisco, CA 94143 PH: 415-476-6800FX: 415-476-4800Website: http://www.memory.ucsf.edu/
Palo Alto ARCC Stanford UniversityDepartment of Psychiatry (116F-PAD)3801 Miranda AvenuePalo Alto, CA 94304PH: 650-858-3915 (Clinic)FX: 650-849-0183Website: http://arcc.stanford.edu/
Southern California Centers:
ARCC General Information Contact: PH: (916) 558-1784.For relay services for the hearing impaired or speech impaired, please call:MCI from TDD 1-800-735-2929 or MCI from voice telephone 1-800-735-2922 Sprint from TDD 1-888-877-5378 or Sprint from voice telephone 1-888-877-5379
Irvine ARCC UC, Irvine Institute for Brain Aging and Dementia1113 Gillespie, N.R.F.Irvine, CA 92697-4540PH: 949-824-5847FX: 949-824-2071Website: http://www.alz.uci.edu/
USC/LA ARCC 1510 San Pablo Street, HCC 600Los Angeles, California 90033General Information/Appointments:PH: 323-442-7600FX: 323-442-7601Email: [email protected] Website: http://www.usc.edu/schools/medicine/departments/psychiatry_behavioralsciences/research/gsc/
Los Angeles/UCLA ARCC Los Angeles/San Fernando ValleyReed Neurological Research Building10911 Weyburn Avenue, 2nd FloorLos Angeles, CA 90095-7226General Information: (310) 794-3665Fax: (310) 794-3148UCLA Appointments: (310) 794-1195Centinela Freeman: (323) 563-5915Olive View/UCLA Center: (818) 895-954Email: [email protected] Website: http://www.adc.ucla.edu/
USC/Rancho ARCCUSC/Rancho Los AmigosRancho Los Amigos National Rehabilitation Center7601 East Imperial Highway (800 West Annex)Downey, California 90242PH: 562-401-8130 FX: 562-803-6900
San Diego ARCC UC, San DiegoSOCARE/UCSD ARCC9500 Gilman Drive - 0948La Jolla, CA 92093-0948PH: 858-622-5800FX: 858-552-7513
Where are the Alzheimer’s Disease Research Centers of California located?

90 california alzheimer’s disease data report

9�california alzheimer’s disease data report
Appendix KCalifornia Guideline for Alzheimer’s Disease Management
2008 California Guideline for Alzheimer’s Disease Management
This is the third edition of this Guideline for Alzheimer’s Disease Management. The first was disseminated in 1998 and updated in 2002. The California Workgroup on Guidelines for Alzheimer’s Disease Management, consisting of a collaborative effort of healthcare provid-ers, consumers, academicians, and representatives of professional and volunteer organizations developed the Guideline through a review of scientific evidence that was supplemented by expert opinion when re-search was unavailable or inconsistent. This Guideline presents core care recommendations for the management of Alzheimer’s disease. It assumes that a proper diagnosis has been made using reliable and valid diagnos-tic techniques. The Guideline is also available through the Alzheimer’s Association’s California website http://www.caalz.org/Guidelines.htm.

92 california alzheimer’s disease data report
Lega
L co
nsid
erat
ions
guideline for alzheimer’s disease Managementtr
eatM
ent
Monitor ChangesConduct and document an assessment and monitor changes in:
Daily functioning, including feeding, bathing, dressing, mobility, toileting, continence, and ability to manage finances and medications
Cognitive status using a reliable and valid instrument
Comorbid medical conditions which may present with sudden worsening in cognition, function, or as change in behavior
Behavioral symptoms, psychotic symptoms, and depression
Medications, both prescription and non-prescription (at every visit)
Living arrangement, safety, care needs, and abuse and/or neglect
Need for palliative and/or end-of-life care planning
•
•
•
•
•
•
•
Develop Treatment PlanDevelop and implement an ongoing treatment plan with defined goals. Discuss with patient and family:
Use of cholinesterase inhibitors, NMDA antagonist, and other medications, if clinically indicated, to treat cognitive decline
Referral to early-stage groups or adult day services for appropriate structured activities, such as physical exercise and recreation
•
•
Discuss StagesDiscuss the patient’s need to make care choices at all stages of the disease through the use of advance directives and identification of surrogates for medical and legal decision-making.
Discuss End-of-Life DecisionsDiscuss the intensity of care and other end-of-life care decisions with the Alzheimer’s Disease patient and involved family members while respecting their cultural preferences.
Non-Pharmacological Treatment FirstIF non-pharmacological approaches prove unsuccessful, THEN use medications, targeted to specific behaviors, if clinically indicated. Note that side effects may be serious and significant.
Treat Co-Morbid ConditionsProvide appropriate treatment for comorbid medical conditions.
Provide End-of-Life CareProvide appropriate end-of-life care, including palliative care as needed.
Treat Behavioral SymptomsTreat behavioral symptoms and mood disorders using:
Non-pharmacologic approaches, such as environmental modification, task simplification, appropriate activities, etc.
Referral to social service agencies or support organizations, including the Alzheimer’s Association’s MedicAlert® + Safe Return® program for patients who may wander
•
•
Integrate Medical Care & SupportIntegrate medical care with education and support by connecting patient and caregiver to support organizations for linguistically and culturally appropriate educational materials and referrals to community resources, support groups, legal counseling, respite care, consultation on care needs and options, and financial resources. Organizations include:
Alzheimer’s Association (800) 272-3900 www.alz.org
Caregiver Resource Centers (800) 445-8106 www.caregiver.org
or your own social service department
•
•
•
Discuss Diagnosis & TreatmentDiscuss the diagnosis, progression, treatment choices, and goals of Alzheimer’s Disease care with the patient and family in a manner consistent with their values, preferences, culture, educational level, and the patient’s abilities.
Involve Early-Stage PatientsPay particular attention to the special needs of early-stage patients, involv-ing them in care planning, heeding their opinions and wishes, and refer-ring them to community resources, including the Alzheimer’s Association.
Reassess FrequentlyReassessment should occur at least every 6 months, and sudden changes in behavior or increase in the rate of decline should trigger an urgent visit to the PCP.
Identify SupportIdentify the primary caregiver and assess the adequacy of family and other support systems, paying par-ticular attention to the caregiver’s own mental and physical health.
Assess CapacityAssess the patient’s decision-making capacity and determine whether a surrogate has been identified.
Identify Culture & ValuesIdentify the patient’s and fam-ily’s culture, values, primary language, literacy level, and decision-making process.
PlanningInclude a discussion of the importance of basic legal and financial planning as part of the treatment plan as soon as possible after the diagnosis of Alzheimer’s Disease.
Capacity Evaluations Use a structured approach to the assessment of patient capacity, being aware of the relevant criteria for particular kinds of decisions.
Elder Abuse Monitor for evidence of and report all suspicions of abuse (physical, sexual, financial, neglect, isolation, abandonment, abduction) to Adult Pro-tective Services, Long Term Care Ombudsman, or the local police department, as required by law.
DrivingReport the diagnosis of Alzheimer’s Disease in accordance with California law.
Patie
nt &
FaMi
Lyed
ucat
ion &
suPP
ort
asse
ssMe
nt
CALIfORNIA VeRSION © April 2008

93california alzheimer’s disease data report
Prepared by theCalifornia Workgroup on Guidelines
for Alzheimer’s Disease ManagementApril 2008
guideline for alzheimer’s disease Management
CALIfORNIA VeRSION © April 2008
Alzheimer’s Disease and Its ImpactAlzheimer’s Disease (AD) currently afflicts over 5.2 million Americans, including an estimated 200,000 patients under the age of 65. The number of those afflicted is increasing annually as the population continues to age. following the aging of the baby boomers, prevalence will escalate rapidly and is expected to double by 2020. The burden on families and the health care system will be substantial as one out of ev-ery eight baby boomers develops this disease.
About the GuidelineThis Guideline presents core care recommen-dations for the management of Alzheimer’s Disease. It assumes that a proper diagnosis has been made using reliable and valid di-agnostic techniques. The main audience for the Guideline is primary care practitioners. However, many of the activities recommended in the Guideline do not require a physician and can be done by other members of the treatment team (care managers, nurses, community sup-port organizations) working closely with the pa-tient and caregiving family. The recommended activities do not have to be done in one visit.
The California Workgroup on Guidelines for Alzheimer’s Disease Management, which consists of health-care providers, consumers, academicians and representatives of professional and vol-unteer organizations, developed the Guideline through a review of scientific evidence supple-mented by expert opinion when research has been unavailable or inconsistent. An expanded companion document, providing more in-depth background information, is available through the Alzheimer’s Association’s California web-site www.caalz.org.
This is the third edition of this Guideline for Alzheimer’s Disease Management. The first was disseminated in 1998 and updated in 2002. In the current version there are four substantive changes:
The advent of a new class of medication (NMDA Antagonists) for the management of moderate to advanced AD
Support for a team approach (medical and social support strategies) to quality management of AD
Strong evidence linking positive patient outcomes to caregiver education and support
New evidence on management of the disease in the very early and end stages (see the recommendations below)
Early-Stage RecommendationsPatients in early-stage AD have unique con-cerns. AD may progress slowly in the early stage. follow up two months after diagnosis and every six months thereafter. Pay particular attention to the special needs of early-stage patients, involv-ing them in care planning and referring them to community resources. Discuss implications with respect to work, driving, and other safety issues with the patient. Initiate pharmacologic therapy early. Recommend interventions to protect and promote continuing functioning, assist with in-dependence, and maintain cognitive health in-cluding physical exercise, cognitive stimulation and psychosocial support. Late Stage and End-of-Life RecommendationsAs the patient’s dementia worsens and the ability to understand treatments and partici-pate in medical decision-making declines, care shifts to focus on the relief of discomfort. The advisability of routine screening tests, hospital-ization, and invasive procedures, including ar-tificial nutrition and hydration, will depend upon previously discussed care plan and the sever-ity of the dementia. Predicting the end-of-life for a patient with severe AD is difficult. Referral to hospice should be considered.
•
•
•
•

9� california alzheimer’s disease data report
