am6
DESCRIPTION
nnTRANSCRIPT

CONTEMPORANEOUS RISK FACTORS AND THE PREDICTION OF
FINANCIAL STATEMENT FRAUD*
Christopher J. Skousen**
Assistant Professor
Department of Accounting
University of Texas at Arlington
College of Business, Room 409
701 S. West Street
Arlington, Texas 76019-0468
Phone: 817-272-3040
Fax: 817-272-5793
and
Charlotte J. Wright
Wilton T. Anderson Professor of Accounting
School of Accounting
William S. Spears School of Business
Oklahoma State University
Stillwater, OK 74078
Phone: 405-744-8611
Fax: 405-744-5180
August 24, 2006
*We thank Don Hansen, Carol Johnson, Dan Tilley, Derek Oler, Steven Kaplan,
and participants at the 2005 AAA Tenth Ethics Research Symposium, 2005
Brigham Young University 2nd
Accounting Research Symposium, and 2006 AAA
Annual Meeting for comments and helpful suggestions.
** Corresponding Author.

1
CONTEMPORANEOUS RISK FACTORS AND THE PREDICTION OF
FINANCIAL STATEMENT FRAUD
ABSTRACT
This study identifies the contemporaneous risk factors empirically related
to financial statement fraud. Extant research identifies a number of individual
factors related to fraud in various settings. In this study we examine an array of
potential fraud risk factors in order to identify a comprehensive set of coexistent
factors that are consistently linked to the incidence of financial statement fraud.
Further, using the identified fraud risk factors, we construct a robust fraud
prediction model. The analysis yields a number of significant factors related to
pressure and opportunity. Using the significant fraud risk factors we then
construct a fraud prediction model. The model correctly classifies fraud and no-
fraud firms approximately 69.77 percent of the time, a substantial improvement
over other fraud prediction models.
Key words: Fraud prediction, fraud detection, risk factors, SAS No. 99
Data Availability: All data are available from public sources.

2
1. INTRODUCTION
A growing body of empirical evidence indicates that there is a relationship
between various corporate governance-related issues and the incidence of
financial statement fraud. For example, fraud has been linked to concentration of
power (Dunn 2004), CEOs serving on boards of directors (DeChow, et al. 1996),
audit committee independence (Abbott et al. 2000), board of director composition
(Beasley 1996), and the existence of audit committees (Beasley 1996). Fraud has
also been linked to financial-related factors, such as sales growth and leverage
(Beneish 1997), inventory and return on assets (Summers and Sweeney 1998),
and the desire to obtain low-cost financing (DeChow, et al. 1996). As was
demonstrated in the recent fraud-related corporate failures, fraud risk factors do
not appear to exist in isolation. While extant research identifies a number of
factors related to fraud in various settings, we could find no studies that identify a
set of risk factors contemporaneous linked to financial statement fraud. In this
study we examine an array of potential fraud risk factors in order to identify a
comprehensive set of coexistent factors that are consistently linked to the
incidence of financial statement fraud. Further, using the identified fraud risk
factors, we are able to construct a robust fraud prediction model.
Cressey’s (1953) fraud risk theory provides the framework for
identification of firms’ fraud risk factors. Cressey contends that, in varying
degrees, pressure, opportunity and rationalization are always present when
3
financial statement fraud occurs. Cressy’s fraud risk factor framework is widely
accepted as evidenced by its adoption by the American Institute of CPA’s
(AICPA) in Statement on Auditing Standards (SAS) No. 99, “Consideration of
Fraud in a Financial Statement Audit”. SAS No. 99 requires auditors to evaluate
the potential presence of fraudulent behavior by assessing factors related to
pressure, opportunity and rationalization.
The first objective of this study is to identify a comprehensive set of
contemporaneous firm-related factors that are empirically related to financial
statement fraud. Using the examples cited in SAS No. 99 and relying on prior
fraud research, we develop fraud proxy variables representing various measures
of pressure, opportunity and rationalization. We test these variables using a
sample of fraud firms and a matched sample of no-fraud firms. This analysis
yields a number of significant factors related to pressure and opportunity. These
results indicate that (1) the proportion of independent audit committee members is
inversely related to the incidence of fraud; (2) when the proportion of ownership
held by managers already holding more than 5 percent of the outstanding shares
increases, the probability of fraud increases; (3) when the proportion of insider
ownership (management and directors) decreases, the probability of fraud
increases; (4) the frequency of fraud is higher among firms that do not have an
audit committee; and (5) when one individual holds both the CEO and Chairman

4
of the Board positions, the incidence of fraud is significantly higher than when the
two positions are held by different individuals.
The second objective of this study is to determine whether the fraud risk
factor framework can be utilized to construct a model capable of effectively
predicting fraud using publicly available information. Other fraud prediction
models have reported success rates of between 30 and 40 percent. We construct
a fraud prediction model using the five significant fraud risk factors identified in
our initial analysis. Using publicly available information, our model correctly
classifies fraud and no-fraud firms approximately 69.77 percent of the time.
Thus, our model substantially outperforms previously reported fraud prediction
models.
Our research contributes to the literature by identifying a comprehensive
set of contemporaneous risk factors consistently related to the incidence of
financial statement fraud and by using these factors to develop a fraud prediction
model that out performs models previously reported in the literature. The
remainder of this paper is organized as follows. Section II provides a brief review
of the relevant fraud literature. Section III contains a description of the research
design and sample selection. Section IV contains the empirical results and
sensitivity analysis. We summarize and conclude in Section V.

5
2. LITERATURE REVIEW AND EMPIRICAL PREDICTION
Cressey’s (1953) fraud risk factor theory is based largely on a series of
interviews conducted with people who had been convicted of embezzlement.
Cressy concludes that frauds generally share three common traits. First, the
embezzler had the opportunity to perpetrate fraud. Second, the individual
perceived a non-shareable financial need (pressure). Third, the individual
involved in a fraud rationalized the fraudulent act as being consistent with their
personal code of ethics. Thus, Cressy concludes that a “fraud triangle” consisting
of pressure, opportunity and rationalization is the key to identifying factors that
are, to some extent, always present in any given fraud. The AICPA adopted
Cressey’s fraud risk factor theory in SAS No. 99; however, according to the
AICPA, only one factor need be present in order for fraud to be committed. SAS
No. 99 requires the auditor to apply numerous new procedures aimed at
examining the firm environment and to evaluate expansive amounts of new
information in an effort to identify facts and circumstances that are indicative of
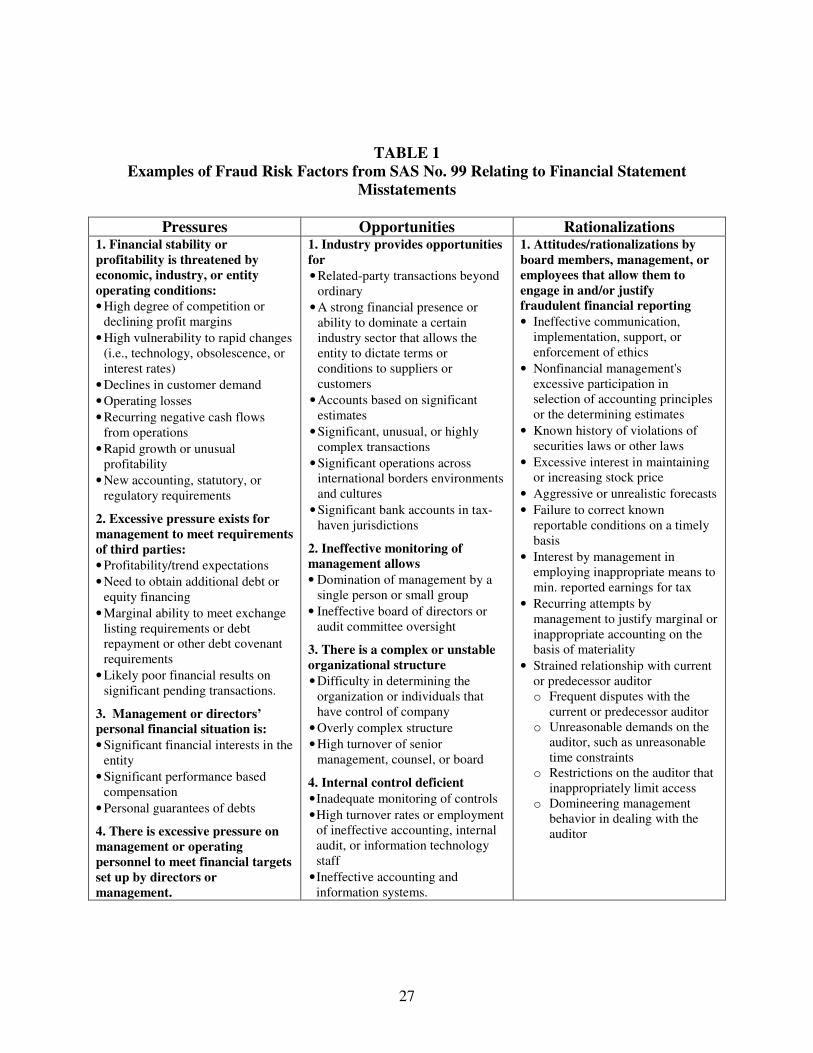
the existence of pressures, opportunities and/or rationalizations. Table 1 appears
in SAS No. 99 and provides examples of situations and circumstances that are
symptomatic of each fraud risk category.
Insert Table 1 about here
Extant fraud-related accounting research examines a few of the examples
cited in SAS No. 99 as being linked to fraud; however, we are aware of no
6
research that comprehensively examines a broad range of fraud risk factors by
empirically testing. Our study utilizes Cressey’s (1953) theory in identifying and
empirically examining a broad range of potential fraud risk factors. We test the
basic premise that:
FRAUD = f(Pressure, Opportunity, Rationalization) [1]
This relationship may also be stated in the form of an empirical prediction:
EP: The fraud risk factors (pressure, opportunity and rationalization) are
positively related to financial statement fraud.
It is our expectation that financial statement fraud is positively correlated with
factors related to pressure, opportunity and rationalization. We further anticipate
that this relationship is useful in predicting financial statement fraud.
3. RESEARCH DESIGN AND SAMPLE SELECTION
Since the fraud risk factors are not directly observable, it is first necessary
for us to develop proxy variables to measure pressure, opportunity and
rationalization. For this we rely on the fraud risk factor examples cited in SAS
No. 99 (Table 1) as well as prior fraud-related accounting research. Our choice of
proxy variables and the relevant research are described below.
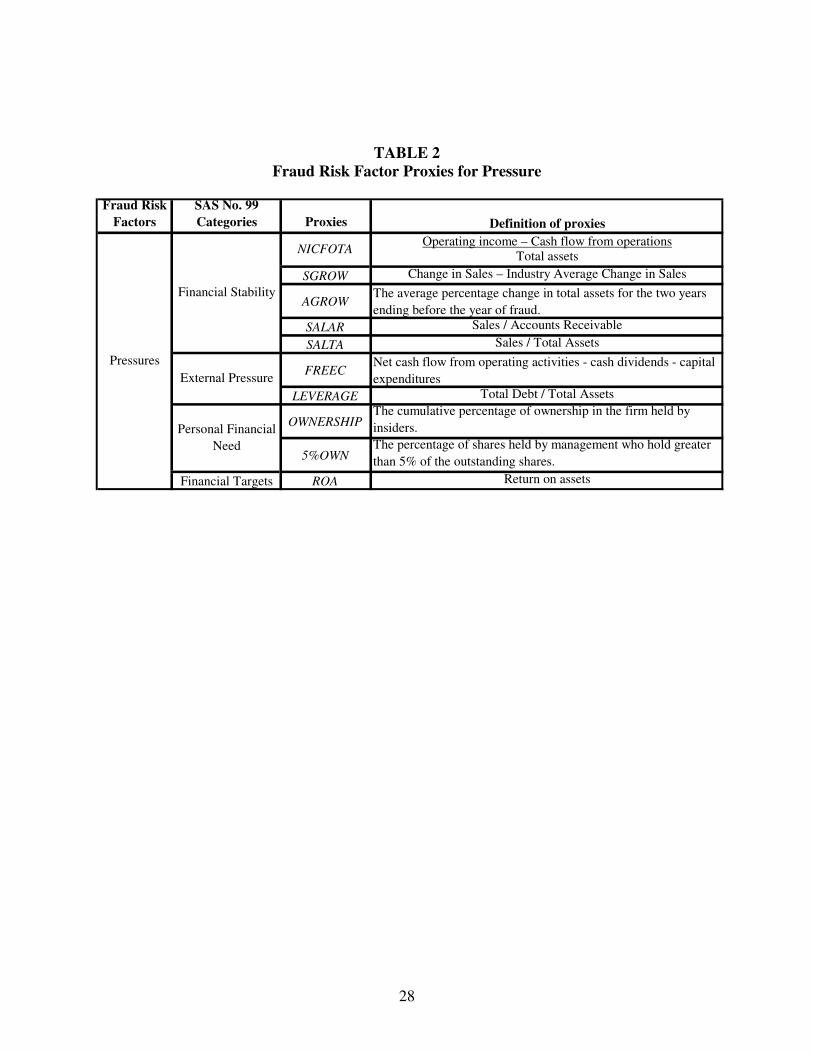
Fraud Risk Factor Proxies for Pressure
SAS No. 99 cites four general types of pressure that may lead to financial
statement fraud. These are financial stability, external pressure, managers’

7
personal financial situations, and meeting financial targets. Using these general
categories we identify five financial stability proxies, two external pressure
proxies, two personal financial need proxies and one proxy for financial targets.
These are described below.
Financial stability
SAS No. 99 suggests that when financial stability and/or profitability are
threatened by economic, industry, or entity operating conditions, managers face
pressure to commit financial statement fraud. Loebbecke et al. (1989) and Bell et
al. (1991) indicate that, in instances where a company is experiencing growth that
is below the industry average, management may resort to financial statement
manipulation to improve the firm’s outlook. Likewise, following a period of
rapid growth, management may resort to financial statements manipulation to
provide the appearance of stable growth. Accordingly, our proxy variables include
growth in sales (Beasley 1996; Summers and Sweeney 1998) and growth in assets
(Beneish 1997; Beasley et al. 2000). These are computed as:
SGROW = Change in Sales – Industry Average Change in Sales
AGROW = Percent change in Assets for the two years prior to
fraud.
SAS No. 99 suggests that financial stability may be affected by recurring
negative cash flows from operations or an inability to generate positive operating

8
cash flows in light of reported earnings growth. We use the following financial
stability ratio (Albrecht 2002) to relate cash flows to earnings growth:
NICFOTA = Operating income – Cash flow from operations
Total assets
Albrecht (2002) and Wells (1997) conclude that financial ratios involving
key income statement and balance sheet figures are useful in detecting fraud.
Persons (1995) suggests that sales to accounts receivable and sales to total assets
are useful in fraud detection. We include the following financial security proxies:
SALAR – Sales / Accounts receivables
SALTA – Sales / Total assets.
External pressure
The ability to meet exchange-listing requirements, repay debt or meet debt
covenants are widely recognized sources of external pressure. Vermeer (2003)
and Press and Weintrop (1990) report that, when faced with violation of debt
covenants, managers are more likely to utilize discretionary accruals. The extent
of leverage has also been associated with income increasing discretionary accruals
(DeAngelo et al.1994; DeFond and Jiambalvo 1991). Therefore, we include
leverage as a proxy for external pressure:
LEVERAGE = Total debt / Total assets
9
Dechow et al. (1996) note that when a firm has adequate internal funding,
managers are less likely to engage in fraud. We include free cash flow as an
additional measure of external pressure:
FREEC = Net cash flow from operating activities – cash dividends
– capital expenditures
Personal financial need
Beasley (1996), COSO (1999), and Dunn (2004) indicate that when
executives have a significant financial stake in a firm, their personal financial
situation may be threatened by the firm’s financial performance. We include
OWNERSHIP and 5%OWN as proxies for personal financial need:
OWNERSHIP = the cumulative percentage of ownership in the
firm held by insiders. Shares owned by management
divided by the common shares outstanding.
5%OWN = the cumulative percentage of ownership in the firm
held by management who hold 5 percent of the
outstanding shares or more divided by the common
shares outstanding.
Financial targets
Return on total assets (ROA) is a measure of operating performance that
shows how well assets have been employed. ROA is often used as a measure to
assess the performance of managers and thus potentially affects bonuses, wage
increases, etc. Summers and Sweeney (1998) report that ROA differs
significantly between fraud and no-fraud firms. Thus, we include ROA as a
financial target proxy.
10
ROA = Net Income before extraordinary items t-1
Total Assets t
Table 2 summarizes the fraud risk factor proxies for pressure.
Insert Table 2 about here
Fraud Risk Factor Proxies for Opportunity
SAS No. 99 cites four general categories of opportunities that may lead to
financial statement fraud. These are nature of industry, ineffective monitoring,
organizational structure, and internal control. Using these categories we identify
seven proxies for opportunity. These are described below.
Nature of industry
SAS No. 99 and Albrecht (2002) indicate that when a firm has significant
operations located in different international jurisdictions the opportunities for
fraud increase. We include FOROPS as a proxy for opportunity resulting from
significant foreign operations:
FOROPS = Percent of sales which are foreign. This is calculated
as total foreign sales divided by total sales.
Ineffective monitoring
Beasley et al. (2000), Beasley (1996), Dechow et al. (1996) and Dunn
(2004) observe that fraud firms consistently have fewer outside members on their
board of directors than do no-fraud firms. Therefore, we include BOUTP to proxy
for related to board composition.
BOUTP = Percentage of board members who are outside members.
11
Beasley et al. (2000) observe a reduced incidence of fraud among those
companies having an audit committee. Additionally, the larger audit committees
are associated with a lower incidence of fraud (Beasley et al. 2000). Consistently,
we use the following measures related to audit committees:
AUDCOMM = Indicator variable with the value of 1 if mention of
oversight by an internal audit committee; and 0
otherwise.
AUDCSIZE = The number of board members who are on the
audit committee divided by the board size.
Abbott and Parker (2001), Abbott et al. (2000), Beasley et al. (2000), and
Robinson (2002) identify a relationship between the independence of audit
committee members and the incidence of fraud. Therefore, we include IND as a
proxy for ineffective monitoring. We define an independent audit committee
member as a member who is not: a current employee of the firm, former officer or
employee of the firm or related entity, a relative of management, professional
advisor to the firm, officers of significant suppliers or customers of the firm,
interlocking director, and/or one who has no significant transactions with the firm
(Robinson 2002).
IND = The percentage of audit committee members who are
independent of the company.
Additionally, we include AUDMEET as a measure of the number of audit
committee meetings.

12
AUDMEET = The number of audit committee meetings held per
year.
Organizational structure
Loebbecke et al. (1989), Beasley (1996), Beasley et al. (1999), Abbott et
al. (2000), and Dunn (2004) conclude that, as a CEO accumulates titles, he/she is
in a position to dominate decision making. Since control of decision making may
provide an opportunity to commit fraud we include the following:
CEO = Indicator variable with a value of 1 if the chairperson of the
board holds the managerial positions of CEO or president;
and 0 otherwise.
Table 3 summarizes the fraud risk factor proxies for opportunity.
Insert Table 3 about here
Fraud Risk Factor Proxies for Rationalization
While rationalization is a necessary component of the fraud triangle, an
individual’s rationale is difficult to observe. Extant research indicates that the
frequency of audit failure and litigation increases immediately after a change in
auditor (Stice 1991; St. Pierre and Anderson 1984; Loebbecke et al.1989).
Therefore, we include auditor change as a proxy for rationalization:
AUDCHANG = a dummy variable for change in auditor where 1
= change in auditor in the 2 years prior to fraud
occurrence and 0 = no change in auditor.
Beneish (1997), Francis and Krishnan (1999), and Vermeer (2003) argue
that accruals are representative of management’s decision making and provide

13
insight into their financial reporting rationalizations. Francis and Krishnan (1999)
report that the excessive use of discretionary accruals may be cited in the audit
report. Accordingly, we include the following two variables to capture
rationalizations related to managements’ use of accruals:
AUDREPORT = a dummy variable for an audit where 1 = an unqualified
opinion and 0 an unqualified opinion with additional
language.
TATA = Total accruals divided by total assets, where total accruals are
calculated as the change in current assets, minus the change in
cash, minus changes in current liabilities, plus the change in
short-term debt, minus depreciation and amortization expense,
minus deferred tax on earnings, plus equity in earnings.
Table 4 summarizes the fraud risk factor proxies for rationalization.
Insert Table 4 about here
The full model that we use to test the empirical prediction is:
FRAUDi = α + β1NICFOTAi + β2SGROWi + β3AGROWi + β4SALARi
+ β5SALTAi + β6FREECi + β7LEVERAGEi + β8OWNERSHIPi
+ β95%OWNi + β10ROAi + β11FOROPSi + β12BOUTPi
+ β13AUDCOMMi + β14AUDCSIZEi + β15INDi + β16AUDMEETi
+ β17CEOi + β18AUDCHANGi + β19AUDREPORTi
+ β20TATAi + εi [2]
We test the model using both univariate analysis and logit regression.
Sample Selection
In order to evaluate our empirical prediction we first identify a set of firms
that had been accused of fraud by the Securities and Exchange Commission
(SEC). We define fraud firms as being those that were charged with violation of

14
Rule 10(b)-5 of the 1934 Securities Act or Section 17(a) of the 1933 Securities
Act and we examine the SEC Accounting and Auditing Enforcement Releases
(AAERs) issued between 1992 and 2001. Using this procedure we identified 113
fraud firms. Since it was necessary to obtain firms’ proxy and financial statement
data, it was necessary for firms’ financial data be available on the LexisNexis
SEC Filings & Reports website and COMPUSTAT for the year of the alleged
fraud as well as the two preceding years. This criterion resulted in elimination of
27 firms yielding a final sample of 86 fraud firms. The fraud firms come from a
variety of industries. Industry demographics of fraud firms are reported in Table
5. The fraudulent activities these firms were accused of occurred fairly evenly
over the 10-year period with the largest number occurring in 1997-1999.
Insert Table 5 about here
Next, in order to develop a control set of no-fraud firms, we first matched
based on industry membership (4 digit SIC code), year, and size (Net Sales +/-
30%) in the year prior to fraud (Beasley 1996). We then searched the SEC
AAERs to verify that none of the match firms had been the subject of SEC fraud-
related actions. Table 6 reports sample statistics for the fraud and no-fraud firms
including results of paired t-tests and Wilcoxon matched-pair sign-rank tests
indicating no significant differences between the two groups of firms.
Insert Table 6 about here

15
4. RESULTS
As an initial assessment of the proxy variables, we perform univariate
analysis. This analysis identifies eight pressure variables and five opportunity
variables that differ significantly between the fraud and no-fraud firms. No
rationalization proxy variables differed between the two groups. The univariate
analysis enables us to substantially reduce the number of explanatory variables
used in the logit regression. The results of the univariate analysis for all variables
are reported in Table 7.
Insert Table 7 about here
Following Hosmer and Lemeshow (2000) and Agrawal and Chadha
(2005) use conditional logit regression on the explanatory variables including
only the pressure and opportunity proxy variables identified in the univariate
analysis as having a p-value of 0.15 or less. The logit regression model is:
FRAUDi = β0 + β1NICFOTA + β2SGROW + β3AGROW + β4SALAR + β5SALTA + β6FREEC + β7OWNERSHIP+ β85%OWN + β9BOUTP + β10AUDCOMM + β11IND+ β12CEO + ε [3]
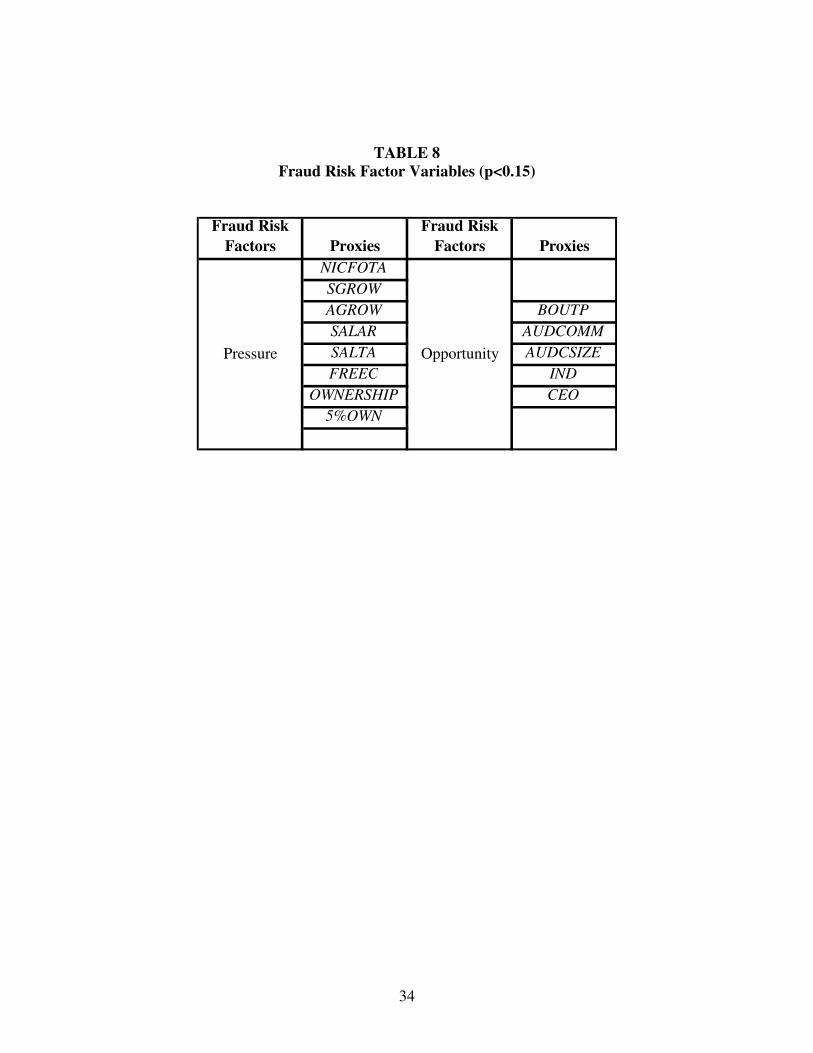
Table 8 lists, by type, the proxy variables that we use as explanatory variables in
the logit regression analysis.
Insert Table 8 about here
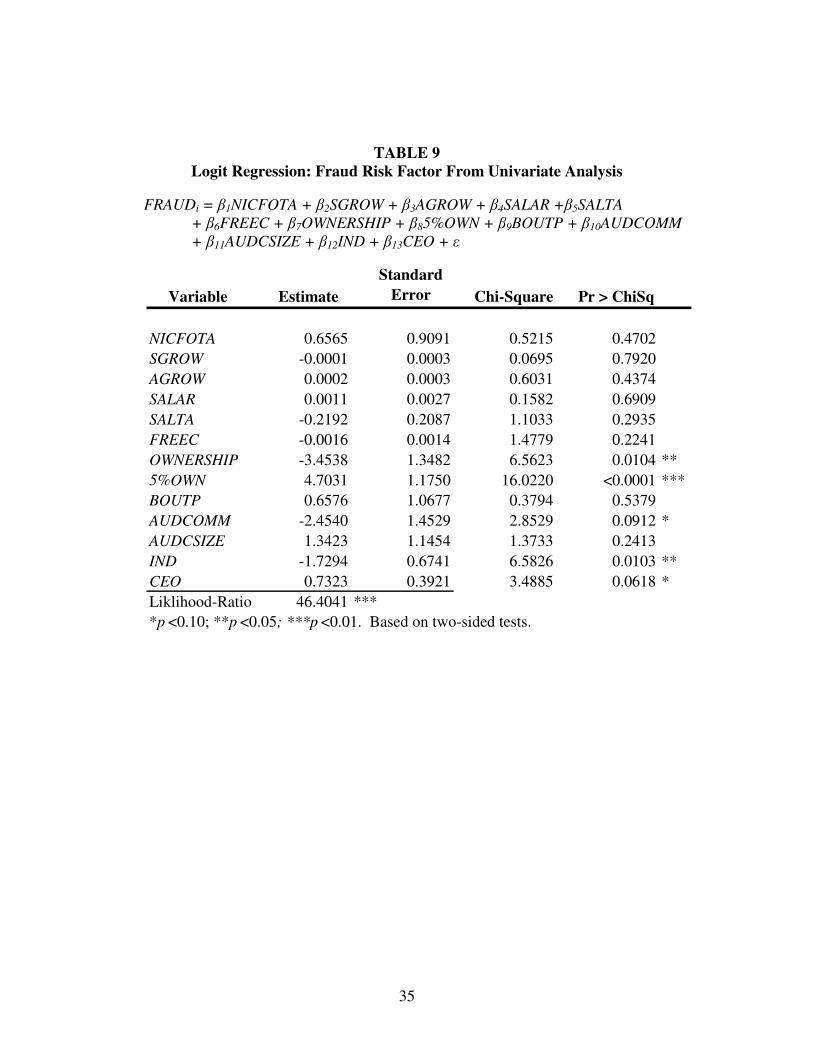
The results of the logit analysis are reported in Table 9. The model is
significant at p<0.01 as indicated by the likelihood ratio of 46.4041.1 Two
pressure variables (OWNERSHIP and 5%OWN) are significant (p<0.05, and
16
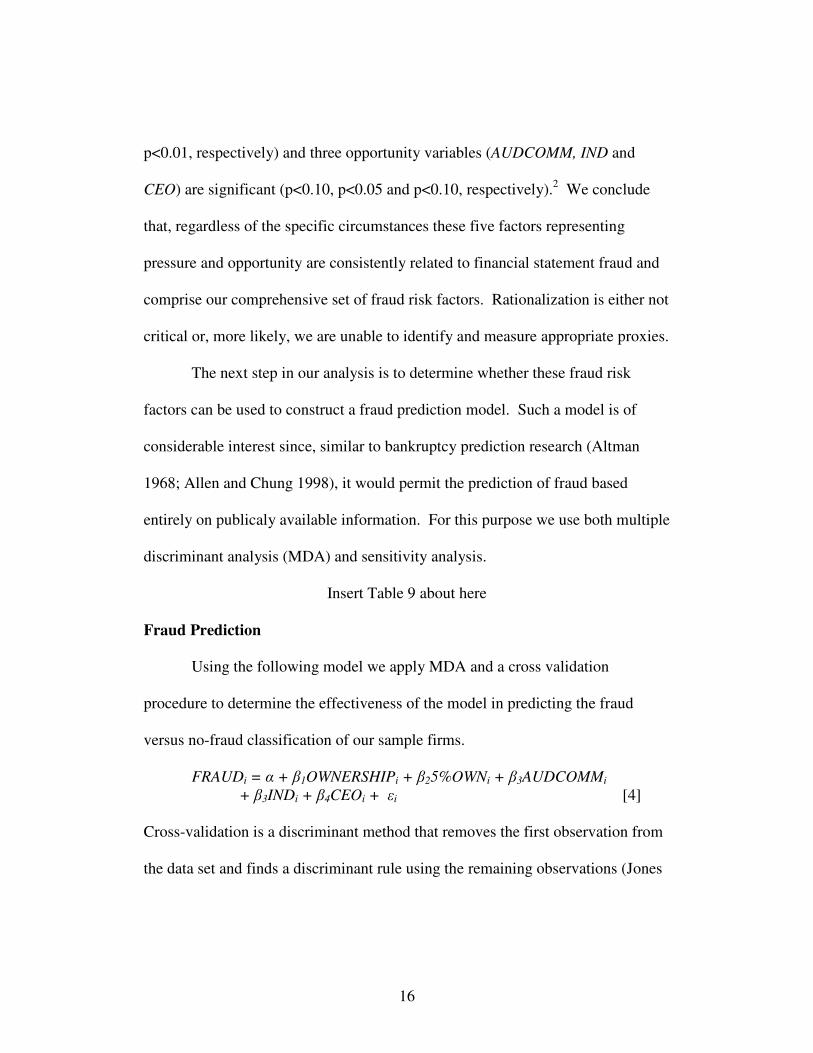
p<0.01, respectively) and three opportunity variables (AUDCOMM, IND and
CEO) are significant (p<0.10, p<0.05 and p<0.10, respectively).2 We conclude
that, regardless of the specific circumstances these five factors representing
pressure and opportunity are consistently related to financial statement fraud and
comprise our comprehensive set of fraud risk factors. Rationalization is either not
critical or, more likely, we are unable to identify and measure appropriate proxies.
The next step in our analysis is to determine whether these fraud risk
factors can be used to construct a fraud prediction model. Such a model is of
considerable interest since, similar to bankruptcy prediction research (Altman
1968; Allen and Chung 1998), it would permit the prediction of fraud based
entirely on publicaly available information. For this purpose we use both multiple
discriminant analysis (MDA) and sensitivity analysis.
Insert Table 9 about here
Fraud Prediction
Using the following model we apply MDA and a cross validation
procedure to determine the effectiveness of the model in predicting the fraud
versus no-fraud classification of our sample firms.
FRAUDi = α + β1OWNERSHIPi + β25%OWNi + β3AUDCOMMi + β3INDi + β4CEOi + εi [4]
Cross-validation is a discriminant method that removes the first observation from
the data set and finds a discriminant rule using the remaining observations (Jones

17
1987, Hair et al. 1995, and Kuruppu et al. 2003). This procedure develops a
model from n – 1 observations, and applies it to the observation not used in
developing the model. This process is repeated until all the firms in the sample
are used to assess the model’s accuracy. The cross-validation method is effective
at providing an unbiased estimate of a model’s misclassification rate (Hair et al.
1995) and is particularly useful in studies with small sample sizes since the entire
sample can be used to cross-validate the results (Kuruppu et al. 2003).
This analysis indicates that our model accurately classifies firms
approximately 69.77 percent of the time (the overall misclassification rate of the
model is 30.23). As reported in Table 10, the model correctly classifies no-fraud
firms 74.42 percent of the time and correctly classifies fraud firms 65.12 percent
of the time. These results are notable. Person (1995) and Kaminski et al. (2004)
develop fraud prediction models using financial ratios. These models suffer from
high misclassification rates. For example, in Person (1995) and Kaminski et al.
(2004) fraud firms are misclassified between 58 and 98 percent of the time.
Insert Table 10 about here
Sensitivity Analysis
Next, we use sensitivity analysis to assess the individual predictive ability
of each explanatory variable in our model (i.e., IND, 5%0WN, OWNERSHIP,
CEO and AUDCOMM). Sensitivity analysis tests each variable’s proportional
relationship to the probability of being in the fraud group while holding the other

18
variables in the model at their mean. Figures 1 through 5 report the results of the
sensitivity analysis.
The analysis of IND indicates that, as the proportion of audit committee
members who are independent increases, the probability of financial statement
fraud decreases. This result, as reported in Figure 1, indicates that, when the
independent audit committee members comprise 12 percent of the audit
committee, the probability of a firm being in the fraud group is approximately 29
percent. On the other hand, when 78 percent of the audit committee members are
independent, the probability of being in the fraud group decreases to 12 percent.
As IND increases to 100 percent, the probability of being in the fraud group
decreases to 9 percent.
Insert Figure 1 about here
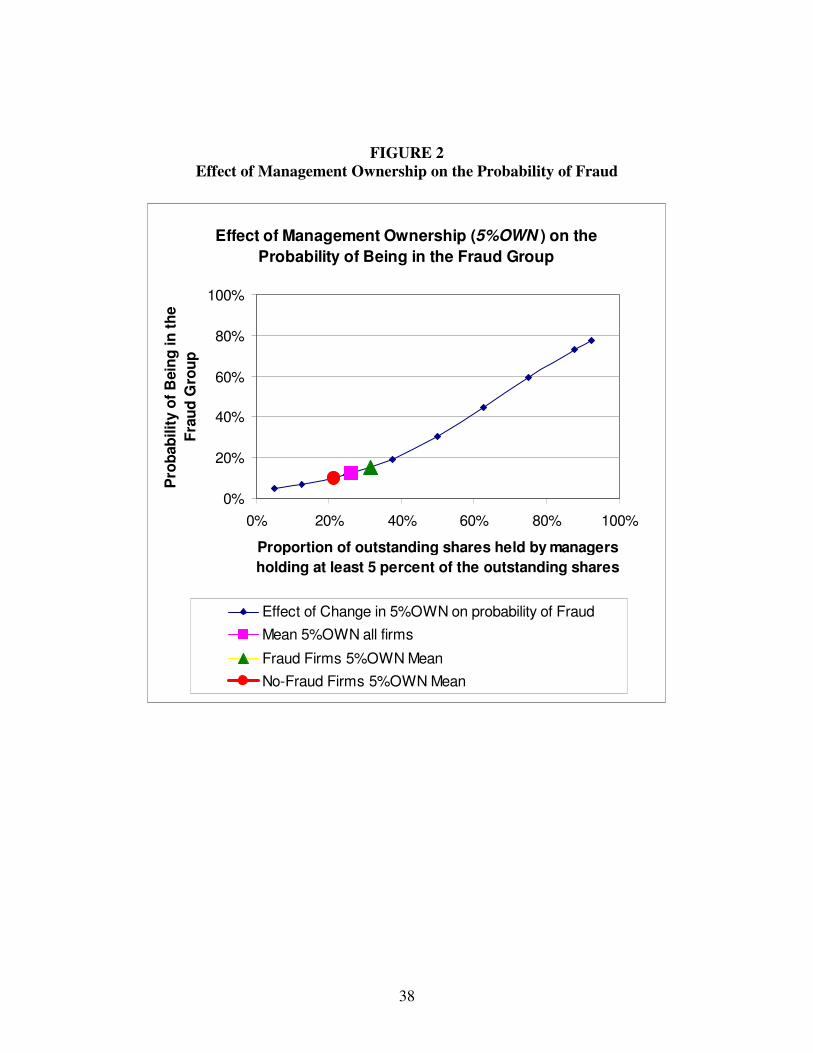
The analysis of 5%OWN reveals that a relationship exists between the
probability of a firm being in the fraud group and the proportion of managers who
own more than 5 percent of their firm’s shares. These results are reported in
Figure 2. When the proportion of ownership held by managers who hold more
than 5 percent of the outstanding shares increases, the probability of fraud
increases. When 5%OWN is approximately 12 percent of the firm’s outstanding
shares, the probability of a firm being in the fraud group is 7 percent. When
5%OWN increases to 75 percent, the probability of being in the fraud group
increases to 59 percent.

19
Insert Figure 2 about here
The analysis of OWNERSHIP indicates that when the proportion of insider
ownership (management and directors) decreases, the probability of being in the
fraud group increases. When insiders own 75 percent of the firm’s outstanding
shares, the probability of being in the fraud group is 2 percent. When
OWNERSHIP decreases to its mean value of approximately 20 percent, the
probability of fraud increases to 12 percent. The results appear in Figure 3.
Insert Figure 3 about here
The analysis of 5%OWN and OWNERSHIP indicates that management
ownership is a positive deterrence to fraud, so long as the ownership of the
remainder of the firm’s stock ownership is diffused. Thus, the larger the
percentage of shares held by managers, the lower the likelihood of fraud
occurring so long as individual managers do not hold a substantial portion of the
firm’s stock. In other words, when a large portion of a firm’s outstanding shares
are owned by management, the incidence fraud increases.3
Figure 4 reports the relationship between the incidence of fraud and
situations where a single individual holds both the CEO and Chairman of the
Board positions (CEO). When the CEO holds the Chairman of the Board position
(CEO = 1), the probability of being in the fraud group is 15 percent; otherwise
(CEO = 0) the probability of being in the fraud group is 8 percent.
Insert Figure 4 about here

20
The relationship between the occurrence of fraud and the existence of an
audit committee (AUDCOMM) is reported in Figure 5. When a firm has an audit
committee (AUDCOMM = 1), the probability of being in the fraud group is 11
percent; otherwise (AUDCOMM = 0) the probability of being in the fraud group is
40 percent.
Insert Figure 5 about here
5. CONCLUSION AND OBSERVATIONS
Extant fraud-related accounting research identifies an array of factors that
are related to the incidence of financial statement fraud in various settings.
However, these risk factors do not appear to exist in isolation. In any given fraud,
multiple risk factors are typically present. In this study, we examine an array of
potential fraud risk factors and identify a comprehensive set of coexistent factors
that are consistently linked to the incidence of financial statement fraud. Further,
using the significant risk factors we are able to develop a fraud prediction model
that outperforms previously reported models that attempt to predict fraud using
publicly available information.
Cressey’s (1953) fraud risk theory provides the framework for
comprehensive evaluation of firms’ fraud risk factors. Using the examples cited in
prior fraud research and in SAS No. 99, we develop proxy variables for pressure,
opportunity and rationalization. We test these variables using conditional logit

21
analysis and a sample of fraud firms (i.e., firms that were the target of SEC fraud
enforcement) and a matched sample of no-fraud firms. This analysis identifies
two pressure variables (OWNERSHIP and 5%OWN) and three opportunity
variables (AUDCOMM, IND, and CEO) as being significant fraud risk factors.
The second objective of this study is to construct a fraud prediction model
using the fraud risk factor framework. For this purpose we use both MDA and
sensitivity analysis. MDA determines whether the model can be used to
accurately categorize firms into the fraud and no-fraud groups. Using a cross
validation procedure our model correctly classifies no-fraud firms 74.42 percent
of the time and correctly classifies fraud firms 65.12 percent of the time. Overall,
the model correctly classifies firms 69.77 percent of the time (the overall
misclassification rate of the model is 30.23 percent). These results represent a
substantial improvement over other fraud prediction models that have reported
success rates of 30 to 40 percent (Persons 1995; Kaminski et al. 2004).
Bankruptcy prediction models using a similar approach yielded accuracy rates of
between 40 and 50 percent (Kuruppu et al. 2003).
As a final step we perform sensitivity analysis on each of the five
significant fraud risk factor proxy variables. This analysis tests each variable’s
proportional relationship to the probability of being in the fraud group while
holding the other variables in the model at their mean. These results indicate that,
(1) as the proportion of independent audit committee members increases, the

22
probability of financial statement fraud is reduced; (2) when the proportion of
ownership held by managers who hold more than 5 percent of the outstanding
shares increases the probability of fraud increases; (3) when the firm does not
have an audit committee, the likelihood of fraud increases; (4) when the
proportion of insider ownership (management and directors) decreases, the
probability of being in the fraud group increases; and (5) when one individual
holds both the CEO and Chairman of the Board positions the incidence of fraud is
significantly higher than when the two positions are held by different individuals.
This research contributes to the literature by examining and identifying a
set of risk factors that are contemporaneously related to the incidence of fraud and
by using these factors to develop a fraud prediction model. The development of a
fraud prediction model based upon the fraud risk factors is of interest to
academics, standard setters, and users of financial statement data since, similar to
bankruptcy prediction research (Altman 1968; Allen and Chung 1998), it permits
the prediction of fraud based entirely on publicaly available information.

23
ENDNOTES
1 In tests involving small to moderate samples the likelihood ratio test is appropriate for
determining overall fit (Greene 2000).
2 Tests using all fraud risk factor proxy variables yielded similar results.
3 Among the proxies, 5%OWN and OWNERSHIP were the highest correlated variables at 55%
level. None of the variables were significantly correlated.

24
REFERENCES
Abbott, L., Y. Park, and S. Parker. 2000. The effects of audit committee activity
and independence on corporate fraud. Managerial Finance 26 (11): 55-67
Abbott, L. and S. Parker. 2001. Audit committees and auditor selection. Journal of Accountancy 191 (6): 95-96
Agrawal, A. and S. Chadha, 2005. "Corporate Governance and Accounting
Scandals". Journal of Law and Economics 48 (2): Forthcoming.
Albrecht, W. 2002. Fraud Examination. Mason, OH: Thomson-SouthWestern.
Allen, D. and J. Chung. 1998. A review of choice of model and statistical
techniques in corporate distress prediction studies.” Accounting Research Journal 11 (1): 245-269.
Altman, E. 1968. Financial ratios, discriminant analysis and the prediction of
corporate bankruptcy. Journal of Finance 35: 1001-1016.
American Institute of Certified Public Accountants (AICPA). 2002. Consideration
of fraud in a financial statement audit. Statement on Auditing Standards No. 99.
New York, NY: AICPA.
Beasley, M. 1996. An empirical analysis of the relation between the board of
director composition and financial statement fraud. The Accounting Review 71
(4): 443-465.
Beasley, M., J. Carcello, and D. Hermanson. 1999. COSO's new fraud study:
What it means for CPAs. Journal of Accountancy 187 (5): 12-14.
Beasley, M., J. Carcello, D. Hermanson, and P. D. Lapides. 2000. Fraudulent
financial reporting: Consideration of industry traits and corporate governance
mechanisms. Accounting Horizons 14 (4): 441-454.
Bell, T., S. Szykowny, and J. Willingham. 1991. Assessing the likelihood of
fraudulent financial reporting: A cascaded logit approach. Working Paper, KPMG
Peat Marwick, Montvale, NJ.

25
Beneish, M. 1997. Detecting GAAP violation: Implications for assessing
earnings management among firms with extreme financial performance. Journal of Accounting and Public Policy 16 (3): 271-309.
Committee of Sponsoring Organizations of the Treadway Commission (COSO).
1999. Fraudulent Financial Reporting: 1987-1997 – Analysis of US. Public Companies. New York, NY: COSO.
Cressey, D. 1953. Other People’s Money; a Study in the Social Psychology of Embezzlement. Glencoe, IL, Free Press.
DeAngelo, H., L. DeAngelo, and D. Skinner. 1994. “Accounting choice in
troubled companies. Journal of Accounting and Economics 17 (1): 113-143.
Dechow, P., R. Sloan, and A. Sweeney. 1996. Causes and consequences of
earnings manipulation: An analysis of firms subject to enforcement actions by the
SEC. Contemporary Accounting Research 13 (1): 1-36.
DeFond, M. and J. Jiambalvo. 1991. Incidence and circumstances of accounting
errors. The Accounting Review 66 (3): 643-655.
Dunn, P. 2004. The impact of insider power on fraudulent financial reporting.
Journal of Management, 30(3) 397-412.
Francis, J. and J. Krishnan. 1999. Accounting accruals and auditor reporting
conservatism. Contemporary Accounting Research 16 (2): 135-165.
Greene, W. 2000. Econometric Analysis, Prentice Hall, Upper Saddle River, New
Jersey, 256
Hair, J., R. Anderson, R. Tatham, and W. Black. 1995. Multivariate Data Analysis, 4
th ed., Prentice Hall, Englewood Cliffs, NJ.
Hosmer, D. W. and S. Lemeshow, 2000. Applied Logistic Regression, Second
edition, New York, NY: John Wiley and Sons, Inc.
Jones, F. 1987. Current techniques in bankruptcy prediction. Journal of Accounting Literature 1: 131-164.
Kaminski, K., T. Wetzel, and L. Guan. 2004. Can financial ratios detect
fraudulent financial reporting? Managerial Auditing Journal 19 (1): 15-28.

26
Kuruppu, N., F. Laswad, and P. Oyelere. 2003. The efficacy of liquidation and
bankruptcy models for assessing going concern. Managerial Auditing Journal 18
(6/7): 577-590.
Loebbecke. J., M. Eining, and J. Willingham. 1989. Auditors’ experience with
material irregularities: Frequency, nature, and detestability. Auditing: A Journal of Practice & Theory 9 (Fall): 1-28.
Persons, O. 1995, Using financial statement data to identify factors associated
with fraudulent financial reporting. Journal of Applied Business Research 11 (3):
38-46.
Press, E. and J. Weintrop. 1990. Accounting constraints in public and private debt
agreements: Their association with leverage and impact on accounting choice.
Journal of Accounting and Economics 12:65-95.
Robinson, D. 2002. Audit Committee Composition and Financial Reporting Problems. Stillwater, Oklahoma: Oklahoma State University.
St. Pierre, K., and J. Anderson. 1984. An analysis of the factors associated with
lawsuits against public accountants. The Accounting Review 59 (2): 242-263.
Stice, J. 1991. Using financial and market information to identify pre-engagement
factors associated with lawsuits against auditors. The Accounting Review 66 (3):
516-533.
Summers, S. and J. Sweeney. 1998. “Fraudulently misstated financial statements
and insider trading: An empirical analysis.” The Accounting Review 73 (1): 131-
146.
Vermeer, T. 2003. The impact of SAS No. 82 on an auditor’s tolerance of
earnings management. Journal of Forensic Accounting 5: 21-34.
Wells, J. 1997. Corporate Fraud Handbook: Prevention and Detection.
Hoboken, New Jersey: Wiley
27
TABLE 1
Examples of Fraud Risk Factors from SAS No. 99 Relating to Financial Statement
Misstatements
Pressures Opportunities Rationalizations 1. Financial stability or
profitability is threatened by
economic, industry, or entity
operating conditions:
• High degree of competition or
declining profit margins
• High vulnerability to rapid changes
(i.e., technology, obsolescence, or
interest rates)
• Declines in customer demand
• Operating losses
• Recurring negative cash flows
from operations
• Rapid growth or unusual
profitability
• New accounting, statutory, or
regulatory requirements
2. Excessive pressure exists for
management to meet requirements
of third parties:
• Profitability/trend expectations
• Need to obtain additional debt or
equity financing
• Marginal ability to meet exchange
listing requirements or debt
repayment or other debt covenant
requirements
• Likely poor financial results on
significant pending transactions.
3. Management or directors’
personal financial situation is:
• Significant financial interests in the
entity
• Significant performance based
compensation
• Personal guarantees of debts
4. There is excessive pressure on
management or operating
personnel to meet financial targets
set up by directors or
management.
1. Industry provides opportunities
for
• Related-party transactions beyond
ordinary
• A strong financial presence or
ability to dominate a certain
industry sector that allows the
entity to dictate terms or
conditions to suppliers or
customers
• Accounts based on significant
estimates
• Significant, unusual, or highly
complex transactions
• Significant operations across
international borders environments
and cultures
• Significant bank accounts in tax-
haven jurisdictions
2. Ineffective monitoring of
management allows
• Domination of management by a
single person or small group
• Ineffective board of directors or
audit committee oversight
3. There is a complex or unstable
organizational structure
• Difficulty in determining the
organization or individuals that
have control of company
• Overly complex structure
• High turnover of senior
management, counsel, or board
4. Internal control deficient
• Inadequate monitoring of controls
• High turnover rates or employment
of ineffective accounting, internal
audit, or information technology
staff
• Ineffective accounting and
information systems.
1. Attitudes/rationalizations by
board members, management, or
employees that allow them to
engage in and/or justify
fraudulent financial reporting
• Ineffective communication,
implementation, support, or
enforcement of ethics
• Nonfinancial management's
excessive participation in
selection of accounting principles
or the determining estimates
• Known history of violations of
securities laws or other laws
• Excessive interest in maintaining
or increasing stock price
• Aggressive or unrealistic forecasts
• Failure to correct known
reportable conditions on a timely
basis
• Interest by management in
employing inappropriate means to
min. reported earnings for tax
• Recurring attempts by
management to justify marginal or
inappropriate accounting on the
basis of materiality
• Strained relationship with current
or predecessor auditor
o Frequent disputes with the
current or predecessor auditor
o Unreasonable demands on the
auditor, such as unreasonable
time constraints
o Restrictions on the auditor that
inappropriately limit access
o Domineering management
behavior in dealing with the
auditor
28
TABLE 2
Fraud Risk Factor Proxies for Pressure
Fraud Risk
Factors
SAS No. 99
Categories Proxies Definition of proxies
Operating income – Cash flow from operationsTotal assets
SGROW Change in Sales – Industry Average Change in Sales
AGROWThe average percentage change in total assets for the two years
ending before the year of fraud.
SALAR Sales / Accounts Receivable
SALTA Sales / Total Assets
FREECNet cash flow from operating activities - cash dividends - capital
expenditures
LEVERAGE Total Debt / Total Assets
OWNERSHIPThe cumulative percentage of ownership in the firm held by
insiders.
5%OWNThe percentage of shares held by management who hold greater
than 5% of the outstanding shares.
Financial Targets ROA Return on assets
Pressures
Financial Stability
NICFOTA
External Pressure
Personal Financial
Need

29
TABLE 3
Fraud Risk Factor Proxies for Opportunity
Fraud Risk
Factors
SAS No. 99
Categories Proxies Definition of proxies
Nature of
IndustryFOROPS Foreign Sales / Total Sales
BOUTP The percentage of board members who are outside members.
AUDCOMMA dummy variable where 1 = mention of oversight by an internal
audit committee and 0 = no mention of oversight.
AUDCSIZE The size of the audit committee scaled by board size.
INDThe percentage of audit committee members who are
independent of the company.
AUDMEET The number of audit committee meetings held.
CEO
Indicator variable with a value of 1 if the chairperson of the
board holds the managerial positions of CEO or president; 0
otherwise.
OpportunityIneffective
Monitoring

30
TABLE 4
Fraud Risk Factor Proxies for Rationalization
Fraud Risk
Factors
SAS No. 99
Categories Proxies Definition of proxies
AUDCHANG
A dummy variable for change in auditor where 1 = change in
auditor in the 2 years prior to fraud occurrence and 0 = no change
in auditor.
AUDREPORT
A dummy variable for an audit where 1 = an unqualified opinion
and 0 = an unqualified opinion with additional language.
TATA
Total accruals/total assets, where total accruals are calculated as
the change in current assets, minus the change in cash, minus
changes in current liabilities, plus the change in short-term debt,
minus depreciation and amortization expense, minus deferred tax
on earnings, plus equity in earnings.
Rationalization Rationalization

31
TABLE 5
Industry Representation of Fraud Firms
SIC Code Industry Title
Number of
Fraud Firms
Percent of
Sample
13 Crude Petroleum & Natural Gas 1 1.16%
15 Operative Builders 1 1.16%
16 Heavy Construction Other Than Building Construction 1 1.16%
20 Food and Kindred Products 1 1.16%
22 Knitting Mills 1 1.16%
23 Apparel & Other Finished Products of Fabrics 4 4.65%
27 Periodicals: Publishing or Publishing & Printing 1 1.16%
28 Chemicals & Allied Products 3 3.49%
31 Footwear 1 1.16%
34 Metal Products 3 3.49%
35 Computers & Communication Equipment 10 11.63%
36 Electrical Equipment 6 6.98%
37 Truck & Bus Bodies, Transportation Equipment 2 2.33%
38 Controlling, Surgical, & Photographic Devices 7 8.14%
50 Wholesale-Computers, Electrical, & Software 4 4.65%
51 Wholesale-Drugs & Petroleum Products 2 2.33%
53 Retail-Variety Stores 1 1.16%
56 Retail-Shoe Stores 1 1.16%
58 Retail-Eating Places 1 1.16%
59 Retail- Catalog, Drug Stores and Proprietary Stores 5 5.82%
73 Services-Business, Computer, & Equipment 24 27.91%
79 Services-Miscellaneous Amusement and Recreation 2 2.33%
80 Services-Health Services 4 4.65%
TOTAL 86 100.00%

32
TABLE 6
Sample Statistics
($ in hundreds of thousands)
Fraud Firms No-Fraud Firms
Mean Mean
[Median] [Median]
(Standard Deviation) (Standard Deviation)
Total Assets 1,420.10 797.91
[108.52] [88.90]
(4,414.39) (2,892.58)
n=86 n=86
Net Sales 1,627.76 1,049.42
[93.62] [93.21]
(5,537.39) (4,137.71)
n=86 n=86
Note: Paired t-tests and Wilcoxon matched-pair sign-rank tests indicated no significant differences
(p=0.10) between the fraud and no-fraud firms based on total assets and net sales.

33
TABLE 7
T-tests and Wilcoxon Sign-Rank Tests
Variable Mean Std Dev Mean Std Dev T Value Pr > |t | Z Pr > |Z|
NICFOTA -0.04 0.15 -0.03 0.28 -0.290 0.772 -1.824 0.034
SGROW -39.17 362.12 81.87 1250.00 -0.860 0.391 -1.429 0.077
AGROW 155.30 663.76 333.56 1679.90 -0.920 0.362 -1.814 0.035
SALAR 11.78 25.99 20.02 113.07 -0.660 0.511 2.075 0.019
SALTA 1.42 1.49 1.19 0.88 1.250 0.214 1.983 0.024
FREEC 15.89 170.69 -9.16 112.47 1.140 0.258 3.236 0.001
LEVERAGE 0.20 0.25 0.21 0.22 -0.220 0.826 -0.785 0.216
OWNERSHIP 0.23 0.20 0.20 0.19 0.950 0.345 1.069 0.143
5%OWN 0.21 0.21 0.32 0.23 -3.040 0.003 -3.173 0.001
ROA -4.25 34.23 -9.40 42.61 0.870 0.383 0.522 0.301
FOROPS -0.02 0.37 0.04 0.18 -1.170 0.245 0.664 0.254
BOUTP 0.69 0.18 0.64 0.19 1.510 0.132 1.717 0.043
AUDCOMM 0.99 0.11 0.88 0.32 2.850 0.005 2.793 0.003
AUDCSIZE 2.84 0.99 2.64 1.29 1.130 0.262 1.173 0.121
IND 0.88 0.25 0.68 0.39 3.880 <0.001 3.719 <0.001
AUDMEET 2.04 1.81 1.86 1.70 0.650 0.515 0.646 0.259
CEO 0.59 0.49 0.71 0.46 -1.600 0.111 -1.593 0.056
AUDCHANG 0.09 0.29 0.12 0.32 -0.500 0.621 -0.494 0.311
AUDREPORT 0.19 0.39 0.26 0.49 -1.030 0.304 -0.814 0.208
TATA -3.57 22.69 -93.85 851.02 0.980 0.328 -0.801 0.212
Wilcoxon t
Approximation
NO-FRAUD
FIRMS FRAUD FIRMS t-statistic
34
TABLE 8
Fraud Risk Factor Variables (p<0.15)
Fraud Risk
Factors Proxies
Fraud Risk
Factors Proxies
NICFOTA
SGROW
AGROW BOUTP
SALAR AUDCOMM
SALTA AUDCSIZE
FREEC IND
OWNERSHIP CEO
5%OWN
Pressure Opportunity
35
TABLE 9
Logit Regression: Fraud Risk Factor From Univariate Analysis
FRAUDi = β1NICFOTA + β2SGROW + β3AGROW + β4SALAR +β5SALTA + β6FREEC + β7OWNERSHIP + β85%OWN + β9BOUTP + β10AUDCOMM + β11AUDCSIZE + β12IND + β13CEO + ε
Variable Estimate
Standard
Error Chi-Square Pr > ChiSq
NICFOTA 0.6565 0.9091 0.5215 0.4702
SGROW -0.0001 0.0003 0.0695 0.7920
AGROW 0.0002 0.0003 0.6031 0.4374
SALAR 0.0011 0.0027 0.1582 0.6909
SALTA -0.2192 0.2087 1.1033 0.2935
FREEC -0.0016 0.0014 1.4779 0.2241
OWNERSHIP -3.4538 1.3482 6.5623 0.0104 **
5%OWN 4.7031 1.1750 16.0220 <0.0001 ***
BOUTP 0.6576 1.0677 0.3794 0.5379
AUDCOMM -2.4540 1.4529 2.8529 0.0912 *
AUDCSIZE 1.3423 1.1454 1.3733 0.2413
IND -1.7294 0.6741 6.5826 0.0103 **
CEO 0.7323 0.3921 3.4885 0.0618 *
Liklihood-Ratio 46.4041 ***
*p <0.10; **p <0.05; ***p <0.01. Based on two-sided tests.

36
TABLE 10
Discriminate Analysis and Fraud Prediction
FRAUDi = α + β1OWNERSHIPi + β25%OWNi + β3AUDCOMMi + β4INDi + β5CEO + εi
No-Fraud % Fraud % Total Error
No-Fraud % 74.42 25.58 30.23
Fraud % 34.88 65.12
Cross-validation Method

37
FIGURE 1
Effect of Independent Audit Committee Membership on the
Probability of Fraud
Effect of Independence of Audit Committe Members
on the Probability of Being in the Fraud Group
0%
5%
10%
15%
20%
25%
30%
35%
40%
0% 20% 40% 60% 80% 100%
Proportion of Audit Committee Members that are
Independent of the Firm
Pro
bab
ilit
y o
f B
ein
g in
th
e
Fra
ud
Gro
up
Effect of Change in IND on probability of Fraud
Mean IND all firms
Fraud Firms IND Mean
No-Fraud Firms IND Mean
38
FIGURE 2
Effect of Management Ownership on the Probability of Fraud
Effect of Management Ownership (5%OWN ) on the
Probability of Being in the Fraud Group
0%
20%
40%
60%
80%
100%
0% 20% 40% 60% 80% 100%
Proportion of outstanding shares held by managers
holding at least 5 percent of the outstanding shares
Pro
bab
ilit
y o
f B
ein
g in
th
e
Fra
ud
Gro
up
Effect of Change in 5%OWN on probability of Fraud
Mean 5%OWN all firms
Fraud Firms 5%OWN Mean
No-Fraud Firms 5%OWN Mean

39
FIGURE 3
Effect of Ownership on the Probability of Fraud
Effect of Inside Ownership (OWNERSHIP ) on the
Probability of Being in the Fraud Group
0%
5%
10%
15%
20%
25%
30%
35%
40%
0% 20% 40% 60% 80% 100%
Proportion of Outstanding Shares Held by Insiders
(Directors, Managers, etc.)
Pro
bab
ilit
y o
f B
ein
g in
th
e
Fra
ud
Gro
up
Effect of Change in OWNERSHIP on probability of Fraud
Mean OWNERSHIP all firms
Fraud Firms OWNERSHIP Mean
No-Fraud Firms OWNERSHIP Mean

40
FIGURE 4
Effect of CEO/Chairman of the Board Positions on the Probability of Fraud
Effect of CEO and Chairman of the Board Position
being held by the same Individual (CEO ) on the
Probability of Being in the Fraud Group
0%
10%
20%
30%
40%
50%
Dummy Variable, where a value of 1 indicates the CEO
holds the Chairman of the Board title and a value of 0
indicates the title is not held.
Pro
bab
ilit
y o
f B
ein
g in
th
e
Fra
ud
Gro
up
The Effect of holding both the CEO and Chairman of the Board
Position at the same time on the probability of Fraud
10

41
FIGURE 5
Effect of having an Audit Committee on the Probability of Fraud
Effect of having an Audit Committee (AUDCOMM ) on
the Probability of Being in the Fraud Group
0%
10%
20%
30%
40%
50%
Dummy Variable, where a value of 1 indicates existence of
an Audit Committee and a value of 0 indicates no audit
committee.
Pro
bab
ilit
y o
f B
ein
g in
th
e F
rau
d
Gro
up
The Effect of having an Audit Committee on the probability of
Fraud.
10