ama marine · crude gas clean products chemical ... tankers designed specially for delivery...
TRANSCRIPT

AMA Marine
Public Company Limited
25 MAY 2017

2
Topics I. Company Background & Development
II. Nature of Business
III. Operation Result & Financial Position
IV. Investment Highlighted
V. Significant Investment

3
Establishment of AMA with Registered Capital of THB 1M
• Start International Marine Transportation (“Myanmar Route”)
• Registered capital Increase of THB 100M
Establishment of AMAL with registered Capital of THB 5M
• Expand Service Route to “The Philippines”
• Registered Capital Increase to THB 110M
Expand Service Route to “Vietnam”
• Expand Service Routes to East Asia
• Company Transformation to Public Company Limited
• Registered Capital to THB 215.80 M
1996 1999 2001 2002 2005 2009 2010 2012 2013 2014 2015 2016 1Q2017
2 4 4 5 4 3 4 6 5 5 6 7 8
3,814 10,245 13,861 16,791 14,266 11,440 16,203 23,781 18,876 18,876 23,699 33,641 56,731
5 43 100 120
0.23 1.94 4.50 5.40
No. of Tanker Vessels & Tanker Trucks
DWT
Loading capacity(Million liter
Registered Capital Increase to THB 12M
Register Capital Increase to THB 60M
Vessels
Trucks
1996 1998 1999 2001 2002 2003 2005
AMA Overall Revenues Come from International Transportation
2014
• AMAL’s Registered Capital Increase to THB 190M
• PTGLG enters into holding shares of 32.01%
2016
Being listed in MAI on 22 Dec 2016
Company Background & Development
4
Nature of Business
5
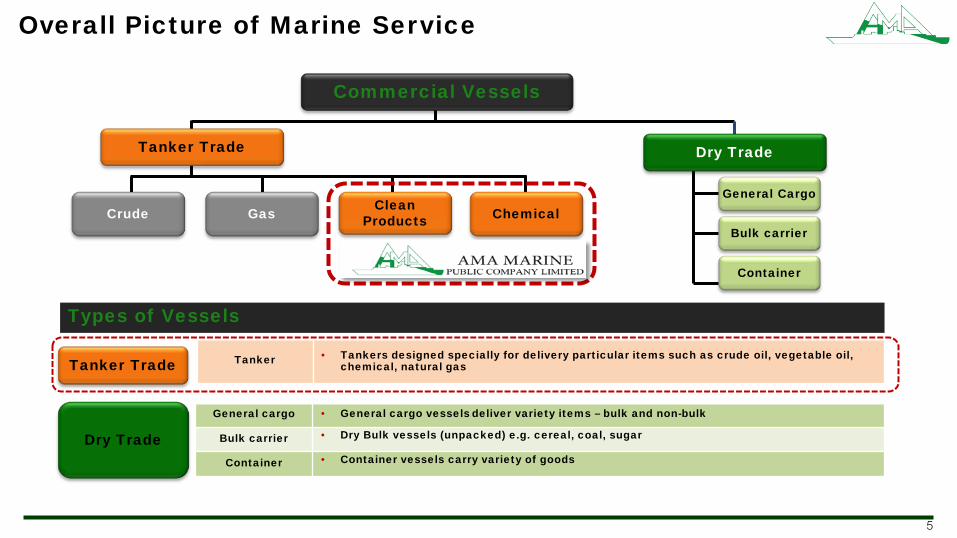
General cargo • General cargo vessels deliver variety items – bulk and non-bulk
Bulk carrier • Dry Bulk vessels (unpacked) e.g. cereal, coal, sugar
Container • Container vessels carry variety of goods
Crude Gas Clean Products Chemical
Commercial Vessels
Tanker • Tankers designed specially for delivery particular items such as crude oil, vegetable oil, chemical, natural gas
General Cargo
Bulk carrier
Container
Tanker Trade Dry Trade
Types of Vessels
Tanker Trade
Dry Trade
Overall Picture of Marine Service
6
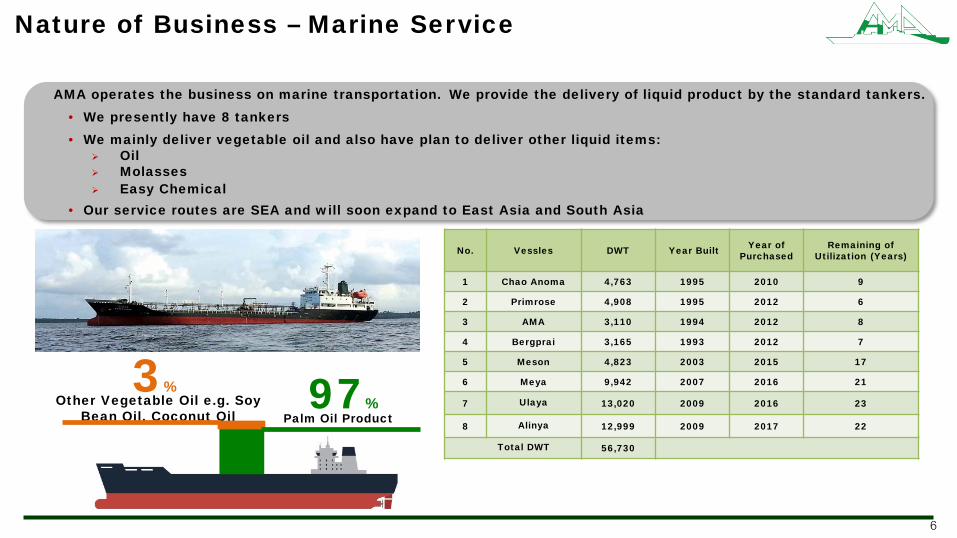
No. Vessles DWT Year Built Year of Purchased
Remaining of Utilization (Years)
1 Chao Anoma 4,763 1995 2010 9
2 Primrose 4,908 1995 2012 6
3 AMA 3,110 1994 2012 8
4 Bergprai 3,165 1993 2012 7
5 Meson 4,823 2003 2015 17
6 Meya 9,942 2007 2016 21
7 Ulaya 13,020 2009 2016 23
8 Alinya 12,999 2009 2017 22
Total DWT 56,730
AMA operates the business on marine transportation. We provide the delivery of liquid product by the standard tankers.
• We presently have 8 tankers
• We mainly deliver vegetable oil and also have plan to deliver other liquid items:
Oil
Molasses
Easy Chemical • Our service routes are SEA and will soon expand to East Asia and South Asia
Palm Oil Product 97% Other Vegetable Oil e.g. Soy
Bean Oil, Coconut Oil
3%
Nature of Business – Marine Service
7
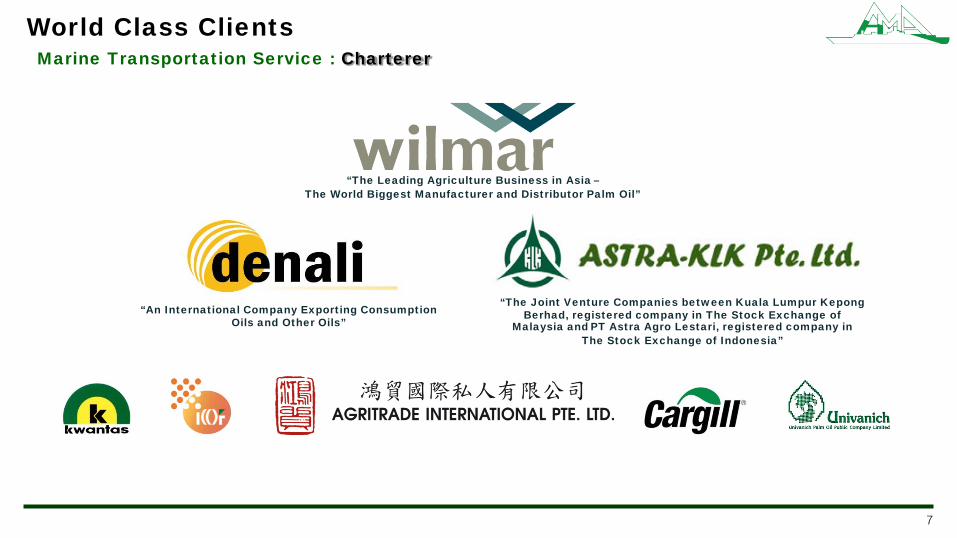
Marine Transportation Service : Charterer
“The Leading Agriculture Business in Asia –
The World Biggest Manufacturer and Distributor Palm Oil”
“An International Company Exporting Consumption Oils and Other Oils”
“The Joint Venture Companies between Kuala Lumpur Kepong Berhad, registered company in The Stock Exchange of
Malaysia and PT Astra Agro Lestari, registered company in The Stock Exchange of Indonesia”
World Class Clients

Globally Sources of Production and exporter of Palm
(Red color represents the countries that produce palm)
An estimate of the palm import in the following countries as at the
end of 2016
• The Company’s service routes in the area of palm production and import of the world
0.65
0.75
0.78
0.80
1.23
0.90
1.50
1.60
3.30
5.15
6.60
10.25
Turkey
Philippines
Vietnam
Russian Federation
United Stated
Myanmar
Bangladesh
Egypt
Pakistan
China
European Union
India
Palm Oil Imports (Tons)
Industrial Review
8

-
5
10
15
20
25
30
35
40
45
50
2012 2014 2016
India
Europe
China
Pakistan
Other
-
10
20
30
40
50
60
2012 2013 2014 2015 2016 1Q2017
Indonesia
Malaysia
Benin
Papua NewGuineaGuatemala
Other
- 10 20 30 40 50 60 70
2012 2013 2014 2015 2016 1Q2017
Indonesia
Malaysia
Thai
Columbia
Nigeria
Other
Producer of palm oil (Figures show the quantity of palm oil production)
Palm Oil Exporter
(Figures show the quantity of the import of palm oil)
Palm Oil Importer
(Figures show the quantity of the import of palm oil)
56.4
Mill
ion
Ton
s 59.3 61.6 59.4 65.5
43.1 43.2 47.5 45.6 48.0
42.2 42.0 44.6 45.3 46.8
Mill
ion
Ton
s
Mill
ion
Ton
s
The Growth of Palm Oil Industrial
9
62.79
47.66
42.9
10
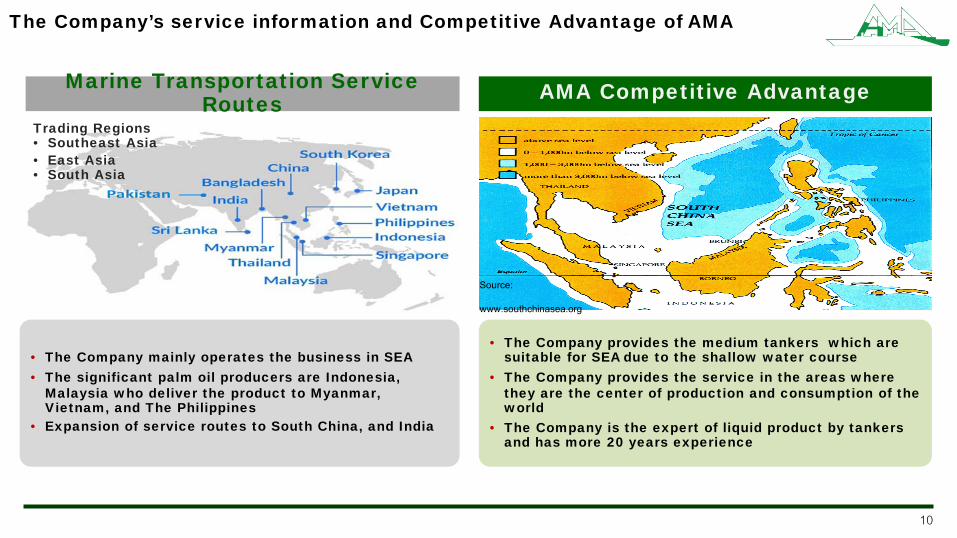
Trading Regions • Southeast Asia
• East Asia • South Asia
Marine Transportation Service Routes
AMA Competitive Advantage
• The Company mainly operates the business in SEA
• The significant palm oil producers are Indonesia, Malaysia who deliver the product to Myanmar, Vietnam, and The Philippines
• Expansion of service routes to South China, and India
• The Company provides the medium tankers which are suitable for SEA due to the shallow water course
• The Company provides the service in the areas where they are the center of production and consumption of the world
• The Company is the expert of liquid product by tankers and has more 20 years experience
Source:
www.southchinasea.org
The Company’s service information and Competitive Advantage of AMA
11
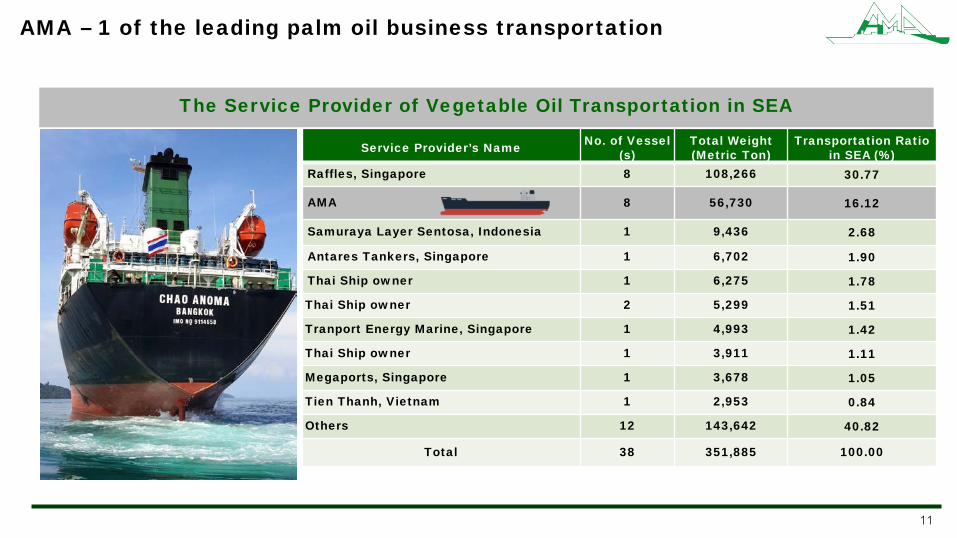
The Service Provider of Vegetable Oil Transportation in SEA
Service Provider’s Name No. of Vessel (s)
Total Weight
(Metric Ton) Transportation Ratio
in SEA (%)
Raffles, Singapore 8 108,266 30.77
AMA 8 56,730 16.12
Samuraya Layer Sentosa, Indonesia 1 9,436 2.68
Antares Tankers, Singapore 1 6,702 1.90
Thai Ship owner 1 6,275 1.78
Thai Ship owner 2 5,299 1.51
Tranport Energy Marine, Singapore 1 4,993 1.42
Thai Ship owner 1 3,911 1.11
Megaports, Singapore 1 3,678 1.05
Tien Thanh, Vietnam 1 2,953 0.84
Others 12 143,642 40.82
Total 38 351,885 100.00
AMA – 1 of the leading palm oil business transportation

12
Nature of Business
13
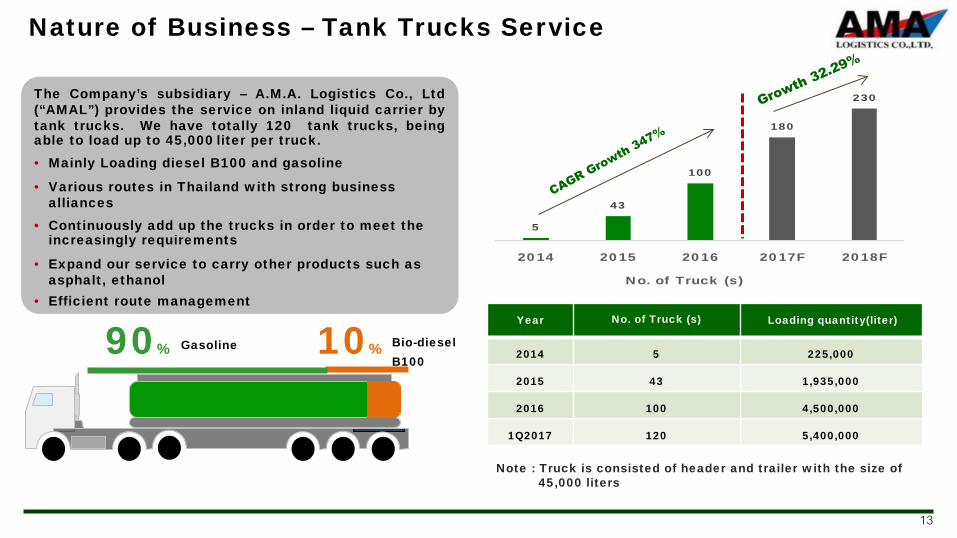
5
43
100
180
230
2014 2015 2016 2017F 2018F
No. of Truck (s)
Year No. of Truck (s) Loading quantity(liter)
2014 5 225,000
2015 43 1,935,000
2016 100 4,500,000
1Q2017 120 5,400,000
Note : Truck is consisted of header and trailer with the size of 45,000 liters
The Company’s subsidiary – A.M.A. Logistics Co., Ltd (“AMAL”) provides the service on inland liquid carrier by tank trucks. We have totally 120 tank trucks, being able to load up to 45,000 liter per truck.
• Mainly Loading diesel B100 and gasoline
• Various routes in Thailand with strong business alliances
• Continuously add up the trucks in order to meet the increasingly requirements
• Expand our service to carry other products such as asphalt, ethanol
• Efficient route management
10% Bio-diesel B100
90% Gasoline
Nature of Business – Tank Trucks Service
14
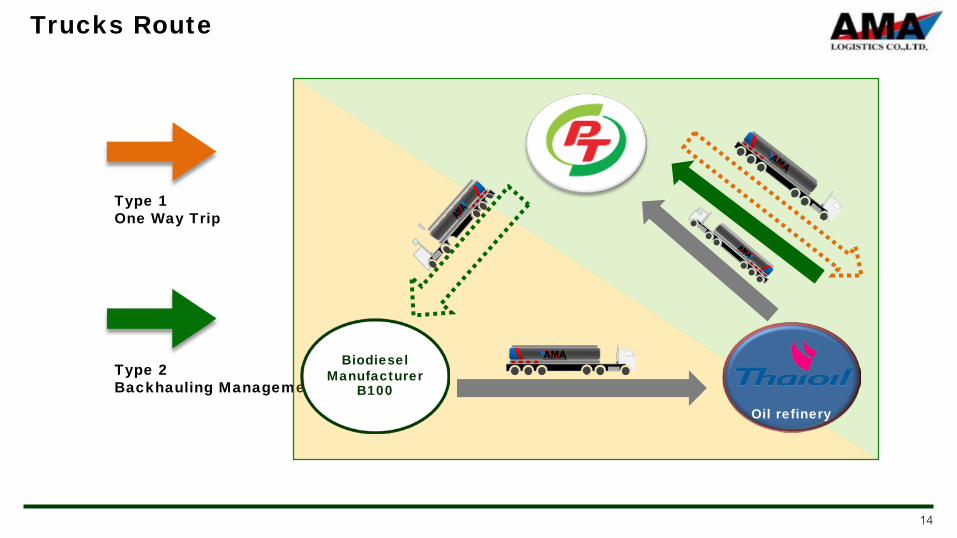
Type 2 Backhauling Management
Type 1 One Way Trip
Trucks Route
Biodiesel Manufacturer
B100
Oil refinery
15
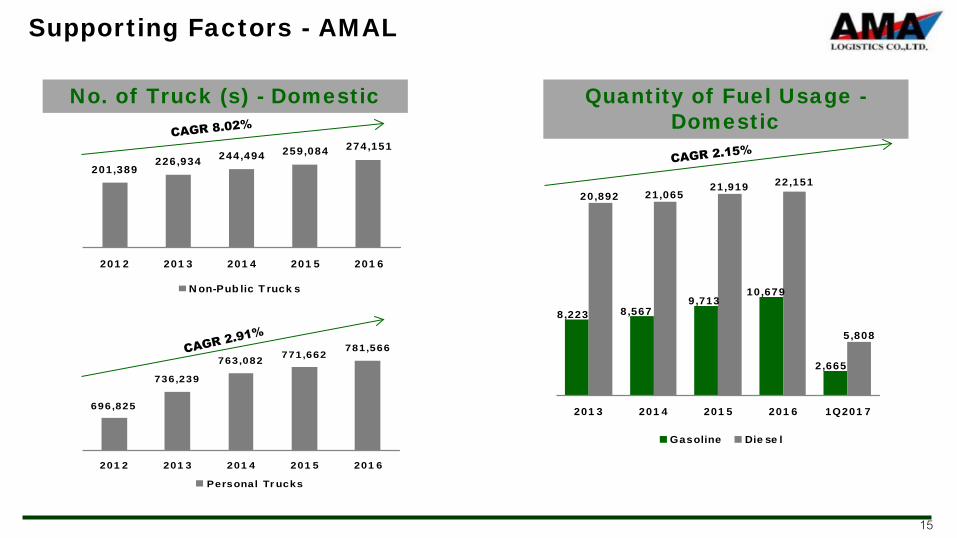
8,223 8,5679,713
10,679
2,665
20,892 21,06521,919 22,151
5,808
2013 2014 2015 2016 1Q2017
Gasoline Diesel
Quantity of Fuel Usage - Domestic
No. of Truck (s) - Domestic
201,389226,934 244,494 259,084 274,151
2012 2013 2014 2015 2016
Non-Public Trucks
696,825
736,239
763,082 771,662781,566
2012 2013 2014 2015 2016
Personal Trucks
Supporting Factors - AMAL

16
Operation Result & Financial Position

17
Total Asset Total LiabilityTotal shareholders'
equityOther Components
of equity
2016 3,260.21 1,160.70 2,099.50 59.341Q17 3,086.08 1,009.94 2,076.13 (21.09)
3,260.21
1,160.70
2,099.50
59.34
3,086.08
1,009.94
2,076.13
-21.09 -500
0
500
1,000
1,500
2,000
2,500
3,000
3,500(174.13)
(150.76)
(23.37)
(80.43)
(5.34%)
(12.99%)
(1.11%)
(135.54%)
Million Baht
Statements of financial position (Consolidated financial statements) – Convert to Baht

18
1,331 1,859
70
Asset - 2016
CurrentAsset
Fixed Asset
276
885
Liability - 2016
CurrentLiability
NonCurrentLiability
216
1,563
243
19 59
Equity - 2016
Share capital
Premium onshare capital
711
2,303
72
Asset - 1Q17
CurrentAsset 288
722
Liability – 1Q17
CurrentLiability
NonCurrentLiability
216 297
1,563
22 (21)
Equity – 1Q17 Share capital
Retainedearnings
Premium onshare capital
Statements of financial position (Consolidated financial statements) – Convert to Baht
19
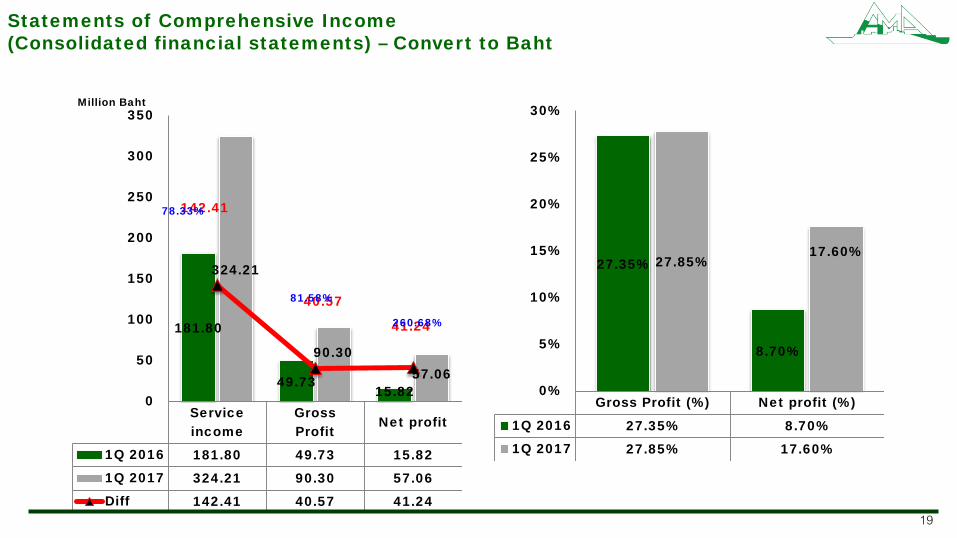
Serviceincome
GrossProfit
Net profit
1Q 2016 181.80 49.73 15.821Q 2017 324.21 90.30 57.06Diff 142.41 40.57 41.24
181.80
49.73 15.82
324.21
90.30 57.06
142.41
40.57
41.24
0
50
100
150
200
250
300
350Million Baht
78.33%
81.58%
260.68%
Statements of Comprehensive Income (Consolidated financial statements) – Convert to Baht
Gross Profit (%) Net profit (%)
1Q 2016 27.35% 8.70%1Q 2017 27.85% 17.60%
27.35%
8.70%
27.85% 17.60%
0%
5%
10%
15%
20%
25%
30%

20
USD convert to Baht
1Q17 2016 Different
Current Ratio (current assets / current liabilities) 2.47 4.83 (2.36)
Quick Ratio (current assets - Inventories / current liabilities) 1.99 4.72 (2.73)
Debt to Equity Ratio (Total liabilities / Total shareholders' equity) 0.49 0.55 (0.06)
Return on Asset (ROA) (Net profit / Total assets Avg.) 7.19 6.78 0.41
Return on Equity (ROE) (Net profit / Total shareholders' equity Avg.) 10.93 11.07 (0.14)
Return on Fixed Assets (Net profit +Depreciation / Total fixed assets Avg.) 18.57 19.34 (0.77)
Interest Bearing Debt (interest-bearing debt / Total shareholders' equity) 0.43 0.51 (0.08)
Ratio Analysis (Consolidated financial statements)
21
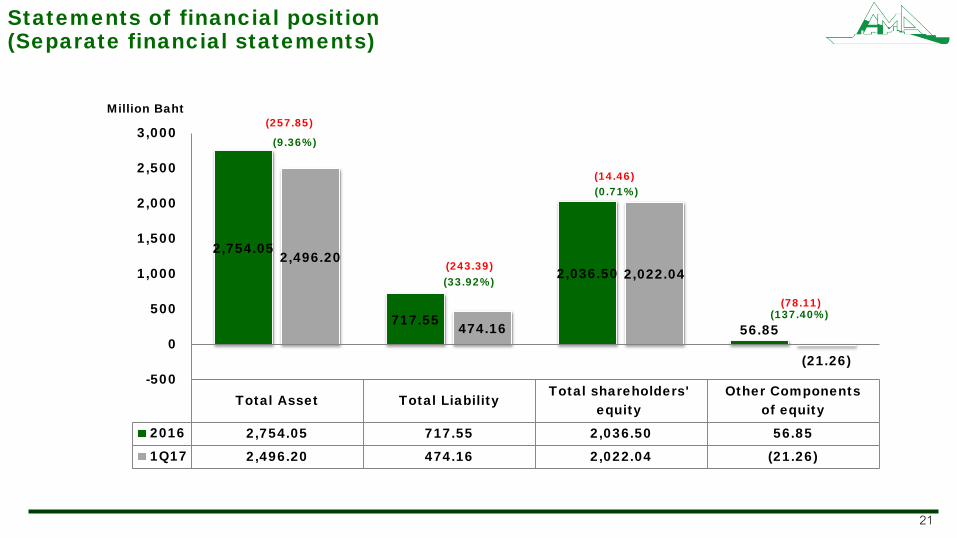
Total Asset Total LiabilityTotal shareholders'
equityOther Components
of equity2016 2,754.05 717.55 2,036.50 56.851Q17 2,496.20 474.16 2,022.04 (21.26)
2,754.05
717.55
2,036.50
56.85
2,496.20
474.16
2,022.04
(21.26) -500
0
500
1,000
1,500
2,000
2,500
3,000(257.85)
(243.39)
(14.46)
(78.11)
(9.36%)
(33.92%)
(0.71%)
(137.40%)
Million Baht
Statements of financial position (Separate financial statements)
22
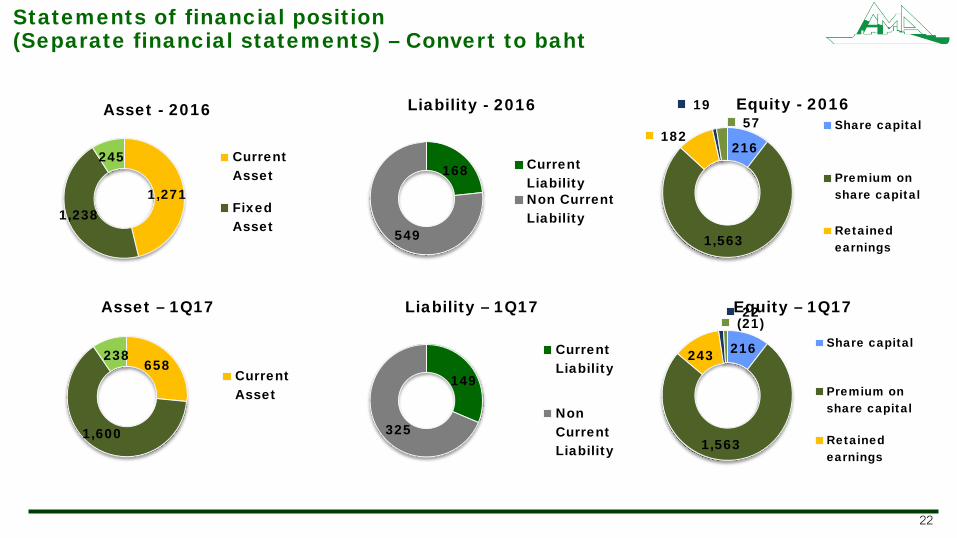
1,271 1,238
245
Asset - 2016
CurrentAsset
FixedAsset
168
549
Liability - 2016
CurrentLiabilityNon CurrentLiability
216
1,563
182
19 57
Equity - 2016 Share capital
Premium onshare capital
Retainedearnings
658
1,600
238
Asset – 1Q17
CurrentAsset
149
325
Liability – 1Q17
CurrentLiability
NonCurrentLiability
216
1,563
243
22 (21) Equity – 1Q17
Share capital
Premium onshare capital
Retainedearnings
Statements of financial position (Separate financial statements) – Convert to baht
23
Serviceincome
GrossProfit
Net profit
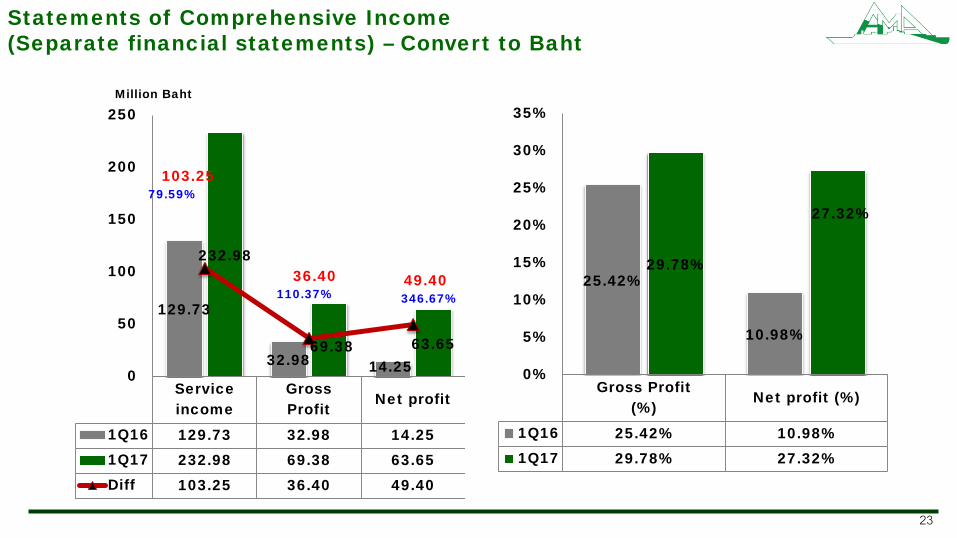
1Q16 129.73 32.98 14.251Q17 232.98 69.38 63.65Diff 103.25 36.40 49.40
129.73
32.98 14.25
232.98
69.38 63.65
103.25
36.40 49.40
0
50
100
150
200
250Million Baht
79.59%
110.37% 346.67%
Statements of Comprehensive Income (Separate financial statements) – Convert to Baht
Gross Profit(%)
Net profit (%)
1Q16 25.42% 10.98%1Q17 29.78% 27.32%
25.42%
10.98%
29.78%
27.32%
0%
5%
10%
15%
20%
25%
30%
35%

24
Total Asset Total LiabilityTotal shareholders'
equity2016 684.30 444.80 239.491Q17 787.23 538.73 248.50
684.30
444.80
239.49
787.23
538.73
248.50
0
100
200
300
400
500
600
700
800
900
3.76%
Million Baht
Statements of financial position - Baht
102.93
93.93
9.01
15.05%
21.12%

25
60
601
23
Asset - 2016 CurrentAsset
FixedAsset
108
337
Liability - 2016
CurrentLiability
NonCurrentLiability
190
49
Equity - 2016
Sharecapital
Retainedearnings
53
709
25
Asset – 1Q17
CurrentAsset
FixedAsset
140
398
Liability – 1Q17
CurrentLiability
NonCurrentLiability
190
59
Equity – 1Q17
Sharecapital
Retainedearnings
Statements of financial position – Baht
Serviceincome
GrossProfit
Gain(Loss) OnExchange
Rate
Net profit
Net profitwithout
Gain(Loss) OnExchange
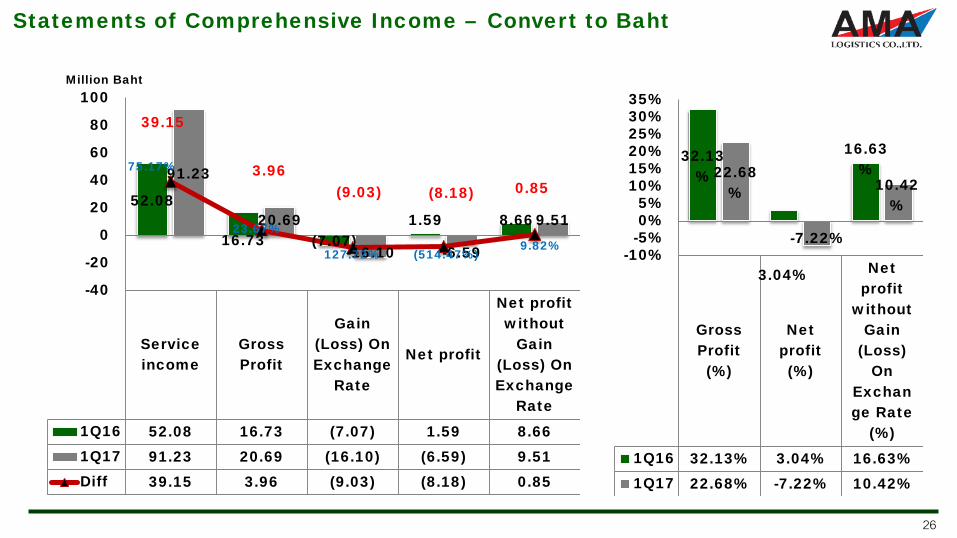
Rate1Q16 52.08 16.73 (7.07) 1.59 8.661Q17 91.23 20.69 (16.10) (6.59) 9.51Diff 39.15 3.96 (9.03) (8.18) 0.85
52.08
16.73 (7.07) 1.59 8.66
91.23
20.69
-16.10 -6.59
9.51
39.15
3.96 (9.03) (8.18) 0.85
-40
-20
0
20
40
60
80
100Million Baht
75.17%
23.67%
127.72%
Statements of Comprehensive Income – Convert to Baht
GrossProfit(%)
Netprofit(%)
Netprofit
withoutGain
(Loss)On
Exchange Rate
(%)1Q16 32.13% 3.04% 16.63%1Q17 22.68% -7.22% 10.42%
32.13%
3.04%
16.63% 22.68
%
-7.22%
10.42%
-10%-5%0%5%
10%15%20%25%30%35%
26
(514.47%) 9.82%

27
Revenue structure 1Q16 1Q17
Million Baht % Million Baht %
International liquid logistic service
Service income 116.25 63.94 221.45 68.30
Demurrage charge 13.48 7.41 11.53 3.56
Total revenue from tankers 129.73 71.36 232.98 71.86
Domestic land logistic service
Service income 52.07 28.64 91.23 28.14
Total revenue from tank trucks 52.07 28.64 91.23 28.14
Total revenue from services 181.80 100.00 324.21 100.00
Revenue Breakdown
28
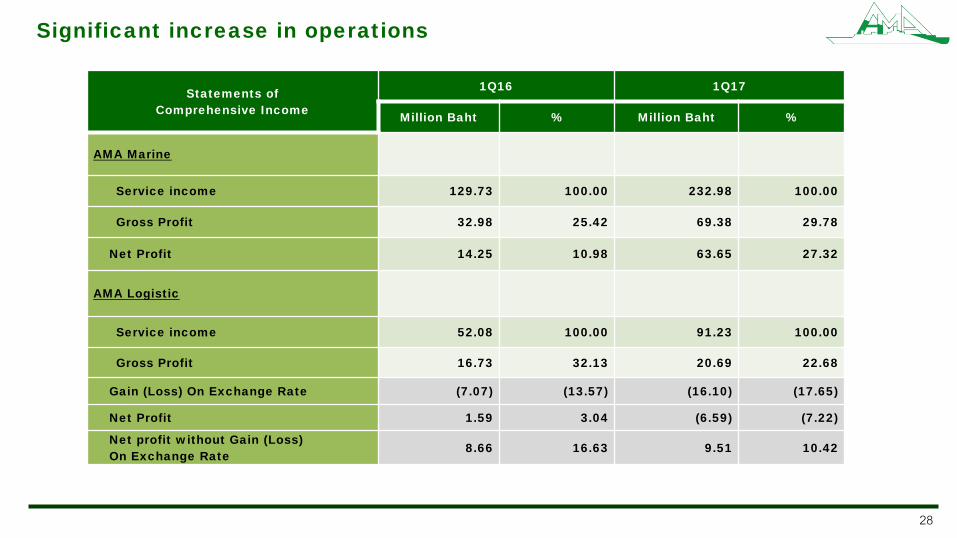
Statements of Comprehensive Income
1Q16 1Q17
Million Baht % Million Baht %
AMA Marine
Service income 129.73 100.00 232.98 100.00
Gross Profit 32.98 25.42 69.38 29.78
Net Profit 14.25 10.98 63.65 27.32
AMA Logistic
Service income 52.08 100.00 91.23 100.00
Gross Profit 16.73 32.13 20.69 22.68
Gain (Loss) On Exchange Rate (7.07) (13.57) (16.10) (17.65)
Net Profit 1.59 3.04 (6.59) (7.22)
Net profit without Gain (Loss) On Exchange Rate 8.66 16.63 9.51 10.42
Significant increase in operations
29
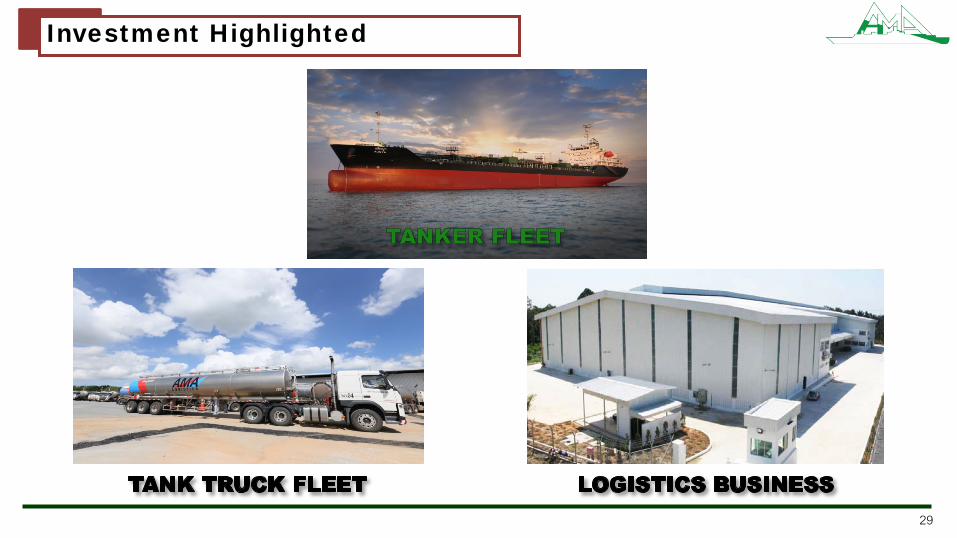
Investment Highlighted

30
The Continued Growth of Total Revenue
Continued Growth of Revenue from marine transportation
Outstanding Growth of Revenue from inland transportation
High Gross Profit
Good Level of Net Profit
Strong Financial Status D/E is at low level of 0.49
Outstanding of Future Project to Expand the Business Both marine and inland that allow the Company to extend the service routes, variety of delivery goods including backhauling service that will continuously drive the revenue.
Significant Investment

31
Q & A