ama q2 2010 report
DESCRIPTION
TRANSCRIPT

2010 Second Quarter Report
TSX.V: AMA

Letter to the Shareholders
To Our Shareholders,
While we are not at proud of our Q2 financial results, we are pleased to report on a number of developments that will reward us and you for staying the course with our strategy.
While the global economic recovery is delayed and will apparently take time to return to previous levels, recovery in parts of the aviation industry has begun, which will unlock funds for purchases of afirsTM UpTimeTM over the next 6-24 months. I just returned from the Farnborough International Air Show where we exhibited with our partner L-3 Communications. At the show, there were many signs of market improvement with new airplane orders, aftermarket product and services up ticks, and a renewed optimism. Major airlines are reporting profits, air cargo traffic is picking up again, and business aircraft utilization is recovering. Therefore, financial footing is being established in the industry for an acceleration of our growth.
During the period that the industry has been slowly regaining its financial health, we have been actively building the foundation for our future – in the marketplace, in our technology development, and in our staff and processes. For example, the AerCap relationship announced in February, although delayed by events in Europe, will, when consummated, engage us with a major lessor and Airbus, as well as providing a launch of our afirs 228 product that is fully compliant with Europe’s new regulations. Also in Europe in Q2, we successfully completed the in-service-evaluation of afirs UpTime on an aircraft owned by the world’s largest fleet operator of business aircraft, demonstrating an impressive array of financial and operational benefits that establish a solid business case for equipping that fleet.
Our team, in cooperation with CMC Electronics, has successfully completed upgrades of several C-130 Hercules aircraft and the military end customer formally accepted the first 2 (of 20) upgraded aircraft in July, establishing the credibility of afirs UpTime and AMA in that market space. Finally, moving half way around the globe, the long-awaited approval to use Iridium for commercial aviation in China has occurred and we are now receiving orders as operators in China start to train installation teams. In the last 6 weeks, we have received orders for 4 kits from 2 airlines, have received payment for and shipped 3. We also recently made a trip to China to demonstrate the fully functional systems. FLYHTStreamTM and FIRSTTM are of keen interest to both our end users and the government. The plan is for each airline to build out by fleet type until all of their planes have afirs installed. We are cautiously optimistic that the full roll out in China has commenced.
Our sales strategy is being revised to target specific industry segments with tailored solutions. The Bombardier Dash-8 Operators Conference in June was the first industry event where we rolled out this new approach, and it has already produced results with a contract for 34 aircraft signed July 28 with one of the largest and most active airlines in Scandinavia. An important Middle East customer installed its first 3 (of 10) systems after a year of bureaucratic delay and will increase its order as its
P. 2
fleet expands. In Nigeria, the stage is set for success with our hard-fought win to provide the first-ever flight tracking center for Nigerian airspace. Also in Africa in July we signed a second airline contract that was driven by flight tracking requirements.
On the technology side, our unique data streaming technology, FLYHTStreamTM has been validated by two independent working groups in Europe, the Oceanic Position Tracking Improvement Management Initiative (OPTIMI) for improved tracking of aircraft, and the French Bureau d’ Enquetes et d’ Analyses (BEA) team investigating the tragic accident of Air France 447. We received considerable attention from the industry during and after the Farnborough Air Show as a result of the positive reports from these independent evaluations.
On the operations front, we have strengthened our software development and program management competencies and team which will allow us to better meet the growing demands of our customer base. Our cash invested includes programmed one-time development expenditures on the new afirs 228 which are necessary to get this critical product to market in a timely manner. As the order book rebuilds, shipments ramp up, and our major product development project gets completed, the pressure on financial resources will be reversed accordingly.
We want to thank our shareholders for their confidence and patience, and our staff and industry partners for their superb and steady efforts during these challenging times for aviation. We are doing our best to reward your commitment to our team and company.
Yours truly,
Richard E. Hayden
President
P. 3

Management Discussion & Analysis This management discussion and analysis (“MD&A”) is as of August 12, 2010 and should be read in conjunction with the unaudited interim consolidated financial statements of AeroMechanical Services Ltd. (“AMA” or the “Company”) for the six months ended June 30, 2010 and the accompanying notes. Additional information with respect to AMA can be found on SEDAR at www.sedar.com which is supplemental to the unaudited interim consolidated financial statements and notes for the six month period ended June 30, 2010.
Overview AMA is a designer, developer and service provider of patented innovative solutions to the global aerospace business. The Company’s solutions are designed to improve the productivity and profitability of our customers’ assets.
The major products and services of the Company are:
afirs UpTime: afirs stands for Automated Flight Information Reporting System (afirs™) and is a flight data recorder that automatically records aircraft operational parameters, compiles and interprets the data, and sends summary information to UpTime™, the server on the ground anywhere, anytime, in real-time.
FLYHT Fuel Management System: a tool that allows key decision makers to efficiently manage and understand fuel usage within their airline operation.
FIRST: the Fuel initiative Reporting System Tracker (FIRST™) can work as part of or separately from the FLYHT Fuel Management System to help airlines measure and manage fuel usage.
FLYHTStream™: an emergency data streaming mode that streams real-time data to the ground to be analyzed immediately.
aeroQ™: a cabin cleaning system that is designed to reduce the risk of infection from surfaces in passenger aircraft due to biofilm infestations.
Underfloor Stowage Unit: offers the flight crew additional stowage space in the cockpit for manuals and safety equipment that they can reach throughout the flight.
These products and services are marketed and supported globally by a team of several employees and agents based in Canada (Calgary and Ottawa), United States (Boston, Atlanta and Portland), United Kingdom, Ireland, France, Switzerland, India, United Arab Emirates and Argentina. One of the Calgary staff is currently spending 95% of his time in China working on opportunities there.
Non-GAAP Financial Measures The Company reports its financial results in accordance with generally accepted accounting principles (GAAP). It also occasionally uses certain non-GAAP financial measures, such as working capital, modified working capital and cash revenue. AMA defines working capital as current assets less
P. 4

current liabilities. The Company defines modified working capital as current assets less current liabilities not including customer deposits or the current portion of unearned revenue. AMA defines cash revenue as financial statement revenue plus arrangement consideration received during the period that has not yet been recognized as revenue in the period due to the required revenue recognition criteria not yet being satisfied. These non-GAAP financial measures are always clearly indicated. The Company believes that these non-GAAP financial measures provide investors and analysts with useful information so they can better understand the financial results and perform a better analysis of the Company’s growth and profitability potential. Since non-GAAP financial measures do not have a standardized definition, they may differ from the non-GAAP financial measures used by other companies. The Company strongly encourages investors to review its financial statements and other publicly filed reports in their entirety and not rely on a single non-GAAP measure.
Looking Forward The Company continues to improve and expand its products and services, develop its sales network around the world, and improve its delivery capacity and productivity.
During the second quarter, the Company witnessed signs of a modest increase in capital expenditures across the international aviation industry which resulted in customer payment or shipment for 10 kits. On the shipment side there appears to be long awaited movement on the China agreement with the payment or shipment for 3 kits in the quarter. During the second quarter the Company continued to negotiate with potential customers but given the complex nature of the service offering no new contracts were executed. Since the end of the quarter two agreements have been executed for an aggregate of 36 aircraft with a total estimated potential revenue of USD $4,558,360 over the five year terms of the agreements if AMA is able to install on all contracted aircraft and provide recurring services for the full term of the agreements.
In addition, the Company continues to meet the needs of the aviation industry through the introduction of value-added information products and specialty services that can build customer value and AMA revenues from existing installations as well as new ones. Three areas of concentration continue to be the essential flight data recorder data streaming, fuel management program and related product enhancements, and fee-for-service consulting services. The Company views these initiatives as enhancing the value added to the industry and as strengthening the monthly recurring revenue base.
Various strategic relationships with leading organizations leverage our marketing capability world wide. The teaming and seller agreement with L-3 Communications (“L-3”) gives AMA access to the sales network of the industry-leading manufacturer of flight data recorders (black boxes). The L-3 agreement will allow AMA and L-3 to market and sell a bundled solution to the airline industry and AMA will be the exclusive provider to L-3 of Iridium based real-time solutions. The partnership agreement with GuestLogix Inc. (TSX: GXI) allows for the joint marketing and selling of their real-time credit and debit card transaction processing to the airline industry. The license and manufacturing agreement with Sierra Nevada Corporation (“SNC”) gives SNC the right to manufacture the Company’s afirs product and market the afirs UpTime technology and products to the global military market. AMA’s strategic relationship with Meggitt plc (MGGT:L) is to jointly market both companies’
P. 5
solutions to airlines and the military. These agreements provide AMA with a higher standard of credibility within the global aviation community and with access to prime contracts and airframe manufacturers.
Results of Operations – Three Months Ended June 30, 2010
Revenue
As shown in the Summary of Quarterly Results Table (on page 9), afirs and UpTime revenue as well as other revenue consisting of consulting services, license fees, and interest revenue are producing the expected results. The Company’s long term investment in marketing and relationship building has given the Company a strong pipeline of prospective clients around the world. The ongoing revenue streams from our existing client base is expected to continue to expand throughout this and future years. The installation delays associated with customers’ decisions to install afirs during heavy maintenance continue to delay revenue recognition, but they represent captive long-term recurring revenue.
The Company has two types of revenue streams relating to afirs equipment depending on the type of service agreement: (1) rental and (2) sales. In accordance with the Company’s revenue recognition policy for rental type agreements, the arrangement consideration is deferred as unearned revenue and revenue is recognized over the initial term of the contracts. In the early stages of the Company’s growth, this will result in less recognized revenue than cash received. For sales type agreements, afirs fees are deferred as unearned revenue and corresponding expenses are recorded as work in progress. When the system is fully functional and the customer has accepted the system, the deferred amount is fully recognized in revenue along with the work in progress as cost of sales. Under both forms of agreement, UpTime usage fees are recognized as the service is provided based on actual customer usage each month. For the Sierra Nevada Corporation (“SNC”) license fee, the amount received is deferred as unearned revenue and revenue is recognized over the initial 5 year term of the agreement.
AMA received $1,704,791 in cash revenues in the quarter with $1,281,147 reported as revenue and $423,643 being included in unearned revenue, which compares to $2,783,947 in cash revenue in the second quarter of 2009 with $1,324,004 reported as revenue and $1,459,943 being included in unearned revenue. The decrease in cash revenue was primarily due to the lower level of paid for kits or shipments.
Revenue decreased $42,857 in the second quarter compared to the second quarter of last year. afirs UpTime revenues increased by $8,004 over the second quarter of 2009 as the result of increased monthly recurring revenue, recognition of sales type agreements, and the addition of monthly revenues from former Wingspeed customers. Product sales revenue decreased by $70,057 as the result of decreased sales of Under Floor Stowage Units when compared to the second quarter of 2009 as a result of a decreased emphasis on the sales and marketing of the product and the concentration of efforts on AMA’s core afirs UpTime product line. Services revenue and interest increased $19,196 over the second quarter of 2009 as the result of increased requirements for consulting and engineering services by existing customers and interest earned on cash balances.
P. 6

Revenue is expected to grow at a higher rate than costs because the Company has the infrastructure, sales people, and support organization in place to support revenue growth. The industry recognition of the afirs UpTime product innovation has allowed AMA to continue to be active at several leading industry events. This shows that AMA’s products and services are being recognized as leading edge in this industry. In addition, the Company continues to grow its service offerings such as fuel management which has the potential to increase both monthly recurring and one-time services revenue.
Cost of Sales and Gross Margins
AMA’s cost of product sales includes the direct cost of the afirs kit, installation, and training support labour as well as associated travel and shipping expenses. Installations on aircraft are performed by third parties at the customer’s expense. Fuel management consulting costs are primarily-labour and travel-related. The percentage cost of sales in the second quarter of 2010 is 41.7% compared to 34.2% in 2009. This increase is due to the fluctuation between quarters in the mix of revenue coupled with the change to sales type agreements. As well, decreased recurring revenue as a percentage of total revenue during the quarter will increase cost of sales as a percentage of total revenue since the cost of sales for recurring revenue is lower than that for afirs shipments and its corresponding non-routable supplies and support.
The gross margin comparison for the past eight quarters is 58.3% for Q2 2010 compared to 59.3% for Q1 2010, 64.6% for Q4 2009, 45.6% for Q3 2009, 65.8% for Q2 2009, 51.5% for Q1 2009, 38.1% for Q4 2008, and 67.0% for Q3 2008.
Net Loss, General Administrative and Marketing Expenses
The net loss in the quarter ending June 30, 2010 was $2,548,584 compared to a loss of $1,333,969 in the same quarter of 2009, which is an increase of $1,214,615. This increase is primarily due to decreased gross margin of $124,700 coupled with increased salaries and benefits of $157,330, increased general and administrative expenses of $16,844, increased research and development of $947,174, increased marketing of $116,082, decreased bad debt expense of $35,524, increased amortization of $13,957, decreased stock based compensation of $76,235, and decreased foreign exchange loss of $54,377. If the direct costs associated with research and development, including the extensive development of the next generation afirs 228, were adjusted for the loss for the second quarter of 2010 would be $1,370,475 or an increase of $267,441 compared to the second quarter of 2009.
Marketing expenses increased by $116,082 to $200,413 over the second quarter in 2009. These figures do not include salaries, and are indicative of the focus of the sales and marketing team on developing new business opportunities using both face to face communications and technology to meet the needs of potential customers while minimizing the costs associated with marketing to the global aviation industry. We expect that expenses in marketing will remain the same or increase into the future as the Company’s focus is on generating new customers. The promotion of the product line to potential customers benefits from face to face meetings to build confidence of, and relationships with, future customers which creates the need for travel for senior staff to close the agreement. As
P. 7

the aviation industry rebounds and the demand for the Company’s products and services increases, there is an anticipation that marketing costs will increase.
Salaries continue to be the main cost of doing business for AMA. We provide sophisticated technical products and services that our customers rely on for timely support of their fleets. A highly-qualified and motivated staff, scaled to the size of the customer base, is essential in meeting these expectations and achieving a reputation of dependability in the industry to facilitate our growth. The Company maintains staffing levels to meet these objectives. As a result of corporate objectives, opportunities and the development of the afirs 228, salaries and benefits increased by $157,330 from $1,026,055 in the second quarter of 2009 to $1,183,385 in the second quarter of 2010.
Stock based compensation in the second quarter of 2010 was $231,115 versus $307,350 in the corresponding period of 2009 due to 955,000 stock options being granted at a fair value of $0.24 versus 1,500,000 at a fair value of $0.21 in the same quarter of 2009.
Bad debt expense decreased $35,524 from the second quarter of 2009 as the result of management’s assessment of the collectability of accounts.
General and administrative expenses increased by $16,844 to $431,601 compared to $414,757 in the first quarter of 2009 due mainly to increased legal costs of $47,724 related to the ongoing action which was offset by a reduction in general office expenses of $21,448 and occupancy expenses of $8,211.
Research and Development
Research and development costs for the second quarter of 2010 were $1,178,109 as compared to $230,935 in 2009, an increase of $947,174. The increase during the quarter is the result of the full scale commencement of the development of the next generation afirs product (“afirs 228”) in collaboration with SNC. It is anticipated that this level of development will continue throughout 2010 and 2011 as the afirs 228 and other products are brought to market. If the direct costs associated with research and development initiatives were removed from the calculation of net loss and cash flow the Company’s net loss for the second quarter would be $1,370,475 and the cash outflow from operations would be $910,827. The majority of these costs are consulting, testing, certification, and other expenses and do not include internal labour costs.
Foreign Exchange
The Company is susceptible to foreign exchange fluctuations resulting from the significant portion of its revenues being generated in U.S. dollars. The downward fluctuation of the Canadian dollar, and the fact that a majority of the Company’s accounts receivable are denominated in United States dollars, would have resulted in foreign exchange losses but purchases of U.S. dollar denominated services and supplies offsets these losses creating an overall foreign exchange loss of $9,426 in the second quarter of 2010 as compared to foreign exchange loss of $63,803 for the same period in 2009.
P. 8

Summary of Quarterly Results
Q3-08 Q4-08 Q1-09 Q2-09 Q3-09 Q4-09 Q1-10 Q2-10
Revenue (cash) $ 1,498,481 $ 1,934,462 $ 2,828,469 $ 2,783,947 $ 1,133,796 $ 725,565 $ 1,338,670 $ 1,704,791
Revenue (GAAP) 789,994 1,392,671 1,253,932 1,324,004 1,521,894 1,006,664 1,112,876 1,281,147
Loss 1,814,010 1,912,469 1,299,036 1,333,969 717,268 1,189,445 2,068,591 2,548,584
Loss/Share $ 0.02 $ 0.02 $ 0.02 $ 0.02 $ 0.01 $ 0.01 $ 0.02 $ 0.02
Results of Operations – Six Months Ended June 30, 2010
Revenue
Revenues decreased by $183,913 in the first six months compared to the same period of 2009. afirs Uptime revenues increased by $106,684 over the same six month period of 2009. Product sales revenues decreased by $215,564 and license fees and interest decreased by $75,033 compared to the corresponding six month period of 2009. Cash revenue for the first six months of 2010 was $3,403,461 compared to $5,612,416 in the same period of 2009, a decrease of $2,208,955.
Cost of Sales and Gross Margins
Percentage Cost of Sales in the first six months of 2010 is 41.2% of sales compared to 41.1% in the same period of 2009. This consistent cost of sales is due to a consistent level of afirs Uptime revenue during the six month period and the ability of AMA to keep costs relatively constant. This has resulted in a gross margin in the first six months of 2010 of 58.8% versus 58.9% in the same period of 2009.
Net Loss, General Administrative and Marketing Expenses
The net loss in the six month period ending June 30, 2010 was $4,617,175 compared to a loss of $2,633,005 in the same six month period of 2009, which is an increased loss of $1,984,170. This increase is primarily due to the decreased revenue in 2010 of $183,913 coupled with increased research and development of $1,556,181, increased salaries and benefits of $339,278, increased marketing expenses of $142,556, decreased stock-based compensation of $65,016, decreased general and administration expenses of $146,332, increased bad debts of $93,513, and decreased foreign exchange currency loss of $78,663. The overall increase in expenses during the first six months ended June 30, 2010 versus the corresponding six month period of 2009 is primarily the result of initiatives related to the development of the afirs 228 which if the direct costs associated with those initiatives plus other research and development were removed the net loss for the first six
P. 9
months of 2010 would be $3,060,994 versus $2,202,474 for the same period of 2009, an increase of $858,518. Stock based compensation decreased due to a decreased number of options being granted at reduced average fair market values. The increase in bad debts is the result of the receivership of two airline customers.
Research and Development
Research and development costs for 2010 were $1,986,712 as compared to $430,531 in 2009, an increase of $1,556,181, which is primarily the result of the initiatives related to the development of the afirs 228. There is also ongoing design, testing, and certification of afirs and UpTime to add aircraft types to its approved installation list and the addition of service offerings such as FIRST, FLYHT Fuel Management System and FLYHTStream.
Liquidity and Capital Resources
As of June 30, 2010 the Company had working capital of $2,777,722 compared to negative working capital of $35,718 in the same period of 2009 an increase of $2,813,440. The increase in the working capital is attributed primarily to an increase in cash of $2,816,304, increased accounts receivable of $197,376, increased prepaid and deposits of $5,333, increased inventory of $411,661, increased accounts payable of $287,971, an increase in the current portion of unearned revenue of $241,210, an increase in the current portion of loans payable of $46,733 and an increase in the current portion of obligation under capital leases of $41,320.
The payables at June 30, 2010 include customer deposits totaling $692,741 compared to $1,253,516 in the same period of 2009, a decrease of $560,775. As well, the current portion of unearned revenue increased $241,210 to $1,664,263 at June 30, 2010. Neither the customer deposits nor current portion of unearned revenue are refundable and if they were not included in the working capital calculation, the resulting modified working capital at June 30, 2010 would be $5,134,726 compared to $2,640,851 in the same period of 2009, an increase of $2,493,875.
The Company’s ability to continue is dependent upon attaining and sustaining profitable operations and obtaining additional financing in order to fund its working capital requirements and on-going operations. The Company’s ability to attain profitable operations and positive cash flow in the future is dependent upon various factors, including its ability to acquire new customer contracts, the success of management’s continued cost controls and general economic conditions.
The Company currently has no bank debt and has an operating line of $250,000 which as of June 30, 2010 was at a nil balance. The operating line bears interest at Canadian chartered bank prime plus 1.5%, and is secured by assignment of cash collateral and a general security agreement.
Contingencies The Company is defending itself in an action for which the Company believes the amount of liability is undeterminable at this time. No liability has been accrued for claims on this action.
In September 2007, the Company, among others, was served with a counterclaim alleging that the Company induced a breach of contract and interfered with economic relationships. The Company
P. 10

maintains that the claims are without merit and no liability has been included in these consolidated interim financial statements, as management intends to vigorously defend the matter and believes the outcome will be in its favour. On November 7, 2007 the Company filed a Statement of Defense and a counterclaim against three parties for their interference with legally binding contracts, disrupted business, attacks on the Company’s reputation, and costs. Any amounts awarded as a result of these actions will be reflected in the year the amounts become reasonably estimable. The Company’s legal counsel has commenced the discovery process.
Commitments The Company has entered into various leases for its operating premises and equipment. Future minimum annual payments under these operating leases are as follows:
Year Premises Equipment Total
2010 210,896 58,102 268,998
2011 432,652 90,328 522,980
2012 445,685 32,319 478,004
2013 458,718 458,718
2014 76,815 76,815
$ 1,624,766 $ 180,749 $ 1,805,515
IFRS Changeover Plans International Financial Reporting Standards (“IFRS”) are to be implemented by the Company on January 1st, 2011 and CSA Notice 52-320 requires that progress on IFRS changeover plans be disclosed. AMA has completed a formal gap analysis of the differences between IFRS and Canadian GAAP. This analysis was reviewed by both the Audit Committee and external advisors. The Company has prepared white papers on areas of significant difference based on the detailed review that has been completed and these are being reviewed by the IFRS implementation team. To date, AMA has identified the following areas where differences may occur but has not yet determined the potential impact on its financial statements. These areas are:
1. Property Plant & Equipment
The decision to adopt the cost model instead of revaluation will likely be made. Current depreciation rates have been reviewed and will most likely be deemed appropriate for all property, plant and equipment. First time adopters may use an optional exemption to use fair value as deemed cost upon date of transition. When this exemption is used, the deemed cost becomes the new IFRS cost basis and any accumulated depreciation recognized under Canadian
P. 11

GAAP prior to transition is set to zero. The Company is continuing to assess whether the optional exemption will be used.
2. Impairment
IFRS results in increased exposure to impairment write downs. The movement from the existing afirs 220 to afirs 228 may result in impairment depending on the demand level for the afirs 220 at the time of transition. The Company has determined that it likely has two cash generating units (“CGU”). At each reporting date, the Company will assess whether there is an indication that an asset or CGU is impaired. If an indication exits, the asset’s or CGU’s recoverable amount will be estimated and compared to the carrying amount. An impairment loss maybe recognized if an asset’s (CGU’s) carrying amount exceeds its recoverable amount. At each reporting date, the Company will assess whether there is an indication that a previously recognized impairment loss has reversed. It is unlikely that there will be any impairment recognition in the Company’s financial statements at the transition date.
3. Leases
Based on analysis to date, the Company has determined that it is unlikely there will be changes in the classification of capital versus operating leases. Under IFRS, the capital leases will be renamed as finance leases. Initial direct costs for operating leases can be recognized as an asset and expensed over the lease term or expensed immediately by the lessee. It is likely the Company will opt to expense initial direct costs for operating leases immediately.
Forward-Looking Statements This discussion includes certain statements that may be deemed “forward-looking statements” that are subject to risks and uncertainty. All statements, other than statements of historical facts included in this discussion, including, without limitation, those regarding the Company’s financial position, business strategy, projected costs, future plans, projected revenues, objectives of management for future operations, the Company’s ability to meet any repayment obligations, the use of non-GAAP financial measures, trends in the airline industry, the global financial outlook, expanding markets, research and development of next generation products and any government assistance in financing such developments, foreign exchange rate outlooks, new revenue streams and sales projections, cost increases as related to marketing, research and development, administration expenses, and litigation matters, may be or include forward-looking statements. Although the Company believes the expectations expressed in such forward-looking statements are based on a number of reasonable assumptions regarding the Canadian, U.S., and global economic environments, local and foreign government policies/regulations and actions and assumptions made based upon discussions to date with the Company’s customers and advisers, such statements are not guarantees of future performance and actual results or developments may differ materially from those in the forward-looking statements. Factors that could cause actual results to differ materially from those in the forward-looking statements include production rates, timing for product deliveries and installations, Canadian, U.S., and foreign government activities, volatility of the aviation market for the Company’s products and services, factors that result in significant and prolonged disruption of air travel worldwide, U.S. military activity, market prices, foreign exchange rates, continued availability of
P. 12

capital and financing and general economic, market, or business conditions in the aviation industry, worldwide political stability or any effect those may have on our customer base. Investors are cautioned that any such statements are not guarantees of future performance and that actual results or developments may differ materially from those projected in the forward-looking statements.
Although the Company believes that the expectations reflected in such forward-looking statements are reasonable, there can be no assurance that such expectations will prove to have been correct. The Company cannot assure investors that actual results will be consistent with any forward-looking statements; accordingly, readers should not place undue reliance on forward-looking statements. The forward-looking statements contained herein are current only as of the date of this document. The Company disclaims any intentions or obligation to update or revise any forward-looking statements or comments as a result of any new information, future event or otherwise, unless such disclosure is required by law.
P. 13

Auditors’ Involvement National Instrument 51-102, Part 4, subsection 4.3 (3) (a), requires that if an auditor has not performed a review of the interim financial statements there must be an accompanying notice to the interim statements indicating that the interim financial statements have not been reviewed by an auditor.
The auditors of AeroMechanical Services Ltd. have not performed a review of the unaudited interim financial statements for the three and six month periods ended June 30, 2010 and June 30, 2009.
P. 14
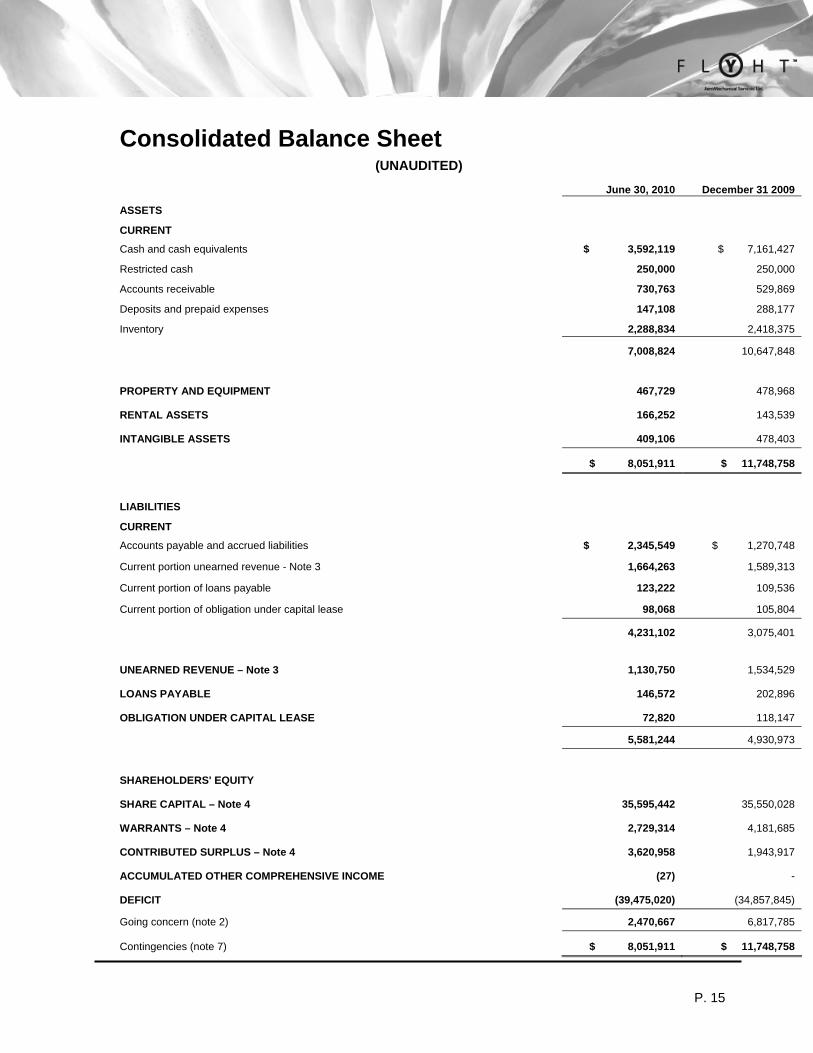
Consolidated Balance Sheet (UNAUDITED)
June 30, 2010 December 31 2009
ASSETS
CURRENT
Cash and cash equivalents $ 3,592,119 $ 7,161,427
Restricted cash 250,000 250,000
Accounts receivable 730,763 529,869
Deposits and prepaid expenses 147,108 288,177
Inventory 2,288,834 2,418,375
7,008,824 10,647,848
PROPERTY AND EQUIPMENT 467,729 478,968
RENTAL ASSETS 166,252 143,539
INTANGIBLE ASSETS 409,106 478,403
$ 8,051,911 $ 11,748,758
LIABILITIES
CURRENT
Accounts payable and accrued liabilities $ 2,345,549 $ 1,270,748
Current portion unearned revenue - Note 3 1,664,263 1,589,313
Current portion of loans payable 123,222 109,536
Current portion of obligation under capital lease 98,068 105,804
4,231,102 3,075,401
UNEARNED REVENUE – Note 3 1,130,750 1,534,529
LOANS PAYABLE 146,572 202,896
OBLIGATION UNDER CAPITAL LEASE 72,820 118,147
5,581,244 4,930,973
SHAREHOLDERS' EQUITY
SHARE CAPITAL – Note 4 35,595,442 35,550,028
WARRANTS – Note 4 2,729,314 4,181,685
CONTRIBUTED SURPLUS – Note 4 3,620,958 1,943,917
ACCUMULATED OTHER COMPREHENSIVE INCOME (27) -
DEFICIT (39,475,020) (34,857,845)
Going concern (note 2) 2,470,667 6,817,785
Contingencies (note 7) $ 8,051,911 $ 11,748,758
P. 15

Consolidated Statement of Loss and Deficit (UNAUDITED)
For the three
months ended June 30, 2010
For the three months ended June 30, 2009
For the six months ended June 30, 2010
For the six months ended June 30, 2009
REVENUE
afirs UpTime revenue $ 1,159,627 $ 1,151,623 $ 2,163,110 $ 2,056,426
Product sales revenue 12,625 82,682 39,722 255,286
Services revenue 108,895 89,699 191,191 266,224
1,281,147 1,324,004 2,394,023 2,577,936
COST OF SALES 534,039 452,196 987,476 1,060,671
GROSS MARGIN 747,108 871,808 1,406,547 1,517,265
EXPENSES
Salaries and benefits 1,183,385 1,026,055 2,455,467 2,116,189
General and administrative 431,601 414,757 767,014 913,346
Research and development 1,178,109 230,935 1,986,712 430,531
Marketing 200,413 84,331 338,309 195,753
Bad debt (1,657) 33,867 127,380 33,867
Amortization 49,852 35,895 94,631 66,343
Stock based compensation 231,115 307,350 242,334 307,350
Interest and bank charges 9,097 8,784 19,667 18,239
Foreign exchange currency (loss) gain 9,426 63,803 (12,143) 66,520
3,291,341 2,205,777 6,019,371 4,148,138
NET LOSS FOR THE PERIOD BEFORE INCOME TAXES (2,544,233) (1,333,969) (4,612,824) (2,630,873)
Current income taxes 4,351 - 4,351 2,132
NET LOSS FOR THE PERIOD $ (2,548,584) $ (1,333,969) $ (4,617,175) $ (2,633,005)
DEFICIT – Beginning of the period $ (36,926,436) $ (31,617,163) $ (34,857,845) $ (30,318,127)
NET LOSS (2,548,584) (1,333,969) (4,617,175) (2,633,005)
DEFICIT- END OF THE PERIOD $ (39,475,020) $ (32,951,132) $ (39,475,020) $ (32,951,132)
NET LOSS PER SHARE – Basic and Diluted – Note 4 $ (0.02) $ (0.02) $ (0.04) $ (0.03)
P. 16

Consolidated Statement of Comprehensive Income and Accumulated Other Comprehensive Income
(UNAUDITED)
For the three
months ended June 30, 2010
For the three months ended June 30, 2009
For the six months ended June 30, 2010
For the six months ended June 30, 2009
Net loss $ (2,548,584) $ (1,333,969) $ (4,617,175) $ (2,633,005)
Unrealized loss on translation of US subsidiary (35) (146) (27) (377)
Comprehensive loss $ (2,548,619) $ (1,334,115) $ (4,617,202) $ (2,633,382)
Accumulated other comprehensive income, Beginning of period
$ 8 $ (231) $ - $ -
Unrealized loss on translation of US subsidiary (35) (146) (27) (377)
Accumulated other comprehensive income, June 30, 2010 $ (27) $ (377) $ (27) $ (377)
P. 17

Consolidated Statement of Cash Flows (UNAUDITED)
CASH PROVIDED BY (USED IN): For the three
months ended June 30, 2010
For the three months ended June 30, 2009
For the six months ended June 30, 2010
For the six months ended June 30, 2009
OPERATING ACTIVITIES
Net loss $ (2,548,584) $ (1,333,969) $ (4,617,175) $ (2,633,005)
Add items not affecting cash
Amortization 49,852 35,895 94,631 66,343
Amortization of rental assets 9,089 28,399 18,155 58,891
Amortization of intangibles 34,648 - 69,297 -
Write down of rental assets - - - 7,200
Stock based compensation 231,115 307,350 242,334 307,350
Unrealized foreign exchange (gain) loss 2,258 66,629 (14,878) 126,743
(2,221,622) (895,696) (4,207,636) (2,066,478)
Net change in non-cash working capital balances – Note 5 132,686 1,154,968 833,007 2,213,903
(2,088,936) 259,272 (3,374,629) 147,425
FINANCING ACTIVITIES
Issuance of common shares and warrants 5,400 - 27,750 -
Repayment of capital leases (26,752) (12,548) (53,063) (21,107)
Loan repayment (31,466) (33,031) (42,639) (48,489)
(52,818) (45,579) (67,952) (69,596)
INVESTMENT ACTIVITIES
Purchase of property and equipment (75,289) - (83,392) (119,097)
Purchase of rental assets (43,335) (193,498) (43,335) (220,858)
Proceeds on sale of rental assets - 190,028 - 236,537
(118,624) (3,470) (126,727) (103,418)
Change in cash and cash equivalents (2,260,378) 210,223 (3,569,308) (25,589)
Cash and cash equivalents - beginning of period 5,852,497 565,592 7,161,427 801,404
Cash and cash equivalents - end of period $ 3,592,119 $ 775,815 $ 3,592,119 $ 775,815
SUPPLEMENTAL INFORMATION
Taxes paid $ 4,351 $ - $ 4,351 $ 2,132
Interest earned 4,537 270
11,150 270
Cash and Cash Equivalents
Cash in bank $ 3,592,119 $ 775,815 $ 3,592,119 $ 775,815
$ 3,592,119 $ 775,815 $ 3,592,119 $ 775,815
P. 18
Notes to Consolidated Financial Statements For the Three and Six Month Periods Ended June 30, 2010 and 2009
(UNAUDITED)
1. Significant accounting policies:
These unaudited interim consolidated financial statements have been prepared in accordance with Canadian Generally Accepted Accounting Principles (GAAP) on a basis consistent with those followed in the most recent audited annual financial statements for the year ended December 31, 2009. These unaudited interim consolidated financial statements do not include all note disclosures required by GAAP for annual consolidated financial statements. Accordingly, these statements should be read in conjunction with the Company’s annual audited financial statements for the year ended December 31, 2009.
2. Going concern:
At June 30, 2010, the Company had working capital of $2,777,722 (2009 - deficit $35,718) a deficit of $39,475,020 (2009 - $32,951,132), a loss from operations of $4,617,175 (2009 - $2,633,005) and negative cash flow from operations of $ 3,374,629 (2009 – positive $147,425).
The Company’s ability to continue as a going concern is dependent upon attaining and sustaining profitable operations and/or obtaining additional financing in order to fund its ongoing operations. The Company’s ability to attain profitable operations and positive cash flow in the future is dependent upon various factors including its ability to acquire new customer contracts, the success of management’s continued cost containments and general economic conditions.
There is no assurance that the Company will be successful in attaining and sustaining profitable operations and cash flows or raising additional capital to meet its working capital requirements. If the Company is unable to satisfy its working capital requirements from these sources, the Company’s ability to continue as a going concern and to achieve its intended business objectives could be adversely affected. These interim financial statements do not reflect adjustments that would otherwise be necessary if the going concern assumption was not valid such as revaluation to liquidation values and reclassification of balance sheet items.
P. 19

3. Unearned revenue:
Balance December 31, 2009 $ 3,123,842
Installation access fees 720,004
License fees (128,760)
Earned revenues (920,073)
Balance June 30, 2010 2,795,013
Less current portion (1,664,263)
$ 1,130,750
4. Share capital:
Authorized: Unlimited number of: Common shares Class A, B, and C preferred shares, issuable in series. The preferred shares may be issued in one or more series and the directors are authorized to fix the number of shares in each series and to determine the designation, rights, privileges, restrictions, and conditions attached to the shares of each series.
ISSUED:
a) Common shares
Number of Shares Value
Balance December 31, 2009 103,498,386 $ 35,550,028
Exercise of employee options 104,000 27,750
Contributed surplus from the exercise of employee options 17,664
Balance June 30, 2010 103,602,386 $ 35,595,442
b) Stock Option Plan
Number of Shares
Weighted Average Exercise Price
Outstanding December 31, 2009 2,784,496 $ 0.42
Options granted 975,000 0.41
Options exercised (104,000) 0.27
Outstanding June 30, 2010 3,655,496 $ 0.43
Exercisable June 30, 2010 3,430,496 $ 0.45
P. 20

c) Contributed Surplus
Balance December 31, 2009 $ 1,943,917
Stock based compensation 242,334
Employee stock options exercised (17,664)
Warrants expired 1,452,371
Balance June 30, 2010 $ 3,620,958
The weighted average fair market value of the options granted was $0.28 per option. The fair value of the options granted was estimated using the Black-Scholes option pricing model with the following weighted average assumptions: risk free interest rate of 2.15%, expected life of 3.44 years, volatility of 112% and dividend yield rate of nil.
d) Warrants
Number of Warrants
Weighted Average Exercise Price
Outstanding December 31, 2009 11,527,499 $ 0.84
Warrants expired (2,407,500) 1.30
Outstanding June 30, 2010 9,119,999 $ 0.75
The calculation of basic loss per share is based on the weighted-average number of common shares outstanding during the three and six month periods ending June 30, 2010 of 103,596,672 and 103,525,425 respectively (2009 – 82,500,219 and 82,500,219 respectively).
P. 21
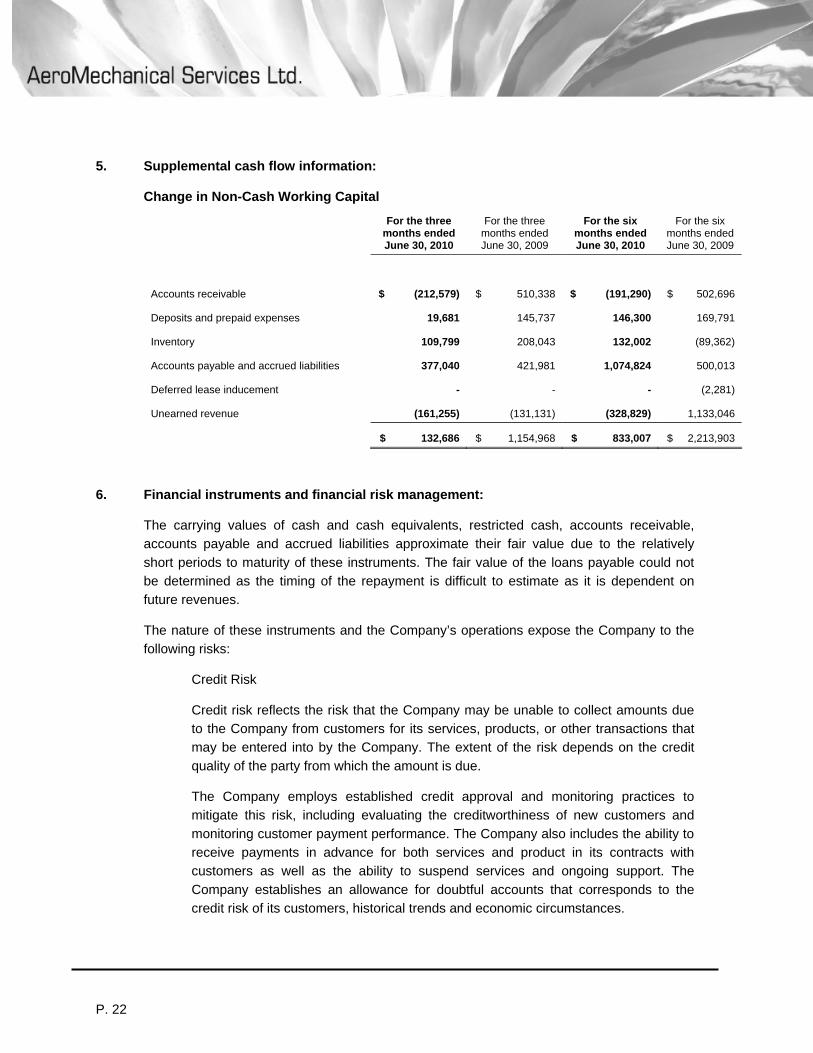
5. Supplemental cash flow information:
Change in Non-Cash Working Capital
For the three months ended June 30, 2010
For the three months ended June 30, 2009
For the six months ended June 30, 2010
For the six months ended June 30, 2009
Accounts receivable $ (212,579) $ 510,338 $ (191,290) $ 502,696
Deposits and prepaid expenses 19,681 145,737 146,300 169,791
Inventory 109,799 208,043 132,002 (89,362)
Accounts payable and accrued liabilities 377,040 421,981 1,074,824 500,013
Deferred lease inducement - - - (2,281)
Unearned revenue (161,255) (131,131) (328,829) 1,133,046
$ 132,686 $ 1,154,968 $ 833,007 $ 2,213,903
6. Financial instruments and financial risk management:
The carrying values of cash and cash equivalents, restricted cash, accounts receivable, accounts payable and accrued liabilities approximate their fair value due to the relatively short periods to maturity of these instruments. The fair value of the loans payable could not be determined as the timing of the repayment is difficult to estimate as it is dependent on future revenues.
The nature of these instruments and the Company’s operations expose the Company to the following risks:
Credit Risk
Credit risk reflects the risk that the Company may be unable to collect amounts due to the Company from customers for its services, products, or other transactions that may be entered into by the Company. The extent of the risk depends on the credit quality of the party from which the amount is due.
The Company employs established credit approval and monitoring practices to mitigate this risk, including evaluating the creditworthiness of new customers and monitoring customer payment performance. The Company also includes the ability to receive payments in advance for both services and product in its contracts with customers as well as the ability to suspend services and ongoing support. The Company establishes an allowance for doubtful accounts that corresponds to the credit risk of its customers, historical trends and economic circumstances.
P. 22

During the six month period ended June 30, 2010, the Company recorded a bad debt expense of $127,380 to reflect accounts that the Company has determined may not be collectible and has a total reserve against receivables totaling nil.
The aging of the accounts receivable as at June 30, 2010 is as follows:
Current , 1 – 30 days $ 465,109
31 – 60 days 132,953
61 – 90 days 70,269
Greater than 90 days 62,432
$ 730,763
7. Contingencies:
In September 2007, the Company, among others, was served with a counterclaim alleging that the Company induced a breach of contract and interfered with economic relationships. The Company maintains that the claims are without merit. Management intends to vigorously defend the matter and believes the outcome will be in its favour. On November 7, 2007, the Company filed a statement of defense and a counterclaim against three parties for interference with legally binding contracts, disrupted business, attacks on the Company’s reputation, and costs. Any amounts awarded as a result of these actions will be reflected in the year the amounts become reasonably estimable.
P. 23