amadeus jan-sep 2016 results - 4-traders.com · 5 s distribution _ renewed/signed 17 content...
TRANSCRIPT

Amadeus Jan-Sep 2016 Results
November 4, 2016
© 2
016
Am
adeu
s IT
Ho
ldin
g an
d it
s af
filia
tes
and
su
bsi
dia
rie
s

_ This presentation may contain certain statements which are not purely historical facts, including statements about anticipated orexpected future revenue and earnings growth. Any forward-looking statements in this presentation are based upon informationavailable to Amadeus on the date of this presentation. Any forward-looking statements involve risks and uncertainties that couldcause actual events or results to differ materially from the events or results described in the forward-looking statements. Amadeusundertakes no obligation to publicly update or revise any forward-looking statements, whether as a result of new information, futureevents or otherwise. Readers are cautioned not to place undue reliance on forward-looking statements.
_ This presentation has to be accompanied by a verbal explanation. A simple reading of this presentation without the appropriateverbal explanation could give rise to a partial or incorrect understanding.
2
© 2
016
Am
adeu
s IT
Ho
ldin
g an
d it
s af
filia
tes
and
su
bsi
dia
rie
s
Disclaimer

© 2
016
Am
adeu
s IT
Gro
up
an
d it
s af
filia
tes
and
su
bsi
dia
rie
s
Jan-Sep 2016 review
President & CEO,
Mr. Luis Maroto

4
© 2
016
Am
adeu
s IT
Ho
ldin
g an
d it
s af
filia
tes
and
su
bsi
dia
rie
s
_ Revenue +14.2%
• Strong business performance
• Navitaire and 2015 acquisitions
_ EBITDA +16.4%
• O.7 p.p. margin expansion
• Positive FX impact
_ Adjusted profit +21.3%
• Adjusted EPS + 21.6%
_ Free cash-flow 18.2%
_ Leverage 1.21x689
1,332
3,387
738
In €
millio
ns
Revenues
EBITDA
Adj. profit
Free CF
Solid results through September 2016
4

5
© 2
016
Am
adeu
s IT
Ho
ldin
g an
d it
s af
filia
tes
and
su
bsi
dia
rie
s
Distribution
_ Renewed/signed 17 content agreements, including easyJet
_ KAYAK has implemented Amadeus Master Pricer with Instant Search technology - online search results in milliseconds with no compromise to accuracy
_ 64% of bookings through Amadeus can carry ancillary services -Amadeus Ancillary Services contracted by 116 carriers and implemented by 90 airlines, for indirect channel
_ Amadeus’ Fare Family Solution - 42 contracted airline customers and 32 implemented, for indirect channel
_ Over 30 OTAs have now integrated Amadeus merchandising solutions, including Sembo and Al Tayyar
Q3 – Continued progress across our strategiesAirline IT
_ Malaysia Airlines has contracted Amadeus PSS, Anytime Merchandising and E-commerce solutions
_ EVA Air implemented Amadeus Altéa Revenue Management suite – which takes into account a travellers’ entire journey from origin to destination, not simply managing revenue on a leg-by-leg basis
_ Virgin Australia has implemented Altéa Departure Control Flight Management – which allows the customer to benefit from fuel savings, agent productivity and flight safety
Hospitality IT
_ We are advancing in the execution of our Hospitality IT strategy, by integrating Itesso and Hotel SystemsPro and by working with InterContinental Hotels Group in the development of a new-generation Guest Reservation System for the hospitality industry
Airport IT
_ Amadeus and Copenhagen Airports successful implementation of Amadeus Airport Sequence Manager and A-CDM Portal solutions - airports, airline customers, ground handlers and air traffic controllers benefiting from accurate and synched information on aircraft departures
_ Over 90 LCCs and hybrid carriers‘ content accessible for Amadeus subscribers
6
© 2
016
Am
adeu
s IT
Ho
ldin
g a
nd
its
affi
liate
s an
d s
ub
sid
iari
es
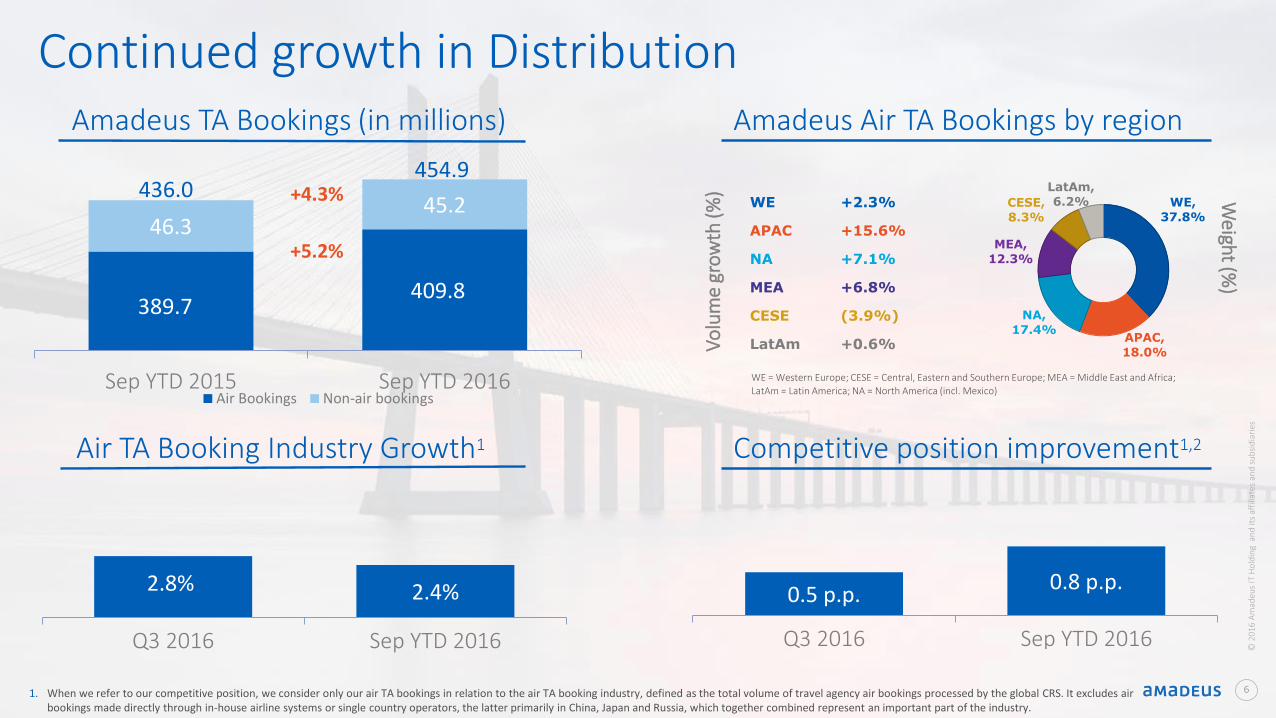
389.7409.8
46.345.2
Sep YTD 2015 Sep YTD 2016Air Bookings Non-air bookings
Vo
lum
e gr
ow
th (%
)
WE = Western Europe; CESE = Central, Eastern and Southern Europe; MEA = Middle East and Africa;
LatAm = Latin America; NA = North America (incl. Mexico)
Weigh
t (%)
2.8% 2.4%
Q3 2016 Sep YTD 2016
1. When we refer to our competitive position, we consider only our air TA bookings in relation to the air TA booking industry, defined as the total volume of travel agency air bookings processed by the global CRS. It excludes air bookings made directly through in-house airline systems or single country operators, the latter primarily in China, Japan and Russia, which together combined represent an important part of the industry.
454.9
Continued growth in Distribution
+4.3%
+5.2%
436.0
Air TA Booking Industry Growth1
Amadeus Air TA Bookings by region
Competitive position improvement1,2
WE,
37.8%
APAC,
18.0%
NA,
17.4%
MEA,
12.3%
CESE,
8.3%
LatAm,
6.2%WE +2.3%
APAC +15.6%
NA +7.1%
MEA +6.8%
CESE (3.9%)
LatAm +0.6%
Amadeus TA Bookings (in millions)
0.5 p.p.0.8 p.p.
Q3 2016 Sep YTD 2016
7
© 2
016
Am
adeu
s IT
Ho
ldin
g an
d it
s af
filia
tes
and
su
bsi
dia
rie
s
Weigh
t (%)
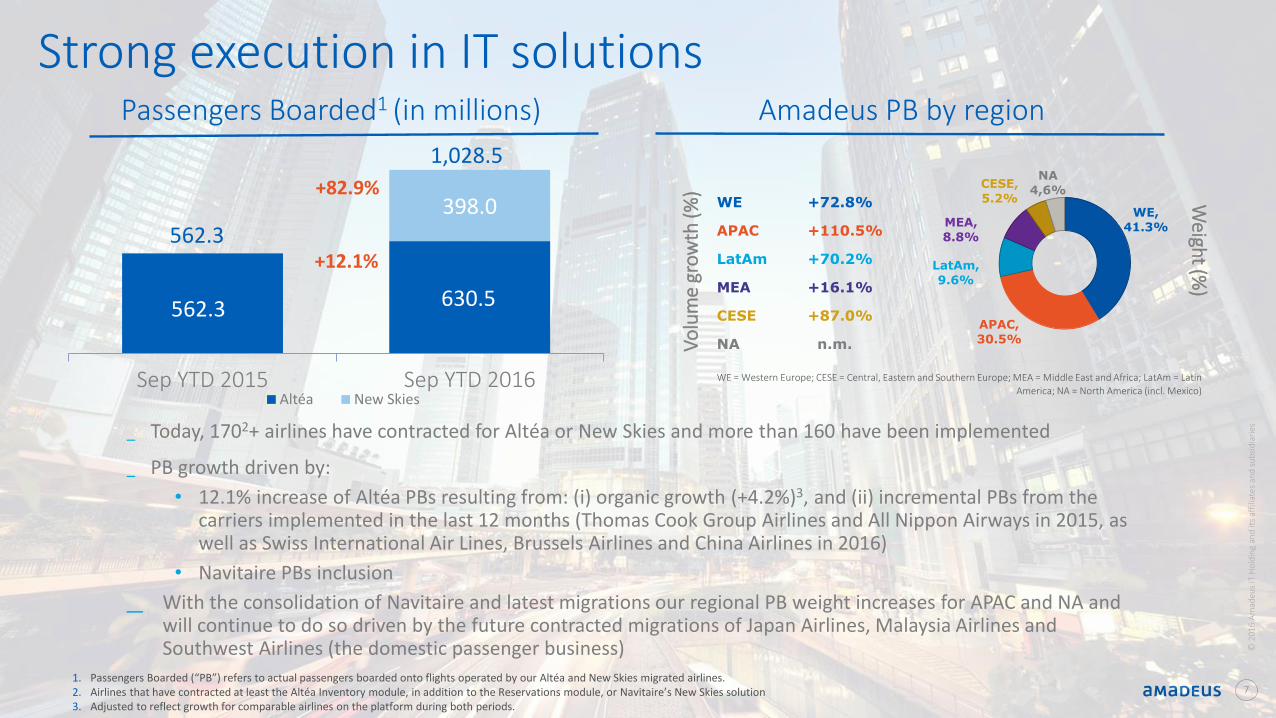
Strong execution in IT solutionsPassengers Boarded1 (in millions) Amadeus PB by region
562.3 630.5
398.0
Sep YTD 2015 Sep YTD 2016Altéa New Skies
Vo
lum
e gr
ow
th (%
)1. Passengers Boarded (“PB”) refers to actual passengers boarded onto flights operated by our Altéa and New Skies migrated airlines.2. Airlines that have contracted at least the Altéa Inventory module, in addition to the Reservations module, or Navitaire’s New Skies solution3. Adjusted to reflect growth for comparable airlines on the platform during both periods.
+12.1%
+82.9%
1,028.5
562.3
_ Today, 1702+ airlines have contracted for Altéa or New Skies and more than 160 have been implemented
_ PB growth driven by:
• 12.1% increase of Altéa PBs resulting from: (i) organic growth (+4.2%)3, and (ii) incremental PBs from the carriers implemented in the last 12 months (Thomas Cook Group Airlines and All Nippon Airways in 2015, as well as Swiss International Air Lines, Brussels Airlines and China Airlines in 2016)
• Navitaire PBs inclusion
_ With the consolidation of Navitaire and latest migrations our regional PB weight increases for APAC and NA and will continue to do so driven by the future contracted migrations of Japan Airlines, Malaysia Airlines and Southwest Airlines (the domestic passenger business)
WE,
41.3%
APAC,
30.5%
LatAm,
9.6%
MEA,
8.8%
CESE,
5.2%
NA
4,6%WE +72.8%
APAC +110.5%
LatAm +70.2%
MEA +16.1%
CESE +87.0%
NA n.m.
WE = Western Europe; CESE = Central, Eastern and Southern Europe; MEA = Middle East and Africa; LatAm = Latin
America; NA = North America (incl. Mexico)
562.3

© 2
016
Am
adeu
s IT
Gro
up
an
d it
s af
filia
tes
and
su
bsi
dia
rie
s
Financial Highlights
CFO, Ms. Ana de Pro

Double-digit group revenue growth
999
2,964.8
3,386.5
Sep YTD 2015 Sep YTD 2016
2,087.5
2,219.9
Sep YTD 2015 Sep YTD 2016
877.3 1,166.7
Sep YTD 2015 Sep YTD 2016
+14.2%
Group Revenue (in € millions)
Distribution
+6.3%
IT Solutions
+33.0%
_ Group revenue expanded by 14.2%, driven by a 6.3% and 33.0% increase in Distribution and IT Solutions revenue, respectively, supported by the positive impact from our 2015 acquisitions and Navitaire. The underlying trend was strong and driven by:
_ Distribution: volume growth and unitary pricing expansion due to (i) certain customer renegotiations, and (ii) positive booking mix (higher weight of global bookings and declining weight of non-air bookings). Revenue growth also supported by the positive evolution of non-booking revenue
_ IT Solutions: (i) higher Altéa volumes and expansive average pricing reflection of a successful upselling strategy, (ii) growth in services and (iii) growing contribution from new businesses
Segment Revenue (in € millions)

Double-digit EBITDA and Adjusted EPS growth
101010
1,144.5
1,332.1
38.6%
39.3%
38.3%
39.3%
40.3%
1,000.0
1,100.0
1,200.0
1,300.0
1,400.0
Sep YTD 2015 Sep YTD 2016
EBITDA EBITDA Margin (%)
608.4
738.1
€1.39€1.69
-0.40
0.10
0.60
1.10
1.60
2.10
515.0
525.0
535.0
545.0
555.0
565.0
575.0
585.0
595.0
605.0
615.0
625.0
635.0
645.0
655.0
665.0
675.0
685.0
695.0
705.0
715.0
725.0
735.0
745.0
755.0
765.0
775.0
785.0
795.0
805.0
815.0
825.0
835.0
845.0
855.0
865.0
875.0
Sep YTD 2015 Sep YTD 2016Adjusted Profit Adjusted EPS
Adjusted profit increase as a result of EBITDA growth and lower taxes, partly offset by foreign exchange losses and D&A growth
EBITDA growth (in € millions)
+16.4%
Adj. Profit1 (in € millions) & Adj. EPS2 (€)
+21.3%
1. Excluding after-tax impact of the following items: (i) accounting effects derived from PPA exercises and impairment losses, (ii) non-operating exchange gains (losses) and (iii) other non-recurring items.
2. EPS corresponding to the Adjusted profit attributable to the parent company. Calculated based on weighted average outstanding shares of the period.
101010
_ 0.7 p.p. margin expansion_ EBITDA growth resulting from positive
performances in Distribution and IT Solutions, as well as from Navitaire consolidation and a positive FX impact on costs – excluding FX and Navitaire, EBITDA grew at a double-digit rate and margins were broadly stable
_ Adjusted profit increase as a result of EBITDA growth coupled with moderate financial expenses and taxes growth
EBITDA growth (in € millions)
+21.6%
© 2
016
Am
adeu
s IT
Ho
ldin
g a
nd
its
affi
liate
s an
d s
ub
sid
iari
es
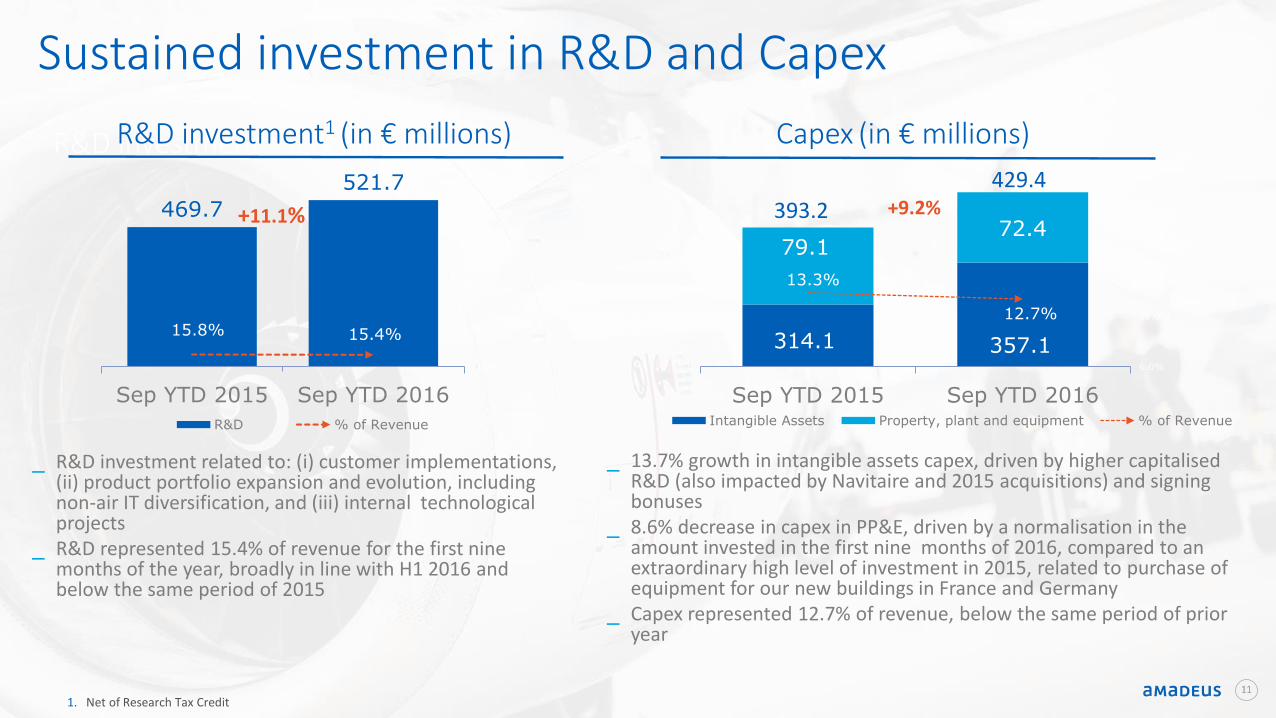
Sustained investment in R&D and Capex
1111
314.1 357.1
79.172.4
13.3%
12.7%
6.0%
11.0%
16.0%
21.0%
26.0%
250.0
270.0
290.0
310.0
330.0
350.0
370.0
390.0
410.0
430.0
450.0
470.0
490.0
Sep YTD 2015 Sep YTD 2016Intangible Assets Property, plant and equipment % of Revenue
469.7
521.7
15.8% 15.4%
0.0%
50.0%
100.0%
150.0%
200.0%
250.0%
200.0
220.0
240.0
260.0
280.0
300.0
320.0
340.0
360.0
380.0
400.0
420.0
440.0
460.0
480.0
500.0
520.0
540.0
560.0
Sep YTD 2015 Sep YTD 2016
R&D % of Revenue
R&D investment(1) (in € millions)
+11.1% +9.2%
1. Net of Research Tax Credit
_ R&D investment related to: (i) customer implementations, (ii) product portfolio expansion and evolution, including non-air IT diversification, and (iii) internal technological projects
_ R&D represented 15.4% of revenue for the first nine months of the year, broadly in line with H1 2016 and below the same period of 2015
_ 13.7% growth in intangible assets capex, driven by higher capitalisedR&D (also impacted by Navitaire and 2015 acquisitions) and signing bonuses
_ 8.6% decrease in capex in PP&E, driven by a normalisation in the amount invested in the first nine months of 2016, compared to an extraordinary high level of investment in 2015, related to purchase of equipment for our new buildings in France and Germany
_ Capex represented 12.7% of revenue, below the same period of prior year
Capex (in € millions) R&D investment1 (in € millions)
429.4
393.2
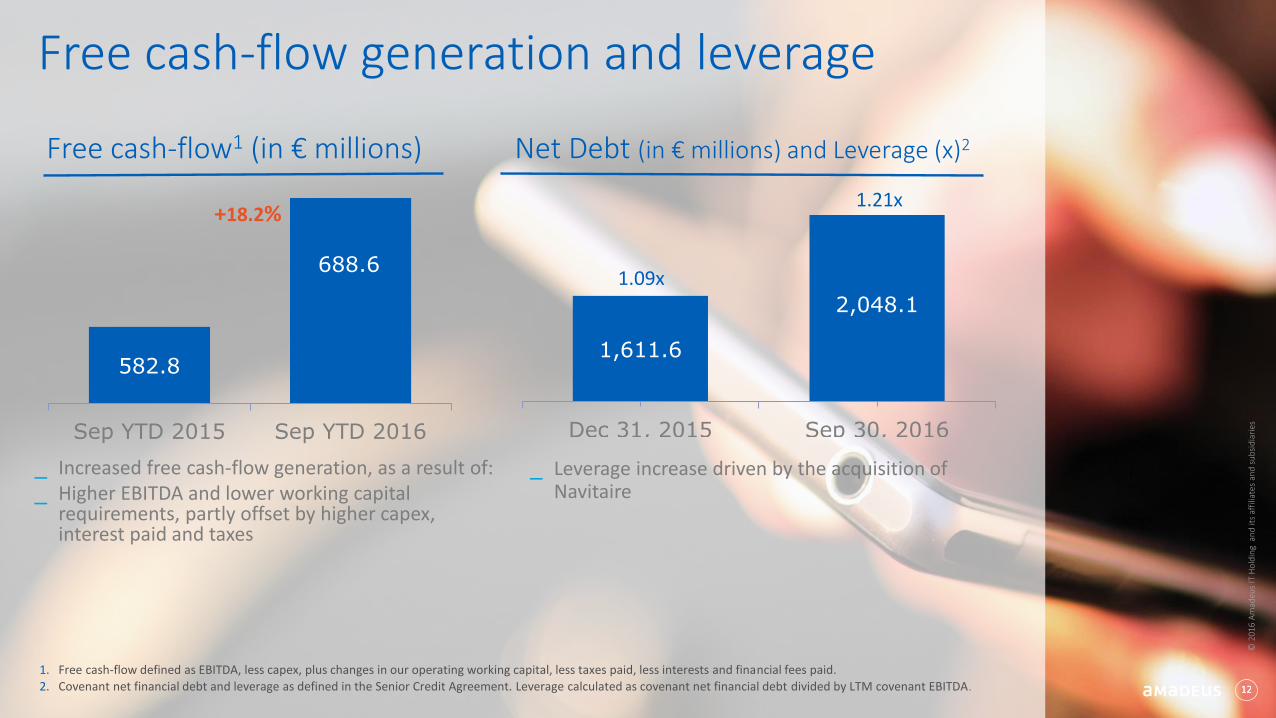
Free cash-flow generation and leverage
582.8
688.6
Sep YTD 2015 Sep YTD 2016
1,611.6
2,048.1
Dec 31, 2015 Sep 30, 2016
1.21x
1.09x
+18.2%
Net Debt (in € millions) and Leverage (x)2
1. Free cash-flow defined as EBITDA, less capex, plus changes in our operating working capital, less taxes paid, less interests and financial fees paid.
2. Covenant net financial debt and leverage as defined in the Senior Credit Agreement. Leverage calculated as covenant net financial debt divided by LTM covenant EBITDA. 121212
_ Increased free cash-flow generation, as a result of:_ Higher EBITDA and lower working capital
requirements, partly offset by higher capex, interest paid and taxes
_ Leverage increase driven by the acquisition of Navitaire
Free cash-flow1 (in € millions)
© 2
016
Am
adeu
s IT
Ho
ldin
g a
nd
its
affi
liate
s an
d s
ub
sid
iari
es
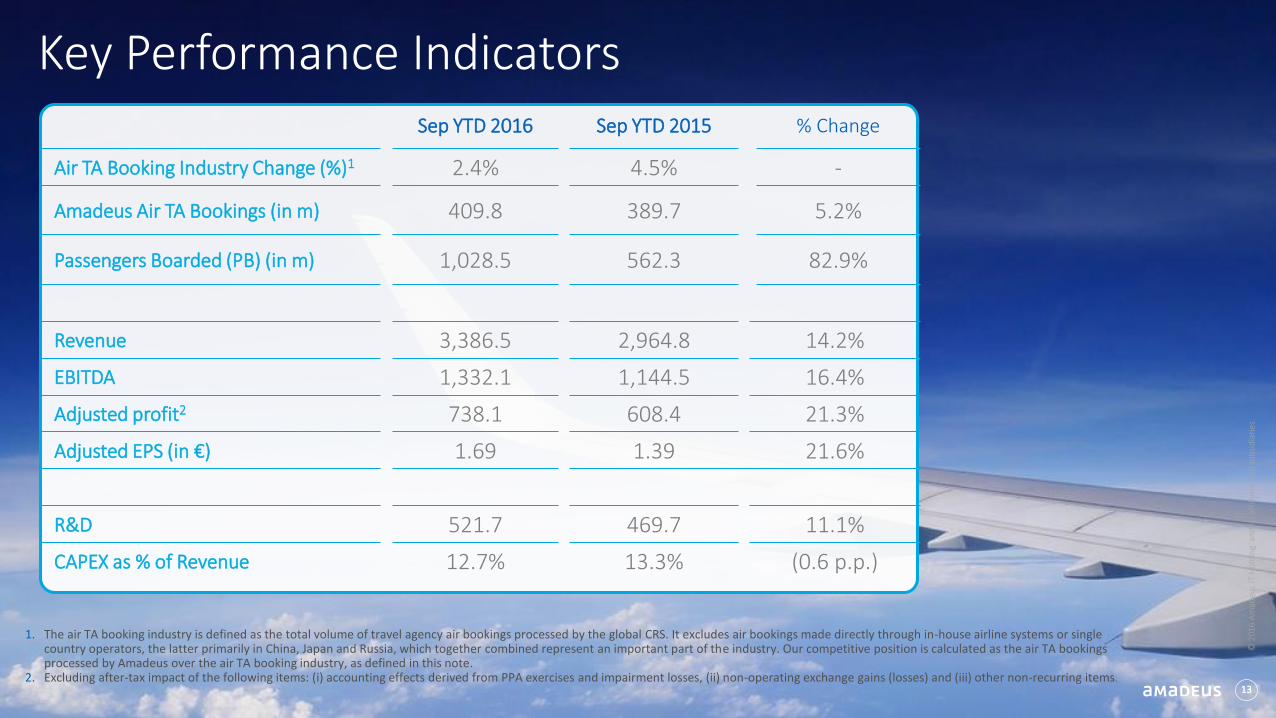
Sep YTD 2016 Sep YTD 2015 % Change
Air TA Booking Industry Change (%)1 2.4% 4.5% -
Amadeus Air TA Bookings (in m) 409.8 389.7 5.2%
Passengers Boarded (PB) (in m) 1,028.5 562.3 82.9%
Revenue 3,386.5 2,964.8 14.2%
EBITDA 1,332.1 1,144.5 16.4%
Adjusted profit2 738.1 608.4 21.3%
Adjusted EPS (in €) 1.69 1.39 21.6%
R&D 521.7 469.7 11.1%
CAPEX as % of Revenue 12.7% 13.3% (0.6 p.p.)
Key Performance Indicators
131313
1. The air TA booking industry is defined as the total volume of travel agency air bookings processed by the global CRS. It excludes air bookings made directly through in-house airline systems or single country operators, the latter primarily in China, Japan and Russia, which together combined represent an important part of the industry. Our competitive position is calculated as the air TA bookings processed by Amadeus over the air TA booking industry, as defined in this note.
2. Excluding after-tax impact of the following items: (i) accounting effects derived from PPA exercises and impairment losses, (ii) non-operating exchange gains (losses) and (iii) other non-recurring items.
© 2
016
Am
adeu
s IT
Ho
ldin
g a
nd
its
affi
liate
s an
d s
ub
sid
iari
es

© 2
016
Am
adeu
s IT
Gro
up
an
d it
s af
filia
tes
and
su
bsi
dia
rie
s
Q3 2016 Highlights

15
123.8 130.5
14.1 13.9
Q3 2015 Q3 2016Air Bookings Non-air bookings
Vo
lum
e gr
ow
th (%
)
WE = Western Europe; CESE = Central, Eastern and Southern Europe; MEA = Middle East and Africa;
LatAm = Latin America; NA = North America (incl. Mexico)
Weigh
t (%)
1. Passengers Boarded (“PB”) refers to actual passengers boarded onto flights operated by our Altéa and New Skies migrated airlines.
144.4
+4.8%
+5.5%
137.9
Amadeus Air TA Bookings by region
WE,
36.8%
APAC,
18.3%
NA,
16.9%
MEA,
12.5%
CESE,
8.6%
LatAm,
7.0%WE +3.4%
APAC +12.2%
NA +3.1%
MEA +9.6%
CESE +0.2%
LatAm +5.1%
Amadeus TA Bookings (in millions)
Weigh
t (%)
208.1 237.6
162.2
Q3 2015 Q3 2016Altéa New Skies V
olu
me
gro
wth
(%)
399.8
208.1 WE,
43.2%
APAC,
28.6%
LatAm,
9.2%
MEA,
8.5%
CESE,
5.9%
NA
4.6%WE +83.1%
APAC +120.0%
LatAm +84.2%
MEA +19.8%
CESE +88.7%
NA n.m.
Passengers Boarded1 (in millions) Amadeus PB by region
Q3 Volumes
+92.1%
+14.2%

161616
988.0 1,111.1
Q3 2015 Q3 2016
672.5
699.4
Q3 2015 Q3 2016
315.6
411.7
Q3 2015 Q3 2016
+12.5%
Group Revenue (in € millions)
Distribution+4.0%
IT Solutions
+30.5%
Segment Revenue (in € millions)
Q3 Revenue by segment
_ Group revenue expanded by 12.5%, driven by a 4.0% and 30.5% increase in Distribution and IT Solutions revenue, respectively, supported by the positive impact from our 2015 acquisitions and Navitaire. The underlying trend was supported by:
_ Distribution: solid volume evolution, particularly in APAC, and positive non-booking revenue performance
_ IT Solutions: double-digit growth driven by higher Altéa volumes, average pricing expansion and an increased contribution from new businesses
© 2
016
Am
adeu
s IT
Ho
ldin
g a
nd
its
affi
liate
s an
d s
ub
sid
iari
es

Thank you!
© 2
016
Am
adeu
s IT
Ho
ldin
g an
d it
s af
filia
tes
and
su
bsi
dia
rie
s
You can follow us on:
AmadeusITgroupamadeus.comamadeus.com/blog