(a)main concepts and results ncert republished be not to · pdf file(a)main concepts and...
TRANSCRIPT
UNIT 3
DATA HANDLINGDATA HANDLINGDATA HANDLINGDATA HANDLINGDATA HANDLING
(A) Main Concepts and Results
• The information collected in the form of numbers is called Data.
• Data is organised and represented graphically so that it becomeseasy to understand and interpret.
• The difference between the highest and lowest observations in a
given data is called its Range.
• The average or Arithmetic Mean or mean of a given data is
defined as :
Mean = Sum of all observations
Number of observations
• Mode is the observation that occurs most frequently in the data.
• If each of the values in a data are occurring one time (or equal number
of times), then all are mode. Sometimes, we also say that this datahas no mode since none of them is occurring frequently.
• When the given data is arranged in ascending (or descending) order,then the middle most observation is the median of the data.
• Mean, median and mode are the representative values of a group of
observations. They are also called the measures of central tendencyof the data.
• The representation of the data in the form of rectangles (bars) ofuniform width is called a Bar Graph.
• A double bar graph can be used to compare informations related to
two data.
• The situation that may or may not happen, have a chance of
happening.
04062014
© NCERT
not to
be re
publi
shed

64 EXEMPLAR PROBLEMS
MATHEMATICS
• The probablity of an event which is certain to happen is ‘1’.
• The probability of an event which is impossible to happen is ‘0’.
• The probability of an event
= Number of outcomes favourableto the eventTotal number of outcomes in the experiment
(B) Solved Examples
In Examples 1 to 3, there are four options, out of which only one is
correct. Write the correct answer.
Example 1: The range of the data 14, 6, 12, 17, 21, 10, 4, 3 is
(a) 21 (b) 17 (c) 18 (d) 11
Solution: Correct answer is (c)
Example 2: The mode of the data 23, 26, 22, 29, 23, 29, 26, 29,22, 23 is
(a) 23 and 29 (b) 23 only
(c) 29 only (d) 26 only
Solution: Correct answer is (a)
Example 3: The median of the data 40, 50, 99, 68, 98, 60, 94 is
(a) 40 (b) 60
(c) 68 (d) 99
Solution: Correct answer is (c)
In Examples 4 and 5, fill in the blanks to make the statements true.
Example 4: The mean of first five prime numbers is __________.
Solution: 5.6
[Hint : First five prime numbers are 2, 3, 5, 7 and 11]
Example 5: The probability of getting a number greater than 2 on
throwing a die once is _________.
Solution:2
3
04062014
© NCERT
not to
be re
publi
shed
DATA HANDLING 65
UNIT 3
In Examples 6, 7 and 8, state whether the statements are True or False .
Example 6: The mode of the observations 23, 26, 15, 12, 28, 38,19, 23, 26, 23 is 28.
Solution: False.
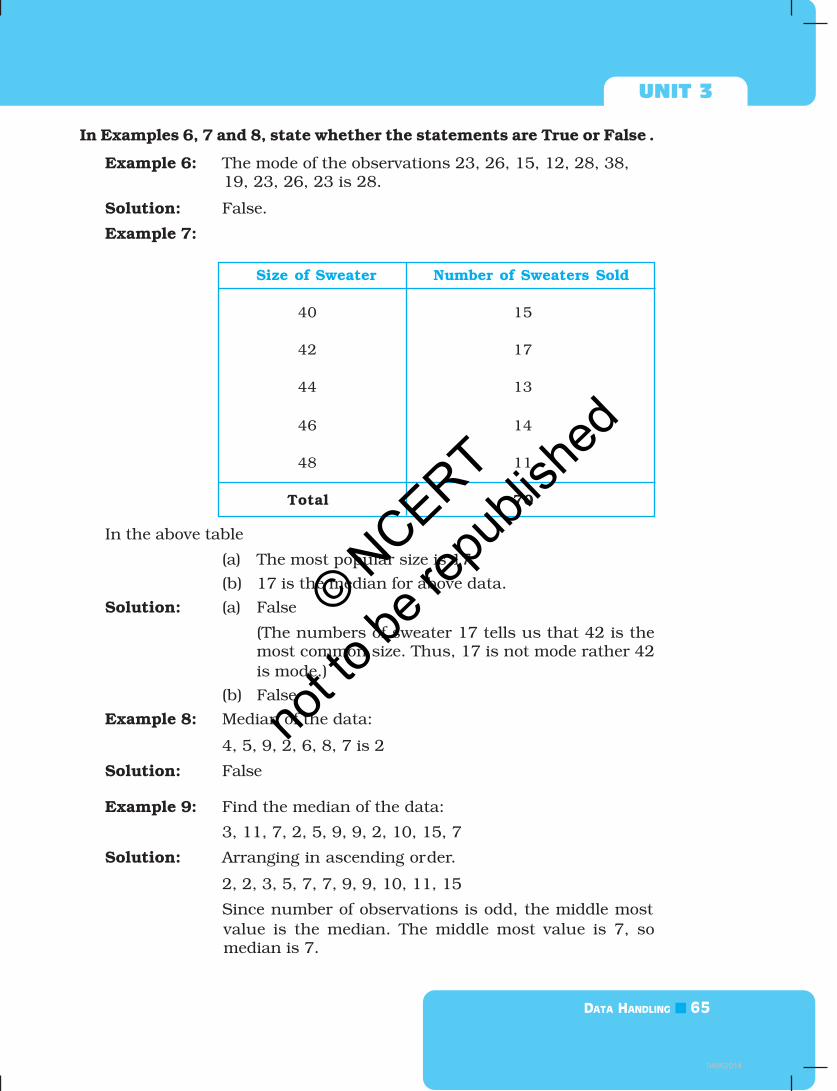
Example 7:
Size of Sweater Number of Sweaters Sold
40 15
42 17
44 13
46 14
48 11
Total 70
In the above table
(a) The most popular size is 17.
(b) 17 is the median for above data.
Solution: (a) False
(The numbers of sweater 17 tells us that 42 is themost common size. Thus, 17 is not mode rather 42
is mode.)
(b) False
Example 8: Median of the data:
4, 5, 9, 2, 6, 8, 7 is 2
Solution: False
Example 9: Find the median of the data:
3, 11, 7, 2, 5, 9, 9, 2, 10, 15, 7
Solution: Arranging in ascending order.
2, 2, 3, 5, 7, 7, 9, 9, 10, 11, 15
Since number of observations is odd, the middle most
value is the median. The middle most value is 7, somedian is 7.
04062014
© NCERT
not to
be re
publi
shed
66 EXEMPLAR PROBLEMS
MATHEMATICS
Example10: Find the median of the data :
21, 15, 6, 25, 18, 13, 20, 9, 8, 12
Solution: Arranging in ascending order :
6, 8, 9, 12, 13, 15, 18, 20, 21, 25
Since number of observations is even, the median is given
by finding the average or mean of the two middle most
observations:
So, median = 13+15
2 =
28
2 = 14
Note : In this data, there are two middle most terms 13 and 15. So, median
is the average of these observations.
Example 11: The cards bearing letters of the word “MATHEMATICS”
are placed in a bag. A card is taken out from the bag
without looking into the bag (at random).
(a) How many outcomes are possible when a letter is
taken out of the bag at random?
(b) What is the probability of getting
(i) M?
(ii) Any vowel?
(iii) Any consonant?
(iv) X?
Solution: (a) There are 11 outcomes namely M, M, A, A, T, T, H,
E, I, C, S.
(b) (i) Probability of getting ‘M’ = 2
11
(ii) Probability of getting a vowel = 4
11
(iii) Probability of getting a consonant = 7
11
(iv) Probability of getting X = 0 = 0
11
04062014
© NCERT
not to
be re
publi
shed
DATA HANDLING 67
UNIT 3
Example 12: If the mean of 26, 28, 25, x, 24 is 27, find the value of x.
Solution: Mean = Sum of all observations
Number of observations
or, 27= 26 + 28 + 25 + + 24
5
x
or, 27 = 103 +
5
x
or, 135 = 103 + x
or, x = 135 – 103
So, x = 32
Example 13: The mean of 10 observations was calculated as 40. It
was detected on rechecking that the value of 45 was
wrongly copied as 15. Find the correct mean.
Solution: Mean =Sum of all observations
Number of observations
or, 40 = Sum of all observations
10
So, sum of all observations = 400
But this is incorrect sum, since one observation was
copied wrongly.
So, correct sum = Incorrect sum – Incorrect
observation + correct observation
= 400 – 15 + 45
= 430
Correct Mean = Correct Sum
Number of observations =
430
10 = 43
Example 14: The median of observations 11, 12, 14, 18, x + 2, 20, 22,25, 61 arranged in ascending order is 21. Find the value
of x.
Solution: Median from data = x + 2
or, 21 = x + 2
or, x = 21 – 2
or, x = 19
04062014
© NCERT
not to
be re
publi
shed

68 EXEMPLAR PROBLEMS
MATHEMATICS
Example 15: Study the double bar graph given below and answer the
questions that follow:
Fig. 3.1
(a) What information does the above double graphdepict?
(b) Name the fruits for which cost of 1 kg is greater in
City I as compared to City II.
(c) What is the difference of rates for apples in both the
cities?
(d) Find the ratio of the cost of mangoes per kg in City Ito the cost of mangoes per kg in City II.
Solution: (a) The double bar graph compares the cost of differentfruits per kg in Cities I and II.
(b) Apple, Banana, Mango and Cherry.
(c) Since ` 82 – ` 75 = ` 7 therefore, in both the citiesthe difference of rates of apples is ` 7/kg.
(d) ` 75 : ` 60 = 5 : 4
04062014
© NCERT
not to
be re
publi
shed
DATA HANDLING 69
UNIT 3
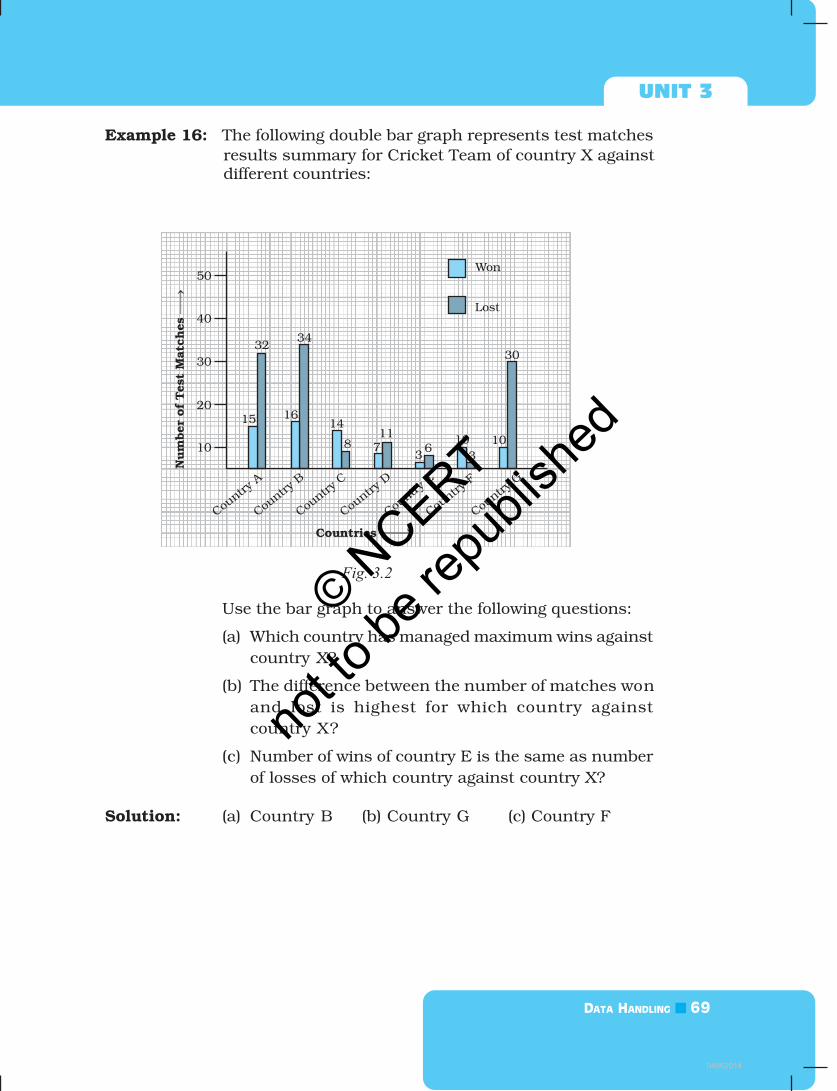
Example 16: The following double bar graph represents test matches
results summary for Cricket Team of country X againstdifferent countries:
Fig. 3.2
Use the bar graph to answer the following questions:
(a) Which country has managed maximum wins against
country X?
(b) The difference between the number of matches won
and lost is highest for which country against
country X?
(c) Number of wins of country E is the same as number
of losses of which country against country X?
Solution: (a) Country B (b) Country G (c) Country F
04062014
© NCERT
not to
be re
publi
shed
70 EXEMPLAR PROBLEMS
MATHEMATICS
Application on Problem Solving Strategy
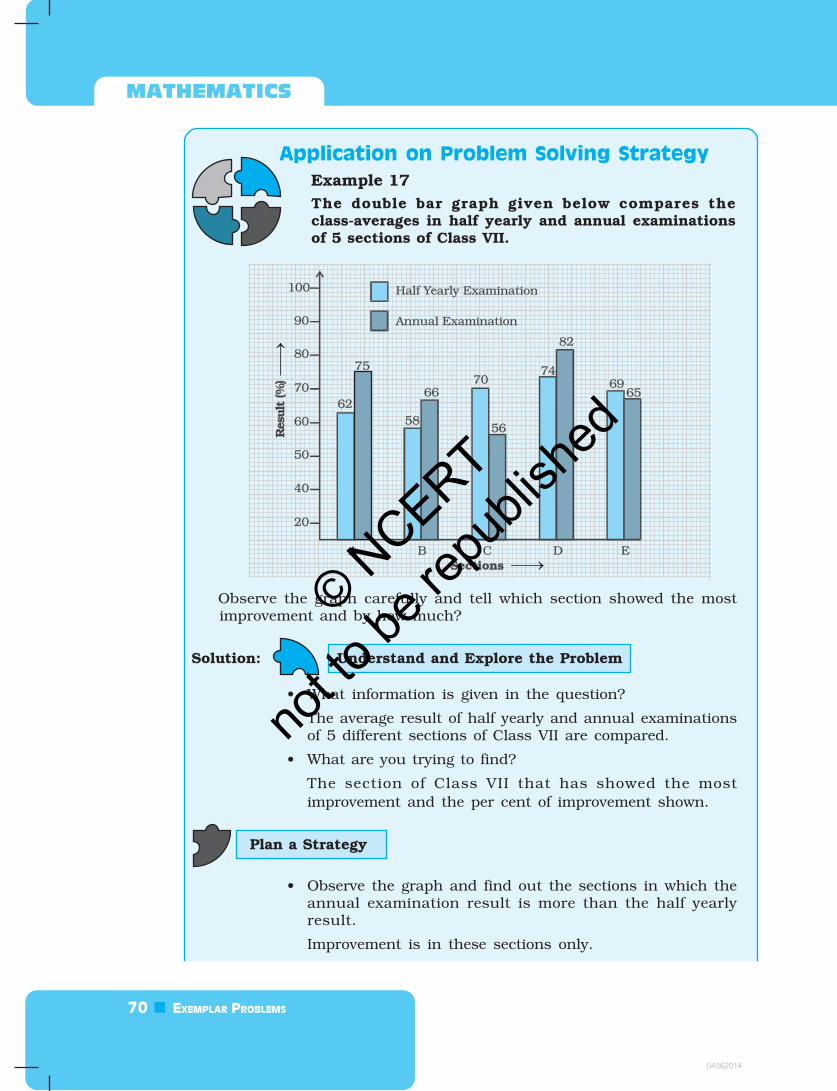
Example 17
The double bar graph given below compares theclass-averages in half yearly and annual examinationsof 5 sections of Class VII.
Observe the graph carefully and tell which section showed the mostimprovement and by how much?
Solution: Understand and Explore the Problem
• What information is given in the question?
The average result of half yearly and annual examinationsof 5 different sections of Class VII are compared.
• What are you trying to find?
The section of Class VII that has showed the most
improvement and the per cent of improvement shown.
Plan a Strategy
• Observe the graph and find out the sections in which theannual examination result is more than the half yearlyresult.
Improvement is in these sections only.
04062014
© NCERT
not to
be re
publi
shed

DATA HANDLING 71
UNIT 3
• Then only for these sections, compare the results
graphically and locate the section for which the differenceof results is the maximum.
• For this section, find the difference of the results.
Solve
• The sections in which the results of annual examinationis more than half yearly examination are sections A, Band D.
• Observing the graph of these sections we locate that sectionA has the maximum difference between the results.
The difference of results of section A = 75 – 62 = 13
Hence, section A has shown the maximum improvement andit is 13 per cent.
Revise
• Find the difference of the annual examination results andthe half yearly examination results for each section.
Difference in results of section A = 75 – 62 = 13
Difference in results of section B = 66 – 58 = 8
Difference in results of section C = 56 – 70 = –14
Difference in results of section D = 82 – 74 = 8
Difference in results of section E = 65 – 69 = – 4
We see that the difference is maximum for Section A and thedifference is 13, which is same as our answer.
Think and Discuss
1. Can you compare the ratio of difference of results of Sections B and D?
2. From the graph, can you observe the sections where there was no
improvement?
04062014
© NCERT
not to
be re
publi
shed

72 EXEMPLAR PROBLEMS
MATHEMATICS
(C) EXERCISE
In Questions 1 to 16, there are four options, out of which only one iscorrect. Write the correct answer.
1. Let x, y, z be three observations. The mean of these observations is
(a)× ×
3
x y z(b)
+ +
3
x y z(c)
− −
3
x y z(d)
× +
3
x y z
2. The number of trees in different parks of a city are 33, 38, 48, 33,
34, 34, 33 and 24. The mode of this data is
(a) 24 (b) 34 (c) 33 (d) 48
3. Which measures of central tendency get affected if the extremeobservations on both the ends of a data arranged in descendingorder are removed?
(a) Mean and mode (b) Mean and Median
(c) Mode and Median (d) Mean, Median and Mode
4. The range of the data : 21, 6, 17, 18, 12, 8, 4, 13 is
(a) 17 (b) 12 (c) 8 (d) 15
5. The median of the data : 3, 4, 5, 6, 7, 3, 4 is
(a) 5 (b) 3 (c) 4 (d) 6
6. Out of 5 brands of chocolates in a shop, a boy has to purchase thebrand which is most liked by children. What measure of centraltendency would be most appropriate if the data is provided to him?
(a) Mean (b) Mode
(c) Median (d) Any of the three
7. There are 2 aces in each of the given set of cards placed face down.From which set are you certain to pick the two aces in the first go?
(a) (b)
(c) (d)
04062014
© NCERT
not to
be re
publi
shed

DATA HANDLING 73
UNIT 3
8. In the previous question, what is the probability of picking up an
ace from set (d)?
(a)1
6(b)
2
6(c)
3
6(d)
4
6
9. The difference between the highest and the lowest observations in a
data is its
(a) frequency (b) width (c) range (d) mode
10. In a school, only 2 out of 5 students can participate in a quiz. What
is the chance that a student picked at random makes it to thecompetition?
(a) 20% (b) 40% (c) 50% (d) 30%
11. Some integers are marked on a board. What is the range of theseintegers?
(a) 31 (b) 37
(c) 20 (d) 3
12. On tossing a coin, the outcome is
(a) only head
(b) only tail
(c) neither head nor tail
(d) either head or tail
13. The mean of three numbers is 40. All the three numbers are differentnatural numbers. If lowest is 19, what could be highest possiblenumber of remaining two numbers?
(a) 81 (b) 40 (c) 100 (d) 71
14. Khilona earned scores of 97, 73 and 88 respectively in her first three
examinations. If she scored 80 in the fourth examination, then heraverage score will be
(a) increased by 1 (b) increased by 1.5
(c) decreased by 1 (d) decreased by 1.5
15. Which measure of central tendency best represents the data of the
most popular politician after a debate?
(a) Mean (b) Median
(c) Mode (d) Any of the above
Fig. 3.3
04062014
© NCERT
not to
be re
publi
shed

74 EXEMPLAR PROBLEMS
MATHEMATICS
16. Which of the following has the same mean, median and mode?
(a) 6, 2, 5, 4, 3, 4, 1 (b) 4, 2, 2, 1, 3, 2, 3
(c) 2, 3, 7, 3, 8, 3, 2 (d) 4, 3, 4, 3, 4, 6, 4
In Questions 17 to 31, fill in the blanks to make the statements true.
17. The difference between the highest and the lowest observations of adata is called _________.
18. The mean of a data is defined as _________.
19. In a set of observations, the observation that occurs the most often
is called _________.
20. In a given data, arranged in ascending or descending order, themiddle most observation is called _________.
21. Mean, Median, Mode are the measures of _________.
22. The probability of an event which is certain to happen is _________.
23. The probability of an event which is impossible to happen is _________.
24. When a die is thrown, the probability of getting a number less than7 is _________.
25. In Throwing a die the number of possible outcomes is _________.
26. _________ can be used to compare two collections of data.
27. The representation of data with bars of uniform width is called_________.
28. If the arithmetic mean of 8, 4, x, 6, 2, 7 is 5, then the value of x is
_________.
29. The median of any data lies between the _________ and _________
observations.
30. Median is one of the observations in the data if number ofobservations is _________.
Think and Discuss
What is the difference between a bar graph and a histogram.
04062014
© NCERT
not to
be re
publi
shed
DATA HANDLING 75
UNIT 3
31. Rohit collected the data regarding weights of students of his class
and prepared the following table:
Weight (in kg) 44 – 47 48 – 51 52 – 55 56 – 60
Number of Students 3 5 25 7
A student is to be selected randomly from his class for somecompetition. The probability of selection of the student is highest
whose weight is in the interval _________.
In Questions 32 to 49, state whether the statements are True or False.
32. If a die is thrown, the probability of getting a number greater than 6is 1.
33. When a coin is tossed, there are 2 possible outcomes.
34. If the extreme observations on both the ends of a data arranged in
ascending order are removed, the median gets affected.
35. The measures of central tendency may not lie between the maximum
and minimum values of data.
36. It is impossible to get a sum of 14 of the numbers on both dice when
a pair of dice is thrown together.
37. The probability of the spinning arrow stopping in
the shaded region (Fig. 3.4) is 1
2.
38. A coin is tossed 15 times and the outcomes arerecorded as follows :
H T T H T H H H T T H T H T T. The chance of
occurence of a head is 50 per cent.
39. Mean, Median and Mode may be the same for some data.
40. The probability of getting an ace out of a deck of cards is greater
than 1.
41. Mean of the data is always from the given data.
42. Median of the data may or may not be from the given data.
43. Mode of the data is always from the given data.
44. Mean of the observations can be lesser than each of the observations.
45. Mean can never be a fraction.
Fig. 3.4
04062014
© NCERT
not to
be re
publi
shed
76 EXEMPLAR PROBLEMS
MATHEMATICS
46. Range of the data is always from the data.
47. The data 12, 13, 14, 15, 16 has every observation as mode.
48. The range of the data 2, –5, 4, 3, 7, 6 would change if 2 was
subtracted from each value in the data.
49. The range of the data 3, 7, 1, –2, 2, 6, –3, –5 would change if 8 wasadded to each value in the data.
50. Calculate the Mean, Median and Mode of the following data:
5, 10, 10, 12, 13.
Are these three equal ?
51. Find the mean of the first ten even natural numbers.
52. A data constitutes of heights (in cm) of 50 children. What do you
understand by mode for the data?
53. A car seller collects the following data of cars sold in his shop.
Colour of Car Number of Cars Sold
Red 15
Black 20
White 17
Silver 12
Others 9
(a) Which colour of the car is most liked?
(b) Which measure of central tendency was used in (a)?
54. The marks in a subject for 12 students are as follows:
31, 37, 35, 38, 42, 23, 17, 18, 35, 25, 35, 29
For the given data, find the
(a) Range (b) Mean (c) Median (d) Mode
55. The following are weights (in kg) of 12 people.
70, 62, 54, 57, 62, 84, 75, 59, 62, 65, 78, 60
(a) Find the mean of the weights of the people.
04062014
© NCERT
not to
be re
publi
shed
DATA HANDLING 77
UNIT 3
(b) How many people weigh above the mean weight?
(c) Find the range of the given data.
56. Following cards are put facing down:
A E I O U
What is the chance of drawing out
(a) a vowel (c) a card marked U
(b) A or I (d) a consonant
57. For the given data given below, calculate the mean of its median and
mode.
6, 2, 5, 4, 3, 4, 4, 2, 3
58. Find the median of the given data if the mean is 4.5.
5, 7, 7, 8, x, 5, 4, 3, 1, 2
59. What is the probability of the sun setting tomorrow?
60. When a spinner with three colours (Fig. 3.5) is rotated,which colour has more chance to show up with arrowthan the others?
61. What is the probability that a student chosen at random out of3 girls and 4 boys is a boy?
62. The letters written on paper slips of the word MEDIAN are put in abag. If one slip is drawn randomly, what is the probability that itbears the letter D?
63. Classify the following events as certain to happen, impossible tohappen, may or may not happen:
(a) Getting a number less than 1 on throwing a die.(b) Getting head when a coin is tossed.(c) A team winning the match.
(d) Christmas will be on 25 December.(e) Today moon will not revolve around the earth.
(f) A ball thrown up in the air will fall down after some time.
64. A die was thrown 15 times and the outcomes recorded were
5, 3, 4, 1, 2, 6, 4, 2, 2, 3, 1, 5, 6, 1, 2
Find the mean, median and mode of the data.
65. Find the mean of first six multiples of 4.
66. Find the median of first nine even natural numbers.
Fig. 3.5
04062014
© NCERT
not to
be re
publi
shed
78 EXEMPLAR PROBLEMS
MATHEMATICS
67. The mean of three numbers is 10. The mean of other four numbersis 12. Find the mean of all the numbers.
68. Find the mode of the given data:
10, 8, 4, 7, 8, 11, 15, 8, 4, 2, 3, 6, 8
69. Given below are heights of 15 boys of a class measured in cm:
128, 144, 146, 143, 136, 142, 138, 129, 140, 152, 144, 140, 150,142, 154.
Find
(a) The height of the tallest boy.
(b) The height of the shortest boy.
(c) The range of the given data.
(d) The median height of the boys.
70. Observe the data and answer the questions that follow:
16, 15, 16, 16, 8, 15, 17
(a) Which data value can be put in the data so that the mode remainsthe same?
(b) At least how many and which value(s) must be put in to change
the mode to 15?
(c) What is the least number of data values that must be put in to
change the mode to 17? Name them.
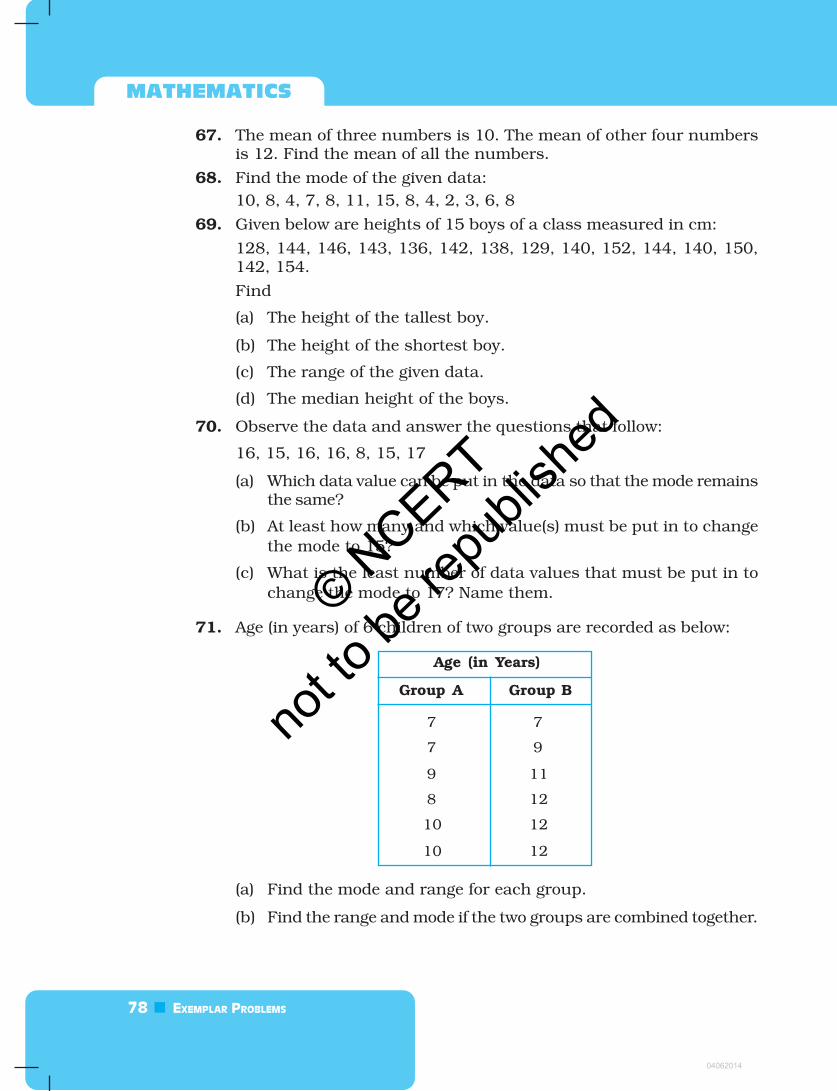
71. Age (in years) of 6 children of two groups are recorded as below:
Age (in Years)
Group A Group B
7 7
7 9
9 11
8 12
10 12
10 12
(a) Find the mode and range for each group.
(b) Find the range and mode if the two groups are combined together.
04062014
© NCERT
not to
be re
publi
shed
DATA HANDLING 79
UNIT 3
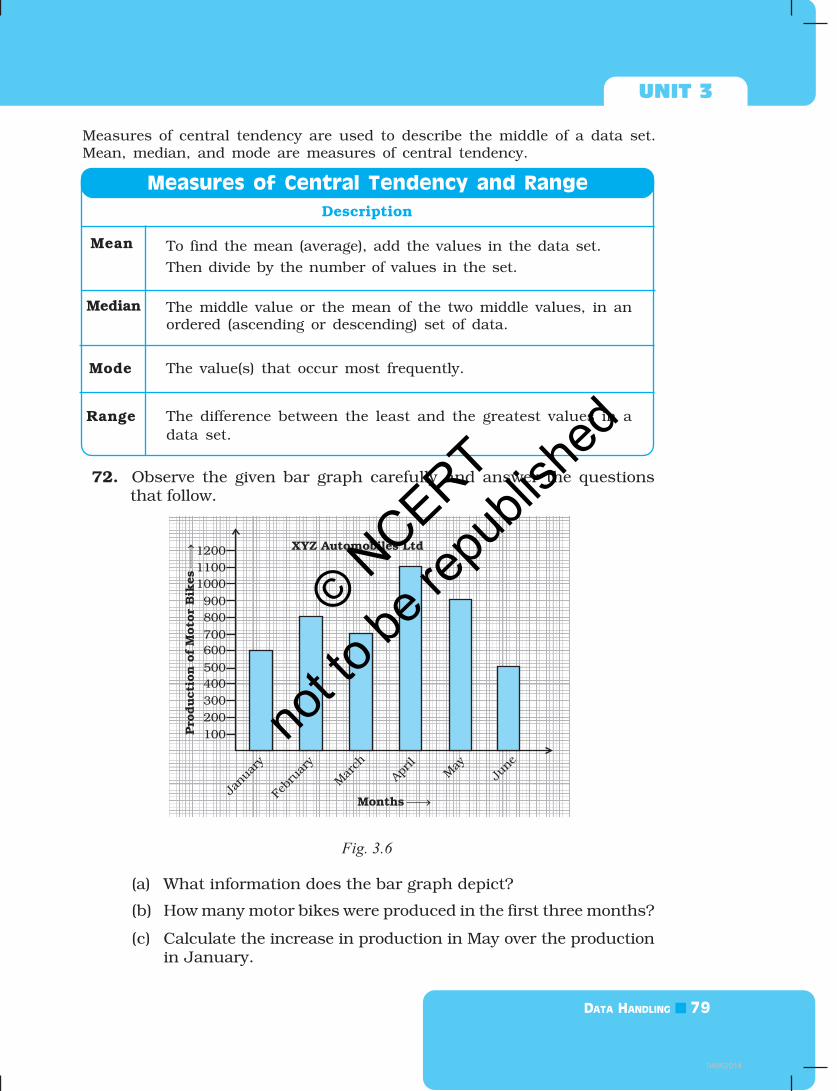
72. Observe the given bar graph carefully and answer the questionsthat follow.
Fig. 3.6
(a) What information does the bar graph depict?
(b) How many motor bikes were produced in the first three months?
(c) Calculate the increase in production in May over the productionin January.
Measures of Central Tendency and Range
Description
Mean To find the mean (average), add the values in the data set.
Then divide by the number of values in the set.
The middle value or the mean of the two middle values, in anordered (ascending or descending) set of data.
The value(s) that occur most frequently.
The difference between the least and the greatest values in a
data set.
Measures of central tendency are used to describe the middle of a data set.Mean, median, and mode are measures of central tendency.
Median
Mode
Range
04062014
© NCERT
not to
be re
publi
shed
80 EXEMPLAR PROBLEMS
MATHEMATICS
(d) In which month the production was minimum and what was it?
(e) Calculate the average (mean) production of bikes in 6 months.
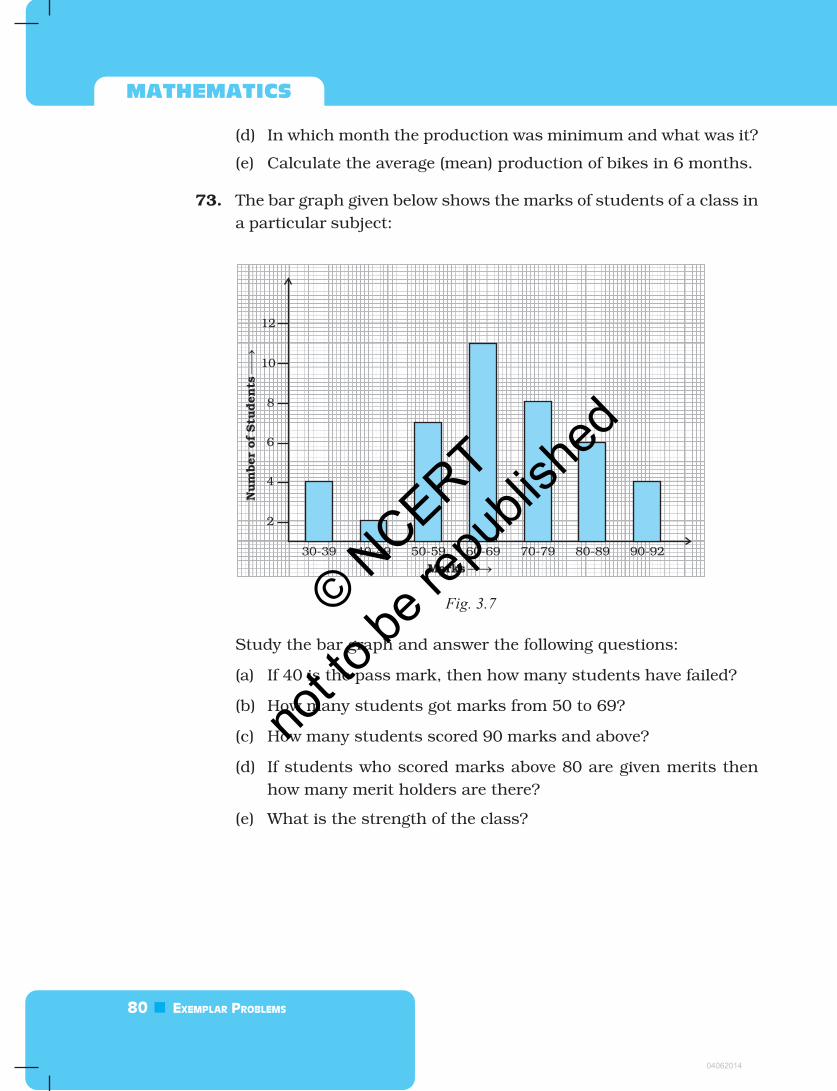
73. The bar graph given below shows the marks of students of a class in
a particular subject:
Fig. 3.7
Study the bar graph and answer the following questions:
(a) If 40 is the pass mark, then how many students have failed?
(b) How many students got marks from 50 to 69?
(c) How many students scored 90 marks and above?
(d) If students who scored marks above 80 are given merits then
how many merit holders are there?
(e) What is the strength of the class?
04062014
© NCERT
not to
be re
publi
shed
DATA HANDLING 81
UNIT 3
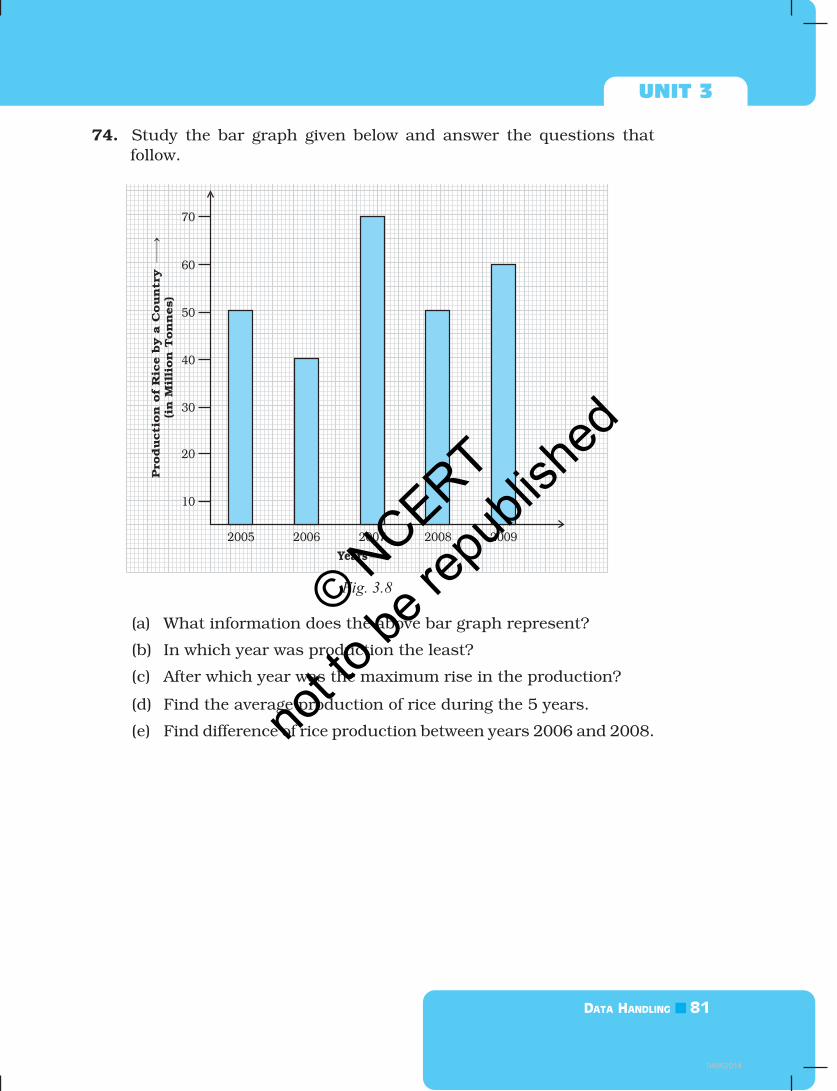
74. Study the bar graph given below and answer the questions that
follow.
Fig. 3.8
(a) What information does the above bar graph represent?
(b) In which year was production the least?
(c) After which year was the maximum rise in the production?
(d) Find the average production of rice during the 5 years.
(e) Find difference of rice production between years 2006 and 2008.
04062014
© NCERT
not to
be re
publi
shed
82 EXEMPLAR PROBLEMS
MATHEMATICS
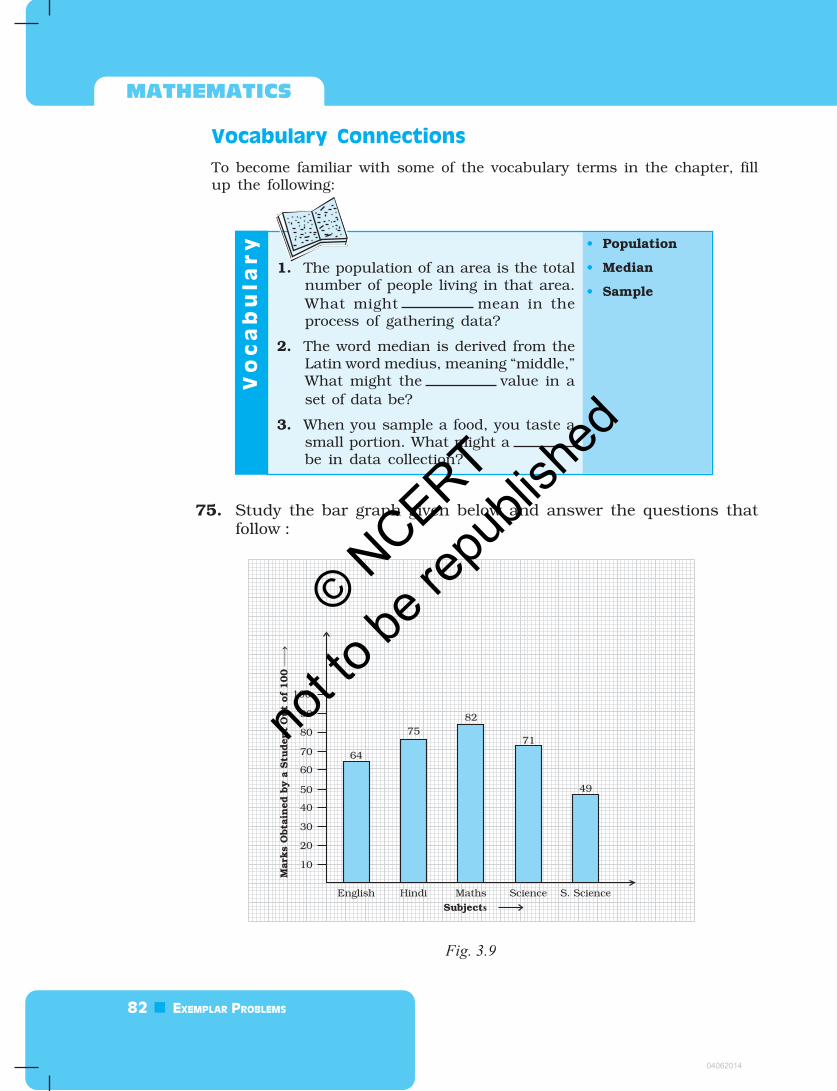
75. Study the bar graph given below and answer the questions thatfollow :
Fig. 3.9
To become familiar with some of the vocabulary terms in the chapter, fillup the following:
Vocabulary Connections
Vo
ca
bu
la
ry
1. The population of an area is the totalnumber of people living in that area.
What might mean in theprocess of gathering data?
2. The word median is derived from theLatin word medius, meaning “middle,”What might the value in a
set of data be?
3. When you sample a food, you taste asmall portion. What might abe in data collection?
• Population
• Median
• Sample
04062014
© NCERT
not to
be re
publi
shed
DATA HANDLING 83
UNIT 3
(a) What information is depicted from the bar graph?
(b) In which subject is the student very good?
(c) Calculate the average marks of the student.
(d) If 75 and above marks denote a distinction, then name thesubjects in which the student got distinction.
(e) Calculate the percentage of marks the student got out of 500.
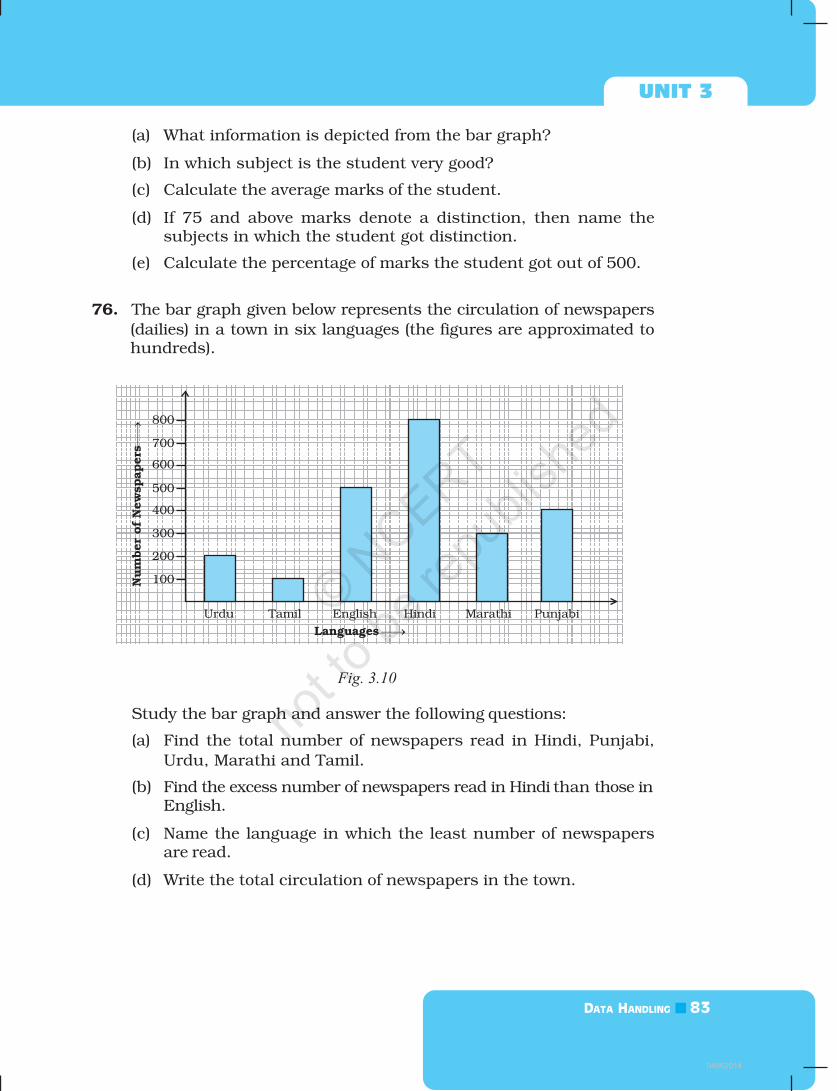
76. The bar graph given below represents the circulation of newspapers
(dailies) in a town in six languages (the figures are approximated tohundreds).
Fig. 3.10
Study the bar graph and answer the following questions:
(a) Find the total number of newspapers read in Hindi, Punjabi,
Urdu, Marathi and Tamil.
(b) Find the excess number of newspapers read in Hindi than those inEnglish.
(c) Name the language in which the least number of newspapersare read.
(d) Write the total circulation of newspapers in the town.
04062014
© NCERT
not to
be re
publi
shed
84 EXEMPLAR PROBLEMS
MATHEMATICS
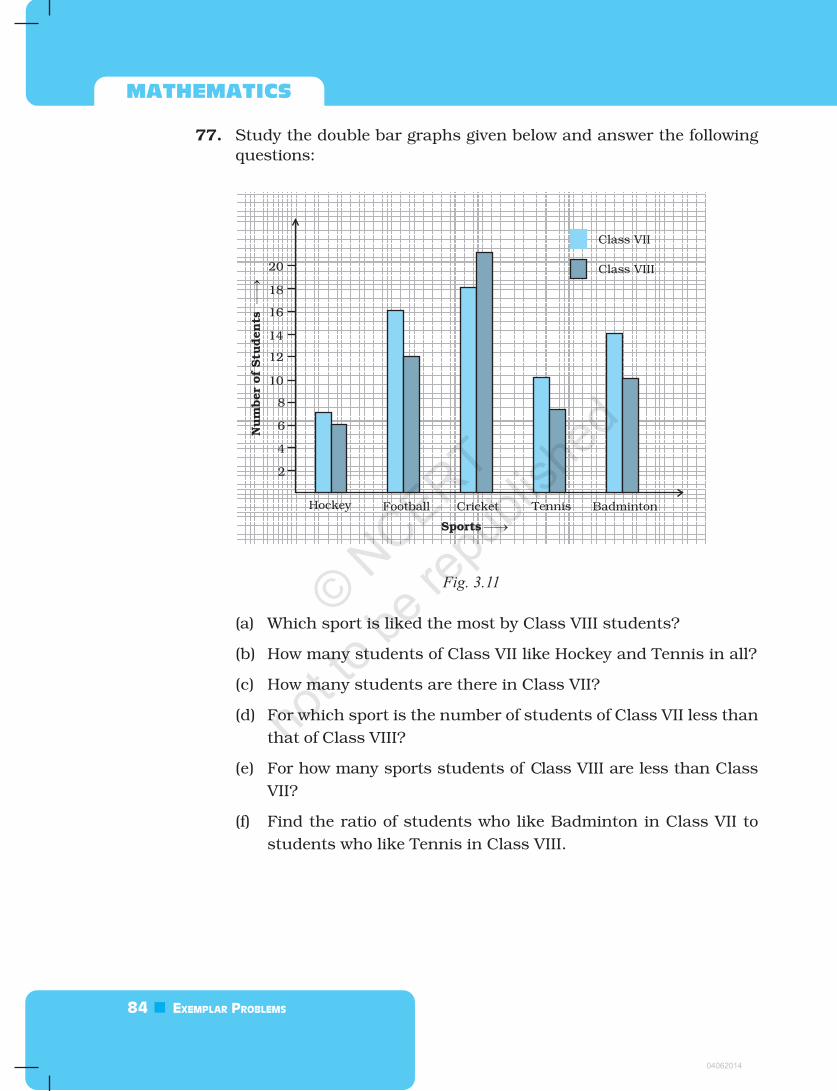
77. Study the double bar graphs given below and answer the following
questions:
Fig. 3.11
(a) Which sport is liked the most by Class VIII students?
(b) How many students of Class VII like Hockey and Tennis in all?
(c) How many students are there in Class VII?
(d) For which sport is the number of students of Class VII less than
that of Class VIII?
(e) For how many sports students of Class VIII are less than Class
VII?
(f) Find the ratio of students who like Badminton in Class VII to
students who like Tennis in Class VIII.
04062014
© NCERT
not to
be re
publi
shed

DATA HANDLING 85
UNIT 3
78. Study the double bar graph shown below and answer the questions
that follow:
Fig. 3.12
(a) What information is represented by the above double bar graph?
(b) In which month sales of Brand A decreased as compared to the
previous month?
(c) What is the difference in sales of both the Brands for the month
of June?
(d) Find the average sales of Brand B for the six months.
(e) List all months for which the sales of Brand B was less than
that of Brand A.
(f) Find the ratio of sales of Brand A as compared to Brand B for
the month of January.
04062014
© NCERT
not to
be re
publi
shed

86 EXEMPLAR PROBLEMS
MATHEMATICS
79. Study the double bar graph given below and answer the questions
that follow:
Fig. 3.13
(a) What information is compared in the above given double bar graph?
(b) Calculate the ratio of minimum temperatures in the year 2008
to the year 2009 for the month of November.
(c) For how many months was the minimum temperature in the
year 2008 greater than that of year 2009? Name those months.
(d) Find the average minimum temperature for the year 2008 for
the four months.
(e) In which month is the variation in the two temperatures
maximum?
80. The following table shows the average intake of nutrients in calories
by rural and urban groups in a particular year. Using a suitable scale
for the given data, draw a double bar graph to compare the data.
04062014
© NCERT
not to
be re
publi
shed
DATA HANDLING 87
UNIT 3
Foodstuff Rural Urban
Pulses 35 49
Leafy vegetables 14 21
Other vegetables 51 89
Fruits 35 66
Milk 70 250
Fish and flesh foods 10 22
Fats and Oils 9 35
Sugar/Jaggery 19 31
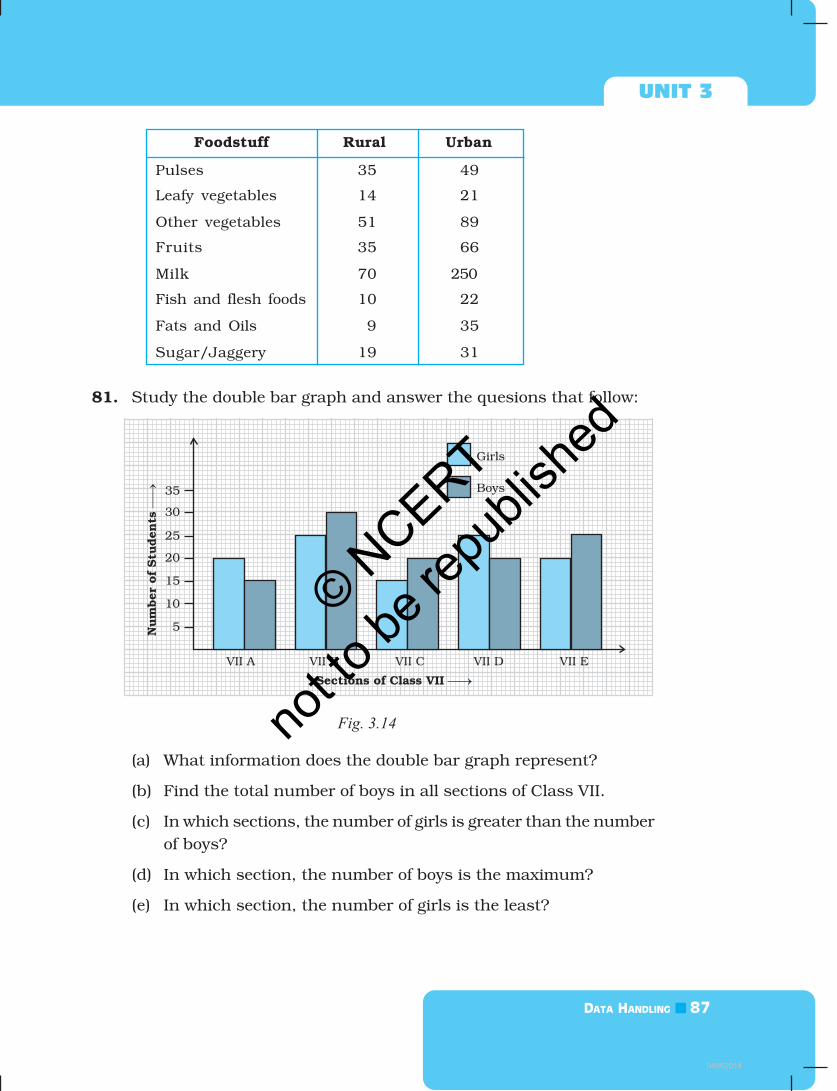
81. Study the double bar graph and answer the quesions that follow:
Fig. 3.14
(a) What information does the double bar graph represent?
(b) Find the total number of boys in all sections of Class VII.
(c) In which sections, the number of girls is greater than the number
of boys?
(d) In which section, the number of boys is the maximum?
(e) In which section, the number of girls is the least?
04062014
© NCERT
not to
be re
publi
shed

88 EXEMPLAR PROBLEMS
MATHEMATICS
82. In a public library, the following observations were recorded by the
librarian in a particular week:
Days Mon Tues Wed Thurs Fri Sat
Newspaper 400 600 350 550 500 350Readers
Magazine 150 100 200 300 250 200
Readers
(a) Draw a double bar graph choosing an appropriate scale.
(b) On which day, the number of readers in the library was maximum?
(c) What is the mean number of magazine readers?
83. Observe the following data:
Government School, Chandpur
Daily Attendance Date : 15.4.2009
Class Total Students Number of StudentsPresent on that Day
VI 90 81
VII 82 76
VIII 95 91
IX 70 65
X 63 62
(a) Draw a double bar graph choosing an appropriate scale. What
do you infer from the bar graph?
(b) Which class has the maximum number of students?
(c) In which class, the difference of total students and number of
students present is minimum?
(d) Find the ratio of number of students present to the total number
of students of Class IX.
(e) What per cent of Class VI students were absent?
04062014
© NCERT
not to
be re
publi
shed

DATA HANDLING 89
UNIT 3
84. Observe the given data:
Days of Mon Tues Wed Thurs Fri Sat
the Week
Number of 50 45 30 55 27 60Mobile Phone
Sets Sold
(a) Draw a bar graph to represent the above given information.
(b) On which day of the week was the sales maximum?
(c) Find the total sales during the week.
(d) Find the ratio of the minimum sale to the maximum sale.
(e) Calculate the average sale during the week.
(f) On how many days of the week was the sale above the averagesales?
Plan a Strategy
• Identify too much/too little Information.
When you read a problem, you must decide if the problem has too much
or too little information. If the problem has too much information, youmust decide what information to use to solve the problem. If the problemhas too little information, then you should determine what additionalinformation you need to solve the problem.
• Read the problems below and decide if there is too much or too little
information in each problem. If there is too much information, tell whatinformation you would use to solve the problem. If there is too littleinformation, tell what additional information you would need to solvethe problem.
• On Monday, 20 students tookan examination. There were
10 students who scored above85 and 10 students whoscored below 85. What wasthe average score?
• Aayesha is practising for amarathon. She ran for 50
minutes on Monday, 70 minuteson Wednesday, and 45 minuteson Friday. On Tuesday andThursday, she lifted weights atthe gym for 45 minutes each day.
She swam for 45 minutes overthe weekend. What was theaverage amount of time per dayAayesha spent running lastweek?
04062014
© NCERT
not to
be re
publi
shed

90 EXEMPLAR PROBLEMS
MATHEMATICS
85. Below is a list of 10 tallest buildings in India.
This list ranks buildings in India that stand at least 150m (492 ft.)tall, based on standard height measurement. This includes spires
and architectural details but does not include antenna marks.Following data is given as per the available information till 2009.Since new buildings are always under construction, go on-line to
check new taller buildings.
Use the information given in the table about sky scrapers to answer
the following questions:
Name City Height Floors Year
Planet Mumbai 181m 51 2009
UB Tower Bengaluru 184 m 20 2006
Ashok Towers Mumbai 193 m 49 2009
The Imperial I Mumbai 249 m 60 2009
The Imperial II Mumbai 249 m 60 2009
RNA Mirage Mumbai 180 m 40 2009
Oberoi Woods Tower I Mumbai 170 m 40 2009
Oberoi Woods Tower II Mumbai 170 m 40 2009
Oberoi Woods Tower III Mumbai 170 m 40 2009
MVRDC Mumbai 156 m 35 2002
(a) Find the height of each storey of the three tallest buildings andwrite them in the following table:
Building Height Number of Height of
Storeys Each Storey
(b) The average height of one storey for the buildings given in (a) is______________.
(c) Which city in this list has the largest percentage of skyscrappers?
What is the percentage?
(d) What is the range of data?
(e) Find the median of the data.
(f) Draw a bar graph for given data.
04062014
© NCERT
not to
be re
publi
shed

DATA HANDLING 91
UNIT 3
86. The marks out of 100 obtained by Kunal and Soni in the Half Yearly
Examination are given below:
Subjects English Hindi Maths Science S. Science Sanskrit
Kunal 72 81 92 96 64 85
Soni 86 89 90 82 75 82
(a) Draw a double bar graph by choosing appropriate scale.
(b) Calculate the total percentage of marks obtained by Soni.
(c) Calculate the total percentage of marks obtained by Kunal.
(d) Compare the percentages of marks obtained by Kunal and Soni.
(e) In how many subjects did Soni get more marks than Kunal?Which are those subjects?
(f) Who got more marks in S. Science and what was the differenceof marks?
(g) In which subject the difference of marks was maximum and by
how much?
87. The students of Class VII have to choose one club from Music, Dance,
Yoga, Dramatics, Fine arts and Electronics clubs. The data givenbelow shows the choices made by girls and boys of the class. Studythe table and answer the questions that follow:
Clubs Music Dance Yoga Dramatics Fine Arts Electronics
Girls 15 24 10 19 27 21
Boys 12 16 8 17 11 30
(a) Draw a double bar graph using appropriate scale to depict theabove data.
(b) How many students are there in Class VII?
(c) Which is the most preferred club by boys?
(d) Which is the least preferred club by girls?
(e) For which club the difference between boys and girls is the least?
(f) For which club is the difference between boys and girls the
maximum?
04062014
© NCERT
not to
be re
publi
shed
92 EXEMPLAR PROBLEMS
MATHEMATICS
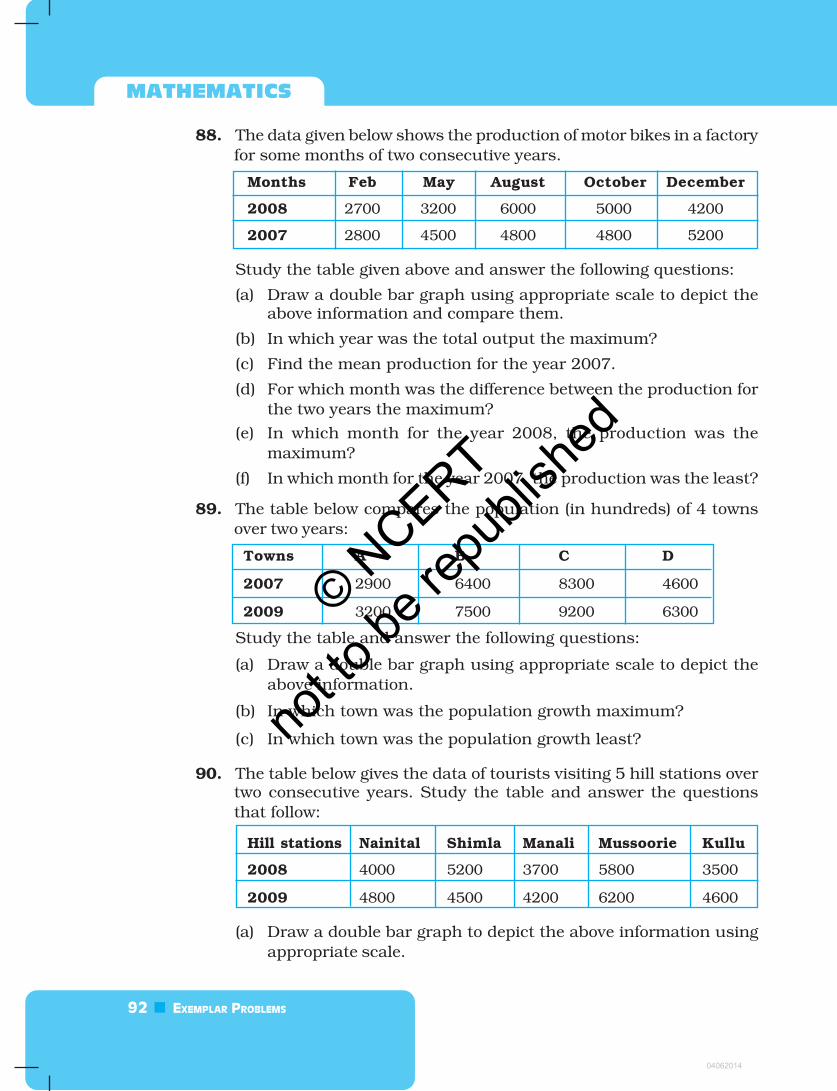
88. The data given below shows the production of motor bikes in a factory
for some months of two consecutive years.
Months Feb May August October December
2008 2700 3200 6000 5000 4200
2007 2800 4500 4800 4800 5200
Study the table given above and answer the following questions:
(a) Draw a double bar graph using appropriate scale to depict theabove information and compare them.
(b) In which year was the total output the maximum?
(c) Find the mean production for the year 2007.
(d) For which month was the difference between the production for
the two years the maximum?
(e) In which month for the year 2008, the production was the
maximum?
(f) In which month for the year 2007, the production was the least?
89. The table below compares the population (in hundreds) of 4 towns
over two years:
Towns A B C D
2007 2900 6400 8300 4600
2009 3200 7500 9200 6300
Study the table and answer the following questions:
(a) Draw a double bar graph using appropriate scale to depict the
above information.
(b) In which town was the population growth maximum?
(c) In which town was the population growth least?
90. The table below gives the data of tourists visiting 5 hill stations overtwo consecutive years. Study the table and answer the questions
that follow:
Hill stations Nainital Shimla Manali Mussoorie Kullu
2008 4000 5200 3700 5800 3500
2009 4800 4500 4200 6200 4600
(a) Draw a double bar graph to depict the above information using
appropriate scale.
04062014
© NCERT
not to
be re
publi
shed

DATA HANDLING 93
UNIT 3
(b) Which hill station was visited by the maximum number of
tourists in 2008?
(c) Which hill station was visited by the least number of tourists in
2009?
(d) In which hill stations was there increase in number of touristsin the year 2009?
91. The table below gives the flavours of ice cream liked by children(boys and girls) of a society.
Flavours Vanilla Chocolate Strawberry Mango Butterscotch
Boys 4 9 3 8 13
Girls 8 12 7 9 10
Study the table and answer the following questions:
(a) Draw a double bar graph using appropriate scale to representthe above information.
(b) Which flavour is liked the most by the boys?
(c) How many girls are there in all?
(d) How many children like chocolate flavour of ice cream?
(e) Find the ratio of children who like strawberry flavour to vanillaflavour of ice cream.
(D) Applications
Application 1: Create a table like the one shown
Object Estimate Measure(in cm) (in cm)
Length of a pen
Length of an eraser
Length of your palm
Length of yourgeometry box
Length of your
math notebook
Draw a double bar graph for the above. How accurate are your
estimations?
04062014
© NCERT
not to
be re
publi
shed
94 EXEMPLAR PROBLEMS
MATHEMATICS
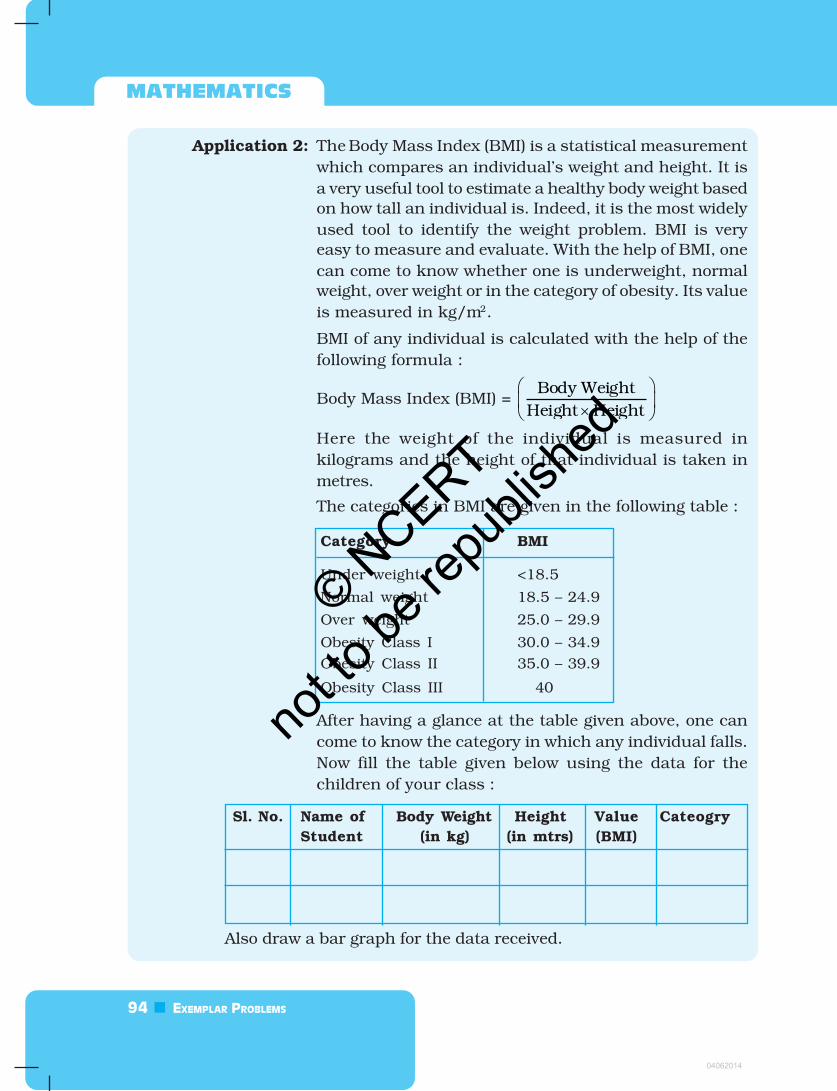
Application 2: The Body Mass Index (BMI) is a statistical measurement
which compares an individual’s weight and height. It is
a very useful tool to estimate a healthy body weight based
on how tall an individual is. Indeed, it is the most widely
used tool to identify the weight problem. BMI is very
easy to measure and evaluate. With the help of BMI, one
can come to know whether one is underweight, normal
weight, over weight or in the category of obesity. Its value
is measured in kg/m2.
BMI of any individual is calculated with the help of the
following formula :
Body Mass Index (BMI) =
×
Body Weight
Height Height
Here the weight of the individual is measured in
kilograms and the height of that individual is taken in
metres.
The categories in BMI are given in the following table :
Category BMI
Under weight <18.5
Normal weight 18.5 – 24.9
Over weight 25.0 – 29.9
Obesity Class I 30.0 – 34.9
Obesity Class II 35.0 – 39.9
Obesity Class III 40
After having a glance at the table given above, one can
come to know the category in which any individual falls.
Now fill the table given below using the data for the
children of your class :
Sl. No. Name of Body Weight Height Value Cateogry
Student (in kg) (in mtrs) (BMI)
Also draw a bar graph for the data received.
04062014
© NCERT
not to
be re
publi
shed
DATA HANDLING 95
UNIT 3
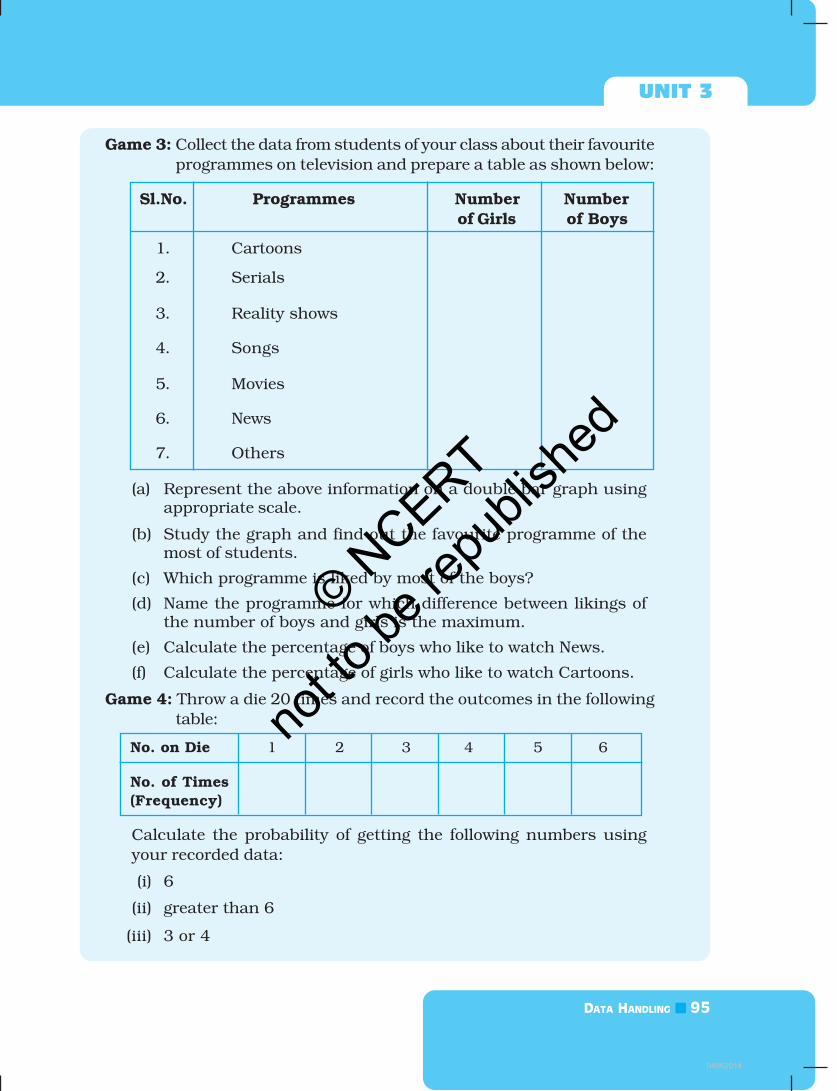
Game 3: Collect the data from students of your class about their favourite
programmes on television and prepare a table as shown below:
Sl.No. Programmes Number Numberof Girls of Boys
1. Cartoons
2. Serials
3. Reality shows
4. Songs
5. Movies
6. News
7. Others
(a) Represent the above information on a double bar graph usingappropriate scale.
(b) Study the graph and find out the favourite programme of themost of students.
(c) Which programme is liked by most of the boys?
(d) Name the programme for which difference between likings ofthe number of boys and girls is the maximum.
(e) Calculate the percentage of boys who like to watch News.
(f) Calculate the percentage of girls who like to watch Cartoons.
Game 4: Throw a die 20 times and record the outcomes in the following
table:
No. on Die 1 2 3 4 5 6
No. of Times
(Frequency)
Calculate the probability of getting the following numbers using
your recorded data:
(i) 6
(ii) greater than 6
(iii) 3 or 4
04062014
© NCERT
not to
be re
publi
shed
96 EXEMPLAR PROBLEMS
MATHEMATICS
Write about your observation about the certainty of getting any
particular number by throwing a die.
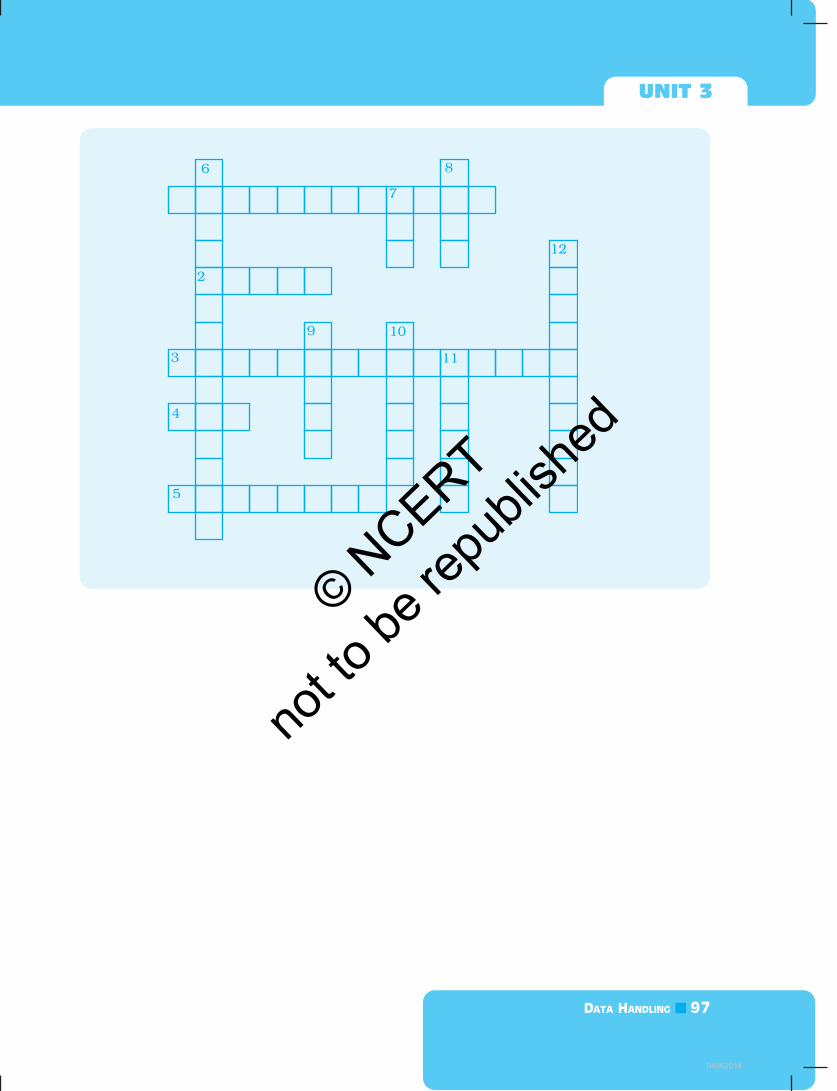
Cross Word Puzzle 5
Solve the given crossword and then fill up the given blanks and
then boxes. Clues are given below for across as well as downward
filling. Also for across and down clues. Clue number is written at
the corner of boxes. Answers of clues have to fill up their respective
boxes.
Clues
Across
1. Arranging the collected
data in tabular form is
called _______ of data.
2. Mean is defined as sum of
all observations divided by
________ number of
observations.
3. Mean, median and mode
are collectively known as
measures of ________.
4. Throwing a die gives
________ possible
outcomes.
5. A ________ is the
representation of data
using bars of uniform
width and varying
heights.
Down
6. The most common
representative value of a
group of data is the _______.
7. Tossing a coin gives
outcomes.
8. The observation that occurs
most often is called the _____.
9. The difference between the
highest and lowest
observations gives the ______.
10. gives the middle
observation of a given data.
11. A _______ bar graph helps in
comparing two collections of
data at a glance.
12. The number of times each
observation occurs can be
represented by ________.
04062014
© NCERT
not to
be re
publi
shed
DATA HANDLING 97
UNIT 3
04062014
© NCERT
not to
be re
publi
shed