ambient water quality guidelines for selenium technical ... · rosie barlak, bruce carmichael, jody...
TRANSCRIPT

Ministry of Environment
Province of British Columbia
Ambient Water Quality Guidelines for Selenium
Technical Report
Update
April 2014
Water Protection and Sustainability Branch
Environmental Sustainability and Strategic Policy Division
British Columbia Ministry of Environment

ii
Prepared by:
J.M. Beatty and G.A. Russo
Ambient water quality guidelines for Selenium Technical Report Update
ISBN 978-0-7726-6740-3

iii
Acknowledgements
The authors would like to thank the following individuals for their help and advice in the preparation of
and contribution to the updated selenium water quality guideline technical appendix:
Jenny Bourhill, BC Ministry of Agriculture and Lands Library, and John Pinn, BC Ministry of Forests and
Range Library, Victoria BC;
Dr. Cindy Meays, Kevin Rieberger and George Butcher, Water Sustainability Branch, BC Ministry of
Environment, Victoria BC;
Dr. Carl Schwarz, Department of Statistics & Actuarial Science, Simon Fraser University, Burnaby BC;
Dr. Narender Nagpal, Victoria BC;
Don MacDonald, MacDonald Environment Services Ltd., Nanaimo BC;
Pat Shaw, Environmental Quality Guidelines Specialist, Environment Canada, Vancouver BC;
Charles Delos and Gary Russo, US Environmental Protection Agency, Washington DC, (US);
Dennis McIntyre, Great Lakes Environmental Centre, Columbus OH, (US);
Renee Peterson, Newfoundland and Labrador Department of Environment and Conservation, St. John’s NL;
Cynthia Crane, PEI Department of Environment, Energy and Forestry, Charlottetown PEI;
Bob Truelson, Yukon Department of Environment, Whitehorse YT;
Sylvie Cloutier and Isabelle Guay, Ministère du Développement durable, de l'Environnement et des Parcs du
Québec, Québec QC;
Michele Giddings, Water Quality and Health Bureau, Health Canada, Ottawa ON;
Geneviève Tardif and Julie Boyer, Water Science and Technology Branch, Environment Canada, Gatineau, QC;
Carline Rocks, Provincial Water Quality Monitoring Network (PWQMN), Ontario Ministry of Environment,
Etobicoke ON;
Daryl McGoldrick, Water Quality Monitoring and Surveillance Division, Canada Centre for Inland Waters,
Environment Canada, Burlington ON;
Melissa Gledhill, Freshwater Surveillance Scientist, Science and Technology Branch, Environment Canada,
Vancouver BC;
Kevin Jacobs, Manitoba Department of Water Stewardship, Winnipeg MB ;
Darrell Taylor, Water and Wastewater Branch, Nova Scotia Environment, Halifax NS;
Don Fox, New Brunswick Department of Environment, Fredericton NB;
Alina Wolanski, Northern Region Limnologist, Alberta Environment, Edmonton AB;
Leigh Noton, Environment and Sustainable Resource Development, Edmonton AB;
Rosie Barlak, Bruce Carmichael, Jody Fisher, Liz Freyman, Tracy Henderson, James Jacklin, Kara Przeczek
and Chris Swan, Regional Environmental Impact Assessment Biologists, BC Ministry of Environment;
Weiping Zhang; Health Risk Assessment Specialist, Scientist Surveillance and Assessment Alberta and
Wellness, Edmonton AB;
Mike Zemanek, Director, Healthy Communities, Population and Public Health, BC Ministry of Health. Victoria
BC;
Joanne Edwards, Human Health Risk Assessment Specialist, Population and Public Health, BC Ministry of
Health. Victoria BC;
J. Ivor Norlin, Manager, Infrastructure Programs, Interior Health Authority, Salmon Arm BC;
Carl Alleyne, Regional Environmental Assessment Coordinator, Health Canada, Burnably, BC.
Sanya Petrovic, Senoir Advisor, Contaminated Sites Division, Health Canada, Ottawa, ON;
Mark Feeley, Associate Director, Bureau of Chemical Safety, Health Canada, Ottawa, ON;
B. Baginska, San Francisco Bay Regional Water Quality Control Board, San Francisco CA, (US).
Thanks to all those who provided comments during the public review and editing of this document.

iv
Table of Contents
Glossary…………………………………………………………………………………………..x
1.0 Executive Summary ............................................................................................................. 2
2.0 Introduction .......................................................................................................................... 5
2.1 BC Approved Ambient Water Quality Guidelines .......................................................... 5
2.2 Derivation of Ambient Water Quality Guidelines for Selenium...................................... 7
2.2.1 Human Health Guidelines for Selenium ............................................................... 7
2.2.2 Guidelines for the Protection of Aquatic Life....................................................... 8
2.3 History .............................................................................................................................. 9
2.3.1 Observations of Deficiency and Toxicity in Livestock ...................................... 10
2.3.2 Observations of Deficiency and Toxicity in Humans ......................................... 11
2.3.3 Ecological Toxicity and Impacts ........................................................................ 12
3.0 Physical and Chemical Properties ...................................................................................... 13
4.0 Selenium in the Environment............................................................................................. 18
4.1 Sources ........................................................................................................................... 18
4.1.1 Natural Sources ................................................................................................... 18
4.1.2 Anthropogenic Sources ....................................................................................... 19
4.1.3 Production and Uses ........................................................................................... 20
4.2 Environmental Concentrations of Selenium .................................................................. 22
4.2.1 Air ....................................................................................................................... 22
4.2.2 Soils..................................................................................................................... 25
4.2.3 Terrestrial Plants ................................................................................................. 27
4.2.4 Water ................................................................................................................... 31
4.2.4.1 Marine Water ................................................................................................... 31
4.2.4.2 Groundwater .................................................................................................... 32
4.2.4.3 Surface (Fresh) Water ...................................................................................... 33
4.2.5 Sediment ............................................................................................................. 41
4.2.6 Aquatic Biota ...................................................................................................... 46
4.2.6.1 Microbes and Algae ......................................................................................... 46
4.2.6.2 Macrophytes .................................................................................................... 49
4.2.6.3 Invertebrates .................................................................................................... 50

v
4.2.6.4 Vertebrates ....................................................................................................... 52
4.2.6.5 Fish .................................................................................................................. 53
4.2.6.6 Birds................................................................................................................. 60
4.2.6.7 Amphibians and Reptiles ................................................................................. 64
4.2.6.8 Mammalian Wildlife ........................................................................................ 64
5.0 Environmental Fate and Persistence .................................................................................. 68
5.1 Processes in the Aquatic Selenium Cycle ...................................................................... 69
5.2 Physical and Biological Processes ................................................................................. 71
5.3 Factors Affecting the Fate of Selenium.......................................................................... 73
5.4 Selenium Behaviour in the Environment ....................................................................... 76
6.0 Selenium Bioaccumulation ................................................................................................ 78
6.1 Quantifying Bioaccumulation ........................................................................................ 80
6.2 Factors Affecting Bioaccumulation ............................................................................... 84
6.2.1 Selenium Speciation............................................................................................ 85
6.2.2 Physical Environment ......................................................................................... 86
6.2.3 Influences of Other Compounds and Elements .................................................. 87
6.2.4 Species-Specific Variation in Selenium Uptake ................................................. 90
7.0 Deficiency and Toxicity of Selenium ................................................................................ 92
7.1 Effects on Human Health ............................................................................................... 92
7.1.1 Exposure in Humans ........................................................................................... 92
7.1.1.1 Dermal ............................................................................................................. 93
7.1.1.2 Air .................................................................................................................... 93
7.1.1.3 Selenium Species in Foods .............................................................................. 93
7.1.1.4 Selenium Intake from Food ............................................................................. 94
7.1.1.5 Selenium Intake from Dietary Supplements .................................................... 96
7.1.1.6 Selenium Intake from Drinking Water ............................................................ 96
7.1.2 Pharmacokinetics in Humans .............................................................................. 96
7.1.3 Essentiality and Deficiency ................................................................................. 98
7.1.4 Human Toxicity and Toxicological Reference Values ..................................... 100
7.2 Toxicity in Aquatic Organisms .................................................................................... 102
7.2.1 Mode of Action of Selenium............................................................................. 102

vi
7.2.2 Teratogenicity ................................................................................................... 104
7.3 Factors Affecting Selenium Toxicity in the Aquatic Environment.............................. 106
7.4 Toxicity of Selenium to Aquatic Organisms ................................................................ 108
7.4.1 Short-Term (Acute) Toxicity ............................................................................ 109
7.4.2 Chronic Toxicity ............................................................................................... 112
7.4.2.1 Microorganisms and Invertebrates ................................................................ 113
7.4.2.2 Vertebrates ..................................................................................................... 115
7.4.2.3 Fish ................................................................................................................ 115
7.4.2.4 Birds............................................................................................................... 119
7.4.2.5 Amphibians and Reptiles ............................................................................... 120
7.4.2.6 Mammals ....................................................................................................... 121
7.4.3 Chronic Toxicity Thresholds for Selenium....................................................... 121
7.4.3.1 Water ............................................................................................................. 121
7.4.3.2 Sediment ........................................................................................................ 124
7.4.3.3 Microorganisms and Invertebrates ................................................................ 126
7.4.3.4 Dietary ........................................................................................................... 127
7.4.3.5 Fish Tissues ................................................................................................... 130
7.4.3.6 Bird Tissues ................................................................................................... 135
7.4.3.7 Amphibians and Reptiles ............................................................................... 136
8.0 Guidelines for Selenium .................................................................................................. 137
8.1 Summary of Existing Environmental Quality Guidelines for Selenium ...................... 137
8.2 Guideline Approach ..................................................................................................... 145
8.3 Guidelines for the Protection of Human Health ........................................................... 147
8.3.1 Drinking Water Guideline ................................................................................. 147
8.3.2 Health-based Selenium Screening Value in Fish Tissue .................................. 149
8.3.2.1 Exposure Assessments in Fish Tissue in Canada and the US ....................... 149
8.3.2.2 BC Health-based Screening Value for Selenium in Fish Tissue ................... 152
8.4 Aquatic Life.................................................................................................................. 156
8.4.1 Water Column Guideline .................................................................................. 160
8.4.2 Sediment Guideline ........................................................................................... 164
8.4.3 Tissue Guidelines .............................................................................................. 167

vii
8.4.3.1 Dietary Tissue ................................................................................................ 168
8.4.3.2 Egg/Ovary Tissue .......................................................................................... 174
8.4.3.3 Whole-Body Tissue ....................................................................................... 182
8.4.3.4 Muscle Tissue ................................................................................................ 189
8.5 Guidelines for the Protection of Wildlife ..................................................................... 193
8.6 Recreational Use and Aesthetics .................................................................................. 201
8.7 Irrigation and Livestock Watering ............................................................................... 201
8.8 Industrial Uses .............................................................................................................. 202
9.0 Monitoring and Analytical Considerations for Selenium Analysis ................................. 202
10.0 References ........................................................................................................................ 207
Appendix A – Fish Tissue Regression Model ..………………………………………………..255
Appendix B – Summary of Consumption Guidelines for Utah, Michigan and West Virginia...256

viii
List of Tables
Table 1.1 List of updated and previous WQGs for selenium recommended for use in British
Columbia. Water concentrations are measured as total selenium. Details on guideline
derivation may be found in Section 8. ......................................................................... 4
Table 3.1 Examples of the forms of selenium found in the environment (adapted from Haygarth
1994, Terry et al. 2000, Simmons and Wallschlager 2005, and Maher et al. 2011). 15
Table 4.1 Typical and background selenium concentrations in air. ............................................ 24
Table 4.2 Background soil selenium concentrations reported in the literature for locations in
Canada. ....................................................................................................................... 26
Table 4.3 Summary of literature thresholds for Se concentrations in forage crops considered
deficient, acceptable, or toxic to livestock. ................................................................ 28
Table 4.4 Selenium concentrations measured in grasses and legumes in BC collected between
1966 and 1973, listed in order from highest to lowest (from Miltimore et al. 1975). 31
Table 4.5 Summary of surface water quality data across Canada (other than in BC) for
background or minimally influenced locations. ......................................................... 35
Table 4.6 Mean (SD) water concentrations of selenium measured in various river systems in BC.
.................................................................................................................................... 40
Table 4.7 Summary of sediment selenium values reported in eastern Canadian provinces. ....... 43
Table 4.8 Summary of sediment selenium concentrations at locations sampled in western
Canada. ....................................................................................................................... 45
Table 4.9 Summary of selenium tissue concentrations in planktonic algae and biofilm from sites
in western Canada. ..................................................................................................... 48
Table 4.10 Summary of invertebrate and zooplankton tissue selenium concentrations from
Canadian studies. ....................................................................................................... 51
Table 4.11 Summary of selenium in fish tissues for monitoring sites in eastern Canada (data
obtained from Environment Canada, converted from ww to dw assuming 75%
moisture content1). ..................................................................................................... 55
Table 4.12 Summary of Se concentrations in various fish species and tissue types from western
Canada. ....................................................................................................................... 57
Table 4.13 Summary of selenium concentrations in bird tissues collected at sites in Canada. ... 63

ix
Table 4.14 Summary of selenium concentrations in mammalian species measured in tissues at
various locations across North America (units in dry weight unless otherwise stated).
.................................................................................................................................... 67
Table 6.1 Summary of bioaccumulation and bioconcentration factors found in various
compartments based on studies on freshwater organisms. ........................................ 82
Table 7.1 Average dietary intake of Se has been published by Health Canada (2005; 2006;
2007a) for various age-sex groups. ............................................................................ 95
Table 7.2 Selenium dietary reference intake values for humans (IOM 2000; Health Canada
2003). ......................................................................................................................... 99
Table 7.3 Tolerable daily intake of selenium by age group (Health Canada 2010d). ............... 101
Table 7.4 Examples of short-term (acute) toxicological thresholds reported for some invertebrate
species to water-only exposures of selenium. .......................................................... 111
Table 7.5 Examples of short-term toxicity thresholds for mortality in fish species in water-only
exposures of selenium. ............................................................................................. 112
Table 7.6 Examples of literature-based chronic effect thresholds, risk benchmarks and
concentrations of concern for water. ........................................................................ 124
Table 7.7 Examples of literature-based sediment selenium toxicity thresholds suggested for the
protection of fish and wildlife. ................................................................................. 126
Table 7.8 Examples of some suggested literature-based selenium toxicity thresholds for
invertebrates. ............................................................................................................ 127
Table 7.9 Examples of literature-based dietary Se toxicity thresholds for the protection of fish
and birds. .................................................................................................................. 129
Table 7.10 Examples of literature-based selenium toxicity thresholds for fish. ........................ 131
Table 7.11 Examples of literature-based selenium toxicity thresholds for birds. ...................... 136
Table 7.12 Some published selenium toxicity thresholds for amphibians and reptiles. ............ 137
Table 8.1 Summary of human health drinking water and tissue residue guidelines and criteria.
.................................................................................................................................. 138
Table 8.2 Summary of existing selenium water quality guidelines, criteria or objectives for the
protection of freshwater and marine aquatic life. .................................................... 139
Table 8.3 Summary of US State water quality standards or site-specific standards developed for
water. ........................................................................................................................ 140

x
Table 8.4 Summary of selenium sediment and soil quality guidelines, criteria or objectives
developed by other jurisdictions and previously by BC MoE for the protection of
freshwater and marine aquatic life and soil organisms (respectively). .................... 142
Table 8.5 Summary of water and tissue residue selenium guidelines and site-specific criteria
developed for the protection of fish and wildlife. .................................................... 144
Table 8.6 Summary of selenium guidelines and objectives developed by other jurisdictions and
previously by BC MoE, for the agricultural water uses of crop irrigation and
livestock watering. ................................................................................................... 145
Table 8.7 Drinking water guidelines for selenium from various jurisdictions. ......................... 148
Table 8.8 US EPA selenium screening values for sport and subsistence fishers. ..................... 150
Table 8.9 Fish contaminant goals for selenium in California sport fish are levels that pose no
significant risk to individuals consuming sport fish at a standard rate (32 g/day). .. 152
Table 8.10 Advisory tissue levels for a range of selenium concentrations in California sport fish
and corresponding consumption recommendations. ................................................ 152
Table 8.11 Screening values for rates of average, moderate and high fish consumption. ......... 155
Table 8.12 Published dietary effect thresholds for selenium toxicity on fish and bird species. 172
Table 8.13 Summary of egg/ovary toxicity thresholds for fish from studies with combined water
and dietary exposure. ............................................................................................... 177
Table 8.14 Summary of whole-body Se toxicity thresholds for reproductive and non-
reproductive end points in fish, including studies with dietary and water-only Se
exposure. .................................................................................................................. 184
Table 8.15 Summary of toxicity thresholds based on muscle selenium concentrations for various
fish species. .............................................................................................................. 192
Table 8.16 Toxicity thresholds for various bird species based on mean egg selenium
concentrations (µg/g dw). ........................................................................................ 197
xi
List of Figures
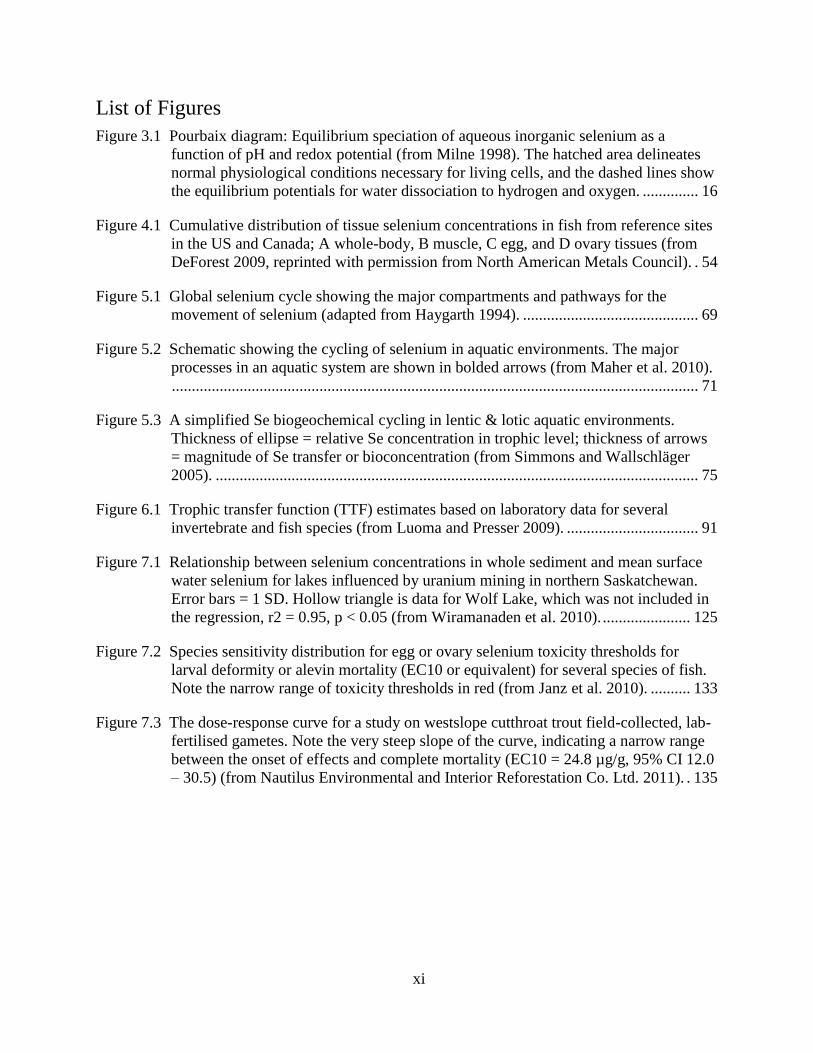
Figure 3.1 Pourbaix diagram: Equilibrium speciation of aqueous inorganic selenium as a
function of pH and redox potential (from Milne 1998). The hatched area delineates
normal physiological conditions necessary for living cells, and the dashed lines show
the equilibrium potentials for water dissociation to hydrogen and oxygen. .............. 16
Figure 4.1 Cumulative distribution of tissue selenium concentrations in fish from reference sites
in the US and Canada; A whole-body, B muscle, C egg, and D ovary tissues (from
DeForest 2009, reprinted with permission from North American Metals Council). . 54
Figure 5.1 Global selenium cycle showing the major compartments and pathways for the
movement of selenium (adapted from Haygarth 1994). ............................................ 69
Figure 5.2 Schematic showing the cycling of selenium in aquatic environments. The major
processes in an aquatic system are shown in bolded arrows (from Maher et al. 2010).
.................................................................................................................................... 71
Figure 5.3 A simplified Se biogeochemical cycling in lentic & lotic aquatic environments.
Thickness of ellipse = relative Se concentration in trophic level; thickness of arrows
= magnitude of Se transfer or bioconcentration (from Simmons and Wallschläger
2005). ......................................................................................................................... 75
Figure 6.1 Trophic transfer function (TTF) estimates based on laboratory data for several
invertebrate and fish species (from Luoma and Presser 2009). ................................. 91
Figure 7.1 Relationship between selenium concentrations in whole sediment and mean surface
water selenium for lakes influenced by uranium mining in northern Saskatchewan.
Error bars = 1 SD. Hollow triangle is data for Wolf Lake, which was not included in
the regression, r2 = 0.95, p < 0.05 (from Wiramanaden et al. 2010). ...................... 125
Figure 7.2 Species sensitivity distribution for egg or ovary selenium toxicity thresholds for
larval deformity or alevin mortality (EC10 or equivalent) for several species of fish.
Note the narrow range of toxicity thresholds in red (from Janz et al. 2010). .......... 133
Figure 7.3 The dose-response curve for a study on westslope cutthroat trout field-collected, lab-
fertilised gametes. Note the very steep slope of the curve, indicating a narrow range
between the onset of effects and complete mortality (EC10 = 24.8 µg/g, 95% CI 12.0
– 30.5) (from Nautilus Environmental and Interior Reforestation Co. Ltd. 2011). . 135
xii
Glossary
Alert Concentration – is a concentration below the guideline but above which there may be a
risk to some environments and/or species that are particularly sensitive to Se bioaccumulation. If
alert concentrations are exceeded, a series of actions may be triggered to evaluate whether
impacts may be occurring and if necessary, mitigate the effects of Se.
Bioaccumulation – general term describing a process by which chemical substances are
accumulated by aquatic organisms from water directly or through consumption of fine suspended
particles, sediment and food containing the chemicals (CCME 1999). Bioaccumulation factors
(BAFs) are typically expressed as the ratio of the concentration of a chemical in an organism (or
tissue) to the concentration of that chemical in diet or from sediment in which the organism
resides (sometimes called a biota-sediment accumulation factor (BSAF).
Bioconcentration – a process by which there is a net accumulation of a chemical directly from
water alone into aquatic organisms resulting from simultaneous uptake (e.g., by gill or epithelial
tissue) and elimination (CCME 1999). Bioconcentration factors (BCFs) are expressed as the ratio
of a chemical in an organism (or tissue) to the concentration of that chemical in water.
Bioconcentration is sometimes used interchangeably with bioaccumulation where water is the
medium being compared to tissue.
Biofilm – refers to the layer of microscopic organisms (yeasts, bacteria, and algae) as well as
organic and inorganic particles, typically found living on rocks or sediment surfaces. Biofilm is a
term used in biology and engineering fields, and has become synonymous with periphyton.
These microbiota assemblages can be further differentiated by the strata on which they live
(rocks, mud, or sand) (Wetzel 2001).
Biogenic – produced by living organisms or biological processes.
Biomagnification – result of the processes of bioconcentration and bioaccumulation by which
tissue concentrations of bioaccumulated chemicals increase as the chemical passes up through
two or more trophic levels. The term implies an efficient transfer of chemicals from food to
consumer so that residue concentrations increase systematically from one trophic level to the
next (CCME 1999).
EC50 – a concentration of a pollutant or effluent at which 50 percent of the test organisms
display non-lethal effects.
ECX (or ICX) – A concentration of a pollutant or effluent at which x percentage of the test
organisms display non-lethal effects such as growth or reproduction (or inhibition) after a
specific exposure period.
Epilithon – epilithic periphyton or biofilm (the aggregate of attached algae, bacteria, yeast, and
fine particles) found on the surface of rocks or stone sediments (lotic environments) (Wetzel
2001).

xiii
Epipelon – epipelic periphyton or biofilm (the aggregate of algae, bacteria, yeast, and fine
particles) found on the surface of bottom sediments made up of finer organic matter (lentic
environments) (Wetzel 2001).
Euphotic zone –refers to the depth of water to which light penetrates sufficiently for
photosynthesis to occur (also called the photic zone).
Genus mean acute values (GMAVs) – US EPA’s method for estimating a mean acute (LC50)
value for a genus used in deriving water quality criteria.
Genus mean chronic values (GMCVs) – US EPA’s method for estimating a mean chronic
value for a genus used in deriving water quality criteria.
Herps/herptiles/herpetofauna – a term sometimes used for the classes of organisms that fall
under the general heading of amphibians and reptiles.
LC50 – a concentration of a pollutant or effluent at which 50 percent of the test organisms die,
commonly used to measure acute toxicity.
LCx – a concentration of a pollutant or effluent at which x percentage of the test organisms
display lethal effects after a specific exposure period.
Lentic – refers to waters that have relatively slow flushing rates (still water), such as lakes,
ponds, and wetlands.
Lowest observable effect concentration (LOEC) – the lowest tested concentration of a
substance that has been reported to cause harmful (adverse) effects on organisms tested.
Lotic – refers to flowing water that has high flushing rates, such as creeks, streams, and rivers.
Maximum acceptable toxicant concentration (MATC ) – the MATC is the geometric mean of
the NOEC and the LOEC for a chronic level exposure.
No observable effect concentration (NOEC) – the highest tested concentration of a substance
that has been reported to have no harmful (adverse) effects on organisms tested.
Thiols – a class of sulphur-containing compounds having the general formula RSH, also called
mercaptan.
Uncertainty factor (safety factor, application factor) – a mathematical adjustment made to
guideline values to account for incomplete knowledge.
Water Quality Guideline (WQG) – A maximum and/or minimum value for a physical,
chemical or biological characteristic of water, sediment or biota, applicable in British Columbia,
which should not be exceeded to prevent detrimental effects from occurring to a water use.
WQGs may be derived for the protection of six designated water uses, including:
drinking, public water supply, and food processing;
aquatic life;

xiv
wildlife;
agricultural (irrigation and livestock watering);
recreation and aesthetics; and,
industrial water supplies.
Water Quality Objective (WQO) – A WQO is best defined as a site-specific WQG. A water
quality objective may be derived in situations where the natural background concentrations of a
given variable exceed the BC-approved WQG, where there are ameliorating circumstances
affecting the toxicity of the contaminant in question, or the data used to derive the BC approved
WQG includes taxonomic groupings not present at the site in question.
Wet Weight – Analysis of tissue selenium (or other compounds) may be expressed as wet
weight or dry weight. Tissue analyses are reported on a wet-weight or “as-is” basis following
acid digestion of the sample by inductively coupled plasma spectrometry / mass spectrometry
(ICP/MS) or cold vapor atomic absorption (CVAA) techniques. Wet Weight data may be
converted to dry weight with a correct factor for moisture content, directly from moisture
analysis or by estimating tissue moisture from literature values.

2
1.0 Executive Summary
Selenium is a relatively rare trace element, but may be elevated in areas with soils that originate
from marine sedimentary deposits. The movement of Se from land to water occurs from both
natural processes (e.g., erosion) and human activities (e.g., mining) either indirectly through
overland runoff or directly from industrial discharges. In the aquatic environment, Se
accumulates in sediments and biota, and can continue to cycle and persist for many years.
Selenium is an essential trace element necessary for cellular function in many organisms;
however excessive amounts may result in toxic effects. Selenium toxicity in fish results in many
adverse effects including: reductions in growth; behavioural changes; increased deformity; and
increased mortality in early life stages. For birds that feed in aquatic environments, the most
sensitive toxicity endpoint is reduced egg hatchability followed by deformity in offspring. As is
often the case in Se toxicity, the adult organism may appear unaffected; however, overall
reproductive success and productivity may be negatively impacted.
In humans, Se deficiency and toxicity is rare in North America because food is generally
obtained from different geographic areas and food choices are plentiful. Health Canada
developed dietary reference intakes recognizing the margins between desirable and undesirable
intakes and associated health benefits and adverse affects. The tolerable upper level intake is
based on observations of selenosis in China, a condition characterized by symptoms such as hair
loss, skin lesions, tooth decay, and abnormalities of the nervous system.
The British Columbia Ministry of Environment (MoE) develops ambient water quality
guidelines (WQGs) to assess and manage the health, safety and sustainability of BC’s aquatic
resources. Guidelines are developed to protect: aquatic life, wildlife, agriculture (irrigation and
livestock watering), drinking water sources, and recreation and aesthetics.
In BC, the development of WQGs for aquatic life is directed by the following guiding principles:
WQGs are science-based and intended for generic provincial application;
WQGs do not account for site-specific conditions or socio-economic factors;
all components of the aquatic ecosystem (e.g., algae, macrophytes, invertebrates,
amphibians, and fish) are considered when data are available;
where data are available but limited, interim WQGs may be developed; and,
all forms of aquatic life and all aquatic stages of their life cycle are to be protected during
indefinite exposures.
Guidelines intended for the protection of human health are determined through consultation with
the BC Ministry of Health (MoH).
This technical report provides numerical ambient water quality guidelines for selenium (Se).
Updated ambient water quality guidelines are provided for aquatic life, wildlife, drinking water
sources, and health-based tissue guidelines (see Table 1). Guidelines for irrigation water and
livestock watering published by Nagpal and Howell (2001) are unchanged and remain Ministry
policy.

3
Health Canada’s drinking water guideline for Se has been established to prevent toxic effects at
excessive levels and was adopted by the MoE for use as an ambient source water quality
guideline to reduce adverse risks to drinking water sources, and therefore indirectly to human
health. A risk-based approach was used to develop health-based tissue guidelines for Se to
protect the human consumer.

4
Table 1.1 List of updated and previous WQGs for selenium recommended for use in British Columbia. Water concentrations are measured as total
selenium. Details on guideline derivation may be found in Section 8.
Water Use Updated 2012
BC Se WQG
2001 Approved
BC Se WQG Guideline Derivation Method/Approach
Source Drinking Water 10 µg/L 10 µg/L
Source Drinking Water: Adopted from Health Canada; a maximum
acceptable concentration of 10 µg/L to protect against adverse effects in
humans from excessive exposure.
Human Consumption Screening Values
High fish intake (0.22 kg/day)
Moderate fish intake (0.11 kg/day)
Low fish intake (0.03 kg/day)
1.8 µg/g (ww), 7.3 (dw)1
3.6 µg/g (ww), 14.5 (dw)
18.7 µg/g (ww), 75.0 (dw)
None proposed
None proposed
None proposed
Tissue Consumption: Values were derived using Health Canada’s
recommended equation for ingestion of Se-contaminated fish and the
dietary reference value’s tolerable upper intake.
Aquatic Life
Water column freshwater & marine
Alert concentration
Guideline
Sediment - Alert concentration
Dietary
Invertebrate tissue (interim)
Tissue (fish)
Egg/ovary
Whole-body (WB)
Muscle/muscle plug (interim)
1 µg/L
2 µg/L
2 µg/g (dw)
4 µg/g (dw)
11 µg/g (dw)
4 µg/g (dw)
4 µg/g (dw)
None proposed
2 µg/L
None proposed
2 µg/g (dw)
None proposed
4 µg/g (dw)
None proposed
Water column: Review of previous WQG (uncertainty factor (UF) applied
to toxicity threshold); weight of evidence including food web modelling
and reported relationships between impacts and Se concentrations in water.
Sediment: Weight of evidence; lowest published toxicity thresholds, no UF
applied; insufficient data for full guidelines at this time.
Dietary: Weight of evidence; lowest published toxicity thresholds, no UF
applied; insufficient data for full guidelines at this time. Invertebrate tissue
as surrogate for aquatic dietary tissue.
Egg/ovary: Combination weight of evidence and mean of published effects
data with an UF of 2 applied; Whole-body: previous WB guideline
compared with published literature, mean of published effects data with UF
(2) applied and weight of evidence; Muscle: WB translation to derive
muscle WQG, no additional UF applied to muscle guideline.
Wildlife
Water column
Bird egg
2 µg/L
6 µg/g (dw)
4 µg/L (maximum)
7 µg/g (dw)
The water column guideline for aquatic life (fish) is adopted for wildlife
since dietary accumulation is most critical. Bird eggs were used as
surrogate for all wildlife; weight of evidence; egg Se most direct/sensitive
measure; mallard EC10 with UF of 2 applied.
Recreation and Aesthetics None proposed None proposed
No data
Irrigation Water
2001 guideline not updated
10 µg/L
10 µg/L Not updated at this time
Livestock Watering
2001 guideline not updated
30 µg/L
30 µg/L Not updated at this time
Industrial Water None proposed None proposed No data
1 Guideline based on edible portions of tissue. Wet weight to dry weight conversion based on 75% moisture content.

5
2.0 Introduction
In 2001, the BC MoE published water quality guidelines for selenium (Se), which included
numerical concentrations for the protection of drinking water, aquatic life, wildlife, irrigation and
livestock watering uses (Nagpal and Howell 2001). Since that publication was released, many
studies have been conducted evaluating the effects of Se on human health and ecological
receptors, some of which are specific to BC. Because Se is a bioaccumulative substance,
derivation of guidelines must account for the accumulation from water, suspended particles,
sediment and diet, to the tissues of exposed aquatic organisms, their progeny, and/or their
consumers. This document provides a brief summary of the physical and chemical properties,
various sources, background concentrations, fate and persistence of Se in the environment. It also
summarises the bioaccumulation and toxicity literature used to update the ambient water quality
guidelines (Table 1.1).
2.1 BC Approved Ambient Water Quality Guidelines
The BC Ministry of Environment (MoE) develops province-wide ambient water quality
guidelines for substances or physical attributes that are important for managing both fresh and
marine surface waters. This work has the following goals:
provide protection of the most sensitive aquatic life form and most sensitive life stage
indefinitely;
provide a basis for the evaluation of data on water, sediment, and biota for water quality
and environmental impact assessments;
provide a basis for the establishment of site-specific ambient water quality objectives
help to identify areas with degraded conditions that need remediation;
provide a basis for establishing wastewater discharge limits; and,
report to the public on the state of water quality and promote water stewardship.
Ambient water quality guidelines are developed for the following water uses:
aquatic life and wildlife,
agriculture (irrigation and livestock watering),

6
drinking water sources, and
recreation and aesthetics.
A water quality guideline in BC is defined as:
“A maximum and/or minimum value for a physical, chemical or biological characteristic of
water, sediment or biota, applicable province-wide, which should not be exceeded to prevent
specified detrimental effects from occurring to a water use, including aquatic life, under
specified environmental conditions.” (BC Ministry of Environment Policy 6.10.03.02, signed
August 1991).
The following principles guide the development of water quality guidelines for aquatic life in BC
(BC MoE 2012). BC’s aquatic water quality guidelines (WQGs) are science-based, intended for
generic provincial application; they do not account for site-specific conditions or socio-economic
factors. All components of the aquatic ecosystem (e.g., algae, macrophytes, invertebrates,
amphibians, and fish) are considered if the data are available. Where data are available but
limited, interim guidelines may be developed. All forms of aquatic life and all aquatic stages of
their life cycle are to be protected during indefinite exposure.
The BC MoE, outlines specific data requirements for derivation of an aquatic life guideline (BC
MoE 2012a). It is essential that, at a minimum, data for fish, invertebrates, and plants be
included in the guidelines derivation process. Data for amphibians are also highly desirable but
often limited or simply not available. Guidelines or interim guidelines may also include studies
involving species not required in the minimum data set (e.g., protozoa, bacteria) when reasonable
justification exists.
It should be noted that there are several sources of uncertainty when it comes to developing
water quality guidelines and therefore it is necessary to apply uncertainty factors. Sources of
uncertainty include:
laboratory to field differences;
single to multiple contaminants (additive, synergistic, antagonistic effects);
7
toxicity of metabolites;
intra- and inter-species differences (limited species to conduct tests on, which may not
include the most sensitive species);
indirect effects (e.g., foodweb dynamics);
whole life-cycle vs. partial life-cycle (many toxicity studies are only conducted on partial
life-cycles and it can be difficult to determine the most sensitive life stage);
delayed effects;
impacts of climate change (species may be more vulnerable with additional stressors); and
other stressors including cumulative effects.
The appropriate uncertainty factor is determined on a case-by-case basis, according to the
evaluation of data quality and quantity, toxicity of the contaminant, severity of toxic effects, and
bioaccumulation potential (BC MoE 2012). Scientific judgement is important in maintaining
some flexibility in the derivation process.
Presently, water quality guidelines do not have any direct legal standing. They are intended as a
tool to provide the scientific basis and policy direction for decisions affecting water quality.
Water quality guidelines can be used to establish the allowable limits in waste discharges. These
limits are set out in waste management permits, approvals, plans, or operating certificates which
do have legal standing.
2.2 Derivation of Ambient Water Quality Guidelines for Selenium
2.2.1 Human Health Guidelines for Selenium
Guidelines intended for the protection of human health are determined through consultation with
the BC Ministry of Health. Health Canada’s Guidelines for Canadian Drinking Water Quality for
chemical parameters are typically adopted by the BC Ministry of Environment for use as ambient
water quality guidelines to reduce adverse risks to drinking water sources, and therefore
indirectly to human health.

8
For substances that accumulate in aquatic food sources such as fish and wildlife, health-based
tissue guidelines may be developed, again in consultation with the Ministry of Health. It is
important to note that for the purposes of this document, health-based guidelines do not provide
advice regarding consumption limits or advisories. Rather, if health-based guideline levels are
exceeded, it may indicate that further assessments or investigations are required to evaluate
possible risks to human health. Decisions regarding health investigations, fish consumption
limits or consumption advisories are under the purview of the regional Health Authorities and the
Ministry of Health.
A risk-based approach was used to develop health-based tissue guidelines for Se; in this
document, these are referred to as screening values. This document also provides a brief
background of selenium pharmacokinetics in humans, essentiality and toxicity, possible exposure
routes, background levels in the Canadian population, and recommended health-based guidelines
such as dietary reference intakes.
It is beyond the scope and intention of this document to assess the derivation of Health Canada’s
health-based guidelines such as drinking water guidelines or dietary reference intake values.
2.2.2 Guidelines for the Protection of Aquatic Life
In aquatic environments Se has proven to be a unique element with a complex mode of toxicity
related to its uptake and bioaccumulation primarily through the food chain. In developing the
guidelines, this complexity and the current state of scientific understanding regarding Se, was
conducive to development of a series of values as guidelines and interim guidelines specific to a
particular media that should not be exceeded. Alert concentrations for water and sediment have
also been incorporated for environmental managers. Although aquatic guidelines represent safe
concentration of Se for most ecosystems, in some environments, like wetlands, ponds and lakes,
Se can bioaccumulate to very high levels in aquatic life at water concentrations lower than the
guideline. Hence, an alert concentration was added to the suite of guidelines to address those
situations where environments and/or species sensitive to Se bioaccumulation, may be at risk
when Se levels are below the guideline. If alert concentrations are exceeded, a series of actions
may be triggered to evaluate and if necessary, mitigate the effects of Se. In the case of sediment,
9
there was insufficient primary or secondary scientific literature to support a full or interim
guideline. However, since sediment is an important sink for Se and elevated concentrations could
indicate significant risks of bioaccumulation, an alert concentration for sediment was
established.
Aquatic life guidelines have incorporated values for several water uses and environmental media
providing practitioners and resource managers with greater flexibility in detecting and assessing
the potential effects and the risks associated with Se in the environment. In some locations,
background Se concentrations in water or sediment may be slightly higher, or some species may
have naturally higher Se levels in tissues than generic guidelines. If this is the case, site-specific
water quality objectives may need to be considered for these aquatic environments (BC MoE
2013). For more information and guidance on how, and under what circumstances, to develop
water quality objectives, please contact the BC Ministry of Environment and access the on-line
guidance document on the web: http://www.env.gov.bc.ca/wat/wq/pdf/wqo_2013.pdf.
2.3 History
Selenium (Se) was discovered in 1817 by a Swedish chemist, Jöns Jakob Berzelius, who
identified it as an impurity resulting from the production of sulphuric acid (Ihnat and Wolf
1989). Selenium is a relatively rare trace element, ranking 68th
among the elements in the Earth’s
crust (Adriano 2001). Although it is distributed widely, soil concentrations are inconsistent, and
depend on the origin of parent rock. Selenium is not a metal, but is considered a metalloid or
semi-metal, having properties of both metal and non-metal elements (Haygarth 1994). Selenium
is essential for the health of organisms like fish, birds and mammals, yet it can also be toxic
(Mayland 1994). One of the important characteristics of Se is the very narrow range between
sufficient and toxic concentrations. For humans and livestock, the factor between optimal and
toxic doses of Se is in the range of 10 to 100 times. For fish the range is as low as 7 to 10 times
optimal dietary requirements for fish (Eisler 1985; McNeal and Balistrieri 1989; Lemly 1998).
The duality of Se is critically important, as both a nutrient, having a role in protecting against
free-radical damage, and as a potential toxicant at higher doses (Ihnat and Wolf 1989; Haygarth
1994; Adriano 2001). The toxicity of Se depends on several factors; therefore, it is important to
10
know not only the concentrations of Se, but also understand the mechanisms controlling its
distribution and fate in the environment (McNeal and Balistrieri 1989; Haygarth 1994).
Since its discovery, Se has been the subject of much research. The initial impetus for research
was diseases related to poultry and livestock grazing in Se-rich areas, or conversely, diseases
associated with deficiency in areas of low Se concentrations (Mayland 1994; Ohlendorf 2003).
The concentration of Se in forage crops throughout the continental US and Canada, has been
used as an index of its geographic distribution and risk of disease associated with deficient or
excess Se (Marier and Jaworski 1983).
2.3.1 Observations of Deficiency and Toxicity in Livestock
Marco Polo is credited with recording the first observations of Se toxicity in animals during his
travels in western China and Turkestan around 1295 (Barceloux 1999; Vinceti et al. 2001; Quinn
et al. 2007). He described “hoof rot” in horses, a condition where the hooves fell off after
grazing on poisonous plants. General Custer’s defeat at the battle of Little Big Horn in Montana
in 1876 is theorized as being a result of Se poisoning of army horses (Quinn et al. 2007).
In 1957, Klaus Schwarz identified the first selenium–responsive disease which led to the
recognition of Se as a trace mineral nutrient (Mayland 1994; Oldfield 2002). Since that time, Se
deficiency has been found to be responsible for several metabolic diseases in livestock and
poultry. Symptoms of Se deficiency in livestock include muscular weakness, skeletal
degeneration, lameness, cataracts, hepatic necrosis and reductions in growth, production, and
fertility (Eisler 1985; Fan et al. 1988).
During the 1930s, Se poisoning of livestock was evident in the western US states of South
Dakota, Wyoming, and Nebraska. Horses and cattle were affected with symptoms known as
“blind staggers”, characterized by an acute and progressive anorexia, emaciation, and
impairment of vision. A more subchronic disease was also identified called “alkali disease”,
resulting in emaciation, stiffness, lameness, loss of hair, and hoof cracking. In both cases; Se was
identified as the toxic factor (Eisler 1985; Fan et al. 1988; ATSDR 2003, Young et al. 2010).
Also in the early 1930s in western South Dakota, there were reports of losses of poultry due to

11
low survival of hatchlings and congenital malformations related to Se poisoning (Kilness et al.
1977).
2.3.2 Observations of Deficiency and Toxicity in Humans
Selenium deficiency in humans was first identified in northeast China in the mid 1930s. Keshan
disease, which affected mostly young women and children, was characterized by
cardiomyopathy (heart muscle weakness, enlarged heart, impaired heart function, and possibly
heart failure) (Whanger 1989; IOM 2000). Another form of Se deficiency called Kashin-Beck
disease, afflicted children in Se–poor regions of northern China, North Korea, and eastern
Siberia. The symptoms were very different than those of Keshan disease and included
degeneration of joint cartilage (osteoarthritis), and in more severe cases, joint deformities, and
dwarfism (Linus Pauling Institute 2007). In the 1950s, Se deficiencies were also observed in
humans in areas such as Florida, the Pacific Northwest and north-eastern areas of the US and
Canada, with similar symptoms as Se toxicity (Eisler 1985).
It was not until the early 1970s, that Se was found to be a critical component of glutathione
peroxidase, an important family of metabolic enzymes that protect organisms from oxidative
(free radical) damage (Marier and Jaworski 1983).
In China, Se toxicity was identified in people living in Enshi located in the Hubei Province
(Whanger 1989). Selenium toxicity in residents of Hubei Province became prevalent in 1958,
about the same time as coal (containing up to 5,000 µg/g Se) became the major fuel source.
Investigations showed that three routes of Se exposure were responsible for toxicity in the
population (Whanger 1989):
food was cooked or dried over open-pit coal fires in the centre of the room;
inhaling large amounts of smoke containing volatilised Se from the burning coal; and,
coal burning in crop fields to fertilise soils.
Following observations of toxicity in livestock in the US in the 1930’s, public health officials
began to investigate the possibility that intoxication may also be occurring in humans residing in
the same regions (Smith and Westfall 1936, 1937). Signs and symptoms of human Se toxicity,

12
such as “bad teeth”, pathologic nails, and lethargy, were observed although no definitive links to
Se intoxication were concluded (Smith and Westfall 1937; Yang et al. 1983; Longnecker et al.
1991).
2.3.3 Ecological Toxicity and Impacts
In the late 1970s and early 1980s, Se became a serious ecological concern with the discovery that
Se bioaccumulation could cause severe impacts to fish and other aquatic wildlife (Ohlendorf
2003). Belews Lake, North Carolina, was a man-made reservoir constructed in 1970, to supply
cooling water to a coal-fired power plant (Skorupa 1998). In 1974, the reservoir began receiving
effluent from the fly ash settling basin resulting in an increase of mean Se concentrations in the
main reservoir to about 10µg/L. The increased Se was associated with the subsequent localized
extinction of 26 of 29 resident fish species by 1978, only four years after discharges commenced
(Skorupa 1998; Young et al. 2010). Sorensen et al. (1984) studied Belews Lake including an
isolated, less contaminated sub-basin (Se concentrations between 3 and 4 µg/L) and documented
fish with sublethal effects that included changes in histopathology (ovarian tissue damage in
female fish), hematology and generalised edema. This was the same area studied by Cumbie and
Van Horn (1987) who found no apparent overt effects on fish at the population level.
In a similar example, Se contamination from agricultural drainage water, directed to a series of
interconnected wetlands known as the Kesterson Reservoir, in California, was responsible for the
loss of most of the resident fish species (Skorupa 1998; Young et al. 2010). However, the most
notable impacts at Kesterson were the reproductive effects to birds using the wetlands. High
rates of reproductive failure and deformed hatchlings were reported, as well as signs of acute
poisoning in adult birds in the most contaminated areas (Ohlendorf et al. 1986; Skorupa 1998).
The concerns regarding Se contamination in wildlife soon lead to growing interest about the
possible impact on human consumers. In 1987, the California Department of Health issued a
consumption advisory for Suisun Bay near San Francisco, specific to surf scoter, and lesser and
greater scaup which fed on Se-contaminated clams and molluscs (Fan et al. 1988; Barceloux
1999). Advisories were issued when Se concentrations in the flesh of waterfowl and fish reached
2 ppm (Fan et al. 1988). The advisory was based on the 5-fold increase of mean Se in the muscle

13
of ducks in contaminated areas (2.2 to 3.6 µg/g wet weight) compared with control areas
(USDOI 1998). In this case, the source of Se contamination was oil refinery effluents that were
discharged into San Francisco Bay.
Although Se is an essential element for organisms, introduction of Se into the environment from
natural and anthropogenic sources can lead to increased concentrations in surface water,
groundwater, soils, and vegetation. Consequently, Se can bioaccumulate and may become toxic
to sensitive aquatic life, birds, and mammals including humans. The margin between essentiality
and toxicity of Se is the narrowest of all trace elements, making the risk of negative impacts from
environmental contamination extremely high (Luoma and Rainbow 2008).
In Canada, there are also several examples of anthropogenic Se releases where studies have
shown adverse effects on aquatic life and birds are occurring. Good examples of these have been
documented in the provinces of BC, Alberta, Saskatchewan, Manitoba and Ontario. In BC and
Alberta, large-scale open-pit coal mining has resulted in the mobilization of Se from waste rock
leachate with high concentrations of Se into surface and groundwater potentially threatening fish
and bird populations (McDonald and Strosher 1998; Casey and Siwik 2000; Kennedy et al.
2000; Casey 2005; Holm et al. 2005; Harding et al. 2005; Wayland et al. 2007; Rudolph et al.
2008; Canton et al. 2008; Minnow et al. 2011; Nautilus Environmental and Interior
Reforestation Co. Ltd. 2011). In Saskatchewan, uranium mining has been associated with
elevated Se in receiving waters and deformity in fish (Pyle et al. 2001; Muscatello et al. 2006;
Muscatello and Janz 2009b). Selenium associated with smelter emissions and effluents have also
been studied in Ontario and Manitoba (Nriagu and Wong 1983; Manitoba Conservation 2007).
3.0 Physical and Chemical Properties
Selenium is a member of Group 16 on the periodic chart of elements with the atomic number 34.
Selenium is situated on the periodic table between the non-metal element sulphur, and the metal
tellurium (IUPAC 1988). The unique Chemical Abstracts Service (CAS) registry number for Se
is 7782-49-2 (ATSDR 2003). Selenium and sulphur are chemically very similar in their form,

14
compounds, and properties. Selenium is commonly found in association with sulphur-containing
(pyrite) rock or soils and often substitutes for S, which accounts for the many interactions
between Se and sulphur in both geology and biology. Selenium has a relative atomic weight of
78.96 g/mol, a melting point of 217 °C, a boiling point of 684.9 °C, and a specific gravity
ranging between 4.28 (vitreous form) and 4.79 (crystalline form). Elemental Se can be
amorphous or crystalline in structure and is found in three general forms: the black vitreous
form, the red crystalline monoclinic form, or the metallic grey crystalline hexagonal form, which
is the most stable (Adriano 2001; BEAK 2002).
Selenium has six naturally occurring stable isotopes with varying degrees of abundance (in
brackets): 74
Se (0.89%), 76
Se (9.37%), 77
Se (7.63%), 78
Se (23.77%), 80
Se (49.61%), and 82
Se
(8.73%). Several other unstable radioisotopes exist, for example 75
Se, which has a half-life of 120
days, used in radiological and biological tracer applications (Rosman and Taylor 1998).
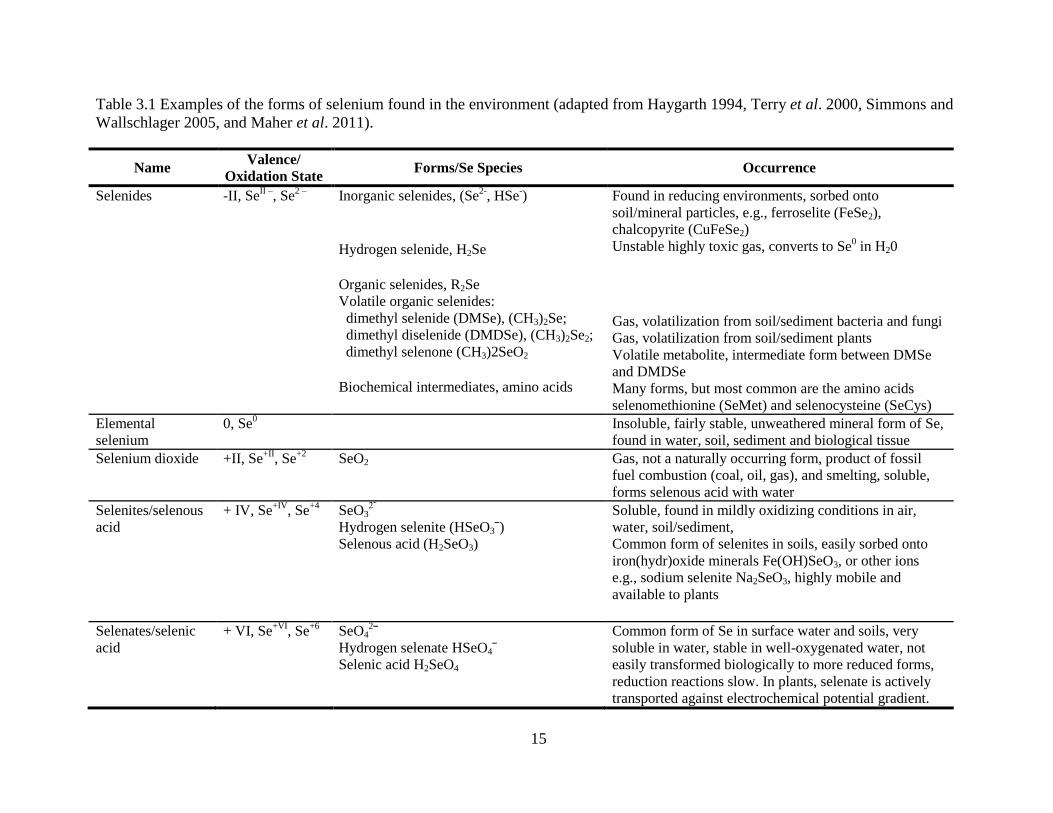
Selenium exists in four oxidation states in nature, shown in Table 3.1: selenides (-II), elemental
Se (0), selenites (+IV), and selenates (+VI). This results in many forms and compounds found in
the environment. The concentrations, speciation, and associations of Se depend on pH, redox
potential, solubility of the seleno-salts, complexing ability of the aqueous or solid ligands, and
biological activity and reaction kinetics (McNeal and Balistrieri 1989). Since the different
chemical species of Se have differing biological reactivity and availability, and chemical and
geochemical properties, knowledge of Se speciation is important to understand its fate and
environmental effects.
15
Table 3.1 Examples of the forms of selenium found in the environment (adapted from Haygarth 1994, Terry et al. 2000, Simmons and
Wallschlager 2005, and Maher et al. 2011).
Name Valence/
Oxidation State Forms/Se Species Occurrence
Selenides -II, SeII –
, Se2 – Inorganic selenides, (Se
2-, HSe
-)
Hydrogen selenide, H2Se
Found in reducing environments, sorbed onto
soil/mineral particles, e.g., ferroselite (FeSe2),
chalcopyrite (CuFeSe2) Unstable highly toxic gas, converts to Se
0 in H20
Organic selenides, R2Se Volatile organic selenides: dimethyl selenide (DMSe), (CH3)2Se; dimethyl diselenide (DMDSe), (CH3)2Se2;
dimethyl selenone (CH3)2SeO2
Biochemical intermediates, amino acids
Gas, volatilization from soil/sediment bacteria and fungi Gas, volatilization from soil/sediment plants Volatile metabolite, intermediate form between DMSe
and DMDSe Many forms, but most common are the amino acids
selenomethionine (SeMet) and selenocysteine (SeCys)
Elemental
selenium 0, Se
0 Insoluble, fairly stable, unweathered mineral form of Se,
found in water, soil, sediment and biological tissue
Selenium dioxide +II, Se+II
, Se+2 SeO2 Gas, not a naturally occurring form, product of fossil
fuel combustion (coal, oil, gas), and smelting, soluble,
forms selenous acid with water
Selenites/selenous
acid + IV, Se
+IV, Se
+4 SeO32ˉ
Hydrogen selenite (HSeO3ˉ)
Selenous acid (H2SeO3)
Soluble, found in mildly oxidizing conditions in air,
water, soil/sediment, Common form of selenites in soils, easily sorbed onto
iron(hydr)oxide minerals Fe(OH)SeO3, or other ions
e.g., sodium selenite Na2SeO3, highly mobile and
available to plants
Selenates/selenic
acid + VI, Se
+VI, Se
+6 SeO42ˉ
Hydrogen selenate HSeO4ˉ
Selenic acid H2SeO4
Common form of Se in surface water and soils, very
soluble in water, stable in well-oxygenated water, not
easily transformed biologically to more reduced forms,
reduction reactions slow. In plants, selenate is actively
transported against electrochemical potential gradient.

16
Changes in ambient redox potential (Eh) and pH can influence the theromdynamic equilibrium
and hence form of Se (Ralston et al. 2008). Figure 3.1 is a pourbaix diagram showing the
expected speciation of Se as a function of pH and redox potential.
Figure 3.1 Pourbaix diagram: Equilibrium speciation of aqueous inorganic selenium as a
function of pH and redox potential (from Milne 1998). The hatched area delineates normal
physiological conditions necessary for living cells, and the dashed lines show the equilibrium
potentials for water dissociation to hydrogen and oxygen.
While Figure 3.1 in general predicts the stability fields typically found for Se, it is important to
recognize that many other factors, like the presence of metals or biological activity, can affect
the speciation of Se in natural environments (Luoma and Rainbow 2008).

17
In natural waters, selenate (SeO4) dominates under oxidizing conditions, and is relatively stable
even under reducing conditions. Selenides and Se-rich sulphides generally dominate in reducing,
acidic, and organic environments. Hydrogen selenide (H2Se) is a foul-smelling toxic gas which
easily oxidizes in the presence of water to elemental Se, (McNeal and Balistrieri 1989). Metal
cations react with selenides (Se2-
) to form insoluble selenides. Metal selenides, found in metal
sulphide ores and Se-sulphide salts are not only insoluble, but also resistant to oxidation.
Selenides of mercury, silver, copper, and cadmium are very insoluble (Langmuir et al. 2003).
Organic selenides can be found primarily as seleno-amino acids (e.g. selenomethionine,
selenocysteine) in biological tissues and in reducing and anoxic environments. Particulate
organo-selenides in the water column are highly bioavailable and may be rapidly incorporated
into sediments or taken up by organisms (Luoma and Rainbow 2008).
Elemental Se (0) is stable in reducing environments and often found in association with sulphur
compounds such as selenium sulphide (Se2S2) or polysulphides (McNeal and Balistrieri 1989).
Elemental Se also shows some tendency to form catenated (chain) species such as organic
diselenides (Milne 1998). Elemental Se has very low solubility with slow oxidation-reduction
kinetics but may be transformed (oxidized) by microorganisms to sediment-bound selenites and
trace amounts of selenates (McNeal and Balistrieri 1989).
Selenium dioxide (SeO2) is a yellow to red powder or crystal which is highly toxic if inhaled,
swallowed, or absorbed through the skin and dissolves easily in water to form selenous acid
(H2SeO3) (Eisler 1985; GFS Chemicals 2010). Selenium dioxide does not occur naturally but is
economically important to several manufacturing sectors (see Section 4.1.3). It is formed by the
combustion of fossil fuels and solid waste, and is a by-product of smelting. Elemental Se is
present in petroleum products, in wastes, or metal ores, is converted to SeO2 during the
combustion or smelting process.
Selenite (SeO3) and selenate (SeO4) are the dominant selenium oxyanions in soils and surface
waters (refer to Table 3.1). Both are very water soluble, with selenate being more soluble than
selenite (Maier and Knight 1994; Adriano 2001). Within normal surface water pH and redox

18
ranges, only elemental Se (Se0), selenite (HSeO3
- or SeO3
-2) and selenate (SeO4
-2), are
thermodynamically stable (Milne 1998). Selenite and selenate are both adsorbed strongly by iron
(Fe) and aluminum oxyhydroxides and will compete with phosphate and sulphate for sorption
sites on Fe-oxides. (Langmuir et al. 2003). Microorganisms reduce selenate to elemental Se and
selenides (Mayland 1994). Selenate is easily taken up into terrestrial plants through root
membranes primarily by high-affinity active transport, against the electrochemical potential
gradient (Terry et al. 2000). Selenite and organic forms of Se are also taken up by plants but with
different mechanisms and in lesser amounts. Microorganisms, plants, and animals have the
ability to reduce selenite to selenide, eliminating some Se as respiratory products in the form of
volatile organic Se as dimethyl selenide, dimethyl diselenide or dimethyl selenone (Mayland
1994; Terry et al. 2000).
Sulphate (SO4-2
) competes directly with selenate (SeO4-2
), affecting its availability to plants, and
microorganisms which transform and bioconcentrate Se up through the food web (Simmons and
Wallschläger 2005). Fate and transport of Se as it relates to aquatic environments are discussed
more fully in Section 5.
4.0 Selenium in the Environment
4.1 Sources
4.1.1 Natural Sources
The primary geologic source of Se is volcanic (Presser 1994a). During the Cretaceous period
volcanic activity was extensive, leading to deposition of Se in Cretaceous seas from the gases,
ash, and dust associated with volcanic eruptions and the erosion and sedimentation of volcanic
rock. Bioaccumulation of Se by microscopic marine organisms then formed the sediments that
were deposited during the Cretaceous period, also contributed to the source of Se in soils of
marine origin (Presser 1994a). The highest concentrations of Se are found in marine shales,
particularly carbon-rich black shale, and phosphate-rich sedimentary rock, formed during the
Tertiary and Upper Cretaceous periods (McNeal and Balistrieri 1989; Haygarth 1994; USDOI
1998).The observed distribution of naturally elevated Se concentrations in surficial soils,
groundwater and surface water today, is the result of weathering and sedimentary processes
acting on these volcanic parent rocks over millions of years.

19
Secondary natural sources of Se include those of a biogenic (produced through biological
processes) nature, precipitation of minerals and organic matter, adsorption, chemical or bacterial
reduction, oxidation, and metabolic uptake and release by plants and animals (McNeal and
Balistieri 1989). Natural atmospheric releases of Se result primarily from plants and
microorganisms (terrestrial and oceanic) which transform Se into volatile organoselenides, and
from physical processes like volcanic activity (ATSDR 2003). Forest fires can also be a source
of Se to the atmosphere and to local soils from deposition of fly ash (Marier and Jaworski 1983).
Soils naturally high in Se are typically found in the arid and semi-arid areas of the world where
soils are also alkaline, including some areas of the Prairie Provinces (Hu et al. 2009) and mid-
western United States (Adriano 2001). Problems can result where naturally high seleniferous
deposits or Se-poor soils exist, but more recently it has been the anthropogenic sources of Se that
have caused a high level of concern.
4.1.2 Anthropogenic Sources
Anthropogenic release of Se to the environment is associated with industrial, agricultural,
mining, and petrochemical operations (such as oil and gas refining) as well as wastewater
discharges from municipal sewage treatment plants and landfills (Lemly 2004). Selenium is also
released to the atmosphere from combustion of coal and other fossil fuels, and through emissions
from smelting and manufacturing of pyritic ores. Selenium bound to fly ash from coal-fired
power plants can enter the atmosphere and be deposited to water, or contaminate surface waters
from effluent discharges from fly ash storage facilities. Selenium concentrations in soils and
organisms tend to be significantly higher in areas of high population density, where Se wastes
are being introduced, or sub-surface irrigation drainwater is released (Eisler 1985). A well-
known example of anthropogenically-caused Se toxicity occurred during the mid-1970s at
Belews Lake in North Carolina. Selenium, found predominantly as selenite in fly ash, was
associated with effluents being discharged from a coal-fired power plant which caused
extirpation of 16 of 20 resident fish species (Lemly 2002a; Huggins et al. 2007). Another well
documented example of Se toxicity, is the Kesterson Reservoir in California, where subsurface
drainage of agricultural irrigation water that reached concentrations as high as 4,200 µg/L
(predominantly as selenate), resulted in devastating impacts to fish and wildlife populations
dependent on those habitats (Presser and Ohlendorf 1987; Lemly 2004).

20
4.1.3 Production and Uses
Even though Se is widely distributed in the Earth’s crust, it is relatively rare and usually not
found in concentrations sufficient to warrant economical recovery. Selenium is associated with
sulphide (pyritic) ores and is recovered as a by-product of copper smelting and to a lesser extent
from the production of gold, lead, nickel or zinc. Anode slimes from electrolytic refining of
copper can contain as much as 10% Se. Although coal can contain between 0.5 and 12 µg/g Se
(80-90 times that of copper), recovery of Se from coal, while technically possible, is not
considered to be practical (USGS 2009a).
Canada is among the top five producers of Se, along with the US, Japan, Belgium, and Chile. In
the 2008 Canadian Minerals Yearbook, Natural Resources Canada (NRCan) reported annual
production of Se in Canada of 106, 144, and 156 tonnes in 2006, 2007 and 2008, respectively
(NRCan 2009a). Based on yearly mineral production estimates compiled by NRCan, Canada’s
production of Se occurs primarily in the provinces of Quebec, Ontario and Manitoba with 29, 66,
and 60 metric tonnes produced respectively (NRCan 2009b). The global supply and demand for
Se had been relatively stable until the mid-2000s when demand increased largely as a result of
China’s increased consumption of SeO2 which is used as a substitute for SO2 in the refining of
manganese. This substitution reduces power consumption and increases manganese yield in the
refining process. Selenium dioxide is economically important to countries exporting this product
to China due to its increase in demand and price (USGS 2008).
Selenium has a wide variety of uses. In the early 1900s, Se as sodium selenate, was used in
control of plant pests like mites and spiders. Although Se is still used sparingly in some limited
pest control applications (greenhouse-grown chrysanthemums, carnations, and cotton plants), its
use has largely been discontinued since it was expensive, highly stable, and bioaccumulative
resulting in the contamination of crops and imparting negative impacts on birds and mammals
(Eisler 1985; ATSDR 2003). In Canada, there has never been a registered pesticide product with
Se identified as the active ingredient (Y. Herbison, pers. comm., Pest Management Regulatory
Agency, December 2010).
Selenium is used in the manufacture of glass, metal alloys, textiles, petroleum products, medical
therapeutic formulas, and photographic emulsions (Eisler 1985; USGS 2008). In the early to

21
mid-1900s, SeO2 was used as an oxidizing agent for many organic compounds, in the production
of many new chemical compounds previously unobtainable or produced with much greater
difficulty (Waitkins and Clark 1945). SeO2 is also used as a glass or plastic colourant, as a
component of photographic developing and as the main ingredient in gun blueing (Haygarth
1994; USGS 2008).
After studies revealed that lead in ceramics, plumbing fixtures, fluxes, and solder could elevate
lead in drinking water or food coming into contact with those materials, Se, along with bismuth,
was added to brass as a substitute for lead in these products. Selenium has also been used as a
lead substitute in other metal alloys of steel and copper. Owing to selenium’s intrinsic properties
to convert light energy directly into electricity (and vice versa), other new uses and demands for
Se have emerged including photovoltaic cells (e.g., in light meters and security alarms)
photocopiers, and other photoconductive technologies (USGS 2009c). Selenium is incorporated
in many electronic and technical applications, such as rectifiers (to convert alternating to direct
electric current), and semiconductors. There are also diverse industrial and military applications,
for example Se is incorporated into eye-shields to protect the vision of workers from laser beams
(USGS 2009c).
Most recently, Se has been used as a component in nanotechnology, making Se of greater
commercial and medical interest in this emerging field. Engineered CdSe nanoparticles are used
in electronics, experimental biology, and medicine as a result of their ability to emit light with
specific wavelengths (Norwegian Pollution Control Authority 2008). CdSe nanoparticles belong
to a group of such particles called quantum-dots or Q-dots, which are used in solar cells, LEDs,
transistors, and diode lasers. CdSe nanoparticles are specifically used in fluorescence imaging to
localize specific cells (e.g., locating tumor cells). However, results of studies examining the
ecotoxicity of CdSe Q-dots have been variable since the effects appear to be related to several
factors, such as the method of synthesis and surface coatings applied to the Q-dots (Farré et al.
2009). Since these nanoparticles are very small and reactive, and relatively little is known about
their environmental effects, the long-term implications of introduction of these nanoparticles into
aquatic environments remains a concern.
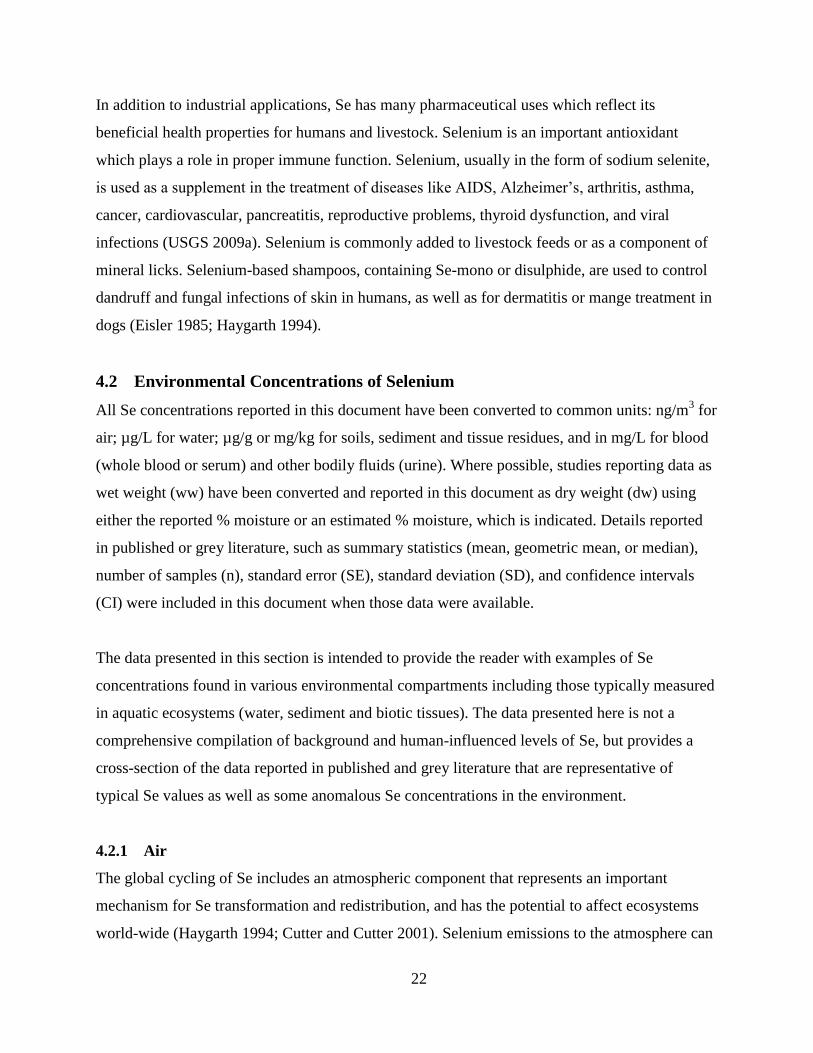
22
In addition to industrial applications, Se has many pharmaceutical uses which reflect its
beneficial health properties for humans and livestock. Selenium is an important antioxidant
which plays a role in proper immune function. Selenium, usually in the form of sodium selenite,
is used as a supplement in the treatment of diseases like AIDS, Alzheimer’s, arthritis, asthma,
cancer, cardiovascular, pancreatitis, reproductive problems, thyroid dysfunction, and viral
infections (USGS 2009a). Selenium is commonly added to livestock feeds or as a component of
mineral licks. Selenium-based shampoos, containing Se-mono or disulphide, are used to control
dandruff and fungal infections of skin in humans, as well as for dermatitis or mange treatment in
dogs (Eisler 1985; Haygarth 1994).
4.2 Environmental Concentrations of Selenium
All Se concentrations reported in this document have been converted to common units: ng/m3 for
air; µg/L for water; µg/g or mg/kg for soils, sediment and tissue residues, and in mg/L for blood
(whole blood or serum) and other bodily fluids (urine). Where possible, studies reporting data as
wet weight (ww) have been converted and reported in this document as dry weight (dw) using
either the reported % moisture or an estimated % moisture, which is indicated. Details reported
in published or grey literature, such as summary statistics (mean, geometric mean, or median),
number of samples (n), standard error (SE), standard deviation (SD), and confidence intervals
(CI) were included in this document when those data were available.
The data presented in this section is intended to provide the reader with examples of Se
concentrations found in various environmental compartments including those typically measured
in aquatic ecosystems (water, sediment and biotic tissues). The data presented here is not a
comprehensive compilation of background and human-influenced levels of Se, but provides a
cross-section of the data reported in published and grey literature that are representative of
typical Se values as well as some anomalous Se concentrations in the environment.
4.2.1 Air
The global cycling of Se includes an atmospheric component that represents an important
mechanism for Se transformation and redistribution, and has the potential to affect ecosystems
world-wide (Haygarth 1994; Cutter and Cutter 2001). Selenium emissions to the atmosphere can

23
be divided into naturally-occurring and anthropogenic sources. Nriagu (1989) estimated a total
Se flux to air of 14,700 tonnes per year which is consistent with more recent estimates of 13,000
to 19,000 tonnes per year (Wen and Carignan 2009). Of these emissions, natural sources account
for 57%, while anthropogenic sources account for 43% of total emissions (Nriagu 1989). Natural
sources of Se to the atmosphere can result from either biological or physical processes, but
approximately 90% are biogenic. These are primarily in the form of gaseous dimethyl selenide
generated from the microbial methylation and subsequent volatilization of Se from soils,
wetlands, marine and freshwaters, and vascular plants (Haygarth 1994; Cahill and Eldred 1998).
The vast majority of natural biogenic Se comes from the ocean, estimated to be anywhere from
5,000 to 8,000 tonnes per year, and a smaller fraction, approximately 1,200 tonnes per year, from
terrestrial sources (Nriagu 1989). The remaining 10% of natural sources are non-biogenic, and
include volcanoes (8%), suspension of sea salt (2%) and crustal weathering (<1%) (Cahill and
Eldred 1998). Taylor and Lichte (1980) measured Se in volcanic ash in the vicinity of the Mount
St. Helens, Washington eruptions of 1980. The range of Se concentrations were between <0.2
and 3 µg/g depending on location, demonstrating how natural events can influence localised
distribution of Se in the environment.
Anthropogenic Se emissions to air are primarily from combustion sources, including coal
burning (50%), oil (9%), and other miscellaneous sources (10%), along with copper smelting
(20%), lead and zinc smelting (4%), the production of Se dioxide (4%), as well as other
manufacturing processes, primarily glass and ceramics (<4%) (Cahill and Eldred 1998).
Selenium concentrations in air are usually less than 1 ng/m3, with levels in semi-urban and rural
continental areas ranging between 0.3 and 1 ng/m3 (Haygarth 1994; Mosher and Duce 1989).
Unpublished data from the Canadian National Air Pollution Surveillance (NAPS) network,
representing all the Provinces and Territories except Yukon, Newfoundland and PEI, was
summarised by the Canadian Council of Ministers of Environment (CCME 2009). Based on fine
particulate matter (PM10; the fraction less than 10 µm in diameter) samples collected across the
network between 2002 and 2003, they estimated a background concentration of atmospheric Se
in Canada of 1 ng/m3
(Table 4.1).The range of sample results in that data set was from 0.5 ng/m3
measured in Iqaluit, Nunavut, to 1.7 ng/m3 in Egbert, Ontario 75 km northwest of Toronto.

24
Remote continental and oceanic areas have much lower atmospheric Se concentrations, in the
range of 0.43 and 0.25 ng/m3 total Se, respectively (Nriagu 1989). Selenium concentrations
measured at remote sites in the north-western United States to the Appalachian Mountains in the
east, range from 0.05 ng/m3 to 1 ng/m
3, respectively (Cahill and Eldred 1998).
While marine biogenic Se contributes significantly to the overall concentration and fluxes,
anthropogenic sources contribute substantially to concentrations in the atmosphere (Nriagu and
Pacyna 1988). Anthropogenic sources of Se have increasingly become important in the
mobilization and redistribution of Se into the global biosphere (Nriagu and Wong 1983; Nriagu
and Pacyna 1988; Nriagu 1989; Wen and Carignan 2009).
Table 4.1 Typical and background selenium concentrations in air.
Location Mean Air Se
(ng/m3)
Location / Description Reference
Global ≤ 1 Typical concentration of Se in air
globally Mayland (1994)
Canada 1
(n = 721)
Background PM10 Se concentrations
from Canadian NAPS network, 2002-
03;
CCME (2009)
0.5 – 1.7
(n = 721)
Range of Se in PM10 samples
Remote
continental or
oceanic regions
0.43 and 0.25 Range of atmospheric Se
concentrations in remote regions Nriagu (1989)
North-western
US
Appalachian
Mountains
0.05
1
Typical Se concentrations in air in
remote regions of the US
Cahill and Eldred (1998)
For example, in areas where high vehicle traffic volumes, petroleum refineries, or metal smelting
plants contribute to the atmospheric emissions of Se, local Se concentrations in air can be
significantly elevated over background (Cutter 1989). Urban or industrial areas can have the
highest average concentrations of atmospheric Se. Mosher and Duce (1989) reported total Se
concentrations in urban areas between 1 and 10 ng/m3, comparable to other reported urban air
concentrations in the range of 3 to 4 ng/m3 (Marier and Jaworski 1983; Nriagu 1989).
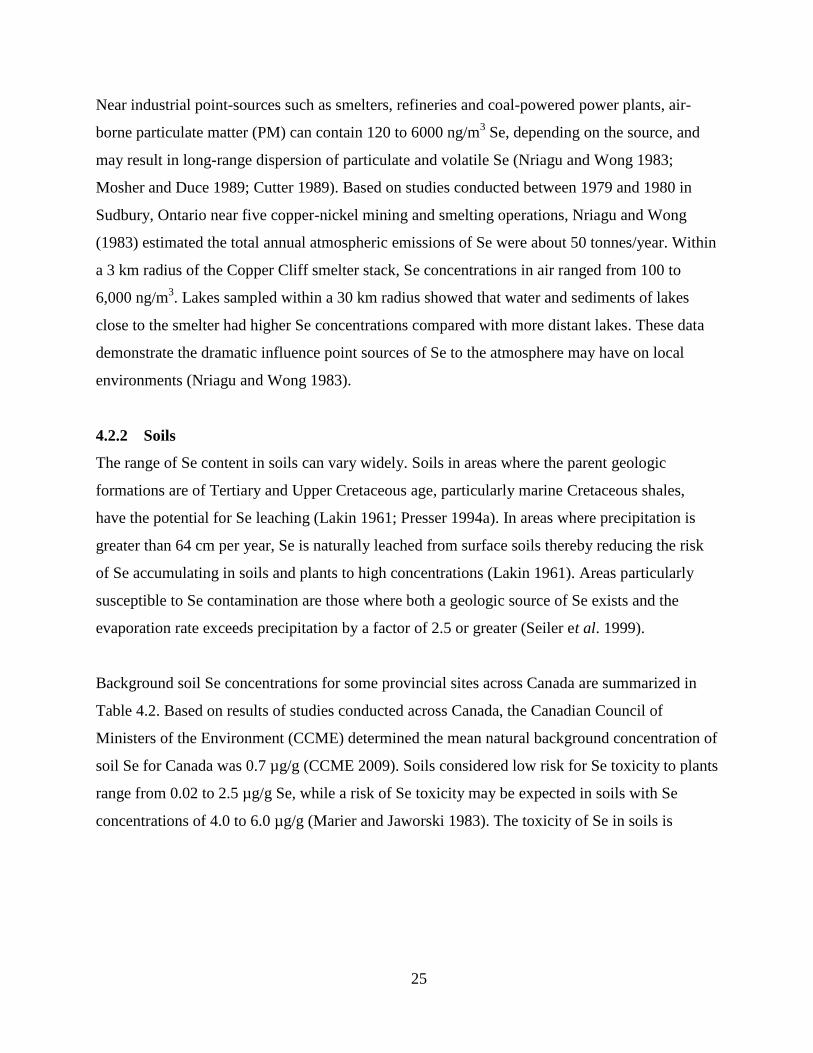
25
Near industrial point-sources such as smelters, refineries and coal-powered power plants, air-
borne particulate matter (PM) can contain 120 to 6000 ng/m3 Se, depending on the source, and
may result in long-range dispersion of particulate and volatile Se (Nriagu and Wong 1983;
Mosher and Duce 1989; Cutter 1989). Based on studies conducted between 1979 and 1980 in
Sudbury, Ontario near five copper-nickel mining and smelting operations, Nriagu and Wong
(1983) estimated the total annual atmospheric emissions of Se were about 50 tonnes/year. Within
a 3 km radius of the Copper Cliff smelter stack, Se concentrations in air ranged from 100 to
6,000 ng/m3. Lakes sampled within a 30 km radius showed that water and sediments of lakes
close to the smelter had higher Se concentrations compared with more distant lakes. These data
demonstrate the dramatic influence point sources of Se to the atmosphere may have on local
environments (Nriagu and Wong 1983).
4.2.2 Soils
The range of Se content in soils can vary widely. Soils in areas where the parent geologic
formations are of Tertiary and Upper Cretaceous age, particularly marine Cretaceous shales,
have the potential for Se leaching (Lakin 1961; Presser 1994a). In areas where precipitation is
greater than 64 cm per year, Se is naturally leached from surface soils thereby reducing the risk
of Se accumulating in soils and plants to high concentrations (Lakin 1961). Areas particularly
susceptible to Se contamination are those where both a geologic source of Se exists and the
evaporation rate exceeds precipitation by a factor of 2.5 or greater (Seiler et al. 1999).
Background soil Se concentrations for some provincial sites across Canada are summarized in
Table 4.2. Based on results of studies conducted across Canada, the Canadian Council of
Ministers of the Environment (CCME) determined the mean natural background concentration of
soil Se for Canada was 0.7 µg/g (CCME 2009). Soils considered low risk for Se toxicity to plants
range from 0.02 to 2.5 µg/g Se, while a risk of Se toxicity may be expected in soils with Se
concentrations of 4.0 to 6.0 µg/g (Marier and Jaworski 1983). The toxicity of Se in soils is
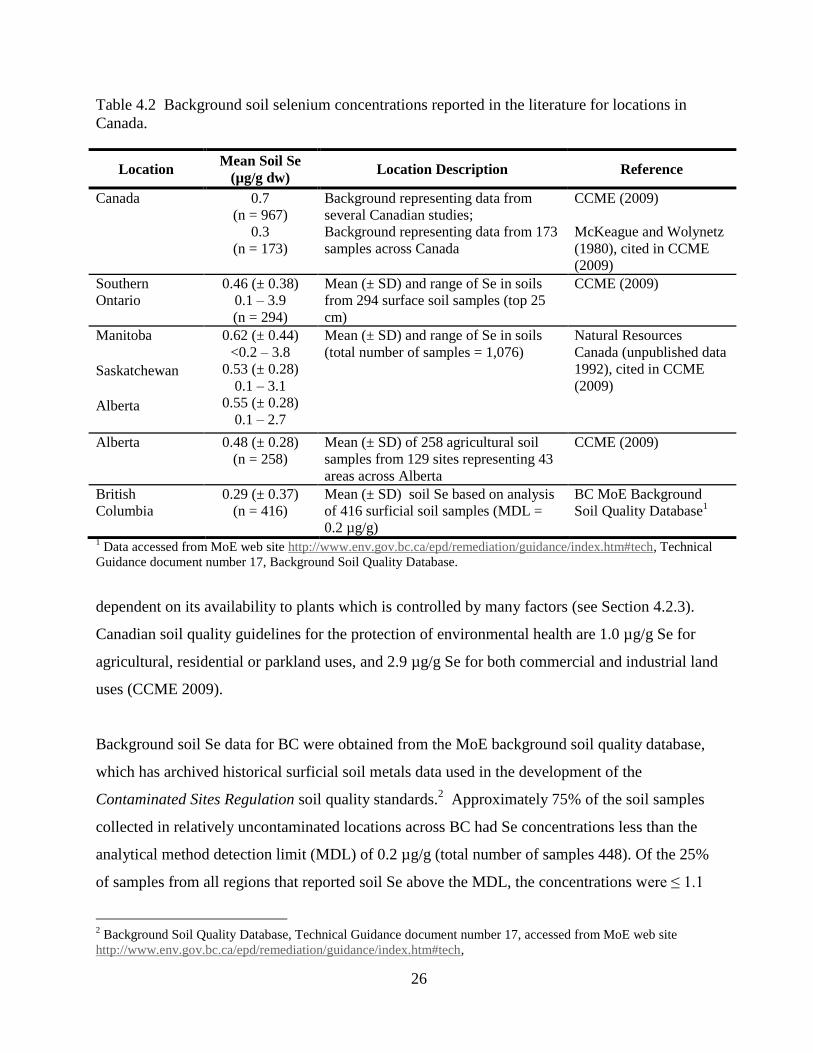
26
Table 4.2 Background soil selenium concentrations reported in the literature for locations in
Canada.
Location Mean Soil Se
(µg/g dw) Location Description Reference
Canada
0.7 (n = 967)
Background representing data from
several Canadian studies; CCME (2009)
0.3 (n = 173)
Background representing data from 173
samples across Canada McKeague and Wolynetz
(1980), cited in CCME
(2009)
Southern
Ontario 0.46 (± 0.38)
0.1 – 3.9 (n = 294)
Mean (± SD) and range of Se in soils
from 294 surface soil samples (top 25
cm)
CCME (2009)
Manitoba Saskatchewan Alberta
0.62 (± 0.44) <0.2 – 3.8
0.53 (± 0.28) 0.1 – 3.1
0.55 (± 0.28) 0.1 – 2.7
Mean (± SD) and range of Se in soils (total number of samples = 1,076)
Natural Resources
Canada (unpublished data
1992), cited in CCME
(2009)
Alberta 0.48 (± 0.28) (n = 258)
Mean (± SD) of 258 agricultural soil
samples from 129 sites representing 43
areas across Alberta
CCME (2009)
British
Columbia 0.29 (± 0.37)
(n = 416) Mean (± SD) soil Se based on analysis
of 416 surficial soil samples (MDL =
0.2 µg/g)
BC MoE Background
Soil Quality Database1
1 Data accessed from MoE web site http://www.env.gov.bc.ca/epd/remediation/guidance/index.htm#tech, Technical
Guidance document number 17, Background Soil Quality Database.
dependent on its availability to plants which is controlled by many factors (see Section 4.2.3).
Canadian soil quality guidelines for the protection of environmental health are 1.0 µg/g Se for
agricultural, residential or parkland uses, and 2.9 µg/g Se for both commercial and industrial land
uses (CCME 2009).
Background soil Se data for BC were obtained from the MoE background soil quality database,
which has archived historical surficial soil metals data used in the development of the
Contaminated Sites Regulation soil quality standards.2 Approximately 75% of the soil samples
collected in relatively uncontaminated locations across BC had Se concentrations less than the
analytical method detection limit (MDL) of 0.2 µg/g (total number of samples 448). Of the 25%
of samples from all regions that reported soil Se above the MDL, the concentrations were ≤ 1.1
2 Background Soil Quality Database, Technical Guidance document number 17, accessed from MoE web site
http://www.env.gov.bc.ca/epd/remediation/guidance/index.htm#tech,

27
µg/g, with slightly higher concentrations reported in a few locations in urban parks in Metro
Vancouver (maximum Se concentration was 2.4 µg/g). Soil Se concentrations in BC are well
below the Canadian Se soil quality guideline for agriculture, residential or parkland uses, with
only a few exceptions.
A few areas in Canada might slightly exceed the lowest Canadian soil quality Se guidelines as a
result of naturally-occurring Se in the surficial geology and it is not uncommon for soil Se
concentrations to greatly exceed Canadian soil guidelines near anthropogenic sources. For
example, soils in the vicinity of three copper-nickel smelters near Sudbury, Ontario, had elevated
soil metals concentrations, including Se (Ontario MoE 2004). Soil Se concentrations ranged from
less than or equal to the MDL of 0.5 µg/g in areas furthest from smelters, to 49 µg/g in adjacent
areas (Ontario MoE 2004).
Manitoba Conservation measured Se in soils, vegetation, and snow pack in the vicinity of
Hudson Bay Mining and Smelting located in Flin Flon. This plant has been operating from the
early 1930s, and recently (2010) ceased production. Soils in close proximity to the smelter and in
areas where there had been very little soil disturbance had mean Se concentrations of 177.2 µg/g,
while at locations more remote from the smelter concentrations were below the MDL of 0.2 µg/g
(Manitoba Conservation 2007). In 92 of the 108 sampling locations within the study area, soil Se
concentrations exceeded the Canadian soil quality guideline of 1 µg/g (Manitoba Conservation
2007; CCME 2009).
4.2.3 Terrestrial Plants
It is difficult to discuss plant concentrations of Se without also discussing soil Se concentrations
since the two are closely related. Selenium concentration in plants, particularly forage crops,
have been used as an index of the distribution of Se in soils throughout the continental US,
Mexico and Canada. Such data are also used to determine where risk to animals might exist due
either to Se deficiencies or to toxicity (Marier and Jaworski 1983). The “Great Plains” region of
the arid mid-western US and the Canadian Prairie Provinces are areas of relatively high Se
concentrations in soils and vegetation (Marier and Jaworski 1983).
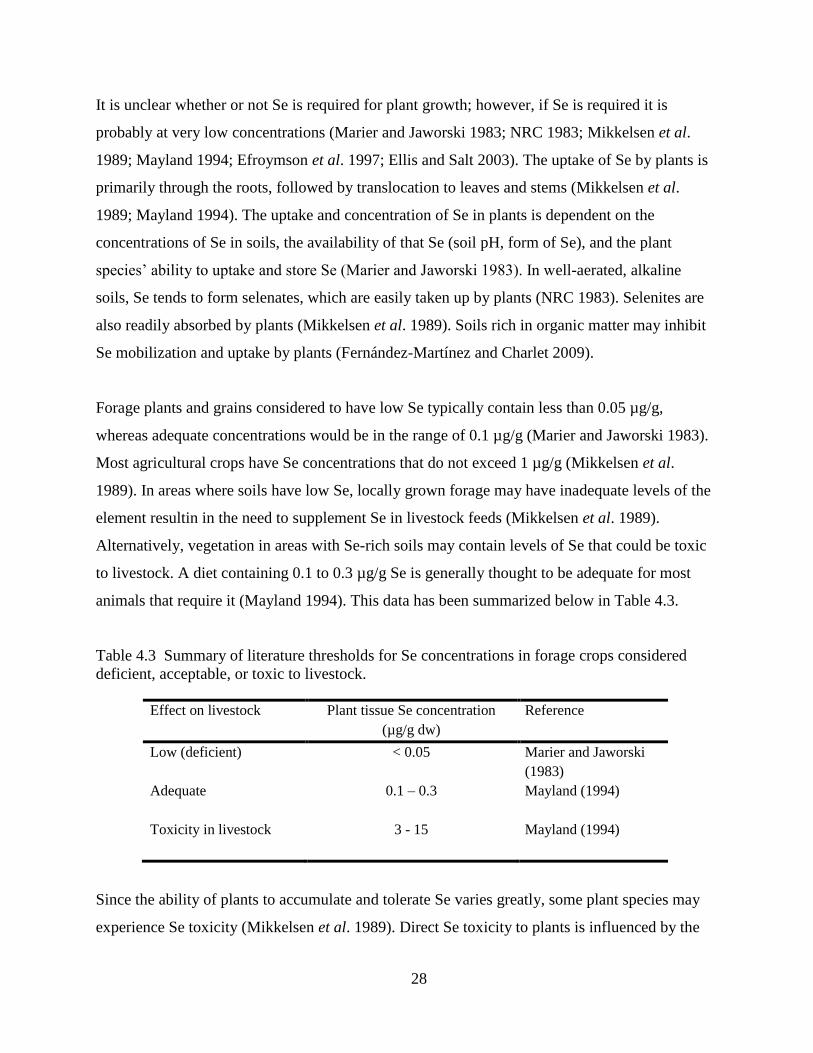
28
It is unclear whether or not Se is required for plant growth; however, if Se is required it is
probably at very low concentrations (Marier and Jaworski 1983; NRC 1983; Mikkelsen et al.
1989; Mayland 1994; Efroymson et al. 1997; Ellis and Salt 2003). The uptake of Se by plants is
primarily through the roots, followed by translocation to leaves and stems (Mikkelsen et al.
1989; Mayland 1994). The uptake and concentration of Se in plants is dependent on the
concentrations of Se in soils, the availability of that Se (soil pH, form of Se), and the plant
species’ ability to uptake and store Se (Marier and Jaworski 1983). In well-aerated, alkaline
soils, Se tends to form selenates, which are easily taken up by plants (NRC 1983). Selenites are
also readily absorbed by plants (Mikkelsen et al. 1989). Soils rich in organic matter may inhibit
Se mobilization and uptake by plants (Fernández-Martínez and Charlet 2009).
Forage plants and grains considered to have low Se typically contain less than 0.05 µg/g,
whereas adequate concentrations would be in the range of 0.1 µg/g (Marier and Jaworski 1983).
Most agricultural crops have Se concentrations that do not exceed 1 µg/g (Mikkelsen et al.
1989). In areas where soils have low Se, locally grown forage may have inadequate levels of the
element resultin in the need to supplement Se in livestock feeds (Mikkelsen et al. 1989).
Alternatively, vegetation in areas with Se-rich soils may contain levels of Se that could be toxic
to livestock. A diet containing 0.1 to 0.3 µg/g Se is generally thought to be adequate for most
animals that require it (Mayland 1994). This data has been summarized below in Table 4.3.
Table 4.3 Summary of literature thresholds for Se concentrations in forage crops considered
deficient, acceptable, or toxic to livestock.
Effect on livestock Plant tissue Se concentration
(µg/g dw)
Reference
Low (deficient) < 0.05 Marier and Jaworski
(1983)
Adequate 0.1 – 0.3 Mayland (1994)
Toxicity in livestock 3 - 15 Mayland (1994)
Since the ability of plants to accumulate and tolerate Se varies greatly, some plant species may
experience Se toxicity (Mikkelsen et al. 1989). Direct Se toxicity to plants is influenced by the
29
same factors as those that affect Se uptake – soil pH, texture, organic content and the presence of
other competitive ions (CCME 2009). For example, there is an antagonistic effect between
sulphate (SO4) and selenate (SeO4) in soils, and to a lesser extent between sulphate and selenite
(SeO3). Hence, the presence of higher soil sulphate results in reduced Se concentrations in plant
tissues (Mikkelsen et al. 1989). The mechanism is thought to be either directly antagonistic, with
SO4 substituting for Se, or plant growth is enhanced by added SO4 which dilutes the effect of Se
(Mikkelsen et al. 1989). This interaction between sulphur and Se is not surprising due to the
physical and chemical similarities between the two elements.
Plant Se concentrations are also influenced by differences in the ability of different plants to
absorb and accumulate Se. However, toxicity can occur when Se is taken up, translocated, and
incorporated into the essential sulphur compounds in the plant as Se-analogues. Toxic effects on
plants can occur at soil Se concentrations as low as 1.5 µg/g; symptoms of Se poisoning include
chlorosis, stunting, yellow leaves and reduction in plant biomass and yields in forage crops
(CCME 2009).
Plants known as “Se accumulators” are tolerant of Se-rich soils and may incorporate in excess of
3 to 15 µg/g Se in their tissues, which is considered a dietary effect threshold above which
animals begin to show signs of Se toxicity (Mayland 1994). Selenium accumulator plants are
common in the genus Astragalus, some species of which can contain concentrations as high as
20,000 µg/g Se (Mikkelsen et al. 1989). Typically, selenate and selenite is taken up through the
roots, and translocated throughout the plant where it is incorporated into amino acids, most of
which (60 – 80%) is further incorporated into proteins. Accumulator plants are thought to be able
to prevent incorporation of Se-amino acids into proteins, thereby avoiding a phytotoxic response
that normally occurs in plants at higher Se concentrations (Mikkelsen et al. 1989). Accumulator
plants are often found in semi-arid regions with seleniferous soils, conditions that may occur in
at least 15 countries including Canada, Mexico, the United Kingdom, Ireland, Israel, Venezuela,
Australia and the United States (Adriano 2001). In BC, there are approximately 32 species of
Astragalus (milkvetches); most are native, found in a variety of climates, several are yellow-
listed and some very rare species which are red-listed (Douglas et al. 1999). Some species of

30
milkvetch may be toxic to livestock, but details about the toxicity and ability to accumulate Se of
species in BC could not be found.
Coastal regions of British Columbia have forages that are deficient in Se content for livestock
needs (Bittman et al. 1999). This is likely a reflection of the very low soil Se concentrations in
coastal areas, which is consistent with data from the BC background soil quality database.
Selenium levels in livestock forages grown in BC were assessed by Miltimore et al. (1975) and
summarized in Table 4.4. The Thompson, Nicola, Cariboo, Creston, east Kootenay and south
Okanagan regions all had mean Se forage (grasses and legumes) from 0.20 to 0.34 µg/g, with the
Thompson having the highest mean concentrations (0.34 ±0.2 µg/g Se, n=176). The Chilcotin
and Peace regions both had mean forage Se concentrations of 0.19 µg/g (n=39 and 29,
respectively). The Coastal, Bulkley and Boundary regions had mean forage Se concentrations of
0.16 (n=296), 0.14 (n=27), and 0.14 (n=25) µg/g, respectively. Only two areas with samples
considered high (twice the standard deviation of means) in Se were observed in the Creston Flats
(mean Se 1.5 µg/g, n=11) and Miles 410-422 on the Alaska Highway (mean Se 3.04 µg/g, n=17)
(Miltimore et al. 1975). Local veterinarians have identified this area near Mile 422 of the Alaska
Highway north of Dawson Creek, known as Toad River, as having a high incidence of Se
toxicity in horses (Dr. M. Ross, DVM, pers. comm., Dawson Creek Veterinary Clinic, December
2011).
Agricultural runoff and irrigation drainage waters have been known to carry elevated Se
concentrations in areas like the San Joaquin Valley in California where soils have higher
concentrations of Se (Presser 1994b). Southern Manitoba and parts of Saskatchewan share
similar geology and possibly similar soil Se concentrations. However, studies conducted in
southern Manitoba indicate that, in spite of this, the risk of Se contamination to surface water, of
the scale experienced in California, is very low (Hu et al. 2009). The reason for this is related to
relatively fewer acres of well-drained soil Manitoba irrigates compared with other heavily
agriculturalised areas and the very different climate and evaporation rates (Hu et al. 2009).

31
Table 4.4 Selenium concentrations measured in grasses and legumes in BC collected between
1966 and 1973, listed in order from highest to lowest (from Miltimore et al. 1975).
Region Mean Se (± SD) (µg/g dw)
Thompson 0.34 (± 0.20), n = 176
Nicola 0.27 (± 0.14), n = 36
Cariboo 0.22 (± 0.13), n = 81
Creston 0.21 (± 0.15), n = 183
East Kootenay 0.21 (± 0.12), n = 23
South Okanagan 0.20 (± 0.18), n = 60
Chilcotin 0.19 (± 0.07), n = 39
Peace 0.19 (± 0.10), n = 29
Coastal 0.16 (± 0.09), n = 296
Bulkley 0.14 (± 0.11), n = 27
Boundary 0.14 (± 0.09), n = 25
4.2.4 Water
4.2.4.1 Marine Water
Marier and Jaworski (1983) found that seawater typically had lower Se concentrations than
freshwater attributed to the increased contact freshwater has with Se-rich rock and soils. An early
estimate of the Se content in marine waters was slightly over 4 µg/L at 19 ‰ salinity (Sverdrup
et al. 1942). However, Se concentrations in open ocean water with minimal influence from
human activity tend to be well under 1 µg/L. There are several other estimates of worldwide
background Se concentrations in seawater, with levels ranging from 0.009 to 0.045 µg/L (Sui
and Berman 1989). By comparison, Eisler (1985) reported higher Se concentrations in sea water
off California (0.06 µg/L). Marier and Jaworski (1983) estimated average Se in seawater to be in
the range of 0.09 ± 0.03 µg/L. Vertical profiles along a transect in the western Atlantic showed
concentrations of dissolved Se in seawater varied little, ranging between 0.04 and 0.07 µg/L
(Cutter and Cutter 2001). Coastal ocean waters off Brazil within the influence of the Amazon

32
River had dissolved Se concentrations of 0.02 µg/L (Cutter and Cutter 2001). Profiles of total
dissolved Se, selenite (Se IV) and selenate (Se VI) showed nutrient-like behaviour of Se, with
surface water depletion and deeper water enrichment, (Cutter and Cutter 2001). Sui and Berman
(1989) found this same pattern with oceanic Se concentrations being highly correlated with
micronutrients such as silica and phosphorus.
Marine microorganisms accumulate Se from water and sediment in a similar way as freshwater
organisms, and like freshwater systems, marine primary producers are considered to be the first
step in Se bioaccumulation. Larger marine organisms further accumulate Se from the food web
and to a lesser extent from surrounding water and sediment. Uptake from water and Se upwelling
from sediment may be more important sources of Se for filter feeding organisms like bivalves
and corals (Sui and Berman 1989).
There are few Canadian data for Se in marine water, but those found were generally below the
analytical method detection limit (MDL). Nine water quality samples from locations around
Sooke Harbour in 2008 on the south west coast of Vancouver Island were all below the MDL of
0.5 µg/L total Se (BC Ministry of Environment EMS database3). Samples collected between
2000 and 2009 in coastal marine waters from Howe Sound, Vancouver Harbour, English Bay,
Coal Harbour, False Creek and Second Narrows were all reported as less than the MDLs which
ranged from 0.06 to 2.0 µg/L in 2000/2001 and from 0.04 to 2.0 µg/L in 2009.
4.2.4.2 Groundwater
Groundwater is a subset of freshwater and is often a neglected environmental compartment in
many ecological assessment and monitoring programs. Globally, mean concentrations of Se in
groundwater are estimated to be approximately 0.2 µg/L (Nriagu 1989). In Canadian
groundwater drinking sources, typical Se concentrations were generally less than 1.0 µg/L
(CCME 2009).
3 Data accessed from the BC Ministry of Environment, Environmental Monitoring System (EMS) database, Jan
2010.
33
Exceptions to these typically low Se concentrations in groundwater occur in areas where the
geology is high in Se, or where anthropogenic activities elevate Se. CCME (2009) reported
exceedances of the maximum acceptable drinking water guideline of 10 µg/L in Quebec, near
Walkerton Ontario, Saskatchewan, southern and northern Alberta and southwest BC
(Chilliwack). For example, in seleniferous geologic formations in Saskatchewan, Se
concentrations in some groundwater drinking water supplies exceed the Health Canada (1992)
drinking water guideline of 10 µg/L total Se (S. Ferris, pers. comm., Saskatchewan
Environmental Protection Branch, June 2010). These water supply systems are all south of
Saskatoon, Saskatchewan and coincident with geologic formations known to be high in Se
(Marier and Jaworski 1983; Seiler et al. 1999; Saskatchewan Ministry of Environment 2008;).
Zubel (2000) conducted a study near Cultus Lake (Chilliwack, BC) and found that Se
concentrations in two groundwater sources used for drinking were 100 and 80 µg/L, values well
over the drinking water guideline. The source of contamination was thought to be from septic
systems and/or fertilizers. The remainder of 28 groundwater sample results were less than the
detection limit which ranged from <30 to < 60 µg/L. Such high analytical detection limits
provides little information on background groundwater quality relative to normally low
background Se concentrations in groundwater.
4.2.4.3 Surface (Fresh) Water
Background Se concentrations in surface waters range from 0.1 to 0.4 µg/L (USDOI 1998;
Adriano 2001). Luoma and Rainbow (2008) estimated that background Se concentrations for
undisturbed surface waters may be between 0.07 and 0.19 µg/L. Other estimates at the lower end
of background concentrations for Se include those for lakes, between 0.001 and 0.04 µg/L (Eisler
1985), and for rivers (global), 0.06 µg/L (Nriagu 1989).
However, anthropogenic inputs from runoff or effluents can elevate Se concentrations in surface
water, but increased atmospheric concentrations can also be a conduit for Se directly into large
waterbodies (lakes) or indirectly into streams from soil runoff (Adriano 2001). As examples of
these kinds of industrial contributions, effluent concentrations of Se in metal mining discharges
in Canada can range from 4.9 to 110 µg/L (BEAK 2002), and smelters have been known to

34
elevate local lake water concentrations of Se through direct wet and dry deposition (Nriagu and
Wong 1983; Manitoba Conservation 2007).
Typical Se concentrations in Canadian freshwaters are similar to those found elsewhere globally,
typically much less than 1 µg/L, ranging from 0.01 to 4 µg/L (CCME 2009). Based on a survey
of 122 municipalities across Canada, Subramanian and Méranger (1984, as cited in CCME 2009)
showed that Se concentrations in typical surface drinking water supplies were less than or equal
to the MDL of 0.5 µg/L (CCME 2009).
Environment Canada and provincial government agencies have collaborated since the mid-
1980s, carrying out jointly funded water quality monitoring programs under the federal-
provincial Water Quality Monitoring Agreements (WQMA). This database provides an effective
basis for comparing water quality across diverse areas within and between provinces. This data
and information on Se concentrations from other authors have been summarized in Table 4.5.
Environment Canada Atlantic Region ENVIRODAT water quality database show 2009 surface
water Se concentrations generally at or below the minimum detection limit of 0.01 µg/L
in the Atlantic Provinces.4 In Newfoundland and Labrador, data collected under the Canada-
Newfoundland WQMA program between 1986 and 2000, was used to generate a map showing
Se concentration contours for the purpose of identifying “hot spots” across the province
(NLWRMD 2010). The figure showed that surface water total Se concentrations were generally
less than the existing CCME water quality guideline for aquatic life of 1.0 µg/L. The only
instances of elevated Se were at urban sites or sites with saltwater intrusion, the latter
highlighting the connection between surface and groundwater in coastal areas (R. Paterson, pers.
comm., Newfoundland and Labrador Department of Environment and Conservation, June 2011).
Somers et al. (1999) reviewed water quality data collected across Prince Edward Island. Sites
represented ambient environmental condition across a range of land-use (mostly forested to
largely agricultural) and stream size, but did not include sites influenced strongly by effluent
4 Data accessed through Environment Canada Atlantic Region water quality web page,
http://map.ns.ec.gc.ca/envirodat/root/main/en/extraction_page_e.asp June 2010.

35
Table 4.5 Summary of surface water quality data across Canada (other than in BC) for
background or minimally influenced locations.
Location /Station
Name
Mean Se
(µg/L)
Description
(period of record, if known) Impact
1 Reference
Canadian surface
waters
≤ 0.05
<0.01 – 4.0
Summary of surface source drinking water
for 122 municipalities across Canada
Range of Se concentrations in surface
water
U
U
Subramanian and
Méranger (1984)
NAQUADAT(1985) (cited in CCME 2009)
Atlantic provinces ≤ 0.01
(n=231)
Summary of Environment Canada Atlantic
Region ENVIRODAT 2009 water quality
database
R/PI ENVIRODAT 2009
Newfoundland and
Labrador
< 1.0 µg/L Generalized summary of surface water
quality data 1986 – 2000. R/PI NLWRMD 2010
Prince Edward
Island
0.08 (0.05)
0.16 (max)
Mean (SD) and maximum total Se conc at
freshwater sites representing ambient
environmental conditions (Atlantic Region
ENVIRODAT)
R/PI Somers et al. 1999
Nova Scotia, Cape
Breton, New
Brunswick
≤ 1.0 Monitoring data from 29 rivers in NS, NB
and Cape Breton, 1992 to 1996. Two
values over MDL, 1.16, 1.42 µg/L
R/PI Dalziel et al. 1998
Quebec < 0.05 2009 data collected at Rivière à la Pêche, a
pristine location in La Mauricie National
Park.
R Environment Canada
data request 2010
Ontario < MDL
(0.05 – 1.0)
Data from 14 long-term monitoring
stations at background or minimally
impacted sites in Ontario.
R/PI PWQMN data request
2010
Ontario
Sturgeon River
(Severn Sound)
< 0.5 Sturgeon River near Severn Sound, two
samples in 2002. R Ontario MoE data
request 2012
Manitoba < 0.4 Data collected at water quality surveillance
sites in Manitoba since 2001 R
Manitoba
Conservation data
request 2010
Saskatchewan 0.02 - 0.1 Range of Se concentrations at reference
sites in two studies near uranium mines R
Muscatello et al.
(2008); Pyle et al.
(2001)
Alberta 0.3 – 0.7
0.7
Range of average Se for 19 WQ stations
2005 to 2007;
Median Se concentration at reference sites
above coal mining activities
R/PI
R
Environment Canada
data request 2010;
Casey (2005)
1R = reference (unimpacted), PI = possibly impacted, I = impacted, U = unknown
discharges. Mean Se concentrations in fresh surface water sites were 0.08 (± 0.05) µg/L, with the
maximum concentration of 0.16 µg/L. This demonstrates the very low Se concentrations across
PEI in surface waters.

36
Lake water quality surveys conducted between 1981 and 2005 by Nova Scotia Environment
showed Se in lake water was consistently less than the MDL of 1.9 or 2.0 µg/L (Nova Scotia
Environment 2009). Dalziel et al. (1998) conducted seasonal sampling on 29 rivers in Nova
Scotia, Cape Breton and New Brunswick between 1992 and 1996. With the exception of two
samples, measuring 1.16 and 1.42 µg/L, dissolved Se concentrations at all river sites were below
the MDL of 1.0 and 1.2 µg/L. Although Se is not a wide-spread problem in Atlantic Provinces,
there has been concern regarding Se in coal mining areas in the north-eastern area of the
mainland, like south of Canso Strait, and Cape Breton Island. Selenium releases are also a
concern at the Sydney Steel Mill which operated between approximately 1901 and 2000,
releasing toxic wastes to Sydney Harbour and Tar Ponds on Cape Breton Island (D. Taylor, pers.
comm., Nova Scotia Environment, May 2010).
Data collected in 2009 at a federal water quality station on Rivière à la Pêche in La Mauricie
National Park in Quebec (a pristine location) show Se concentrations at or below the MDL of
0.05 µg/L. Within the freshwater fluvial reach of the St. Lawrence River at Lavaltrie, PQ, 25
samples collected between 2007 and 2009 had an average Se concentration of 0.1 µg/L
(Environment Canada ENVIRODAT5). Although the St. Lawrence River is influenced by human
activities, these sites were considered representative of minimally impacted water quality
concentrations for Se for most streams in the province of Quebec (G. Tardif, pers. comm.,
Environment Canada, April 2010).
Water quality data collected in Ontario during the mid to late 1970s showed that Se
concentrations in lakes Superior, Michigan, Huron, Erie and Ontario were generally below the
MDL of 0.1 µg/L to 1.0 µg/L (IJC 1981). The exception was Lake Erie, which had Se
concentrations that ranged between < 0.1 and 36 µg/L, the latter likely influenced by
anthropogenic discharges (IJC 1981). Surface water quality data from the Ontario Ministry of
Environment’s Provincial Water Quality Monitoring Network (PWQMN) were retrieved from 14
5 Data obtained by request through Geneviève Tardif, Fresh Water Quality Monitoring and Surveillance, Water
Science and Technology, Environment Canada, Gatineau QC, May 2010.

37
long-term monitoring stations at background or possibly minimally impacted sites throughout
Ontario.6
A review of these data showed that most sites have Se concentrations consistently below the
MDL, which was 1.0 µg/L during the early years of the program, and 0.05 µg/L in later years (C.
Rocks, pers. comm., Ontario MoE, April 2010). At one station still being monitored on the
Ottawa River near the Otto Holden Dam, there was a measurable and slightly higher average Se
concentration of 0.27 µg/L for the period of record between 1989 and 1994. Although this
concentration is elevated relative to other Ontario sites, it is still well under the CCME WQG of
1 µg/L (CCME 2007a). At a site on the Sturgeon River in Ontario, two samples collected in 2002
had Se concentrations < the MDL of 0.5 µg/L.7
Exceptions to these low levels are sites associated with point source contributions from mining
effluents or atmospheric emissions. An example is in Sudbury, where lakes within a 30 km
radius of the copper-nickel smelter had up to 4 times the concentration of Se (0.2 to 0.4 µg/L)
compared to lakes outside the influence of the smelter (≤0.1 µg/L) (Nriagu and Wong 1983). A
more recent study on nine lakes at varying distances (4 to 204 km) from the Sudbury smelter
showed similar patterns in dissolved Se. At two lakes in close proximity (4 km) to the smelter,
the average water column Se was 0.67 µg/L (Chen et al. 2001). However, Se concentrations
averaged 0.1 µg/L in five lakes that were greater than 30 km from the smelter (Chen et al. 2001).
These studies show that atmospheric deposition from metal smelters can be an important source
of Se to surface waters.
Manitoba’s water quality data shows surface water Se concentrations near or below the MDL
(0.4 µg/L since 2001 and 2.0 µg/L prior to 2001) (K. Jacobs, pers. comm., Manitoba Water
Stewardship, March 2010). Se concentrations are elevated in areas in surface waters influenced
by hard rock mining and/or smelting activities. One example is surface water around the Hudson
Bay Mining and Smelting (HBMS) operation near Flin Flon. In 2009, Ross Lake, which receives
effluents from HBMS as well as urban runoff from the City of Flin Flon, had Se concentrations
6 Data obtained by request though Carline Rocks, Ontario Ministry of Environment, May 2010.
7 Data obtained by request from Georgina Kaltenecker, Ontario Ministry of Environment, August 2012.

38
between 156 and 162 µg/L (K. Jacobs, pers. comm., Manitoba Water Stewardship, March 2010).
As part of a human health risk assessment currently underway, HBMS has reported water,
sediment, and fish tissue residues for 12 lakes in the vicinity of their operations that were likely
influenced by both effluent discharges and aerial deposition from smelter stack emissions
(Stantec 2009). All 12 lakes sampled met the Health Canada Se drinking water quality guideline
of 10 µg/L (Health Canada 1992), and most lakes were below 2 µg/L. However, Schist Lake,
which receives effluents from HBMS via Ross Lake and Ross Creek, had Se concentrations of 4
to 5 µg/L (Stantec 2009).
The western provinces of Saskatchewan and Alberta typically have very low Se concentrations
in surface waters (< 1 µg/L), although there are some exceptions where Se may be elevated due
localized geologic formations or anthropogenic activities. Studies in northern Saskatchewan
document elevated total Se concentrations in surface waters below uranium mining operations,
where Se concentrations ranged from 0.5 to 7.67 µg/L in exposed lakes and streams downstream,
compared with 0.02 to 0.1 µg/L in reference areas (Muscatello et al. 2008; Pyle et al. 2001).
Data collected under the Federal-Provincial Water Quality Monitoring Agreement (WQMA)
from 19 stations on major Alberta rivers between 2005 to 2007 showed the average total Se
concentrations was between 0.3 and 0.7 µg/L (MDL = 0.1 µg/L).8 These concentrations
represent background levels, but in some other locations in Alberta anthropogenic sources of Se
are known to elevate background concentrations. For example, a report summarizing data
collected from the mid 1980s to 2003, documented Se increases below open-pit coal mining
areas in Alberta (Casey 2005). Upstream of mining influences, waters had a median Se
concentration of 0.7 µg/L, while in closest proximity to the mines levels ranged between 12.7
and 29.2 µg/L Se (Casey 2005). Another study conducted between 1998 and 1999 on Alberta
streams influenced by large-scale open-pit coal mining showed that surface water Se
concentrations were as high as 48 µg/L (Casey and Siwik 2000).
8 Data obtained by request through Julie Boyer, Fresh Water Quality Monitoring and Surveillance, Water Science
and Technology, Environment Canada, Montreal QC, July 2010.

39
The oil and gas industry has also been associated with Se releases to the environment. In 2006, at
an oil sand upgrader (a facility that processes crude bitumen from oil sands) near Edmonton,
Alberta, waste water effluents with Se concentrations averaging 300 µg/L (range of 150 to 600
µg/L) were found entering the North Saskatchewan River (A.Wolanski, pers. comm., Alberta
Environment, February 2010). Since identifying the problem, mitigation measures have reduced
Se loadings by 80%, with concentrations in effluent currently in the range of 20 µg/L. In spite of
significant reductions in effluents, Se in sediment and biota remain elevated in the near field area
(< 50 m downstream) below the discharge (North/South Consultants Inc. 2009).
Background water quality data for BC were obtained from government databases and reports,
primarily from the Federal-Provincial WQMA program, for approximately 42 sites across the
province which are monitored bi-weekly or monthly.Table 4.6 summarizes Se concentrations at
several of these sites. Where data was reported as less than the MDL, the value of the detection
limit was used to calculate the mean. These data show that total Se concentrations are typically
much less than 1 µg/L, but can be elevated above 1 µg/L in areas where there are natural Se
sources from seleniferous rock and/or sources from anthropogenic activities (seeTable 4.6 for
site descriptions).

40
Table 4.6 Mean (SD) water concentrations of selenium measured in various river systems in BC.
Station Name
Mean Se
(SD)
(µg/L)
Location / Description
(period of record) Impact
1 Reference
Moyie River at
Kingsgate
0.08 2
(0.03)
(n=98)
Columbia Mtn Highlands ecoregion, some
agriculture, logging and historical mining
(Pb-Zn-Ag) (1984-2009)
PI Dessouki (2009d);
Environment Canada4
Fraser River at Red
Pass
0.10 2
(0.07)
(n=385)
Western Continental Range ecoregion, close
to the headwaters, no human activity (1984-
2004)
R Swain (2007a);
Environment Canada4
Flathead River at the
International
Boundary
0.20 2
(0.08)
(n=376)
Northern Continental Divide ecoregion,
fairly pristine wilderness, some logging,
mining exploration (1984-2004)
R Pommen (2005);
Environment Canada4
Fraser River at
Marguerite
0.14 2
(0.10)
(n=383)
Central Interior ecoregion, between Quesnel
and Williams Lake BC (1985-2004)
PI Swain (2007b);
Environment Canada4
Kettle River 0.15 2
(0.12)
(n=590)
Okanagan Highland ecoregion, southern
interior of BC near Midway above US
border (1984-2009)
PI Dessouki (2009a);
Environment Canada4
Fraser River at Hope 0.16 2
(0.11)
(n=420)
Pacific Coastal Mtns ecoregion in southern
BC, east of Vancouver (1984-2004)
PI Swain (2007c);
Environment Canada4
Peace River above
Alces River
0.37 2
0.22
(n=425)
Peace Lowlands ecoregion, north-eastern
BC, 45 km upstream of BC-Alberta border
(1984-2002)
PI Phippen (2003a);
Environment Canada4
Okanagan River at
Oliver
0.39 2
(0.11)
(n=404)
Okanagan Highland ecoregion, southern
interior of BC near Oliver BC, above US
border (1984-2009)
PI Dessouki (2009b);
Environment Canada4
Iskut River below
Johnson River
0.54 2
(0.22)
(n=130)
Northern Coastal Mtns ecoregion, near
confluence with the Stikine R, north central
BC (1984-2009)
PI Dessouki (2009c);
Environment Canada4
Salmon River near
Hyder
1.07 2
(0.43)
(n=573)
Northern Coastal Mtns ecoregion, near
BC/Alaska border, mineralized with
historical mining (Au, Ag, Cu, Pb, Zn)
(1984-2002)
I Phippen (2003b);
Environment Canada4
Bear River at Stewart 1.25 2
(0.53)
(n=282)
Northern Coastal Mtns, near Stewart BC,
mineralized area with historical mining (Au,
Ag, Cu, Pb, Zn) (1984-1994)
I Webber (1997);
Environment Canada4
Elk River at Hwy 93
near Elko
2.50 3
(1.07)
(n=456)
Southern Rocky Mtn Trench ecoregion,
downstream of large-scale open-pit coal
mining (1991-2011)
I
Swain (2007d);
Environment Canada4
Elk River below
Sparwood
5.47 3
(2.10)
(n=179)
Northern Continental Divide ecoregion,
close proximity to large-scale open-pit coal
mining (2002-2011)
I
Swain (2007e);
Environment Canada4
1R = reference (unimpacted), PI = possibly impacted, I = impacted, U = unknown
2 No significant trend over the period of record. 3Significant increasing trend over the period of record. Se concentrations routinely exceed both CCME and BC guidelines for
the protection of aquatic life. 4Data used in the calculation of average total Se concentrations was downloaded from Environment Canada’s Water Quality
web site accessed on-line at http://waterquality.ec.gc.ca/EN/home.htm.

41
Swain (2007a; 2007b), confirmed a long-established increasing Se concentration trend at two
sites on the Elk River in south eastern BC below large scale open pit coal mining operations.
Selenium concentrations at both sites greatly exceed both the CCME and the BC Se guidelines
for aquatic life of 1 µg/L and 2 µg/L, respectively (CCME 2007a; Nagpal 2001). Since 2009 at
the Elk River monitoring site below Sparwood, monthly water quality samples have occasionally
exceeded the CCME and BC drinking water guideline of 10 µg/L (Environment Canada
ENVIRODAT19
).
In contrast, a site on the Flathead River at the International Boundary, an adjacent watershed also
sampled under the Canada – BC WQMA, shows no such trend with an average concentration of
0.02 µg/L total Se (Pommen 2005). The Flathead is similar in its lithography and within the
same ecoregion as the Elk River, but has not had the same degree of disturbance (Pommen
2005).
4.2.5 Sediment
Sediment Se concentrations in aquatic environments are usually less than 4 µg/g (Cutter 1989)
and average background concentrations in the range of 0.2 to 2 µg/g (USDOI 1998). Sediments
of undisturbed surface waters typically have Se concentrations at the lower end of the range,
about 0.2 µg/g (Luoma and Rainbow 2008). Eisler (1985) reported concentrations between 0.35
and 0.75 µg/g in the Great Lakes, and 0.22 µg/g in Lake George, New York. Marine sediments
often contain background Se concentrations ranging from 0.1 µg/g to 2.0 µg/g (Sui and Berman
1989).
Sediment Se concentrations reported in eastern Canada are presented in Table 4.7. In the
province of Quebec, anthropogenically enriched lakes (sources of Se not identified) can have
sediment Se concentrations as high as 14.5 µg/g (Eisler 1985). In Ontario, sediment profiles
collected near the Sudbury smelter had deposition rates of Se in lake sediments estimated to be
0.3 to 12 mg/m2/year, mirroring smelter production and among the highest recorded in North
America at that time (Nriagu and Wong 1983). Most of the reported sediment concentrations for
9 Data used in the calculation of average total Se concentrations was downloaded from Environment Canada’s Water
Quality web site accessed on-line at http://waterquality.ec.gc.ca/EN/home.htm.

42
relatively undeveloped and unimpacted lakes were below 1 µg/g, even where lakes had historical
mining or had been developed for recreational purposes.
Sediment selenium concentrations in western Canada are summarised in Table 4.8. Minor
elevations in sediment Se concentrations have been detected in the Northwest Territories at near-
field locations below a tungsten mine on the Flat River, but not below a metal-mining operation
(i.e., lead, zinc, copper and silver) on Prairie Creek; both are tributaries to the South Nahanni
River (Spencer et al. 2008). In the Flat River, the upstream (background) concentration of
sediment Se was 0.5 µg/g, but at the near-field site was 3.1 µg/g, approximately 6 times that of
background. The metal-mine operating on Prairie Creek treated their mine-water portal effluent
in polishing and catchment ponds prior to discharge to the receiving environment, which the
authors believed could explain why Se was not accumulating in sediments below the mine site
(Spencer et al. 2008).
In other areas, Se is known to accumulate in sediments, for example below uranium mining
operations (Klaverkamp et al. 2002; Muscatello et al. 2008; Burnett-Seidel and Liber 2012). In a
2005 study of Se contamination below a uranium mine in northern Saskatchewan, Se
concentrations in the top 10 cm of lake sediment at a reference site were less than the detection
limit (< 0.01 µg/g, n=3) while the Se-exposed sediments had a mean concentration of 0.54 ± 0.01
µg/g (n=3) (Muscatello and Janz 2009a). However, in a study conducted at a different uranium
mining area in northern Saskatchewan, Muscatello et al. (2008) found that mean lake sediment
Se concentrations were 5.7 ± 0.4 µg/g (n=3) at reference sites but increased below uranium
mining activities to 25.6 ± 2.9 and 62.2 ± 4.7 µg/g (n=3) at medium and high exposure sites,
respectively. The two studies by Muscatello et al. (2008; 2009a) had very different reference site
sediment Se, showing that area-to-area sediment concentrations may be variable.

43
Table 4.7 Summary of sediment selenium values reported in eastern Canadian provinces.
Station Name Sediment Se
(µg/g dw) Location / Description Impact
1 Reference
Nova Scotia
Kejimkujik Lake
1.12 (± 0.12)
(n= 3)
Mean (SD) sediment Se. Oligotrophic
lake in southern end of NS PI
Environment
Canada (2012)10
East River All < 1 or 2
(MDL)
East River near Trenton NS, in vicinity
of coal-fired power plant ash lagoons PI
Lalonde et al.
(2011)11
New Brunswick
Grand Lake
Grand Lake
Saint John Harbour
0.19 (± 0.08)
(n=3)
≤1 (n=3)
3, (n=1)
1.61 (± 0.34)
(n=21)
Mean (SD) sediment Se for a lake,
historical coal mining area east of
Fredericton;
Four sites in the vicinity of old coal-fired
power plant, one site at the outfall had Se
over the MDL;
Mean (SD) from six sites sampled 2011-
12. Of 87 individual replicates, 66
samples were < MDL (1 µg/g).
PI
I
I
Environment
Canada (2012)10
Lalonde et al.
(2011)
University of
New Brunswick
(2012)12
Ontario
Winnange Lake
Harp Lake
Mary Lake
0.56
(n=2)
0.25 (± 0.25)
(n=3)
0.59 (± 0.11)
(n=3)
Mean sediment Se. Undeveloped lake
within a Provincial Park.
Mean (SD) sediment Se. Lake in the
Muskoka region east of Huntsville ON,
cottage development;
Mean (SD) sediment Se. Lake in the
Muskoka region near Bracebridge ON,
cottage development, regulated flow.
R
PI
PI
Environment
Canada (2012)10
Quebec
Lac Matagami
1.10 (± 0.12)
(n=3)
Mean (SD)sediment Se. Relatively
remote but historical metal mining (Cu,
Zn, Ag, Au);
I
Environment
Canada (2012)10
Lac Edouard 0.52 (± 0.31)
(n=3)
Mean (SD) sediment Se. Relatively
remote and unimpacted lake;
R
Lac Ouescapis 0.51 (0.22)
(n=3)
Mean (SD) sediment Se. Relatively
remote and unimpacted lake. R
1R = reference (unimpacted), PI = possibly impacted, I = impacted, U = unknown
The much higher reference site Se concentration in the earlier study (5.7 ± 0.4 µg/g) may reflect
possible mine influence at those sites and/or the different dynamics in accumulation of Se in
sediments in those lakes. This underscores the complexity of the behaviour of Se in aquatic
environments.
10
Data obtained from Melissa Gledhill, Environment Canada CARA databases. 11
Data not reported in publication, obtained from author. MDLs were relatively high = 1 or 2 µg/g dw. 12
Data obtained by request from Dr. K. Kidd, Professor, Dept. of Biology, University of New Brunswick.

44
Burnett-Seidel and Liber (2012) compared sediment Se data collected for environmental
monitoring purposes with the lowest- and severe-effect levels for Se (LELs and SELs,
respectively) derived by Thompson et al. (2005). They found that 75% of reported sediment Se
concentrations at reference sites (n=12) were below the 1.9 µg/g LEL concentration, 25% were
above the LEL but below the SEL concentrations, and none exceeded the SEL concentration of
16.1 µg/g.
Studies in Alberta show that Se emitted from coal-fired power plants can accumulate in lake
sediments (Donahue et al. 2006). Approximately 74% of Alberta’s electric energy is generated
from coal-fired power plants (Statistics Canada 2010). In western Canadian coal-fired power
plants, Se had one of the highest rates of emission, at 0.73 kg/day, of 10 elements of concern
examined (Goodarzi et al. 2006). In a study on Wabamun Lake, Alberta, where four coal-fired
power plants operated within a 35 km radius (two of which were located on the shoreline),
sediment cores showed that Se had increased 3.4-fold in lake sediments since the 1950s
(Donahue et al. 2006). These increases coincided with the start-up of coal-fired power plants and
other industries in the Wabamun Lake watershed (Donahue et al. 2006).
Sediment Se concentrations on the North Saskatchewan River in Alberta, sampled between 2007
and 2009, were approximately 0.5 µg/g (n=3) at reference sites above the Scotford oil-sand
upgrader discharge. However, 10 m below the upgrader discharge, sediment Se concentrations
were 9.6 µg/g (n=1) (North/South Consultants Inc. 2009).
Selenium has a strong affinity to coal geologies and this is reflected in the wide range of
sediment Se concentrations that may be found in coal mining areas, even at unimpacted
reference sites (Yudovich and Ketris 2006). For example, whole sediment Se in the Upper
McLeod River and Cold Creek basins in Alberta (unimpacted by coal mining) were between 0.3
and 4.813
µg/g (Casey 2005).
13
The range in sediment selenium at reference sites in this Alberta study was 0.3 to 1.7 µg/g (dw) when the highest
concentration of 4.8 µg/g (dw) was omitted since the sediment composition of this sample was suspected to contain
higher amounts of organic material including small twigs, compared with other samples (Casey 2005).

45
Table 4.8 Summary of sediment selenium concentrations at locations sampled in western
Canada.
Station Name Sediment Se
(µg/g dw) Location / Description Impact
1 Reference
Yukon
Lake Kusawa
0.72 (± (0.38)
(n=3)
Mean (SD) sediment Se at an unimpacted
lake site in southern Yukon R
Environment
Canada
databases
(2012)14
Northwest
Territories
Flat River
0.5
(n=1)
Sediment Se at reference site above
tungsten mine, South Nahanni River
watershed;
R Spencer et al.
(2008)
Flat River, Northwest
Territories
3.1
(n=1)
Sediment Se concentrations at the near-
field site below the tungsten mine. I
Saskatchewan
Indigo Lake
< 0.01 (MDL)
(n=3)
Reference lake upstream of the McClean
Lake uranium mine (sampled in 2005)
R Muscatello and
Janz (2009a)
Vulture Lake 0.54 (± 0.01)
(n=3)
Exposed site below effluent discharges
from the McClean Lake uranium mine
(sampled in 2005)
I
Saskatchewan
David Lake
5.7 (± 0.4)
(n=3)
Reference site upstream of the Key lake
uranium mine (sampled in 2004)
R
Muscatello et
al. (2008)
Delta Lake 25.6 (± 2.9)
(n=3)
Medium exposure site below Key Lake
uranium mine (sampled in 2004) I
Unknown Lake 62.2 (± 4.7)
(n=3)
High exposure site below Key Lake
uranium mine (sampled in 2004) I
Saskatchewan
Granite Lake
0.72 (± 0.38)
(n=3)
Mean (SD) sediment Se. Relatively
unimpacted lake 40 km west of
Creighton (smelter). PI
Environment
Canada
databases
(2012)
Alberta
Upper McLeod River
and Cold Creek
0.3 to 4.8
(n=13)
Range of background sediment Se
concentrations at reference sites sampled
between 1999 and 2000
R Casey (2005)
Alberta
North Saskatchewan
River
0.5
(n=3)
Mean background sediment Se measured
in 2009 above Scotford oil upgrader R North/South
Consultants Inc
(2009)
9.6
(n=1)
Sediment Se concentration (2009)
immediately downstream of the Scotford
oil upgrader
I
British Columbia
Fraser River basin
<0.05 – 0.6 Range of sediment Se at 44 sites sampled
within the Fraser River basin 1994-96
R-I Brewer et al.
(1998)
British Columbia
Murray River, north
eastern BC
0.98 (± 0.19)
(n=3)
Mean (SD) background sediment Se at
three reference sites 2009 and 2011
(samples sieved, < 63 µ fraction
analysed)
R BC MoE data
files
British Columbia
Elk River watershed,
south eastern BC
1.5 (± 1.4)
<0.5 to 3.1
(n=3)
Mean (±SD) and range of background
sediment Se concentrations at lentic
reference sites in 2009;
R Minnow et al.
(2011)
1R = reference (unimpacted), PI = possibly impacted, I = impacted, U = unknown
14
Data obtained by request from Melissa Gledhill, Environment Canada CARA databases.

46
Minnow et al. (2011) reported whole sediment Se concentrations collected in 2009 from the top
2 cm at lentic reference sites in the Elk River, BC were between < 0.5 and 3.1 µg/g (mean 1.5 ±
1.4, n=3). However, at coal mining impacted sites in the Elk River, sediment Se concentrations
measured at lentic sites in 2009 were between 2.2 and 20.5 µg/g (mean 10.4 ± 7.7, n=4).
Brewer et al. (1998) reported bed sediment Se concentrations for 44 individual sampling sites
representing 15 reaches of the Fraser River basin in BC. The reaches were categorized into
reference (little or no potential human impact) and non-reference (some degree of influence from
one or more land-use activities). Based on data collected between 1994 and 1996, sediment Se
concentrations ranged between < MDL (0.05) at more pristine sites, and 0.6 µg/g at sites on the
Quesnel River (mid-basin tributary) and sites within the North Arm of the Fraser (lower basin).
On the Murray River in north eastern BC, where the < 63 µm fraction was analysed to reduce
variability, background sediment Se concentrations at three reference sites (n=3 at each site)
were ≤ 1 µg/g (± 0.19) (K. Przeczek, pers. comm., BC Ministry of Environment, March 2012).
4.2.6 Aquatic Biota
4.2.6.1 Microbes and Algae
Bacteria, fungi, and plants including attached (periphyton) and planktonic algae, easily take up
waterborne Se, which is the first important step in Se accumulation and transfer to higher trophic
levels in both freshwater and marine environments (Lemly 1993a; Luoma and Presser 2009;
Maher et al. 2010). Since these microorganisms play a key role in Se biotransformation,
subsequent bioaccumulation and potential toxicity higher up the food web, knowing Se
concentrations in this environmental compartment is an important indicator of potential toxic
effects (Swift 2002; Luoma and Rainbow 2008).
With the exception of vascular plants, Se is thought to be an essential micronutrient for most
living organisms, from microorganisms to large mammals (Ellis and Salt 2003). Studies have
shown that at least some aquatic algae require Se for growth (e.g., marine planktonic species of
diatoms, dinoflagellates, prymnesiophytes, and a cyanophyte) (Harrison et al. 1988). Selenium
from the water column is actively taken up and concentrated in these small aquatic plants;
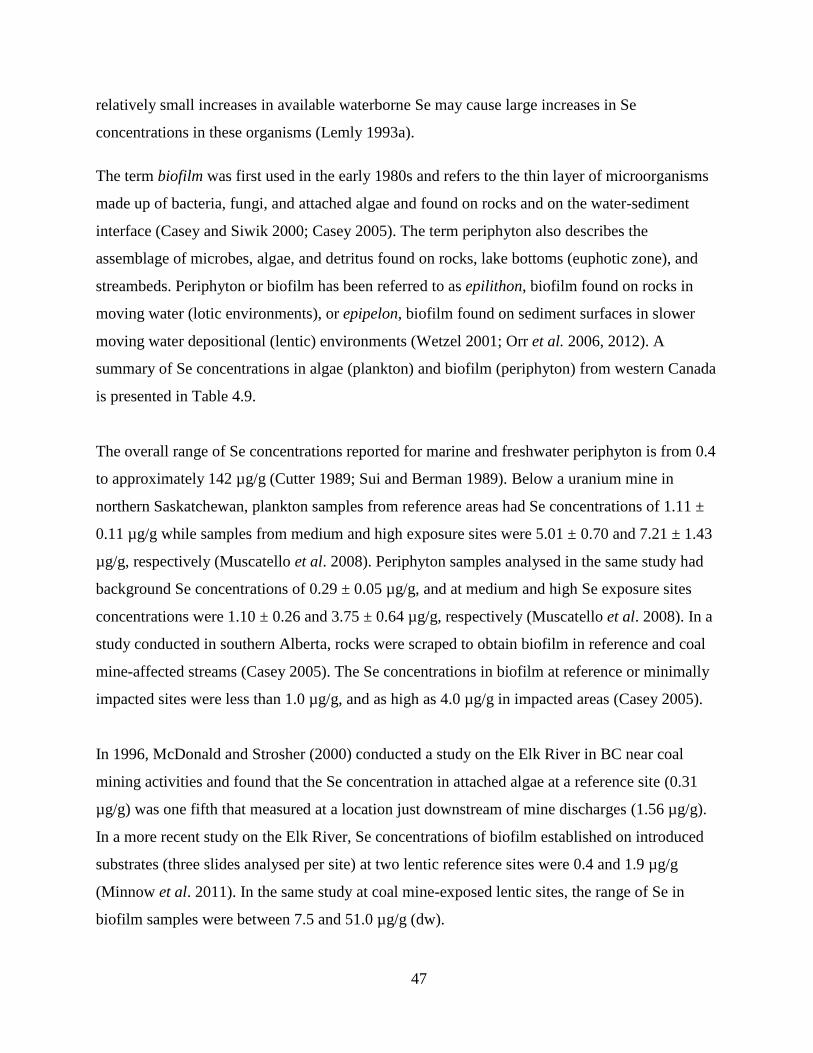
47
relatively small increases in available waterborne Se may cause large increases in Se
concentrations in these organisms (Lemly 1993a).
The term biofilm was first used in the early 1980s and refers to the thin layer of microorganisms
made up of bacteria, fungi, and attached algae and found on rocks and on the water-sediment
interface (Casey and Siwik 2000; Casey 2005). The term periphyton also describes the
assemblage of microbes, algae, and detritus found on rocks, lake bottoms (euphotic zone), and
streambeds. Periphyton or biofilm has been referred to as epilithon, biofilm found on rocks in
moving water (lotic environments), or epipelon, biofilm found on sediment surfaces in slower
moving water depositional (lentic) environments (Wetzel 2001; Orr et al. 2006, 2012). A
summary of Se concentrations in algae (plankton) and biofilm (periphyton) from western Canada
is presented in Table 4.9.
The overall range of Se concentrations reported for marine and freshwater periphyton is from 0.4
to approximately 142 µg/g (Cutter 1989; Sui and Berman 1989). Below a uranium mine in
northern Saskatchewan, plankton samples from reference areas had Se concentrations of 1.11 ±
0.11 µg/g while samples from medium and high exposure sites were 5.01 ± 0.70 and 7.21 ± 1.43
µg/g, respectively (Muscatello et al. 2008). Periphyton samples analysed in the same study had
background Se concentrations of 0.29 ± 0.05 µg/g, and at medium and high Se exposure sites
concentrations were 1.10 ± 0.26 and 3.75 ± 0.64 µg/g, respectively (Muscatello et al. 2008). In a
study conducted in southern Alberta, rocks were scraped to obtain biofilm in reference and coal
mine-affected streams (Casey 2005). The Se concentrations in biofilm at reference or minimally
impacted sites were less than 1.0 µg/g, and as high as 4.0 µg/g in impacted areas (Casey 2005).
In 1996, McDonald and Strosher (2000) conducted a study on the Elk River in BC near coal
mining activities and found that the Se concentration in attached algae at a reference site (0.31
µg/g) was one fifth that measured at a location just downstream of mine discharges (1.56 µg/g).
In a more recent study on the Elk River, Se concentrations of biofilm established on introduced
substrates (three slides analysed per site) at two lentic reference sites were 0.4 and 1.9 µg/g
(Minnow et al. 2011). In the same study at coal mine-exposed lentic sites, the range of Se in
biofilm samples were between 7.5 and 51.0 µg/g (dw).

48
Table 4.9 Summary of selenium tissue concentrations in planktonic algae and biofilm from sites
in western Canada.
Station Name Se Conc.
(µg/g dw) Location / Description Impact
1 Reference
David Lake, north-
central Saskatchewan
1.11 ± 0.11
(n=3)
Plankton Se concentrations from a
reference lake upstream of Key
Lake uranium mine, Saskatchewan
R
Muscatello et
al. (2008)
5.01 ± 0.70
(n=3)
Plankton Se from medium
exposure site I
7.21 ± 1.43
(n=3)
Plankton Se from high exposure
site
I
David Lake, north-
central Saskatchewan
0.29 ± 0.05
(n=3)
Periphyton Se concentrations
from a reference lake upstream of
Key Lake uranium mine,
Saskatchewan
R
1.10 ± 0.26
(n=3)
Periphyton Se concentrations
from medium exposure site I
3.75 ± 0.64
(n=3)
Periphyton Se concentrations
from high exposure site I
Deerlick Creek,
Alberta
1.0 (0.7-
1.4) (n=3)
Mean (range) of biofilm Se
concentrations in a reference
stream above coal mining activities
R
Casey (2005)
Luscar Creek, Alberta 3.2 (2.3-
4.0) (n=4)
Mean (range) of biofilm Se
concentrations in an exposed
stream below coal mining activities
I
Elk River watershed,
BC
0.3
(n=1)
Periphyton Se from a reference
site collected in 1996 above open-
pit coal mining activities
R McDonald
and Strosher
(2000)
Elk River watershed,
BC
0.8 to 1.6
(n=5)
Range of periphyton Se in
samples collected in 1996 from
exposed sites below open-pit coal
mining activities
I
Elk River watershed,
BC
0.4 and 1.9
(n=2)
Biofilm Se concentrations from
introduced substrates deployed in
2009 at 2 lentic reference sites
R
Minnow et al.
(2011)
Elk River watershed,
BC
7.5 to 51.0
(n=4)
Range of biofilm Se
concentrations from introduced
substrates deployed in 2009 at 4
lentic exposed sites
I
1R = reference (unimpacted), PI = possibly impacted, I = impacted, U = unknown

49
4.2.6.2 Macrophytes
Background Se in aquatic macrophytes is typically between 0.1 and 2.0 µg/g (USDOI 1998).
Sandholm et al. (1973) found that aquatic plants had low background Se concentrations, ranging
from 0.02 to 0.14 µg/g. This is consistent with other estimates of background Se in aquatic
macrophytes from natural waters, ranging between 0.04 and 0.24 µg/g (Eisler 1985), and
generally less than 0.60 µg/g (Maier et al. 1998). Edible seaweed is reported to have Se
concentrations of between 0.16 and 0.39 µg/g (Eisler 1985).
Studies show that when additional Se is introduced into a stream, macrophytes are very effective
in bioaccumulating Se, with increases in concentration occurring rapidly, sometimes within
weeks (Ohlendorf et al. 1986; Maier et al. 1998). In studies conducted at the Kesterson National
Wildlife Refuge in California, the mean Se concentration of rooted plants from a control area
was 0.43 µg/g, compared with areas contaminated by agricultural drainwater, where
concentrations were between 18 and 79 µg/g, a 120-fold increase (Ohlendorf et al. 1986). As
Kesterson continued to be impacted by inputs from agricultural drainwater, the mean
concentration of Se in aquatic macrophytes sampled in evaporation ponds in the Kesterson study
area reached 273 µg/g (Presser and Ohlendorf 1987; Presser et al. 1994).
Along with microorganisms (biofilm and plankton), macrophytes can be an important source of
Se in the food webs of some organisms, particularly herbivorous invertebrates and some water
fowl (Stewart et al. 2010). Therefore, macrophytes also play a key role in the biotransformation
and bioaccumulation of Se in the transfer of Se up the aquatic food web (Bowie et al. 1996;
Luoma and Presser 2009; Stewart et al. 2010).
There are few measurements of Se content in aquatic macrophytes from Canadian waters. Casey
(2005) sampled filamentous algae, aquatic macrophytes (unidentified), moss, Potamogeton sp.,
and reedgrass (Sparagium sp.) in Alberta between 1999 and 2000. Only filamentous algae and
unidentified macrophytes were sampled at locations that were clearly above and below coal
mining areas. In the reference locations, individual Se concentrations in samples of filamentous
algae and macrophytes were 0.3 and 1.3 µg/g, respectively, while at the exposed locations
concentrations were 5.5 and 17 µg/g, respectively (Casey 2005). At two coal mine-exposed sites
in the Elk Valley BC in 2002 and 2003, the range of Se concentrations in individual macrophyte

50
samples, which included Carex sp., Equisetum sp., and Typha sp., were between 3.9 and 12.3
µg/g (n=5) (Minnow Environmental Inc. 2004).
4.2.6.3 Invertebrates
The background range of Se in aquatic invertebrates sampled from uncontaminated water is
between 0.5 and 1.5 µg/g (Eisler 1985). However, Se in top predators within the same habitats
may differ greatly, reflecting the variability of Se bioaccumulation in various prey species
(Luoma and Rainbow 2008). For example, Se concentrations in the benthic clam Corbula
amurensis were tracked for approximately 15 years in the San Francisco Bay area; Se
concentrations ranged between 2 and 22 µg/g in areas minimally to strongly impacted from
refinery discharges (Kleckner et al. 2010; Luoma and Rainbow 2008). Selenium concentration
data from some Canadian studies are summarized in Table 4.10.
Jardine and Kidd (2011) collected stream invertebrates in New Brunswick at 49 locations
between 2006 and 2007. The taxa at each site varied, including mixtures of primary consumers
(Pteronarcyidae, Hydropsychidae, and freshwater mussels) and predators (Gomphidae,
Aeshnidae, Gerridae, Cordulegastridae, Megaloptera, and Perlidae). The mean Se concentrations
of invertebrate tissues at 39 of the sites ranged from 0.7 to 3.5 µg/g. Most of the 39 sites (72%)
had tissue Se concentrations between 1 and 2 µg/g, reflecting the effects of local geology and
suggesting that Se enrichment is rare in New Brunswick (Jardine and Kidd 2011).
Near uranium mining operations in Saskatchewan detritivore, filter-feeders, and predator
invertebrate taxa (in all cases n=3–5) had mean background tissue Se concentrations of 0.93 ±
0.22, 2.01 ± 1.11, and 1.23 ± 0.43 µg/g, respectively (Muscatello et al. 2008). In almost all cases,
the mean Se concentration in these invertebrate groups at medium and high exposure sites were
significantly higher, with the exception of filter-feeders at the medium exposure sites
(Muscatello et al. 2008). Detritivores at medium and high exposure sites had mean Se
concentrations of 12.39 ± 4.87 and 25.12 ± 7.07 µg/g, respectively, which were approximately
13 and 25 times background concentrations (Muscatello et al. 2008). A study by Weech et al.
(2011), in the same area in northern Saskatchewan, found mean (SD) Se concentrations of
invertebrate tissues at reference sites were 0.86 (± 0.05, n=19) µg/g.

51
Table 4.10 Summary of invertebrate and zooplankton tissue selenium concentrations from
Canadian studies.
Station Name Se Conc.
(µg/g dw) Location / Description Impact Reference
New Brunswick
0.7 (± 0.2)
to
3.5 (±1.09)
Range of mean (SD) Se in mixed-taxa
invertebrate tissues collected from 49
streams across New Brunswick (n=5).
R - I Jardine and Kidd
2011
David Lake,
Saskatchewan
(reference)
0.9 (± 0.2)
1.23 (± 0.4)
2.0 (± 1.1)
Mean (SE) Se in detritivores (n=5)
Mean (SE) Se in predators (n=3 – 5)
Mean (SE) Se in filter-feeders (n=5) R
Muscatello et al.
(2008)
Delta Lake,
Saskatchewan
12.4 (±4.9)
12.7 (± 0.9)
Not
reported
Mean (SE) Se in detritivores (n=5)
Mean (SE) Se in predator (n=3 – 5)
Mean (SE) Se in filter-feeders (n=5)
I
(medium
exposure)
Unknown Lake,
Saskatchewan
25.1 (± 7.1)
16.0 (± 2.1)
6.0 (± 0.9)
Mean (SE) Se in detritivores (n=5)
Mean (SE) Se in predators (n=3 – 5)
Mean (SE) Se in filter-feeders (n=5)
I
(high
exposure)
Key Lake area,
north Saskatchewan
0.9 (± 0.05)
(n=19)
Mean (SD) Se of mixed aquatic
invertebrates from reference marsh. R Weech et al. (2011)
Deerlick & Cold creeks,
Alberta
1.5 to 7.3
(4.5)
(n=4)
Range and (mean) Se in invertebrate
samples at reference sites above coal
mining activities
R
Casey (2005)2
Luscar Creek, Alberta
6.3 to 15.0
(10.0)
(n=3)
Range and (mean) Se in invertebrate
samples at exposed sites below coal
mining activities
I
Mt Polley Mine,
Williams Lake, BC
0.6 (± 0.1)
to
2.5 (± 0.7)
Mean (SD) Se in invertebrates from
four reference lakes near Mt. Polly
Mine (n=5 at each site)
R
Minnow
Environmental
Inc.(2013)
Elk River, BC 2.74; 6.84
(n=2)
Invertebrate Se in samples at two
reference sites above open-pit coal
mining
R McDonald and
Strosher (2000)
Elk River, BC 6.82 to 10.7
(n=5)
Range of invertebrate Se in samples
from exposed sites below open-pit
coal mining
I
Elk River watershed, BC 4.4 (± 1.6)
(n=4)
Mean (SD) of composite invertebrate
samples from Boivin, Gold and Lynx
(2) creeks (assuming 75% moisture)
R Harding and Paton
(2003)
Elk River BC
3.9 (± 1.6)
(n=32)
Geometric mean (SD) Se in
invertebrate samples from lotic and
lentic sites reference sites, 1996-2009 R
Calculated using
data provided by
Minnow
Environmental Inc.
Lake Koocanusa, south
eastern BC
2.9 (± 0.3)
(n=5)
Mean (SD) of replicate zooplankton
samples collected at a reference site
above coal mining inputs
R McDonald (2009)
1R = reference (unimpacted), PI = possibly impacted, I = impacted, U = unknown
2 Mean of Se concentrations measured in mayflies (Baetidae, Heptageniidae and Ephemerellidae), stoneflies
(Perlodidae, Perlidae and Chloroperlidae), caddisflies (Hydropsychidae and Rhyacophila) and the dipteran
Tipulidae (Casey 2005).

52
In a study, conducted between 1999 and 2001 at coal mining areas in Alberta, mean benthic
invertebrate tissue Se concentrations were 4.5 µg/g at reference areas, and 10.0 µg/g15
at mine-
exposed areas (Casey 2005). Wayland et al. (2006) and Wayland and Crosley (2006) collected
benthic invertebrate Se data from many of the same areas as Casey (2005) which would account
for the tissue Se residue data from these studies being very similar. A study by Wayland et al.
(2007) represents the combined data set.
Minnow Environmental Inc. (2013) collected benthic invertebrates using a ponar from four
reference lakes in the vicinity of Mount Polley Mine north-east of Williams Lake, BC. The mean
(SD) Se concentrations in invertebrate tissues ranged from 0.6 (± 0.1) to 2.5 (0.7), (n=5 at each
site). In 1996, McDonald and Strosher (2000) collected benthic invertebrate samples in the Elk
River BC, containing a mixture of taxa; predominantly Perlodid stoneflies and/or Hydropsychid
caddisflies, as well as mayflies and stoneflies. Selenium concentrations of composite samples of
benthic invertebrates collected at two references sites were 2.74 and 6.84 µg/g, while at three
sites downstream of coal mining activities Se concentrations were between 6.82 and 10.7 µg/g
(McDonald and Strosher 2000).Benthic invertebrate tissue Se data from reference sites sampled
by Minnow Environmental Inc., including the data collected by McDonald and Strosher (2000),
were used to estimate an overall geometric mean (SD) background Se concentration for the Elk
River basin of 3.9 (1.6) µg/g (n=32). McDonald (2009) collected zooplankton samples in Lake
Koocanusa reservoir from a reference area above inputs from coal mining and found mean (SD)
Se concentrations were 2.9 (± 0.3, n=5) µg/g.
4.2.6.4 Vertebrates
Tissue Se concentrations vary in vertebrates depending on species, tissue types (whole-body,
muscle, liver or egg/ovary), and other factors. Oviparous (egg-laying) vertebrate species,
particularly fish and birds, are taxa most at risk to Se toxicity. While reptiles and amphibians
may also be sensitive to the effects of Se, their relative sensitivity to Se is less certain (Janz et al.
2010). Therefore, most of the focus in this section was on fish and birds, and other oviparous
wildlife where data were available.
15
Reported as the median of mean concentrations of secondary and tertiary consumer invertebrate taxa.

53
4.2.6.5 Fish
The US Department of the Interior’s (US DOI) National Irrigation Water Quality Program
(USDOI 1998) summarised fish tissue data from US and global sources. At sites not influenced
by Se contamination, the average whole-body Se concentration in fish was between 1.6 and 2.4
µg/g. In controlled feeding studies where dietary Se was no greater than 2 µg/g, whole-body Se
in fish was < 2 µg/g, and mean muscle, gonad, and egg Se concentrations were between < 2 and
4 µg/g (USDOI 1998). Eisler (1985) reported Se in freshwater whole-body fish tissues similar to
the range reported by US DOI (1998) but noted that marine fish typically had higher Se
concentrations than freshwater. The differences were not great, ranging from similar, to less than
an order of magnitude (Eisler 1985).
DeForest (2009) recently summarized available fish tissue Se data at reference sites to define a
typical background concentration (Figure 4.1). The 50th
and 90th
percentile Se concentrations
were 2.9 and 6.8 μg/g for whole body (n=902), 1.6 and 4.8 μg/g for muscle (n=403), 8.6 and 15.2
μg/g for eggs (n=52), and 9.4 and 24.0 μg/g for ovaries (n=47), respectively (DeForest 2009).The
author noted that it was not possible to verify in all cases that the data represented fish which had
not been previously exposed to Se from either anthropogenic activity or as a result of fish
moving in and out of contaminated areas (DeForest 2009). Fish movement, in particular those
species that move over great distances, can influence exposure to Se and complicate exposure
assessment (Stewart et al. 2010).
Selenium concentrations in fish from Canadian freshwaters show background tissue
concentrations are comparable across the country, with some exceptions (Table 4.11). Mean Se
concentrations for brook trout (Salvelinus fontinalis) in New Brunswick were fairly low, ranging
between 0.6 µg/g (n=1), to 2.6 (± 0.4) µg/g, n=11). The low concentrations in New Brunswick
brook trout reflect the geology of the area.
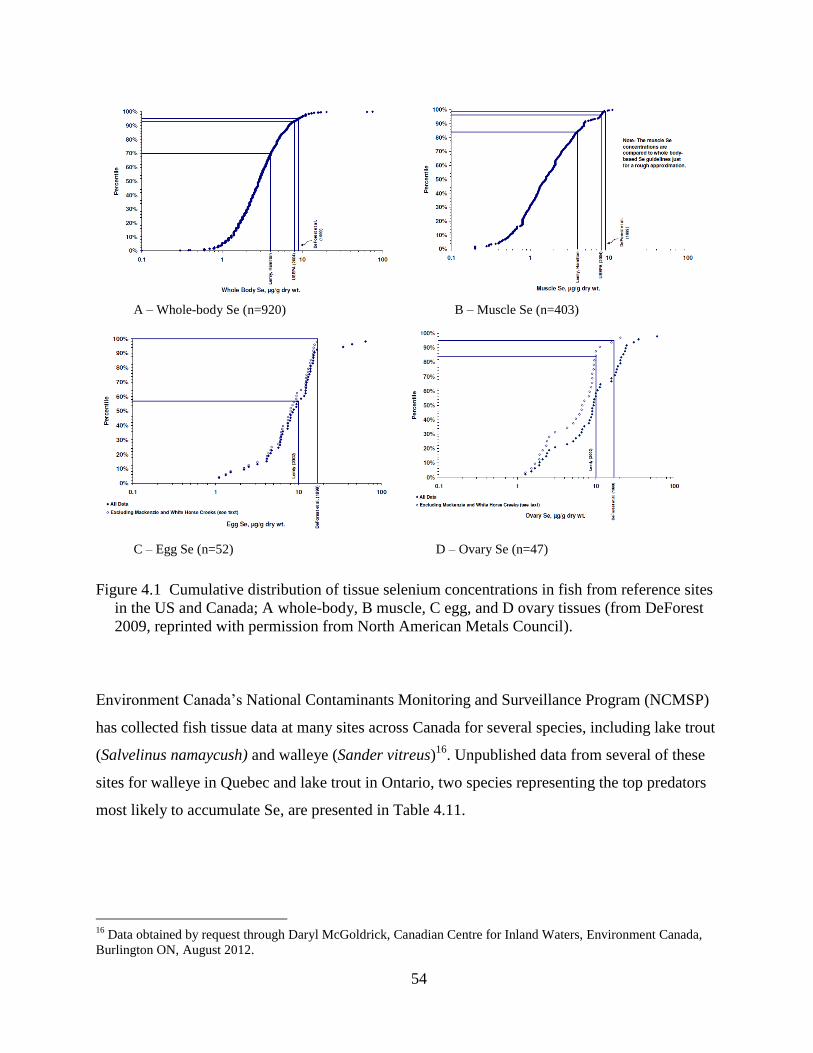
54
A – Whole-body Se (n=920) B – Muscle Se (n=403)
C – Egg Se (n=52) D – Ovary Se (n=47)
Figure 4.1 Cumulative distribution of tissue selenium concentrations in fish from reference sites
in the US and Canada; A whole-body, B muscle, C egg, and D ovary tissues (from DeForest
2009, reprinted with permission from North American Metals Council).
Environment Canada’s National Contaminants Monitoring and Surveillance Program (NCMSP)
has collected fish tissue data at many sites across Canada for several species, including lake trout
(Salvelinus namaycush) and walleye (Sander vitreus)16
. Unpublished data from several of these
sites for walleye in Quebec and lake trout in Ontario, two species representing the top predators
most likely to accumulate Se, are presented in Table 4.11.
16
Data obtained by request through Daryl McGoldrick, Canadian Centre for Inland Waters, Environment Canada,
Burlington ON, August 2012.

55
Table 4.11 Summary of selenium in fish tissues for monitoring sites in eastern Canada (data
obtained from Environment Canada, converted from ww to dw assuming 75% moisture
content1).
Sampling Location Se (µg/g dw) Fish Species / Description Impact2 Reference
New Brunswick
39 streams across New
Brunswick
0.6
(n=1)
to
2.6 (± 0.4)
(n=11)
Range of mean Se (±SD) measured in
brook trout tissues from 39 streams
across New Brunswick.
R - I Jardine and
Kidd 2011
Quebec
St Lawrence River at
St. Nicolas
Lac Matagami
Lac Ouescapis
2.04 (± 0.17)
2.96
1.84 (± 0.15)
Mean (±SD) whole-body Se in walleye
(n = 10) sampled in 2009;
Mean muscle Se in walleye
(n = 2) sampled in 2009;
Mean (±SD) muscle Se in walleye
(n = 8) sampled in 2010
I
U
U
Environment
Canada
(2012)17
Quebec
Lac Édouard
1.26 (± 0.37)
Mean (±SD) muscle Se in lake trout (n
= 10) sampled in 2009
I Environment
Canada
(2012)17
1.21 (± 0.10)
Mean (±SD) muscle Se in lake trout (n
= 10) sampled in 2010
I
Ontario
Lake Huron
(Georgian Bay)
Lake Ontario
(eastern basin)
Lake Superior
(nr Pie Island)
Lake Erie
(eastern basin)
3.63 (± 0.49)
2.46 (± 0.33)
1.94 (± 0.34)
2.00 (± 0.28)
Mean (±SD) whole-body Se in lake
trout (n = 10) sampled in 2010-11,
Cape Rich site on Georgian Bay
Mean (±SD) whole-body Se in lake
trout (n = 29) sampled in 2009, 10 &
11 in the eastern basin of Lake Ontario;
Mean (±SD) whole-body Se in lake
trout (n = 36) sampled in 2009 and
2011, Pie Island - Thunder Bay station;
Mean (±SD) whole-body Se in lake
trout (n = 41) sampled in 2009, 10 &
11 in the eastern basin of Lake Erie -
Dunkirk station;
PI
PI
PI
I
Environment
Canada
(2012)17
1Converted from wet weight to dry weight using a generic 75% moisture content as reported in Lemly (2002a).
2R = reference (unimpacted), PI = possibly impacted, I = impacted, U = unknown
At Quebec sites, the mean fish muscle tissue concentrations for Se for both walleye and lake
trout do not exceed 3 µg/g. Walleye data from 2009 and 2010 at three sites in Quebec shows that
17
Data provided by Daryl McGoldrick, Canadian Centre for Inland Waters, Environment Canada, Burlington ON,
August 2012.

56
the most pristine site at Lac Ouescapis has lower mean Se in walleye muscle tissues (1.84 µg/g, n
= 8), than do either of the two sites which possibly have some impacts from human activity; the
St. Lawrence River at Nicholas (2.04 µg/g, n = 10) and Lac Matagami (2.96 µg/g, n = 2). Lake
trout data collected at a sampling site on Lac Édouard in Quebec in 2009 and 2010, showed that
mean muscle Se concentrations were 1.26 and 1.21 µg/g (n=10), respectively.
At four sites on the Great Lakes in Ontario, mean lake trout muscle tissue residues were between
1.94 and 3.63 µg/g Se (n between 10 and 41, see Table 4.11). This range of Se in fish tissues
likely reflects the amount of human influence at each of the sites, but the tissue Se concentrations
remain fairly low.
In western Canada, Se has been measured in fish tissues at many locations (Table 4.12). For
example, in the Yukon River, Alaska, northern pike (Esox lucius), longnose sucker (Catastomus
catastomus) and burbot (Lota lota), had whole-body composite Se concentrations ranging from
0.92 to 3.4 µg/g with only one burbot sample having concentrations in excess of the literature-
based risk threshold for protection of piscivorous wildlife used by the authors (3.0 µg/g Se)
(Hinck et al. 2006). Harrison and Klaverkamp (1990) conducted lake studies in Manitoba and
Saskatchewan, and reported mean Se concentrations for fish in lakes grouped into three distances
from a smelter emission in Flin Flon, Manitoba. In lakes furthest from the smelter, mean muscle
and liver Se concentrations for northern pike were 1.21 and 8.38 µg/g 18
respectively, and 1.17
and 4.05 µg/g for white suckers (Catostomus commersoni) (Harrison and Klaverkamp 1990).
Studies on the North Saskatchewan River in the vicinity of the Scotford oil sand upgrader facility
in Alberta, showed that average whole-body tissue Se concentrations in longnose dace
(Rhinichthys cataractae) captured at two reference areas were highly variable over a three year
monitoring program, ranging from a minimum of 1.12 µg/g to a maximum of 5.39 µg/g19
(North/South Consultants Inc. 2009).
18
Converted from wet weight to dry weight using 79% and 76% moisture content for liver and muscle respectively
as reported in Harrison and Klaverkamp 1990. 19
Converted from wet weight to dry weight assuming 75% moisture content.

57
Table 4.12 Summary of Se concentrations in various fish species and tissue types from western
Canada.
Sampling Location Se (µg/g dw) Fish Species / Description Impact1 Reference
Yukon River Basin,
Yukon Territory
0.92 to 3.42
Range of whole-body Se in northern
pike (n=19), longnose sucker (n=9), and
burbot (n=3) sampled within the basin
PI Hinck et al.
(2006)
Four lakes in
Saskatchewan
1.21 (0.42)
1.17 (0.50)
Mean (SD) muscle Se in northern pike
Mean (SD) muscle Se in white sucker
(lakes upwind of smelter emissions)
R
Harrison and
Klaverkamp
(1990)
Five lakes near Flin
Flon, Manitoba
3.67 (1.58)
4.38 (2.04)
Mean (SD) muscle Se in northern pike
Mean (SD) muscle Se white sucker
(lakes in close proximity to smelter)
I
North Saskatchewan
River, Alberta
1.1 (0.8) to
5.4 (1.0)
(n=8)
Range of mean (SD) Se in whole-body
tissue of longnose dace at 5 reference
sites, 2007 – 2009
R, PI North/South
Consultants
Inc. (2009)
Deerlick Creek,
Alberta
8.96 (± 1.02) 3
(n=20)
Mean (± SE) egg Se in rainbow trout at
a reference site above coal mining
R
Holm et al.
(2005)
Luscar Creek , Alberta
25.34 (± 3.58) 3
(n=22)
Mean (± SE) egg Se in rainbow trout
sampled below coal mining activities
I
Cold Creek, Alberta
3.33 (± 0.26) 3
(n=22)
Mean (± SE) egg Se in brook trout at a
reference site above coal mining
R
Luscar Creek, Alberta 19.97 (± 1.79)
3
(n=30)
Mean (± SE) egg Se in brook trout
sampled below coal mining activities
I
North-eastern BC
watersheds
1.6 to 7.9
(n=178)
Range of whole-body Se in slimy
sculpin at reference sites inside and
outside coal mining areas
R Carmichael
and Chapman
(2006)
Elk River, south-
eastern BC
7.59 (±1.88)
(n=42)
Mean (± SE) ovary Se for westslope
cutthroat trout in lotic reference or
minimally impacted sites (1998 to 2009)
R, PI
Minnow et al.
(2011)
19.52 (lotic)
92.43 (lentic)
Highest individual ripe ovary Se
measurements for exposed sites
I
4
(3.0 – 4.6)
(n=10)
Mean Se (range) in muscle in westslope
cutthroat trout
R McDonald and
Strosher
(1998)
Flathead River, south-
eastern BC
1.29 (0.28)
(n=20)
7.04 (1.8)
(n=22)
Mean (SD) muscle Se in westslope
cutthroat trout at lotic reference sites
(2006)
Mean (SD) whole-body Se in slimy
sculpin sampled in 2006.
R, PI
Henderson and
Fisher (2012)
Blind Creek, north-
eastern BC
3.4 (0.5)
(n=5)
Mean (SD) Se in whole-body juvenile
rainbow trout sampled pre-coal mining
development (2004), Brule Mine
R
Golder (2009)
7.1 (1.8)
(n=8)
Mean (SD) Se in whole-body juvenile
rainbow trout sampled after coal mining
development (2008), Brule Mine
I
1R = reference (unimpacted), PI = possibly impacted, I = impacted, U = unknown 2 Converted from wet weight to dry weight using 75% moisture content (Lemly 2002a).
3 Converted from wet weight to dry weight using 61% moisture as reported in Holm et al. 2005.

58
Mean Se concentration in rainbow trout (Oncorhynchus mykiss) egg from a reference and a
mine-affected stream in western Alberta were 8.96 (± 1.02) µg/g (n=20) and 25.4 (± 3.58) µg/g
(n=22) respectively20
. In the same study, brook trout mean egg Se concentrations were 3.33 (±
0.26) µg/g (n=22) at the reference site and 19.97 (± 1.79) µg/g (n=30) at the mine-affected site
(Holm et al. 2005). The reason for differences between these two species of salmonids in the
uptake and compartmentalisation of Se in tissues was unclear but underscored the need for
further site- and species-specific research (Holm et al. 2005). At Blind Creek in north eastern
BC, mean (SD) whole-body Se concentrations in juvenile rainbow trout increased from 3.4 (0.5)
µg/g prior to mining, to 7.1 (1.8) µg/g four years after mining commenced (Golder 2009).
Carmichael and Chapman (2006) carried out studies in north-eastern BC, comparing whole-body
slimy sculpin (Cottus cognatus) tissue Se concentrations from reference sites within and outside
of coal mining geology zones. Mean whole-body Se concentrations in sculpin from reference
streams inside the active coal mining zone were significantly higher than those outside the zone
(Carmichael and Chapman 2006). Although sculpin collected at reference sites outside the coal
zone were assumed to be uninfluenced, some tissue Se concentrations were slightly elevated,
exceeding the 2001 BC WQG for Se, but all were below the US EPA criteria (Carmichael and
Chapman 2006). Elevated Se in sculpin tissue at reference sites inside and outside the coal
mining zone was thought to be related to the influence of natural coal deposits present in the
area, or due to small sample sizes or the coal-field boundaries used (Carmichael and Chapman
2006). Henderson and Fisher (2012) collected sculpin in the Flathead River in south eastern BC,
in 2006 at sites considered relatively pristine and found that mean (SD) whole-body Se tissue
concentrations were 7.04 (1.8) µg/g (n=22). At those same sites, Se measured in westslope
cutthroat trout muscle tissue (similar to whole-body concentrations) were 1.29 (0.28) µg/g
(n=20).
Spencer et al. (2008) investigated the effects of mining activities on the Flat River and Prairie
Creek in the Northwest Territories. They reported mean muscle tissue Se concentrations in
sculpin (equal numbers of male and female fish, n=40) at two reference sites were 3.28 and 5.0
20
Converted from wet weight to dry weight assuming 61% moisture content.

59
µg/g.21
However, at the near- and far-field sites, mean muscle Se concentrations were
comparable to or lower than that at reference sites. Other studies conducted on sculpin have
found similar elevations in natural background whole-body Se tissue concentrations (Hamilton
and Buhl 2003; EDI 2009). The relevance of elevated tissue Se concentrations in sculpin is
unknown since there are currently no published Se toxicity thresholds for sculpin, but these data
illustrate the species-specific nature of Se accumulation.
Based on studies in the Elk River, BC between 1998 and 2009, Minnow et al. (2011) reported
mean Se concentrations at lotic reference or minimally impacted sites in whole-body, muscle,
and ripe ovary tissue of westslope cutthroat trout (O. clarkii lewisi) were 5.2 (±1.0) (n=9), 4.6
(±0.8) (n=42) and 7.6 (±1.9) (n=15) µg/g, respectively. Individual muscle tissue residues of fish
captured in 2009 from areas exposed to coal mining effluents were as high as 19.5 µg/g at lotic
sites and 92.4 µg/g at lentic sites (Minnow et al. 2011). The differences in bioaccumulation
dynamics between lotic and lentic waters were evident in these data, and are discussed further in
Section 5.
These data indicate that slight elevations in tissue Se may be apparent at reference sites near coal
geologies where large-scale mining is occurring, compared with other reported background Se
concentrations (e.g., the Flathead River). This provides evidence that background conditions may
vary and/or fish movement may obscure true background. Site selection should be carefully
considered in a monitoring and regulatory framework. Similarly, some species such as sculpin,
may accumulate Se more efficiently that others even in relatively pristine conditions. This
underscores the need to affirm that reference site fish are not exposed to anthropogenic Se
sources and/or development of site- or species-specific Se tissue guidelines (objectives) for some
areas or species may be necessary. This is discussed further in Section 8.4.
Not all fish tissue data located was included in this document. Other BC fish tissue data collected
as part of the Fraser River Action Plan, not summarised in Table 4.12, exist for peamouth chub
(Mylocheilus caurinus), mountain whitefish (Prosopium williamsoni) and starry flounder
21
Converted from wet weight to dry weight assuming 75% moisture content

60
(Platichthys stellatus). In general, the concentrations reported by these authors for Se in muscle
tissues were less than 2.4 µg/g in all three species tested (Raymond et al. 2001)22
.
4.2.6.6 Birds
Selenium in birds is commonly measured in feathers, blood, hepatic tissue (liver/kidney), and
eggs; Se is rarely measured on a whole-body or carcass basis in birds (USDOI 1998). Some
whole-body/carcass bird Se concentrations have been reported by Eisler (1985) include 0.4 to 2.0
µg/g in little green heron (Butorides virescens), 2.1 µg/g in blackbird (Turdus merula), and 0.6
µg/g in both house sparrow (Passer domesticus) and pheasant (family Phasianidae).23
White et
al. (1977, cited in Skorupa et al. 1996) conducted a monitoring program in 1973, sampling 51
sites across the US and reported an average carcass Se (feet, legs, feathers and beaks removed) of
< 2 µg/g in starlings (Sturnus vulgaris). Wells et al. (1977) reported a background Se carcass
concentration of 1.3 µg/g (assuming 65% moisture content) from a composite of five black-
necked stilts (Himantopus mexicanus) collected in Texas.
Feathers from birds in reference areas usually have between 1 and 4 µg/g of Se, while whole
blood typically contains between 0.1 and 0.4 mg/L Se (USDOI 1998). Selenium concentrations
in the liver and kidney tissues of birds are similar, with reference Se concentrations generally <
10 µg/g (USDOI 1998). Avian liver tissue Se concentrations reported for background locations
ranged from 2.0 – 4.3 µg/g in American coots (Fulica americana), 5.2 – 9.5 µg/g in dabbling
ducks (family Anatidae), to 6.0 – 9.9 µg/g in stilts and avocets (Recurvirostridae) (Skorupa et al.
1996).
The most direct means of determining the potential for toxic effects of Se in birds is through
measurement of egg Se concentrations (Adams et al. 1998; Fairbrother et al. 1999; Heinz 1996).
In areas without Se contamination, typical concentrations of Se reported in bird eggs were < 5
µg/g (USDOI 1998; Skorupa et al. 1996; Ohlendorf et al. 1986). In Se-contaminated areas, birds
nesting near ponds collecting agricultural drainage waters within the Kesterson Wildlife Refuge
were found to have egg Se concentrations up to 20 times higher than eggs from reference areas
22
Converted from wet weight to dry weight assuming 75% moisture content. 23
Unable to ascertain if these were average or individual values.

61
(Ohlendorf et al. 1986). Many eggs from contaminated areas had concentrations in excess of 40
µg/g Se, and were associated with higher incidences of embryonic mortality, hatchling mortality,
and severe developmental abnormalities (Ohlendorf et al. 1986).
Much of the Canadian data on bird Se tissue concentrations, some of which is summarized in
Table 4.13, originate from western Canada. Outridge et al. (1999) reviewed Se data for several
species of birds in Canada and found that seven of nine species had background mean egg Se
concentrations below 3 µg/g. Two species, black-legged kittiwake (Rissa tridactyla) and
northern fulmar (Fulmarus glacialis), which feed in pelagic marine areas, had mean egg Se
concentrations slightly over 4 µg/g (Outridge et al. 1999). This observation is consistent with the
observation that marine bird species may have higher Se levels due to feeding habits. Another
anomaly found by Outridge et al. (1999), (not in Table 4.13) weres the high concentrations of Se
in the liver of the common merganser (Mergus merganser) and western grebe (Aechmophorus
occidentalis), with the median (and maximum) concentrations of 38.6 (76.1) µg/g and 34.1
(66.2) µg/g, respectively. These birds were captured in the marine habitat of Howe Sound, BC,
which may explain the relatively high values. The authors noted that further investigation was
warranted (Outridge et al. 1999).
In Alberta (Slave Lake area) and the Northwest Territories (Yellowknife and Inuvik) between
2003 and 2004, DeVink et al. (2008) collected liver tissue from lesser and greater scaup (Aythya
affinis and Aythya marila, respectively), scoters (Melanitta fusca), and ring-necked ducks
(Aythya collaris). Geometric mean (range) Se concentrations in liver were 6.2 (5.5 – 7.0, n=71),
4.6 (4.0 – 5.6, n= 42), and 32.6 (28.4 – 37.3, n=50) µg/g in female scaup, ring-necked ducks, and
scoters, respectively, from all sites and all years combined (DeVink et al. 2008). The higher Se
in scoter livers was attributed to heavier use of marine habitats for foraging where concentrations
of Se are naturally higher than in freshwater environments (DeVink et al. 2008).
Morrisey et al. (2004) studied two populations of American dippers (Cinclus mexicanus) in the
Chilliwack area in south-western BC. The resident river dippers and more migrant tributary
dipper populations had mean egg Se concentrations of 2.96 (± 0.16) and 2.67 (± 0.19) µg/g,
respectively (not in Table 4.13). Wayland et al. (2006) studied resident American dipper

62
populations near coal mining activities in the Rocky Mountain foothills of Alberta and found
dippers at reference sites had mean egg Se concentrations (SD) of 4.9 (± 0.2) µg/g, versus 6.3 (±
0.2) µg/g within coal mining areas, which was significantly higher. SciWrite (2004), Harding et
al. (2005), and Harding (2008) conducted studies on various bird species in the Elk River, south-
eastern BC, between 2002 and 2005, evaluating the potential impacts of Se from large-scale open
pit coal mining activities. In their study on the American dipper, there was no significant
difference in mean (SE) egg Se concentrations between reference (7.4 (0.45) µg/g, n=11) and
exposed areas (8.0 (± 0.44) µg/g, n=10) (Harding et al. 2005). However, in spotted sandpiper
(Actitis macularia) there was a significant difference between mean (SE) egg Se concentrations
at reference (3.8 (± 0.19) µg/g, n=14) and exposed sites (7.3 (± 0.43) µg/g, n=26) (Harding et al.
2005). Monitoring conducted in north-eastern BC on spotted sandpiper found mean (SD) egg Se
concentration in reference streams were at 3.2 (± 0.3) µg/g, with a fairly narrow range in
individual eggs (2.8 to 3.7 µg/g Se) (Golder 2010a).
In the Elk River basin, red-winged blackbirds (Agelaius phoeniceus) had mean egg Se
concentrations of 2.96 µg/g in reference areas, and 21.7 µg/g in areas influenced by coal mining,
with individual measurements in exposed areas reaching 40 µg/g (Harding 2008). Mean egg Se
concentrations were measured in several aquatic bird species in the Elk Valley, including Canada
goose (Branta canadensis), mallard (Anas platyrhynchos), American coot, hooded merganser
(Lophodytes cucullatus), blue-winged teal (A. discors), green-winged teal (A. carolinensis), ring-
necked duck, Barrow’s goldeneye (Bucephala islandica), and bufflehead (B. albeola) (SciWrite
2004). Mean egg Se ranged from 1.38 µg/g, measured in Canada goose at a reference site, to
29.6 µg/g in American coot at a high Se exposure site (SciWrite 2004).
These data show that the majority of mean egg Se concentrations in birds at background sites are
less than 5 µg/g. The Harding et al. (2005) reference site data for dipper is an exception and is
much higher than reported by Wayland et al. (2006) for that species in Alberta studies.

63
Table 4.13 Summary of selenium concentrations in bird tissues collected at sites in Canada.
Sampling Location Se (µg/g dw) Bird Species / Description Impact1 Reference
Sites across Canada
2.56 (± 1.11)
(n=134)
Mean egg Se in multiple bird species (predominantly water fowl) at sites from
NWT, Ontario and Nova Scotia (n represents number of pooled samples in
mean)
R, PI Outridge et al.
(1999)
Slave Lake, Alberta; Inuvik &
Yellowknife, NWT
6.2 (5.5–7.0)
(n=71)
Mean liver Se (95%CI) in female scaup R, PI
DeVink et al.
(2008)
4.6 (4.0–5.4)
(n=42)
Mean liver Se (95%CI) in female ring-necked ducks R, PI
32.6 (28.4–37.3)
(n=50)
Mean liver Se (95%CI) in female scoter (influenced by marine habitat and diet) R, PI
Chilliwack, south-western BC 2.96 (± 0.16)
(n=17)
Mean (SD) egg Se in American dipper from riverine reference sites R.PI Morrisey et al.
(2004)
McLeod River, Alberta 4.9 (± 0.2) Mean (± 1SD) egg Se in American dipper from reference sites
R Wayland et al.
(2006)
Gregg River, Alberta 6.3 (± 0.2) Mean (± 1SD) egg Se in American dipper from coal mine influenced sites I
Elk River,
south-eastern BC
7.4 (0.5)
(n=11)
Mean egg Se (SE) in American dipper from reference sites
R
Harding et al.
(2005)
8.4 (0.4)
(n=10)
Mean egg Se (SE) in American dipper from coal mine influenced sites I
3.8 (0.2)
(n=14)
Mean egg Se (SE) in spotted sandpiper from reference sites
R
7.3 (0.4)
(n=26)
Mean egg Se (SE) in spotted sandpiper from coal mine influenced sites I
Hambrook Creek,
north-eastern BC
3.2 (± 0.3)
(2.8 – 3.7)
Mean egg Se (±SD), and (range) of Se in individual spotted sandpiper collected
from reference area near coal mining
R Golder (2010)
Elk River,
south-eastern BC
2.96 – 6.34
(0.89–6.00)
Range of mean egg Se concentrations in red-winged blackbird at reference sites R
Harding (2008)
3.91 – 21.7 1
(3.60–39.9)
Range of egg Se (individual min – max egg Se concentrations) in red-winged
blackbird at sites influenced by coal mining
I
Elk River,
south-eastern BC
1.38, (n=2) Mean egg Se in Canada goose from a reference site (aqueous Se < 1.0 µg/L) R
SciWrite (2004)
3.23 Egg Se in individual mallard egg collected from a low Se Exposure site
(aqueous Se between 1 – 10 µg/L)
I
17.1 Egg Se in individual Canada goose egg collected from a high Se exposure site
(aqueous Se >10 µg/L)
I
29.6, (n=2) Mean egg Se in American coot from a high Se exposure site (aqueous Se >10
µg/L)
I
1R = reference (unimpacted), PI = possibly impacted, I = impacted, U = unknown.

64
4.2.6.7 Amphibians and Reptiles
The background concentration of Se in amphibian and reptile tissue was reported to be between
2.9 and 3.6 µg/g in liver and 1 to 3 µg/g in other tissues (USDOI 1998). Studies conducted near a
coal-fired power plant on eastern narrow-mouth toads (Gastrophryne carolinensis) found that
reference site females had mean (SD) whole-body Se burdens of 1.85 ± 0.14 µg/g, with similar
Se concentrations in eggs, 1.63 ± 0.12 µg/g (n=18) (Hopkins et al. 2006). Females at exposed
sites had mean (SD) whole-body and egg Se concentrations of 42.40 (± 38.78) and 43.96 (±
37.62) µg/g (n=10), respectively (Hopkins et al. 2006).
Embryo Se concentrations measured from studies conducted between 2005 and 2009 on the
Columbia spotted frog (Rana luteiventris) in the Elk Valley BC, at reference or minimally
impacted sites, were between 2.44 to 5.26 µg/g, with a mean (SD) of 3.6 (± 0.8) µg/g (n=12)
(Minnow et al. 2011).
4.2.6.8 Mammalian Wildlife
There are little data on Se concentrations in mammalian wildlife species. Species, such as mink
(Mustela vison), are often near the top of the aquatic-based food web so may be at risk in areas
where Se concentrations are elevated. Although mammals that rely on aquatic ecosystems for
food accumulate Se, studies have not necessarily demonstrated a clear toxic response to Se,
leading to the supposition that mammals may be less susceptible to Se-induced deformities than
birds (Clark et al. 1987; Clark et al. 1989; Janz et al. 2010). While some small mammals
themselves may be less at risk of Se-induced toxicity, levels of Se in these species may pose a
threat to predators that may be more sensitive to Se (i.e., predatory birds) (Clark et al. 1987).
A summary of tissue Se residues in mammals from several North American studies is provided
in Table 4.14. Puls (1994) reported that mink with an adequate Se concentration in their diet (0.2
to 0.4 µg/g), had tissue concentrations approximately 2.0 to 3.2 µg/g24
in liver, 7.0 µg/g in
kidney25
, and 0.3 to 0.41 mg/L in blood. Adequate Se concentrations in the diet of deer (no
species given) and domestic sheep (Ovis aries) are reported to be between 0.1 and 1.0 µg/g, and
24
Converted wet weight to dry weight assuming 75% moisture content. 25
Converted wet weight to dry weight assuming 75% moisture content.

65
0.4 to 1.0 µg/g, respectively. Puls (1994) reported tissue concentrations of Se in the muscle of
deer (with adequate dietary Se), were between 0.25 and 0.49 µg/g. Additional Se tissue and
blood data for domestic pets and livestock mammalian species may be found in Puls (1994).
In the western United States, the mean Se concentration in the blood of free-ranging bighorn
sheep (Ovis canadensis) captured between 1980 and 1986, was 0.25 ± 0.25 mg/L (n=457) (Kock
et al. 1987). The mean blood Se concentration of these wild sheep is comparable to the range of
reported blood Se concentrations for domestic sheep of 0.12 to 0.5 mg/L, reported by Puls
(1994).
Clark (1987) published the results of studies conducted on 10 species of wild mammals collected
in 1984 at the Kesterson Wildlife Refuge area (Se-impacted) and the Volta Wildlife area
(reference) in California. In general, they found that carnivorous species or species with diets
closely linked to ponds containing Se-contaminated drainage (n=193), had much higher tissue Se
concentrations in liver, than those in reference areas (n=139) (Clark 1987). Although the study
focused on California vole (Microtus californicus), several other species were sampled,
including: three species of mice (house mouse (Mus musculus), deer mouse (Peromyscus
maniculatus), and western harvest mouse (Reithrodontomys megalotis)), ornate shrew (Sorex
ornatus), muskrat (Ondatra zibethicus), California ground squirrel (Spermophilus beecheyi),
dessert cottontail (Sylvilagus audubonii), long-tailed weasel (Mustela frenata), and Norway rat
(Rattus norvegicus) (Clark 1987). Of note were the accumulations of Se in the liver tissues of
voles from Kesterson, which had mean liver Se as much as 522 times those measured in voles at
the reference sites (Clark 1987).
Clark et al. (1989) compared Se in racoon (Procyon lotor) captured at the Kesterson Reservoir
and Volta Wildlife Area. The Kesterson racoons had liver and blood Se concentrations at least an
order of magnitude greater than those captured at Volta, with hair and feces Se concentrations 30
and 21 times greater, respectively (Clark et al. 1989). Clark et al. (1992) continued studies on
small mammals in the San Francisco Bay area, characterizing several contaminant levels
including Se, in mice and voles in pickleweed marsh habitats. At Calaveras Point, the most
contaminated sampling location in the Bay area, Se liver concentrations in mice were elevated

66
(range of mean Se were1.54 – 4.75 µg/g, n=3), but still well below those measured at Kesterson
(maximum liver Se was 60 µg/g in deer mouse) (Clark et al. 1992).
In Canada, several studies reported Se analysis on various wildlife species (Wren 1984; Gamberg
et al. 2005a, 2005b; Lemke and Schwantje 2005). Wren (1984) conducted studies on beaver
(Castor canadensis), racoon, and river otter (Lutra canadensis) in the Tadenac Lake area, an
uninhabited watershed in Ontario. Of the tissues sampled, Se concentrations were highest in the
liver of all three species, compared with kidney, intestine and muscle tissues. The mean (± SD)
liver Se concentrations in racoon, otter, and beaver were 2.8 (± 1.2), 2.1 (± 0.3), and 0.2 (± 0.0)
µg/g (n=4) 26
, respectively. The results also indicated that liver concentrations of mercury and Se
were highly correlated (r=0.96, n=12) in all species analysed. In a subsequent study by Wren et
al. (1986), Se liver concentrations were measured in otter captured from four lakes in north-
western Ontario; mean concentrations ranged from 1.21 µg/g (n=9) to 2.21 µg/g (n=26).
Trace mineral concentrations in bighorn sheep were compiled and evaluated using data collected
between 1978 and 2004 from three meta-populations of California bighorn sheep and one meta-
population of Rocky Mountain bighorn sheep, in British Columbia (Lemke and Schwantje 2005).
Serum Se concentrations for all individuals ranged between 0.01 to 0.89 mg/L; the mean serum
Se for California and Rocky Mountain bighorn sheep were 0.09 mg/L and 0.16 mg/L,
respectively. The concentrations of Se in liver tissue for all individuals were from 0.24 to 10.48
µg/g; mean concentrations for California and Rocky Mountain bighorn sheep were 1.36 and 1.44
µg/g, respectively27
. The authors stated that all mean serum and liver Se values were within
established normal ranges for domestic sheep, published by Puls (1994).
26
The author did not specify if Se concentrations were reported in wet wright or dry weight. 27
Converted wet weight tissue concentrations to dry weight assuming 75% moisture content.

67
Table 4.14 Summary of selenium concentrations in mammalian species measured in tissues at
various locations across North America (units in dry weight unless otherwise stated).
Sampling Location
Se
(µg/g dw or
mg/L)
Mammal Species / Description Impact1 Reference
Literature summary2 0.2–0.4
0.5–0.8 (ww)
1.4 (ww)
0.3–0.41 mg/L
Mink, adequate dietary Se
Mink, liver tissue
Mink, kidney
Mink, whole blood
U
Puls (1994) Literature summary2 0.1–1.0
0.25–0.49
Deer, adequate dietary Se
Deer, muscle tissue
U
Literature summary2 0.4–1.0
0.12–0.5 mg/L
0.25-1.5 (ww)
Domestic sheep, adequate dietary Se
Domestic sheep, whole blood Se
Domestic sheep, liver Se
U
Western US 0.25 ± 0.2 mg/L
(n=457)
Bighorn sheep blood Se (mean ± SD) R/U Kock et al. (1987)
British Columbia
0.01–0.89 mg/L
(n=598)
0.06-2.62 (ww)
(n=283)
Bighorn sheep blood Se, range of
individual blood samples
Bighorn sheep liver Se, range of
individual samples
R/U
R/U
Lemke and
Schwantje 2005
Kesterson Reservoir,
Pond 2
119 (61–250)
(n=5)
California vole liver Se (mean and
(range)) I
Clark et al. (1987)
Volta Wildlife Area
(two sites)
0.23 ( ND–1.4)
(n=10)
California vole liver Se (mean and
(range)) R
Kesterson Reservoir,
Pond 6
38.2 (19–73)
(n=4)
Western harvest mouse liver Se (mean
and (range)) I
Volta Wildlife Area,
Pond 7
1.69 (1.2–2.2)
(n=4)
Western harvest mouse liver Se (mean
and (range)) R
Kesterson Reservoir
19.9 (12–31)
(n=8)
Racoon liver Se (mean and (range)) I
Clark et al. (1989) Volta Wildlife Area
1.69 (0.9–5.9)
(n=4)
Racoon liver Se (mean and (range)) R
San Francisco Bay,
CA 4.75–1.56
(n=3)
Mice liver Se (range of mean conc at
most contaminated sites) I Clark et al. (1992)
Tadenac Lake, south
central Ontario
2.8 (± 1.2) 3
2.1 (± 0.3) 3
0.2 (± 0.0) 3
(n=4)
Racoon liver Se (mean ± SD)
Otter liver Se (mean ± SD)
Beaver liver Se (mean ± SD) R Wren (1984)
Yukon, CA 5.60 ± 3.36
(n=98)
Mink liver Se (mean ± SD)
(assuming 75% moisture content) R/PI
Gamberg et al.
(2005a)
Yukon, CA 4.08 ± 1.67
(n=384)
6.40 ± 6.52
(n=56)
0.88 ± 1.36
(n=37)
Moose kidney Se, (mean ± SD)
(assuming 75% moisture content)
Moose liver Se (mean ± SD)
(assuming 75% moisture content)
Moose muscle Se (mean ± SD)
(assuming 75% moisture content)
R/PI Gamberg et al.
(2005b)
1R = reference (unimpacted), PI = possibly impacted, I = impacted, U = unknown
2 Number of samples and location of samples, not reported.
ND = Se not detected, entered as 0.1 for calculations. 3 The author did not specify if results were reported in wet weight or dry weight.

68
Gamberg et al. (2005a) measured Se in mink captured in the Yukon between 2001 and 2002.
Mean liver Se was 5.60 ± 3.36 (n=98, assuming 75% moisture content). In another study
conducted by Gamberg et al. (2005b) in the Yukon between 1994 and 2001, moose (Alces alces)
tissues (kidney, liver, and muscle) were analysed for several metals, including Se. The data was
summarised to evaluate: a) which, if any, elements were of toxicological concern, b) whether any
temporal or geographic trends were evident, and c) assess whether tissue concentrations in
moose kidney could be linked to environmental trace element concentrations. Selenium
concentrations in moose kidney (n=384), liver (n=56), and muscle (n=37) were 4.08 ± 1.67, 6.40
± 6.52, and 0.88 ± 1.36 µg/g, respectively28
. The authors found that moose kidney Se was
negatively correlated with age, as was arsenic, copper and molybdenum, while cadmium was
positively correlated with age. They also concluded that concentrations of metals in moose
reflected the natural geology of the areas they were captured.
5.0 Environmental Fate and Persistence
Three main processes govern the release of Se: natural weathering; biomethylation, which
accounts for biogenic Se sources from terrestrial plants as well as freshwater and marine biota;
and, accelerated release due to human activities such as mining, irrigation of Se-rich soils, fossil
fuel combustion, or smelting of other minerals (Maier and Knight 1994). From a global
perspective, the most significant pathway for the mobilization of Se, representing the largest
fluxes, is from land to the aquatic environment (Figure 5.1; Haygarth 1994). However, the
greatest contribution of Se both globally and to the aquatic environment originates from human
activities often associated with areas having seleniferous soils or a geology of marine
sedimentary rock or shales (Maier and Knight 1994; Luoma and Rainbow 2008).
28
Assumed 75% moisture content to convert tissue concentrations from wet weright to dry weight.

69
Marine
Anthropogenic
Terrestrial AtmosphericWet & Dry Deposition
Volatilization & Particle Suspension
BioticRecycling
BioticRecycling
Was
te D
isp
osa
l
Figure 5.1 Global selenium cycle showing the major compartments and pathways for the
movement of selenium (adapted from Haygarth 1994).
5.1 Processes in the Aquatic Selenium Cycle
While there is information on Se cycling on a global scale (e.g., Haygarth 1994), this section
focuses on the cycles and processes that affect aquatic ecosystems. Selenium enters aquatic
environments directly and indirectly through wet and dry deposition from both natural biogenic
and anthropogenic (industrial combustion) sources in dissolved or particulate form (Maier and
Knight 1994; Maher et al. 2010). Biogenic sources contribute 50 to 66% of the global Se.
Natural random events, such as wildfires and volcanoes can also contribute to local increases of
Se in air, but human activities are responsible for an increasing proportion of Se released to the
environment (Nriagu and Pacyna 1988; Wen and Carignan 2009). Although the atmospheric
contributions and speciation of particulate Se are not well studied, there is growing concern
about the increasing use of coal for energy production world-wide and the potential
consequences of greater contributions from this activity to the global Se cycle (Maher et al.
2010). Atmospheric Se is quickly photo-oxidized and returned to Earth’s surface, some of which
falls directly into surface waters as inorganic Se (Maier and Knight 1994).

70
The concentration of Se in surface soils is primarily driven by the geologic origin of the parent
rock formation. The availability of Se in soils to plant life varies depending on other soil
characteristics such as alkalinity, pH, and sulphur content. However, soil microbes also play an
important role in transforming elemental, inorganic, and organic forms of Se, which are then
more available for plant uptake (CCME 2009). Methylated selenides formed by soil microbes
and by the plants themselves, may then volatilize to the atmosphere. It is the wet and dry
deposition of this biogenic Se from the atmosphere that is thought to be a major source in the
cycling and redistribution of Se back to soils, surface water and groundwater (CCME 2009).
Land releases of Se into water occur from natural and human activities, either indirectly through
overland runoff or directly from industrial discharges to the environment, with water being the
most important vector for Se entering aquatic systems (Maher et al. 2010). As Se is transported,
distributed, and redistributed in surface waters, the form of Se changes, playing an important
role, along with overall Se loading, in the availability and fate of Se, and ultimately the severity
of its effects on aquatic life (Luoma and Rainbow 2008).
Figure 5.2 shows the three major processes observed in the cycling of Se in aquatic environments
(Maher et al. 2010):
microbial processing and transformation of Se (selenate, selenite, elemental Se, selenide
and gaseous dimethylselenide and dimethyldiselenide);
trophic transfer of Se involving algae, plants, and animals (selenomethionine,
selenocysteine and reduced diselenides);
deposition and resuspension of multiple species of Se (selenate, selenite, elemental Se,
and reduced diselenides).

71
Figure 5.2 Schematic showing the cycling of selenium in aquatic environments. The major
processes in an aquatic system are shown in bolded arrows (from Maher et al. 2010).29
5.2 Physical and Biological Processes
The biogeochemistry of Se in an aquatic environment is complex. Three processes influence the
fate of dissolved Se in an aquatic environment: biological uptake, where Se is absorbed or
ingested by organisms; binding with particulate matter, colloids, or surficial sediments; and,
ongoing dissolution in aqueous solution (Lemly and Smith 1987; Simmons and Wallschläger
2005). Most of the Se entering the aquatic environment binds to particulate matter or is taken up
by organisms (Maier and Knight 1994), ultimately becoming detritus and sediments through
death, decay, and deposition of organisms and settling of particulates (Lemly and Smith 1987).
Sediments play an important role in the cycling of Se in the aquatic environment. Selenium
moves into and out of the top layers of sediment and detritus, governed by several physical,
29
Reprinted with permission from Ecological Assessment of Selenium in the Aquatic Environment. Copyright 2010,
Society of Environmental Toxicology and Chemistry (SETAC), Pensacola, FL, USA. ISBN 978-1-4398-2677-5
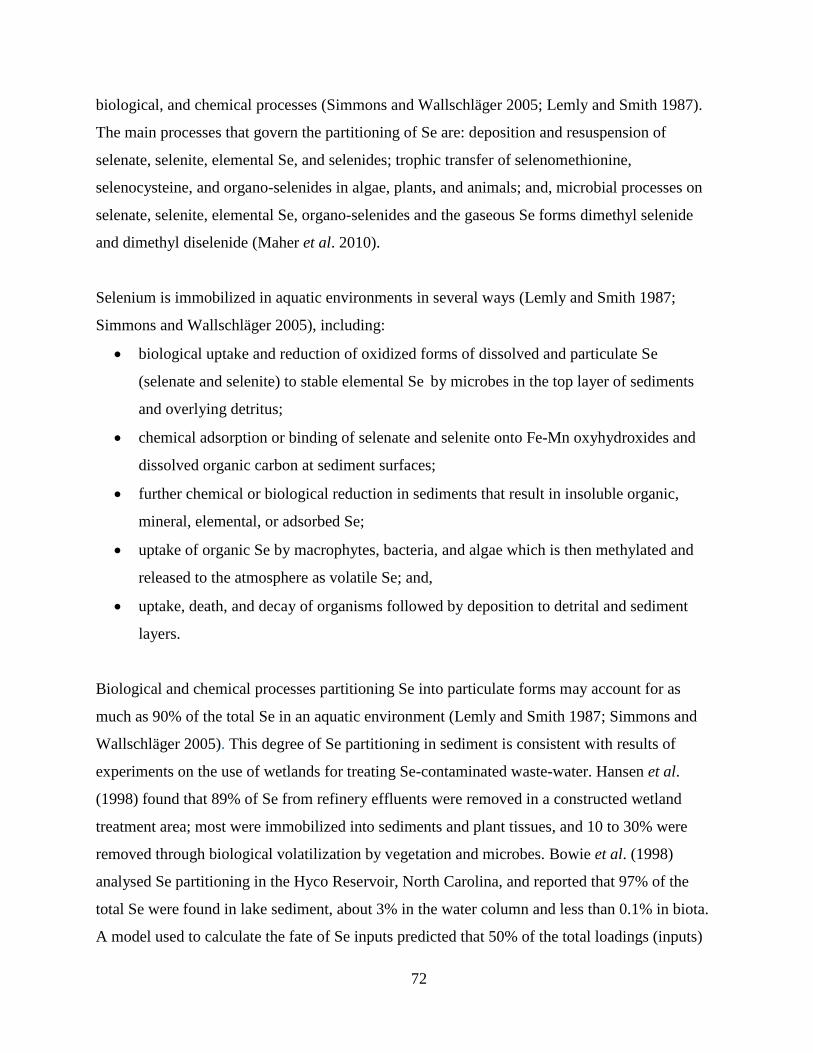
72
biological, and chemical processes (Simmons and Wallschläger 2005; Lemly and Smith 1987).
The main processes that govern the partitioning of Se are: deposition and resuspension of
selenate, selenite, elemental Se, and selenides; trophic transfer of selenomethionine,
selenocysteine, and organo-selenides in algae, plants, and animals; and, microbial processes on
selenate, selenite, elemental Se, organo-selenides and the gaseous Se forms dimethyl selenide
and dimethyl diselenide (Maher et al. 2010).
Selenium is immobilized in aquatic environments in several ways (Lemly and Smith 1987;
Simmons and Wallschläger 2005), including:
biological uptake and reduction of oxidized forms of dissolved and particulate Se
(selenate and selenite) to stable elemental Se by microbes in the top layer of sediments
and overlying detritus;
chemical adsorption or binding of selenate and selenite onto Fe-Mn oxyhydroxides and
dissolved organic carbon at sediment surfaces;
further chemical or biological reduction in sediments that result in insoluble organic,
mineral, elemental, or adsorbed Se;
uptake of organic Se by macrophytes, bacteria, and algae which is then methylated and
released to the atmosphere as volatile Se; and,
uptake, death, and decay of organisms followed by deposition to detrital and sediment
layers.
Biological and chemical processes partitioning Se into particulate forms may account for as
much as 90% of the total Se in an aquatic environment (Lemly and Smith 1987; Simmons and
Wallschläger 2005). This degree of Se partitioning in sediment is consistent with results of
experiments on the use of wetlands for treating Se-contaminated waste-water. Hansen et al.
(1998) found that 89% of Se from refinery effluents were removed in a constructed wetland
treatment area; most were immobilized into sediments and plant tissues, and 10 to 30% were
removed through biological volatilization by vegetation and microbes. Bowie et al. (1998)
analysed Se partitioning in the Hyco Reservoir, North Carolina, and reported that 97% of the
total Se were found in lake sediment, about 3% in the water column and less than 0.1% in biota.
A model used to calculate the fate of Se inputs predicted that 50% of the total loadings (inputs)

73
into the reservoir were in sediments, 45% were flushed out in the outflows, and less than 5%
were volatilized by algae and bacteria from the lake surface.
Although Se is immobilized by incorporation into biota and sediments, these compartments of Se
represent a temporary repository (Lemly and Smith 1987; Simmons and Wallschläger 2005).
Some Se will also be remobilized through several processes, which include:
uptake, oxidation, and methylation of inorganic and organic Se by plant roots and
microbes, followed by release to the atmosphere as volatile selenides which are then
photo-oxidized and returned to land and water surfaces;
the physical mixing and subsequent oxidation of reduced forms of Se by bioturbation
(burrowing invertebrates) and disturbance related to the feeding activities of fish and other
wildlife at sediment surface layers;
direct physical mixing of sediments by water currents or upwellings;
oxidation of sediments through plant photosynthesis; and,
uptake and further cycling of Se by rooted plants and invertebrates which are then
consumed by higher organisms.
In a study that compared two slightly different lentic areas in the Elk Valley BC, emergent
vegetation was the most significant factor dictating sediment redox conditions in addition to the
corresponding speciation and flux of Se across the sediment-water boundary (Martin et al. 2008).
Rooted plants may be one of the main drivers for both redox conditions and the flux of Se
between sediment pore water and overlying bottom waters (Martin et al. 2011).
5.3 Factors Affecting the Fate of Selenium
The form and availability of Se to aquatic organisms is controlled by both geochemical processes
and kinetically-driven biological processes, such as species-specific mechanisms of uptake
(Luoma and Presser 2009). Selenium speciation in various environmental compartments is
influenced strongly by the oxidation-reduction potential (ORP), pH, flushing rates, and
biological productivity of the particular environment, all of which play a role in the biological
availability of Se (Simmons and Wallschläger 2005). The ratio of selenium species in solution
depends on the source (natural or industrial), any treatment that was implemented prior to

74
release, complexation with other ions, oxygenation of water, and biological activity (Maher et al.
2010; Bowie et al. 1996). Selenate is soluble, fairly stable and not particularly reactive with
particulate matter so is taken up slowly especially in the presence of sulphate which competes
directly with selenate for binding sites (Luoma and Presser 2009). Selenite and selenides are
more reactive and may be taken up more readily by biota. Microorganisms readily convert
selenate into elemental selenium in sediments and will also convert any form of aqueous Se into
organo-selenides (Luoma and Presser 2009). The more reactive, reduced particulate selenium
species accumulate in sediment and biota, creating a risk to vulnerable organisms in the food
web (Luoma and Presser 2009).
The form and partitioning of Se is dependent on adsorption of dissolved ions onto particles, pH,
and redox potential, but also may be influenced by temperature. Colder temperatures tend to
decrease adsorption and increase partitioning of Se to sediments, relative to adsorption to
competitive ions (such as sulphates, nitrates, or carbonates) (Wright 1999; Simmons and
Wallschläger 2005; Maher et al. 2010). The speciation of Se may also be influenced by the
concentration of organic matter, productivity (microbial activity), and physical mixing processes
present (Lemly and Smith 1987). Studies have demonstrated that lentic waters are typically more
biologically productive and, due to their slow moving nature, favour the establishment of
reducing conditions. Under such conditions, the transport of Se into sediments is enhanced,
increasing exposure and enhancing uptake of Se by bottom-dwelling benthic organisms
(Simmons and Wallschläger 2005; Orr et al. 2006). This enhanced mobilization and
bioavailability of Se in lentic environments at the base of the food web, leads to greater uptake
and cycling of Se and higher overall bioaccumulation and risk to higher predators (Figure 5.3;
Orr et al. 2006; Simmons and Wallschläger 2005). Redox potential and biological activity in
sediments largely drive the flux of Se between water and the food web, perpetuating long-term
toxic effects in aquatic systems even when Se inputs into the system have been reduced
(Simmons and Wallschläger 2005).

75
Figure 5.3 A simplified Se biogeochemical cycling in lentic & lotic aquatic environments.
Thickness of ellipse = relative Se concentration in trophic level; thickness of arrows = magnitude
of Se transfer or bioconcentration (from Simmons and Wallschläger 2005).
Based on studies comparing two lentic areas, Martin et al. (2008, 2011) concluded that
speciation and recycling of Se is dependent on redox conditions. Furthermore, the presence or
absence of emergent vegetation appears to be the dominant driver in sedimentary redox and
hence the recycling and persistence of reduced Se in waters adjacent to sediments. These
findings support those of Simmons and Wallschläger (2005).
Several important conclusions can be drawn from these models that predict the behaviour of Se
in the aquatic environment, including:
sediments are important in the biogeochemical cycling (and accumulation) of Se through
the benthic food web, and represent a major repository for overall Se loadings to an
aquatic system, as well as a source of Se exposure to benthic organisms;

76
organisms play a major role in Se cycling. The biological processing and high flux rates of
Se in an aquatic system can be determinants for Se speciation in the water column and
microbial action drives much of the accumulation of Se in sediments;
bacteria and primary producers bioconcentrate Se from water by several orders of
magnitude, responding quickly to changes in water concentrations of Se. Higher trophic
levels receive their Se though diet, some responding slowly to changes in Se. Sediments
also respond more slowly to changing Se loadings;
loss of Se through volatilization may be small in most aquatic environments. Wetlands
with shallow, productive ecosystems can have more substantial losses; and,
the type of environment (lotic versus lentic) plays a role in the cycling, partitioning and
bioavailability of Se, as does the structure of the aquatic food web.
(Bowie et al. 1996; Ohlendorf 2003; Maher et al. 2010).
5.4 Selenium Behaviour in the Environment
Once Se is introduced into an aquatic environment and taken up in sediments and biota, it can
continue to cycle and persist for many years if not decades (Simmons and Wallschläger 2005).
Ecosystem recovery is just as complex as the mechanisms of bioaccumulation, and dependent on
many factors including the severity of contamination, habitat type, annual productivity, flushing
rates, and climate (Lemly and Smith 1987). Even after concentrations have been reduced in the
water column, Se will continue to cycle from sediments and through the food web, heightening
the risk associated with Se-contaminated ecosystems (Lemly and Smith 1987; Lemly 1997a;
Lemly and Ohlendorf 2002).
Hermanutz et al. (1996) conducted a series of studies on bluegill sunfish (Lepomis macrochirus)
using outdoor experimental streams dosed with 2.5, 10 or 30 µg/L sodium selenite, then after
approximately a year, ceased Se dosing and continued to track effects. Streams dosed at 2.5 or 10
µg/L showed no adverse effects on progeny one year after Se addition ended. However, streams
dosed with 30 µg/L Se took two years to recover (i.e., no significant adverse effect on adult or
progeny after two years following the end of Se dosing).

77
A study of Belews Lake was conducted 10 years after concentrations of Se in the water column
dropped to less than 1 µg/L (Lemly 1997a). Selenium concentrations in the sediment-detrital
food pathway still represented a risk to fish and aquatic life, as evidenced by the continued
occurrence of Se-induced effects.
Maier et al. (1998) investigated the effects of a single application of Se fertilizer to enhance deer
winter range on streams within the treatment area. Their findings were surprising given there was
only a short-term elevation in waterborne Se, from below detectable concentrations (< 1µg/L)
before the application, to 10.9 ± 0.7 µg/L three hours after the application. Concentrations of Se
returned to below detection 11 days after the fertilizer treatment. Selenium concentrations
measured in stream invertebrate tissues prior to treatment were 1.67 ± 1.65 µg/g, increased to
4.74 ± 1.73 µg/g three hours post-treatment (demonstrating the very rapid uptake into the food
web), and remained at 4.54 ± 0.52 µg/g 11 months following the treatment.
Swift (2002) found similar results in experimental stream mesocosms dosed with sodium selenite
for two to three years, followed by a two to three year period with no dosing. Selenium
accumulated very rapidly in sediment and macroinvertebrate tissues at the onset of dosing and
either reached a plateau, or in the case of some macroinvertebrates, continued to increase
depending on species and dose. When dosing ceased, Se concentrations in sediment, rooted
macrophytes, macroinvertebrates and fish decreased slowly. In the medium exposure mesocosm
(10 µg/L), it took approximately one year for Se concentrations in these compartments to return
to near that of control levels, and in the high exposure mesocosm (30 µg/L) it took almost two
years. Only after several years, did Se concentrations in all compartments of the ecosystem
approach concentrations considered to be non-toxic to fish and wildlife.
Hamilton et al. (2004) conducted studies in the Colorado River to evaluate the effect of lowering
waterborne Se concentrations on various ecosystem compartments in a Se-contaminated
backwater channel. A comparison of samples taken before (1995-96) and after (1997-98) Se was
reduced demonstrated that substantial decreases in Se concentrations were seen in water,
sediment, aquatic invertebrates and some forage fish. However, Se concentrations did not
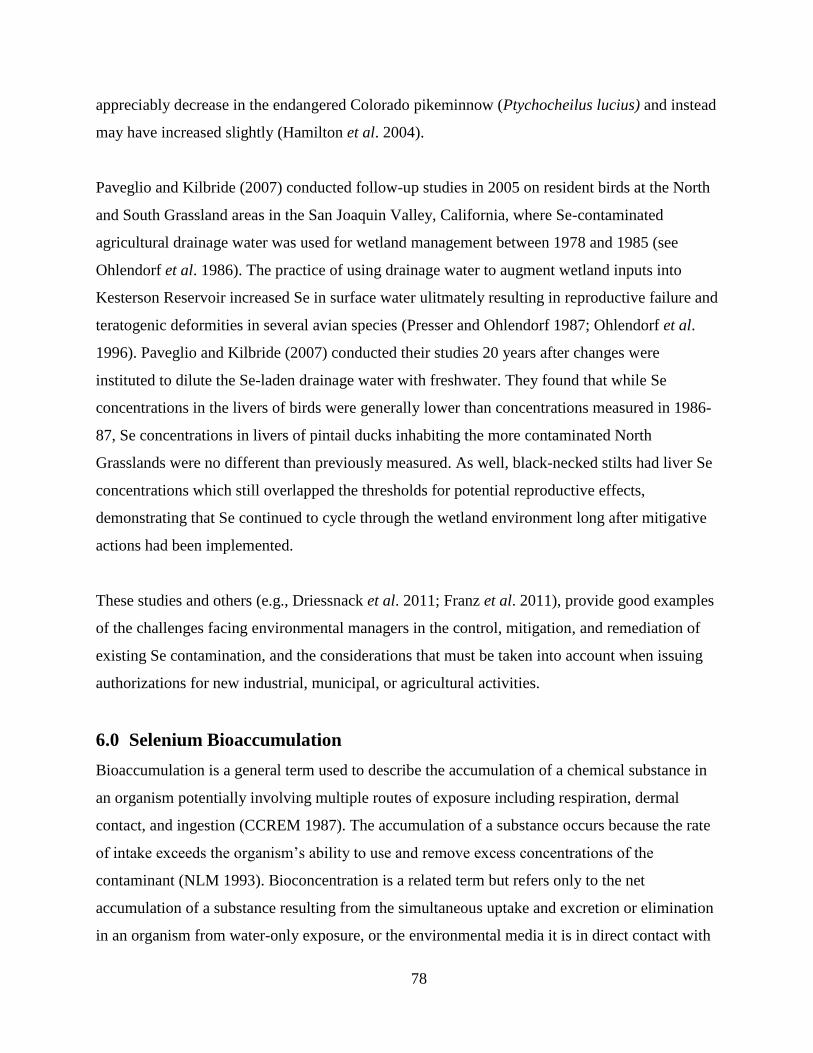
78
appreciably decrease in the endangered Colorado pikeminnow (Ptychocheilus lucius) and instead
may have increased slightly (Hamilton et al. 2004).
Paveglio and Kilbride (2007) conducted follow-up studies in 2005 on resident birds at the North
and South Grassland areas in the San Joaquin Valley, California, where Se-contaminated
agricultural drainage water was used for wetland management between 1978 and 1985 (see
Ohlendorf et al. 1986). The practice of using drainage water to augment wetland inputs into
Kesterson Reservoir increased Se in surface water ulitmately resulting in reproductive failure and
teratogenic deformities in several avian species (Presser and Ohlendorf 1987; Ohlendorf et al.
1996). Paveglio and Kilbride (2007) conducted their studies 20 years after changes were
instituted to dilute the Se-laden drainage water with freshwater. They found that while Se
concentrations in the livers of birds were generally lower than concentrations measured in 1986-
87, Se concentrations in livers of pintail ducks inhabiting the more contaminated North
Grasslands were no different than previously measured. As well, black-necked stilts had liver Se
concentrations which still overlapped the thresholds for potential reproductive effects,
demonstrating that Se continued to cycle through the wetland environment long after mitigative
actions had been implemented.
These studies and others (e.g., Driessnack et al. 2011; Franz et al. 2011), provide good examples
of the challenges facing environmental managers in the control, mitigation, and remediation of
existing Se contamination, and the considerations that must be taken into account when issuing
authorizations for new industrial, municipal, or agricultural activities.
6.0 Selenium Bioaccumulation
Bioaccumulation is a general term used to describe the accumulation of a chemical substance in
an organism potentially involving multiple routes of exposure including respiration, dermal
contact, and ingestion (CCREM 1987). The accumulation of a substance occurs because the rate
of intake exceeds the organism’s ability to use and remove excess concentrations of the
contaminant (NLM 1993). Bioconcentration is a related term but refers only to the net
accumulation of a substance resulting from the simultaneous uptake and excretion or elimination
in an organism from water-only exposure, or the environmental media it is in direct contact with

79
(CCREM 1987). Biomagnification refers to a systematic increase in the concentration of a
substance in tissues as it passes up through two or more trophic levels (CCME 1999).
Selenium bioaccumulation is the key to toxic effects in an aquatic ecosystem. Selenium
accumulates in biotic and abiotic environmental compartments which contribute, to different
degrees, to elevated Se body burdens (Ohlendorf 2003; Presser and Luoma 2009; Stewart et al.
2010). Selenium residues in tissues can vary, even within the same species at the same site, and
may not always be predictably correlated with Se in water (Buhl and Hamilton 2000; Hamilton
2002). Selenium concentrations in aquatic life can range between 100 and 35,000 times the
concentration in water where waterborne Se is between 2 and 16 µg/L (Lemly 1996a; Lemly and
Smith 1987). Relatively low water column Se concentrations, in the range of 3 to 10 µg/L, may
result in elevated levels of Se in sediments, primary and secondary producers, and higher trophic
level consumers, causing reproductive impairment in fish, aquatic birds, and amphibians (Lemly
and Smith 1987; Peterson and Nebeker 1992; USDOI 1998; Lemly and Skorupa 2007). In a
majority of cases, low water column Se concentrations (≤ 2 µg/L) will not result in significant
accumulation through the food web. However, there are rarer instances where water Se < 1 µg/L
results in significant bioaccumulation and apparent chronic effects (Pease et al. 1992; Barwick
and Maher 2003; Rudolph et al. 2008).
Hamilton (2004) stated that fish studies published as early as 1957, identified accumulation of Se
in the food webs and corresponding toxic effects. Barnhart (1957, cited in Skorupa 1998) found
that seven species of stocked game fish in Sweitzer Lake, Colorado, were not reproducing, where
benthic fauna had Se concentrations as high as 20 µg/g and fish livers contained 40 µg/g Se
(Skorupa 1998). Later studies began to distinguish between the relative uptake and toxicity of
different chemical forms of Se (Hamilton 2004). However, it should be noted that Se body
burden may be almost entirely from dietary intake in some aquatic species. In other species,
some invertebrates for example, uptake of soluble Se from water may account for 20% to 60% of
the total body burden (Stewart et al. 2010).
Studies conducted in San Francisco Bay between 1998 and 1999 by Purkerson et al. (2003),
found Se values ranged from 1.02 to 6.07 µg/g in estuarine zooplankton. Among their

80
conclusions, the authors found that smaller herbivorous-omnivorous zooplankton had higher Se
concentrations than larger omnivorous-carnivorous zooplankton, suggesting that trophic level
and size may play an important role in regulating zooplankton Se concentrations (Purkerson et
al. 2003).
For planktonic invertebrates in general, if water concentrations of Se are < 1.0 µg/L, tissue
residues also tend to be low. Some macro-invertebrates, such as molluscs or benthic stream
invertebrates, may accumulate a limited amount of Se by direct contact with water and sediments
(Sui and Berman 1989). There is evidence that some detritus–eating benthic invertebrates may
have accumulated relatively more Se from ingestion of epipelon (microorganisms living within
the sediment-water interface) than was ingested directly from water and sediments (Orr et al.
2006). The concentration of Se in different tissues within the same organism is not necessarily
consistent. Sometimes large differences are found between tissue types, for example Se in the
mantle, kidney and digestive glands of the American oyster (Crassostrea virginica) (Sui and
Berman 1989; Eisler 1985). Interestingly, with the exception of fish, some marine organisms can
accumulate higher concentrations of Se than freshwater species without apparent ill effects
(Stewart et al. 2010).
6.1 Quantifying Bioaccumulation
Bioconcentration factors (BCFs) and bioaccumulation factors (BAFs) are tools commonly used
to better understand the fate of Se, predict toxic effects, and evaluate risk to ecological receptors
(DeForest et al. 2007). Bioconcentration factors are calculated as ratios of Se concentrations in
tissue to Se concentrations in water, or the ratio of Se in sediment to water. Bioaccumulation
factors are ratios between tissue Se concentrations and dietary or sediment Se concentrations
(Besser et al. 1993; Cleveland et al. 1993). However, some researchers may also also refer to the
ratio of tissue Se to water Se as a bioaccumulation factor. Bioaccumulation factors are more
appropriately used when chemical exposure routes include water, dietary items, and incidental
ingestion of particles containing the chemical (DeForest et al. 2007).
Biomagnification is considered to have occurred when the ratio of contaminant concentrations
between successive trophic levels is greater than 1.0 (Stewart et al. 2010). There are conflicting

81
opinions as to whether Se biomagnifies through the food chain. Some investigators believe that
Se may not biomagnify between trophic levels when considered on a whole-body to whole-body
basis (Ohlendorf 2003) or when specific predator-prey relationships are not considered (Luoma
and Rainbow 2008). Others have found that, in some instances, Se does biomagnify (Lemly
1996; Presser and Luoma 2006; Luoma and Rainbow 2008; Barwick and Maher 2003), may
biomagnify (Stewart et al. 2004), may biomagnify depending on the size of the organism (Zhang
and Wang 2007), or will biomagnify between some trophic levels and not others (Jasonsmith et
al. 2008; Muscatello et al. 2008; Sanders and Gilmore 1994). Of the field studies conducted in
Canada, McDonald and Strosher (1998), Casey (2005) and Orr et al. (2006) all reported
bioaccumulation factors (BAFs) or bioconcentration factors (BCFs) in one or more
compartments of the food web, and based on their data suggested biomagnification was
occurring. The summary of bioaccumulation data in Table 6.1 shows variation in Se
bioaccumulation related to the form of Se or other factors in the natural environment, making Se
bioaccumulation in aquatic environments difficult to predict.
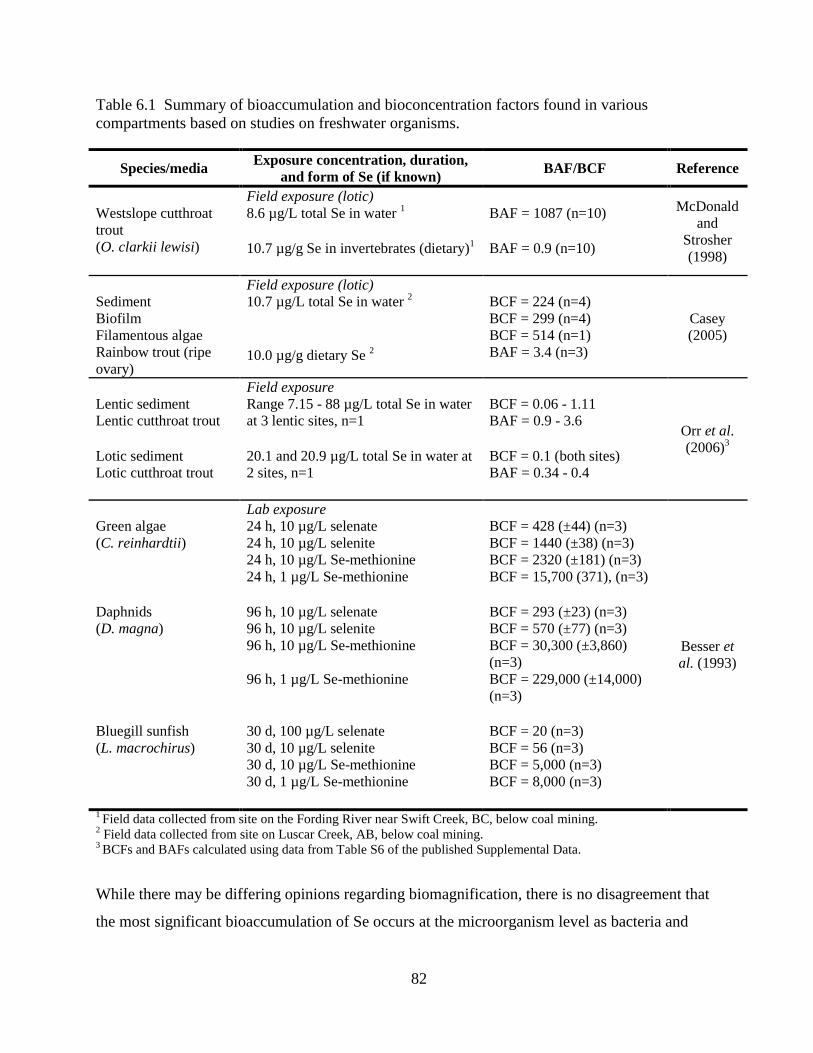
82
Table 6.1 Summary of bioaccumulation and bioconcentration factors found in various
compartments based on studies on freshwater organisms.
Species/media Exposure concentration, duration,
and form of Se (if known) BAF/BCF Reference
Westslope cutthroat
trout (O. clarkii lewisi)
Field exposure (lotic)
8.6 µg/L total Se in water 1
10.7 µg/g Se in invertebrates (dietary)
1
BAF = 1087 (n=10) BAF = 0.9 (n=10)
McDonald
and
Strosher
(1998)
Sediment Biofilm Filamentous algae Rainbow trout (ripe
ovary)
Field exposure (lotic)
10.7 µg/L total Se in water 2
10.0 µg/g dietary Se
2
BCF = 224 (n=4) BCF = 299 (n=4) BCF = 514 (n=1) BAF = 3.4 (n=3)
Casey
(2005)
Lentic sediment Lentic cutthroat trout
Lotic sediment Lotic cutthroat trout
Field exposure
Range 7.15 - 88 µg/L total Se in water
at 3 lentic sites, n=1 20.1 and 20.9 µg/L total Se in water at
2 sites, n=1
BCF = 0.06 - 1.11 BAF = 0.9 - 3.6 BCF = 0.1 (both sites) BAF = 0.34 - 0.4
Orr et al.
(2006)3
Green algae (C. reinhardtii)
Lab exposure
24 h, 10 µg/L selenate 24 h, 10 µg/L selenite 24 h, 10 µg/L Se-methionine 24 h, 1 µg/L Se-methionine
BCF = 428 (±44) (n=3) BCF = 1440 (±38) (n=3) BCF = 2320 (±181) (n=3) BCF = 15,700 (371), (n=3)
Besser et
al. (1993)
Daphnids (D. magna)
96 h, 10 µg/L selenate 96 h, 10 µg/L selenite 96 h, 10 µg/L Se-methionine
96 h, 1 µg/L Se-methionine
BCF = 293 (±23) (n=3) BCF = 570 (±77) (n=3) BCF = 30,300 (±3,860)
(n=3) BCF = 229,000 (±14,000)
(n=3)
Bluegill sunfish (L. macrochirus)
30 d, 100 µg/L selenate 30 d, 10 µg/L selenite 30 d, 10 µg/L Se-methionine 30 d, 1 µg/L Se-methionine
BCF = 20 (n=3) BCF = 56 (n=3) BCF = 5,000 (n=3) BCF = 8,000 (n=3)
1 Field data collected from site on the Fording River near Swift Creek, BC, below coal mining.
2 Field data collected from site on Luscar Creek, AB, below coal mining.
3 BCFs and BAFs calculated using data from Table S6 of the published Supplemental Data.
While there may be differing opinions regarding biomagnification, there is no disagreement that
the most significant bioaccumulation of Se occurs at the microorganism level as bacteria and

83
algae take up available Se from the water column and sediments (Ohlendorf 2003; Lemly 1987).
This first step in bioaccumulation not only represents the largest concentration of Se but can also
be the most variable likely due to species-specific and site-specific variables (Schlekat et al.
2004). Selenium is also taken up from the water column by fish and wildlife through the gills,
epidermis, gut, and diet (Hamilton 2004). Presser and Luoma (2010) suggest the aqueous route
of exposure typically makes up less than 5% of the overall body burden in tissues of consumer
organisms. Sandholm et al. (1973) were the first to report that Se accumulated in fish primarily
through the food web. This study examined the food chain uptake of Se in fish, demonstrating
that Se uptake through food organisms, such as phytoplankton and zooplankton, was the most
efficient exposure route, while Se accumulation directly from water was not substantial. Dietary
Se uptake is also important in invertebrates. For example, water boatmen (Trichocorixa
reticulate) exposed to high concentrations of Se in water did not accumulate any more Se than
control exposure groups, but did accumulate significantly more Se from diet than controls,
suggesting accumulation in this species is solely from diet (Thomas et al. 1999).
Biotransference factors (BTFs), defined as the ratio of chemical concentration in organisms from
a food source to its consumer or between trophic levels, have been estimated by Barwick and
Maher (2003) and later by Jasonsmith et al. (2008). These researchers calculated the BTFs
between successive trophic levels to evaluate whether or not biomagnification was occurring in
various food pathways. Barwick and Maher (2003) examined bioaccumulation of Se within an
estuarine seagrass ecosystem, finding that 29 of 35 trophic interactions demonstrated positive
biotransference (i.e., BTFs >1) indicating that biomagnification had occurred. Despite Se
concentrations in the water column being low (0.3 to 0.5 µg/L), the muscle of four predatory fish
species demonstrated biomagnification of Se and had tissue levels exceeding the maximum
Australia New Zealand Food Authority (ANZFA1992) permitted level of Se considered safe for
human consumption (5 µg/g Se) (Barwick and Maher 2003). Jasonsmith et al. (2008) concluded
that biomagnification was occurring within a freshwater ecosystem, in the phytoplankton and
sediment/detrital pathways, likely explaining the Se biomagnification seen in both rainbow trout
and flathead gudgeon (Philypnodon grandiceps).

84
Since Se accumulation is influenced by more than just exposure to ambient concentrations,
researchers have added biokinetic or biodynamic terms to models which more accurately reflect
the accumulation and passage of Se through the food web (Luoma and Rainbow 2005; Zhang
and Wang 2007; Luoma and Presser 2009; Presser and Luoma 2010). These models quantify the
mechanistic components from one trophic level to the next, including not only the concentration
of Se in food or ingested particles, but also ingestion rate, and constants for assimilation
efficiency, growth, and efflux (excretion) rates (Luoma and Rainbow 2005; Zhang and Wang
2007; Luoma and Presser 2009; Presser and Luoma 2010). Luoma and Presser (2009) have
advocated a systematic approach that breaks down the overall bioaccumulation (BAFs) into
smaller steps that consider the uptake of Se in the aquatic food web progressively though each
successive trophic level. In their model, enrichment factors (EFs), which are equivalent to BCFs
between water and primary producers, as well as trophic transfer factors (TTFs), calculations of
accumulation between trophic levels, may be derived experimentally or from field observations.
These models should consider site- and species-specific differences in bioaccumulation and may
sometimes require incorporation of an aqueous exposure route for some species (DeForest et al.
2007; Zhang and Wang 2007; Luoma and Presser 2009).
Many uncertainties and gaps in our understanding of the biokinetics and biodynamics of Se
bioaccumulation remain. Research is needed on the biotransformation of Se at the base of the
food web, mechanisms of uptake, ingestion and assimilation efficiency rates, sequestration and
inter-organ transfer of Se, and the induction of toxic effects (Stewart et al. 2010). In addition,
some of the basic assumptions that are the foundation of this approach, have been questioned,
such as to what degree, if at all, an individual of any given species is capable of regulating Se. If
biota have the ability to regulate Se (i.e., TTFs are not fixed), then values used for ingestion,
assimilation and excretion are not constant (Beckon et al. 2010). Once again, this area of
research is progressing and better ways of predicting Se bioaccumulation are being sought.
6.2 Factors Affecting Bioaccumulation
Selenium bioaccumulation can vary widely within and between species and is dependent on
many biotic and abiotic factors, including the amount, form of Se, the presence of other elements
and compounds, food preferences, temperature, type of habitat, species sensitivity, life stage, and
85
trophic position or food web structure (Lemly and Smith 1987; Coulliard et al. 2008; Stewart et
al. 2010). Although more research is needed on the mechanisms of Se bioaccumulation for
various organisms, some general findings are apparent. For example, at low ambient Se
concentrations, assimilation and accumulation of Se is often highest, declining as aqueous or
dietary concentrations increase. This biphasic dose-response pattern is seen in nutrition,
agriculture, pharmacology, and toxicology describing responses to essential compounds, where
there is an optimum range and a toxic range, as concentrations increase in excess of optimum
(Beckon et al. 2008).This pattern suggests that a mechanism for regulation of Se may exist in
some species (Ohlendorf 2003; DeForest et al. 2007; Harding 2008; Minnow et al. 2011).
6.2.1 Selenium Speciation
Differences in the bioconcentration of organic and inorganic Se are apparent, with the
accumulation of organic Se (seleno-L-methionine and selenocysteine) one to two orders of
magnitude greater than inorganic selenate or selenite (Simmons and Wallschläger 2005). Besser
et al. (1993) found that organic Se, in the form of seleno-L-methionine, accumulated more
readily than either inorganic selenate or selenite in the algae Chlamydomonas reinhardtii, the
water flea Daphnia magna and in bluegill sunfish (Table 6.1). Bioconcentration factors estimated
for the three species based on an exposure of 1 µg/L Se-methionine were approximately 16,000
in algae, 200,000 in daphnids and 5,000 in bluegill sunfish, as compared with bioaccumulation of
selenite and selenate in the same species between 270 and 3,600 (Besser et al. 1993) (Table 6.1).
Kiffney and Knight (1990) found similar accumulation patterns in studies on the cyanobacteria
Anabaena flos-aquae. Maier and Knight (1993) found seleno-DL-methionine accumulation was
significantly higher than selenate or selenite based on laboratory experiments exposing larval
midge Chironomus decorus for a 48-hour period. Similar studies were conducted by Franz et al.
(2011), who compared accumulation of Se in larval C. dilutus exposed for10-days to aqueous
selenate, selenite, and seleno-DL-methionine, versus controls. These authors found no
appreciable difference in body Se concentrations of control larva and those exposed to 4.8 µg/L
selenate, but found substantial increases resulted from exposure to 3.8 and 1.8 µg/L of selenite
and seleno-DL-methionine, respectively.

86
In a study on macroinvertebrates, Se speciation analyses showed that organic selenides and
diselenides, modelled as selenomethionine and selenocysteine, accounted for more than 85% of
the total Se measured in all nymph and larval insects analysed (Andrahennadi et al. 2007). In the
same study, small fractions of selenite were found in invertebrate tissue, but selenate was not
found in significant quantities despite selenate being the dominant form of Se in the water
column. Interestingly, the researchers also found that biofilm samples showed fairly high
concentrations of selenite and moderate concentrations of elemental Se. This supports other
study results which suggest that the conversion of selenate to selenite, the initial step in Se
bioaccumulation, is important in making Se more available to consumers, while bacterial
conversion to elemental Se renders some fraction of total Se in a potentially less available form
(Simmons and Wallschläger 2005; Andrahennadi et al. 2007; Luoma and Presser 2009). Studies
on birds and fish have shown similar trends in the relative bioaccumulation and toxicity of
organic and inorganic Se forms, with the organic forms of Se (organic selenides,
selenomethionine and selenocysteine) bioaccumulating more readily than inorganic forms (Heinz
et al. 1987; Ohlendorf and Heinz 2011).
6.2.2 Physical Environment
Selenium behaves differently in lotic (fast moving) and lentic (very slow moving or still) waters
(Lemly and Smith 1987; Simmons and Wallschläger 2005; Hillwalker et al. 2006; Orr et al.
2006). As mentioned in Section 5.2, lentic aquatic environments have lower flushing rates and
higher productivity and favour reducing conditions, all of which enhance Se bioaccumulation.
Orr et al. (2006) compared the accumulation of Se in lentic and lotic environments and found
that lentic habitats accumulated Se to a greater extent than lotic exposure areas (Table 6.1). Some
investigators have used the water flow regime of an aquatic system, along with primary
productivity and sediment characteristics, to estimate retention capacity of Se (the ability of a
system to accumulate and conserve Se) to assess the degree of hazard Se may pose to fish and
wildlife (Lemly 2002c; Lemly 2007).
Lemly (1993b) found temperature was a significant factor in Se bioaccumulation. In a study
evaluating the effects of Se exposure, when water temperature was decreased to 4 ºC to simulate
winter conditions, whole-body Se concentrations in juvenile bluegill sunfish (Lepomis

87
macrochirus) increased by approximately 30% compared with a control group held at 20 °C. At
the termination of the test, 40% mortality was observed in the exposed group – an effect later
dubbed “winter stress syndrome” (Lemly 1993b). McIntyre et al. (2008) attempted to replicate
the study and while their study design was not exactly the same, they found the temperature-
related effect thresholds were slightly higher than reported by Lemly (1993b). However,
McIntyre et al.’s (2008) results were similar to that of Lemly (1993b) in that juvenile bluegill
appeared to accumulate more Se and were more sensitive to Se toxicity in the test groups that
were lowered to colder water temperatures (20 to 4 °C). The mechanism for increased Se
accumulation found in the Lemly (1993b) study may have been related to a combination of
reduced feeding (reduced photoperiod) and lipid depletion as energy stores were used (resulting
in reduced weight and decreased condition factor). McIntyre et al. (2008) did not find similar
decreases in lipid content or condition factor in his studies. Janz (2012) noted that the evidence
for increased Se toxicity over winter periods has not been found under field conditions. For
example, Driedger et al. (2009) did not find evidence of a temperature effect on bioaccumulation
in field investigations on northern pike. On the other hand, Saiki et al. (2001) conducted field
studies on Se body burdens in both bluegill and green sunfish (Lepomis cyanellus) and found that
waterborne Se was the single most important predictor of Se body burden, but temperature was
also a significant predictor. Since the literature is equivocal, this may be an area where more
research is needed to determine what the mechanism and effect of colder water may be on Se
bioaccumulation and toxicity.
6.2.3 Influences of Other Compounds and Elements
Studies have shown that the presence of dissolved sulphate can reduce selenate uptake by algae,
cladocera and midges, probably due to the chemical similarity of the two compounds (Hansen et
al. 1993; Williams et al. 1994; Ogle and Knight 1996; Riedel and Sanders 1996). The
mechanism for this interaction is rooted in the competition between sulphate and selenate for
transport across cell membranes (William et al. 1994). However, while sulphate may reduce the
uptake of selenate, it does not appear to affect uptake of selenite or selenomethionine (Ohlendorf
2003). On the other hand, Severi (2001) examined the effects of sulphate on sodium selenate and
sodium selenite concentrations in the aquatic plant Lemna, reporting that the toxicity of both Se
salts appeared to be inversely correlated with sulphate concentration. The relationship between
88
sulphate and selenate bioaccumulation may not be as evident in some species, which may affect
Se bioavailability and toxicity in species such as Hyallela azteca (Brix et al. 2001).
In the draft US EPA Se criteria document, the authors derived a sulphate-correction for an acute
exposure criterion for selenate (US EPA 2004). However, there appears to be conflicting
evidence of a consistent relationship between decreasing selenate bioaccumulation and
increasing sulphate in zoobenthos (deBruyn and Chapman 2007). These authors point out that
the selenate:sulphate relationship in Gammarus reported by Brix et al. (2001) was driven by a
single low LC50 value at low ambient sulphate concentrations; a similar analysis for Hyalella
revealed no such relationship. They also point out that while Hansen et al. (1993) reported the
bioconcentration of Se was reduced as sulphate increased, that decrease in bioconcentration was
modest (less than a factor of 2) over a very large range of sulphate (Se/sulphur ratios from 1:0 to
1:480) (DeBruyn and Chapman 2007). Hansen et al. (1993) offered a caveat to their findings,
stating that the presence of sulphate does not eliminate selenate uptake and added that more
research is needed before a sulphate-corrected Se criterion should be adopted.
Ohlendorf (2003) mentions organic carbon and sediment grain size as factors influencing Se
concentration and bioavailability. Wiramanaden et al. (2010) also found that whole sediment Se
concentrations were closely related to sediment total organic carbon. However, this may reflect
the eventual fate of Se that is taken up by microorganisms or complexed with organic and
inorganic particulate matter which is then incorporated into sediments (Simmons and
Wallschläger 2005). Hillwalker et al. (2006) conducted a three-year study examining the
possible connection between organic carbon and Se accumulation in various compartments of
lotic and lentic environments. Although the pond and creek had fairly similar water Se and
similar total organic carbon (TOC) content in sediments, the pond sediment and detritus (top 2
cm) had 1 to 7 times higher levels of Se. They also found that Se was more efficiently
accumulated in invertebrates at the lentic (pond) site compared with lotic. The study revealed
that site-specific relationships between organic content and Se were apparent in sediment and
detritus. However, organic carbon did not explain differences found in site-specific Se
accumulation in invertebrates between lotic and lentic sites, suggesting that factors beyond

89
organic carbon (other site-specific biogeochemical factors) influence bioaccumulation in lotic
and lentic food web (Hillwalker et al. 2006).
In experiments using green algae (C. reinhardtii), Riedel and Sanders (1996) found that
phosphate suppressed the uptake of selenite. Studies by Yu and Wang (2004) also suggest that
increased phosphate concentrations in water may suppress the uptake of selenite by algae due to
competition between the selenite and phosphate ions. Wright (1999) proposed that increased
nitrate might be associated with increased oxidation and mobilization of Se, a possibility that
could have profound implications for many industrial discharges containing high levels of
nitrate.
Metals such as copper, arsenic, and iron can influence Se bioaccumulation (Hamilton 2004;
Barceloux 1999). In a laboratory feeding study, Atlantic salmon fed a copper-supplemented diet
had reduced liver Se concentrations (Lorentzen et al. 1998). These researchers found a strong
negative correlation between dietary copper and liver Se concentrations, yet at the same time
observed a significant positive correlation between liver concentrations of copper and Se
(Lorentzen et al. 1998). Reduced Se levels in the liver with increased dietary Cu was thought to
be the result of: a) redistribution of Se for synthesis of glutathione peroxidase in response to
oxidative stress (a detoxification mechanism to address increased Cu) or, b) the formation and
excretion of Cu-Se complexes from the liver or intestines of fish (Lorentzen et al. 1998). Hilton
and Hodson (1983), found a similar relationship with increasing Se and Cu concentrations in
rainbow trout liver.
There is a great deal of literature reporting the antagonistic effect of Se on mercury (Hg)
bioaccumulation, particularly in marine fish (Chen et al. 2001; Ohlendorf 2003; Klaverkamp
2002; Hamilton 2004). Studies conducted on northern pike demonstrated that waterborne Se had
no effect on Hg concentrations in fish tissue, but dietary Se reduced Hg concentrations in both
total body burden and muscle tissue (Turner and Swick 1983). Chen et al. (2001) found similar
results; there was a strong negative correlation between muscle Se and Hg in perch (Perca
flavescens) and walleye (Stizosedion vitreum) in nine lakes in the vicinity of a Sudbury Ontario
smelter. However, it should be noted that not all literature report an antagonistic effect between
90
Se and Hg. Some authors have reported no effect or even a synergistic effect (greater than the
sum of individual effects) on the bioaccumulation and toxicity of Hg in the presence of Se
(Stewart et al. 2010; Khan and Wang 2009). The relationship between Se and Hg, while thought
to be strictly antagonistic, needs further research.
Arsenic (As) has also been shown to have an antagonistic effect with Se, reducing the toxic of Se
in several species under varying conditions, including teratogenic effects (Levander 1977). The
mechanism is thought to be the increased excretion of Se in bile rather than As blocking Se
accumulation. Arsenic toxicity can also be reduced by the presence of Se (Marier and Jaworski
1983). Sufficient concentrations of iron in solution has been shown to decrease Se availability
through co-precipitation of Se and iron as insoluble ferric selenite (Barceloux 1999).
Aquatic environments receiving industrial discharges contain a mixture of contaminants.
Available metals such as chromium, cadmium and nickel may confound the expected effects of
elevated Se perhaps through formation of complexes and explaining an apparent lack of toxicity
in fish (Lohner et al. 2001a). For example, Pollack and Machin (2009) found that the effect of Se
on the reproductive indices of male lesser and greater scaup were attenuated when Se was bound
with cadmium, but not with mercury.
6.2.4 Species-Specific Variation in Selenium Uptake
One of the many challenges of understanding Se bioaccumulation is the variation of
accumulation across different environments and between species (Figure 6.1). Studies have
compared Se uptake and depuration of the bivalve Potamocorbula amurensis and two common
crustacean zooplankton species, including the effect on Se concentrations in their predators
(Stewart et al. 2004). These studies demonstrated that basic differences in physiology, in this
case the relatively slow rate of Se loss in molluscs compared to crustaceans, resulted in a much
higher bioaccumulation of Se in molluscs suggesting that some organisms and their predators
may be at higher risk of Se-induced effects.
Hillwalker et al. (2006) conducted accumulation studies in a lotic and lentic ecosystem and
found that along with site-specific differences in accumulation of Se (lotic versus lentic) there

91
were also organism-specific differences in Se accumulation within basic classification levels
(Order, Genera). They underscored the importance of investigating organism-specific factors in
understanding the transfer of Se to higher trophic levels.
Figure 6.1 Trophic transfer function (TTF) estimates based on laboratory data for several
invertebrate and fish species (from Luoma and Presser 2009).
Conley et al. (2011) found that a species of mayfly (Centroptilum triangulifer) fed a lower ration
(1x) of cultured periphyton had higher Se body burdens and higher trophic transfer factors
(TTFs) than mayflies on double the ration (2x). Several possible explanations were put forward
to explain this disparity: a) mayflies receiving the 2x ration became larger possibly diluting the
accumulated Se; b) the 1x ration group were nutritionally limited resulting in higher Se
assimilation efficiencies, as well as higher TTFs and body burdens; or, c) because they were
nutritionally limited, the 1x group were unable to avoid more highly contaminated food prey
92
species (Conley et al. 2011). This study demonstrates the complexity and uncertainty that exists
when predicting Se bioaccumulation in natural environments. In an attempt to address these
complexities, biokinetic controls of Se accumulation have been the basis for recent modelling
approaches to estimate the trophic transfer of Se in aquatic ecosystems (Luoma and Presser
2009).
Selenium does not necessarily show an allometric (proportional) relationship of increasing
concentration with increasing size, length, or age of the individual species as do some metals like
mercury, indicating that other physiologically-based pharmacokinetic factors may be involved in
driving bioaccumulation (Newman and Unger 2003; Hamilton 2004; Zhang and Wang 2007;
Gantner et al. 2009; Stewart et al. 2010). These within- and between-species differences
underscore the importance of site-specific and species-specific data.
7.0 Deficiency and Toxicity of Selenium
7.1 Effects on Human Health
Globally, the Se status in human populations varies widely ranging from deficient to toxic;
variation is due primarily to the amount of Se in our diets (Rayman 2012; Combs 2001).
Selenium intake through food is dependent upon various factors within our diets including the
consumption composition of different food groups and the locations where our food is produced
due to geologic and environmental variables (MacPherson 1997; Fairweather–Tait et al. 2010;
Rayman 2012). The body’s ability to absorb, metabolize, and eliminate Se also contributes to Se
status. Recent studies have focussed on the Se species that humans are exposed to in our diets
because bioavailability, toxicity, and beneficial effects vary with different Se species (Rayman et
al. 2008; Fairweather-Tait et al. 2010; Rayman 2012).
7.1.1 Exposure in Humans
For the vast majority of people living in North America, the primary source of exposure to Se is
through food and dietary supplements (Health Canada 1992; ATSDR 2003; Health Canada
2010c). Food is estimated to account for more than 98% of the daily intake of Se (Health
Canada1992). Although people may also be exposed to Se compounds in ambient air, drinking
water, and soil, typically (though not always) these are insignificant contributions (IOM 2000).

93
7.1.1.1 Dermal
Selenium is an ingredient in some antidandruff shampoos and antifungal skin creams (CCME
2009). Selenium compounds are not easily absorbed through the skin; there is little information
concerning systemic effects of dermal exposure to Se compounds in humans (ATSDR 2003).
Use of antidandruff shampoo containing 1% selenium sulphide by 150 individuals found no
adverse effects after six weeks (Neumann et al. 1996). Acute dermal exposure to selenous acid
or selenium dioxide causes burns and rashes (ATSDR 2003; Calello 2010).
7.1.1.2 Air
Exposure through inhalation is typically insignificant for the general population; however,
occupations where people may be exposed via inhalation are the metal industries, Se-recovery
processes, paint manufacturing and special trades (ATSDR 2003). Selenium compounds
encountered in these settings include dusts of elemental Se, hydrogen selenide, and Se dioxide;
the respiratory tract is the primary site of injury after inhalation but gastrointestinal,
cardiovascular, and irritation of skin and eyes may also occur (ATSDR 2003). Quantitative data
is not available primarily because of the possibility of concurrent exposure to other substances
(ATSDR 2003). However, there have been reported exposures in occupational settings. At a
copper refinery, exposure exceeding 0.2 mg Se/m3 (amongst other contaminants in the air)
increased nose irritation and sputum (Holness et al. 1989). CCME considers that typical
background Se concentration in Canada is approximately 1.0 ng/m3 (CCME 2009).
7.1.1.3 Selenium Species in Foods
Excellent reviews of the various species and concentrations of Se in foods and food supplements
and associated health effects are provided by Rayman et al. (2008) and Fairweather-Tait et al.
(2011). While all dietary forms of Se tend to be absorbed quite efficiently in the human body, the
retention and use of organic forms tend to be higher than for inorganic forms (IOM 2000; Finley
2006; Calello 2010; Fairweather-Tait et al. 2010).
The Se content of the food we consume is a reflection of complex geologic and environmental
factors (Combs 2001; Fairweather-Tait et al. 2010). Selenium concentrations in soils on which
crops are grown (e.g., grains and cereals) or in fodder consumed by animals is a large contributor

94
to the amount of Se found in our food (MacPherson et al. 1997; ASTDR 2003; Fairweather-Tait
et al. 2011; Rayman 2012). The biosynthesis and metabolism of Se in plants and animals will
affect the Se concentration and species present in plant and animal foods (Rayman 2012). For
example, selenomethionine is the dominant Se form in cereals and grains; it is less prevalent in
vegetables and some animal and fish species (Rayman et al. 2008; Fairweather-Tait et al. 2010).
Selenomethionine accounts for approximately 55-85% of Se species in bread and wheat, 50-60%
in meat, and 29-70% in fish (Fairweather-Tait et al. 2011). The major species in plant sources
are selenate, selenomethionine and smaller amount of selenocysteine (Rayman et al. 2008).
There is less information on the species of Se in dietary sources of animal origin (Rayman et al.
2008).
Grains and cereals grown in Canada, Australia, Japan and the US are known to be excellent
sources of Se compared to similar crops grown in Europe (MacPherson 1997; Finley 2006;
Rayman 2012). In fact, reductions in the importation of North American wheat to European
countries has been linked to less than optimal Se status in humans in Finland and the UK thus
prompting government to find strategies to increase levels (MacPherson 1997; Rayman 2000;
Finley 2005; Reilly 2006).
7.1.1.4 Selenium Intake from Food
Through the Total Diet Study, Health Canada analyzes contaminants and chemicals in Canadian
foods; in other countries these surveys are often called ‘Market Basket Surveys Studies’ (Health
Canada 2012b). The Canadian Total Diet Study conducted by Dabeka (1994) found that 51% of
the daily selenium intake (males and females of all age groups) was derived from baked goods
and cereals. Dietary studies of the US population published by the Food and Drug
Administration (FDA 1982) estimated that approximately 52% of Se intake was obtained from
grains and cereals, followed by meat, fish, and poultry (36%), and dairy products (10%). A study
in the United Kingdom estimated 26% of Se was obtained from bread and cereals, 26% from
meat, 21% from dairy products, 10% from fish, with fruit, vegetables, eggs and other products
accounting for the remaining contribution (Fairweather-Tait et al. 2011). Average dietary Se
intake of Canadians was assessed in the most recent three surveys of trace elements (Table 7.1).

95
Selenium status corresponds to intake; the Canadian Health Measures Survey measures Se in
blood and urine of participating Canadian populations from the ages of 6 – 79 years (Health
Canada 2010c). During the 2007-2009 survey cycle, the geometric mean and 90th
percentile of
Se in blood concentrations of populations of both males and females aged 6-79 years were 0.198
mg/L and 0. 236 mg/L, respectively (Health Canada 2010a). Calello (2010) reported the
following as normal concentrations in US populations: whole blood 0.1 – 0.34 mg/L, serum 0.04
– 0.6 mg/L, urine < 0.03mg/L, and hair < 0.4 µg/g.
Table 7.1 Average dietary intake of Se has been published by Health Canada (2005; 2006;
2007a) for various age-sex groups.
Age-Sex Group Reference Body
Weights (kg)30
2005 (Toronto)
(µg/kg bw/day)
2006 (Halifax)
(µg/kg bw/day)
2007 (Vancouver)
(µg/kg bw/day)
0-1 Mo (M&F) 7 5.0 4.9 7.9
2-3 Mo (M&F) 7 4.4 4.2 7.1
4-6 Mos (M&F) 7 4.2 4.2 8.2
7-9 Mo (M&F) 13 4.0 3.9 7.1
10-12 Mo (M&F) 13 4.0 4.1 7.0
1-4 Years (M&F) 13 5.7 5.7 8.7
5-11 Years (M&F) 27 4.6 4.4 6.5
12-19 Years (M) 57 3.1 3.1 4.5
12-19 Years (F) 57 2.3 2.2 3.2
20-39 Years (M) 70 2.6 2.7 3.7
20-39 Years (F) 70 2.1 2.1 2.8
40-64 Years (M) 70 2.1 2.1 3.0
40-64 Years (F) 70 1.7 1.7 2.4
All ages (M and F) 2.2 2.2 3.2
30
Health Canada. 1994. Human Health Risk Assessment for Priority Substances. Minister of Supply and Services
Canada, Ottawa, Ontario.

96
7.1.1.5 Selenium Intake from Dietary Supplements
Dietary supplements can be a significant source of Se; generally the content of Se in
multivitamins/multiminerals is ≤ 50 µg/tablet (Health Canada 2007b). Selenium supplementation
in the form of selenised yeast can be as high as 200 µg/tablet in over-the-counter supplements
(Health Canada 2007b). Other forms of Se are available in commercial mineral and vitamin
foods sold in Canada.
7.1.1.6 Selenium Intake from Drinking Water
Drinking water was not considered as a significant exposure source of Se when the IOM
developed dietary reference intakes (IOM 2000); these have been adopted by Canada (Health
Canada 2003). Drinking water sources in Canada and the US usually contain very low or only
trace amounts of Se (Health Canada 1992; ATSDR 2003; CCME 2009). For example, a survey
of 122 drinking water supply systems in Canada found that Se levels were at or below 0.5 µg /L
(Health Canada 1992). Source water sampling results provided by the Interior Health Authority
from 761 small water systems (ie. serving less than 500 people) indicated that 13 systems had
source water Se concentrations greater than 10 µg/L, 349 systems had concentrations between 1
and 10 µg/L, while the remaining 399 systems had concentrations less than 1 µg/L (J. Norlin,
pers. comm., Interior Health Authority, September 2013). There are circumstances where the Se
contribution from drinking water can be significant either due to natural or anthropogenic
processes. For example, Valentine (1997) listed specific geographic regions in the United States
where Se concentrations in surface, springs, and ground water sources were 8 to 180 times the
EPA drinking water standard of 50 µg/L. Drinking water at these concentrations can result in
dietary exposures exceeding the tolerable upper intake level of 400 µg/day. Inorganic forms of
Se (e.g., selenate, selenite) are the primary water-soluble forms found in drinking water which
are considered more toxic than organic forms (Health Canada 1992; OEHHA 2010).
7.1.2 Pharmacokinetics in Humans
Both organic and inorganic forms of Se are available in the human diet; absorption varies with
species (IOM 2000; Calello 2010). Rayman et al. (2008) provides an excellent review of the
species of Se and associated concentrations found in foods and food supplements. Absorption of
all forms is efficient; elemental Se is least bioavailable (<50%) followed by inorganic selenite
97
and selenate (75%), and organic Se (95%) (IOM 2000; ATSDR 2003; Finley 2006; Rayman et al
2008). Absorption may be affected by factors such as its chemical form, presence of protein,
vitamin E, and vitamin A (Fairweather-Tait 1997). Animal studies have demonstrated that the
primary site of absorption is the lower end of the small intestine (Reilly 2006). The specific
mechanisms of absorption are not fully understood, however there is evidence that
selenomethionine is absorbed by sharing an active transport mechanism with methionine,
selenite is absorbed via passive diffusion, while other species such as selenate are absorbed from
action of sodium-mediated carrier transport shared with sulphate (Vendeland et al. 1994;
Fairweather-Tait 1997; Barceloux 1999; Reilly 2006).
Of interest in terms of health effects is the amount of Se that is bioavailable. This is defined by
Fox et al. (2004) as that fraction of ingested nutrient that is utilised for normal physiological
functions. Organic forms of Se such as selenomethionine are more bioavailable than inorganic
forms such as selenate and selenite (Rayman et al. 2008; Fairweather-Tait et al. 2010). The
bioavailability of Se in fish is not well studied, however recent research suggests it is dependent
on species rearing location factors (Yoshida et al. 2011). Studies have found that Se
bioavailability is low in tuna and other seafood products (Alexander et al. 1983; Wen et al. 1997;
Yoshida et al. 2001; Fox et al. 2004) whereas Fox et al. (2004) found that in farmed trout, Se
bioavailability to humans is comparatively high.
Selenium metabolism is partially determined by its chemical form (Rayman et al. 2008; Finley
2006; Combs 2001). Finley (2006) describes three potential fates of ingested Se: 1) as
selenomethionine, it may be inserted into general proteins (i.e., not Se specific) as a substitute for
methionine; 2) in salt form (selenite and selenate) it may be reduced to the selenide and then
inserted into Se specific proteins (i.e., selenoproteins such as glutathione peroxidase; and 3) Se
compounds (e.g., the species found in allium vegetables) may be reduced to selenide and
ultimately excreted primarily through urine but a lesser amount in the breath.
Soluble Se compounds such as sodium selenate and sodium selenite are considered more toxic to
humans than the organic forms (Yang et al. 1983; Health Canada 1992; Nagpal and Howell
2001). The amount of information available on the human toxicity of inorganic forms of Se in

98
drinking water, independent of intake of organic Se from food sources is however limited
(Health Canada 1992; OEHHA 2010). According to the IOM (2000) inorganic Se in humans can
cause toxicity at much lower levels than is observed with organic forms of Se.
7.1.3 Essentiality and Deficiency
Selenium is known to be of fundamental importance to human health (IOM 2000; Rayman 2000;
Reilly 2006). Selenium is a critical component of selenoproteins such as glutathione peroxidase;
these function primarily in oxidation-reduction reactions (IOM 2000; ATSDR 2003).
Selenoproteins are also a catalyst for the production of active thyroid hormone (Rayman 2000).
There is substantial evidence that Se deficiency or low Se status is accompanied by loss of
immunocompetence, disease progression of viral infections, risk of miscarriage, and
cardiovascular disease (Rayman 2000; Reilly 2006). For example, low Se status in the general
population of Finland has been linked to high cancer and cardiac mortality rates (Reilly 2006).
Selenium deficiency is rare in the modern North American diet because generally food is
obtained from different geographic areas and food choices are plentiful. However, Se deficiency
has been observed in areas of China where the soil Se levels are very low (< 0.125 mg Se/kg
soil), the diet is almost entirely composed of locally produced food, and there is limited food
variety (Whanger 1989; Combs 2001). Deficiency occurs when daily intake falls below 20
µg/day (Calello 2010). Keshan disease was discovered in the Keshan county of northeast China
in the mid 1930s and it is linked to Se deficiency (<25 µg/day) in humans (Whanger 1989; IOM
2000). It is a cardio-myopathy characterized by an enlarged heart as well as abnormal ECG
patterns, cardiogenic shock, and congestive heart failure, with multifocal necrosis of the
myocardium (IOM 2000; ATSDR 2003). The disease is almost exclusively observed in children.
There is also evidence that Se deficiency may be related to a condition called Kashin-Beck
disease which is characterized by atrophy, degeneration, and necrosis of cartilage tissue (IOM
2000; ATSDR 2003). The disease is endemic in an area of Asia consisting of east Siberia, North
Korea, North Vietnam and northeast China, primarily in the Shaanxi province (Whanger 1989).
The disease only occurs in Se deficient children, however, it appears to be triggered by an
additional stress and not when in isolation (IOM 2000). Other causative factors hypothesized
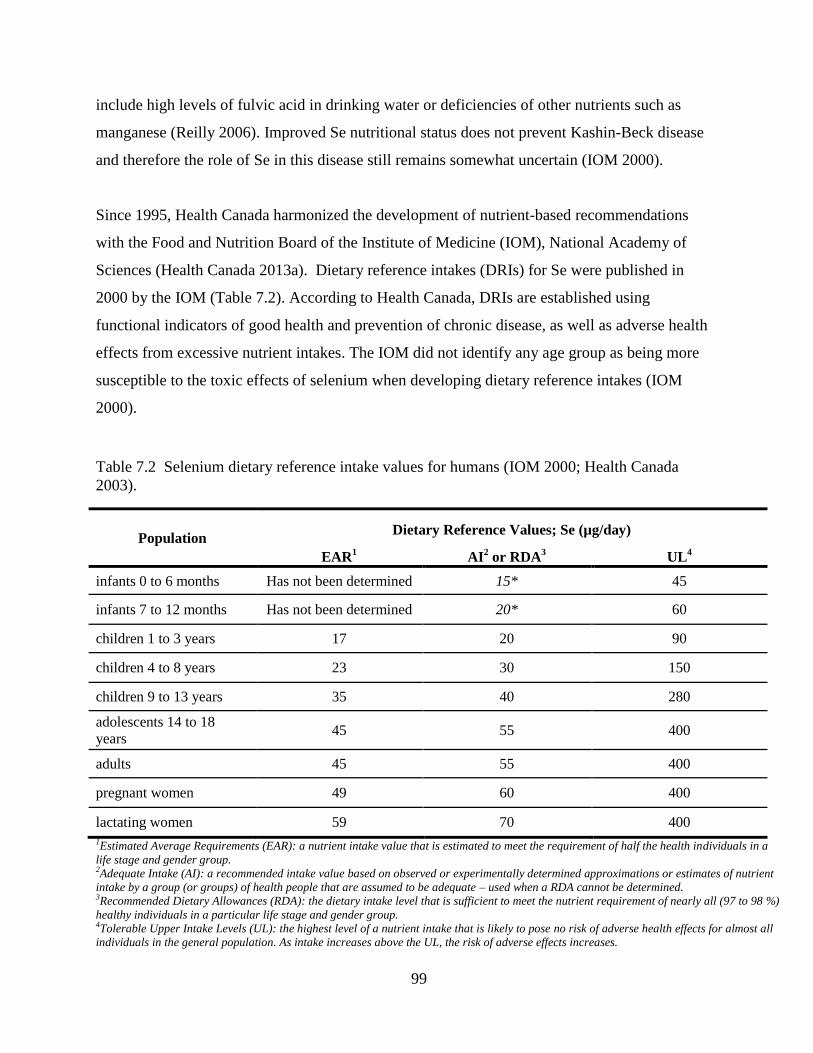
99
include high levels of fulvic acid in drinking water or deficiencies of other nutrients such as
manganese (Reilly 2006). Improved Se nutritional status does not prevent Kashin-Beck disease
and therefore the role of Se in this disease still remains somewhat uncertain (IOM 2000).
Since 1995, Health Canada harmonized the development of nutrient-based recommendations
with the Food and Nutrition Board of the Institute of Medicine (IOM), National Academy of
Sciences (Health Canada 2013a). Dietary reference intakes (DRIs) for Se were published in
2000 by the IOM (Table 7.2). According to Health Canada, DRIs are established using
functional indicators of good health and prevention of chronic disease, as well as adverse health
effects from excessive nutrient intakes. The IOM did not identify any age group as being more
susceptible to the toxic effects of selenium when developing dietary reference intakes (IOM
2000).
Table 7.2 Selenium dietary reference intake values for humans (IOM 2000; Health Canada
2003).
Population Dietary Reference Values; Se (µg/day)
EAR1 AI
2 or RDA
3 UL4
infants 0 to 6 months Has not been determined 15* 45
infants 7 to 12 months Has not been determined 20* 60
children 1 to 3 years 17 20 90
children 4 to 8 years 23 30 150
children 9 to 13 years 35 40 280
adolescents 14 to 18
years 45 55 400
adults 45 55 400
pregnant women 49 60 400
lactating women 59 70 400
1Estimated Average Requirements (EAR): a nutrient intake value that is estimated to meet the requirement of half the health individuals in a
life stage and gender group. 2Adequate Intake (AI): a recommended intake value based on observed or experimentally determined approximations or estimates of nutrient
intake by a group (or groups) of health people that are assumed to be adequate – used when a RDA cannot be determined. 3Recommended Dietary Allowances (RDA): the dietary intake level that is sufficient to meet the nutrient requirement of nearly all (97 to 98 %)
healthy individuals in a particular life stage and gender group. 4Tolerable Upper Intake Levels (UL): the highest level of a nutrient intake that is likely to pose no risk of adverse health effects for almost all
individuals in the general population. As intake increases above the UL, the risk of adverse effects increases.

100
7.1.4 Human Toxicity and Toxicological Reference Values
Ingestion of elemental and organic Se compounds is not known to cause acute toxicity (Calello
2010). Acute toxicity can occur following ingestion of inorganic forms: sodium selenite, sodium
selenate, selenium dioxide, hydrogen selenide, selenic acid, and selenous acid (Calello 2010).
Observations of acute oral toxicity (several 1,000 times the recommended dietary allowance) can
induce vomiting, diarrhoea, nausea, and occasionally, cardiovascular issues in humans and
laboratory animals (ATSDR 2003). For example, an accidental death occurred in Australia when
a 75-year-old man consumed 10 g of sodium selenite (See et al. 2006). Three and half hours
following ingestion, symptoms were abdominal pain, poor perfusion, and hypertension. The man
died six hours after ingesting the sodium selenite of cardiac arrest. Experiments using laboratory
animals indicate that sodium selenite is the most acutely toxic Se compound: oral LD50 for
sodium selenite (mg/ Se kg body weight) reported as 4.8 – 7 (rats), 1.0 (rabbits), 3.2 (mice), 2.3
(guinea pigs) (ATSDR 2003).
Information about chronic Se intoxication effects in humans following oral ingestion is derived
primarily from observations of selenosis in the Hubei Province of China (Brozmanová et al.
2010; ATSDR 2003). Daily dietary Se intake was estimated to range from 3,200 to 6,690 µg
(Yang et al. 1983). Symptoms observed in individuals exposed to chronically high levels of
dietary Se include loss of hair and nails, skin lesions, tooth decay, and abnormalities of the
nervous system (ATSDR 2003). Unusually high levels of Se were measured in locally grown
foods (e.g., vegetables and cereals) and drinking water (although few samples were collected,
concentrations ranged from 117 – 159 µg/L from surface supplies). Based on studies from this
region, Yang and Zhou (1994) determined that the onset of selenosis occurs at or above
consumption of 910 µg Se per day; a NOAEL of 800 µg Se/day was derived. In developing
dietary reference intakes, the Institute of Medicine (IOM) applied an uncertainty factor of 2 to
Yang and Zhou’s (1994) NOAEL, resulting in a tolerable upper intake level of 400 µg/day. The
IOM (2000) considers this protective of sensitive individuals based on the toxic effects being not
severe but also not necessarily reversible.
In 1991, EPA’s Integrated Risk Information System (IRIS) developed an oral reference dose
(RfD) of 5x10⁻³
mg/kg-day for selenium based on NOAEL for selenosis reported by Yang et al.
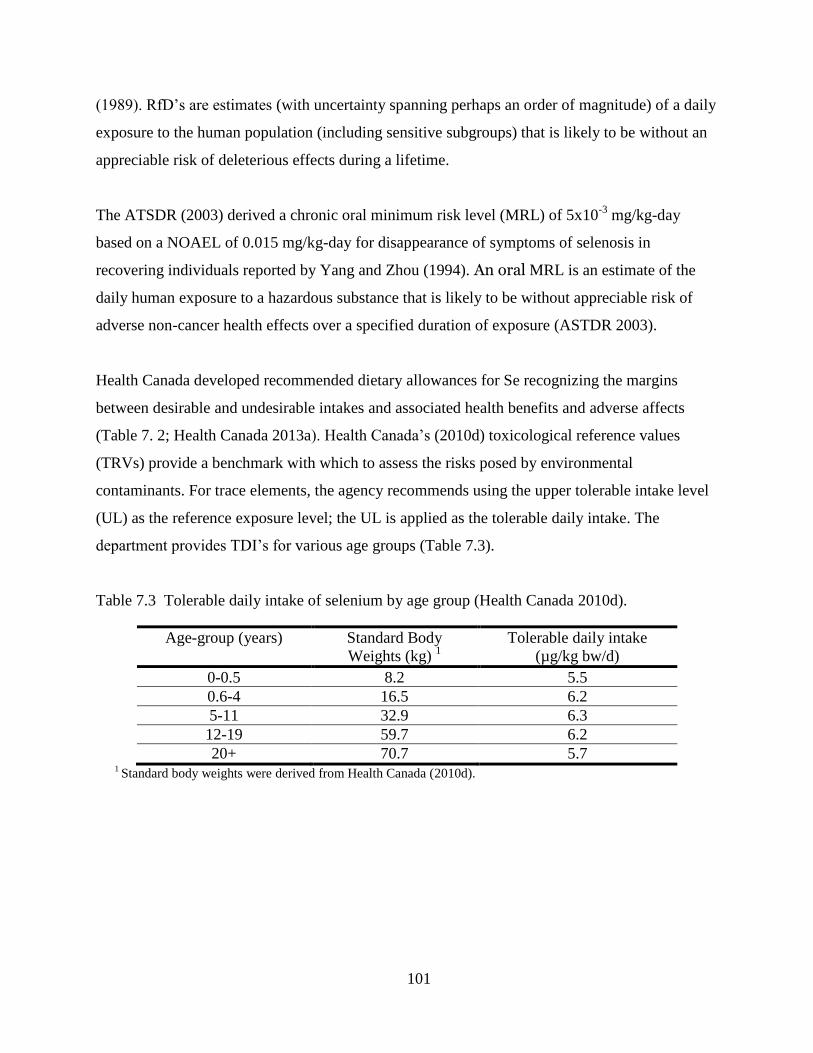
101
(1989). RfD’s are estimates (with uncertainty spanning perhaps an order of magnitude) of a daily
exposure to the human population (including sensitive subgroups) that is likely to be without an
appreciable risk of deleterious effects during a lifetime.
The ATSDR (2003) derived a chronic oral minimum risk level (MRL) of 5x10⁻³
mg/kg-day
based on a NOAEL of 0.015 mg/kg-day for disappearance of symptoms of selenosis in
recovering individuals reported by Yang and Zhou (1994). An oral MRL is an estimate of the
daily human exposure to a hazardous substance that is likely to be without appreciable risk of
adverse non-cancer health effects over a specified duration of exposure (ASTDR 2003).
Health Canada developed recommended dietary allowances for Se recognizing the margins
between desirable and undesirable intakes and associated health benefits and adverse affects
(Table 7. 2; Health Canada 2013a). Health Canada’s (2010d) toxicological reference values
(TRVs) provide a benchmark with which to assess the risks posed by environmental
contaminants. For trace elements, the agency recommends using the upper tolerable intake level
(UL) as the reference exposure level; the UL is applied as the tolerable daily intake. The
department provides TDI’s for various age groups (Table 7.3).
Table 7.3 Tolerable daily intake of selenium by age group (Health Canada 2010d).
Age-group (years) Standard Body
Weights (kg) 1
Tolerable daily intake (µg/kg bw/d)
0-0.5 8.2 5.5 0.6-4 16.5 6.2 5-11 32.9 6.3 12-19 59.7 6.2 20+ 70.7 5.7
1 Standard body weights were derived from Health Canada (2010d).

102
7.2 Toxicity in Aquatic Organisms
7.2.1 Mode of Action of Selenium
The importance of Se in the healthy functioning of organisms is based on the physiological
association and involvement of selenoproteins. Selenium is incorporated as selenocysteine in a
range of physiologically important selenoproteins which are required by all living organisms
with the exception of higher plants and yeasts (ATSDR 2003). In mammals, there could be as
many as 100 selenoproteins, 30 of which have been characterized and 15 of which have known
biological function (Brown and Arthur 2001). Some of the first selenoproteins to be identified
were a major class of glutathione peroxidase enzymes which act as antioxidants in cell cytosol,
cell membranes, blood plasma, and the gastrointestinal tract, protecting cells from lysis or
damage due to lipid peroxidation (the breakdown of cell membrane lipids by free radicals)
(Brown and Arthur 2001; ATSDR 2003; Lemly 1998).
Selenium is an essential component of a major group of iodothyronine deiodinase enzymes
involved in mediating production of thyroid hormone triiodothyronine (T3) from its precursor
thyroxine (T4) (Brown and Arthur 2001). Thyroid hormones have a crucial role in cell function,
tissue development, and physiology; they are required for proper immune system function, have
a role in cell differentiation, and regulate the metabolic breakdown of protein, fat and
carbohydrates (Brown and Arthur 2001, ATSDR 2003; Janz et al. 2010). Another
selenocysteine-containing enzyme, thioredoxin reductase, catalyzes the reduction of thioredoxin
which controls intracellular redox reactions and regulates the proliferation of normal cells.
Thioredoxin reductase has also been associated with cancer cells when thioredoxin is in high
concentrations (Brown and Arthur 2001).
Other selenoproteins are involved in Se transporting and mediating synthesis of selenocysteine
(selenoprotein P), muscle metabolism (selenoprotein W), and the regulation of Se bioavailability
by converting dietary selenocysteine and selenomethionine into other functional selenoproteins
(ATSDR 2003; Janz et al. 2010; Brown and Arthur 2001).
An acute toxic response in aquatic organisms occurs at very high aqueous concentrations of Se,
in the range of 100 mg/L and over (see Section 7.4.1, and Table 7.4), with the dietary exposure

103
pathway in this case posing a much lower risk. Although the mechanism of acute toxicity is not
completely understood, it is believed that oxidative stress is involved as the cellular mechanism
in much the same way as chronic selenosis (Janz 2012). Chronic Se toxicity occurs at much
lower Se concentrations, primarily from dietary sources (see Section 7.4.3.4). There have been
three common theories on the mechanism for chronic Se toxicity published: 1) Se substitutes for
sulphur (S) in proteins; 2) the inhibition of Se methylation results in the accumulation of reduced
hydrogen selenide; and, 3) the theory which has gained acceptance as probably the fundamental
cellular mechanism of toxicity, is oxidative stress resulting from high Se concentrations
(Spallholz and Hoffman 2002; Miller et al. 2007; Janz et al. 2010).
The Se substitution theory is based on the knowledge that the proper functioning of proteins
relies on a helical protein structure created by the disulphide, or sulphur-to-sulphur (S-S),
linkages (Lemly 2002a). When Se is in surplus, sometimes not much over background, excess
dietary Se is substituted for S into proteins. These Se-substituted proteins contain triselenium
(Se-Se-Se) or selenotrisulphide (S-Se-S, also called 2-seleno-1,3-disulphide) linkages which,
when translated during protein synthesis and incorporated into proteins, prevent the S-S bonds
from forming thereby altering the structure of the proteins (Lemly 2002a). It is thought that the
flawed proteins which are transferred maternally into eggs cause teratogenesis in the developing
embryo leading to a variety of characteristic lethal and sublethal deformities (Lemly 2002a).
These malformed proteins may also be responsible for pathological changes in the organs and
tissues of juvenile and adult fish (Sorensen 1991; Lemly 2002a).
Substitution of Se for S in proteins however, is not be the only toxic mechanism (Janz et al.
2010). Spallholz and Hoffman (2002) suggest Se toxicity, in particular hepatic toxicity, may
arise in organisms exposed to excess dietary selenocysteine. This leads to the inhibition of Se
methylation (Se-detoxification process) of both organic and inorganic Se compounds and the
subsequent accumulation of hydrogen selenides, an intermediate metabolite of the Se
methylation process (Spallholz and Hoffman 2002). Inhibition of Se methylation leads to an
excess of hydrogen selenides, a known contributor to hepatotoxicity (Nakamuro et al. 2000).

104
Finally, the third theory suggests tissue damage is related to oxidative stress, which occurs when
bio-reactive superoxides are produced in response to high Se concentrations (Lemly 2002a). This
mechanism is now being proposed as possibly the initiating step in embryo mortalities and
deformities in fish and birds (Spallholz and Hoffman 2002; Hoffman 2002; Palace et al. 2004;
Miller et al. 2007; Janz et al. 2010; Janz 2012). The one common interaction that occurs in
organisms during metal toxicity is the reaction between Se and thiols (sulphur containing organic
compounds, R-SH), resulting in the formation of reactive oxygen species called superoxides
(Spallholz and Hoffman 2002). Glutathione is a thiol with antioxidant properties which easily
combines with some forms of Se, resulting in the production of free radicals that bind with and
inhibit the normal function of cellular enzymes and proteins (Spallholz and Hoffman 2002;
Palace et al. 2004). Glutathione peroxidase is a Se-containing enzyme responsible for reducing
lipid hydroperoxides to their corresponding alcohols and reducing free hydrogen peroxide to
water (Janz et al. 2010). Glutathione peroxidase however, is involved in both the removal of
reactive oxygen species and their production, depending on the amount and chemical form of Se
an organism is exposed to (Spallholz and Hoffman 2002). Selenium toxicity occurs when
oxidative damage from reactive oxygen species exceeds the organism’s antioxidant defence
mechanisms (Spallholz 1994). More research is needed to determine the importance of oxidative
stress as a mode of toxic action for Se in both teratogenic and other effects such as
histopathological changes (lesions) and immune system dysfunction in juvenile and adult
organisms (Palace et al. 2004; Janz et al. 2010).
7.2.2 Teratogenicity
Selenium can elicit reproductive effects in the form of teratogenic deformity, a more visually
obvious biomarker of Se toxicity restricted to the embryo/larval life stages which can lead to
reproductive impairment or failure in fish and birds (Lemly 1997b; Palace et al. 2004; Hamilton
2004). Evaluating the teratogenic effects resulting from the maternal transfer of Se to the
offspring of fish and birds is a commonly researched reproductive toxic end point (DeForest
2008). For example, studies on resident rainbow trout conducted by Holm et al (2005) in Alberta
documented teratogenic effects in fish captured below coal mining areas where water column Se
concentrations were between 1 and 32 µg/L. The egg Se concentrations associated with a 15%

105
increase in skeletal deformities above reference sites, were between 22.6 and 27 µg/g31
(Holm et
al. 2005). Based on their results, Holm et al. (2005) recommended against calls for higher Se
criteria for cold-water fish compared to warm-water species (Kennedy et al. 2000; Chapman
2007).
Selenium exposure can cause deformities in juvenile fish which have not been previously
exposed through maternally transferred Se. A study by Teh et al. (2004) demonstrated that non-
reproductive deformity in juvenile fish could occur, leading the authors to speculate whether the
mechanism of the observed effects were related to excessive lipid peroxidation (Teh et al. 2004).
Regardless, this strongly suggests Se exposure can result in teratogenic effects through
reproductive and non-reproductive pathways. There is more discussion on this in Section 8.
The significance of teratogenic effects (embryonic deformity) in fish has been demonstrated in
reproductive studies showing that few of the deformed individuals survive past the larval or
juvenile stages (Gillespie and Baumann 1986; Hermanutz et al. 1992; Lemly 1993a). Hermanutz
et al. (1992) found that larval fish with lordosis and haemorrhaging failed to survive more than
one day, and edematous larvae surviving five days post-hatch failed to absorb their yolk sac and
died before reaching swim-up stage. Other studies on fish embryo and larvae have also found
that the presence of deformities in individuals resulted in significant increases in overall
mortalities (Hamilton et al. 2005). Minnow and Paine, Ledge and Associates (2006) studied
dwarf longnose sucker in coal mine-affected lentic waters in the Elk Valley BC. While no
significant correlation was found between egg Se and larval mortality or deformity, correlation
analysis suggested that larvae in groups that had high mortality tended to have more severe
deformities, while survivors with lower mortality were associated with more mild or moderate
deformities. Buhl and Hamilton (2000) found that Colorado pikeminnow (Ptychocheilus lucius)
embryos with deformities may be more sensitive than normal embryos to fungal infection
resulting in increased mortality in these individuals. The possible secondary effects of Se toxicity
(deformity causing higher mortality through increased predation or higher incidence of fungal
infection) requires further research.
31
Converted wet weight to dry weight using 61% moisture content consistent with Holm et al. (2005).

106
In fish, both Se-related deformity and reproductive failure may eventually alter the population
structure through an absence of year classes (particularly young-of-year) and increases in the
average age of the population (May et al. 2001). These population-level consequences are also
dependent on many factors such as species fecundity, survival, reproductive life-span and
immigration/emigration of species (May et al. 2001).
In birds, teratogenic effects are usually associated with low survival of hatchlings (Ohlendorf
2003). Direct and indirect mortality may lead to reduced recruitment, population declines and the
eventual disappearance of species (Lemly 2002a; Ohlendorf 2003).
7.3 Factors Affecting Selenium Toxicity in the Aquatic Environment
There are many factors that influence the bioaccumulation of Se (see Section 6.2) and since
many of these also control an organism’s exposure, they can affect the toxic response to Se (Janz
et al. 2010). Factors controlling physical and dietary Se exposure, such as mobility of the species
feeding within or outside of Se contaminated areas, can result in a high degree of variability in
Se exposure and, hence, the resultant ranges in Se concentrations in diagnostic tissues (Holm et
al. 2003; Fairbrother et al. 1999). However, while mobility of an organism may complicate
evaluation of Se exposure, it does not necessarily alter the relationship between Se accumulation
and effects. The mobility of organisms has implications in evaluating site-specific exposure for
some species, leaving uncertainty in environmental risk assessments.
Surface waters, particularly those that receive contaminants, contain a mixture of chemical
constituents which can bind with Se, potentially attenuate or magnify toxic responses, or have no
effect on Se toxicity depending on the substance (Eisler 1985). Constituents that may reduce Se
toxicity include arsenic, antimony, bismuth, cadmium, copper, lead, germanium, mercury, silver,
thallium, tungsten and zinc (Hamilton 2004; Janz et al. 2010; Heinz 1996). However,
interactions between Se and other compounds are often unclear and inconsistent (see Section
6.2). For example, mercury accumulation has been shown to be blocked by excess Se. In bird
studies, it has also been shown that the combination of Se with mercury may have an
antagonistic toxic effect (Hamilton 2004). Heinz and Hoffman (1998) found that dietary Se had a
protective effect against methylmercury poisoning in adult mallards, but in contrast combined Se

107
and mercury diets had a synergistic effect demonstrated as reduced reproductive success and
increased deformity in embryos.
Lohner et al. (2001a) hypothesized that an apparent lack of expected toxicity of Se to fish was
due to the presence metals like arsenic, chromium, copper and nickel, which potentially formed
complexes that interfered with Se accumulation and toxicity. Other elements such as antimony,
bismuth, cyanide, germanium, silver and tungsten, have been shown to reduce the accumulation
and/or toxicity of Se (Marier and Jaworski 1983; Hamilton 2004). Selenium has also been
reported to decrease the toxicity of elements such as cadmium and thallium (Marier and Jaworski
1983). Some other elements such as chromium, cobalt, fluorine, molybdenum, nickel, tellurium,
uranium, vanadium and zinc, may have little or no effect on Se toxicity (Marier and Jaworski
1983; Hamilton 2004).
Selenium is also thought to be erroneously taken up into cells via the sulphate uptake
mechanisms, due to the similarity of selenate and sulphate (Ogle and Knight 1996). In the
presence of elevated sulphate concentrations, the bioaccumulation and toxicity of selenate can be
ameliorated (Ogle and Knight 1996; Hansen et al. 1993). However, the relationship between the
reduction of Se bioaccumulation and toxicity in the presence of sulphate is not consistent (Besser
et al. 1989; see the discussion on sulphate and selenate in Section 6.2.3).
Many other factors can influence Se toxicity including temperature, the chemical form of Se,
exposure duration, nutritional status of the organism, differences in the sensitivity of species and
life stages, differences between freshwater and marine environments, and other environmental
stresses ( Lemly and Smith 1987; Hamilton 2004). Organic forms of dietary Se, particularly
selenomethionine, are more toxic to organisms than inorganic forms (Heinz et al. 1987; Kiffney
and Knight 1990; Ingersoll et al. 1990; Maier and Knight 1993). Kiffney and Knight (1990)
found that sublethal effects (reduced chlorophyll a production) in cyanobacteria occurred at
exposure concentrations of 100 µg/L seleno-L-methionine, but for both selenite and selenate
exposures, those effects were not apparent until concentrations reached 3,000 µg/L.

108
Differences in toxicity observed in studies may not always be easily explained. Hamilton et al.
(1990) conducted partial life cycle laboratory feeding studies on Chinook salmon (Oncorhynchus
tshawytscha) to compare the effects of naturally incorporated forms of Se in diet with that of fish
meal spiked with selenomethionine. The naturally Se-enriched diet resulted in a greater effect
(reduced growth) in juvenile fish at both lower concentrations and over a shorter time period,
than did a diet of Se-fortified fish meal. The authors offered three possible explanations for the
increased toxicity in the diet with environmentally incorporated Se: 1) the diet may have
contained other environmental contaminants (i.e., boron, chromium, and strontium); 2) other
forms of Se (e.g., selenocysteine) may have been present in the diet of natural incorporated Se;
and, 3) there could have been differential uptake, distribution or elimination of Se in fish fed the
naturally incorporated Se diet (Hamilton et al. 1990).
7.4 Toxicity of Selenium to Aquatic Organisms
The most obvious effects of Se toxicity to aquatic biota are on reproduction which may be
manifested as reduced survival and increased deformity in developing embryos (Lemly 1998). In
general, the threshold for adverse effects in vertebrate animals may begin at Se concentrations
less than an order of magnitude above normal background ambient concentrations (Eisler 1985;
USDOI 1998; Ohlendorf 2003). Other estimates put that margin even smaller at only 2 to 5 times
that of normal background (Maier and Knight 1994).
Aquatic species not only have species-specific sensitivity to Se, but may also have different
chronic effect thresholds for non-reproductive and reproductive toxicological endpoints due to
differences in exposure routes, exposure durations, forms of Se they are exposed to and modes of
toxicity for these effects (Hamilton 2004; Janz et al. 2010). In studies that evaluate several
reproductive endpoints (e.g., hatchability, deformity, and larval survival), hatchability has been
shown to be a more sensitive reproductive endpoint than larval deformity in birds (Ohlendorf
2003) and fish (Crane et al. 1992; NewFields 2009; Nautilus Environmental and Interior
Reforestation Co. Ltd. 2011). For example, hatching success was a more sensitive toxicological
end point than larval development and survival in a study on perch, grass carp, and stickleback
(Crane et al. 1992). NewFields (2009) conducted studies on brown trout (Salmo trutta) and
determined EC10 for post-hatch survival was 17.68 (95% CI, 13.44 – 23.25) µg/g egg Se, while
109
the EC10 for deformity was 19.33 (95% CI, 15.07 – 24.79) µg/g egg Se. Similarly, in a study on
westslope cutthroat trout, hatchability (larval survival) was the more sensitive toxicity endpoint
(Nautilus Environmental and Interior Reforestation Co. Ltd. 2011). However, deformity was the
more sensitive endpoint than survival (hatchability) in studies by Holm et al. (2005) and
McDonald et al. (2010). More research is needed to understand the relative sensitivity of Se in
fish and wildlife species, as well as reproductive versus non-reproductive toxicological endpoints
(Hamilton 2004; Janz et al. 2010).
7.4.1 Short-Term (Acute) Toxicity
Short-term Se exposure resulting in acute mortality typically occurs at much higher aqueous
concentrations than chronic effects and results primarily from waterborne Se not dietary sources
(Luoma and Presser 2009; Janz 2012). However, responses to short-term exposure of very high
water Se concentrations will vary by species. In addition to species sensitivity, the form of Se,
duration of exposure and endpoint being measured are factors that could influence final acute
values.
Aquatic invertebrates are, for the most part, thought to be tolerant to aqueous Se, at least at
concentrations that might result in dietary Se toxicity to fish and birds (deBruyn and Chapman
2007; Janz et al. 2010). Yet, some freshwater invertebrates are among the most sensitive and the
most tolerant to acute concentrations of Se (USEPA 1987). Some acute toxicity thresholds for
invertebrates are presented in Table 7.4. Water-only acute toxicity thresholds (96 hour LC50s for
mortality) for selenite range from 210 µg/L for Daphnia magna (Adams and Heidolph 1985, as
cited by USEPA 2004) to 203,000 µg/L for the leech Nephelopsis obscura (Brooke et al. 1985,
as cited by USEPA 1987, 2004). Pieterek and Pietrock (2012) found differences between
sensitivity in lab-reared versus field-collected H. azteca, to selenate, with the lab-reared
individuals being approximately an order of magnitude more sensitive. In both groups however,
mean survival times decreased as the exposure period increased to 10 days.
Bringmann and Kuhn (1977, as cited by USEPA 1987, 2004) reported a 24 hr EC50 of 9.9 µg/L
selenite for immobilization of D. magna, indicating these invertebrates may indeed be much
more sensitive to waterborne Se concentrations than other invertebrates. LeBlanc (1980) found

110
that D. magna had a 24-hour LC50 of 660 µg/L which was a slightly higher value compared to a
48-hour LC50 of 430 µg/L (the form of the Se was not reported by LeBlanc (1980) but is listed
as selenous acid in USEPA (2004) Table 1a).
Some marine invertebrate species may have a higher tolerance to Se. Martin et al. (1981)
exposed embryonic Pacific oyster (Crassostrea gigas), blue mussel (Mytilus edulis), and
Dungeness crab (Cancer magister) to Se dioxide (selenous acid), and reported all species had 96
hour LC50 values greater than 10,000 µg/L. On the other hand, juvenile bay scallop (Aropecten
irradians) exposed to selenite had a short-term LC50 concentration of 255 µg/L based on static
96 hour laboratory tests (Nelson et al. 1988).
For fish species, short-term toxicity thresholds (Table 7.4) typically occur at much higher Se
concentrations than those for chronic exposures. The US EPA (2004) reported that genus mean
acute values (GMAV) for freshwater fish species exposed to aqueous selenite ranged from 1,783
µg/L for striped bass (Morone saxatilis), to 28,500 µg/L for bluegill sunfish (Table 7.5).
However, there are reports of relatively low short-term Se thresholds. For example, larval
haddock (Melanogrammus aeglefinus) exposed to selenous acid for 96 hours had a LC50
concentration of 600 µg/L (Cardin 1986, as cited by USEPA 1987). Cardin (1986, as cited by
USEPA 2004) reported a LC50 for the more tolerant larval winter flounder (Pseudopleuronectes
americanus) of 14,649 µg/L in water-only acute exposures of selenous acid.
Selenium toxicity thresholds for rainbow trout range from approximately 4,500 to 9,000 µg/L
(Adams 1976, as cited by USEPA 2004; Buhl and Hamilton 1991). Short-term thresholds for
coho salmon (Oncorhynchus kisutch) and Chinook salmon are reported to be 7,830 µg/L and
8,000 µg/L respectively (Hamilton and Buhl 1990; Buhl and Hamilton 1991).

111
Table 7.4 Examples of short-term (acute) toxicological thresholds reported for some invertebrate
species to water-only exposures of selenium.
Species Toxicological
Endpoint Se concentration in µg/L
(form of Se) Reference
1
Hyallela azteca
(amphipod) LC50 (96 hr mortality) 340 (selenite) Halter et al. (1980) cited
in USEPA (2004)
Hyallela azteca
(amphipod)
LC50 (95% CI)
(10-day, mortality)
(strictly speaking not an
acute test)
86 (55 – 180), (lab-reared)
574 ( 408 – 820), (field-
collected),
(selenate)
Pieterek and Pietrock
(2012)
Cerodaphnia
dubia
(cladoceran)
LC50 (< 24 hr) 440 (selenite) USEPA (2004)
Nephelopsis
obscura
(leech)
LC50 203,000 (selenite) Brooke et al. (1985)
cited in USEPA (2004)
Daphnia magna
(cladoceran) LC50 (mortality) 210 (selenite) Adams and Heidolph
(1985) cited in USEPA
2004
Daphnia magna
(cladoceran) LC50 (24 hr, mortality) LC50 (48 hr, mortality)
660 (selenous acid) 430 (selenous acid)
LeBlanc (1980)
Daphnia magna
(cladoceran) EC50 (24 hr
immobilization) 9.9 (selenite) Bringmann and Kuhn
(1977) cited in USEPA
(2004)
Mytilus edulis
(blue mussel) Crassostrea gigas
(Pacific oyster) Cancer magister
(Dungeness crab)
LC50 (96 hr) (marine species,
embryonic/larval)
> 10,000 (selenium
dioxide/selenous acid)
Martin et al. (1981)
Aequipecten
irradians
(Atlantic bay
scallop)
LC50 (96 hr) 255 (selenite)
Nelson et al. (1988)
1It should be noted that literature included in Table 7.4 was not classified since there are no short-term guidelines
being proposed for Se. These data provide examples of the range of toxicity threshold reported in the literature.

112
Table 7.5 Examples of short-term toxicity thresholds for mortality in fish species in water-only
exposures of selenium.
Species Toxicological
Endpoint Se concentration in µg/L
(form of Se) Reference
1
Oncorhynchus
mykiss (rainbow trout,
juvenile)
LC50 (96 hr) 4,500 – 9,000
(selenate) Adams (1987) cited in
USEPA (2004); Buhl
and Hamilton (1991)
Oncorhynchus
Tshawytscha
(Chinook, fry)
LC50 (96 hr) 3,578 – 13,600
(selenite) Hamilton and Buhl
(1990)
Oncorhynchus
kisutch
(coho, fry)
LC50 (96 hr) 8,150 – 23,400
(selenite) Hamilton and Buhl
(1990)
Lepomis
macrochirus (bluegill sunfish)
LC50 (96 hr) 28,500 Cardin (1986) cited in
USEPA (2004)
Melanogrammus
aeglefinus
(haddock)
LC50 (96 hr), larval 600 (selenite) USEPA (2004)
Morone saxatilis
(striped bass) LC50 (96 hr) 1,783 (selenite) USEPA (2004)
Polyprion
americanus
(stone bass)
LC50 (96 hr) 14,649 USEPA (2004)
1Please note that literature included in Table 7.5 was not classified since there are no short-term guidelines being
proposed for Se. These data provide examples of the range of acute toxicity threshold reported in the literature.
The US EPA (2004) acute criterion for aquatic organisms for selenite is 258 µg/L and for
selenate (sulphate-adjusted) is 410 µg/L where sulphate is 100 mg/L. When environmental
concentrations of Se reach potentially acutely toxic concentrations, which might occur below
major industrial discharges, swift action must be taken by environmental managers to mitigate
and remediate the effects.
7.4.2 Chronic Toxicity
Since ambient Se concentrations rarely reach levels that result in acute effects, the more common
situation resulting in Se toxicity occurs at much lower chronic exposures (Sorenson 1991; Maier
and Knight 1994; Lemly 1998). Environmental guidelines focus on chronic exposure
concentrations to protect against sublethal effects.
113
7.4.2.1 Microorganisms and Invertebrates
It is generally thought that bacteria, fungi, algae, and invertebrates are fairly tolerant to elevated
Se concentrations, and the more important role these organisms play is in the rapid
transformation and transfer of Se into the aquatic food web (Janz et al. 2010). However, these
organisms should not be thought of as simple conduits for Se bioaccumulation, insensitive to Se
toxicity. There is a high degree of variability in the toxic effects on algae and invertebrate taxa
based on water Se concentrations, suggesting that Se uptake is very different among species at a
given water concentration. In fact, microorganisms may also have differing nutritional
requirements for Se. Doblin et al. (1999) conducted lab experiments on three estuarine
phytoplankton species (Gymnodinium catenatum, Alexandrium minutum (Dinophyta) and
Chaetoceros cf. tenuissimus (Bacillariophyta)) which commonly bloom in southern Australian
waters. Phytoplankton were cultured in Se-deficient mediums to determine the requirements for
Se based on growth rate and biomass yield. The authors found that the dinoflagellates G.
catenatum and A. minutum had obligate and intermediate Se requirements, respectively, while
the diatom C. tenuissimus showed no changes in growth or biomass after eight weeks in Se-
deficient media.
Chronic toxicity thresholds for green algae species exposure to sodium selenite for greater than
four days, ranged between 522 and 70,000 µg/L (USEPA 2004). However, Vocke et al. (1980)
exposed four species of freshwater algae to sodium selenate and reported the 14-day EC50s for
reduced growth were from 33 µg/L for Ankistrodemus falcatus, to 277 and 284 µg/L for
Selenastrum capricornutum and Scenedesmus obliquus, respectively, and 8,511 µg/L for
Microcoleus vaginatus, demonstrating the broad range in sensitivities of algae to Se (Vocke et al.
1980).
deBruyn and Chapman (2007) found that Se body burden concentrations in invertebrates
resulting in sublethal toxic effects showed a relatively narrow range; 1 to 30 µg/g Se.
Chironomus was shown to be among the most sensitive invertebrate taxon, when considered on a
body burden basis (deBruyn and Chapman 2007, based on data in Ingersoll et al. 1990 and Maier
and Knight 1993). Some invertebrate species may be at risk when Se is in the lower range of
concentrations (3 to 11 µg/g Se) thought to elicit sublethal effects on fish and birds predators

114
(deBruyn and Chapman 2007). By extrapolation, using a BAF of 1,000, deBruyn and Chapman
(2007) estimated the range of water Se concentrations associated with sublethal effects were
between 1 to 30 µg/L. These findings are important in the context of setting protective water
quality guidelines.
There is evidence suggesting lethal and sublethal effects in some freshwater invertebrate species
occur at Se concentrations below the acute and chronic LC50s reported in the literature. For
example, Malchow et al. (1995) found that midge larvae fed a diet of ≥ 2.11 µg/g (seleniferous
algae) showed significantly reduced growth at body burdens of ≥ 2.55 µg/g after only 96 hours
of exposure. Anastasia et al. (1998) found that the early survival of fiddler crab larvae (Uca
pagnax) may be reduced at body burden concentrations ranging from 2.4 to 268.5 µg/g.
Some researchers have found significant decreases in algal species diversity and benthic
invertebrate diversity and abundance in streams below open-pit coal mining, related to increases
in Se, nitrate, and sulphate. Hauer and Sexton (2010) observed decreased algal diversity and
abundance at sites with the highest mean values of Se (10 µg/L), nitrate (2,000 µg/L), and
sulphate (400 µg/L). Frenette (2008) conducted an invertebrate study below coal mining areas
using a multimetric approach and demonstrated subtle changes in community structure, namely
the loss of sensitive Ephemeroptera taxa and reduced number of EPT (total number of
Ephemeroptera, Plecoptera and Trichoptera).
It should be noted that some field studies often do not distinguish between the effects of Se and
the possible effects of another contaminant or the mixture of contaminants present. In studies
using stream mesocosms, Swift (2002) found that density of isopods and tubificid worms was
significantly decreased by exposure to both medium (10 µg/L) and high (30 µg/L) aqueous Se
treatments but density was unaffected at 2.5 µg/L. More recently, Pond et al. (2008) found
negative impacts to benthic invertebrate communities below coal mining activities in West
Virginia, where several metrics such as Ephemeroptera generic richness, family richness, and the
total number of Ephemeroptera and Plecoptera were strongly negatively correlated with Se and
other water quality parameters.

115
Not all invertebrates are susceptible to chronic low Se levels. For example, Brix et al. (2004)
found that brine shrimp (Artemia franiciscana) had a NOEC and LOEC for Se of 3,000 µg/L and
8,000 µg/L, respectively, for both 11-day growth and 21-day reproduction endpoints. Brasher
and Ogle (1993) found that H. azteca had 10-day LC50s to both selenite and selenate that were
lower, 502 and 1135 µg/L, respectively.
7.4.2.2 Vertebrates
Oviparous (egg-laying) vertebrates are among the most sensitive organisms to Se toxicity (US
DOI 1998; Palace et al. 2004; Janz et al. 2010). Of those, fish and bird species have the highest
sensitivities to both Se-related embryo mortality and developmental deformity, although
amphibians and reptiles may also be sensitive to Se (Janz et al. 2010).
7.4.2.3 Fish
Reproductive and non-reproductive toxic effects may be seen in fish from chronic Se exposure;
(Lemly 2008; Janz et al. 2010). Reproductive effects are those originating from the maternal
transfer of Se, while non-reproductive effects refer to the direct toxic impacts Se may have on
juveniles and adults (Lemly 2008). Both reproductive and non-reproductive effects result
primarily from the dietary intake of Se (DeForest and Adams 2011). There is also evidence that
waterborne Se can elicit non-reproductive effects albeit at higher aqueous concentrations (Hunn
et al. 1987; Cleveland et al. 1993; Hamilton 2004; Miller et al. 2007).
Chronic effects via multiple exposure routes can simultanously occur and be expressed at the
molecular, biochemical, and cellular level right up to individual and population levels (Sorenson
1991; Lemly 1998; Lemly 2002a; Janz et al. 2010). Sublethal effects may occur at low Se
concentrations, for example reduction in calcium concentrations in the vertebrae of rainbow trout
fry, eye cataracts, and changes in gill and organ histopathology and blood characteristics
(Hodson et al. 1980; Hilton and Hodson 1983; Hicks et al. 1984; Sorenson et al. 1984; Sorenson
1991). Other reported effects on early life stage and juvenile fish from chronic Se exposure at
relatively low water (3–8 µg/L) and whole-body Se concentrations (1–15 µg/g), include reduced
condition factor, growth and survival (Sorenson 1991; Lemly 2002a; Hamilton 2003).

116
Lemly (2002a; 1997a) documented chronic effects on fish populations from Belews Lake, North
Carolina, between 1975 and 1986. These included:
swelling and inflammation of gill lamellae;
elevated lymphocytes;
reduced hematocrit and haemoglobin (anemia);
pathological alterations in livers kidneys, hearts, and ovaries (e.g. vacuolization of
parenchymal hepatocytes, intracapillary proliferative glomerulonephritis, severe
pericarditis and myocarditis, necrotic and ruptured mature egg follicles);
cataracts present on the cornea and lens;
reproductive disruption including lack of fertilization, lower hatchability, and higher
mortalities of eggs and alevins;
exopthalus (protruding eyes) caused by edema32
or fluid build-up within the eye socket;
abdominal edema caused by fluid in the visceral cavity or abdomen;
a range of teratogenic edema of the head; and,
skeletal deformities commonly seen in the head, jaw, mouth and fins, and spinal
deformities in the lumbar and caudal areas (kyphosis, lordosis and scoliosis).
While research has demonstrated the range of observed reproductive and non-reproductive
effects in fish may be very broad, the literature also suggests that chronic effects observed in the
early life and juvenile stages of fish are not consistent, likely as a result of differential rates of Se
accumulation and/or different species sensitivity (Hamilton 2003). The most sensitive life stage
to the toxic effects of contaminants is often the early life stage (Newman and Unger 2003). In
studies conducted on larval razorback suckers (Xyrauchen texanus) fed Se-laden zooplankton,
dietary exposures of 3 to 5 µg/g Se resulted in a fairly rapid increase in mortality (Hamilton et al.
2005). In a study on northern pike exposed to uranium mill effluent in lakes, significant increases
in developmental deformities were associated with the medium and high Se concentration sites
(approximately 0.7 and 2.7 µg/L, respectively) (Muscatello et al. 2006; 2008). However, there
were no apparent differences in time to eyed-embryo, hatchability and swim-up stages among all
32
Non-teratogenic edema versus that related to deformity is distinguished by excess fluid forming behind the eye
and in the abdomen as a result of excess Se which distorts selenoproteins in the cell membrane structure causing
damage to cell permeability making organs “leaky” (Lemly 2002).

117
Se treatments, suggesting that embryonic deformity was the more sensitive indicator of toxicity
in that fish species. Crane et al. (1992) found variable hatchability in perch (Perca fluviatilis),
grass carp (Ctenophryngodon idella) and stickleback (Gasterosteus aculeatus) eggs raised in
experimental ponds with Se concentrations up to 10 µg/L, but hatchability dropped to zero for all
species at 25 µg/L. In this experiment, hatchability was a more sensitive reproductive endpoint
than larval development, survival or teratogenic effects.
Although dietary Se is the primary route of exposure in fish, the water exposure route should not
be ignored. Research assessing toxic responses in fish from water-only exposures has shown that
early life stage and juvenile fish may be sensitive to Se when based on whole-body tissue
accumulation (Hodson et al. 1980; Hamilton and Wiedmeyer 1990; Cleveland et al. 1993). In a
study using water-only Se exposures Hodson et al. (1980) found a significant increase in eyed
egg mortality of rainbow trout at Se exposures at or above 26 µg/L, decreases in red blood cell
volume and serum iron concentrations at 53 and 16 µg/L, respectively, and a decrease in mean
time to hatch at Se concentrations greater than 4.4 µg/L (significant decrease in mean time to
hatch at 16.0 µg/L). At 44 weeks post-hatch, the mean whole-body tissue Se concentration
estimated for rainbow trout exposed to the highest water Se concentration (53 µg/L) was 1.7
µg/g compared with control (0.4 µg/L Se) fish which had whole-body Se concentrations of 0.64
µg/g Se.33
Hamilton and Wiedmeyer (1990) conducted studies on Chinook salmon using water-only
exposures of boron, molybdenum and Se. Boron and molybdenum body burdens in test fish were
less than analytical detection limits leading the authors to conclude that these elements were not
bioaccumulating and did not pose a significant risk of adverse effects. However, there was a
strong correlation between increased body burden of Se and increasing water Se, with significant
decreases in survival and growth in fish exposed to water concentrations of selenate and selenite
at 50 µg/L or greater, and 9.3 µg/L or greater, respectively. Resulting whole-body no-effect
concentrations in these studies were between 3 and 5 µg/g (Hamilton and Wiedmeyer 1990).
33
Converted wet weight to dry weight assuming 75% moisture content.
118
Cleveland et al. (1993) exposed juvenile bluegill sunfish to both water and dietary Se and found
that water-only exposures decreased swimming behaviour at 170 µg/L, and significantly
increased mortality at 680 µg/L Se (mostly as selenate).
Miller et al. (2007) exposed juvenile rainbow trout to a range of aqueous sodium selenite
concentrations, incorporating both 96-hour acute test concentrations (390 and 2,670 µg/L,
measured Se), and 30-day chronic test concentrations (50 and 160 µg/L, measured Se). Several
physiological stress indicators such as plasma cortisol, plasma glucose, plasma T3 and T4
hormones, were activated in both acute and chronic exposures suggesting oxidative stress is an
important mechanism in non-reproductive effects. Miller et al. (2009) conducted a study on
white suckers exposed to agricultural drain water in Lethbridge Alberta. At Se concentrations in
receiving waters of between 0.4 and 26.7 µg/L, plasma glucose concentrations were significantly
positively correlated with Se concentrations in muscle between 1.5 and 6.4 µg/g (p < 0.05).
Although white suckers did not exhibit the classic stress response (i.e., increased cortisol with
increasing Se), the results suggested that the fish were mobilizing energy reserves as Se
increased. These studies suggest waterborne Se as a component of contaminated effluents, is
important to overall exposure, particularly in streams that are in close proximity to industrial
discharges where fish reside.
Lohner et al. (2001a; 2001b; 2001c) conducted field studies on tolerant sunfish species in
streams receiving coal fly ash, finding that fish in exposed streams had significant differences in
some biochemical indicators and significant hematological changes, but without apparent
changes in fish health condition indices at even the highest Se concentrations (32 ± 13 µg/L).
Thomas and Janz (2011) investigated behavioural and physiological changes in adult zebrafish
(Danio rerio) fed a diet spiked with selenomethionine at 0 (control), 3.7, 9.6 and 26.6 µg/g over
90 days. They found that swimming performance was reduced significantly in all feeding groups,
but particularly in the highest feeding group which had an almost 50% reduction in performance
compared with control fish. Mean mortality was significantly greater in fish fed the highest Se
diet, and all fish fed Se spiked diets showed increased energy stores (measured as triglycerides
and glycogen), an indication that Se might interfere with normal energy homeostasis in fish.

119
These studies demonstrate that chronic non-reproductive effects of Se on adult and juvenile fish
can result from relatively low exposures of waterborne and dietary Se. Higher aqueous (and
dietary) Se exposure concentrations may be relevant in areas in close proximity to industrial
discharges where fish reside. While increased mortality responses are easily interpreted, the cost
of changes in behaviour and physiology to an individual’s health, and ultimately their success, is
not known but may have negative consequences from an energetics perspective (Thomas and
Janz 2011).
7.4.2.4 Birds
Many of the sublethal effects of Se in fish are similar to those found in birds (Lemly 1993a).
Non-reproductive chronic effects in birds from Se exposure include reduced immune function,
excess feather loss, liver lesions and necrosis, muscle atrophy and weight loss (Ohlendorf et al.
1988; Fairbrother and Fowles 1990; Ohlendorf and Heinz 2011).
The more sensitive chronic effects in birds are related to reproductive impairment. Reproductive
impairment is a general term including decreased fertility, reduced egg hatchability (embryo
mortality) and increased incidence of deformity in embryos including eyes, feet, legs, beak and
skull (Ohlendorf and Heinz 2011). Studies on birds show that thresholds for reduced hatchability
are usually below those for teratogenic effects (Ohlendorf 2003). Egg fertility in some bird
species, such as American kestrel (Falco sparverius), is considered a more sensitive
toxicological endpoint often not reported but distinct from embryotoxicity (Ohlendorf and Heinz
2011).
Egg Se concentration is the most sensitive and reliable measurement of avian Se exposure, with
thresholds for reproductive impairment estimated to be between 3 and 8 µg/g, depending on the
species and form of Se in the diet (Heinz 1996; Ohlendorf and Heinz 2011). It is thought that
aquatic birds are more susceptible to Se toxicity than terrestrial birds species based on the lack of
reproductive effects seen in meadow larks (Sturnella neglecta), and barn swallows (Hirundo
rustica) studied at Kesterson Reservoir (Santolo and Ohlendorf 1994). This observation could be
the result of lower exposure (different diet preferences) and/or species-specific differences in
how Se is metabolised. It should be noted that sea birds are often less sensitive to Se than

120
freshwater birds due to mechanisms thought to protect marine birds against metal toxicity
(Burger et al. 1994).
In studies of water fowl in the Elk Valley, American coots accumulated more Se in eggs (mean
egg Se = 29.6 µg/g) than Canada geese at the same site (mean egg Se = 17.1 µg/g). The authors
suggest this was the result of the differences in feeding patterns (SciWrite 2004). Canada geese
successfully hatched and raised four goslings to day 31, while the coots hatched seven eggs but
no young were found. There was no conclusive evidence linking failure to successfully fledge
young coots with Se concentrations in eggs (SciWrite 2004). However, other studies have
reported comparable Se concentrations that were sufficient to cause toxicity to coots, which are
among the most sensitive bird species to Se toxicity (Ohlendorf et al. 1986; Hoffman et al. 1988;
Ohlendorf et al. 1988).
7.4.2.5 Amphibians and Reptiles
There is a scarcity of literature on the effects of Se on amphibians and reptiles (Hopkins et al.
2006; Janz et al. 2010). Amphibians and reptiles may respond in much the same way as fish and
birds to dietary intake, bioaccumulation, and maternal transfer of Se to eggs and this may be
important in the transfer of Se through food webs (Stewart et al. 2010).
In studies on the toxicological effects of Se on amphibians and reptiles, the majority have
examined simple Se bioaccumulation (Hopkins et al. 2004, 2006; Bergeron et al. 2010) or
effects from mixtures of contaminants in which case causal relationships with Se cannot be
determined conclusively (Hopkins et al. 2006; Minnow Environmental 2006; Unrine et al. 2007;
Janz et al. 2010). For example, Minnow Environmental (2006) conducted a study on Columbia
spotted frog in the Elk Valley BC, below coal mining activites and found that higher Se
concentrations may have contributed to increased mortality and deformity in tadpoles. However,
the authors were unable to estimate toxicity thresholds due to the high variability in tadpole
response at low Se concentrations. More research is needed to develop toxicologal thresholds for
amphibians and reptiles.

121
7.4.2.6 Mammals
Mammals are not as sensitive to Se as fish and birds (Ohlendorf 1989; Janz et al. 2010). In
studies conducted between 1984 and 1986 at Kesterson National Wildlife Refuge in central
California, concentrations of Se were measured in various tissues (blood, liver, hair) and feces of
10 species of small mammals (Ohlendorf 1989). Results demonstrated a strong relationship to
environmental Se concentrations, with the highest tissue Se concentrations associated with the
most contaminated sites (Ohlendorf 1989). In spite of higher Se bioaccumulation in the exposed
mammals, there were no apparent changes in the health of the organisms between exposed and
reference areas. The exception was that no pregnant voles or mice were found in Kesterson,
whereas pregnant individuals were found in the reference area. Although this finding might
suggest reproductive failure, Se could not be definitively linked to the observation (Ohlendorf
1989). In comparison, at the same locations there were overt and often severe signs of acute and
chronic Se toxicity observed in both fish and birds (Ohlendorf 1989).
7.4.3 Chronic Toxicity Thresholds for Selenium
There are several documents that summarize the existing toxicity data and provide effect
thresholds or risk benchmarks for evaluating Se concentrations in the various environmental
compartments including water, sediment, and tissue (Skorupa et al. 1996; Lemly 1996a, 1996b;
US DOI 1998; Fairbrother et al. 1999; DeForest et al. 1999; Hamilton 2003; Ohlendorf and
Heinz 2011; DeForest and Adams 2011).
7.4.3.1 Water
Adams et al. (1998) recommend a water Se criteria of 6.8 µg/L (lower 10th
percentile of the
distribution) which was the concentration the authors associated with a threshold concentration
for reproductive effects in bird of 20 µg/g egg Se, based on modelling of data from different bird
species and sites across the US. However, the majority of research supports a waterborne Se
effect threshold for both fish and birds of approximately 2 µg/L or less (Lemly and Smith 1987;
DuBowy 1989; Peterson and Nebeker 1992; Maier and Knight 1994; Lemly 1996a; Skorupa et
al. 1996; Hamilton and Lemly 1999; Swift 2002; Hamilton 2003; Paveglio and Kilbride 2007).
Table 7.6 provides a summary of these data.

122
Hodson et al. (1980) exposed newly fertilised rainbow trout eggs from naive parental stock to
water-only lethal and sublethal concentrations of sodium selenite over 44 weeks. The results
showed that Se was lethal to trout at concentrations between 2,000 and 16,000 µg/L, but
sublethal physiological effects were evident above 4.3 µg/L. Chronic responses included
decreased median time to hatching at ≥4.4 µg/L, increased developmental rate at ≥16 µg/L, and
increased in eyed-egg mortality at ≥28 µg/L Se. Exposed fish had increased body burden Se with
increasing water Se concentrations, demonstrating Se bioaccumulated in tissue from a water-only
exposure.
Dubowy (1989) developed dietary bioaccumulation models to predict the water concentration
required to protect sensitive hervbivorous birds. The results showed that water Se greater than
2.8 µg/L would result in dietary Se (10 µg/g) sufficient to cause negative reproductive effects in
ducks. Hermanutz et al. (1996) conducted studies on bluegill sunfish using stream mesocosm.
They found adverse effects on early life stage and juvenile fish at Se test concentrations of 2.5
and 10 µg/L. Swift (2002) conducted experiments using stream mesocosms and found that
isopod and Tubifex populations were dramatically reduced at the high (30 µg/L) and medium (10
µg/L) Se concentrations34
but not at low (2.5 µg/L) exposures, although other invertebrate
species were not affected even at high concentrations. Based on this study, Swift (2002)
recommended a water quality criterion of 2 µg/L to protect sensitive fish and invertebrate
species. This research demonstrates that a range of sublethal and lethal effects can occur in
sensitive organisms at environmentally-relevant aqueous Se concentrations resulting in negative
consequences to long-term health, survival and productivity.
The toxicity of Se is dependent on bioaccumulation primarily driven by dietary uptake (Luoma
and Rainbow 2008). However, certain studies indicate a water concentration of 2 µg/L may not
be sufficiently protective when bioaccumulation of Se in the food web is considered. Some
researchers have found negative effects on biota in ecosystems with very low water Se
concentrations, at or below 2 µg/L (Pease et al. 1992; Crane et al. 1992; Peterson and Nebeker
1992; Skorupa et al. 1996; Swift 2002; Rudolph et al. 2008). Crane et al. (1992) conducted
ecosystem-scale studies on Se bioaccumulation and the effects on biota using freshwater
34
Mesocosms dosed with selenium as sodium selenite.

123
experimental ponds. They reported that spinal deformities in larval perch increased in eggs that
were laid in ponds with 2 µg/L and 10 µg/L compared to control ponds; none of the eggs from
ponds with 25 µg/L Se hatched.
Rudolph et al. (2008) found that at O’Rourke Lake, a small reference lake with Se
concentrations <1.0 µg/L, the mean concentration of westslope cutthroat trout egg tissues was
14.11 (± 1.42) µg/g. The mean (SD) hatchability in fish eggs collected from O’Rourke Lake was
72.6 % (± 27.2%), which was lower (but not significantly different) than mean (SD) hatchability
in eggs collected at the exposed lake 83.3 % (± 13.9%). Although this data may suggest that very
low waterborne Se (<1 µg/L) can lead to reproductive effects from bioaccumulation of Se in diet,
there is uncertainty in the interpretation of these results. O’Rourke Lake contained no resident
fish (Elkford Rod and Gun Club 1984) prior to a stocking program which introduced westslope
cutthroat trout on three occasions between 1985 and 1992 (BC Environment, Fish and Wildlife
Branch internal files). Therefore, classifying O’Rourke Lake as a natural reference site may be
questionable as the lake did not support fish prior to their introduction.
Lemly (1996a) cautioned that where circumstances favour transformation and uptake of Se from
water, concentrations as low as, or in the case of O’Rourke Lake, less than 1 µg/L, could lead to
enhanced bioaccumulation and unanticipated adverse effects. Peterson and Nebeker (1992)
developed a model using existing data to estimate waterborne Se toxicity thresholds for a range
of wildlife that included marsh wrens (Cistothorus palustris), belted kingfisher (Ceryle alcyon),
mallard, osprey (Pandion haliaetus), bald eagle (Haliaeetus leucocephalus), bats (Myotis spp.),
shrews (Sorex spp.), mink (Neovison vison) and river otter (Lontra canadensis). They found that
the waterborne toxicity estimates for sensitive birds and mammals clustered around 1 µg/L; the
range for all species evaluated was 0.7 to 2.1 µg/L.
Based on this work, authorities in California have identified the San Francisco Bay estuary as
one that is extremely sensitive to bioaccumulation of Se in the food web (Pease et al. 1992). The
San Francisco Bay Regional Water Quality Control Board recommended a site-specific water
quality criterion of 0.1 to 0.8 µg/L, limiting Se bioaccumulation and tissue concentrations to
below levels that might harm fish, birds and humans (Pease et al. 1992).

124
Table 7.6 Examples of literature-based chronic effect thresholds, risk benchmarks and
concentrations of concern for water.
Water thresholds Selenium concentration
(µg/L) Reference
San Francisco Bay estuary
site-specific Se criteria
0.1 – 0.8 Pease et al. (1992)
Freshwater thresholds for the
protection of fish, birds and
other wildlife
Lower 10th percentile water
Se associated with mallard
egg Se = 20 µg/g
≤ 11
2
6.8
Crane et al. (1992); Peterson and
Nebeker (1992); Lemly (1996)
DuBowy (1989); Maier and
Knight (1994); Lemly (1996);
Skorupa et al. (1996); USDOI
(1998); Hamilton and Lemly
(1999); Swift (2002); Hamilton
(2003); Paveglio and Kilbride
(2007)
Adams et al. (1998)
1Lemly (1996a) recommended <1 µg/L for organic forms of water column Se as the threshold for food-chain
bioaccumulation and reproductive failure in fish and wildlife. Organic Se forms will represent on a fraction of total
water column Se.
7.4.3.2 Sediment
Sediments represent an important repository for Se cycling in aquatic ecosystems. While
sediment Se concentrations can be highly variable, both temporally and spatially, evaluation of
concentrations is extremely important in understanding the potential environmental threats of Se
(Canton and Van Derveer 1997; Lemly 2003). Research conducted on lakes influenced by
uranium mining in northern Saskatchewan identified strong relationships between dissolved Se
in the water column and total Se concentrations in sediments (r2 = 0.98, p < 0.05, Figure 7.1)
(Wiramanaden et al. 2010). In spite of the data variability, this study was able to show that
sediment Se increased proportionally with increasing water Se, suggesting that the major
mechanism for incorporation of Se into sediments is through the transformation of Se from the
water column by primary producers. The authors also found a strong relationships between
dissolved Se in pore-water and overlying surface water (r2 =- 0.95, p < 0.05). The same study
showed strong relationships between mean whole-body chironomidSe concentrations and
dissolved Se in the water (r2 = 0.91, p < 0.05), and with whole sediment Se concentrations (r
2 =
0.80, p < 0.05). A very strong relationship between chironomid tissue Se and dissolved Se in

125
sediment pore-water was also reported (r2 = 0.99, p < 0.05) (Wiramanaden et al. 2010). These
results demonstrate the importance of water column Se as the source for sediment and sediment
pore-water in Se cycling and the subsequent uptake and bioaccumulation of Se in invertebrates.
Figure 7.1 Relationship between selenium concentrations in whole sediment and mean surface
water selenium for lakes influenced by uranium mining in northern Saskatchewan. Error bars = 1
SD. Hollow triangle is data for Wolf Lake, which was not included in the regression, r2 = 0.95, p
< 0.05 (from Wiramanaden et al. 2010).
Recognizing the link between Se in sediment and bioaccumulation of Se in the food web, some
authors have suggested toxicity thresholds or concentrations of concern related to sediment Se
concentrations ( IJC 1981; Lemly and Smith 1987; Van Derveer and Canton 1997; US DOI
1998). These are summarised in Table 7.7. Some of the earliest recommendations for sediment
quality guidelines for Se came from the International Joint Commission’s Aquatic Ecosystem
Objectives Committee, who stated that sediment Se concentrations should not exceed 5 µg/g for
the protection of aquatic life (IJC 1981). Lemly and Smith (1987) recommended that sediment
Se concentrations greater than or equal to 4 µg/g represent a concentration of concern. Hamilton
(2004) suggested a sediment toxicity threshold for Se of 4 µg/g, but cautioned that emerging
research might reveal that the threshold is lower in some ecosystems. Van Derveer and Canton
(1997) compiled data from 25 study sites across the US and calculated a sediment Se toxicity
threshold of 2.5 µg/g.

126
Table 7.7 Examples of literature-based sediment selenium toxicity thresholds suggested for the
protection of fish and wildlife.
Sediment Thresholds Selenium Concentration
(µg/g dw) Reference
Lowest effect level (LEL) 0.9 – 1.91 Thompson et al. (2005)
Toxic threshold value 2.0 Lemly (2003)
EC10 (fish and birds) 2.5 USDOI (1998)
Predicted effects threshold Observed effects threshold
2.5 > 4
Van Derveer and Canton (1997)
Level of concern ≥ 4 Lemly and Smith (1987)
1Range of lowest effect levels (LEL) for benthic invertebrates in uranium mining-affected sites derived using
“closest observation” and “weighted “ methods (Thompson et al. 2005).
Reliance on sediment concentrations as a predictor of Se toxicity is problematic since sediment
Se and conditions that result in Se bioaccumulation can be highly variable. Studies comparing
sediment Se concentrations to effects show that toxicity is affected by many factors such as total
organic carbon (Van Derveer and Canton 1997;USEPA 1998; Hamilton 1999; Hamilton and
Lemly 1999; Wiramanaden et al. 2010). However, multiple indicators of exposure such as Se
concentrations in water, suspended particulates, sediments, and diet, and their associated
benchmarks, are important in identifying potential risks, especially if Se concentrations in
reproductive tissues are unavailable (Hodson et al. 2010). Currently, the only existing Canadian
federal or provincial sediment Se quality guidelines are those developed by the BC MoE of 2
µg/g (Nagpal and Howell 2001).
7.4.3.3 Microorganisms and Invertebrates
Chronic toxicity thresholds for microorganisms and invertebrates are presumed much higher than
thresholds for fish or birds that consume them (Section 7.4.3.4). There are no general published
toxicity thresholds for invertebrates, partly because there is such a wide range of responses and a
similarly wide range of reported values for effects across species. Table 7.8 summarises some of
the published invertebrate effect thresholds. However, as previously mentioned, there is some
evidence that sensitive invertebrate taxa may have chronic toxicity thresholds for Se that are
similar to or below the dietary toxicity thresholds of their predators, based on whole-body Se

127
concentrations (deBruyn and Chapman 2007). Other examples of benthic community shifts and
losses of sensitive invertebrate taxa below coal mining areas (Section 7.4.2.1) suggest that more
research is necessary to determine a chronic effect thresholds for Se in sediment applicable to a
broad array of invertebrate taxa and their life stages (Frenette 2008; Janz et al. 2010).
Table 7.8 Examples of some suggested literature-based selenium toxicity thresholds for
invertebrates.
Invertebrate Thresholds Selenium Concentration Reference
Internal Se tissue
concentration associated with
sublethal effects
1 – 30 µg/g dw deBruyn and Chapman (2007)
Water concentration to protect
sensitive taxa
2 µg/L Swift (2002)
7.4.3.4 Dietary
Dietary Se toxicity thresholds are not a direct a measure of toxicity, but measurements in prey
organisms can provide an alternative to direct monitoring efforts (Lemly 1996). Minnow (2009)
and Minnow et al. (2011) recommend targeting macroinvertebrates because 1) they can be
frequently sampled with less environmental impact than is associated with gathering fish or bird
egg tissues; 2) are not considered charismatic fauna; and, 3) concentrations are a direct reflection
of dietary Se levels providing a better indication of localised changes in food web Se, than can be
provided by monitoring fish species with large foraging areas.
Reported thresholds for Se in dietary tissues to prevent bioaccumulation leading to toxic
responses in sensitive fish species (i.e., Se concentrations in prey organisms) range from 10 and
11 µg/g for warm and cold water fish species respectively, to 3 and 4 µg/g or less, for freshwater
and anadromous fish to (DeForest et al. 1999; US DOI 1998; Lemly 1996). The dietary
thresholds for fish reported in literature are summarised in Table 7.9, demonstrating that a
majority of these are 3 to 4 µg/g Se (Hamilton 2004).

128
Hilton et al. (1980) conducted a 20-week study on rainbow trout to investigate the physiological
response to dietary Se deficiency and toxicity, and attempt to quantify the dietary requirement
for Se. These authors stated that optimum dietary Se was between 0.15 and 0.38 µg/g Se based
on maximum plasma glutathione peroxidase activity. Fish fed a diet supplemented with 13 µg/g
Se displayed reductions in growth, poor feed efficiency and higher mortalities than all other test
groups. Based on lower glutathione peroxidase activity in the test groups fed the 3.67 and 13
µg/g Se diets, the authors believed that dietary Se in excess of 3 µg/g, over long term exposures,
may be toxic to rainbow trout. Hilton and Hodson (1983) conducted a 16-week feeding study on
juvenile rainbow trout and found that kidney tissues had significantly higher calcium and
phosphorus levels in test groups that had diets supplemented with 5 and 10 µg/g Se, indicating
that renal calcinosis was occurring. They also found that trout in both the low and high
carbohydrate test groups having diets supplemented with highest level of Se (10 µg/g Se) had
significant reductions in body weight and a higher feed:gain ratio than all other test groups.
Cleveland et al. (1993) found that juvenile bluegill sunfish fed a diet enriched with seleno-L-
methionine for 90 days in flow-through experiments experienced a significant increase in
mortality at 6.5 µg/g or greater, although the response was not always consistent.
Hamilton et al. (1990) fed swim-up larval Chinook salmon diets containing either Se-
contaminated fish meal (fish from San Luis Drain, SLD diet) or diets fortified with
selenomethionine (SeMet diet) for a 90 day period. They found that the growth of larval fish fed
the SLD diet was significantly reduced at dietary concentrations between 3.2 and 5.3 µg/g; these
same larval fish had mean whole-body Se concentrations of 4.0 µg/g (Hamilton et al. 1990). The
Hamilton et al. (1990) study was criticised by DeForest et al. (1999) since the San Luis Drain
fish may have contained other co-contaminants. However, fish fed 9.6 µg/g Se in either diet
(SLD or SeMet diets) had significantly increased mortality at mean whole-body Se levels
between 5.4 and 6.5 µg/g (Hamilton et al. 1990). Once again, the results for the 90-day study
were criticised due to increased mortality between 60- and 90-days intervals in all groups
including the controls, suggesting other factors may have been in part, responsible for mortalities
(DeForest et al. 1999). Therefore, use of the 60-day results reported by Hamilton et al. (1990)
has been considered acceptable (DeForest et al. 1999; DeForest and Adams 2011).

129
Table 7.9 Examples of literature-based dietary Se toxicity thresholds for the protection of fish
and birds.
Dietary Thresholds Selenium Concentration
(µg/g dw) Reference
For protection of fish
3
3 – 9
12 – 14
Lemly (1993a, 1996) Hilton et al. (1980); Hilton and
Hodson (1983); Hamilton et al.
(1990); Cleveland et al. (1993);
Jasonsmith et al. (2008)
Janz et al. (2010)
For protection of fish and/or
birds
41,2
Moore et al. (1990); Maier and
Knight (1994); Wayland et al.
(2007)
For protection of poultry
5
Puls (1994)
For protection of sensitive
bird species 4.8 (CI 3.6 – 5.7) 4.4 (CI 3.8 – 4.8)
Ohlendorf (2003) Ohlendorf (2007)
Ohlendorf and Heinz (2011) 1Dietary concentrations below 3 µg/g were not associated with adverse effects and concentrations above 4 µg/g
were associated with adverse effects (Maier and Knight 1994). 2Dietary EC10 for hatching failure published by Wayland et al. 2007.
In a more recent study, Jasonsmith et al. (2008) found that deformity rates were between 11–
12% (gross spinal deformity) in flathead gudgeon at dietary concentrations for that species that
ranged from 3.1 to 8.3 µg/g. These examples represent some of the lower dietary toxicity
thresholds reported in the literature for fish.
Dietary toxicity thresholds for birds are summarized in Table 7.9. Wayland et al. (2007) carried
out an assessment of the potential risk that may be posed by dietary Se by combining
invertebrate Se data and modelling Se exposure to evaluate possible toxicity for two aquatic bird
species. They found that 4.0 µg/g (95% CI of <0.5 - 7.3) was the dietary EC10 for reduced
hatchability in American dipper and harlequin ducks (Histrionicus histrionicus). Puls (1994)
reported that poultry, which are particularly sensitive to Se, have an adequate dietary intake of
0.3 to 1.1 µg/g; diets between 3 and 5 µg/g are excessive but not necessarily toxic. Dietary
concentrations over 5 µg/g do not necessarily affect adult laying hens but results in reduced
hatchability and embryonic deformity (Puls 1994). Ohlendorf et al. (2008) and Ohlendorf and

130
Heinz (2011) provide good summaries of the dietary thresholds for birds ranging from 3.0 to 8
µg/g, with most EC10 values in the range of 4.0 to 4.9 µg/g.
In a study conducted on spotted sandpiper in the Elk Valley, BC, there was a highly significant
15% decrease in hatchability at exposed sites compared with reference (X2=9.6, p< 0.01)
(Harding et al. 2005). The mean Se concentrations measured in the diet (benthic invertebrates) of
sandpipers at the two exposed sites were 4.7 and 10.2 µg/g. The lower of these two sites is within
the low range of the recommended dietary toxicity thresholds for birds (Harding et al. 2005).
This is a good example of the applicability of a dietary threshold for resident BC birds.
7.4.3.5 Fish Tissues
The bioaccumulation of Se is important in determining toxicity, therefore, both tissue and dietary
Se threshold concentrations are considered more appropriate and reliable than water or sediment
for predicting the effects from Se (DeForest et al. 1999; Hamilton 2003; Ohlendorf and Heinz
2011). For fish, whole-body, liver, muscle, ripe ovary, and egg tissues have been used to
evaluate dose-response relationships and estimate toxicity thresholds. These thresholds are
summarised in Table 7.10.

131
Table 7.10 Examples of literature-based selenium toxicity thresholds for fish.
Fish Thresholds Selenium Concentration
(µg/g dw)
Reference
Whole-body
4 4 –6
6 (cold water fish)
9 (warm water fish)
8.1
Lemly (1996a); Hamilton (2002)
Ohlendorf et al. (2011)
DeForest et al. (1999); Brix et al.
(2000)
DeForest and Adams (20121)
Muscle 8
Lemly (1996a)
Liver 12
Lemly (1996a)
Egg/ovary
10
17
20
Lemly (1996a)
DeForest et al.(1999); Brix et al.
(2000); DeForest&Adams (2011)
DeForest et al. (2012)
Modelled population
density effect threshold
(approximate EC10) as
egg Se in westslope
cutthroat trout
28 deBruyn (2009)
Reported whole-body tissue toxicity thresholds for fish range from 3 to 4 µg/g, not
distinguishing between warm or cold-water fish (Lemly 1996a; Hamilton 2003) to 6 µg/g for
larval cold-water anadromous fish and 9 µg/g for warm-water fish (DeForest et al. 1999).
DeForest and Adams (2011) recommended a whole-body Se toxicity threshold for fish of 8.1
µg/g.
Different species of fish may have different toxicity thresholds for Se. Hamilton et al. (1990)
conducted feeding studies on Chinnok salmon and after 60 days of exposure (SeMet diet) found
mortality increased significantly at mean whole-body Se concentrations between 5.4 and 6.5
µg/g. On a whole-body tissue basis, two studies on mosquitofish (Gambusia affinis) suggest this
species is fairly tolerant to Se (Lemly 2002a; Saiki et al. 2004). In Belews Lake, North Carolina,
mosquitofish were the single resident species of fish that persisted after 19 other species were

132
extirpated due to Se toxicosis (Lemly 2002a). Another study in California showed no observed
negative consequences to reproduction in adult mosquitofish with whole-body Se as high as 17.5
µg/g (Saiki et al. 2004). On the other hand, bluegill sunfish, in the same Order
(Cyrpinodontiformes) as mosquitofish, have much lower whole-body toxicity thresholds reported
for reduced winter survival of between 5.9 and 9.6 µg/g (Lemly 1993b; McIntyre et al. 2008).
On an egg Se basis, McDonald et al. (2010) reported an EC10 for larval deformity in Dolly
Varden char (Salvelinus malma) of 54 µg/g Se. Brown trout and rainbow trout and were found to
be highly sensitive to Se toxicity, with egg Se EC10s for larval survival and deformity in the
range of 17 to 22µg/g Se, respectively (Holm et al. 2005; NewFields 2009). This shows the
range of Se toxicity, even within fairly closely related genera, may be relatively wide.
The US EPA (2004) released a draft Se tissue criterion for whole-body fish tissue of 7.91 µg/g,
and 5.85 µg/g as a summer and fall concentration that should trigger further monitoring in
winter. These numbers were based on the results of Lemly (1993b), which showed increased
sensitivity to Se toxicity in bluegill sunfish when fish were additionally stressed by low
temperatures. Previously, the BC MoE published a whole-body tissue Se guideline for fish of 4
µg/g (Nagpal and Howell 2001).
Tissue effect thresholds for egg and/or gravid ovary tissue in fish have also been suggested,
ranging from 10 µg/g for overall health and reproductive vigour (Lemly 1996), to 17 µg/g for
larval mortality (DeForest et al. 1999; DeForest 2008; DeForest and Adams 2011). Most recently
20 µg/g was recommended by DeForest et al. (2012) as a possible guideline for Canada using a
species sensitivity distribution approach. While these are meant to be generally applicable
thresholds, there is a range of species sensitivity to Se which is evident when comparing
published studies reporting egg tissue thresholds. Holm et al. (2005) compared Se-related
deformity in two species of salmonids from streams in Alberta and found that rainbow trout
(Oncorhynchus mykiss) had lower toxicity thresholds than brook trout (Salvelinus fontinalis).
Figure 7.2 shows the distribution of reported toxicity thresholds for fish species (Janz et al. 2010;
DeForest and Adams 2011). While salmonids are thought to be among the most sensitive fish
species to Se toxicity, a study on Dolly Varden char (Salvelinus malma) reported an EC10 for

133
larval deformity of 54 µg/g Se in eggs, not shown on the figure (McDonald et al. 2010).
Although some char species may be more tolerant than other salmonids, studies indicate that
rainbow trout, cutthroat trout and brown trout are much more sensitive with toxicity thresholds in
the range of 17 µg/g egg Se (DeForest and Adams 2011). The EC10 for alevin mortality in
brown trout was 17.7 µg/g egg Se (NewFields 2009), a value that was later revised to 20.8 µg/g
egg Se (Formation Environmental 2011). The EC10 published by Elphick (2009) for larval
survival in westslope cutthroat trout was 19 µg/g egg Se. This value was also later revised to
24.8 µg/g egg Se due to a discrepancy in laboratory analytical results (Nautilus Environmental
and Interior Reforestation Co. Ltd. 2011). Some non-salmonid species also have lower
thresholds than char. Northern pike were reported to have an EC10 for larval deformity of 20.4
µg/g, which is more similar to those reported for other salmonids (Muscatello et al. 2006). What
is interesting about Figure 7.2 is that it demonstrates the narrow range of Se toxicity thresholds
for fish, with some exceptions.
Figure 7.2 Species sensitivity distribution for egg or ovary selenium toxicity thresholds for
larval deformity or alevin mortality (EC10 or equivalent) for several species of fish. Note the
narrow range of toxicity thresholds in red (from Janz et al. 2010).35
35
Reprinted with permission from Ecological Assessment of Selenium in the Aquatic Environment. Copyright 2010,
Society of Environmental Toxicology and Chemistry (SETAC), Pensacola, FL, USA. ISBN 978-1-4398-2677-5

134
Besser et al. (2012), recently published a full life-cycle study on desert pupfish (Cyrpinodon
macularius), reporting that Se exposure had minimal results on survival and growth of juvenile
and adult pupfish except in the highest Se dietary exposure (52 µg/g dw). They also reported that
reduced egg production, although variable in treatment groups, was reduced in all Se exposure
groups with egg Se of 4.4 µg/g or greater. This indicates that although pupfish may be among the
least sensitive freshwater fish for survival and growth endpoints, based on egg production
results, this species may be highly sensitive. It is thought that of the reproductive endpoints
which are typically measured, larval survival and deformity are among the most sensitive (Janz
et al. 2010). The results of Besser et al. (2012) indicate that more research is needed on a broader
range of toxicological endpoints and species to better delineate the effects of Se.
Another feature of Se toxicity is the steepness of the concentration-response curve for fish and
birds species. Figure 7.3 from Nautilus Environmental and Interior Reforestation Co. Ltd. (2011)
shows Se concentration-response curve for westslope cutthroat trout for larval survival based on
egg Se concentrations. The near vertical slope of the curve is a good demonstration that small
increments above the toxicity threshold (EC10) result in very large increases in response. This
narrow range between onset of effects and complete mortality, underscores the need for caution
in establishing “safe limits” for Se in the environment.
Site-specific and species-specific relationships between whole-body, muscle and egg Se, make it
possible to convert between tissue types (Casey and Siwik 2000; Casey 2005; Holm et al. 2005;
Minnow et al. 2007). There are some techniques in use or under development, which allow non-
destructive fish sampling to determine Se tissue residues. Non-destructive muscle plug sampling
allows for greater flexibility in long-term monitoring of vulnerable or listed populations (Casey
and Siwik 2000; Casey 2005; Minnow 2004; Minnow et al. 2007). There are also techniques
being developed to better understand the temporal exposure to Se in highly mobile fish species
using analysis of the annual otolith growth rings, although this technique requires the fish is
sacrificed (Palace et al. 2007; Palace et al. 2011).There are additional recommendations for
monitoring in Section 9.0.

135
Figure 7.3 The dose-response curve for a study on westslope cutthroat trout field-collected, lab-
fertilised gametes. Note the very steep slope of the curve, indicating a narrow range between the
onset of effects and complete mortality (EC10 = 24.8 µg/g, 95% CI 12.0 – 30.5) (from Nautilus
Environmental and Interior Reforestation Co. Ltd. 2011).
7.4.3.6 Bird Tissues
Selenium tissue residues for birds have been published for whole-body, diet, egg, liver, kidney,
muscle, blood, and feathers. The most commonly measured tissue Se toxicity threshold
concentrations are for diet and egg (Puls 1994; Skorupa et al. 1996; US DOI 1998; Ohlendorf
and Heinz 2011). Published thresholds for birds are summarised in Table 7.11. The most relevant
indicator of toxicity effects in birds is egg Se concentration (Skorupa 1998; Janz et al. 2010;
Ohlendorf and Heinz 2011).
Dietary Se toxicity thresholds in birds are between 3 and 8 µg/g; some EC10 (95% CI) values
reported for selected species were 4.0 µg/g (<0.5 - 7.3 µg/g), 4.4 µg/g (3.8 - 4.8 µg/g), and 4.9
µg/g (3.6 - 5.7 µg/g) (Ohlendorf and Heinz 2011). Puls (1994) reported that nutritionally
adequate dietary Se for poultry and other birds (0.3 - 1.1µg/g Se) results in whole-egg
concentrations between 0.67 and 5.0 µg/g Se. Egg Se greater than 5.0 µg/g Se is considered high,
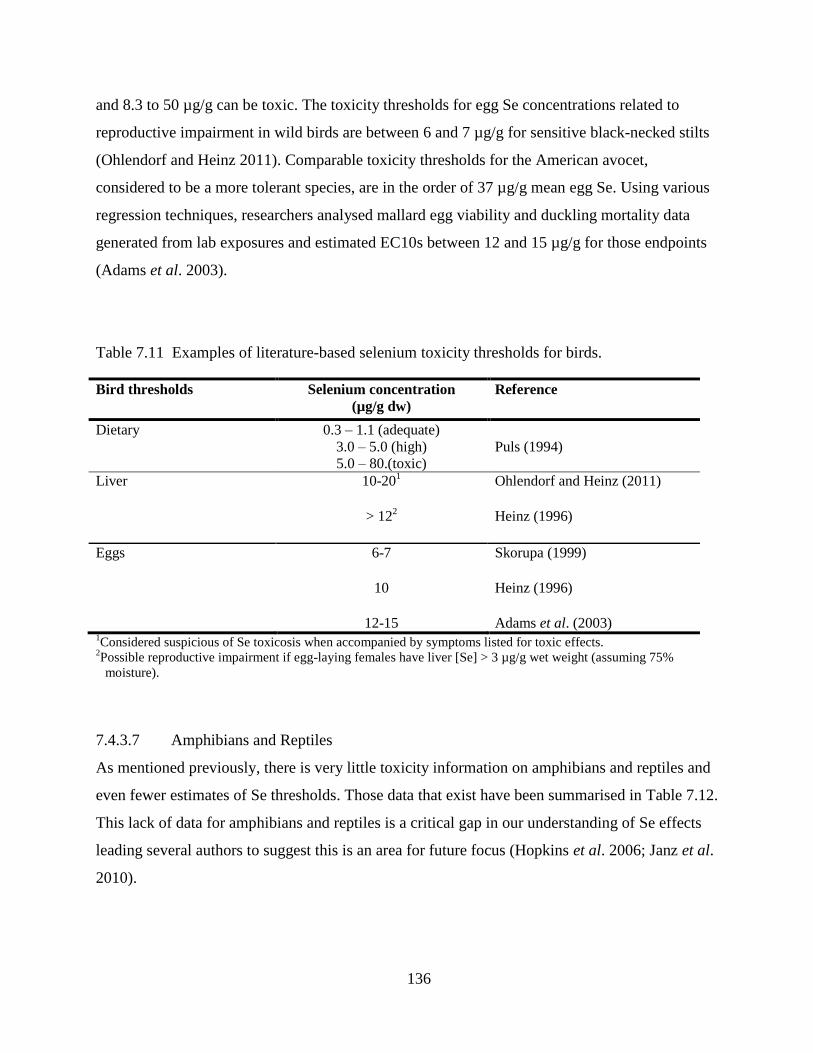
136
and 8.3 to 50 µg/g can be toxic. The toxicity thresholds for egg Se concentrations related to
reproductive impairment in wild birds are between 6 and 7 µg/g for sensitive black-necked stilts
(Ohlendorf and Heinz 2011). Comparable toxicity thresholds for the American avocet,
considered to be a more tolerant species, are in the order of 37 µg/g mean egg Se. Using various
regression techniques, researchers analysed mallard egg viability and duckling mortality data
generated from lab exposures and estimated EC10s between 12 and 15 µg/g for those endpoints
(Adams et al. 2003).
Table 7.11 Examples of literature-based selenium toxicity thresholds for birds.
Bird thresholds
Selenium concentration (µg/g dw)
Reference
Dietary 0.3 – 1.1 (adequate)
3.0 – 5.0 (high)
5.0 – 80.(toxic)
Puls (1994)
Liver
10-201
> 122
Ohlendorf and Heinz (2011) Heinz (1996)
Eggs
6-7
10
12-15
Skorupa (1999) Heinz (1996) Adams et al. (2003)
1Considered suspicious of Se toxicosis when accompanied by symptoms listed for toxic effects.
2Possible reproductive impairment if egg-laying females have liver [Se] > 3 µg/g wet weight (assuming 75%
moisture).
7.4.3.7 Amphibians and Reptiles
As mentioned previously, there is very little toxicity information on amphibians and reptiles and
even fewer estimates of Se thresholds. Those data that exist have been summarised in Table 7.12.
This lack of data for amphibians and reptiles is a critical gap in our understanding of Se effects
leading several authors to suggest this is an area for future focus (Hopkins et al. 2006; Janz et al.
2010).

137
Table 7.12 Some published selenium toxicity thresholds for amphibians and reptiles.
Amphibian and reptile
thresholds
Selenium concentration (µg/g dw)
Reference
Whole-body Eggs
≥ 201
≥ 101
USDOI (1998)
1 Presumptive thresholds for adverse effects based on whole-body concentrations (10x normal), and presumptive
reproductive impairment threshold based on egg concentrations.
8.0 Guidelines for Selenium
8.1 Summary of Existing Environmental Quality Guidelines for Selenium
Existing water quality guidelines or criteria from North America, Australia, New Zealand, and
Europe, are summarised in Tables 8.1 through 8.6, organized by water use. Guidelines for the
protection of human health, presented in Table 8.1, are discussed in more detail in Section 8.3. It
should be noted that each of the jurisdictions developing environmental quality guidelines or
criteria use their own particular decision criteria and protocols, so the values may not be directly
comparable or reflect the same level of protection.
Alberta, Saskatchewan, and Manitoba have published their own provincial aquatic guidelines
which for the most part, have been adopted from the CCME (AENV 1999; Manitoba
Conservation 2002; Saskatchewan Environment 2006). Prince Edward Island, Nova Scotia, New
Brunswick, Newfoundland and Labrador, and the Yukon Territory use existing CCME water
quality guidelines.

138
Table 8.1 Summary of human health drinking water and tissue residue guidelines and criteria.
Water Use Jurisdiction Guideline/Criteria/Objective Reference
Drinking water
Health Canada 10 µg/L Health Canada
(1992)
World Health Organization 40 µg/L WHO (2003)
Japan Ministry of
Environment 10 µg/L
Japan MoE
(1993)
US Environmental
Protection Agency 50 µg/L
USEPA
(2009)
US Environmental
Protection Agency, and
Ministère du
Développement durable, de
l'Environnement et des
Parcs du Québec
170 µg/L (water + organism)1
4200 µg/L (organisms only)1
USEPA
(2009)
MDDEP
(2009)
Water-based
human health
consumption
US Environmental
Protection Agency, Mid-
Atlantic Region
6.9 µg/g wet weight (ww)
USEPA Mid-
Atlantic
Region (2010)
Tissue
consumption of
fish, birds, and
mammals for
human health
US Environmental
Protection Agency
20 µg/g ww, recreational fishers
2.457 µg/g ww, subsistence fishers
USEPA
(2000)
US Department of Interior
2 µg/g ww, limited consumption for healthy
populations and no consumption by children
and pregnant women
5 µg/g ww, complete ban for all populations
USDOI
(1998)
Office of Environmental
Health Hazard Assessment
(California EPA)
Fish Contaminant Goal (FCG) – 7.4 µg/g ww
(based on an individual consuming sport fish
at a rate of 8 oz/week over a lifetime.)
OEHHA
(2009)
1 US EPA 2009 states that a more stringent maximum contaminant level has been issued by EPA. Refer to drinking
water regulations (40 CFR 141).

139
Table 8.2 Summary of existing selenium water quality guidelines, criteria or objectives for the
protection of freshwater and marine aquatic life.
Jurisdiction Guideline/Criteria/Objective Reference
Aquatic life – freshwater
International Joint
Commission ≤ 1 µg/L IJC (1981)
Canadian Council of
Ministers of Environment 1 µg/L
CCREM (1987) CCME (2007a)
BC MoE 2 µg/L Nagpal and Howell 2001
Ontario Environment and
Energy 100 µg/L MoEE (1987, 1994)
Ministère du
Développement durable,
de l'Environnement et des
Parcs du Québec
Same as US EPA (see below) MDDEP (2009)
US EPA 5 µg/L (chronic)1 US EPA (1987; 2004)
Australia/New Zealand 5 µg/L trigger value to protect 99% of species2 ANZECC (2000)
The Netherlands 0.09 µg/L, target value (long-term)
5.4 µg/L, max permissible conc. (short-term) Warmer and van Dokkum
(2002)
Aquatic life – marine water
BC MoE 2 µg/L Nagpal and Howell
(2001)
US EPA 290 µg/L, saltwater acute
3,4 71 µg/L, saltwater chronic
3,4 USEPA (2004)
1US EPA acute Se criteria 258 µg/L for selenite, and a sulphate-corrected algorithm for selenate,
exp(0.5812[ln(sulphate)]+3.357), e.g., at 100 mg/L sulphate, selenate should not exceed 417 µg/L Se. 2The ANZECC recommends for chemicals that bioaccumulate the low risk 99% trigger values be used.
3 US EPA 2004 criteria document states that because Se may be as toxic to saltwater fishes as it is to freshwater
fishes, the status of the fish community should be monitored, if Se exceeds 5.85 µg/g dw in summer or fall, or
7.91 µg/g dw during any season in the whole-body tissue of salt water fishes. 4US EPA 2009 states if Se is as toxic to saltwater fishes in the field as it is to freshwater fishes in the field, the status
of the fish community should be monitored whenever the Se concentration exceeds 5.0 g/L in saltwater because
the saltwater chronic criteria does not take into account uptake via the food chain.
The Province of Quebec has adopted US EPA water quality criteria for Se, including those for
marine waters (MDDEP 2009). Ontario and BC have developed their own guidelines for Se
(MoEE 1994; Nagpal and Howell 2001). Ontario’s provincial water quality objective (PWQO)
for Se (100 µg/L) stands out as much higher than others. This is because the objective was
originally developed in 1979 (MoEE 1979) and was based only on acute toxicity data since
chronic data was not available at that time. All provinces and territories in Canada participate in

140
the development and technical review of CCME environmental quality guidelines as members of
the inter-provincial Water Quality Task Group (CCME 2007b).
Selenium water quality guidelines or criteria for the protection of freshwater aquatic life have
been developed by several other jurisdictions, including: the International Joint Commission (IJC
1981), Canada (CCME 2007a), the US EPA (USEPA 2004), Australia and New Zealand
(ANZECC 2000), and the Netherlands (Warmer and van Dokkum 2002) (Table 8.2). Both BC
MoE and the US EPA have also developed water column guidelines/criteria for the protection of
marine aquatic life (Table 8.2).
Since Se is listed as a priority toxic pollutant under the US Clean Water Act, many state
jurisdictions have either adopted the EPA aquatic life criteria (5 µg/L), or developed Se water
quality standards (WQS) based on the EPA criteria and/or other scientific information (USEPA
1986). These are summarised in Table 8.3.
Table 8.3 Summary of US State water quality standards or site-specific standards developed for
water.
Jurisdiction Standard/Criteria Reference
California EPA 0.1 – 0.8 μg/L1 Pease et al. (1992)
Colorado 4.6 µg/L (Colorado DPHE 2007)
Indiana 35 µg/L Indiana WPCB (2009)
Illinois 1,000 µg/L undesignated waters
5 µg/L Lake Michigan and tributaries Illinois PCB (2009)
Iowa 10 – 70 µg/L Iowa DNR (1992)
West Virginia 5 – 62 µg/L WV DEP (2009)
1Site-specific water column quality criterion for San Francisco Bay.
State-derived standards for the protection of aquatic life are usually consistent with the US EPA
Se criteria, but may deviate slightly. These exceptions include:
California EPA and the California Water Quality Control Board – set a site-specific
standard for Se in San Francisco Bay of 0.1 to 0.8 µg/L (Pease et al. 1992).
Colorado – established a chronic Se WQS of 4.6 µg/L (Colorado DPHE 2007);

141
Indiana – a 4-day average chronic aquatic criteria (CAC) concentration of 35 µg/L was
established (Indiana WPCB 2009);
Illinois – 1,000 µg/L was established as a “not to be exceeded” concentration in
undesignated waters except in mixing zones. A WQS of 5 µg/L was established for Lake
Michigan or waters tributary to Lake Michigan (Illinois PCB 2009);
Iowa – established chronic Se standards that range from 10 to 70 µg/L, depending on the
classification of water (Iowa DNR 1992); and,
West Virginia – adopted the US EPA Se chronic water quality criteria of 5 µg/L, but has
also established site-specific numeric criterion of 62 µg/L for watersheds receiving coal
mining drainage (WV DEP 2009).
The European Commission, (United Kingdom, Ireland, Portugal, Germany, Spain, France,
Belgium and the Netherlands) has not listed Se as a priority substance and, therefore, has not
developed environmental quality standards for Se (EC 2008). The Netherlands have published
their own water column (dissolved Se) and sediment environmental quality objectives for Se
(Warmer and van Dokkum 2002). The maximum permissible concentration (short-term) and
target (long-term or chronic) values for total Se in surface waters are 5.4 and 0.09 µg/L,
respectively (Table 8.4). Environmental quality objectives for Se in sediment are maximum
permissible concentrations and target values of 2.9 and 0.7 µg/g (dw), respectively (Table 8.4;
Warmer and van Dokkum 2002). Several other jurisdictions in North America have developed
Se guidelines for sediment and soils which are summarised in Table 8.4.

142
Table 8.4 Summary of selenium sediment and soil quality guidelines, criteria or objectives
developed by other jurisdictions and previously by BC MoE for the protection of freshwater and
marine aquatic life and soil organisms (respectively).
Jurisdiction Guideline/Criteria/Objective Reference
Sediment
BC MoE 2 µg/g (dw) Nagpal and Howell
(2001)
International Joint
Commission ≤ 5 µg/g (dw)
IJC (1981)
The Netherlands 0.7 µg/g (dw) target value (long-term) 2.9 µg/g (dw) max permissible conc. (short-
term)
Warmer and van Dokkum
(2002)
Soil
Canadian Council of
Ministers of Environment 1 µg/g and 2.9 µg/g
1 CCME (2009)
1CCME soil quality Se guideline 1 µg/g for agricultural, residential or parklands and 2.9 µg/g for commercial and
industrial lands.
In the early 1980s, the International Joint Commission published a guideline for Se in sediment
(IJC 1981). The BC MoE also published a sediment quality guideline for sediments to protect
aquatic life (Nagpal and Howell 2001). The CCME (2009) recently issued an environmental
quality guideline for soil that protects receptors for agriculture, residential, recreational,
commercial, and industrial land uses (Table 8.4). The soil guideline for sensitive agricultural,
residential and parkland uses (1 µg/g) was derived using thresholds for soil contact and/or soil
ingestion by wildlife or livestock, while for commercial and industrial land uses (2.9 µg/g) it was
derived primarily on toxicity data for soil contact by plants, soil microorganisms, and
invertebrates (CCME 2009).
Tissue based guidelines or site-specific criteria for protection of fish and wildlife are summarised
in Table 8.5. The BC MoE, the San Francisco Regional Water Quality Control Board, and the
US EPA have developed water column and/or tissue-based guidelines or site-specific criteria for
the protection of sensitive fish species. Recently, DeForest et al. (2012) proposed a fish egg Se
guideline of 20 µg/g Se, derived using the CCME (2007) species sensitivity distribution model.
However, the CCME (2007) protocol was developed to deal with the concentration of substances
in the water column and the toxic effects resulting from direct exposure, not bioaccumulation.

143
BC MoE developed a guideline for wildlife in 2001 (Nagpal and Howell 2001) using birds as
representative sensitive wildlife. The Utah Department of Environmental Quality (DEQ) recently
developed a site-specific standard for the Great Salt Lake also using birds as surrogates (Table
8.5). The Se wildlife standard arrived at by the Utah DEQ (12.5 µg/g dw as egg Se) did not
represent a consensus of all members of the Science Panel, a group of experts struck to review
and recommend site-specific Se criteria. Some members of the Science Panel believed the
standard was not sufficiently protective (CH2M Hill 2008). To address this, the Utah DEQ and
the Utah Division of Water Quality developed assessment procedures as part of the standard,
called Footnote (14) which were adopted by the Utah Water Quality Board and later submitted to
the US EPA for approval (USEPA 2011a). The assessment procedures are a series of bird egg Se
thresholds which, if exceeded, institute higher levels of response by the Utah Division of Water
Quality if those thresholds are surpassed (USEPA 2011a). The trigger thresholds commence at
the 5 µg/g mean egg Se, at which time monitoring is increased to assess Se loadings, address
data gaps and areas of uncertainty identified during development of the standard (USEPA
2011a). If monitoring demonstrates that mean Se concentrations are ≥ 6.4 µg/g, a Level II
Antidegradation review is launched by the State; at 9.8 µg/g Se studies are initiated to develop
total maximum daily loads (TMDLs) for discharges; and at ≥ 12.5 µg/g mean egg Se,
impairment is declared and TMDLs are formalized and implemented (USEPA 2011a; Table 8.5).
The Science Panel also recommended a bird dietary Se standard for the Great Salt Lake of
between 3.6 and 5.7 µg/g, representing the 95% confidence interval of the dietary EC10 for bird
egg hatchability estimated to be 4.9 µg/g Se (CH2M Hill 2008).
The San Francisco Bay Regional Water Quality Control Board derived a water column site-
specific criterion for the protection of fish, birds, and humans (Pease et al. 1992). Based on
modelling data from the San Francisco Bay estuary, the Board estimated that a water
concentration of between 0.1 and 0.8 µg/L would limit Se uptake in primary producers and
reduce the potential for bioaccumulation of Se in fish, birds, and humans consuming wildlife
tissues (Pease et al. 1992).

144
Table 8.5 Summary of water and tissue residue selenium guidelines and site-specific criteria
developed for the protection of fish and wildlife.
Jurisdiction Guideline/Criteria/Standard Reference
Fish (whole-body)
BC MoE 4.0 µg/g Nagpal and Howell
(2001)
US EPA 5.85 µg/g (summer or fall),
7.91 µg/g (any season)1
USEPA (draft 2004)
Wildlife (fish and/or birds)
BC MoE guidelines for
birds as wildlife surrogates
4 µg/L (water, maximum conc)
7µg/g (mean egg Se, alert level) Nagpal and Howell
(2001)
San Francisco Bay
Regional Water Quality
Control Board site-specific
criteria for fish and birds
0.1 – 0.8 µg/L2 Pease et al. (1992)
Utah Department of
Environmental Quality dietary Se standard for
birds
3.6 – 5.7 µg/g (95% CI of EC10)
4.9 µg/g (dietary EC10 for hatchability) CH2M Hill 2008
Utah Department of
Environmental Quality
bird egg site-specific
criteria for Great Salt Lake
> 5.0 µg/g (increased monitoring)3
6.4 µg/g (Level II Antidegradation review)
9.8 µg/g (TMDL process initiated)
≥ 12.5 µg/g (waterbody declared impaired,
TMDLs implemented)
USEPA (2011a)
1 US EPA 2004 criteria document states that if whole-body fish tissue Se exceeds 5.85 µg/g during summer or fall,
fish should be monitored to determine whether Se exceeds 7.91 µg/g whole-body (WB) during winter. 2This represents a modelled Se concentration in water that would limit uptake in primary producers and reduce
bioaccumulation in fish, birds, and humans. 3The Utah Water Quality Board adopted Footnote (14); a series of triggers based on mean egg Se in birds.
Several jurisdictions have developed Se water quality guidelines for the protection of agricultural
uses, summarised in Table 8.6. The Canadian federal guidelines for Se in irrigation water and
livestock water, originally published in 1987, were established to protect crops and/or livestock
foraging on crops and livestock watering (CCREM 1987; CCME 2005). Alberta (AENV 1999)
and Manitoba (Manitoba Conservation 2002) adopted the CCREM (1987) agricultural
guidelines, but BC derived slightly lower guideline values for both irrigation and livestock
watering (Nagpal and Howell 2001). Agriculture and Agri-Foods Canada recently published a
recommended maximum Se concentration for drinking water specific to horses, due to higher

145
watering requirements for horses and their overall higher sensitivity to contaminants (Olkowski
2009).
Table 8.6 Summary of selenium guidelines and objectives developed by other jurisdictions and
previously by BC MoE, for the agricultural water uses of crop irrigation and livestock watering.
Jurisdiction Guideline/Criteria/Objective Reference
Canadian Council of
Ministers of
Environment
20-50 µg/L, irrigation1
50 µg/L, livestock watering CCME (2005)
BC MoE 10 µg/L , irrigation water
30 µg/L, livestock watering Nagpal and Howell
(2001)
Agriculture and Agri-
Food Canada 10 µg/L, drinking water for horses
2 50 µg/L, drinking water for all other livestock
Olkowski (2009)
1CCME Se guideline of 20 µg/L for continuous irrigation, 50 µg/L for intermittent irrigation.
2Ministry of Agriculture and Agri-Foods Canada recommended safe upper level of water contaminants for horses
and other livestock.
8.2 Guideline Approach
The updated Se guidelines proposed in this section follow a similar approach as that used in 2001
by Nagpal and Howell (2001). Guidelines for various water uses and media are presented and
accompanied by supporting rationale. For the human health (tissue residue), and aquatic life
guidelines, screening values and alert concentrations (respectively) have been developed. These
concentrations provide guidance to environmental managers using a tiered approach to Se
management. Since Se bioaccumulation is complex and can be variable, it should be recognized
that there is some degree of uncertainty in concentrations that may be considered safe for
different media.
There has previously been no clear consensus on what measure of chronic Se toxicity is most
relevant. Differences in interpretation of available toxicity data may have been responsible for
the disparity in how Se has been managed (historically using water-based guidelines or criteria)
in Canada and the US (Lemly 1996b; Adams et al.1998; Hamilton and Lemly 1999; Deforest et
al. 1999; Fairbrother et al. 1999; Skorupa 1999; Hamilton and Palace 2001; McDonald and
Kennedy 2002; Luoma and Rainbow 2008). Many of the authors cited above would agree

146
however, that water column Se concentrations are not the most reliable measure for a complete
understanding of Se bioaccumulation or its potential adverse effects. This is largely due to
research showing that direct uptake of dissolved Se in higher animals, regardless of its form, is
slow and often has no direct relationship to bioaccumulation in tissues or toxic responses in
organisms (Coyle et al. 1993; Cleveland et al. 1993; Sappington 2002; Luoma and Presser
2009).
Despite water Se concentrations in general being a poor predictor of effects, some studies have
defined strong relationships between water Se concentrations and tissue Se in fish (Skorupa and
Ohlendorf 1991; Casey and Siwik 2000; Golder 2010b; deBruyn 2009). Hence, water guidelines
can be very useful as alert concentrations or triggers for further action and management before
Se increases to levels in the food chain which could lead to toxic responses in exposed organisms
(Canton et al. 2008).
There is a consensus regarding the need to develop tissue-based Se guidelines and criteria
(Lemly 1996; DeForest et al. 1999; Adams et al. 2003; Hamilton 2003; USEPA 2004; Janz et al.
2010). Tissue-based guidelines provide a more direct causal link between Se exposure and toxic
effects, integrating the many factors affecting accumulation at any given site. Selenium
concentrations in the prey of higher trophic level consumers, as well as tissues of the consumers
themselves, are commonly recommended for monitoring (DeForest et al. 1999; Lemly 2002a;
Ohlendorf and Heinz 2011). Many researchers advocate the use of eggs or ripe ovary tissue in
fish and birds in Se risk assessment, but there can be limitations to relying on a specific tissue
(Janz et al. 2010). The main disadvantage of using tissues for evaluating Se exposure is often the
need for destructive sampling (sacrificing the organism to obtain a sample) which, in itself, can
put a small population at risk. Sampling may be restricted or extremely difficult if the study
includes rare or endangered species, if mature ovary tissues are difficult to obtain (e.g., small-
bodied fish) or if early-life stages of fish (e.g., immature, non-breeding fish) are at risk
(Hamilton 2002; USEPA 2004).
Guidelines should consider the possible logistical, regulatory or administrative limitations in
monitoring and assessment programs, accommodating options for investigators to compare a
147
wider array of indicator species, tissues, and media for a flexible approach (Coyle et al. 1993;
Lemly 1996b). For example, the utility of guidelines based solely on dietary concentrations for
fish and birds may be restricted since knowledge of the foraging habits, identifying actual diet
composition, and hence getting accurate dietary Se estimates may be difficult (Fairbrother et al.
1999).
Since Se accumulation and toxicity varies widely between and within sites and species, site-
specific assessments may be necessary (Lemly 1999; Adams et al. 1998; deBruyn et al. 2008). A
generic water quality guideline may be appropriate for one aquatic system, or for one species, or
one time of year, but may not be adequately protective of another adjacent system with different
Se cycling dynamics (e.g., mainstem reaches versus side channels of the same river) (Lemly
1999). While development of site-specific assessment of Se is recommended, there is also a
fundamental need for broadly applicable general guidelines to alert environmental managers to
the potential threat Se may pose to aquatic resources and humans (Lemly 1999; Canton et al.
2008). Therefore a suite of Se guidelines for different media and tissues have been developed for
use in BC to protect human health and aquatic life.
8.3 Guidelines for the Protection of Human Health
8.3.1 Drinking Water Guideline
In 1992, Health Canada established a drinking water quality guideline for Se; maximum
acceptable concentration (MAC) of 10 µg/L (Health Canada 1992; Table 8.7). However, this
guideline is currently being updated (P. Hamel, pers. comm., Health Canada, July 2012).
The rationale for the 1992 guideline was that drinking water containing a MAC of 10 µg/L
would be the source of between 10 and 25% of total Se intake and thus providing a reasonable
factor of safety from adverse health effects (Health Canada 1992). Health Canada based the total
intake on the National Academy of Sciences recommended safe and adequate range of 50-200
µg Se per person per day for adults, and a minimum toxic intake level of 500 – 700 µg per
person per day for adults (Health Canada 1992). In BC, Provincial Health Authorities have
adopted the Health Canada Guidelines for Canadian Drinking Water Quality to assess the risk
from chemical contaminants in drinking water (Drinking Water Leadership Council 2007).

148
Table 8.7 Drinking water guidelines for selenium from various jurisdictions.
Jurisdiction Regulation or Guideline Value
Health Canada (1992) Guideline -maximum acceptable
concentration 10 µg/L
US EPA Office of Drinking Water Standard – maximum contaminant level
50 µg/L
California Environmental Protection
Agency (CEPA 2010) Public Health Goal 30 µg/L
Alabama, Colorado, Delaware,
Kentucky Primary Drinking Water Standard 10 µg/L
Louisiana Ground water protection- maximum
contaminant level 10 µg/L
Massachusetts Groundwater protection maximum
contaminant level 10 µg/L
Minnesota Drinking water guideline 30 µg/L
Mississippi Water quality criterion 10 µg/L
Oklahoma Public and private standard 10 µg/L
Virginia Maximum contaminant level 10 µg/L
Wyoming Water quality for human health standard 10 µg/L
World Health Organization Health-based drinking water guideline 40 µg/L
Australia (National Health and Medical
Research Council and Natural Resource
Management Ministerial Council (2011) Drinking water guideline 10 µg/L
The US EPA Office of Drinking Water recommends a maximum contaminant level (MCL) of 50
µg/L (US EPA 2009). This is a legally enforceable nation-wide standard under the Safe Drinking
Water Act. Several US States have implemented more conservative standards (ATSDR 2003,
Table 8.7). The World Health Organization established a provisional health-based drinking water
guideline of 40 µg/L Se (WHO 2011). The WHO based this guideline on an allocation factor of
20% of the upper tolerable intake of 400 µg/day; this is a provisional guideline due to
uncertainties inherent in the scientific database. The National Health and Medical Research
Council and the Natural Resource Management Ministerial Council in Australia established a
drinking water guideline of 10 µg Se/L (National Health and Medical Research and the Council
and the Natural Resource Management Ministerial Council 2011).

149
To protect drinking water sources and human health, Se concentrations should not exceed 10
µg /L at any time. This guideline is adopted from Health Canada’s drinking water guideline
and any future revisions to that number will be reviewed and may result in revisions to the BC
WQG.
8.3.2 Health-based Selenium Screening Value in Fish Tissue
8.3.2.1 Exposure Assessments in Fish Tissue in Canada and the US
Jurisdictions in both Canada and the US have developed guidance protocols and procedures to
address excessive Se accumulation in wild fish and waterfowl harvested for human consumption.
The Government of Alberta assesses risks to human health from contaminants in fish tissue
through a formal process lead by the Public Health Advisory Committee (PHAC). Alberta Health
and Wellness, Regional Health Authorities, and Alberta Environment all have representation on
the PHAC (Environment Canada 2010; W. Zhang, pers. comm., Alberta Health and Wellness,
July 2011). Advisories are published in the Alberta Guide to Sportfishing Regulations
(Government of Alberta 2011). For example, in February 2000, Alberta’s Public Health
Advisory Committee completed an initial human health risk assessment on Se in fish from four
water courses near Hinton Alberta: Lac Des Roches Lake, West Jarvis Creek, Luscar Creek and
Gregg Creek (Chen 2000). A consumption advisory from the Provincial Health Officer was not
necessary because it was determined that people were not consuming fish from these
watercourses (W. Zhang, pers. comm., Alberta Health and Wellness, July 2011).
The US EPA’s Office of Water prepared four guidance documents for state, local, regional, and
tribal environmental health officials responsible for issuing fish and shellfish consumption
advisories in an effort to standardize the human health risk assessment approach amongst states
(USEPA 2000a, 2000b, 2000c, 2000d). Volumes 1 and 2 provide information on monitoring and
assessing. Volumes 3 and 4 address risk management and communication. The Volume 1
monitoring strategy recommends a two-tiered approach; screening studies (Tier 1) and intensive
studies (Tier 2). The objectives of the Tier 1 are to identify areas where concentrations of
contaminants in edible portions of consumed fish indicate the potential for health risks to
humans. The guidance documents provide recommendations on the sampling program (size and
classes of target species, sampling locations, sampling times, number of replicates, sample

150
analysis, data analysis, and reporting). Observed concentrations of contaminants are compared to
‘screening values’ (USEPA 2000a; Table 8.8). According to the US EPA, exceeding a screening
value is an indication that site-specific human health risk assessments may be warranted (Tier 2).
A screening value of 20 µg/g Se ww, has been established for recreational fishers and 2.457
µg/g, Se ww, for subsistence fishers (USEPA 2000b). Screening values are calculated using a
risk-based procedure: a reference dose of 5 x 10⁻³
(mg/kg-day), an adult body weight of 70 kg,
and consumption rates of 17.5 g/day for the general population and 142.4 g/day for subsistence
fishers (USEPA 2000a). The following equation was used to calculate the EPA’s screening
values:
SV = [(Reference Dose)(Body Weight)]/Consumption Rate
Screening values are useful as they provide default values when site specific information such as
fish consumption rates is not available. The EPA (USEPA 2000b) recommends that monitoring
Se concentrations in fish and shellfish should be part of a monitoring program in areas where Se
occurs in geological formations, or where oil and coal combustion occurs or has historically
occurred.
Table 8.8 US EPA selenium screening values for sport and subsistence fishers.
Population Screening value
1 µg/g Se in fish tissue (wet weight)
Adult, Sports Fisher 20.0
Adult, Subsistence Fisher 2.457
1Screening values are calculated using a risk-based procedure: a reference dose of 5 x 10
-3 (mg/kg/-day), an adult
body weight of 70 kg, and consumption rates of 17.5 g/day for the general population (i.e., sports fishers) and
142.4 g/day for subsistence fishers (USEPA 2000a).
More recently, the California Environmental Protection Agency’s Office of Environmental
Health Hazard (OEHHA) developed Fish Contaminant Goals (FCG) and Advisory Tissue Levels
(ATL) for Se (OEHHA 2008). Analysis of Se concentrations in fish from several California
waterbodies is part of the agency’s surface water ambient monitoring program (OEHHA 2009).
The key difference between FCGs and ATLs is that the latter are calculated with adjustments to

151
incorporate the benefits of fish consumption (OEHHA 2008). FCGs are estimates of contaminant
levels in fish that pose no significant risk to individuals consuming sport fish at a standard rate of
32 g/day, prior to cooking over a lifetime. The OEHHA (2008) uses FGC as a reference point to
assist agencies with pollution mitigation and elimination through the development of fish tissue-
based criteria. The OEHAA used the following equation to calculate the FCG, for Se (a nutrient
with a non-carcinogenic effect) where the consumption exposure is equal to the reference dose:
Tissue Concentration = [(Reference dose)(Body Weight)]-(Background Dietary Level)
(Standard Consumption Rate)
The FCG for Se in fish tissue is 7.4 µg/g ww; this is based on an adult weighing 70 kg, a
standard consumption rate of 32 g/day over a life-time, a reference dose of 5 x 10⁻³
mg/kg-day,
and a background dietary consumption rate of 114 g/day (Table 8.9). According to OEHHA
(2008), selenium concentrations are not reduced by cooking or cleaning techniques and therefore
no reduction factors were applied in determining FCG and ATLs.
ATLs for Se were calculated using the same general equation as for FCGs, however to balance
the risks and benefits of fish consumption the OEHHA determined that the average exposure
should be equivalent to the reference dose. ATLs are recommended fish servings per week based
on contaminant concentrations in fish tissue. They are designed to ensure that consumers are not
exposed to a contaminant at levels that are beyond established safe intake levels (Table 8.10).

152
Table 8.9 Fish contaminant goals for selenium in California sport fish are levels that pose no
significant risk to individuals consuming sport fish at a standard rate (32 g/day).
Population Fish Contaminant Goal1
µg/g Se in fish tissue (wet weight) Standard Consumption Rate
Adult, Sport
Fisher ≤7.4 32 g/day, prior to cooking, over a life-time
1Fish contaminant goals are based on an adult weighing 70 kg, and a reference dose of 5 x 10
-3(mg/kg/day). They are
designed to prevent consumers from being exposed to more than the average daily reference dose (OEHHA 2008).
Table 8.10 Advisory tissue levels for a range of selenium concentrations in California sport fish
and corresponding consumption recommendations.
Population Advisory Tissue Level
1
µg/g Se in fish tissue (wet weight) Recommended Consumption Rate
Adult, Sport
Fisher
>15 No consumption
> 4.9-15 32.4 g/day >2.5-4.9 64.9 g/day
<2.5 97.2 g/day 1Advisory tissue levels are calculated with adjustments to incorporate the benefits of fish consumption (OEHHA
2008).
Public health consumption advisories due to elevated Se in fish tissue or wildlife have been
issued in several US states including Idaho, California, Nebraska, Colorado (S. Fontenelle, pers.
comm., US Public Health Service Commissioned Corps US EPA, Office of Water Standards and
Health Protection), Utah, West Virginia, and Michigan (Appendix B).
8.3.2.2 BC Health-based Screening Value for Selenium in Fish Tissue
In cases where aquatic contaminants have the potential to accumulate in wild fish, game, or other
exposed foods, the Ministry of Environment with the Ministry of Health may determine that
development of health-based guidelines is prudent for use in environmental monitoring
programs. Health-based screening values (SV) for Se in fish tissue using a risk-based approach
are provided below. These were developed collaboratively by the Ministry of Environment and
the Ministry of Health. Screening values are defined in this document as threshold values against
which levels of selenium in the ambient environment can be compared and assessed for potential
risks to human health.

153
The SVs were calculated based on conservative estimates of the receptor population’s fish
consumption rates, days of exposure, and Se bioavailability. Screening values have been
calculated based on three fish consumption scenarios: high, moderate, and low. Determining
which screening value to use in a regional monitoring program will depend on what is known
about local consumption habits. For example, if only seasonal, sports fishing occurs, the ‘low’
consumption pattern SV may be adequate. However, if subsistence fishing is occurring, then a
high consumption SV would be the appropriate threshold. Monitoring programs must be
undertaken with consideration of several factors to ensure that food samples are representative of
those consumed by local populations. Sampling and monitoring considerations and protocols
have been outlined by the BC MOE (BC MOE 2012b) and Health Canada (2004a).
Exceedances of a screening value may indicate that detailed monitoring and evaluation of risks
to human health are appropriate; this would be determined by the Ministry of Health or local
Health Authorities. To assess potential exposure to local populations all exposure pathways
including food, water, and air must be evaluated (M. Zemanek, pers. comm., BC Ministry of
Health, June 2011).
It is recognized that consumption of fish has benefits for health outcomes; this would also be
considered by public health professionals in any decisions regarding consumption advice (M.
Zemanek, pers. comm., BC Ministry of Health, June 2011; McAuley and Knopper 2011). Fish
are excellent sources of polyunsaturated fatty acids, vitamins and minerals; there is evidence that
a diet containing fish has numerous health benefits including a reduction in the risk of coronary
heart disease and stroke (FAO/WHO 2011).
Screening values were calculated using Health Canada’s (2004b) recommend general equation
for predicting ingestion of a contaminant via ingestion of contaminated food, as follows:
Dose (mg/kg bw/day) = [Σ [CFoodi × IRFoodi × RAFOrali × D i ]]/[BW × 365]
Where:
Dose=predicted intake of contaminant

154
CFoodi = concentration of contaminant in food i (mg/kg)
IRFoodi = receptor ingestion rate for food i (kg/day)
RAFOrali = relative absorption factor from the gastrointestinal tract for
contaminant i (unitless)
Di = days per year during which consumption of food i will occur
BW = body weight (kg)
365 = total days per year (constant)
The above equation is adjusted to:
C (mg/kg) = [Dose x BW] / [IRFoodi x RAFOrali]
Where:
C = highest concentration of Se in fish tissue (µg/g) that will not allow [Dose x BW] /
[IRFood x RAFOrali] to exceed 1,
Dose = tolerable daily intake: Health Canada’s recommends using the upper tolerable
intake level of dietary reference intakes as the tolerable daily intake for selenium (see
Table 7.3). Adults are used as the default receptors; IOM (2000) did not identify one
particular age group as being more susceptible to the toxic effects of Se.
BW = body weight: 70.7 kg standard weight for an adult,
IRFood i – ingestion rate: calculated based on the following fish consumption rates:
o 220 g/day Canadian First Nations (Health Canada 2004b),
o 111 g/day Canadian general population (Health Canada 2004b),
o 21.5 g/day based on 2 recommended servings/week (Health Canada 2011).
RAFOrali= relative absorption factor ; 100% used as a cautious upper bound, adsorption
of all forms of Se is considered relatively high in humans.
Note: For the purpose of setting screening values, it is assumed that fish are consumed on a daily
basis throughout the year (365 days).
Note: mg/kg = µg/g (these are equal; no conversion necessary).

155
Fish Consumption (IRFood i)
Extensive fish consumption surveys for BC coastal and inland communities are not available to
provide BC specific rates. The Columbia River Treaty Inter-Tribal Commission (1994) fish
consumption survey of four communities of the Columbia River Basin found that the average
rate of consumption for all species of fish was 58.7 g/day. The 90th
percentile was between 97.2
and 130 g/d, the 95th
percentile was 170 g/d, and the 99th
percentile was 389 g/d. Chen (2000)
conducted a survey in the Swan Hills area and determined that 2% of the population consumed
>100 g/d, 13% consumed 30-99 g/d, 28% consumed 3-29 g/d, and 57% consumed < 4g/d.
Richardson (1997) provided receptor characteristics for fish consumption rates for the Canadian
general and native populations. While dated, this information continues to be recommended for
use by Health Canada (2004b) for preliminary quantitative risk assessments. Although these
rates may be considered conservative, they will be used in the calculation of BC’s screening
values. Site-specific assessments would likely need to refine these rates.
Screening values are provided for three populations: high fish consumption patterns (greater than
220 g/day), moderate consumption (111 g/day) and low consumption (21 g/day) (Table 8.11).
The high and moderate consumption rates correspond to Health Canada’s rates for Canadian
First Nation populations and the general population (Health Canada 2004b).
Table 8.11 Screening values for rates of average, moderate and high fish consumption.
Consumption
Pattern
Ingestion
Rate (g/day)
Reference
Dose (µg/ kg
bw/day)
Standard
Body Weight
(kg)
Relative
Absorption
Factor (%)
Screening
Value (µg/g,
wet weight)
High 220 5.7 70.7 100 1.83
Moderate 111 5.7 70.7 100 3.63
Low 21.5 5.7 70.7 100 18.74
A screening value for populations consuming the recommended two servings per week or 21.5
g/day (Health Canada 2011) is also provided. These default consumption rates provide guidance
when food use by local community populations is not available.
156
If screening values are exceeded, it is protocol that the Ministry of Environment reports the
information to the Ministry of Health and local Health Authorities. The latter agencies determine
what action and public communication may be necessary.
To protect human health, the BC Ministry of Environment and the Ministry of Health
recommend the use of the following screening values in environmental monitoring programs
where elevated Se concentrations due to natural or anthropogenic activities in aquatic
environments is a concern:
1.8 µg/g (wet weight) or 7.3 µg/g (dry weight) for high fish intake (0.22 kg/day)
3.6 µg/g (wet weight) or 14.5 µg/g (dry weight) for moderate fish intake (0.11 kg/day)
18.7 µg/g (wet weight) or 75.0 µg/g (dry weight) for low fish intake (0.03 kg/day).
Sampling and monitoring considerations and protocols have been outlined by the BC MoE
(BC MoE 2012b) and Health Canada (2004). Exceeding screening values may lead to site-
specific investigations to assess possible health risks.
8.4 Aquatic Life
Selenium presents a challenge in application of BC’s typical protocol for deriving guidelines,
since Se is a required nutrient but becomes toxic at concentrations not much higher than
background. Short-term guidelines were not developed for Se since acute toxicity occurs at
relatively high concentrations associated with industrial activities and effluent discharges.
Rather, long-term guidelines were derived to protect aquatic life from the more typical and
potentially hazardous effects resulting from the bioaccumulation of Se at much lower
concentrations in water. Published chronic Se toxicological endpoints were reviewed with a
focus on the harmful effects of Se based on water quality, sediment, dietary tissue, and receptor
tissues for a range of aquatic organisms and their consumers. The use of standard BCFs or BAFs
in deriving a guideline for Se was not possible since Se behaves differently in different
environments. While Se relationships between water and other environmental compartments,
including tissue, are site-specific, generic relationships appear to be relevant when compared
with site-specific data reported at sites in BC (see the following sections on guideline derivation
for details).

157
The guidelines include long-term values for several environmental compartments: water column,
sediment, and tissues (dietary tissues for fish and birds, whole-body, muscle and egg tissues of
fish, and bird egg tissue). Multi-media guidelines provide more information and greater
flexibility in a monitoring and management framework aimed at protecting aquatic ecosystems.
This approach was based on several factors:
transformation of aqueous Se and subsequent bioaccumulation of dietary Se is the primary
route of exposure in aquatic ecosystems;
chronic exposure of waterborne Se also contributes to overall exposure and may result in
negative effects on aquatic biota, ranging from increased mortality and deformity, to
subtle changes in behaviour and physiology (Hodson et al. 1980; Hilton et al. 1982;
Hamilton and Wiedmeyer 1990; Cleveland et al. 1993; Miller et al. 2007; Palace et al.
2004);
sediment is an important repository for Se and may contribute to the long-term cycling of
Se and adverse impacts in an ecosystem long after the Se source is removed (Lemly
2002a), and;
a full characterisation of Se in all critical environmental compartments (water, sediment,
and biota) should be conducted to assist in the evaluation, interpretation, and management
of Se in aquatic ecosystems (Lemly 1996a; Sappington 2002; Presser and Luoma 2006;
Ohlendorf et al. 2008).
The guidelines were developed based on taxa shown to be most sensitive to Se exposure, namely
fish and birds. Differences in the propensity of Se to accumulate exist for different natural
aquatic settings (i.e., lentic versus lotic). The guidelines adopt the principle of protecting the
most sensitive hydrologic units within an exposed watershed, since fast moving (lotic) streams
are connected with and have within them, slower moving, depositional (lentic) areas such as
pools, back-eddies, back-channels, lakes, and wetlands (Lemly 1999).
In deriving the guidelines, BC MoE protocols (2012a) were followed, along with guidance
provided in MacDonald (1993). The guidelines are based primarily on laboratory studies where
test organisms have been exposed to a single contaminant to reduce potential confounding
effects of co-occurring contaminants. Since Se is a complex element with many factors

158
influencing its toxicity, many published field studies were also considered in the derivation of
the guidelines.
Published Se concentrations were converted to common units for water (µg/L), and sediment and
tissues (µg/g dry weight) where possible. Tissue concentrations reported in wet weight were
converted to dry weight using the reported % moisture content, or if no conversion factor was
reported an assumed % moisture (usually 75% for muscle, whole-body, and organs) was used.
Selenium toxicity thresholds for fish species represented in BC and/or Canada were considered
in the derivation of the guideline. Studies used to derive guideline values were evaluated and
classified as primary, secondary, or unacceptable for guideline derivation as per the BC protocol
(BC MoE 2012a). Classification of toxicological studies on the effects of Se presented some
challenges. Selenium is not a typical element with a typical mode of action. Guidelines for
bioaccumulative substances typically take into consideration a bioaccumulation factor (BAF),
but for Se the reported BAFs vary widely making it difficult to establish a “general” BAF
(Peterson and Nebeker 1992). Since Se bioaccumulates through the food web, the exposure
mechanisms and toxicity can be complex and require novel study designs that accommodate this
unique element. Although controlled feeding studies (e.g., mesocosm studies) would not be
classified as acceptable since there are no standard federal or provincial protocols, these studies
were considered primary if they met all other classification criteria. This is consistent with the
approach taken by other jurisdictions such as the US EPA (C. Delos, pers. comm., US EPA, May
2012)
Minimum data requirements for setting long-term (chronic) guidelines were met (BC MoE
2012a). However, the existing literature supports the theory that invertebrate, plant, and algal
species are not as sensitive to Se toxicity as are fish and birds. Therefore, greater emphasis was
placed on fish and bird studies, or amphibian studies if available. Published studies were
classified according to BC MoE (2012a).
In deriving aquatic life and wildlife guidelines, a minimum of three acceptable controlled
laboratory feeding studies on fish or bird species present in BC or Canada were required. Since

159
Se bioaccumulation occurs primarily through dietary exposure, long-term laboratory feeding
studies (or preferably combined dietary and water Se) were necessary to reliably establish
toxicity thresholds. The American Society for Testing and Materials (ASTM 2005) have
published protocols for controlled feeding studies. Environment Canada and the US EPA have
not yet developed protocols for fish and wildlife feeding studies (C. Buday, pers. comm., Pacific
Environmental Science Centre April 2012; C. Delos, pers. comm., US EPA, May 2012).
Therefore, the evaluation of many of these studies relied on professional judgement based on the
study design details provided in the publications.
Controlled laboratory or mesocosm feeding experiments that generate toxicological endpoints for
reproductive effects are inherently more difficult and much more expensive to conduct (e.g.,
Hamilton et al. 1990; Hermanutz et al. 1992; Doroshov et al. 1992; Coyle et al. 1993; Hardy et
al. 2010). However, if control group mortality remains low and/or, there is a clear concentration
response in the larval test endpoints such as edema or deformity, they provide a greater level of
control than field-generated data.
Many of the fish egg/ovary toxicity threshold estimates reported in the literature are based on
field-collected gametes which have an unknown history of Se exposure (e.g., Kennedy et al.
2000; deRosemond et al. 2005; Holm et al. 2005; Muscatello et al. 2006; Rudolph et al. 2008,
Elphick et al. 2009; NewFields 2009). Field-collected gametes may have also been exposed to
co-contaminants which may have altered a toxic response. These studies do not meet the BC or
CCME criteria for classification as primary or secondary literature. Regardless of their
limitations, some field studies demonstrate a clear dose-response for endpoints which are
symptomatic of Se toxicity. Since these studies provide a large body of evidence, they were
considered in setting tissue-based guidelines. The US EPA has also made judicious use of field-
generated data in the derivation of their Se criteria (C. Delos, pers. comm., US EPA, May 2012).
Consistent with BC MoE (2012a) derivation protocols, care was exercised in selecting the
appropriate species information to make guidelines applicable in BC and Canada. The available
Se toxicity data spans several different species, some resident in BC or Canada and others not. In
BC, Oncorhynchus, represented by Chinook salmon, rainbow trout and cutthroat trout, is the

160
most common genus found to be very sensitive to Se toxicity (DeForest and Adams 2011). They
are fairly abundant, distributed in many medium and large coastal and inland river systems in BC
(Scott and Crossman 1973; McPhail 2007). Data was available for Chinook salmon, rainbow
trout (Goettl and Davies 1978; Hilton et al. 1980; Hilton and Hodson 1983; Hunn et al. 1987;
Hamilton et al. 1990; Holm et al. 2005; Vidal et al. 2005), and westslope and Yellowstone
cutthroat trout (Kennedy et al. 2000; Rudolph et al. 2008; Elphick et al. 2009; Nautilus
Environmental and Interior Reforestation Co. Ltd. 2011; Hardy et al. 2010). Other fairly
common species in BC for which there is Se toxicity data are brook trout (Holm et al. 2005),
white sucker (deRosemond et al. 2005), and Dolly Varden char (McDonald et al. 2010).
Toxicity data for other fish species with either limited or very limited presence in BC and/or
Canada (McPhail 2007) were also reviewed: brown trout (Salmo trutta) (NewFields 2009),
northern pike (Muscatello et al. 2006); white sturgeon (Acipenser transmontanus) (Tashjian et
al. 2006), bluegill sunfish (Finley et al. 1985; Doroshov et al. 1992; Hermanutz et al. 1992;
Cleveland et al. 1993; Coyle et al. 1993; Lemly 1993b; Hermanutz et al. 1996; McIntyre et al.
2008), fathead minnow (Schulz and Hermanutz 1990), largemouth bass (Micopterus salmoides)
(Carolina Power and Light 1997, as cited in USEPA 2011b), and striped bass (Morone saxitilis)
(Coughlan and Velte 1989). There are also Se toxicity data that exist for species not found in
Canada: Sacramento splittail (Pognichthys macrolepidotus) (Teh et al. 2004). Data for these
species was reviewed but more emphasis has been placed on data for cold-water salmonid taxa
common to BC and/or Canada.
8.4.1 Water Column Guideline
Since bioaccumulation and toxicity of Se to organisms cannot always be predicted consistently
from the concentration of Se in water, many scientists advise against the sole use of a water
column guideline (Luoma and Presser 2009; Stewart et al. 2010). However, higher Se in water
increases the risk of higher Se levels in biota, even if the absolute relationship is weak. Some
researchers have shown a strong relationship exists between water Se concentrations and fish
tissue Se, making water a reasonably good predictor of Se accumulation in fish and an important
assessment tool (Skorupa and Ohlendorf 1991; Casey and Siwik 2000; deBruyn 2009; Golder
2010b). Moreover, water is probably the most sampled media in environmental monitoring

161
programs since it is easy, relatively inexpensive, and does not require sacrificing organisms
which may be rare or endangered. Therefore, a BC water column guideline was retained in the
suite of Se guidelines and where water:tissue relationships are established can be used as a
surrogate for biological sampling, and a trigger for further assessment and action.
The current CCME Se water quality guideline for protection of aquatic life (1 µg/L) was
published in 1987 and reflected the available science at the time. Comparison of the current
CCME guideline with many of the published toxicity thresholds (Table 7.6) and water quality
guidelines from other jurisdictions (Table 8.2) indicates this guideline is likely protective for the
most sensitive environments. The previous BC MoE water column guideline of 2 µg/L was
applicable to both fresh and marine water. This guideline was based on several assumptions
including the chronic effects of Se (accumulation) as well as studies classified as primary.
Studies used in the derivation included several reported lowest observed effect concentrations
(LOECs) for a number of fish species (Cumbie and Van Horn 1978; Schultz and Hermanutz
1990; Hermanutz et al. 1992; Hermanutz 1992; Gillespie and Baumann 1996), and an EC50 for
Daphnia magna (Bringmann and Kuhn 1977, as cited in Nagpal and Howell 2001), all of which
converge around 10 µg/L Se. This value was then divided by an uncertainty factor of 5 to derive
the 2 µg/L BC water column guideline to protect aquatic life (Nagpal and Howell 2001).
Many jurisdictions recommend a concentration of approximately 2 µg/L as the threshold beyond
which there is risk of adverse effects to aquatic life (DuBowy 1989; Maier and Knight 1994;
Lemly 1996; Skorupa et al. 1996; Hermanutz et al. 1996; USDOI 1998; Hamilton and Lemly
1999; Swift 2002; Hamilton 2003; Paveglio and Kilbride 2007). Some studies however,
demonstrate that water concentrations over 1 µg/L may be cause for concern to sensitive species
in environments and/or food webs due to enhanced Se bioaccumulation (Crane et al. 1992;
Peterson and Nebeker 1992; Skorupa et al. 1996; Swift 2002; Stewart et al. 2004). Based on a
generalized dietary intake model, Peterson and Nebeker (1992) recommended a dissolved Se
threshold of no greater than 1 µg/L to protect sensitive piscivorous birds and mammals. Data
reviewed by deBruyn and Chapman (2007) showed that sublethal effects to aquatic insects (as
much as 50% declines in some taxa) have been observed in field studies where Se concentrations
were between 5 and 10 µg/L. In studies using experimental streams, Swift (2002) found

162
population reductions in stream isopods exposed to water concentrations of 10 µg/L or greater,
and in tubificid worms at the 30 µg/L exposure concentration. Hermanutz et al. (1996) found that
the progeny of adult bluegill sunfish exposed to 2.5 and 10 µg/L waterborne Se in experimental
streams were adversely affected. Skorupa and Ohlendorf (1991) reviewed and analysed field and
laboratory data relating embryo toxicity in birds to water concentrations of Se and recommended
2.3 µg/L as a reasonable provisional goal for waterborne Se to protect sensitive aquatic birds.
Collectively, these results provide support of the BC water quality guideline of 2 µg/L or lower,
for very sensitive environments and/or species.
The San Francisco Bay Regional Water Quality Control Board developed site-specific Se criteria
for San Francisco Bay estuary to protect fish, birds, and humans (Pease et al. 1992). Their
rationale was the recognition that the earliest US EPA water quality criterion for Se (USEPA
1987) did not consider the persistence and bioaccumulation of Se through the food chain. The
criterion developed for the Bay was 0.1 to 0.8 µg/L selenite to limit the uptake of Se at the base
of the food chain and reduce Se bioaccumulation in consumers. The California State Water
Resources Control Board (SWRCB) developed a water column criterion to protect fish from
adverse effects using relationships between fish tissue and water Se concentrations. Based on a
mean low-effect concentration adjusted for background in fish tissue of 1.1 µg/g wet weight, the
estimated water column criteria for the protection of fish was 0.9 µg/L. In addition, the SWRCB
recommended a water criterion of 0.8 µg/L to protect humans consuming fish tissue (Pease et al.
1992). The recommended site-specific criterion is currently under review as part of the process
for developing a total maximum daily loading (TMDL) for the Bay (B. Baginska, pers. comm.,
San Francisco Bay Regional Water Quality Control Board, April 2012). The San Francisco Bay
estuary is an example of a particularly sensitive environment and food web to bioaccumulation
of Se.
A study on northern pike conducted by Muscatello et al. (2006) in northern Saskatchewan lakes
receiving uranium mining/milling effluent provides compelling evidence for a low water Se
guideline. These researchers found significant increased deformity in fry from the medium and
high Se exposure sites compared with reference. The mean Se concentrations at the medium and
high exposure sites measured at the end of the study were approximately 0.5 and 1.0 µg/L

163
(Muscatello et al. 2006). In a similar field study on westslope cutthroat trout, Rudolph et al.
(2008) selected O’Rourke Lake, a small reference lake with Se concentrations <1.0 µg/L, where
mean (SD) hatchability in fish eggs was 72.6 % (± 27.2%). This was lower (but not significantly
different) than mean (SD) hatchability in eggs collected at the exposed lake 83.3 % (± 13.9%).
This data may suggest that very low waterborne Se (<1 µg/L) can lead to reproductive effects,
however, the interpretation of this study may be compromised since no fish resided in O’Rourke
Lake prior to fish stocking programs.
A bioaccumulation model for westslope cutthroat trout in the Elk Valley, BC (Golder 2010b)
was developed between water and egg Se concentrations. Golder’s water-to-egg general linear
model for lentic environments, which represent the most sensitive to Se accumulation, had a
reasonably good fit (r2= 0.75). This equation
36 was used, along with the average EC10 egg Se
toxicity threshold for larval survival and deformity in cutthroat trout (21 µg/g egg Se), to
calculate a corresponding water concentration of 2.2 µg/L. Using the same equation with the
average rainbow trout egg Se EC10 estimate of 22 µg/g for larval deformity, yielded a
corresponding water concentration of 2.5 µg/L. Although water column concentrations of 2 µg/L
Se may be broadly applicable as a guideline, the results of Muscatello et al. (2006), Rudolph et
al. (2008), and Golder’s (2010b) BAF model, suggest that in sensitive lentic areas water Se
concentrations over 1 µg/L may represent a risk to aquatic life.
An alert concentration of 1 µg/L is recommended to identify and evaluate environments where
enhanced Se bioaccumulation may be occurring. The extremely low site-specific Se water
criterion developed by the San Francisco Bay Water Quality Control Board (0.1 – 0.8 µg/L) is
one of several examples illustrating environments where Se uptake is particularly efficient
resulting in greater potential risk to organisms higher up in the food web (Pease et al. 1992). An
alert concentration of 1 µg/L Se can be used as part of a tiered, adaptive management approach.
Exceedance of the alert concentration in sensitive environments indicates the need for increased
monitoring of water and other ecosystem compartments (i.e., sediment, periphyton or biofilm,
and dietary items). This tool will support early detection of potential Se bioaccumulation
36
The equation derived for the relationship between water Se and westslope cutthroat trout egg Se in lentic waters
was log(Seegg) = 0.36 x log(Sewater) + 1.2 from Golder (2010b).
164
problems and provide earlier opportunities to commence proactive management actions. The
alert concentration is consistent with the current CCME environmental quality guideline of 1
µg/L Se in water.
The 30-day average alert concentration for the protection of aquatic life in sensitive
ecosystems is 1 µg/L determined as the mean concentration of 5 evenly spaced samples
collected over 30 days, and measured as total Se.
The proposed guideline of 2 µg/L was compared to typical background Se water concentrations
to assess its applicability. Water Se concentrations at reference sites in BC and Alberta are less
than 2 µg/L and typically less than 1 µg/L (Minnow et al. 2011; Casey and Siwik 2000). The
routine monitoring data from the Elk River upstream of mining activity showed that background
concentrations of Se in water were at or below 1 µg/L (Minnow et al. 2011). A review of water
quality data collected near coal mines in Alberta, representing a larger data set over a longer time
frame, showed that at 11 reference sites, the range of mean water Se was between ≤ 0.25 and 2.2
µg/L with a median water Se concentration of 0.7 µg/L, well below the 2 µg/L guideline value
(Casey 2005). Background water quality at sites across Canada (Table 4.5) is below the Se
WQG of 2 µg/L. The water column guideline for aquatic life is applicable to both fresh and
marine waters, since marine water typically has lower Se concentrations than freshwater and Se
behaves similarly in both environments (Sui and Berman 1989).
The 30-day average water quality guideline for protection of aquatic life is 2 µg/L determined
as the mean concentration of 5 evenly spaced samples collected over 30 days, and measured as
total Se.
8.4.2 Sediment Guideline
Selenium in suspended and bed sediments is an important exposure route for organisms at the
base of the food web (Lemly and Smith 1987; Fan et al. 2002). Nagpal and Howell (2001)
developed an interim sediment Se quality guideline (2 µg/g) due to limited available data at that
time. This guideline was evaluated based on current information.
Thompson et al. (2005) reported very low sediment effect concentrations of between 0.9 and 1.9
µg/g, based on two different derivation methods. The Netherlands Institute for Inland Water

165
Management and Waste Water Treatment (known as RIZA in the Netherlands) published an
environmental quality standard for sediment Se of 0.7 µg/g as a target value (long-term chronic
objective), and 2.9 µg/g as a maximum permissible concentration (short-term objective)
(Warmer and van Dokkum 2002).
Effect levels assessed by Thompson et al. (2005) were based on field data related to sediment
quality and co-occurring benthic invertebrate communities near uranium mines in Saskatchewan.
The response of the benthic community could therefore be related to other contaminants present
or the mixture of contaminants. In addition, the effect concentrations do not consider indirect
toxic effects of Se bioaccumulation on higher trophic level organisms. So, while informative,
Thompson et al. (2005) does not qualify as primary literature, but does provide a possible range
of effect levels in sediment.
The Se sediment environmental quality objectives developed by RIZA (Warmer and van
Dokkum 2002) for freshwater and marine environments were originally derived using a
statistical extrapolation (a species sensitivity distribution) of global toxicological data (van de
Plassche and de Bruijn 1992). However, since no soil or sediment toxicological data could be
found, sediment objectives for Se were derived by estimating a partition co-efficient (Kp) from
measurements of river water and suspended particulate matter. The authors stated that many of
the assumptions, including whether the Kp’s truly represented an equilibrium, were questionable,
making the sediment objectives highly uncertain (van de Plassche and de Bruijn 1992).
Other published benchmarks or concentrations of concern are not appreciably higher than 2 µg/g.
For example, the US DOI (1998) summarized a number of field-collected Se sediment
concentrations associated with adverse effects to fish or other wildlife populations ranging from
0.9 to 5 µg/g. The US DOI (1998) adopted a value of 2.5 µg/g as their EC10 for sediment Se
effects on fish and wildlife. Based on an analysis of data collected over more than a decade at
Belews Lake, NC, Lemly (2003) stated that sediments above 2 µg/g Se pose a high risk for
accumulation of Se in benthos to levels that may be toxic to fish and birds.
166
Although these published sediment thresholds and the original publication used to establish the
BC interim sediment guideline in 2001 (Van Derveer and Canton (1997)) suggest that a sediment
threshold of 2 µg/g would be protective, there is still insufficient primary data and much
uncertainty for derivation of a full or an interim guideline.
Adding to this uncertainty is the inherent variability in sediment metals data, including those for
Se. Seiving sediments and analysing only the fine (< 63 µm) fraction can reduce that variability
(BC MoE 2013). However, sediment data may have other sources of variability due to analytical
or sample collection methods used. For example, one site in the Elk Valley (Barnes Lake
wetland) was sampled in 2002 and again in 2006 over which time the Se concentration in
sediment nearly doubled (from 2.0 to 3.9 µg/g). The difference may reflect the different
collection methods used in the surveys. In 2002, a ponar was used and three subsamples of the
top 3 cm were analysed, but in 2006, a 2-inch corer was used and seven to eleven subsamples of
the top 1 cm were analysed (Minnow Environmental Inc 2004; Minnow et al. 2007).
Alternatively, the difference may indicate a potential source(s) of Se in the Barnes Lake wetland
as coal mining expands in the valley. This example underscores the difficulty in using sediment
data, in isolation of other indicators of Se accumulation in the environment, since data variability
could be the result of several factors. More information on monitoring techniques and
approaches are provided in Section 9.0.
The sediment guideline concentration of 2 µg/g was compared with background levels measured
in eastern (Table 4.7) and western Canada (Table 4.8). The sediment Se concentrations in Tables
4.7 and 4.8 represent whole samples (not sieved prior to analysis), with one reported value for
Murry River sediment Se representing analysis of the < 63 µm fraction (Table 4.8). Most
reference sites in Tables 4.7 and 4.8 had Se sediment concentrations below 2 µg/g, with only a
few exceptions in areas having naturally high Se.
Since background is typically below 2 µg/g, and the published benchmarks, thresholds and
objectives for sediment Se are 2 µg/g or less, this sediment concentration should be protective of
the most sensitive organisms. Because there is no new primary literature available for an updated
sediment Se guideline and uncertainty in the existing information, the status of the guideline will

167
change from interim, to an alert concentration. No uncertainty factor was applied to this value
since it is not a guideline. For most environments, the sediment alert concentration is protective
and, along with data from other ecosystem compartments, will provide an early indication of the
increased risk of impacts to aquatic organisms. Since background concentrations of Se in marine
sediments are also typically well below 2 µg/g, the sediment alert concentration will also apply
in marine environments (Sui and Berman 1989). In regions where true background sediment Se
exceeds the alert concentration, site-specific water quality objectives may be considered in
consultation with BC MoE.
The chronic sediment quality alert concentration for the protection of aquatic life is 2 µg/g,
calculated as the mean concentration of at least 5 samples collected in a representative area
(i.e., site).
8.4.3 Tissue Guidelines
The previous BC tissue residue Se guideline of 4 µg/g (dry weight) (Nagpal and Howell 2001)
for whole-body fish was based on two key published studies. In the first, Hamilton and
Wiedmeyer (1990) studied Se effects on growth and survival in Chinook salmon, reporting a
range of no-effect water Se concentrations (35 to 70 µg/L) and no-effect whole-body tissue Se
concentrations of 2 to 5 µg/g. Brix et al. (2000) re-evaluated these same data along with similar
published data, and suggested the whole-body Se toxicity threshold (EC10) for cold-water fish of
6 µg/g. Nagpal and Howell (2001) converted the whole-body tissue EC10 of 6 µg/g to a wet
weight concentration of 1.2 µg/g (assuming 80% moisture content), which was rounded to 1
µg/g, with no uncertainty factor applied. This value was then converted to a dry weight whole-
body tissue guideline of 4 µg/g Se (also assuming 80% moisture content).
Dietary exposure is the predominant route of uptake (DeForest and Adams 2011). Waterborne
exposure studies on fish accounts for some degree of uptake, with reported effects being
associated with water-only exposures (Hodson et al. 1980; Hilton et al. 1982; Hicks et al. 1984;
Cleveland et al. 1993; Hamilton 2004; Miller et al. 2007). Therefore, both routes of exposure
were considered in updating the Se tissue guidelines.

168
There are some differences in background tissue concentrations between freshwater and marine
aquatic environments. Although it varies by species, some marine animals, such as birds and
fish, often have higher tissue concentrations of Se than freshwater animals (Sui and Berman
1989; DeVink et al. 2008). Therefore, the tissue residue guideline for aquatic life applies only to
freshwater fish.
8.4.3.1 Dietary Tissue
Selenium measurements in lower trophic level organisms may be used as a trigger for further
action and may be valuable for environmental managers and practitioners (Lemly and Smith
1987; Lemly 1996; US DOI 1998; Wayland and Crosley 2006; Wayland et al. 2006, 2007;
Canton et al. 2008). There are many advantages to sampling dietary organisms:
periphyton and benthic invertebrates may be more Se tolerant;
invertebrates are more abundant, and easier to sample than higher trophic levels;
sampling non-commercial or non-charismatic species for Se risk assessment does not put
populations at risk;
invertebrates may be alternate bioindicators when target species are rare or agencies limit
their collection; and,
evaluating subtle changes to aquatic benthic invertebrate communities and if possible
relating those changes to Se exposure can provide a means of assessing overall ecosystem
impacts (e.g., Swift 2002; Pond et al. 2008).
For these reasons, concentrations of Se in the tissue of fish and other wildlife prey organisms
will provide another compartment of the ecosystem to monitor Se bioaccumulation. The direct
effects of Se on the prey organisms themselves can also be evaluated.
Some criticisms of using a dietary chronic Se guideline include: dietary Se is thought of as an
indirect measure of toxicity, the observed responses can be highly variable, Se concentrations in
some trophic levels can be highly variable, and characterisation and selection of appropriate
indicator dietary species can be problematic (USEPA 2004; Malloy et al. 1999; DeForest and
Adams 2011). There are also logistic problems associated with collecting enough dietary tissue
for analysis if a laboratory requires larger volumes. Despite these limitations, diet is the critical

169
exposure pathway for those organisms most at risk, so an understanding of dietary Se can aid in
predicting bioaccumulation and toxicity (Lemly 1996; Canton et al. 2008; Ohlendorf and Heinz
2011). Some studies have shown that fish Se body burdens can be accurately predicted based on
dietary Se intake, with an almost 1:1 relationship between dietary and body burden Se
concentrations (Stewart et al. 2004; Hopkins et al. 2004; Stewart et al. 2010; Presser and Luoma
2010). Comprehensive monitoring programs evaluating the effects of Se include this important
dietary component to provide data for site-specific modelling (Orr et al 2006, 2012). Hence,
there is adequate justification across the literature to establish a dietary guideline for Se.
A summary of studies on the effects of dietary Se exposure to fish and birds (and their
classification) is provided in Table 8.12. The estimates of dietary Se toxicity thresholds for fish
and birds, range from 3 to 14 µg/g, with the majority of threshold values being less than 7 µg/g
(see Table 7.9). Both the US DOI (1998) and Presser et al. (2004) suggest that a dietary Se
concentration between 3 and 7 µg/g would present a marginal risk to aquatic life, while dietary
Se concentrations above 7 µg/g present a substantive risk to higher trophic level consumers.
As discussed in Section 7.4.3.4, the assessment of deBruyn and Chapman (2007) suggests
invertebrates may be at risk of sublethal effects when Se body burdens between 1 and 30 µg/g,
which is within or lower than the range of the sublethal dietary effect thresholds for fish and
birds. They reported that a dietary threshold of 3 µg/g resulted in a Se body burden that would
cause a 15-40 % reduction in the growth of Chironomus. More research is needed to develop
clearer toxicity thresholds for invertebrates before a guideline can be based on the analysis
provided in deBruyn and Chapman (2007). Their evaluation does, however, suggest that a
dietary Se guideline to protect fish and birds may protect invertebrate prey organisms. There are
currently no published Se dietary guidelines, however, the lowest dietary threshold predictions
and estimates for fish and birds are approximately 3 to 5 µg/g Se, respectively (Hilton et al.
1980; Hilton and Hodson 1983; Lemly 1996b; Hamilton 2004; Ohlendorf et al. 2010). Most of
the reported dietary thresholds in Table 8.12 are NOEC and /or LOEC concentrations with only
one reported EC10 estimate.

170
The estimated geometric mean of the dietary Se NOEC/LOEC (i.e. MATC) for rainbow trout
mortality was 4.8 µg/g, one of the lowest published toxicity thresholds (Goettl and Davis 1978).
Hilton et al. (1980) exposed rainbow trout fry to six different diets containing between 0.07 and
13 µg/g sodium selenite, at water Se concentrations of 0.4 ± 0.2 µg/L. Based on the observations
from the 20-week study, they suggested that long-term diets over 3 µg/g could ultimately be
toxic to rainbow trout. In a more recent study, a LOEC for reduced growth of 4.6 µg/g dietary Se
was reported for rainbow trout (Vidal et al. 2005). These studies suggest that a dietary guideline
of between 3 and 5 µg/g for sensitive fish species would be protective.
Since an aquatic dietary guideline should also consider aquatic-dependent wildlife, thresholds for
birds were evaluated. Most bird Se toxicity studies prior to the 1980s used domestic poultry
(Ohlendorf 2003). Ort and Latshaw (1978) conducted laboratory feeding studies on adult
chickens and found that a diet of 5.5 µg/g Se, over 28 weeks, resulted in significantly reduced
egg hatchability.
After 1983, many laboratory studies were conducted on mallard ducks as a result of toxicosis in
birds identified at Kesterson Reservoir (Ohlendorf 2003). Ohlendorf (2003) analysed laboratory
toxicity data from six studies on mallard ducks, a species considered to be relatively sensitive to
Se, and developed a dietary Se EC10 effects threshold for hatchability of 4.9 (3.6 – 5.7) µg/g. At
approximately the same time, Adams et al. (2003) published mallard Se thresholds for deformity
and hatchability using the same data but different statistical methods. Prompted by the re-
analysis by Adams et al. (2003), Ohlendorf (2007) revised his dietary threshold estimate to 4.4
(3.8 – 4.8) µg/g. The studies on mallard were considered acceptable for development of a dietary
tissue guideline based on an evaluation of the reports using CCME’s guidance criteria for
guidelines for the protection of wildlife (CCME 1998).
A study of spotted sandpiper in the Elk Valley, BC, showed a significant decrease in hatchability
at two exposed sites where the mean dietary Se concentrations were 4.7 and 10.2 µg/g (Harding
and Paton 2003). Wayland et al. (2007) studied the dietary risk to American dippers and
harlequin ducks on coal mine-impacted streams in Alberta. Based on existing published
toxicological literature, a simulation model, and risk assessment these authors predicted a dietary

171
EC10 for reduced hatchability of 4 µg/g with a fairly wide 95% confidence interval of 0.5 – 7.3
µg/g Se (Wayland et al. 2007).
Dietary thresholds for fish and birds are similar (Doroshov et al. 1992; Harding and Paton 2003;
Tashjian et al. 2006; Wayland et al. 2007). Hamilton et al. (2005) suggested that a dietary
threshold of 4 µg/g would not be overly conservative for sensitive fish and bird species. Of the
studies listed in Table 8.12, Hilton and Hodson (1980), Hilton et al. (1980), Hamilton et al.
(1990), and Tashjian et al. (2006), were classified as primary data. Only the 60-day results for
SeMet diet published in Hamilton et al. (1990) were used to derive the dietary guideline due to
possible contamination of the diet containing San Luis Drain fish (DeForest et al. 1999). The
study by Teh et al. (2004) was classified as secondary. Bird studies by Ort and Latshaw (1978),
Stanley et al. (1996) and Heinz et al. (1989) were classified as primary according to CCME
(1998) protocols for wildlife tissue guidelines. The remainder of the studies listed in Table 8.12
were unacceptable due to control mortality exceeding allowable limits (Doroshov et al. 1992;
Vidal et al. 2005; Hardy et al. 2010), and/or no clear concentration response detected (Hardy et
al. 2010).
An expert scientific panel reviewing Se studies in the Elk Valley BC agreed an area-specific
dietary (benthic invertebrate) trigger of 5 µg/g would be protective of aquatic invertebrates, as
well as fish and wildlife species (Canton et al. 2008).

172
Table 8.12 Published dietary effect thresholds for selenium toxicity on fish and bird species.
Species Se in diet
(µg/g) dw Effect
Study
Classification Reference
Acipenser
transmontanus (white sturgeon)
10 Dietary Se "threshold" for histopathological alterations in kidney
of juvenile sturgeon
1° Tashjian et al. (2006)
Oncorhynchus
tshawytscha (Chinook salmon)
9.6 EC10 reduced growth in larval fish, 60 day exposure
(approximate dietary concentration for both SLD and SeMet
diets)
1° Hamilton et al. (1990) (cited in
USEPA (2011a))
Oncorhynchus
mykiss (rainbow
trout)
4.6
4.8
>3.7/< 13.1
> 6.6/< 11.4
LOEC for reduced growth in juveniles
Geometric mean of dietary NOEC/LOEC for mortality (MATC)
NOEC/LOEC for decreased body weight in juvenile fish
exposed for 20 wks;
NOEC/LOEC for renal calcinosis in juvenile rainbow trout on
low carb diet;
U
1°
1°
1°
Vidal et al. (2005);
Goettl and Davies (1978)
(cited in DeForest et al. (1999));
Hilton et al. (1980)
Hilton and Hodson (1983)
Oncorhynchus
clarkii bouvieri
(Yellowstone
cutthroat trout)
11.2 Dietary concentration associated with NOEC for larval
mortality and deformity (no LOEC could be estimated)
U Hardy et al. (2010)
Lepomis
macrochirus
(bluegill sunfish)
5.5
13.9
NOEC for edema and delayed yolk sac resorption
LOEC for edema
U Doroshov et al. (1992)
Pogonichthys
macrolepidotus (Sacramento
splittail)
6.6 LOEC for deleterious effects on juvenile fish not exposed
maternally to Se
(> 50% deformity in larval fish at this dietary exposure
concentration)
2° Teh et al. (2004)
Poultry 5.51 LOEC – Significant reduction in hatchability in laying hens 1° Ort and Latshaw (1978)
Falco sparverius
(American kestrel)
6 - 12 Dietary NOEC/LOEC for reductions in body mass after a six
month feeding study
1° Yamamoto and Santolo (2000)
Anas
platyrhynchos
(mallard ducks)
3.91
7.81
4.41
8.91
NOEC for reproductive effects;
LOEC – 33% reduced hatching and teratogenic effects rise
sharply above this threshold;
NOEC for reproductive effects;
LOAEL – approx 17% reduction in duckling survival, 43%
decrease in mean number of 6-day old ducklings
1°
1°
Stanley et al. (1996)
Heinz et al. (1989)
1Dry weight calculated based on 10% moisture in diet as reported in Ort & Latshaw (1978), Stanley et al.(1996) and Heinz et al. (1989). Studies classified for
guideline derivation as primary (1°), secondary (2°) or unacceptable (U).

173
In 2008, a group of Se toxicology experts developed a site-specific standard for the Great Salt
Lake in Utah, and using a summary of toxicological data, recommend a dietary EC10 for
hatchability in birds of 4.9 µg/g, with a 95% confidence interval of 3.6 to 5.7 µg/g (CH2M Hill
2008).
Fish and bird dietary Se concentrations greater than 5 µg/g may exceed the thresholds for
teratogenic effects (Ohlendorf et al. 2011). Since there is a narrow margin between adequate
dietary Se concentrations and those thought to pose a risk to fish and wildlife, and because the
form of Se is a determinant in the degree of risk for toxic effects, it may be difficult to accurately
predict Se toxicity from dietary intake. However, the above evaluations suggest that dietary Se
concentrations above 4 µg/g constitute a risk for excess bioaccumulation resulting in
reproductive and non-reproductive effects to sensitive receptor fish and wildlife species. Since
fish and birds may be consuming a mix of invertebrates and fish, the fish whole-body tissue
residue guideline of 4 µg/g should align with the dietary guideline. Therefore, the BC interim
dietary guideline is 4 µg/g.
While most reference area concentrations of invertebrate tissue will not exceed an interim dietary
guideline of 4 µg/g, some areas with naturally high Se may have background tissue
concentrations that are close to, or slightly exceed this guideline (see Table 4.7). The average of
all invertebrate tissue Se data collected between 1996 and 2009 in the Elk Valley BC, at
combined lotic and lentic reference sites was 3.9 (± 1.6) µg/g (calculated from data summary
provided by Minnow Environmental Inc.). In regions where true background dietary tissue Se
exceeds this value a careful examination of environmental conditions is warranted to evaluate the
need to develop site-specific water quality objectives in consultation with BC MoE.
This guideline is designated interim because additional data are needed to verify the protection
afforded by this value (BC MoE 2012a). Dietary concentrations exceeding this value would
serve as a trigger for further investigation. While there are some studies that suggest this
guideline may not protect highly sensitive invertebrate species, more definitive research is
needed to define Se toxicity thresholds before a full guideline for protection of invertebrates may
be proposed. No uncertainty factor was applied to this value because Se is a dietary requirement,

174
some background levels of dietary Se approach this value, and there is need for additional data to
confirm the guideline. Dietary Se evaluation should target known or likely prey organisms in the
diet of sensitive receptor species, including other fish, and evaluate the presence of other
contaminants.
The interim chronic dietary guideline to protect fish and aquatic-dependent wildlife is 4 µg/g
Se (dry weight) measured as the mean concentration of at least eight replicate (composite)
tissue samples representing appropriate invertebrate or other prey species. Further guidance
on sample collection is provided in BC MoE (2012b).
8.4.3.2 Egg/Ovary Tissue
A Se guideline must consider both the reproductive effects resulting from the maternal transfer
of Se and non-reproductive effects on early life stages (immediately after the onset of exogenous
feeding) and juveniles. Both result primarily from the ingestion of dietary Se, but also from
direct uptake of Se from water (Hermanutz 1992; DeForest 2008). Toxicity thresholds for non-
reproductive effects in early life stages and juvenile fish are not as well defined as those for
reproductive effects, but some researchers suggest the thresholds are similar (DeForest 2008;
Janz et al. 2010; DeForest and Adams 2011; Table 8.13).
Egg or ripe ovary Se concentrations provide the most direct basis for predicting reproductive
effects in fish and other wildlife (Sections 7.4.3.5 and 7.4.3.6) and are the preferred tissues for
environmental assessments (deBruyn et al. 2008; Janz et al. 2010; DeForest and Adams 2011;
Ohlendorf and Heinz 2011). While tissue guidelines may be more ecologically relevant than
water or sediment, it presents several challenges in terms of implementation (Lemly and Skorupa
(2007). In some cases, constraints on sampling fish, whether seasonal or regulatory, may
preclude egg/ovary sampling, in which case analysis of whole-body, muscle, or muscle plug
tissues can provide a reasonable indication of risk for reproductive effects from Se toxicity
(DeForest and Adams 2011). While generic tissue relationships have been defined, species-
specific and site-specific correlations (the most reliable) between tissue types are often
developed and may be used to translate Se concentrations between tissue types to predict
reproductive effects (deBruyn et al. 2008). Differences in tissue Se relationships do exist even

175
between closely related species, as demonstrated by Holm et al. (2005) who found a 7-fold
increase in rainbow trout egg Se compared with muscle Se, while brook trout had only a 2-fold
increase in egg Se over muscle Se at the same sites.
Some of the literature reporting Se toxicity thresholds measured as egg/ovary concentrations
have been summarized in Table 8.13. Egg Se toxicity is evident in several fish species at
concentrations of 12.7 µg/g and above (USEPA 2011b). DeForest and Adams (2011)
recommended a combined egg/ovary threshold for fish of 17 µg/g, which considered data for
several species including bluegill sunfish, brook trout, rainbow trout, brown trout, cutthroat trout,
Dolly Varden char, northern pike, and white sucker. DeForest et al. (2011) recently proposed an
egg/ovary Se guideline for fish of 20 µg/g, using a species sensitivity distribution (SSD) model
with most of the same data.
The US EPA estimated genus mean chronic values (GMCV) for Se based on EC10s for the four
most sensitive fish genera as Oncorhynchus (22.6 µg/g), Micropterus (20.4 µg/g), Lepomis (18.4
µg/g) and Salmo (17.8 µg/g) (C. Delos, pers. comm., US EPA, August 2011). The GMCVs for
Micropterus and Salmo were taken from single published values (see Table 8.13). The GMCVs
for Oncorhynchus were based on the geometric means of toxicity thresholds calculated from
Holm et al. (2005) and Rudolph et al.(2008), and the GMCVs for Lepomis were derived from
Doroshov et al. (1992), Hermanutz et al. (1996), and Coyle et al. (1993) (C. Delos, pers. comm.,
US EPA, August 2011).
The studies in Table 8.13 relate to fish species found in Canadian waters. However, much of this
literature represents laboratory studies conducted on field-collected gametes (i.e., Kennedy et al.
2000, Holm et al. 2005, deRosemond et al. 2005, Muscatello et al. 2006, Rudolph et al. 2008,
Elphick 2009, NewFields 2009, Nautilus Environmental and Interior Reforestation Co. Ltd.
2011) so are classified as unacceptable for guideline derivation. The basis for this classification
is that the exposure of wild adults was not measured and not consistent, therefore the gametes
represent variable exposure concentrations. In addition, adult females may have possibly been
exposed to and influenced by other co-contaminants. However, field studies provide valuable
information and were used as part of the weight of evidence in the derivation of the egg Se
176
guideline. Hermanutz et al. (1992), Coyle et al. (1993), Carolina Power and Light (1997), were
classified as primary literature since they were controlled laboratory feeding studies and met all
other criteria.
Hardy et al. (2010) conducted a two and a half year feeding trial using Yellowstone cutthroat
trout and calculated a NOEC of > 16.0 µg/g egg Se, for reproductive endpoints. Limitations of
the study included low number of replicates, high variability, Se doses insufficient to elicit a
clear toxic response, and high (19.5%) mortality in the control group in weeks 48-80. These
limitations resulted in Hardy et al. (2010) being classified as unacceptable for direct use in
guideline derivation.
The lowest Se egg tissue toxicity threshold based on the available primary EC10 estimates,
including those for species less common in BC, is 12.7 µg/g (8.5 – 19.0) for bluegill sunfish,
reported by Hermanutz et al. (1992, 1996) (based on reanalysis of this data by US EPA 2011b).
However, there is some uncertainty associated with this estimate since toxicity estimates
reported for this species by other researchers were higher; 16 to 24.6 µg/g egg Se. Developing a
guideline using data for the genus Oncorhynchus may be more representative of fish in BC, and
the EC10 data are slightly higher, more in line with other bluegill sunfish estimates. As depicted
in Figure 7.2, there is a fairly narrow range of egg Se toxicity thresholds for fish (17 – 24 µg/g).
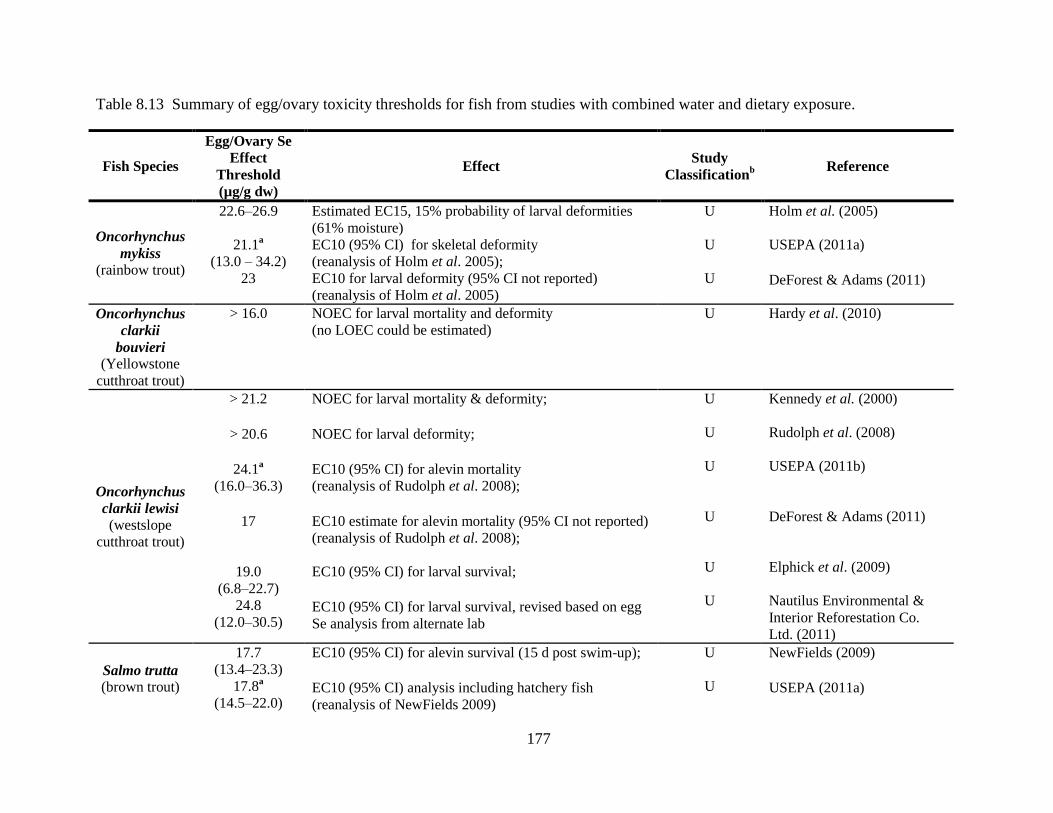
177
Table 8.13 Summary of egg/ovary toxicity thresholds for fish from studies with combined water and dietary exposure.
Fish Species
Egg/Ovary Se
Effect
Threshold (µg/g dw)
Effect Study
Classificationb
Reference
Oncorhynchus
mykiss
(rainbow trout)
22.6–26.9
21.1a
(13.0 – 34.2) 23
Estimated EC15, 15% probability of larval deformities
(61% moisture) EC10 (95% CI) for skeletal deformity
(reanalysis of Holm et al. 2005); EC10 for larval deformity (95% CI not reported)
(reanalysis of Holm et al. 2005)
U
U
U
Holm et al. (2005)
USEPA (2011a) DeForest & Adams (2011)
Oncorhynchus
clarkii
bouvieri (Yellowstone
cutthroat trout)
> 16.0 NOEC for larval mortality and deformity
(no LOEC could be estimated) U Hardy et al. (2010)
Oncorhynchus
clarkii lewisi
(westslope
cutthroat trout)
> 21.2
> 20.6
24.1
a (16.0–36.3)
17
19.0 (6.8–22.7)
24.8 (12.0–30.5)
NOEC for larval mortality & deformity; NOEC for larval deformity;
EC10 (95% CI) for alevin mortality
(reanalysis of Rudolph et al. 2008);
EC10 estimate for alevin mortality (95% CI not reported)
(reanalysis of Rudolph et al. 2008);
EC10 (95% CI) for larval survival; EC10 (95% CI) for larval survival, revised based on egg
Se analysis from alternate lab
U
U
U
U
U
U
Kennedy et al. (2000)
Rudolph et al. (2008)
USEPA (2011b)
DeForest & Adams (2011)
Elphick et al. (2009)
Nautilus Environmental &
Interior Reforestation Co.
Ltd. (2011)
Salmo trutta (brown trout)
17.7 (13.4–23.3)
17.8a
(14.5–22.0)
EC10 (95% CI) for alevin survival (15 d post swim-up); EC10 (95% CI) analysis including hatchery fish
(reanalysis of NewFields 2009)
U
U
NewFields (2009) USEPA (2011a)

178
Table 8.13 (con’t)
Fish Species
Egg/Ovary Se
Effect
Threshold (µg/g dw
Effect Study
Classification1
Reference
Salvelinus
fontinalis (brook trout)
>20
NOEC for larval fish (61% moisture) (reported as EC06 by DeForest and Adams 2011)
U° Holm et al. (2005)
Esox lucius (northern pike)
20.4 (11.1–29.7)
EC10 (95% CI) for larval deformity U Muscatello et al. (2006)
Catostomus
commersoni (white sucker)
25.6 EC12, mean Se concentration associated with 12% larval
deformity U° deRosemond et al. (2005)
Lepomis
macrochirus
(bluegill
sunfish)
3.9/21.1 (9.1)
20.12
(6.3–63.8)
16
12.72
(8.5–19.0)
24.62
(21.2–28.5)
NOEC/LOEC (geometric mean) for larval edema;
EC10 (95% CI) for larval edema
(reanalysis of Doroshov et al. 1992);
EC10 for larval edema
(reanalysis of Doroshov et al. 1992); EC10 (95% CI) for larval edema
(reanalysis of Hermanutz et al. 1992, 1996);
EC10 (95% CI) for larval survival
(reanalysis of Coyle et al. 1993)
1°
1°
1°
1°
1°
Doroshov et al. (1992)
USEPA (2011b)
DeForest and Adams (2011)
USEPA (2011b)
USEPA (2011b)
Micropterus
salmoides (largemouth
bass)
20.42
(13.8–30.1) EC10 (95% CI) for larval survival
(reanalysis of Carolina Power and Light 1997) 1° USEPA (2011b)
1Studies classified for guideline derivation as primary (1°), secondary (2°) or unacceptable (U).
2Denotes endpoints of the four most sensitive fish genus used by US EPA to derive their egg Se tissue criteria (not published), rounded to one significant
decimal.
179
Determining an appropriate uncertainty factor to apply to the lowest EC10 concentration, is a
balance between ensuring Se levels that meet nutritional needs while avoiding levels that may
cause adverse effects; this margin is very narrow. The minimum uncertainty factor of 2 results in
a value that meets the balance between adequacy and protection, while addressing the inherent
uncertainties in published toxicity threshold estimates.
The mean EC10 for rainbow trout (22.05 µg/g egg Se) of studies by Holm (2002) and Holm et
al. (2003, 2005) divided by an uncertainty factor of 2 results in a fish egg Se WQG of 11.03
µg/g. Applying an uncertainty factor of 2 to the mean of reported EC10s for westslope cutthroat
trout (21.97 µg/g), results in a guideline of 10.99 µg/g, and to the US EPA GMCV for
Oncorhynchus (22.56 µg/g), results in a value of 11.28 µg/g. These estimates converge around
11 µg/g Se, which supports this value as an egg/ovary Se guideline for BC.
EC10 estimates for other species common in Canada including rainbow trout, brook trout, brown
trout, northern pike, white sucker, bluegill sunfish, and largemouth bass, have EC10 egg Se
toxicity thresholds that range from 12.7 µg/g for bluegill sunfish, to 25.6 µg/g for white suckers
(Table 8.13). Although Se toxicity data is lacking for a broad cross-section of fish species, the
existing information indicates that 11 µg/g egg Se would be protective of the more sensitive fish
species until more data are available.
This proposed Se WQG for egg/ripe ovary Se may be compared with the reported confidence
intervals for some of the published EC10 estimates. The lower confidence intervals associated
with reproductive EC10 estimates for rainbow and cutthroat trout (Table 8.13), range between 13
and 16 µg/g egg/ovary Se, which are higher than a guideline value of 11 µg/g indicating the
guideline will be protective. Additionally, a guideline of 11 µg/g is within the US DOI (1998)
range of thresholds that represent a marginal risk of reproductive impairment in sensitive fish
species (7 – 13 µg/g egg/ovary Se).
The dose-response curve for Se is steep (Figure 7.3) which heightens the risk of effects to
populations at concentrations not much above individual EC10 levels. Models have been
developed to predict the population response based on established individual-level toxicity

180
thresholds (Van Kirk and Hill 2007; deBruyn 2009). deBruyn (2009) estimated the population-
level EC10 threshold for decline in westslope cutthroat trout to be approximately 28 µg/g egg Se,
which is only 3 to 5 µg/g Se greater than the individual-level fish EC10 egg toxicity threshold for
that species. The overlapping 95% confidence intervals for individual-level cutthroat trout EC10s
reported by US EPA (2011b) (CI = 16 – 36.3) and Nautilus Environmental and Interior
Reforestation Co. Ltd. (2011) (CI = 12.0 – 30.5), with the population effect threshold of 28 µg/g
is further demonstration of the rapid transition from individual- to population-level effects.
DeForest (2009) summarised background Se fish tissue data (egg, muscle and whole-body) but
stated there was some uncertainty in asserting that data used in the summary were all truly
“reference” and that some fish could represent mixed exposure. This uncertainty can also be the
case in fish captured in BC and other Canadian waters. Background fish tissue concentrations for
trout reported from reference sites in BC and Canadian waters are less than the 11 µg/g
egg/ovary guideline, even in areas with relatively high background Se. Egg Se tissue
concentrations for rainbow and brook trout in reference areas of studies published by Holm et al.
(2005) were below the egg Se guideline of 11 µg/g (8.96 ± 1.02 and 3.33 ± 0.26 µg/g,
respectively, Table 4.11). The same holds true for westslope cutthroat trout eggs sampled at sites
in BC (7.59 ± 3.79 µg/g, Table 4.11).
There are however, some exceptions where background fish egg Se concentrations are close to,
or slightly above the guideline. Since many fish species move extensively throughout a
watershed, dietary Se exposure can be varied and Se tissue concentrations may reflect movement
in and out of Se-contaminated areas. Fish captured in reference areas may not always represent
truly unexposed fish. Rudolph et al. (2008) compared two lentic areas in their study examining
toxicity thresholds for westslope cutthroat trout in the Elk River, BC. O’Rourke Lake, the
reference area, had egg Se tissue concentrations (12.3 to 16.8 µg/g dw) which overlapped with
those found at the exposed site, Clode Pond (11.8 to 140.0 µg/g dw). The egg concentrations in
O’Rourke Lake are not typical of an unexposed site and might be considered an anomaly given
that water concentrations of Se in the lake were less than the detection limit of 1.0 µg/L. Lentic
areas can be extremely sensitive to Se bioaccumulation which may account for the higher than
expected background. Adding to this, is the fact that O’Rourke Lake was stocked with westslope

181
cutthroat trout on three occasions between 1985 and 1992 (BC Environment, Fish and Wildlife
Branch internal files), and did not have any resident fish prior to the stocking program (Elkford
Rod and Gun Club 1984). Therefore, there is uncertainty in the use of data from this site as a
reflection of typical egg Se background in fish.
Minnow et al. (2007) reported mean egg Se concentrations in westslope cutthroat trout at lotic
and lentic reference sites collected between 1996 and 2006, were 6.5 µg/g at and 8.1 µg/g,
respectively. In this period, individual egg Se levels exceeded 11 µg/g on one occasion in 2006
(egg Se was 11.5 µg/g) at a lentic site at the Barnes Lake wetland site (Minnow et al. 2007).
However, sediment Se at Barnes Lake in 2002 was 2 µg/g, yet four years later it had nearly
doubled to a concentration of 3.9 µg/g (Minnow et al. 2007). This suggests that the site may not
be truly reference, or was receiving some anthropogenic source of Se. The investigators could
not rule out that females captured at reference sites may have been exposed to coal mining
influences due to their large home range (Minnow et al. 2007). This data underscores the
difficulty in accurately characterizing Se concentrations in organisms able to move in and out of
contaminated zones.
McDonald et al. (2010) conducted a study on Se toxicity in Dolly Varden char in north eastern
BC. They reported that mean Se egg concentrations at reference sites were between 5.4 and 11
µg/g. The egg Se concentrations at two of the three reference sites included in the study analysis
were 10.5 and 11.0 μg/g which are relatively high compared with unexposed fish from other
locations in BC. A reference clutch of eggs with 11 μg/g Se was removed from the analysis due
to its very low survival rate (3%), which suggests uncertainty as to whether these reference fish
with high egg Se may be been previously exposed.
The evaluation of background data suggests that at most reference sites a Se WQG of 11 µg/g
would not be exceeded. The guideline does acknowledge some background tissue Se
concentrations for some tissue types or species may be naturally elevated (e.g., sculpin). In areas
where true background fish tissue Se exceeds the guideline, and unexpected sources of Se have
been evaluated and ruled out, site-specific water quality objectives may be considered in
consultation with the BC MoE.
182
The chronic egg/ovary tissue guideline for the protection of fish is 11 µg/g, calculated as the
mean concentration of at least eight samples (eggs or ripe ovary from 8 individual females)
collected at a representative area (site), and reported as dry weight.
8.4.3.3 Whole-Body Tissue
A whole-body Se guideline is broadly applicable, and may be more appropriate for practical
reasons (USEPA 2004; DeForest and Adams 2011). For example, when investigating non-
reproductive effects of Se on early life-stage and juvenile fish, whole-body Se concentrations are
the most appropriate measure. In situations where juvenile or small-bodied fish species are of
interest, whole-body Se analysis may be the only option for monitoring. While whole-body Se
concentrations may not be the most direct measure of potential reproductive effects in adults, for
the reasons stated above, it has been retained as a guideline. The existing BC whole-body tissue
Se guideline of 4 µg/g (Nagpal and Howell 2001) was compared to reported data for both
reproductive and non-reproductive studies.
Selenium toxicity studies reporting thresholds as whole-body Se concentrations are presented in
Table 8.14. Of these, Hilton et al. (1980), Hamilton et al (1990) (only the 60-day results for
SeMet diet), Cleveland et al. (1993), Lemly (1993b), Coyle et al. (1993), Hermanutz et al.
(1996) and McIntyre et al. (2008) were all classified as primary literature. The studies by
Hodson et al. (1980) and Hunn et al. (1987) were primary and although they did not incorporate
a dietary exposure component, they were considered in guideline derivation. Hilton and Hodson
(1983) was considered primary but the authors reported toxicity thresholds measured as liver Se
concentrations which had to be converted to whole-body tissue residues (MATC adopted from
USEPA 2004). Two studies were deemed unacceptable; Vidal et al. (2005) and Hardy et al.
(2010) had higher than acceptable control mortality. Additionally, Hardy et al. (2010) was
unable to demonstrate a clear toxic response to Se at the dietary exposures used in their study.
There were uncertainties noted in some of the published whole-body toxicity thresholds for fish.
Vidal et al. (2005) studied the effects of Se on larval rainbow trout, and found a whole-body
toxicity threshold (LOEC) for reduced growth was < 4.8 µg/g Se37
. However, the reductions in
37
Conversion of wet weight to dry weight based on 75% moisture content.

183
growth at the highest dietary exposure were not statistically different than controls, and whole-
body Se concentrations were variable in test fish at 60 days and 90 days of exposure (DeForest et
al. 2006). Vidal et al. (2005) acknowledged that Se body burden decreased between 60 and 90
days and suggested it may have been caused by growth dilution.
Although Vidal et al. (2005) was classified as unacceptable for derivation of WQGs, their results
were consistent with many other primary studies (Hamilton et al. 1990 (60-day results for SeMet
diet); Hilton et al. 1980; Hilton and Hodson 1983; Lemly 1993b; Hunn et al. 1993; Cleveland et
al. 1993).
The lowest whole-body tissue Se thresholds for species relevant to BC were for Chinook salmon
and rainbow trout. The US EPA (2004) estimated a whole-body EC20 for skeletal deformity in
rainbow trout of 5.85 µg/g, using data from Holm (2002) and Holm et al. (2003). Of the studies
listed in Table 8.14, some of the lowest effect thresholds for salmonids are reported by Hamilton
et al. (1990), Hilton et al. (1980), and Vidal et al. (2005). Acknowledging the criticism from
DeForest et al. (1999; 2006), only the 60-day results for SeMet diet from the Hamilton et al.
(1990) study used for guideline derivation. Hilton et al. (1980) reported Se concentrations for
fish carcasses (minus organs) at the dietary exposure concentrations, so Se no-effect levels on a
whole-body basis would be expected to be higher.

184
Table 8.14 Summary of whole-body Se toxicity thresholds for reproductive and non-reproductive end points in fish, including studies
with dietary and water-only Se exposure.
Fish Species
Whole-body Se
effect threshold
(µg/g dw)
Effect
Study
Classification1
Reference
Oncorhynchus
tshawytscha (Chinook
salmon)
5.3/10.4
4.3 NOEC/LOEC for reduced juvenile growth (SeMet diet, 60-days)
EC10 for increased mortality on seawater challenge (smolts)
(reanalysis of Hamilton et al. 1990)
1°
1°
Hamilton et al. (1990)
DeForest and Adams (2011)
Oncorhynchus mykiss
(rainbow trout)
> 5
< 1.8
8
< 4.3
5.9
<4.8
NOEC for increased juvenile mortality (feeding study);
LOEC for reduced growth in juveniles (water-only exposure);
MATC for reduced juvenile growth (carcass [Se] equivalent to
whole-body, see USEPA (2004) methods);
LOEC for increased mortality in fry, (water-only exposure);
EC20 for craniofacial deformity (reanalysis of Holm et al. 2005);
LOEC for reduced larval growth (assuming 75% moisture)
1°
1°
1°
1°
U
U
Hilton et al. (1980)
Hodson et al. (1980)
Hilton and Hodson (1983)
Hunn et al. (1987)
USEPA (2004)
Vidal et al. (2005)
Oncorhynchus clarkii
lewisi (westslope
cutthroat trout)
11.72
(4.6 – 13.8)
13.82
(7.7 – 18.1)
EC10 (95% CI) for larval survival based on egg Se EC10 = 19 (6.8
– 22.7);
EC10 (95% CI) revised based on egg Se analysis from different lab
based on egg Se EC10 = 24.8 (12 – 30.5).
U
U
Elphick et al. (2009)
Nautilus Environmental &
Interior Reforestation (2011)
Oncorhynchus clarkii bouvieri (Yellowstone
cutthroat trout)
> 11.4 NOEC for larval mortality and deformity, no LOEC could be
estimated.
U Hardy et al. (2010)
Esox lucius (northern
pike) 9.46
Whole-body EC10 for larval deformity U Muscatello et al. 2006
Lepomis macrochirus
(bluegill sunfish)
<5.9
9.6
3.8/5.0
7/16
8
4.4/21.8
7.7
LOEC for reduced survival based on winter temp regime (4° C);
EC10 for increased mortality at winter temp regime (4° C);
NOEC/LOEC for increased mortality (water only exposure);
NOEC/LOEC reduced survival in larvae;
EC10 reduced larval survival;
NOEC/LOEC for larval edema;
EC10 for larval edema (reanalysis of Hermanutz et al. 1996)
1°
1°
1°
1°
1°
1°
1°
Lemly (1993b)
McIntyre et al. (2008)
Cleveland et al. (1993)
Coyle et al. (1993)
DeForest and Adams (2011)
Hermanutz et al. 1996
DeForest and Adams (2011)
1Studies classified for guideline derivation as primary (1°), secondary (2°) or unacceptable (U).
2See Appendix A for tissue conversions (random effects log-log regression model) used for deriving egg to whole-body Se estimates.

185
Research assessing toxic responses in fish from water-only exposures has shown that early life
stage and juvenile fish may be sensitive to Se when based on whole-body tissue accumulation
(Hodson et al. 1980; Hamilton and Wiedmeyer 1990; Cleveland et al. 1993). Some authors
exclude water-only Se exposure studies on juvenile fish when deriving toxicity thresholds,
stating those studies have limited relevance to natural Se exposure (i.e., lacking dietary exposure
component) (DeForest et al. 1999; USEPA 2004; deBruyn et al. 2008; DeForest 2008; DeForest
and Adams 2011). However, excluding such data has been criticized by other researchers who
state that this approach is selective and may result in erroneous conclusions (Skorupa 1999;
Hamilton 2003).
Despite this controversy regarding juvenile fish toxicity threshold predictions based on dietary
versus water-only exposures to Se, more recent studies have shown that physiological changes
can result when early life-stage and juvenile rainbow trout are exposed to waterborne Se (Palace
et al. 2004; Miller et al. 2007). Water sources of Se can contribute to toxicity and, since Se
residues in fish are the sum total of dietary and aqueous routes of exposure, water-only exposure
evaluations of Se should not be disregarded as irrelevant (Hamilton 2003; Janz et al. 2010).
Since water contributes at least in part to toxic responses in fish, water-only exposure studies
were considered in the derivation of the whole-body guideline.
Hodson et al. (1980) and Hunn et al. (1987) conducted studies using water-only Se exposures on
early life stages of rainbow trout. The results of Hodson et al. (1980) suggest a whole-body Se
toxicity threshold of < 1.8 µg/g, which was the reported LOEC for reduced growth in juveniles
after a 44-week exposure at the highest experimental dose of 53 µg/L. Hodson et al. (1980)
reported effects at lower experimental doses for other endpoints such as decreased calcium in
bone (12 µg/L), reduced median time to hatch (16 µg/L) and reduced survival of eyed eggs (26
and 47 µg/L exposure groups), but did not report the associated whole-body Se residues for these
exposure groups. Hunn et al. (1987) reported a LOEC for increased mortality in fry of < 4.3 µg/g
after a 90-day exposures ≥ 47µg/L Se. Hilton et al. (1980) conducted laboratory feeding studies
on juvenile rainbow trout and found increased mortalities evident at body burdens in excess of 5
µg/g. Although some of these studies did not include dietary exposures, they suggest that a
whole-body tissue Se guideline of 4 µg/g may only marginally protect sensitive life stages of

186
fish. More research is needed to establish a more precise estimate of the toxicity thresholds for
early life stage and juvenile rainbow trout and other sensitive fish species.
There are uncertainties regarding some of the published whole-body toxicity thresholds for fish.
Vidal et al. (2005) studied the effects of Se on larval rainbow trout, and found a whole-body
toxicity threshold (LOEC) for reduced growth was < 4.8 µg/g Se38
. DeForest et al. (2006)
expressed concern regarding the variability in the concentration-response relationship reported
by Vidal et al. (2005). DeForest (2008) pointed out the uncertainty in determining non-
reproductive effects on naive larval or juvenile stages of fish (e.g., Hilton et al. 1980, Hilton and
Hodson 1983, Hamilton et al. 1990, Vidal et al. 2005) and questioned whether some studies
represented realistic environmental exposure conditions and responses.
Based on toxicity data for several fish species, DeForest and Adams (2011) proposed a whole-
body Se tissue EC10 of 8.1 µg/g using a species sensitivity distribution (SSD) approach. The
authors noted however, that the whole-body Se EC10 estimate reported for Chinook salmon is
4.3 µg/g (Hamilton et al. 1990), suggesting this species may have a much lower Se threshold for
juvenile mortality. Based on the work of Hamilton et al. (1990), Hilton et al. (1980), Hunn et al.
(1987) and Vidal et al. (2005), the general whole-body Se EC10 of 8.1 µg/g proposed by
DeForest and Adams (2011), if adopted as a guideline, would not protect the most sensitive
species, such as Chinook juveniles and rainbow trout. Following BC’s protocol for deriving
guidelines, an uncertainty factor would need to be applied to DeForest and Adams’s (2011)
EC10 of 8.1 µg/g. Applying the minimum uncertainty factor of 2 results in a whole-body Se
tissue guideline of 4 µg/g. Although this is only slightly below the EC10 estimate reported for
Chinook salmon, given the uncertainties of the Hamilton et al. (1990) study, the weight of
evidence continues to support a WQG of 4 µg/g to protect the majority of sensitive species and
life stages.
Other published evaluations of salmonid data suggest whole-body Se toxicity thresholds lower
than that recommended by DeForest and Adams (2011). Van Kirk and Hill (2007) modelled
cutthroat trout population-level response based on several studies reporting individual-level
38
Conversion of wet weight to dry weight based on 75% moisture content.

187
responses to Se exposure based on whole-body tissue residues, many of which were primary
literature. Through modelling, the authors determined that population-level response thresholds
may be lower than predicted for individual toxicity thresholds due to density-dependent factors
and the unpredictable spatial and temporal natural environmental conditions. The authors
suggested that cutthroat trout populations would be protected at whole-body Se concentrations
less than 7.0 µg/g (Van Kirk and Hill 2007). In a subsequent publication, Gledhill and Van Kirk
(2011) modelled the effects of Se exposure on long-term effects to population size in bluegill
sunfish, hoping to refine and expand the usefulness of the model. Their model showed that at a
whole-body Se concentration of 4 µg/g, the predicted mean mortality response was 9.54% with a
95% prediction range of 0.65 to 63.13%. They stated that while the population-level response
would be small at a mean individual-level response of 10%, if the first-year survival rate is low,
equilibrium population sizes may be near or below 50% of carrying capacity when whole-body
Se concentrations are 4 µg/g. The authors concluded that their model supports a whole-body Se
threshold for fish of 4 µg/g.
Background whole-body Se concentrations from monitoring data collected across Canada were
compared to the current guideline. Whole-body tissue residues at reference sites, even in areas of
high Se geology, are typically less than the 4 µg/g guideline (refer to Table 4.11 and 4.12). There
are exceptions in some fish species at reference locations where geological Se is naturally
elevated or in environments where Se accumulation is enhanced. An example of this is in north
eastern BC where whole-body sculpin tissue Se concentrations at some reference sites slightly
exceeded 4 µg/g (Carmichael and Chapman 2006). However, sculpin may be an exception to
typical background Se whole-body tissues found in other species. Data collected in reference
areas in the Flathead River BC, also had relatively high mean whole-body Se concentrations
(7.04 µg/g) for slimy sculpin (Henderson and Fisher 2012). Little is known about the toxicity
effect thresholds for sculpin.
In 2004, at Blind Creek in northern BC, whole-body rainbow trout tissues were collected prior to
coal mining activities where average tissue Se concentrations were 3.37 µg/g, (Golder Associates
Ltd. 2009). Baseline data collected in 2010 for the proposed Chu Molybdenum Mine south of
Vanderhoof, BC (not in Table 4.11) demonstrated that mean whole-body tissue Se for rainbow
188
trout was 2.9 (± 1.78) µg/g (data submitted by Warren Robb, TTM Resources, Vancouver, BC).
However, at two of the 13 monitoring sites, mean Se tissue concentrations were over 4 µg/g
(4.55 ± 0.78 and 8.18 ± 0.75 µg/g Se). This suggests that a whole-body Se guideline of 4 µg/g is
within background Se tissue concentrations for a majority of sites, with only some exceptions.
The whole-body Se tissue guideline was also compared to data for alternate tissue types (egg
and/or muscle) using published conversion relationships. Several years of monitoring westslope
cutthroat trout in the Elk Valley, BC, has resulted in the development of fairly robust
relationships between Se tissue concentrations for different tissue types (egg, muscle, and
calculated whole-body) (Minnow et al. 2007; Schwarz 2011). Tissue conversion models can be
helpful, particularly where data do not exist for a specific tissue type. However, since model
uncertainty cannot be eliminated, caution should be exercised when using Se threshold or
guideline concentrations for one tissue type to estimate Se values in other tissue types. Using a
random effects log-log tissue regression to translate an egg Se guideline of 11 µg/g (based on
reproductive endpoints), to whole-body and muscle tissue concentrations, the values become 7.1
and 6.5 µg/g, respectively (Schwarz 2011).
The translations of toxicity thresholds from egg to whole-body (and muscle) might suggest there
could be some upward adjustment of a whole-body (and muscle) guideline to approximately 6
µg/g. However, this translation does not take into consideration model uncertainties and may not
account for possible differences in toxicity related to maternal transfer of Se versus those from
direct dietary and waterborne exposure to early life stages and juvenile fish. As well, there are
several reported toxicity thresholds for sensitive species that are below 6 µg/g.
The toxicity studies discussed above on juvenile rainbow trout (Vidal et al. 2005; Hilton et al.
1980; Hilton and Hodson 1983) and Chinook salmon (Hamilton et al. 1990) report very low
whole-body thresholds. These low whole-body EC10 thresholds suggests that 4 µg/g Se in
whole-body tissue would protect sensitive fish species and life stages. A whole-body guideline of
4 µg/g is consistent with recommendations in Presser et al. (2004), who suggested that whole-
body Se concentrations between 4 to 6 µg/g represents marginal risk of harmful effects to fish.
Ohlendorf et al. (2011) state that negative effects are known to occur at whole-body
concentrations in fish as low as 4 to 6 µg/g. Lemly (1996a) recommended 4 µg/g Se in whole-

189
body tissue as an effect threshold for fish. An uncertainty factor was applied in the original
whole-body fish tissue Se WQG published by Nagpal and Howell (2001) so no additional
uncertainty factor is necesary. In some cases, background whole-body concentrations in fish may
exceed 4 µg/g Se, and development of a site-specific or species-specific objective may be
considered in consultation with BC MoE.
The chronic whole-body tissue guideline for the protection of fish is 4 µg/g calculated as the
mean concentration of at least eight tissue samples collected at a representative area and
reported as dry weight.
8.4.3.4 Muscle Tissue
Muscle tissue has been used to evaluate the exposure of fish to Se as an alternative to egg and
whole-body analysis, though it may not be the most direct measure of toxic response (Waddell
and May 1995; deBruyn et al. 2008). Muscle can be a reasonable and useful surrogate,
particularly if reliable species-specific tissue relationships have been developed (deBruyn et al.
2008) such as those for westslope cutthroat trout in the Elk River BC (Minnow et al.2007) and
for rainbow trout in Alberta (Holm et al. 2005).
Toxicity thresholds relating specifically to muscle tissue residues are limited and rarely consider
species native to BC (Table 8.15). These include striped bass (Coughlan and Velte 1989), and
bluegill sunfish (Finley 1985; Hermanutz et al. 1992, 1996). Coughlan and Velte (1989)
determined a muscle Se LOEC of < 15.2 µg/g in striped bass for effects which included
increased mortality, reduced growth and condition factor, as well as changes in behaviour (food
avoidance) and histopathology in liver and kidney tissue. Hermanutz et al. (1992) exposed
bluegill to 10 and 30 µg/L in outdoor stream mesocosms and observed reduced hatching and
larval survival as well as increased larval deformity at muscle Se concentrations of 7.2 and 11.2
µg/g, respectively. In a related study, Hermanutz et al. (1996) used stream mesocosms to expose
bluegill sunfish to 2.5 and 10 µg/L. In this study, larval deformities were significantly higher in
the 2.5 and 10 µg/L treatments than in the controls with a resulting LOEC of approximately 4
µg/g mean muscle tissue Se. Finley (1985) found increased mortality in adult bluegill sunfish fed
a diet of Se-contaminated mayfly nymphs from Belews Lake (13.6 µg/g Se) which was
associated with muscle Se concentrations of 20 to 32 µg/g (assuming 75% moisture). Of the
190
studies mentioned, only the two studies by Hermanutz et al. (1992, 1996) were classified as
“primary” for the purpose of guideline derivation. Coughlan and Velte (1989) used a diet
augmented with fish from Belews Lake, which may have contained co-contaminants so was
deemed unacceptable. Similarly, Findley (1985) was deemed unacceptable as a result of the
exposure diet containing mayfly nymphs from Belews Lake (possible co-contaminants) and poor
test replication.
Other studies in Table 8.15 provide supporting evidence for a fish tissue guideline based on
muscle Se concentrations. Holm et al. (2005) found that in rainbow trout, mean egg Se
concentrations were 7-fold higher than mean muscle Se (reported as wet weight concentrations).
Using this simple relationship, the reported egg-based toxicity threshold (EC15 of 8.8 to 10.5
µg/g egg Se, wet weight) for larval deformity in rainbow trout is calculated to be 5 to 6 µg/g (dry
weight, assuming 75% moisture) in muscle tissue (Holm et al. 2005)39
. Presser and Luoma
(2006) published a rainbow trout Se toxicity threshold for muscle of 4.3 µg/g based on
converting the ovary threshold reported by Holm et al. (2003) to a muscle tissue value. This
value was also cited by Ohlendorf et al. (2008; 2011, supplemental data). This provides
additional supporting evidence for a Se guideline of 4 µg/g in fish muscle tissue.
The Se egg to whole body translation for rainbow trout (Schwarz 2011) is based on data from
Holm et al. (2005), Casey and Siwik (2000), and Mackay (2006). The random effects log-log
regressions in Schwarz (2011) for rainbow trout were used to translate egg to muscle toxicity
thresholds reported by Holm et al. (2005). Based on egg tissue EC15s for skeletal deformity
(22.6 to 29.6 µg/g, Table 8.13), the resulting range of muscle tissue thresholds using the random
effects model, was 7.2 to 9.4 µg/g. Translating the US EPA (2011a) estimate of an egg EC10 for
rainbow trout larval deformity reported by Holm et al. (2005) the resulting muscle EC10 (95%
CI) was 6.7 (4.1 – 10.9) µg/g (Table 8.15). While there was some variability in translated
estimates for rainbow trout muscle tissue toxicity thresholds, the low range was from 4.3 to 7.2
µg/g, which supports a muscle guideline for fish being slightly lower than that, at 4 µg/g Se.
39
The reported EC15 range of 8.8 to 10.5 µg/g egg Se wet weight, was divided by seven to yield the corresponding
Se effect threshold range for muscle (1.25 to 1.5 µg/g wet weight). This was then converted to dry weight using 75%
moisture content.

191
Other researchers have relied on existing literature or species-specific tissue relationships
developed during their studies or through monitoring programs to translate thresholds from one
tissue type to another. For example, Muscatello et al. (2006) reported a muscle tissue EC10 (95%
CI) for larval deformity in northern pike of 13.85 µg/g Se (3.54 – 24.16 µg/g) which was
converted from an egg Se concentration estimate using the US EPA’s (2004) tissue conversion
equations. Using the random effects regression in Schwarz (2011), the conversion from muscle
to egg EC10 (95% CI) for pike deformity was 11.5 µg/g (5.9 – 17.3 µg/g) (Table 8.15). For
brown trout, a Se-sensitive species, NewFields (2009) reported an egg EC10 (95% CI) for alevin
survival of 17.7 µg/g Se (13.4 – 23.3 µg/g). This was converted to a muscle Se estimate using the
random effects regression, for an EC10 of 4.3 µg/g Se (4.0 – 4.7 µg/g) (Table 8.15).
The proposed egg Se guideline of 11 µg/g was converted to a muscle concentration for two
sensitive BC species, rainbow and cutthroat trout using the species-specific regressions in
Schwarz (2011), resulting Se residue estimates of 3.5 and 6.5 µg/g Se, respectively. The
evaluation of the low toxicity thresholds based on muscle in Chinook salmon (Hamilton et al.
1990), brown trout (NewFields 2009), rainbow trout (Holm et al. 2005) and westslope cutthroat
trout (Rudolph et al. 2008) all support a muscle guideline of 4 µg/g Se.
Muscle Se residue data from reference sites in BC and Alberta demonstrates that for many areas
and fish species, muscle Se concentrations are less than 4 µg/g, with a few exceptions (see Table
4.12). Data collected in 2009 in the Elk Valley, BC, showed that westslope cutthroat trout at one
reference lake site (Elk Lake) had a mean (SD) muscle tissue Se concentration of 2.98 (± 0.78)
µg/g, n=4 (Minnow et al. 2011). Data collected by MoE staff in 2006 on the Flathead River, an
adjacent watershed to the Elk, showed that mean (SD) concentrations of Se in whole-body
samples of westslope cutthroat trout were 1.29 (± 0.28) µg/g, n=20 (Henderson and Fisher 2012).

192
Table 8.15 Summary of toxicity thresholds based on muscle selenium concentrations for various fish species.
Fish Species
Muscle Se Effect
Threshold
(µg/g dw)
Effect
Study
Classification1 Reference
Oncorhynchus
mykiss (rainbow
trout)
4.6 – 7.2
7.2 – 9.42
6.662
(4.08 – 10.86)
4.3
EC15 for larval deformity based on 7-fold increase from muscle to egg
Se;
EC15 for larval deformity translated to muscle using random effects
conversion model;
EC10 (95% CI) estimate converted from egg to muscle Se based on
reanalysis of Holm et al.(2005);
Muscle translation of egg toxicity threshold from Holm et al. (2005)
U
U
U
Holm et al. (2005)
USEPA (2004)
Presser and Luoma (2006)
Ohlendorf et al. (2008, 2011)
Oncorhynchus
clarkii lewisi
(westslope
cutthroat trout)
> 11.572
> 11.09
13.01
(9.1 – 18.6)
9.57
10.552
(4.3 – 12.3)
13.342
(7.1 – 16.0)
NOEC for larval mortality & deformity;
NOAC for larval deformity;
EC10 (95% CI) for alevin mortality (reanalysis of Rudolph et al 2008);
EC10 estimate for alevin mortality (reanalysis of Rudolph et al. 2008);
Muscle EC10 (95% CI) larval survival, random effects model
conversion;
Muscle EC10 (95% CI) revised based on egg Se analysis from different
lab , random effects model conversion.
U
U
U
U
U
U
Kennedy et al. 2000
Rudolph et al. 2008
USEPA 2011a
DeForest and Adams (2011)
Elphick et al. (2009)
Nautilus Environmental and Interior
Reforestation Co. Ltd. (2011)
Salmo trutta (brown trout)
4.322
(3.99 – 4.68)
EC10 (95% CI) for alevin survival (15 d post swim-up); U NewFields (2009)
Oncorhynchus
clarkii bouvieri (Yellowstone
cutthroat trout)
> 11.37 NOEC for larval mortality and deformity, no LOEC could be estimated
(reproductive)
U Hardy et al. (2010)
Esox lucius (northern pike)
11.512
(5.9 – 17.3)
Muscle EC10 (95% CI) for larval deformity based on reported egg Se U Muscatello et al. (2006)
Lepomis
macrochirus
(bluegill sunfish)
< 11.2
4
20
LOEC for reduced hatching & larval survival & increased larval
deformity;
LOEC for larval abnormalities;
LOEC for increased mortality in adult fish
1°
1°
U
Hermanutz et al. (1992)
Hermanutz et al. (1996)
Finley (1985) 1Studies classified for guideline derivation as primary (1°), secondary (2°) or unacceptable (U).
2See Appendix A (Schwarz (2011) for tissue conversion using the random effects log-log regression model for egg to muscle Se translation.

193
Lotic reference site data can also present challenges when comparing tissue concentrations to
guidelines. Due to the broad home range of species like westslope cutthroat trout, lotic reference
sites in the Elk Valley and elsewhere may have resident fish which have foraged in Se-
contaminated areas, confounding the conclusions regarding background tissue Se concentrations
(Minnow et al. 2007; DeForest 2009; Minnow et al. 2011). Therefore, caution must be exercised
if reference area tissue concentrations are unexpectedly high relative to other reference values or
in excess of the guideline.
Holm et al. (2005) found that mean muscle Se in rainbow trout from reference sites at Deerlick
Creek in Alberta, was 2.27 µg/g, assuming 78 % moisture content. In other studies conducted
between 1999 and 2001 in southern Alberta, rainbow trout at a lentic reference site (Fairfax
Lake) was 0.61 µg/g, assuming 75% moisture (Mackay 2006). In that same study, lotic reference
muscle tissue concentrations for rainbow trout were 2.8, 3.7, 3.8 and 3.5 µg/g Se for Wampus,
Whitehorse, MacKenzie, and Muskeg watersheds, respectively (Mackay 2006). These
background muscle Se concentrations at sites within the coal geology, are all below 4 µg/g.
Based on the low effect concentrations for rainbow trout, brown trout and bluegill sunfish, 4
µg/g in fish muscle tissue is the recommended guideline for sensitive species (e.g., rainbow
trout, westslope cutthroat trout), or fish species for which there are no toxicity data. This is an
interim guideline since there remains some uncertainty in the estimates and little primary toxicity
data directly linking effects to muscle tissue concentrations. Since we assume that whole-body
and muscle Se concentrations in fish are approximately the same, and an uncertainty factor was
previously applied to whole-body guidelines, an additional uncertainty factor was not applied to
the interim muscle tissue guideline. In regions where natural background fish muscle tissue Se
exceeds the guideline consideration of unexpected Se sources may be warranted to evaluate the
need to develop site-specific water quality objectives.
The interim muscle tissue Se guideline for the protection of fish is 4 µg/g, calculated as the
mean of at least eight tissue samples from individual fish collected at a representative area,
and reported as dry weight.

194
8.5 Guidelines for the Protection of Wildlife
The previous wildlife guideline developed for BC used birds as the surrogate to represent all
sensitive wildlife (amphibians, reptiles), excluding fish and aquatic life (Nagpal and Howell
2001). The 2001 guidelines included a water-based maximum concentration of 4 µg/L, as well as
an alert concentration for Se in bird eggs of 7 µg/g (Nagpal and Howell 2001). Since dietary
accumulation at the base of the food web is the critical link to body burden in higher trophic
levels, the aquatic life guideline (2 µg/L) for the water column has also been adopted for the
protection of wildlife.
The previous bird egg tissue guideline of 7 µg/g was reviewed in light of more recent toxicity
studies. Unfortunately, toxicity data on amphibians and reptiles is still limited (Section 7.4.3.7).
There are studies that suggest effects may be occurring, but the results fall short of defining a Se
concentration-response relationship that would allow for comparison with fish or birds (Janz et
al. 2010; Hopkins et al. 2004; Minnow 2006). For example, Hopkins et al. (2004) conducted a
laboratory study on brown house snakes (Lamphrophis fuliginosus), and were able to conclude
that snakes readily transferred dietary Se to kidney, liver, ovary, and egg tissues, but no
significant differences were found in survival, food consumption, growth, body condition, or
reproductive activity in female snakes. They did find that female snakes fed 20 µg/g of dietary
Se on average were less likely to reproduce, had fewer eggs, and lower total egg mass than
control snakes, but the differences were not significant due to high variability in the reproductive
output among all females (Hopkins et al. 2004). The mean (± 1 SE) Se concentration in snake
eggs associated with the highest dietary treatment was 22.65 (± 0.49), exceeding embryotoxicity
thresholds for birds and suggesting that birds are comparatively more sensitive (Hopkins et al.
2004). Similarly, Minnow (2006) conducted a study on Columbia spotted frog from the Elk
Valley, BC, but failed to conclusively link effects with Se exposure from coal mining activities.
There are also toxicological studies on aquatic-dependent mammals or other small mammal
species exposed to Se contamination, yet concentration-response relationships with Se have not
been established for mammalian wildlife. However, the studies to date suggest that aquatic-
dependant mammals may be less sensitive to Se than are fish or birds (Janz et al. 2010).
Ohlendorf et al. (1989) found that of the wildlife species evaluated at Kesterson Reservoir,

195
aquatic birds had the most frequent and extreme signs of Se toxicity, while small mammals
showed almost none. One explanation may be due to the much wider margin between essential
and toxic doses of Se in mammals compared with fish and birds (Janz et al. 2010). Since birds
are known to be more sensitive to chronic Se effects, the updated wildlife guideline was
developed using bird data as a surrogate for all wildlife species.
The CCME protocol for deriving tissue residue guidelines for wildlife calls for the calculation of
tolerable daily intake to be applied to the highest known trophic level at which the most sensitive
species of aquatic-dependent wildlife feeds (CCME 1998). The consideration of diet specifically
for birds was incorporated into the interim dietary tissue guideline recommended for BC of 4
µg/g Se (see Section 8.4.3.1). However, for a more direct estimate of the potential for Se
toxicity, most researchers recommend the use of bird egg analysis (Skorupa 1998; Adams et al.
1998; Ohlendorf and Heinz 2011; Table 8.16). Therefore, rather than establish a guideline for
total daily intake of Se in sensitive birds as per the CCME (1998) protocol, mean egg Se
concentration for birds was selected for guideline development. The Science Panel developing a
site-specific Se standard for the Great Salt Lake agreed that diet and egg Se concentrations in
birds would best serve as the basis for a water quality standard (Ohlendorf et al. 2009). This and
the lack of toxicity data for other wildlife (amphibians, reptiles, and mammals), supports the bird
egg guideline approach for wildlife that BC has chosen.
Some investigators have suggested that the intra-specific variability in bird egg Se concentrations
is low (Heinz et al. 1987) while others have shown that in some species, the maternal transfer of
Se to eggs may be highly variable, even within the same clutch (Bryan et al. 2003). Studies on
common grackles (Quiscalus quiscala), where whole clutches of eggs were collected in nests
from reference areas and at coal ash settling basins, found high inter- and intra-clutch variation in
mean egg Se concentrations (Bryan et al. 2003). However, the variation in Se concentrations in
clutches from reference areas were much lower (coefficient of variation 7.9 – 18.9 %) than in
exposed areas (coefficient of variation 10.8 – 34.8 %), which was likely a reflection of the
variation in dietary Se concentrations (Bryan et al. 2003).

196
Weech et al. (2011) conducted studies on birds nesting near a uranium mill in northern
Saskatchewan and also found that intra-clutch egg Se was highly variable in mallard ducks (Anas
platyrhychos) and tree swallows (Tachycineta bicolour). These studies suggest that a single
random egg sampled from a nest in higher Se-exposed areas may not be truly representative of
Se in all eggs from the same clutch. While these studies may add some level of uncertainty to the
estimates of toxic thresholds, most bird surveys adopt a design in which one random egg per nest
is collected thereby reducing to some degree any bias in the Se estimates (Skorupa 1998; Seiler
et al. 2003). With adequate sample sizes, a strictly random selection of a single egg from any
given clutch, along with an appropriate study design and statistical analysis, can address
potential biases (Dr. C. Schwarz, pers. comm., Simon Fraser University, Sept 2011). All things
considered, bird egg Se is still the most direct measure of embryotoxicity in birds (Ohlendorf
2003). Liver Se concentrations in birds may also provide a reasonably good estimate of Se
exposure (Ohlendorf and Heinz 2011; Table 7.11).
Since the Se poisoning of birds that occurred at Kesterson National Wildlife Refuge in
California, a great deal of knowledge has been gained about the effects of Se on birds (Ohlendorf
and Heinz 2011). There is a similar range of variability in the sensitivity of bird species to Se, as
has been shown in fish (Ohlendorf et al. 1986). Domestic poultry are thought to be among the
most sensitive birds (Puls 1994), but much information exists on wild species, on which many
toxicity threshold estimates have been based (Table 7.11, Table 8.16).

197
Table 8.16 Toxicity thresholds for various bird species based on mean egg selenium concentrations (µg/g dw).
Bird Species Mean Egg Se
Effect Threshold (µg/g dw)
Effect Study
Classification1 Reference
Anas platyrhychos (mallard duck)
≥ 16.67
12 - 16
12
(6.4 - 16)
11.5
(9.7 – 13.6)
23
7.7
Increased likelihood of reproductive impairment (70%
moisture content);
EC10 for duckling mortality based on 6 studies, various
statistical approaches;
EC10 (95% CI) for egg hatchability based on 6 studies,
logistic regression;
EC10 (95% CI) for duckling mortality;
EC10 for teratogenic effects ;
EC10 egg hatchability reanalysis of one study biphasic
model regression;
1°
1°
1°
1°
-
1°
Heinz et al. (1989)
Adams et al. (2003)
Ohlendorf (2003)
Ohlendorf (2007)
USDOI (1998)
Beckon et al. (2008)
Actitis macularia
(spotted sandpiper)
7.3
(± SE 0.43)
Significant (15%) reduction in hatchability &
significantly higher (approximately double) MES at
exposed sites compared to reference.
2° Harding et al. (2005)
Cinclus mexicanus (American dipper)
8.4
(± SE 0.44)
15% depression in egg viability at the exposed site,
although there was no significant difference in MES or
hatchability due to low sample sizes
2° Harding et al. (2005)
Himantopus
mexicanus (black-
necked stilt)
14
6-7
EC11.8 for reduced hatchability based on meta-analysis
of data;
EC03 egg viability, corrected for background;
2°
2°
Ohlendorf et al. (2011)
Skorupa (1999); USDOI
(1998)
Agelaius
phoneniceus (red-
winged blackbird)
22 Approximate effects threshold for hatchability based on
mean egg Se at exposed sites.
2° Harding (2008)
Multiple bird species
(data synthesis)
12
6
Threshold for reproductive effects based on field and lab
studies, not necessarily a safe concentration;
Bird egg Se guideline for evaluating toxic response in
NIWQP
2°
2°
Heinz (1996)
Seiler et al. (2003)
1Studies classified for guideline derivation as primary (1°), secondary (2°) or unacceptable (U).

198
Ohlendorf et al. (1986) plotted the frequency of embryonic mortality and deformity in chicks of
several species of aquatic birds nesting in the Kesterson Wildlife Refuge, which were grouped
into coots, ducks, stilts and grebes. Although there was no statistical analysis, it was apparent
that coots and grebes had the highest percentages of mortality and deformity so were thought to
be highly sensitive to the effects of Se contamination, while ducks and stilts were considered to
be less sensitive (Ohlendorf et al. 1986). Studies conducted in the Elk Valley BC, on American
dippers and spotted sandpipers suggest that sandpipers are more sensitive than dippers to the
chronic effects of Se (Harding et al. 2005). Red-winged blackbirds may be slightly more Se
tolerant than both dippers and sandpipers (Harding 2008).
There has been much debate over the last decade concerning an appropriate avian egg Se toxicity
threshold (Skorupa 1998; Fairbrother et al. 1999, 2000; Skorupa 1999; Adams et al. 2003;
Ohlendorf 2003, 2007; Presser and Luoma 2006; Beckon et al. 2007; Ohlendorf and Heinz
2011). A general agreement among researchers is that hatchability is a more sensitive endpoint
for Se toxicity than is deformity – reductions in hatchability will be evident in birds at lower egg
Se concentrations than would be the case for deformities (Skorupa 1999; Ohlendorf 2003; Janz et
al. 2010). For some species, such as American kestrel, fertility may be a more sensitive endpoint
than hatchability (Santolo et al. 1999). Skorupa (1998) suggested a bird egg toxicity threshold
between 6 and 7 µg/g Se based on data for black-necked stilt.
Toxicological studies on mallard ducks, thought to be one of the more sensitive bird species,
have provided a good starting point for development of a guideline for wildlife based on bird
toxicity (Fairbrother et al. 1999; Skorupa 1999; Fairbrother et al. 2000; Ohlendorf 2003;
Ohlendorf 2007; Ohlendorf and Heinz 2011; Ohlendorf et al. 2011;Table 8.16). Mallard duck
studies were assessed using CCME’s guidance on evaluation of toxicological data and were
deemed acceptable for derivation of a BC guideline (CCME 1998).
Fairbrother et al. (1999) re-analysed data from two mallard studies (Heinz et al. 1989 and
Stanley et al. 1996), estimating an EC10 for duckling mortality of 16 µg/g egg Se – a much
higher estimate than the 6 – 7 µg/g Se previously proposed by Skorupa (1998). This EC10
estimate was criticized for not including important data, using incompatible response endpoints,

199
and not evaluating the more sensitive endpoint of egg viability (Skorupa 1999). Fairbrother et al.
(2000) responded to this criticism. Subsequently, Ohlendorf (2003) calculated an EC10 of 12.5
µg/g for egg hatchability based on data generated from six lab studies on mallard ducks.
Seiler et al. (2003) stated that an EC10 of 12.5 μg/g egg selenium (with 95% confidence
boundaries of 6.4 to 16.5 μg/g) may be appropriate as a high-risk Se exposure level. A more
conservative 6 μg/g egg Se, which was the approximate lower confidence limit, was used in their
assessment as the toxicity benchmark for evaluating Se concentrations in eggs (Seiler et al.
2003). Their rationale was related to the applicable federal wildlife laws (such as the US
Migratory Bird Treaty Act and Endangered Species Act) which do not allow any foreseeable,
human-caused mortality of protected populations (Seiler et al. 2003).
As part of the development of a Se water quality standard for the Great Salt Lake, the mallard
egg Se threshold was re-examined by a panel of experts (Ohlendorf et al. 2007). The Utah Water
Quality Board, and Utah Department of Environmental Quality (DEQ), finally adopted the site-
specific water quality criterion of 12.5 µg/g egg Se for the Great Salt Lake, which was approved
by the US EPA (USEPA 2011a). However, to be more protective, the Utah Water Quality Board
and Utah DEQ, incorporated a series of bird egg Se thresholds in Footnote (14), which used
lower egg Se thresholds as triggers for management action (USEPA 2011a). The trigger values
in Footnote (14) commence at egg Se concentrations of 5.0 µg/g, with increasing regulatory
action at 6.4 and 9.8 µg/g trigger values (USEPA 2011a, see Table 8.5 for summary of trigger
points/ actions).
Ohlendorf and Skorupa (1991) reviewed available avian egg Se data and determined a
background concentration of about 3 µg/g. Bird egg Se is typically close to 3 µg/g concentrations
in reference areas; where local geology is high in Se, the concentrations are usually 6 µg/g or
less (Table 4.13). Caution should be exercised when verifying reference areas and interpreting
data that appear to be anomalously high, since birds or their prey may forage in Se-exposed
areas, elevating their dietary intake and resulting egg tissue residues (Ohlendorf et al. 2011).
200
Comparing several bird studies conducted in the Elk Valley, BC, one species stands out. Harding
et al. (2005) suggested that spotted sandpipers may be a particularly sensitive species to Se
toxicity, based on their study which showed a significant 14% reduction in hatchability
(compared to referenence) at a mean egg Se concentration of 7.3 µg/g. The number of failed
eggs at the exposed sites were three time higher than at reference site. However, the number of
eggs per clutch, showed no significant reduction at exposed sites, likely because the sample size
was too small (Harding et al. 2005).
Beckon et al. (2008) re-analysed mallard data from Heinz et al. (1989), comparing a standard
monotonic log-logistic regression model of the EC10 for mallard hatchability with two
alternative biphasic regression models describing a hormetic dose-response effect. A wide range
of EC10 estimates were generated; the standard log-logistic estimate was 28.6 µg/g, and the two
biphasic log-logistic models were 7.3 and 3.4 µg/g. Beckon et al. (2008) cautioned that a
biphasic dose-response model is not always the best representation of the potential effect but that
this comparison demonstrated that for some effects, such as hatchability, a biphasic model may
describe the response variable more accurately and yield a more protective EC10. The authors
suggested the EC10 of 7.3 µg/g, generated by one of the two biphasic models, provided a more
moderate estimate and best described the data. While hormetic dose-response relationships have
been identified (Harding 2008; Beckon et al. 2008), more research is needed in the application of
bi-phasic toxicological models in aquatic ecology.
The EC10 egg Se estimate for hatchability in mallard of 12.5 µg/g, could be used as the critical
value for a wildlife guideline. However, several field studies suggest that at least three species of
birds are more sensitive than mallard; coots, grebes and spotted sandpiper (Ohlendorf et al. 1989;
Harding et al. 2005). Since toxicity data exist for only a limited number of bird species (and
other wildlife species), the minimum uncertainty factor of 2 was selected and applied to the
critical egg Se toxicity value for mallards of approximately 12 µg/g. This results in a guideline
value of 6 µg/g bird egg Se, a concentration which is sufficiently above typical background
levels in bird eggs. Comparing this value with the Footnote 14 provisions established as part of
the Great Salt Lake site-specific bird egg criteria and other guideline recommendations, a
guideline of 6 µg/g is adequately protective of sensitive bird species. Studies of other wildlife
species would be beneficial in establishing additional tissue guidelines for sensitive species.
201
Some authors (Skorupa and Ohlendorf 1991; Skorupa 1999) mention the secondary dietary
hazard posed to predators feeding on bird eggs that may be in excess of dietary thresholds. It is
important that a protective wildlife guideline value consider these potential secondary hazards to
predators and considered in setting a wildlife guideline (e.g., other birds, some reptiles and larger
mammals like marten, coyote, fox, and bear). A guideline of 6 µg/g for wildlife is slightly higher
than the 4 µg/g dietary guideline recommended in this document. Since there is great uncertainty
about the risk posed to predators from consuming bird eggs, and there are too few studies to
determine a wildlife consumer guideline, none is proposed at this time.
The water column guideline of 2 µg/L, and the dietary guideline of 4 µg/g in food items, are
applicable to wildlife species. The chronic tissue guideline for the protection of wildlife, using
birds as a surrogate, is 6 µg/g (dw) in bird egg tissue, calculated as the mean concentration of
at least 8 eggs (from 8 individual nests) in a representative area, reported as dry weight.
8.6 Recreational Use and Aesthetics
No information was found regarding recreational or aesthetic guidelines specifically for
selenium. No evidence was found linking waterborne Se to risks associated with recreational or
aesthetic uses of water. Therefore no guidelines for these water uses are proposed.
A water quality guideline for Se in recreational waters or for aesthetics is not proposed at this
time due to the lack of available information.
8.7 Irrigation and Livestock Watering
The existing guidelines for agricultural water uses, specifically irrigation and livestock watering,
have not been updated at this time. Details on their derivation and rationale are provided in
Nagpal and Howell (2001).
The approved BC water quality guideline for irrigation water is 10 µg/L, and for livestock
watering the guideline is 30 µg/L.

202
8.8 Industrial Uses
No data could be found regarding selenium guidelines for industrial water uses. Therefore, no
guidelines are proposed here.
A water quality guideline for Se in industrial use waters is not proposed at this time due to the
lack of available information.
9.0 Monitoring and Analytical Considerations for Selenium Analysis
A group of studies were conducted in the Elk Valley, BC, all of which attempted to define a
toxicity threshold for westslope cutthroat trout (Kennedy et al. 2000; Rudolph et al. 2008;
Elphick et al. 2009; Nautilus Environmental and Interior Reforestation Co., Inc. 2011, see
Section 8.4). These studies demonstrated that field-based study outcomes on the same population
of fish often differ, resulting in very different toxicity threshold estimates. Additionally,
laboratory results from the same study may also differ (Elphick et al. 2009, Nautilus
Environmental and Interior Reforestation Co., Inc. 2011), adding to the uncertainty in these
estimates. Other examples of toxicity threshold estimates for hatchability in mallard ducks have
resulted in a range of estimates which differed based on different statistical techniques applied to
the same set of data (see Section 8.5). These scientific and analytical uncertainties form the basis
for distinguishing between toxicity threshold estimates, which represent concentrations at which
adverse effects are apparent, and safe concentrations (Hamilton 2003, 2004).
These uncertainties can be minimized by careful design and execution of a monitoring and
assessment program. A good summary of the potential monitoring pitfalls along with
recommendations for conducting sound monitoring and assessment programs for Se is contained
in two documents prepared for the North American Metals Council (NAMC); Ohlendorf et al.
(2008) and a subsequent publication, Ohlendorf et al. (2011). Ralston et al. (2008) prepared a
companion NAMC document on the biogeochemistry of Se, which includes advice on analytical
techniques for Se and its chemical species.
Establishing data quality objectives, along with a conceptual plan, is recommended at the outset
of any monitoring and assessment program for Se (Ohlendorf et al. 2008, 2011). During the

203
collection of data, careful site selection should ensure that samples are representative of the area
being sampled (control or background versus exposed sites). Sample handling, preservation or
other preparation, and shipping should be conducted according to standardised procedures
appropriate for each media (water, sediment, or biological). The appropriate number of sample
blanks, spiked samples, certified reference materials, and duplicates should be incorporated into
the sampling and monitoring program design. Ralston et al. (2008), and documents prepared by
the BC Ministry of Environment (Cavanagh et al. 1998; Ministry of Water, Land and Air
Protection 2003) provide more detail on proper procedures for sampling and monitoring
programs.
The variability in fish tissue monitoring data at sites where there is no apparent disturbance or
source of Se contamination may be explained by unanticipated Se sources, complex
bioaccumulation dynamics that enhance Se uptake, and/or species-specific enhanced Se uptake.
In locations where unexpectedly high Se concentrations result in one or more environmental
compartments, or for species that accumulate high levels of Se in undisturbed reference areas,
closer examination of the data and the site conditions are recommended. Laboratory quality
assurance should be checked carefully, as well as the numbers and representativeness of samples.
Highly mobile species may be moving in and out of Se-contaminated areas resulting in variable
exposure and higher than expected tissue Se. Some fish species, such as sculpin, could have
habitat preferences or physiologies that put them at greater risk of accumulating Se. Some
locations may be more prone to Se bioaccumulation as a result of the natural geology of the area.
Any one, or a combination of these factors may result in Se concentrations elevated above
guidelines, in which case site-specific water quality objectives may be warranted. Contact the
BC Ministry of Environment for assistance in determining if and how water quality objectives
should be developed (see guidance document at:
http://www.env.gov.bc.ca/wat/wq/pdf/wqo_2013.pdf).
A critical monitoring consideration when developing a comprehensive environmental risk
assessment is incorporation of a thorough inventory and assessment of organisms potentially at
risk in the area of concern. This should include the lowest trophic levels to the highest. Knowing
what organisms may be at risk, and where, helps define the study area and identify key indicator
species.

204
Presser and Luoma (2006) recommended that a full characterisation of Se in the critical
environmental compartments will greatly enhance the evaluation, interpretation and management
of Se in aquatic ecosystems. Co-located sampling of various compartments in the environment
(different media) in both exposed and reference areas, and/or across a gradient of Se
concentrations provides optimal information (Ohlendorf et al. 2008). This will assist in long-
term studies where the objective is to compare results over time to determine trends. This will
also facilitate development of important site-specific and species-specific relationships within
and between the various environmental compartments and tissue types.
The number and types of samples should consider other possible contaminants, the type of
environment being sampled, natural variability (adequate numbers of samples), interactions
between media, and target organisms (i.e., dietary organisms and key surrogate species at the top
of the food web) (Ohlendorf et al. 2008). Assessments should target the correct season to
coincide with spawning of important target species, nesting of birds, and/or worst case Se
concentrations. As well, establishing relationships between Se concentrations in multiple tissue
types within an individual fish species (e.g., egg/ripe ovary with whole-body or muscle tissues)
can improve the understanding of Se toxicokinetics and also provide some flexibility in
monitoring programs (use of non-destructive sampling techniques) once relationships between
tissue types is established. For example, muscle plug tissue samples in westslope cutthroat trout
in the Elk River in BC, were found to be highly correlated to muscle fillet tissues, with a
correlation coefficient (r2) of 0.996, making muscle plug samples a reliable non-destructive
sampling alternative (Minnow 2004).
Sediment concentrations of Se, by nature, may be highly variable and may not provide a link to
Se levels in other environmental compartments, such as tissues (Hamilton and Lemly 1999;
Malloy et al. 1999). Sampling methods and study designs may help control the high degree of
spatial and temporal variability in sediment Se concentrations (Malloy et al. 1999). Selenium
tends to adsorb to fine-textured, organic-rich sediments, making these characteristics important
to define when analysing sediment samples (Besser et al. 1989; Wiramanaden et al. 2010).
Restricting stream sample locations to depositional zones and using only the fine grain size
fraction of sediment for metals analysis may reduce this variability (Rex and Carmichael 2002).
205
The BC MoE has recently released a guidance document that recommends sediments less than
63 µm be evaluated for metals analysis, including Se, to reduce the variability in reported metals
concentrations (BC MoE 2012b). It is important when collecting sediments, to analyze key
variables such as particle size distribution and total organic carbon (TOC) content. Sediment
samples should be composites of at least five individual samples per location so variability
between sites and changes over time can be evaluated. It is also recommended that collection and
analytical methods remain constant, or careful evaluation of changes are incorporated in a
monitoring program to ensure comparability of data over the long-term.
D’Ulivo (1997) stated that the most common problems associated with accurate analysis of Se
involve sample preparation, storage and manipulation procedures to liberate Se compounds
(mainly the protein-bound fractions) from the sample matrix. This is especially important for
speciation of Se in environmental samples. Another common problem is adequately sensitive
instrumentation and equipment for low and accurate detection of Se (D’Ulivo 1997).
Typically, accredited labs will use one of the US EPA methods for analyzing Se in
environmental media (Ralston et al. 2008). For example, EPA method 200.8 is used for water or
waste water. EPA methods 3050B and/or 3052 are often used for sediment, sludge, and soil
samples, which involve sample digestion with both nitric acid and hydrogen peroxide (USEPA
1994; USEPA 1996a,b). The later method is typically the most commonly used for these media,
as well as for biological tissue, since the hydrogen peroxide digestion step is most efficient at
breaking down organically-bound Se (F. Chen, pers. comm., Maxxam Analytics, July 2011).
The use of inductively coupled plasma mass spectrometry (ICP-MS) has become the instrument
of choice for determining Se in all matrices (water, soils, tissues) due to its sensitivity and
precision (D’Ulivo 1997; Ralston et al. 2008). It does, however, have the disadvantage of being
prone to interferences. For example, a seawater matrix presents difficulties unless the sample is
first diluted prior to analysis (M. Melnychuk, pers. comm., Maxxam Analytics, July 2010). Over
the past decade, collision/reaction cell (CRC) technology has been coupled with ICP-MS to
reduce, if not eliminate, interference from polyatomic ions and further improve the performance
of the ICP-MS instrument (Ralston et al. 2008).

206
Other instruments and methods used to analyse Se are reviewed in D’Ulivo (1997), Ohlendorf et
al. (2008) and Ralston et al. (2008). Use of equipment and techniques which provide minimum
detection limits 10 times lower than the range of interest (water quality guideline, objective or
management goal) are best for meaningful results, particularly if Se speciation is being
conducted (Ralston et al. 2008). Where possible, analysis of Se species has been advised to gain
additional information about the site-specific dynamics and transformation of Se for all
environmental compartments (Ohlendorf et al. 2008).
Further guidance and information specific to mining-related monitoring and assessment can be
found in Water and Air Baseline Monitoring Guidance Document for Mine Proponents and
Operators (BC MoE 2012b).

207
10.0 References
Adams, W.J., K.V. Brix, K.A. Cothern, L.M. Tear, R.D. Cardwell, A. Fairbrother and J.E. Toll.
1998. Assessment of selenium food chain transfer and critical exposure factors for avian
wildlife species: Need for site-specific data. In: Little, E.E., A.J. DeLonay and B.M.
Greenberg, editors. Environmental Toxicology and Risk Assessment, 7th
Volume. West
Conshohocken, PA (US): ASTM Special Technical Publication 1333. 184p.
Adams, W.J., K.V. Brix, M. Edwards, L.M. Tear, D.K. DeForest and A. Fairbrother. 2003.
Analysis of field and laboratory data to derive selenium toxicity thresholds for birds.
Environmental Toxicology and Chemistry 22(9):2020-2029.
Adams, W.J., and B.B. Heidolph. 1985. Short-cut chronic toxicity estimates using Daphnia
magna. In: Cardwell, R.D., R. Purdy and R.C. Bahner, editors. Aquatic toxicology and
hazard assessment: Seventh symposium. ASTM STP 854. Philadelphia, PA (US):
American Society for Testing and Materials. p87-103 (cited in USEPA 1987, 2004)
Adriano, D.C. 2001. Trace elements in the terrestrial environment: biogeochemistry,
bioavailability and risks of metals. 2nd
ed. New York, NY (US): Springer-Verlag Inc. 871p.
[ATSDR] Agency for Toxic Substances and Disease Registry. 2003. Toxicological profile for
selenium. Atlanta, GA (US): US Department of Health and Human Services, Public Health
Service. 457p. Accessed on-line at http://www.atsdr.cdc.gov/toxprofiles/tp92.pdf
[AENV] Alberta Environment. 1999. Surface water quality guidelines for use in Alberta.
Edmonton, AB (CA): Science and Standards Branch. 25p. Accessed on-line at
http://www.gov.ab.ca/env/protenf/publications/SurfWtrQual-Nov99.pdf
Alexander, A.R., P.D. Whanger and L.T. Miller. 1983. Bioavailability to rats of selenium in
various tuna and wheat products. Journal of Nutrition 113:196-204.
[ASTM] American Society for Testing and Materials. 2005. ASTM E857 - 05e1 Standard
practice for conducting sub-acute dietary toxicity tests with avian species. West
Conshohocken, PA (US): ASTM International.
Anastasia, J.R., S.G. Morgan and N.S. Fisher. 1998. Tagging crustacean larvae: Assimilation and
retention of trace elements. Limnology and Oceanography 43(2):362-368.
Anderson, A-M., R. Crosley, F.P. Dieken, D.S. Lucyk and S. Wu. 1994. Multi-media monitoring
of trace metals and pesticides in the Battle River 1989-1990. Edmonton, AB (CA): Alberta
Ministry of Environment. 93p. Accessed on-line at
http://environment.gov.ab.ca/info/library/7994.pdf
Andrahennadi, R., M. Wayland and I.J. Pickering. 2007. Speciation of selenium in stream insects
using x-ray absorption spectroscopy. Environmental Science and Technology 41:7683-
7687.
208
[ANZECC] Australia New Zealand Environment and Conservation Council. 2000. Australian
and New Zealand Guidelines for fresh and marine water quality 2000. Perth, AU:
Australian and New Zealand Environment and Conservation Council, and the Agriculture
and Resource Management Council of Australia and New Zealand. Accessed on-line at
http://www.mfe.govt.nz/publications/water/anzecc-water-quality-guide-02/anzecc-water-
quality-guide-02-pdfs.html
[ANZFA] Australia New Zealand Food Authority. 1992. Australian food standards code.
ANZFA Act. Canberra, AU: Department of Agriculture and Fisheries and Forestry. (cited
in Barwick and Maher 2003)
Barnhart, R.A. 1957. Chemical factors affecting the survival of game fish in a western Colorado
reservoir. MSc. thesis. Fort Collins, CO (US): Colorado State University. 1957. (cited in
Skorupa 1998)
Barnthouse, L.W. G. W. Suter II, A.E. Rosen and J.J. Beauchamp. 1987. Estimating responses of
fish populations to toxic contaminants. Environmental Toxicology and Chemistry
6(10):811-824.
Barceloux, D.G. 1999. Selenium. Clinical Toxicology 37(2):145-172.
Barwick, M., and W. Maher. 2003. Biotransference and biomagnification of selenium, copper,
cadmium, zinc, arsenic and lead in a temperate seagrass ecosystem from Lake Macquarie
Estuary, NSW, Australia. Marine Environmental Research 56:471-502.
[BEAK] BEAK International Incorporated. 2002. Literature review of environmental toxicity of
mercury, cadmium, selenium and antimony in metal mining effluents. Ottawa ON (CA):
Natural Resources Canada, Toxicological Investigations into Mining Effluents Program.
89p.
Beckon, W.N., C. Parkins, A. Maximovich and A.V. Beckon. 2007. A general approach to
modeling biphasic relationships. Environmental Science and Technology 42:1308-1314.
Beckon, W., O. Kozak and O. Kravchenko. 2010. Trophic transfer of selenium and metals: Does
regulation occur in food chains? In: Proceedings of the SETAC; 2010 Nov 8-11; Portland
OR (US). Abstract for poster available on-line at www.setac.org
Bergeron, C.M., C.M. Bodinof, J.M. Unrine and W.A. Hopkins. 2010. Bioaccumulation and
maternal transfer of mercury and selenium in amphibians. Environmental Toxicology and
Chemistry 29(4):989-997.
Besser, J.M., J.N. Huckins, E.E. Little and T.W. La Point. 1989. Distribution and
bioaccumulation of selenium in aquatic microcosms. Environmental Pollution 62:1-12.
Besser, J.M., T. J. Canfield and T.W. La Point. 1993. Bioaccumulation of organic and inorganic
selenium in a laboratory food chain. Environmental Toxicology and Chemistry 12:57-72.
209
Besser, J.M., W.G. Brumbaugh, D.M. Papoulias, C.D. Ivey, J.L. Kunz, M. Annis, and C.G.
Ingersoll. 2012. Bioaccumulation and toxicity of selenium during a life-cycle exposure
with desert pupfish (Cyprinodon macularius). Reston, VA (US): U.S. Geological Survey
Scientific Investigations Report 2012-5033. 30p. + appendices.
Biosson, F., M. Gnassia-Barelli and M. Romeo. 1995. Toxicity and accumulation of selenite and
selenate in the unicellualr marine alga Cricosphaera elongata. Archives of Environmental
Contamination and Toxicology 28:487-493.
Bittman, S., O. Schmidt and T.N. Cramer. 1999. Advanced forage management - A production
guide for coastal British Columbia and the Pacific Northwest. Agassiz BC (CA): Pacific
Field Corn Association. 92p.
Bjerregaard, P., S. Fjordside, M.G. Hansen and M.B. Petrova. 2011. Dietary selenium reduces
retention of methyl mercury in freshwater fish. Environmental Science and Technology
45(22):9793-9798.
Bowie, G.L., J.G. Sanders, G.F. Riedel, C.C Gilmour, D.L. Breitburg, G.A. Cutter and D.B.
Porcella. 1996. Assessing selenium cycling and accumulation in aquatic ecosystems.
Water, Air and Soil Pollution 90:93-104.
Brasher, A.M., and R.S. Ogle. 1993. Comparative toxicity of selenite and selenate to the
amphipod Hyalella azteca. Archives of Environmental Contamination and Toxicology
24:182-186.
Brewer, R., M. Sekela, S. Sylvestre, T. Tuominen and G. Moyle. 1998. Contaminants in bed
sediments from 15 reaches of the Fraser River basin. Vancouver, BC (CA): Aquatic and
Atmospheric Sciences Division, Environmental Conservation Branch, Pacific and Yukon
Region, Environment Canada. 249p.
[BC MoE] British Columbia Ministry of Environment. 2006. Compendium of working water
quality guidelines for British Columbia. 2006. Victoria, BC (CA): BC Ministry of
Environment, Lands and Parks. Accessed on-line at
http://www.env.gov.bc.ca/wat/wq/BCguidelines/working.html
[BC MoE] British Columbia Ministry of Environment. 2012a. Derivation of water quality
guidelines to protect aquatic life in British Columbia. Victoria, BC (CA): Ministry of
Environment, Science and Information Branch. 32p. Accessed on-line at
http://www.env.gov.bc.ca/wat/wq/pdf/wq-derivation.pdf
[BC MoE] British Columbia Ministry of Environment. 2012b. Water and air baseline monitoring
guidance document for mine proponents and operators. Victoria, BC (CA): Ministry of
Environment. 194p.Accessed on-line at
http://www.env.gov.bc.ca/wat/wq/wq_procedure.html

210
[BC MoE] British Columbia Ministry of Environment. 2013. Guidance for the derivation and
application of water quality objectives in British Columbia. Victoria, BC (CA): Ministry of
Environment, Water Protection and Sustainability Branch. 146p. Accessed on-line at
http://www.env.gov.bc.ca/wat/wq/pdf/wqo_2013.pdf
Brix, K.V., D.K. DeForest, A. Fairbrother and W.J. Adams. 2000. Critical review of tissue-based
toxicity thresholds for fish and birds. Proceedings of the 24th Annual British Columbia
Mine Reclamation Symposium; 2000 June 21-22; Williams Lake, BC (CA): British
Columbia Technical and Research Committee on Reclamation (TRCR). Accessed on-line
at https://circle.ubc.ca/handle/2429/6934
Brix, K.V., J.S. Volosin, W.J. Adams, R.J. Reash, R.G. Carlton and D.O. McIntyre. 2001.
Effects of sulfate on the acute toxicity of selenate to freshwater organisms. Environmental
Toxicology and Chemistry 20(5):1037-1045.
Brix, K.V., D. K. DeForest, R.D. Cardwell and W.J. Adams. 2004. Derivation of a chronic site-
specific water quality standard for selenium in the Great Salt Lake, Utah, USA.
Environmental Toxicology and Chemistry 23(3):606-612.
Bringmann, G., and R. Kuhn. 1977. Results of the damaging effect of water pollutants on
Daphnia magna. Zeitschrift für Wasser und Abwasserforschung (Journal of Water and
Wastewater Research) 10:161-166. (cited in Nagpal and Howell 2001)
Brodberg, R.K., and G.A. Pollock. 1999. Prevalence of selected target chemical contaminants in
sport fish from two California lakes: Public health designed screening study. Sacramento,
CA (US): California Environmental Protection Agency, Office of Environmental Health
Hazard Assessment. 28p. Accessed on-line at http://oehha.ca.gov/fish/pdf/Cx8258.pdf
Brooke, L.T., D.J. Call, S.L. Harting, C.A. Lindberg, T.P. Markee, D.J. McCauley and S.H.
Poirier. 1985. Acute toxicity of selenium (IV) and selenium (VI) to freshwater organisms.
Superior, WI (US): University of Wisconsin-Superior, Centre for Lake Superior
Environmental Studies. (cited in USEPA 1987, 2004).
Brown, K.R., and J.R Arthur. 2001. Selenium, selenoproteins and human health: A review.
Public Health and Nutrition 4(2B):593-599.
Brozmanová, J. D. Mániková, V. Vlčková, M. Chovanec . 2010. Selenium: a double-edged
sword for defense and offence in cancer. Archives of Toxicology 84(12):919-938.
Bryan, A.L. Jr., W.A. Hopkins, J.A. Baionno and B.P. Jackson. 2003. Maternal transfer of
contaminants to eggs in common grackles (Quiscalus quiscala) nesting on coal fly ash
basins. Archives of Environmental Contamination and Toxicology 45:273-277.
Buhl, K.J., and S.J. Hamilton. 2000. The chronic toxicity of dietary and waterborne selenium to
adult Colorado pikeminnow (Ptychocheilus lucius) in a water quality simulating that in the
San Juan River. Yankton, SD (US): National Irrigation Water Quality Program. 112p.

211
Burger, J., C.T. Nisbet and M. Gochfeld. 1994. Heavy metal and selenium levels in feathers of
known-aged common terns (Sterna hirundo). Archives of Environmental Contamination
and Toxicology 26:351-355.
Burnett-Seidel, C., and K. Liber. 2012. Evaluation of sediment quality guidelines derived using
the screening-level concentration approach for application at uranium operations in
Saskatchewan, Canada. Environmental Monitoring and Assessment 184:1593-1602.
Cahill, T.A., and R.A. Eldred. 1998. Particulate selenium in the atmosphere. In: Frankenberger,
W.T., and R.A. Engberg, editors. Environmental chemistry of selenium. New York, NY
(US): Marcel Dekker, Inc., p.613-632.
Calello, D.P. 2010. Selenium. In:, Goldfrank, L.R., N.E. Flomenbaum, N.A. Lewin, M.A.
Howland, R.S. Hoffman, and L.S. Nelson, editors. Goldfrank's toxicologic emergencies.
9th ed. New York, NY (US): McGraw-Hill, p.1316-1320.
[CCME] Canadian Council of Ministers of Environment. 1998. Protocol for derivation of
Canadian tissue residue guidelines for the protection of wildlife that consume aquatic biota.
In: Canadian environmental quality guidelines. Winnipeg, MB (CA): Canadian Council of
Ministers of the Environment. 18p.
[CCME] Canadian Council of Ministers of Environment. 1999. A protocol for the derivation of
water quality guidelines for the protection of aquatic life. In: Canadian environmental
quality guidelines. Winnipeg, MB (CA): Canadian Council of Ministers of Environment.
10p.
[CCME] Canadian Council of Ministers of Environment. 2005. Canadian water quality
guidelines for the protection of agricultural water uses: Summary table. In: Canadian
environmental quality guidelines, 1999. Winnipeg MB (CA): Canadian Council of
Ministers of Environment. 8p.
[CCME] Canadian Council of Ministers of Environment. 2007a. Canadian environmental quality
guidelines for the protection of aquatic life. Summary table. Winnipeg, MB (CA):
Canadian Council of Ministers of Environment, Task Force on Water Quality Guidelines.
13p. Accessed on-line at http://st-ts.ccme.ca/
[CCME] Canadian Council of Ministers of Environment. 2007b. A protocol for the derivation of
water quality guidelines for the protection of aquatic life 2007. Winnipeg, MB (CA):
Canadian Council of Ministers of Environment, Task Force on Water Quality Guidelines.
37p. Accessed on-line at http://ceqg-rcqe.ccme.ca/
[CCME] Canadian Council of Ministers of Environment. 2009. Canadian soil quality guidelines
– Selenium. Environmental and human health effects. Scientific criteria document.
Winnipeg, MB (CA): Canadian Council of Ministers of Environment. 138p. Accessed on-
line at http://www.ccme.ca/assets/pdf/soqg_se_scd_1438.pdf
212
[CCREM] Canadian Council of Resource and Environment Ministers. 1987. Canadian water
quality guidelines. Winnipeg MB (CA): Canadian Council of Resource and Environment
Ministers, Task Force on Water Quality Guidelines. 1484p. No longer in publication.
Canton, S.P., and W. D. Van Derveer. 1997. Selenium toxicity to aquatic life: An argument for
sediment-based water quality criteria. Environmental Toxicology and Chemistry
16(6):1255-1259.
Canton, S.P., A. Fairbrother, A.D. Lemly, H.M. Ohlendorf, L.E. McDonald and D.D.
MacDonald. 2008. Experts workshop on the evaluation and management of selenium in the
Elk Valley, British Columbia. Workshop summary report. Nelson, BC (CA): BC Ministry
of Environment, Environmental Protection Division, Kootenay & Okanagan Regions.
120p.
Cardin, J.A. 1986. U.S. EPA, Narragansett, RI. Memorandum to D.J. Hansen, U.S. EPA,
Narrangansett, RI (US): U.S. Environmental Protection Agency. (cited in USEPA 1987)
Carmicheal, N.B. and P.M. Chapman. 2006. Baseline selenium in sculpins related to the
northeast Britich Columiba coal zone. In: Proceedings of the 31st BC Mine Reclamation
Symposium; 2006 Sept 18-21; Smithers, BC (CA). 6p. Accessed on-line at
http://www.env.gov.bc.ca/epd/regions/omineca/water/reports/pdf/selenium_sculpins.pdf
Casey, R. 2005 Results of Aquatic studies in the McLeod and Upper Smokey River systems.
Edmonton, AB (CA): Alberta Environment, Science and Standards Section. Publication nr
T/785. 72p. Accessed on-line at http://environment.gov.ab.ca/info/library/7745.pdf
Casey, R., and P. Siwik. 2000. Concentrations of selenium in surface water, sediment and fish
from the McLeod, Pembina and Smokey Rivers: Results of surveys from fall 1998 to fall
1999. Edmonton, AB (CA): Alberta Environment, Natural Resources Services. 29p.
Accessed on-line at http://environment.gov.ab.ca/info/library/5843.pdf
Cavanagh, N., R.N. Nordin, L.W. Pommen and L.G. Swain. 1998. Guidelines for designing and
implementing a water quality monitoring program in British Columbia. Victoria, BC (CA):
Ministry of Environment, Lands and Parks, Aquatic Inventory Task Force, Resources
Inventory Commission. Accessed on-line at
http://archive.ilmb.gov.bc.ca/risc/pubs/aquatic/design/index.htm
CH2M Hill. 2008. Final Report: Development of a selenium standard for the open waters of the
Great Salt Lake. Salt Lake City, UT (US): Utah Department of Environmental Quality and
the Utah Division of Water Quality. Accessed on-line at
http://www.deq.utah.gov/workgroups/gsl_wqsc/GLS_Selenium_Standards/index.htm
Chapman, P.M. 2007. Selenium thresholds for fish from cold freshwaters. Human and
Ecological Risk Assessment 13(1):20-24.
Chen, W. 2000. Initial health risk assessment on selenium in fish. Edmonton, AB (CA): Alberta
Health and Wellness, Health Surveillance.
213
Chen, y.-W., N. Belzile and J.M. Gunn. 2001. Antagonistic effect of selenium on mercury
assimilation by fish populations near Sudbury smelters. Limnology and Oceanography
46(7):1814-1818.
Clark, D.R. 1987. Selenium accumulation in mammals exposed to contaminated California
irrigation drainwater. Science of the Total Environment 66:147-168.
Clark, D.R., P.A. Ogasawara, G.J. Smith and H.M. Ohlendorf. 1989. Selenium accumulation by
racoons exposed to irrigation drainwater at Kesterson National Wildlife Refuge, California,
1986. Archives of Environmental Contamination and Toxicology 18:787-794.
Clark, D.R., K.S. Foerster, C.M. Marn and R.L. Hothem. 1992. Uptake of environmental
contaminants by small mammals in pickelweed habitats at San Francisco Bay, California.
Archives of Environmental Contamination and Toxicology 22:389-396.
Cleveland, L., E.E. Little, D.R. Buckler and R.H. Wiedmeyer. 1993. Toxicity and
bioaccumulation of waterborne and dietary selenium in juvenile bluegill (Lepomis
macrochirus). Aquatic Toxicology 27:265-280.
[Colorado DPHE] Colorado Department of Public Health and Environment. 2007. Regulation
No. 31- The basic standards and methodologies for surface water (5 CCR 1002-31).
Washington DC (US): U.S. Environmental Protection Agency. p 178. Accessed on-line at
http://water.epa.gov/scitech/swguidance/standards/wqslibrary/co_index.cfm
Columbia River Treaty Inter-Tribal Commission. 1994. A fish consumption survey of the
Umatilla, Nez Perce, Yakama, and Warm Springs Tribes of the Columbia River Basin.
Portland, OR (US): CRITFC, Technical Report 94-3. 183p. Accessed on-line at
http://www.critfc.org/tech/94-3report.html
Combs, G.F. 2001. Selenium in global food systems. British Journal of Nutrition 85: 517-547.
Conley, J.M., D.H. Funk, N.J. Cariello and D.B. Buchwalter. 2011. Food rationing affects
dietary selenium bioaccumulation and life cycle performance in the mayfly Centroptilum
triangulifer. Ecotoxicology 20(8):1840-1851.
Coughlan, D.J., and J.S. Velte. 1989. Dietary toxicity of selenium-contaminated red shiners to
striped bass. Transactions of the American Fisheries Society 118:400-408.
Coulliard, C.M., R.W. Macdonald, S.C. Courtney and V.P. Palace. 2008. Chemical-environment
interactions affecting the risk of impacts on aquatic organisms: A review with a Canadian
perspective – interactions affecting exposure. Environmental Reviews 16:1-17.
Coyle, J.J., D.R. Buckler, C.G. Ingersoll, J.F. Fairchild and T.W. May. 1993. Effect of dietary
selenium on the reproductive success of bluegills (Lepomis macrochirus). Environmental
Toxicology and Chemistry 12(3):551-565.
Crane, M., T. Flower, D. Holmes and S. Watson. 1992. The toxicity of selenium in experimental
freshwater ponds. Archives of Environmental Contamination and Toxicology 23:440-452.

214
Cumbie, P.M., and S.L. Van Horn. 1978. Selenium accumulation associated with fish mortality
and reproductive failure. Proceedings of the 32nd
Annual Conference of the Southeastern
Association of Fish & Wildlife Agencies; 1978 November 5-7, Hot Springs, VA (US).
p.612-624.
Cutter, G.A. 1989. Freshwater systems. In: Occurrence and distribution of selenium. Ihnat, M.,
editor. Boca Raton, FL (US): CRC Press Inc. p.243-262.
Cutter, G.A., and K.W. Bruland. 1984. The marine biochemistry of selenium: A re-evaluation.
Limnology and Oceanography 29(6):1179-1192.
Cutter, G.A, and L.S. Cutter. 2001. Sources and cycling of selenium in the western and
equatorial Atlantic Ocean. Deep sea research Part II: Topical Studies in Oceanography
48(13):2917-2931.
Dabeka, R.W. 1994. Unpublished report on selenium and iodine levels in total diet samples.
September 17, 1994. Ottawa, ON (CA): Health Canada, Food Research Division. (cited in
CCME 2009).
Dalziel, J.A., P.A. Yeats and B.P. Amirault. 1998. Inorganic chemical analysis of major rivers
flowing into the Bay of Fundy, Scotian Shelf and Bras D'Or Lakes. Canadian Technical
Report of Fisheries and Aquatic Sciences 2226. 148p. Accessed on-line at http://www.dfo-
mpo.gc.ca/Library/227457.pdf
Daniels, L.A. 1996. Selenium metabolism and bioavailability. Biological Trace Element
Research 54:185-199.
Dawe, P. 2003. Water quality trends in selected water bodies of Newfoundland & Labrador. St.
John's, NL (CA): Department of Environment, Canada-Newfoundland Water Quality
Monitoring Agreement, Newfoundland & Labrador Water Resource Management
Division. 66p.
deBruyn, A.M.H. 2009. Westslope cutthroat trout population modeling study. Sparwood, BC
(CA): Elk Valley Selenium Task Force. Unpublished manuscript. 43p.
deBruyn, A.M.H., and P.M. Chapman. 2007. Selenium toxicity to invertebrates: Will proposed
thresholds for toxicity to fish and birds also protect their prey? Environmental Science and
Technology 41:1766-1770.
deBruyn, A., A. Hodaly and P. Chapman. 2008. Tissue selection criteria: Selection of tissue
types for the development of a meaningful selenium threshold in fish. In: Tissue selection
criteria, threshold development endpoints and potential to predict population or community
effects in the field. Part I. Washington DC (US): North American Metals Council,
Selenium Working Group. 178p. Accessed on-line at
http://www.namc.org/docs/00043675.PDF
215
DeForest, D.K. 2008. Threshold development endpoints. In: Tissue selection criteria, threshold
development endpoints and potential to predict population or community effects in the
field. Part II. Washington DC (US): North American Metals Council, Selenium Working
Group. 178p. Accessed on-line at http://www.namc.org/docs/00043675.PDF
DeForest, D.K. 2009. Database of selenium concentrations in fish tissues from reference sites.
Washington DC (US): North American Metals Council, Selenium Working Group. 33p.
Accessed on-line at http://www.namc.org/docs/00043670.PDF
DeForest, D.K., and W.J. Adams. 2011. Selenium accumulation and toxicity in freshwater fishes.
In: Beyer, W.N., and J.P. Meador, editors. Environmental contaminants in biota –
interpreting tissue concentrations, 2nd
ed. Boca Raton, FL (US): CRC Press, p.185-221
DeForest, D.K., W.J. Adams and K.V. Brix. 2006. Comments on Vidal et al. (2005) and
potential implications for tissue-based guideline/criteria development for selenium.
SETAC Globe, March-April 2006 edition. p26.
DeForest, D.K., K.V. Brix and W.J. Adams. 1999. Critical review of proposed residue-based
selenium thresholds for freshwater fish. Human and Ecological Risk Assessment
5(6):1187-1228.
DeForest, D.K., K.V. Brix and W.J. Adams. 2007. Assessing metal bioaccumulation in aquatic
environments: The inverse relationship between bioaccumulation factors, trophic transfer
factors and exposure concentration. Aquatic Toxicology 84:236-246.
DeForest, D.K., G. Gilron, S.A. Armstrong and E.L. Robertson. 2012. Species sensitivity
distribution evaluation for selenium in fish eggs: Considerations for development of a
Canadian tissue-based guideline. Integrated Environmental Assessment and Management
8(1):6-12.
de Rosemond, S.C., K. Liber and A. Rosaasen. 2005. Relationship between embryo selenium
concentrations and early life stage development in white sucker (Catastomus commersoni)
from a northern Canadian lake. Bulletin of Environmental Contamination and Toxicology
74:1134-1142.
Dessouki, T.C.E. 2009a. Water quality assessment of the Kettle River at Midway and Carson,
British Columbia (1990-2007). Victoria, BC (CA): BC Ministry of Environment, Canada-
British Columbia Water Quality Monitoring Agreement. 58p. Accessed on-line at
http://www.env.gov.bc.ca/wat/wq/quality/kettle_midway/kettle-midway07.pdf
Dessouki, T.C.E. 2009b. Water quality assessment of the Okanagan River near Oliver, British
Columbia (1990-2007). Victoria, BC (CA): BC Ministry of Environment, Canada-British
Columbia Water Quality Monitoring Agreement. 34p. Accessed on-line at
http://www.env.gov.bc.ca/wat/wq/quality/okanagan_riv/okanagan-riv-07.pdf

216
Dessouki, T.C.E. 2009c. Water quality assessment of the Iskut River below Johnson River,
British Columbia (1990-2007). Victoria, BC (CA): BC Ministry of Environment, Canada-
British Columbia Water Quality Monitoring Agreement. 30p. Accessed on-line at
http://www.env.gov.bc.ca/wat/wq/quality/iskut/iskut-2007.pdf
Dessouki, T.C.E. 2009d. Water quality assessment of the Moyie River at Kingsgate (1990-2007).
Victoria, BC (CA): BC Ministry of Environment, Canada-British Columbia Water Quality
Monitoring Agreement. 25p. Accessed on-line at
http://www.env.gov.bc.ca/wat/wq/quality/moyie/moyie-2007.pdf
DeVink, J-M. A., R.G. Clark, S.M. Slattery and M. Wayland. 2008. Is selenium affecting body
condition and reproduction in boreal breeding scaup, scoters, and ring-necked ducks?
Environmental Pollution 152:116-122.
Doblin, M.A., S.I. Blackburn and G.M. Hallegraeff. 1999. Comparative study of selenium
requirements of three phytoplankton species: Gymnodinium catenatum, Alexandrium
minutum (Dinophyta) and Chaetoceros cf. tenuissimus (Bacillariophyta). Journal of
Phytoplankton Research 21(6):1153-1169.
Donahue, W.F., E.W. Allen and D.W. Schindler. 2006. Impacts of coal-fired power plants on
trace metals and polycyclic aromatic hydrocarbons (PAHs) in lake sediments in central
Alberta, Canada. Journal of Paleolimnology 35(1):111-128.
Doroshov, S., J. Van Eenennaam, C. Alexander, E. Hallen, H. Bailey, K. Kroll and C. Restrepo.
1992. Development of water quality criteria for resident aquatic species of the San Joaquin
River. Sacramento CA (US): California Environmental Protection Agency, State Water
Resources Control Board. Contract nr 7–197–250–0. 99p.
Douglas, G.W., D.V. Meidinger and J. Pojar. 1999. Illustrated flora of British Columbia. Volume
3: Dicotyledons (Diapensiaceae through Onagraceae). Victoria, BC (CA): BC Ministry of
Environment, Lands & Parks and BC Ministry of Forests. 423 p. In: Klinkenberg, B.,
editor. 2010. E-flora BC: electronic atlas of the plants of British Columbia. Vancouver, BC
(CA): University of British Columbia, Department of Geography, Lab for Advanced
Spatial Analysis. Accessed on-line at http://www.geog.ubc.ca/biodiversity/eflora/
Driedger, K., L.P. Weber, C.J. Rickwood, M.G. Dubé and D.M. Janz. 2009. Overwinter
alterations in energy stores and growth in juvenile fishes inhabiting areas receiving metal
mining and municipal wastewater effluents. Environmental Toxicology and Chemistry
28(2):296-304.
Driessnack, M.K., P.D. Jones and M.G. Dubé. 2011. Altered egg size and selenium
concentrations during and following exposure to fathead minnows (Pimephales promelas)
to industrial effluent. Integrated Environmental Assessment and Management 7:504-506.
Drinking Water Leadership Council. 2007. Drinking water officers’ guide. Victoria BC (CA):
BC Ministry of Health. Accessed online at
http://www.health.gov.bc.ca/protect/dwpublications.html

217
DuBowy, P.J. 1989. Effects of diet on selenium bioaccumulation in marsh birds. Journal of
Wildlife Management 53(3):776-781.
D'Ulivo, A. 1997. Determination of selenium and tellurium in environmental samples. Analyst
122:117R-144R.
Efroymson, R.A, M.E. Will, G.W. Suter and A. C. Wooten. 1997. Toxicological benchmarks for
screening contaminants of potential concern for effects on terrestrial plants: 1997 revision.
Oak Ridge, TN (US): U.S. Department of Energy, Office of Environmental Management,
Oak Ridge National Laboratory. ES/ER/TM-85/R3. Accessed on-line at
http://www.esd.ornl.gov/programs/ecorisk/documents/tm85r3.pdf
Eisler, R. 1985. Selenium hazards to fish, wildlife and invertebrates: A synoptic review.
Contaminant hazard reviews. Report No. 5. Biological report 85(1.5). Laurel, MD (US):
U.S. Fish and Wildlife Service. 41p.
Elkford Rod and Gun Club. 1984. A preliminary survey of O’Rourke Lake. Report prepared by
the Elkford Rod and Gun Club, July 11, 1984. Cranbrook, BC (CA): Fish and Wildlife
Branch, Ministry of Environment. 3p.
Ellis, D.R., and D.E. Salt. 2003. Plants, selenium and human health. Current Opinion in Plant
Biology 6:273-279.
Elphick, J.R., H.C. Bailey, B.K. Lo, G. Sword and J.R. Berdusco. 2009. Effect of selenium on
early life-stage development of westslope cutthroat trout. In: Proceedings of the 33rd
Annual British Columbia Mine Reclamation Symposium; 2009 September 14–18;
Cranbrook, BC (CA). 11p.
Environment Canada. 2010. Examining fish consumption advisories related to mercury
contamination in Canada. Pollution and Waste. Ottawa, ON (CA): Environment Canada.
Accessed on-line at http://www.ec.gc.ca/mercure-
mercury/default.asp?lang=En&xml=BA8EA930-01C7-47A4-988F-949B9062A05C#BC
[EDI] Environmental Dynamics Inc. 2009. Natural sources of contaminants in the Yukon: Focus
on selenium. Whitehorse, YT (CA): Mining and Petroleum Environment Research Group
(MPERG). 52p.
[EC] European Commission. 2008. Priority substances and certain other pollutants (according to
Annex II of the Directive 2008/105/EC). European Commission, Institute for Health and
Consumer Protection (JRC-IHCP). Accessed on-line at
http://ihcp.jrc.ec.europa.eu/our_activities/health-env/eqs
Fairbrother, A., K.V. Brix, J.E. Toll, S. McKay and W.J. Adams. 1999. Egg selenium
concentrations as predictors of avian toxicity. Human and Ecological Risk Assessment
5(6):1229-1253.
Fairweather –Tait, S.J. 1997. Bioavailability of selenium. European Journal of Clinical Nutrition
51:S20-S23.

218
Fairweather-Tait, S.J., R. Collings and R. Hurst. 2010. Selenium bioavailability: current
knowledge and future research requirements. American Journal of Clinical Nutrition
91(supplement): 1484-1491.
Fairweather–Tait, S. J., B. Yongping, M.R. Broadley, R. Collings, D. Ford, J.E. Hesketh and R.
Hurst. 2011. Selenium in human health and disease. Antioxidants and Redox Signaling
14(7):1337-1383. Accessed online at:
http://online.liebertpub.com/doi/abs/10.1089/ars.2010.3275
Fan, A.M., S.A. Book, R.R. Neutra and D.M. Epstien. 1988. Selenium and human health
implications in California’s San Joaquin Valley. Journal of Toxicology and Environmental
Health 23:539-559.
Fan, T.W.-M., S.J. Teh, D.E. Hinton and R.M. Higashi. 2002. Selenium biotransformations into
proteinaceous forms by foodweb organisms of selenium-laden drainage waters in
California. Aquatic Toxicology 57:65-84.
Farag, A.M., D.A. Nimick, A.A. Kimball, S.E. Church, D.D. Harper and W.G. Brumbaugh.
2007. Concentrations of metals in water, sediment, biofilm, benthic macroinvertebrates and
fish in the Boulder River watershed, Montana, and the role of colloids in metal uptake.
Archives of Environmental Contamination and Toxicology 52:397-409.
Fernández-Martínez, A., and L. Charlet. 2009. Selenium environmental cycling and
bioavailability: a structural chemist point of view. Reviews in Environmental Science
Biotechnology 8:81-110.
Farré, M., K. Gajda-Schrantz, L. Kantiani and D. Barceló. 2009. Ecotoxicity and analysis of
nanomaterials in the aquatic environment. Analytical and Bioanalytical Chemistry 393:81-
95.
Finley, J.W. 2005. Selenium accumulation in plant foods. Nutrition Reviews 63(6):196-202.
Finley, J.W. 2006. Bioavailability of selenium from foods. Nutrition Reviews 64(3):146-151.
Finley, K.A. 1985. Observations of bluegills fed selenium-contaminated Hexagenia nymphs
collected from Belews Lake, North Carolina. Bulletin of Environmental Contamination
and Toxicology 35:816-825.
[FAO/WHO] Food and Agriculture Association of United Nations/World Health Organization.
2011. Report of the joint FAO/WHO expert consultation on the risks and benefits of fish
consumption. Rome, 25-29 January 2010. Fisheries and Aquaculture Report No. 978
(FIPM/R978(En)). Rome, IT: United Nations and World Health Organization, Food and
Agriculture Organization. 63p. Accessed on-line at
http://www.fao.org/docrep/014/ba0136e/ba0136e00.pdf
[FDA] Food and Drug Administration. 1982. FDA compliance program report of findings. FY
79 total diet studies – adult (7305.002). Washington, DC (US): U.S. Food and Drug
Administration, Department of Health and Human Services.

219
Formation Environmental. 2011. Brown trout laboratory reproduction studies conducted in
support of development of a site-specific selenium criterion. Boulder, CO (US): J.R.
Simplot Company. Final manuscript dated June 2011. 643p.
Fox T.E., E.G.H.M. Van den Heuval, C.A. Atherton, J.R. Dainty, D.J. Lewis and N.J. Langford.
2004. Bioavailability of selenium from fish, yeast and selenate: A comparative study in
humans using stable isotopes. European Journal of Clinical Nutrition 58:343-9.
Franz, E.D., C. I.E. Wiramanaden, D.M. Janz, I. J. Pickering and K. Liber. 2011. Selenium
bioaccumulation and speciation in Chironomus dilutus exposed to water-borne selenate,
selenite, or seleno-DL-methionine. Environmental Toxicology and Chemistry 30(10):2292-
2299.
Frenette, J.L. 2008. An evaluation of benthic invertebrate communities as an indicator of stream
ecosystem health below active coal mines in the Elk River watershed [MSc. thesis].
Victoria, BC (CA): Royal Roads University. Accessed on-line at
https://circle.ubc.ca/bitstream/handle/2429/24646/17Frenette.pdf?
Friedrich, L.A., P.L. Orr, N.M. Halden, P. Yang and V.P. Palace. 2011. Exposure histories
derived from selenium in otoliths of three cold-water fish species captured downstream
from coal mining activity. Aquatic Toxicology 105(3-4):492-496.
Gamberg, M., G. Boila, G. Stern and P. Roach. 2005a. Cadmium, mercury and selenium
concentrations in mink (Mustela vison) from Yukon, Canada. Science of the Total
Environment 351-352:523-529.
Gamberg, M., M. Palmer and P. Roach. 2005b. Temporal and geographic trends in trace element
concentrations in moose from Yukon, Canada. Science of the Total Environment 351-
352:530-538.
Gantner, N., M. Power, J.A. Babaluk, J.D.G. Kock, L.W. Lockhart, K.R. Solomon and D.C.G.
Muir. 2009. Temporal trends of mercury, cesium, potassium, selenium, and thallium in
Arctic char (Salvelinus alpinus) from Lake Hazen, Nunavut, Canada: Effects of trophic
position, size, and age. Environmental Toxicology and Chemistry 28(2):254-263.
GFS Chemicals. 2010. Material safety data sheet for selenium dioxide. Powell, OH (US): GFS
Chemicals. Accessed on-line at
http://msds.gfschemicals.com/atn/SELENIUM%20DIOXIDE%2c%2099.8%25_Default_
MSDS%20US.pdf
Gillespie, R.B., and P.C. Bauman. 1986. Effects of high tissue concentrations of selenium on
reproduction in bluegills. Transactions of the American Fisheries Society 115:208-213.
[Golder] Golder Associates Ltd. 2009. Technical Memorandum: Selenium concentrations in
rainbow trout collected from Blind Creek. April 08 2009. Prince George, BC (CA): BC
Ministry of Environment.

220
[Golder] Golder Associates Ltd. 2010a. Technical Memorandum: Selenium concentrations in
bird eggs: Preliminary data from samples collected in the vicinity of the proposed Roman
Mine. Prince George, BC (CA): BC Ministry of Environment.
[Golder] Golder Associates Ltd. 2010b. Selenium bioaccumulation analysis: Development of
site-specific BAFs for Se in the Elk Valley. Sparwood, BC (CA): Elk Valley Selenium
Task Force. Report number: 09-1421-0030. 47p.
Goodarzi, F., H. Sanai and J. Reyes. 2006. Concentrations and distribution opf elements in
milled-coal, power plant ashes and stack-emitted materials in a western Canadian coal-
fired power plant. Chinese Journal of Geochemistry 25(Suppl 1):47.
Goettl, J.P., and P.H. Davies 1978. Water pollution studies. Job Progress Report, Federal Aid
Project F-33-R-13. Fort Collins, CO (US): Colorado Division of Wildlife. p.12-13
Government of Alberta. 2011. Alberta guide to sportfishing regulations 2011. PB83-112722.
Accessed on-line at http://www.albertaregulations.ca/fishingregs/
Groff, J., and S. Gropper. 2000. Advanced nutrition and human metabolism. 3rd ed. Belmont,
CA (US): Wadsworth/Thomson Learning.
Hamilton, S.J. 1999. Hypothesis of historical effects from selenium on endangered fish in the
Colorado River basin. Human and Ecological Risk Assessment 5(6):1153-1180.
Hamilton, S.J. 2002. Rationale for a tissue-based selenium criterion for aquatic life. Aquatic
Toxicology 57:85-100.
Hamilton, S.J. 2003. Review of residue-based selenium toxicity thresholds for freshwater fish.
Ecotoxicology and Environmental Safety 56:201-210.
Hamilton, S.J. 2004. Review of selenium toxicity in the aquatic food chain. Science of the Total
Environment 326:1-31.
Hamilton, S.J., and K.J. Buhl. 1990. Acute toxicity of boron, molybdenum and selenium to fry of
Chinook salmon and coho salmon. Archives of Environmental Contamination and
Toxicology 19(3):366-373.
Hamilton, S.J., and K.J. Buhl. 2003. Selenium and other trace elements in water, sediment,
aquatic plants, aquatic invertebrates, and fish from streams in southeastern Idaho near
phosphate mining operations: May 2001. Yankton, SD (US): US Geological Survey. 65p.
Hamilton, S.J., K.J. Buhl, F.A Bullard and S.F. McDonald. 2005. Reduced growth and survival
of larval razorback sucker fed selenium-laden zooplankton. Ecotoxicology and
Environmental Safety 61:190-208.
Hamilton, S.J., K.J. Buhl, N.L. Faerber, R.H. Wiedmeyer and F.A. Bullard. 1990. Toxicity of
organic selenium in the diet to Chinook salmon. Environmental Toxicology and Chemistry
9:347-358.

221
Hamilton, S.J., K.M. Holley, K.J. Buhl, F.A. Bullard, L.K. Weston and S.F. McDonald. 2004.
Evaluation of flushing of a high-selenium backwater channel in the Colorado River.
Environmental Toxicology 19(1):51-81.
Hamilton, S.J., and A.D. Lemly. 1999. Commentary – Water-sediment controversy in setting
environmental standards for selenium. Ecotoxicology and Environmental Safety 44:227-
235.
Hamilton, S.J., and V.P. Palace. 2001. Assessment of selenium effects in lotic ecosystems.
Ecotoxicology and Environmental Safety 50:161-166.
Hamilton, S.J., and R.H. Weidmeyer. 1990. Concentrations of boron, molybdenum, and
selenium in Chinook salmon. Transactions of the American Fisheries Society 119:500-510.
Hansen, D., P.J. Duda, A. Zayed and N. Terry. 1998. Selenium removal by constructed wetlands:
Role of biological volatilization. Environmental Science and Technology 32:591-597.
Hansen, L.D., K.J. Maier and A.W. Knight. 1993. The effect of sulfate on the bioaccumulation
of selenate by Chironomus decorus and Daphnia magna. Archives of Environmental
Contamination and Toxicology 25(1):71-78.
Harding, L.E. 2008. Non-linear uptake and hormesis effects of selenium in red-winged
blackbirds (Agelaius phoeniceus). Science of the Total Environment 389:350-366.
Harding, L.E, and D. Paton. 2003. Effects of selenium on American dippers and spotted
sandpipers in the Elk River valley, British Columbia. Sparwood, BC (CA): Elk Valley
Selenium Task Force. 60p.
Harding, L.E., M. Graham and D. Paton. 2005. Accumulation of selenium and lack of severe
effects on productivity of American dippers (Cinclus mexicanus) and spotted sandpipers
(Actitis macularia). Archives of Environmental Contamination and Toxicology 48:414-
423.
Hardy, R.W., L.L. Oram and G. Möller. 2010. Effects of dietary selenomethionine on cutthroat
trout (Oncorhynchus clarki bouvieri) growth and reproduction performance over a life
cycle. Archives of Environmental Contamination and Toxicology 58:237-245.
Harrison, P.J., P.W. Yu, P.A. Thompson, N.M. Price and D.J. Phillips. 1988. Survey of selenium
requirements in marine phytoplankton. Marine Ecology 47:89-96.
Harrison, S.E., and J.F. Klaverkamp. 1990. Metal contamination in liver and muscle of northern
pike (Exos lucius) and white sucker (Catostomus commersoni) and in sediments from lakes
near the smelter at Flin Flon, Manitoba. Environmental Toxicology and Chemistry 9:941-
956.
Hatfield Consultants. 2010. Assessment of selenium in Waste Rock Creek and other aquatic
ecosystems of the Kemess Area - 2009 status report. Smithers, BC (CA): Northgate
Minerals Corporation, Kemess Mine. 63p.

222
Hauer F.R, and E.K. Sexton. 2010. Transboundary Flathead water quality and aquatic life:
Biennial report. 2007 and 2008 baseline data collection to characterize the north fork of the
Flathead River basin environmental quality. Kalispell, MT (US): The Flathead Basin
Commission. 70p.
Haygarth, P.M. 1994. Global importance and global cycling of selenium. In: Frankenberger,
W.T. and S. Benson, editors. Selenium in the environment. New York, NY (US): Marcel
Dekker Inc. p1-28.
Health Canada. 1986. Guidelines for Canadian drinking water quality – Supporting document for
mercury. April 1979 (updated 1986). Accessed on-line at http://www.hc-sc.gc.ca/ewh-
semt/pubs/water-eau/mercury-mercure/index-eng.php
Health Canada. 1992. Guidelines for Canadian drinking water quality - Technical document.
Selenium. Ottawa ON (CA): Health Canada. Accessed on-line at http://www.hc-
sc.gc.ca/ewh-semt/pubs/water-eau/index-eng.php
Health Canada. 2003. Dietary reference intakes. Cat. H44-49/2003E-HTML ISBN 0-662-34958-
X. Ottawa, ON (CA): Health Canada. Accessed on-line at http://www.hc-
sc.gc.ca/fnan/nutrition/reference/dri_using-util_anref_e.html
Health Canada. 2004a. Canadian handbook on health impact assessment: Volume 3: The
multidisciplinary team. Ottawa, ON (CA): Health Canada, Minister of Health, Chapter 8,
Food Issues in Environmental Impact Assessment. 32p.
Health Canada. 2004b. Federal contaminated site risk assessment in Canada. Part I: Guidance on
human health preliminary quantitative risk assessment (PQRA). Ottawa, ON (CA): Health
Canada, Contaminated Sites Program, Environmental Health Assessment Services. 40p.
Accessed on-line at http://dsp-psd.pwgsc.gc.ca/Collection/H46-2-04-367E.pdf
Health Canada. 2005. Average dietary intakes (μg/kg bw/day) of trace elements for Canadians in
different age/sex groups for total diet study in 2005. Ottawa, ON (CA): Health Canada.
Accessed on-line at http://www.hc-sc.gc.ca/fn-an/surveill/total-diet/intake-
apport/chem_age-sex_chim_2005-eng.php
Health Canada. 2006. Average dietary intakes (μg/kg bw/day) of trace elements for Canadians in
different age/sex groups for total diet study in 2006. Ottawa, ON (CA): Health Canada.
Accessed on-line at http://www.hc-sc.gc.ca/fn-an/surveill/total-diet/intake-
apport/chem_age-sex_chim_2006-eng.php
Health Canada. 2007a. Average dietary intakes (µg/kg bw/day) of trace elements for Canadians
in different age/sex groups for total diet study in 2007. Ottawa, ON (CA): Health Canada.
Accessed on-line at http://www.hc-sc.gc.ca/fn-an/surveill/total-diet/intake-
apport/chem_age-sex_chim_2007-eng.php
Health Canada. 2007b. Compendium of monographs. Selenium. Ottawa, ON (CA): Health
Canada, Natural Health Products Directorate. Accessed on-line at www.hc-sc.gc.ca/dhp-
mps/prodnatur/applications/licen-prod/monograph/index-eng.php

223
Health Canada. 2010a. Report on human biomonitoring of environmental contaminants in
Canada – Results of the Canadian health measures survey cycle 1 (2007-2009). Ottawa,
ON (CA): Health Canada. Accessed on-line at http://www.hc-sc.gc.ca/ewh-
semt/pubs/contaminants/chms-ecms/index-eng.php
Health Canada. 2010b. Supplemental guidance on human health risk assessment for country
foods (HHRA Foods). Ottawa, ON (CA): Health Canada.
Health Canada. 2010c. Federal contaminated site risk assessment in Canada, Part V: Guidance
on human health detailed quantitative risk assessment for chemicals (DQRAChem).
Ottawa, ON (CA): Health Canada.
Health Canada. 2010d. Federal contaminated site risk assessment in Canada, Part II: Health
Canada toxicological reference values (TRVs) and chemical-specific factors, version 2.0.
Ottawa, ON (CA): Health Canada. Accessed on-line at
http://publications.gc.ca/collections/collection_2012/sc-hc/H128-1-11-638-eng.pdf
Health Canada. 2011. Eating well with Canada’s food guide. Ottawa, ON (CA): Health Canada,
Minister of Health. Accessed on-line at http://www.hc-sc.gc.ca/fn-an/alt_formats/hpfb-
dgpsa/pdf/food-guide-aliment/print_eatwell_bienmang-eng.pdf.
Health Canada. 2012a. Guidelines for Canadian recreational water quality. Third edition. Ottawa,
ON (CA): Health Canada. Accessed online at http://www.hc-sc.gc.ca/ewh-
semt/alt_formats/pdf/pubs/water-eau/guide_water-2012-guide_eau/guide_water-2012-
guide_eau-eng.pdf
Health Canada. 2012b. Canadian total diet study. Ottawa, ON (CA): Health Products and Food
Branch, Health Canada. Accessed on-line at http://www.hc-sc.gc.ca/fn-an/surveill/total-
diet/index-eng.php
Health Canada. 2013a. The development of the dietary reference intakes. Questions and
Answers. Ottawa, ON (CA): Health Canada. Accessed on-line at http://www.hc-
sc.gc.ca/fn-an/nutrition/reference/dri_dev-elab_anref-eng.php
Health Canada. 2013b.Dietary reference intake FAQ. Ottawa, ON (CA): Health Canada.
Accessed on-line at http://www.hc-sc.gc.ca/fn-an/nutrition/reference/index-eng.php
Heinz, G.H. 1996. Selenium in birds. In: Beyer, W.N., G.H. Heinz and A.W. Redmon-Norwood,
editors. Environmental contaminants in wildlife: Interpreting tissue concentrations. Boca
Raton, FL (US): CRC Press. p.447-458.
Heinz, G.H., and D.J. Hoffman. 1998. Methylmercury chloride and selenomethionine
interactions on health and reproduction in mallards. Environmental Toxicology and
Chemistry 17(2):139-145.
Heinz, G.H., D.J. Hoffman and L.G. Gold. 1989. Impaired reproduction of mallards fed an
organic form of selenium. Journal of Wildlife Management 53(2):418-428.
224
Heinz, G.H., D.J. Hoffman, A.J. Krynitsky and D.M.G. Weller. 1987. Reproduction in mallards
fed selenium. Environmental Toxicology and Chemistry 6:423-433.
Henderson, T., and J. Fisher. 2012. Baseline metal levels in fish tissue (primarily selenium) from
the Flathead River 2006. Cranbrook, BC (CA): BC Ministry of Environment,
Environmental Protection Division. March 2012. 28p.
Hermanutz, R.O. 1992. Malformation of the fathead minnow (Pimephales promelas) in an
ecosystem with elevated selenium concentrations. Bulletin of Environmental
Contamination and Toxicology 49:290-294.
Hermanutz, R.O., K.N. Allen, T.H. Roush and S.F. Hedtke. 1992. Effects of elevated selenium
concentrations on bluegills (Lepomis macrochirus) in outdoor experimental streams.
Environmental Toxicology and Chemistry 11(2):217-224.
Hermanutz, R.O., K.N. Allan, N.E. Detenbeck and C.E. Stephan. 1996. Exposure of bluegill
(Lepomis macrochirus) to selenium in outdoor experimental streams. Duluth, MN (US):
USEPA Mid-Continent Ecology Division. December 1996. 43p.
Hicks, B.D., J.W. Hodson and H.W. Ferguson. 1984. Influence of dietary selenium on the
occurrence of nephrocalcinosis in rainbow trout, Salmo gairdneri Richardson. Journal of
Fish Diseases 7:379-389.
Hillwalker, W.E., P.C. Jepson and K.A. Anderson. 2006. Selenium accumulation patterns in lotic
and lentic aquatic systems. Science of the Total Environment 366:367-379.
Hilton, J.W., and P.V. Hodson. 1983. Effect of increased dietary carbohydrate on selenium
metabolism and toxicity in rainbow trout (Salmo gairderi). Journal of Nutrition 113:1241-
1248.
Hilton, J.W., P.V. Hodson and S.J. Slinger. 1980. The requirements and toxicity of selenium in
rainbow trout (Salmo gairdneri). Journal of Nutrition 110:2527-2535.
Hilton, J.W., P.V. Hodson and S.J. Slinger. 1982. Absorption, distribution, half-life and possible
routes of elimination of dietary selenium in juvenile rainbow trout (Salmo gairdneri).
Comparative Biochemistry and Physiology Part C: Comparative Pharmacology 71(1):49-
55.
Hinck, J.E., C.J Schmitt, K.R. Echols, T.W. May, C.E. Orazio and D.E. Tillitt. 2006.
Environmental contaminants in fish and their associated risk to piscivorous wildlife in the
Yukon River basin, Alaska. Archives of Environmental Contamination and Toxicology
51:661-672.
Hodson, P.V. 1990. Indicators of ecosystem health at the species level and the example of
selenium effects on fish. Environmental Monitoring and Assessment 15:241-254.

225
Hodson, P.V., D.J. Spry and B.R. Blunt. 1980. Effects on rainbow trout (Salmo gairdneri) of a
chronic exposure to waterborne selenium. Canadian Journal of Fisheries and Aquatic
Science 37:233-240.
Hodson, P.V., R.J. Reash, S.P. Canton, P.V. Campbell, C.G. Delos, A. Fairbrother, N.P. Hitt,
L.L. Miller and H.M. Ohlendorf. 2010. Selenium risk caharacterization. In: Adams, W.J.,
M.L. Brooks, C. G. Delos, S.N. Luoma, W.A. Maher, H.M. Ohlendorf, T.S. Presser and
D.P. Shaw, editors. Ecological assessment of selenium in the aquatic environment.
Proceedings from the SETAC Workshop on Ecological Assessment of Selenium in the
Aquatic Environment. Pensacola Florida, USA, February 2009. Boca Raton FL (US):
SETAC in collaboration with CRC Press. p233-256.
Hoffman, D.J. 2002. Role of selenium toxicity and oxidative stress in aquatic birds. Aquatic
Toxicity 57:11-26.
Hoffman, D.J., H.M. Ohlendorf and T.W. Aldrich. 1988. Selenium teratogenesis in natural
populations of aquatic birds in central California. Archives of Environmental
Contamination and Toxicology 17:519-525.
Holm, J. 2002. Sublethal effects of selenium on rainbow trout (Oncorhynchus mykiss) and brook
trout (Salvelinus fontinalis). Masters Thesis. Winnipeg MN (CA): University of Manitoba,
Department of Zoology.
Holm, J., V.P. Palace, K. Wautier, R.E. Evans, C.L. Baron, C. Podemski, P. Siwik and G.
Sterling. 2003. An assessment of the development and survival of wild rainbow trout
(Oncorhynchus mykiss) and brook trout (Salvelinus fontinalis) exposed to selenium in and
area of active coal mining. In: Browman, H.I. and A.B. Skiftesvik, editors. Proceedings of
the 26th
Annual Larval Fish Conference, 2003. The big fish bang. Bergen, NO: Institute of
Marine Research. p.257-274. Accessed on-line at
http://www.fishlarvae.com/e/book.asp?pg=52
Holm, J., V. Palace, P. Siwik, G. Sterling, R. Evans, C. Baron, J. Werner and K. Wautier. 2005.
Developmental effects of bioaccumulated selenium in eggs and larvae of two salmonid
species. Environmental Toxicology and Chemistry 24(9):2373-2381.
Holness, D.L., I.G. Taraschuk and J.R. Nethercott. 1989. Health status of copper refinery
workers with specific reference to selenium exposure. Archives of Environmental Health
44(5): 291-297. (cited in ATSDR 2003)
Hopkins, W.A., S.E. DuRant, B.P.Staub, C.L. Rowe and B.P. Jackson. 2006. Reproduction,
embryonic development and maternal transfer of contaminants in the amphibian
Gastrphryne carolinensis. Environmental Health Perspectives 114(5):661-666.
Hopkins, W.A., J.W. Snodgrass, J.A. Baionno, J.H. Roe, B.P. Staub and B.P. Jackson.
2005.Functional relationship among selenium concentrations in the diet, target tissues, and
non-destructive tissue samples of two species of snakes. Environmental Toxicology and
Chemistry 24(2):344-351.

226
Hopkins, W.A., B.P. Staub, J.A. Baionno, B.P. Jackson, J.H. Roe and N.B. Ford. 2004. Trophic
and maternal transfer of selenium in brown house snakes (Lamprophis fuliginousus).
Ecotoxicology and Environmental Safety 58:285-293.
Hu, X., F. Wang and M.L.Hanson. 2009. Selenium concentration, speciation and behaviour in
surface waters of the Canadian Prairies. Science of the Total Environment 407:5869-5876.
Huggins, F.E., C.L. Senior, P.Chu, K. Ludwig and G.P. Huffman. 2007. Selenium and arsenic
speciation in fly ash from full-scale coal-burning utility plants. Environmental Science and
Technology 41(9):3284-3289.
Hunn, J.B., S.J. Hamilton and D.R. Buckler. 1987. Toxicity of sodium selenite to rainbow trout
fry. Water Research 21(2):233-238.
[IFCAP] Idaho Fish Consumption Advisory Program. 2002. Fish consumption and advisory list.
Idaho Department of Health and Welfare, Bureau of Environmental Health and Safety,
Division of Health. Accessed on-line at
http://healthandwelfare.idaho.gov/Health/tabid/60/Default.aspx
Idaho Department of Health and Welfare. 2005. Public health assessment. Southeast Idaho
phosphate mining resource area, Bannock, Bear Lake, Bingham, and Caribou Counties,
Idaho. EPA Facility ID: IDN001002245. Bureau of Community and Environmental Health,
Idaho Department of Health and Welfare under cooperative agreement with the Agency for
Toxic Substances and Disease Registry. Accessed on-line at
http://healthandwelfare.idaho.gov/portals/0/Health/MoreInformation/SEIPhosphateAssess
ment.pdf
[Indiana DEP] Indiana Department of Environmental Management. 2011. Water quality
standards. Indiana Administrative Code. Title 327 - Water Pollution Control Board
Accessed on-line at http://www.in.gov/legislative/iac/title327.html
Ingersoll, C.G., F.J. Dwyer and T.W. May. 1990. Toxicity of inorganic and organic selenium to
Daphna magna (Cladocera) and Chironomus riparius (Diperta). Environmental
Toxicology and Chemistry 9:1171-1181.
Ihnat, M., and W.R. Wolf. 1989. The literature of selenium and the status and treatment of
analytical data. In: Ihnat, M., editor. Occurrence and distribution of selenium. Boca Raton,
FL (US): CRC Press Inc. p25-32.
[IOM] Institute of Medicine. 2000. Dietary reference intakes: Vitamin C, vitamin E, selenium,
and carotenoids. Food and Nutrition Board. Washington, DC (US): National Academy
Press. Accessed on-line at http://www.nap.edu/openbook.php?record_id=9810
[IJC] International Joint Commission. 1981. Selenium. In: Report of the Aquatic Ecosystem
Objectives Committee. Windsor, ON (CA): Great Lakes Science Advisory Board,
International Joint Commission. 22p.

227
[IUPAC] International Union of Pure and Applied Chemistry. 1988. New notation in the periodic
table. Pure and Applied Chemistry 60(3):431-436.
[IUPAC] International Union of Pure and Applied Chemistry. 1998. Naturally occurring isotope
abundances: Commission on atomic weights and isotopic abundances report. Pure and
Applied Chemistry 70:217.
[Iowa DNR] Iowa Department of Natural Resources. 1992. Water quality standards. In: Iowa
Administrative Code, Environmental Protection Commission [567] Chapter 61. Accessed
on-line at
http://search.legis.state.ia.us/NXT/gateway.dll/ar/iac/5670___environmental%20protection
%20commission%20__5b567__5d/0610___chapter%2061%20water%20quality%20standa
rds/_c_5670_0610.xml?f=templates$fn=default.htm
[Iowa DNR] Iowa Department of Natural Resources. 2009. Revisions to Chapter 61 - Iowa water
quality standards. Iowa Administrative Code. Accessed on-line at
http://water.epa.gov/scitech/swguidance/standards/wqslibrary/ia_index.cfm
[Illinois PCB] Illinois Pollution Control Board. 2009. Water quality standards - Title 35:
Environmental protection, Subtitle C: Pollution, Chapter1: Pollution Control Board Part
302. Accessed on line at
http://water.epa.gov/scitech/swguidance/standards/wqslibrary/il_index.cfm
[Indiana WPCB] Indiana Water Pollution Control Board. 2009. Article 2. Water quality
standards - Rule 1. Water quality standards applicable to all waters except waters of the
state within the Great Lakes system. Accessed on-line at
http://water.epa.gov/scitech/swguidance/standards/wqslibrary/in_index.cfm
James, L.F., and J.L. Shupe. 1984. Selenium poisoning in livestock. Rangelands 6(2):64-67.
Janz, D.M. 2012. Selenium. In: Wood, C.M., A.P. Farrell and C.J. Brauner, editors. Fish
physiology: homeostasis and toxicology of essential metals: Vol 31A. San Diego CA (US):
Academic Press, Elsevier Inc. p.327-374.
Janz, D.M., D.K. DeForest, M.L. Brooks, P.M. Chapman, G. Gilron, D. Hoff, W.A. Hopkins,
D.O. McIntyre, C.A. Mebane, V.P. Palace, J.P. Skorupa and M. Wayland. 2010. Selenium
toxicity to aquatic organisms. In: W.J. Adams, M.L. Brooks, C.G. Delos, S.N. Luoma,
W.A. Maher, H.M. Ohlendorf, T.S. Presser and D.P. Shaw, editors. Proceedings from the
SETAC workshop on ecological assessment of selenium in the aquatic environment.
February 2009, Pensacola. Boca Raton FL (US): SETAC in collaboration with CRC Press.
p141-231.
[Japan MoE] Japan Ministry of Environment. 1993. Environmental quality standards for water
pollution. Tokyo, Japan: Ministry of Environment, Water Environment Management
Division, Government of Japan. Accessed on-line at http://www.env.go.jp/en/water/
Jardine, T.D., and K.A. Kidd. 2011. Low concentrations of selenium in stream food webs of
eastern Canada. Science of the Total Environment 409:785-791.

228
Jasonsmith, J.F., W. Maher, A.D. Roach and F. Krikowa. 2008. Selenium bioaccumulation and
biomagnification in Lake Wallace, New South Wales, Australia. Marine and Freshwater
Research 59:1048-1060.
Johnson, W.P., M. Conover, W. Wurtsbaugh and J. Adams. 2006. Conceptual model for
selenium cycling in the Great Salt Lake. Salt Lake City, UT (US): Utah Department of
Environmental Quality, Division of Water Quality. 37p. Accessed on-line at
http://digitalcommons.usu.edu/cgi/viewcontent.cgi?article=1292&context=nrei
Kennedy, C.J., L.E. McDonald, R. Loveridge and M.M. Strosher. 2000. The effect of
bioaccumulated selenium on mortalities and deformities in the egg, larvae, and fry of a
wild population of cutthroat trout (Oncorhynchus clarki lewisi). Archives of Environmental
Contamination and Toxicology 39:46-52.
Khan, M.A.K., and F. Wang. 2009. Mercury-selenium compounds and their toxicological
significance: toward a molecular understanding of the mercury-selenium antagonism.
Environmental Toxicology and Chemistry 28:1567-1577.
Kiffney, P., and A. Knight. 1990. The toxicity and bioaccumulation of selenate, selenite and
seleno-L-methionine in the cyanobacterium Anabaena flos-aquae. Archives of
Environmental Contamination and Toxicology 19:488-494.
Kirk, E.J., R. Maggard and C.M. Mower. 2005. A preliminary study of the selenium levels found
in fishes collected downstream from active coal mining and valley fill operations. West
Virginia Mine Drainage Task Force Symposium, 2005 Proceedings. Accessed on-line at
http://wvmdtaskforce.com/proceedings/05/EdKirk.pdf
Klaverkamp, J.F., C.L. Baron, B.W. Fallis, C.R. Ranson, K.G. Wautier and P. Vanriel. 2002.
Metals and metallothionein in fishes and metals in sediments from lakes impacted by
uranium mining and milling in northern Saskatchewan. Canadian Technical Report of
Fisheries and Aquatic Sciences 2420, 72 p. Accessed on-line at http://www.dfo-
mpo.gc.ca/Library/267553.pdf
Kleckner, A.E., A.R. Stewart, K. Elrick and S.N. Luoma. 2010, Selenium and stable isotopes of
carbon and nitrogen in the benthic clam Corbula amurensis from Northern San Francisco
Bay, California: May 1995–February 2010: U.S. Geological Survey, Open-File Report
2010-1252, 34p. Accessed on-line at
http://pubs.usgs.gov/of/2010/1252/pdf/ofr20101252.pdf
Kock, M.D., D.A. Jessup, R.K. Clark and C.E. Franti. 1987. Effects of capture on biological
parameters in free-ranging bighorn sheep (Ovis canadensis): Evaluation of drop-net, drive-
net, chemical immobilization and the net-gun. Journal of Wildlife Diseases 23(4):641-651.
Kolsteren, P. 1992. Kashin-Back disease. Annales de la Société Belge de Médecine Tropicale
72(2): 81-91.

229
Lakin, H.W. 1961. Selenium content of soils. In: Anderson, M.S., H.W. Lakin, K.C. Beeson,
F.F. Smith and E. Thaker, editors. Selenium in agriculture – Agriculture handbook 200.
Washington, DC (US): US Department of Agriculture. Accessed on-line at
http://naldr.nal.usda.gov/NALWeb/Agricola_Link.asp?Accession=CAT87208445
Lakin, H.W., and D.F. Davidson. 1967. The relationship of the geochemistry of selenium to its
occurrence. In: Muth, O.H., J.E. Oldfield, and P.H. Weswig, editors. Selenium in
biomedicine: first international symposium; 1966 September 6-8; Corvallis, OR. Westport
CT (US): AVI Publishing Company Inc. p27-52.
Lalonde, B.A., W. Ernst and F. Comeau. 2011. Trace metal concentrations in sediments and fish
in the vicinity of ash lagoon discharges from coal-combustion plants in New Brunswick
and Nova Scotia, Canada. Archives of Environmental Contamination and Toxicology
61:472-481.
Langmuir, D., P. Chrostowski, R. Chaney and B. Vigneault. 2003. Issue paper on the
environmental chemistry of metals. Draft. Washington, DC (US): US Environmental
Protection Agency.
LeBlanc, G.A. 1980. Acute toxicity of priority pollutants to water flea (Daphnia magna).
Bulletin of Environmental Contamination and Toxicology 24:684-691.
Lemke, S.L., and H.M. Schwantje. 2005. British Columbia bighorn sheep trace mineral levels: A
compilation of existing data. Victoria, BC (CA): Habitat Conservation Trust Fund and
Wild Sheep Society of BC. 26p.
Lemly, A.D. 1993a. Guidelines for evaluating selenium data from aquatic monitoring ad
assessment studies. Environmental Monitoring and Assessment 28:83-101.
Lemly, A.D. 1993b. Metabolic stress during winter increases the toxicity of selenium in fish.
Aquatic Toxicity 27:133-158.
Lemly, A.D. 1996a. Selenium in aquatic organisms. In: W.N. Beyer, G.H. Heinz and A.W.
Redmon-Norwood, editors. Environmental contaminants in wildlife: Interpreting tissue
concentrations. Boca Raton, FL(US): CRC Press, Lewis Publishers. 494p.
Lemly, A.D. 1996b. Assessing the toxic threat of selenium to fish and aquatic birds.
Environmental Monitoring and Assessment 43:19-35.
Lemly, A.D. 1997a. Ecosystem recovery following selenium contamination in a freshwater
reservoir. Ecotoxicology and Environmental Safety 36:275-281.
Lemly, A.D. 1997b. A teratogenic deformity index for evaluating impacts of selenium on fish
populations. Ecotoxicology and Environmental Safety 37:259-266.
Lemly, A.D. 1998. Pathology of selenium poisoning. In: Frankenberger,W.T. and R.A. Engberg,
editors. Environmental chemistry of selenium. New York, NY (US): Marcel Dekker, Inc.
p281-296.

230
Lemly, A.D. 1999. Selenium transport and bioaccumulation in aquatic ecosystems: A proposal
for water quality criteria based on hydrological units. Ecotoxiciolgy and Environmental
Safety 42:150-156.
Lemly, A.D. 2002a. Symptoms and implications of selenium toxicity in fish: the Belews Lake
case example. Aquatic Toxicology 57:39-49.
Lemly, A.D. 2002b. Selenium assessment in aquatic ecosystems: A guide for hazard evaluation
and water quality criteria. New York, NY (US): Springer. 165p.
Lemly, A.D. 2002c. A procedure for setting environmentally safe total maximum daily loads
(TMDLs) for selenium. Ecotoxicology and Environmental Safety 52:123-127.
Lemly, A.D. 2003. A sediment toxicity threshold value for selenium. Washington DC (US): US
Environmental Protection Agency, Office of Water, Health and Ecological Criteria
Division. 4p.
Lemly, A.D. 2004. Aquatic selenium pollution is a global environmental safety issue.
Ecotoxicology and Environmental Safety 59: 44-56.
Lemly, A.D. 2007. A Procedure of NEPA assessment of selenium hazards associated with
mining. Environmental Monitoring and Assessment 125:361-375.
Lemly, A.D. 2008. Aquatic hazard of selenium pollution from coal mining. In: Fosdyke, G.B.,
editor. Coal mining: Research, technology and safety. Hauppauge, NY (US): Nova Science
Publishers Inc. p167-183.
Lemly, A.D., and J.P. Skorupa. 2007. Technical issues affecting the implementation of US
Environmental Protection Agency’s proposed fish tissue-based aquatic criterion for
selenium. Integrated Environmental Assessment and Management 3(4):552-558.
Lemly, A.D. and G.J. Smith. 1987. Aquatic cycling of selenium: Implications for fish and
wildlife. US Fish and Wildlife Service, Fish and Wildlife Leaflet 12. Washington DC
(US): US Fish and Wildlife Service. 10p.
Levander, O.A. 1977. Metabolic interrelationships between arsenic and selenium. Environmental
Health Perspectives 19:159-164.
Linus Pauling Institute. 2007. Selenium - Micronutrient Information Centre. Corvallis, OR (US):
Oregon State University, Micronutrient Research for Optimal Health. Accessed on-line at
http://lpi.oregonstate.edu/infocenter/minerals/selenium/
Lohner, T.W., R.J. Reash, V.E. Willet and L.A. Rose. 2001a. Assessment of tolerant sunfish
populations (Lepomis sp.) inhabiting selenium-laden coal ash effluents. 1. Hematological
and population level assessment. Ecotoxicology and Environmental Safety 50:203-216.

231
Lohner, T.W., R.J. Reash and M. Williams. 2001b. Assessment of tolerant sunfish populations
(Lepomis sp.) inhabiting selenium-laden coal ash effluents. 2. Tissue biochemistry
evaluation. Ecotoxicology and Environmental Safety 50:217-224.
Lohner, T.W., R.J. Reash, V.E. Willet and J. Fletcher. 2001c. Assessment of tolerant sunfish
populations (Lepomis sp.) inhabiting selenium-laden coal ash effluents. 3. Serum chemistry
and fish health indicators. Ecotoxicology and Environmental Safety 50:225-232.
Longnecker, M.P., P.R. Taylor, O.A. Levander, S.M. Howe, C. Veillon, P.A. McAdam, K.Y.
Patterson, J.M.Holden, M.J. Stampfer, J.S. Morris and W.C. Willet. 1991. Selenium in
diet, blood, and toenails in relation to human health in a seleniferous area. American
Journal of Clinical Nutrition 53:1288-1294 (cited in CCME 2009).
Lorentzen, M., A. Maage and K. Julshamn. 1998. Supplementing copper to a fish meal based
diet fed to Atlantic salmon parr affects liver copper and selenium concentrations.
Aquaculture Nutrition 4:67-72.
Luoma, S.N., and T.S. Presser. 2000. Forecasting selenium discharges to the San Francisco Bay-
Delta Estuary: Ecological Effects of a proposed San Luis Drain extension. US Geological
Survey Open-file Report 00-416. US Department of the Interior and USGS. 185p.
Accessed on-line at http://pubs.usgs.gov/of/2000/ofr00-416/pdf/OFR-00-416_1.pdf
Luoma, S.N., and T.S. Presser. 2009. Emerging opportunities in management of selenium
contamination. Environmental Science and Technology 43(22):8483-8487.
Luoma, S.N., and P.S. Rainbow. 2005. Why is metal bioaccumulation so variable? Biodynamics
as a unifying concept. Environmental Science and Technology 39:1921-1931.
Luoma, S.N., and P.S. Rainbow. 2008. Selenium: Dietary exposure, trophic transfer and food
web effects. In: Metal contamination in aquatic environments: Science and lateral
management. New York, NY (US); Cambridge University Press. 573p.
MacDonald, D.D. 1993. A discussion paper on the development and use of safety, application
and uncertainty factors in the derivation of water quality guidelines for aquatic life. Hull,
PQ (CA): Eco Health Branch, Environment Canada; November 1993. 48p.
MacDonald D.D., T. Berger, K. Wood, J. Brown, T. Johnsen, M.L. Haines, K. Brydges, M.J.
MacDonald, S.L. Smith and D.P. Shaw. 1999. A compendium of environmental quality
benchmarks. Report GBEI/EC-99-001. Vancouver, BC (CA): Environment Canada.
Accessed on-line at
http://www.pyr.ec.gc.ca/georgiabasin/reports/Environmental%20Benchmarks/GB-99-
01_E.pdf
[Mackay] W.C. Mackay and Associates. 2006. Selenium concentrations in the tissues of fish
from the Upper McLeod and Upper Smokey River systems. Innisfail, AB (CA): Alberta
Sustainable Resource Development and Alberta Environment. 49p.

232
MacPherson, A., M.N.I. Barclay, R. Scott and R.W.S. Yates. 1997. Loss of Canadian wheat
lowers selenium intake and status of the Scottish population. In: Fischer P.W.F., M.R.
L’Abbé, K.A. Cockell and R.S. Gibson, editors. Trace elements in man and animals:
Proceedings of the 9th
international symposium on trace elements in man and animals.
Ottawa: NRC Research Press1997: 203–05.
Maher, W, A. Roach, M. Doblin, T. Fan, S. Foster, R. Garrett, G. Möller, L. Oram and D.
Wallschläger. 2010. Environmental sources, speciation, and partitioning of selenium. In:
Adams, W.J., M.L. Brooks, C.G. Delos, S.N. Luoma, W.A. Maher, H.M. Ohlendorf, T.S.
Presser and D.P. Shaw, editors. Proceedings from the SETAC workshop on ecological
assessment of selenium in the aquatic environment. February 2009, Pensacola. Boca Raton
FL (US): SETAC in collaboration with CRC Press.p47-91.
Maier, K.J., and A.W. Knight. 1993. Comparative acute toxicity and bioconcentration of
selenium by the midge Chironomus decorus exposed to selenate, selenite, and seleno-DL-
methionine. Archives of Environmental Contamination and Toxicology 25:365-370.
Maier, K.J., and A.W. Knight. 1994. Ecotoxicology of selenium in freshwater systems. Reviews
of Environmental Contamination and Toxicology 134:31-48.
Maier, K.J., C.R. Nelson, F.C. Bailey, S.J. Klaine and A.W. Knight. 1998. Accumulation of
selenium by the aquatic biota oa a watershed treated with seleniferous fertilizer. Bulletin of
Environmental Contamination and Toxicology 60:409-416.
Malchow, D.E., A.W. Knight and K.J. Maier. 1995. Bioaccumulation and toxicity of selenium in
Chironomus decorus larvae fed a diet of seleniferous Selenastrum capricornutum.
Archives of Environmental Contamination and Toxicology 29:104-109.
Malloy, J.C., M.L. Meade and E.W. Olsen. 1999. Small-scale spatial variation of selenium
concentrations in Chironomid larvae. Bulletin of Environmental Contamination and
Toxicology 62:122-129.
Manitoba Conservation. 2002. Manitoba Water Quality Standards, Objectives, and Guidelines.
Manitoba Conservation Report 2002-11. Final Draft: November 22, 2002. Accessed on-
line at http://www.gov.mb.ca/waterstewardship/water_quality/quality/mwqsog_2002.pdf
Manitoba Conservation. 2007. Concentrations of metals and other elements in surface soils of
Flin Flon, Manitoba and Creighton Saskatchewan, 2006. Report number 2007-01, July
2007. Manitoba Conservation. Accessed on-line at
http://www.gov.mb.ca/conservation/wildlife/ecosys/pdf/flinflon_synopsis.pdf
Marier, J.R., and J.F. Jaworski. 1983. Interactions of selenium. Associate Committee on
Scientific Criteria of Environmental Quality, Division of Biological Sciences. Publication
No. 20643 of the Environmental Secretariat. Ottawa, ON (CA): National Research Council
of Canada. 84p.
233
Martin, A. J., D. Wallschläger, J. London, C.I.E. Wiramanaden, I.J. Pickering, N.Belzile, Y-W.
Chen and S. Simpson. 2008. The biogeochemical behaviour of selenium in two lentic
environments in the Elk River Valley, British Columbia. Proceedings of the 32nd
Annual
British Columbia Mine Reclamation Symposium; 2008 September 15–18; Kamloops, BC
(CA): British Columbia Technical and Research Committee on Reclamation (TRCR).
Accessed on-line at https://circle.ubc.ca/handle/2429/6934.
Martin, A.J., S. Simpson, S. Fawcett, C.I. E. Wiramanaden, I.J. Pickering, N. Belzile, Y-W.
Chen, J. London and D. Wallschläger. 2011. Biogeochemical mechanisms of selenium
exchange between water and sediments in two contrasting lentic environments.
Environmental Science and Technology 45:2605-2612.
Martin, M., K.E. Osborn, P. Billig and N. Glickstein. 1981. Toxicities of ten metals to
Crassostrea gigas and Mytilus edulis embryos and Cancer magister larvae. Marine
Pollution Bulletin 12(9): 305-308.
May, T.W., M.J. Walther, J.D. Petty, J.F. Fairchild, J. Lucero, M. Delvaux, J. Manring, M.
Armbruster and D. Hartman. 2001. An evaluation of selenium concentrations in water,
sediment, invertebrates, and fish from the Republican River basin: 1997-1999.
Environmental Monitoring and Assessment 72:179-206.
Mayland, H.F. 1994. Selenium in plant and animal nutrition. In: Frankenberger, W.T. and S.
Benson, editors. Selenium in the environment. New York, NY (US): Marcel Dekker, Inc.
p29-46.
McAuley, C., and L.D. Knopper. 2011. Impacts of traditional food consumption advisories:
Compliance, changes in diet and loss of confidence in traditional foods. Environmental
Health 10(Suppl 1):55
McDonald, L.E. 2008. Coalbed gas baseline water quality survey. Environmental Resource
Information Project, Coalbed Gas Strategy. Report prepared for Resource Development
and Geoscience Branch, Ministry of Energy, Mines and Petroleum Resources. 194p.
McDonald, L.E. 2009. Survey of selenium in water, zooplankton and fish in Lake Koocanusa,
British Columbia, 2008. Cranbrook, BC (CA): Environmental Protection, British Columbia
Ministry of Environment and the Elk Valley Selenium Task Force. 84p. Accessed on-line
at http://a100.gov.bc.ca/pub/eirs/enterEirs.do?repository=EPD&redirect=Y (search
keyword selenium)
McDonald, L.E., and M.M. Strosher. 1998. Selenium mobilization from surface coal mining in
the Elk River basin, British Columbia: A survey of water, sediment and biota. Cranbrook,
BC (CA): Ministry of Environment, Lands and Parks. 66p. Accessed on-line at
http://www.env.gov.bc.ca/wat/wq/studies/seleniumelk.pdf

234
McDonald, L.E., and M.M. Strosher. 2000. Selenium in the Elk River Basin, British Columbia:
A review of findings and discussion of implications for assessment and management.
Procedings of the 24th
Annual British Columbia Mine Reclamation Symposium; 2000 June
19-22; Williams Lake, BC (CA): British Columbia Technical and Research Committee on
Reclamation (TRCR). Accessed on-line at https://circle.ubc.ca/handle/2429/6934
McDonald, B.G., A.M.H. deBruyn, J.R.F. Elphick, M. Davies, D. Bustard and P.M. Chapman.
2010. Developmental toxicity of selenium to Dolly Varden char (Salvelinus malma).
Environmental Toxicology and Chemistry 29(12):2800-2805.
McIntyre, D.O., M.A. Pacheco, M.W. Garton, D. Wallschläger and C.G. Delos. 2008. Effect of
selenium on juvenile bluegill sunfish at reduced temperature. Washington, DC (US):
Health and Ecological Criteria Division, Office of Water, US Environmental Protection
Agency, Contract #68-C-04-006. EPA-822-R-08-020. 63p.
McKeague, J.A., and M.S. Woynetz. 1980. Background levels of minor elements in some
Canadian soils. Geoderma 24:299-307 (cited in CCME 2009).
McNeal, J.M., and L.S. Balistrieri. 1989. Goechemistry and occurrenece of selenium: An
overview. In: Jacobs, L.W., editor. Selenium in agriculture and the environment. Madison,
WI (US): Soil Science Society of America (SSSA) Special Publication No 23. p1-13.
McPhail, J.D. 2007 The freshwater fishes of British Columbia. Edmonton, AB (CA): The
University of Alberta Press. 692p.
Michigan Department of Community Health. 2010. Michigan fish advisory - A family guide to
eating Michigan fish. Lansing MI (US): Division of Environmental Health. Accessed on-
line at http://www.michigan.gov/documents/FishAdvisory03_67354_7.pdf
Michigan Department of Community Health. 2011. Interim consumption screening values for
total selenium – Goose Lake selenium. Lansing, MI (US): U.S. Department of Health and
Human Services, Agency for Toxic Substances and Disease Registry and Michigan
Department of Community Health. Accessed on-line at
http://www.atsdr.cdc.gov/HAC/pha/GooseLakeSelenium/GooseLakeSeleniumLHCFINAL
3102011.pdf
Mikkelsen, R.L., A.L. Page and F.T. Bingham. 1989. Factors affecting selenium accumulation
by agricultural crops. Selenium in agriculture and the environment. Madison, WI (US):
Soil Science Society of America (SSSA) Special Publication No 23. p.65-94.
Miller, L.L., F. Wang, V.P. Palace and A. Hontela. 2007. Effects of acute and subchronic
exposures to waterborne selenite on the physiological stress response and oxidative stress
indicators in juvenile rainbow trout. Aquatic Toxicology 83:263-271.
Miller, L.L., J.B. Rasmussen, V.P. Palace and A. Hontela. 2009. Physiological stress response in
white suckers from agricultural drain waters containing pesticides and selenium.
Ecotoxicology and Environmental Safety 72:1249-1256.
235
Milne, J.B. 1998. The uptake and metabolism of inorganic selenium species. In:
Frankenberger,W.T. and R.A. Engberg, editors. Environmental chemistry of selenium.
New York, NY (US): Marcel Dekker Inc. p459-478.
Miltimore, J.E., A.L. Van Ryswyck, W.L. Prinble, F.M. Chapman and C.M. Kalnin. 1975.
Selenium concentrations in British Columbia forages, grains, and processed feeds.
Canadian Journal of Animal Science 55:101-111.
[MDDEP] Ministère du Développement durable, de l'Environnement et des Parcs (Ministry of
Sustainable Development, Environment and Parks). 2009. Critères de qualité de l'eau de
surface. Direction du suivi de l’état de l’environnement, Ministère du Développement
durable, de l'Environnement et des Parcs, Québec, 506 p. Accessed on-line at
http://www.mddep.gouv.qc.ca/eau/criteres_eau/index.asp
Minnow Environmental Inc. 2004. Selenium uptake in biota inhabiting lentic and lotic areas of
the Elk River watershed. Sparwood, BC (CA): Elk Valley Selenium Task Force. 242p.
Minnow Environmental Inc. 2006. Evaluation of selenium related deformities among Columbia
spotted frog tadpoles in wetlands downstream of coal mines in the Elk Valley, BC.
Sparwood, BC (CA): Elk Valley Selenium Task Force. 182p.
Minnow Environmental Inc. 2013. Mount Polley Mine selenium monitoring 2012. Likely, BC
(CA): Mount Polley Mining Corp. 88p.
Minnow Environmental Inc., Interior Reforestation Co. Ltd., and Paine, Ledge and Associates.
2007. Selenium monitoring in the Elk Valley watershed, B.C. (2006). Sparwood, BC (CA):
Elk Valley Selenium Task Force. 579p.
Minnow Environmental Inc., Interior Reforestation Co. Ltd., and Paine, Ledge and Associates.
2009. Selenium monitoring in the Elk Valley watershed, B.C. (2009) (draft). Calgary, AB
(CA): Teck Coal Limited. 363p.
Minnow Environmental Inc., Interior Reforestation Co. Ltd., and Paine, Ledge and Associates.
2011. Selenium Monitoring in the Elk River Watershed, B.C. (2009). Calgary AB (CA):
Teck Coal Limited. 363p.
Minnow Environmental Inc., and Paine, Ledge and Associates. 2006. Evaluation of selenium
related effects among embryo-larval longnose sucker in the Elk Valley, BC. Sparwood, BC
(CA): Elk Valley Selenium Task Force. 206p.
[MoEE] Ministry of Environment and Energy. 1987. Rationale for the Establishment of Ontario's
Water Quality Objectives. Toronto, ON (CA): Ontario Ministry of Environment and
Energy. 236p.

236
[MoEE] Ministry of Environment and Energy. 1994. Water management policies, guidelines,
provincial water quality objectives of the Ministry of Environment and Energy. Toronto,
ON (CA): Ontario Ministry of Environment and Energy. 67p. Accessed on-line at
http://www.ene.gov.on.ca/stdprodconsume/groups/lr/@ene/@resources/documents/resourc
e/std01_079681.pdf
Ministry of Water, Land and Air Protection. 2003. British Columbia field sampling manual for
continuous monitoring and the collection of air, air-emission, water, wastewater, soil,
sediment, and biological samples. 2003 edition (permittee). Victoria, BC (CA): BC
Ministry of Water, Land, and Air Protection, Water, Air, and Climate Change Branch.
401p. Accessed on-line at http://www.env.gov.bc.ca/epd/wamr/labsys/field_man_03.html
Moore, S.B., J. Winckel, S.J. Detwiler S.A. Klasing, P.A. Gaul, N.R. Kanim, B.E. Kesser, A.B.
DeBevec, K. Beardsley and L.K. Puckett. 1990. Fish and wildlife resources and
agricultural drainage in the San Joaquin Valley, California. Sacramento, CA (US): San
Joaquin Valley Drainage Program. 1030p.
Morrisey, C.A., L.I. Bendell-Young and J.E. Elliott. 2004. Linking contaminant profiles to the
diet and breeding location of American dippers using stable isotopes. Journal of Applied
Ecology 41:402-512.
Mosher, B.W., and R.A Duce. 1989. The atmosphere. In: Ihnat, M., editor. Occurrence and
distribution of selenium. Boca Raton, FL (US): CRC Press Inc. p 295 - 326.
Muscatello, J.R., A.M. Belknap and D.M. Janz. 2008. Accumulation of selenium in aquatic
systems downstream of a uranium mining operation in northern Saskatchewan, Canada.
Environmental Pollution 156:387-393.
Muscatello, J.R., P.M. Bennett, K.T. Himbeault, A.M. Belknap and D.M. Janz. 2006. Larval
deformities associated with selenium accumulation in northern pike (Esox lucius) exposed
to metal mining effluent. Environmental Science and Technology 40:6506-6512.
Muscatello, J.R., and D.M. Janz. 2009a. Selenium accumulation in aquatic biota downstream of
a uranium mining and milling operation. Science of the Total Environment 407:1318-1325.
Muscatello, J.R., and D.M. Janz. 2009b. Assessment of larval deformities and selenium
accumulation in northern pike (Esox lucius) and white sucker (Catostomus commersoni)
exposed to metal mining effluent. Environmental Toxicology and Chemistry 28(3):609-
618.
Nagpal, N.K. 2001. Ambient water quality guidelines for selenium: Overview report. Victoria,
BC (CA): BC Ministry of Water, Land and Air Protection, Water Protection Branch.
Accessed on-line at
http://www.env.gov.bc.ca/wat/wq/BCguidelines/selenium/selenium.html

237
Nagpal, N. K., and Howell, K. 2001. Water quality guidelines for selenium: Technical appendix.
Victoria, BC (CA): BC Ministry of Water, Land and Air Protection, Water Protection
Branch. Accessed on-line at
http://www.env.gov.bc.ca/wat/wq/BCguidelines/selenium/index.html
Nakamuro, K., T. Okouno and T. Hasegawa. 2000. Metabolism of selenoamino acids and
contribution of selenium methylation to their toxicity. Journal of Health Sciences
46(6):418-421.
National Health and Medical Research Council and the Natural Resource Management
Ministerial Council. 2011. Australia drinking water quality guidelines 6. National Health
and Medical Research Council. Accessed on-line at:
http://www.nhmrc.gov.au/guidelines/publications-subject
[NLM] National Library of Medicine. 1993. Glossary for chemists of terms used in toxicology.
International Union of Pure and Applied Chemistry (IUPAC), Clinical Chemistry Division,
Commission on Toxicology, IUPAC Recommendations 1993. Accessed on-line at
http://sis.nlm.nih.gov/enviro/glossarymain.html
[NRC] National Research Council 1983. Selenium in nutrition. Revised Edition. Washington DC
(US): Subcommittee on Selenium, Committee on Animal Nutrition, National Academy
Press.
[NAQUADAT]. National Water Quality Data Bank. 1985. Draft document (unpublished). Water
Quality Branch, Inland Waters Directorate, Environment Canada, Ottawa. (cited in CCME
2009, see GW section 4.2.4.1)
[NRCan] Natural Resources Canada. 2009a. Canadian minerals yearbook 2008. Accessed on-
line at http://www.nrcan-rncan.gc.ca/mms-smm/busi-indu/cmy-amc/2008revu/pdf/stat-stat-
eng.pdf
[NRCan] Natural Resources Canada. 2009b. Mineral production. Annual statistics. Preliminary
2008 mineral production of Canada by province and territory. Accessed on-line at
http://mmsd.mms.nrcan.gc.ca/stat-stat/prod-prod/PDF/2008p.pdf
Nautilus Environmental and Interior Reforestation Co. Ltd. 2011. Evaluation of the effects of
selenium on early life stage development of westslope cutthroat trout from the Elk Valley,
BC. Sparwood, BC (CA): Elk Valley Selenium Task Force. 82p + appendices.
Nebraska Department of Environmental Quality. 2010. Findings of the 2006 to 2008 regional
ambient fish tissue program in Nebraska. Lincoln, NB (US): Nebraska Department of
Environmental Quality, Water Quality Assessment Section. Accessed on-line at
http://www.deq.state.ne.us/Publica.nsf/Pages/WAT155
Nelson, D.A., J.E. Miller and A. Calabrese. 1988. Effect of heavy metals on bay scallops, surf
clams, and blue mussels in acute and long-term exposures. Archives of Environmental
Contamination and Toxicology 17(5):595-600.

238
NewFields. 2009. Brown trout laboratory reproduction studies conducted in support of
development of a site-specific selenium criterion. Pocatello ID (US): J.R. Simplot
Company. Unpublished manuscript dated 2009-06-17. 101p.
[NLWRMD] Newfoundland and Labrador Water Resources Management Division. 2010.
Selenium contours based on Canada-Newfoundland Water Quality Monitoring Agreement
data. Water Resources Management Division and Environment Canada, Department of
Environment and Conservation. Accessed on-line at
http://www.env.gov.nl.ca/env/waterres/quality/background/contours.html
Neumann, P.B., T.W. Coffindaffer and P.E. Cothran. 1996. Clinical investigation comparing 1%
selenium sulfide and 2% ketoconazole shampoos for dandruff control. Cosmet Dermatol
9(12):20-26 in [ATSDR] Agency for Toxic Substances and Disease Registry. 2003.
Toxicological profile for selenium. Atlanta, GA (US): US Department of Health and
Human Services, Public Health Service. 457p. Accessed on-line at
http://www.atsdr.cdc.gov/toxprofiles/tp92.pdf
Newman, M.C., A.W. McIntosh and V.A. Greenhut. 1983. Geochemical factors complicating the
use of aufwuchs as a biomonitor for lead levels in two New Jersey reservoirs. Water
Resources 17(6):625-630.
Newman, M.C., and M.A. Unger. 2003. Fundamentals of ecotoxicology, second edition. Boca
Raton, FL (US): Lewis Publishers, CRC Press. 458p.
Noda, M., T. Takano and H. Sakurai. 1979. Mutagenic activity of selenium compounds.
Mutation Research 66:175-179 (cited in CCME 2009).
Nogueira, C.W., and J.B.T. Rocha. 2011. Toxicology and pharmacology of selenium: emphasis
on synthetic organoselenium compounds. Archives of Toxicology 85:1313-1359.
North/South Consultants Inc. 2009. Selenium concentrations in sediment, benthic invertebrates
and fish collected from the North Saskatchewan River - 2009. Fort Saskatchewan, AB
(CA): Shell Canada Limited, Report # 379-1b. 32p.
Norwegian Pollution Control Authority. 2008. Environmental fate and ecotoxicology of
engineered nanoparticles. Report no. TA 2304/2007. Joner, E.J., T. Hartnik, and C.E.
Amundsen, editors. Âs, Norway: Bioforsk. 64p.
Nova Scotia Environment. 2009. Nova Scotia Environment web site for surface water data, maps
and publications. Accessed on-line at
http://www.gov.ns.ca/nse/surface.water/surfacewater.research.asp#databases
Nriagu, J.O. 1989. Global cycling of selenium. In: Ihnat, M., editor. Occurrence and distribution
of selenium. Boca Raton, FL (US): CRC Press Inc. p328-340.
Nriagu, J.O., and J.M. Pacyna. 1988. Quantitative assessment of worldwide contamination of air,
water and soils by trace metals. Nature 333(12):134-139.
239
Nriagu, J.O., and H.K. Wong. 1983. Selenium pollution of lakes near the smelters at Sudbury,
Ontario. Nature 301:55-57.
[OEHHA] Office of Environmental Health Hazard Assessment. 2008. Development of fish
contaminant goals and advisory tissue levels for common contaminants in California
sport fish: Chlordane, DDTs, dieldrin, methylmercury, PCBs, selenium, and toxaphene.
Sacramento, CA(US): California Environmental Protection Agency, Office of
Environmental Health Hazard Assessment, Pesticide and Environmental Toxicology
Branch.
[OEHHA] Office of Environmental Health Hazard Assessment. 2009. 2009 update of California
sport fish advisories. Sacramento, CA (US): California Environmental Protection Agency,
Office of Environmental Health Hazard Assessment. Accessed on-line at
http://www.oehha.ca.gov/fish/pdf/DiscAdvyUpdates032309.pdf
[OEHHA] Office of Environmental Health Hazard Assessment. 2010. Public health goals for
contaminants in drinking water: Selenium. Sacramento, CA (US): California
Environmental Protection Agency, Office of Environmental Health Hazard Assessment.
Accessed on-line at http://www.oehha.ca.gov/fish/pdf/DiscAdvyUpdates032309.pdf
Ogle, R.S., K.J. Maier, P. Kiffney, M.J. Williams, A. Brasher, L.A. Melton and A.W. Knight.
1988. Bioaccumulation of selenium in aquatic ecosystems. Lake and Reservoir
Management 4(2):165-173.
Ogle, R.S., and A.W. Knight. 1996. Selenium bioaccumulation in Aquatic ecosystems: 1. Effects
of sulfate on the uptake and toxicity of selenate in Daphnia magna. Archives of
Environmental Contamination and Toxicology 30:274-279.
Ohlendorf, H.M. 1989. Bioaccumulation and effects of selenium in wildlife. In: Jacobs, L.W.,
editor. Selenium in agriculture and the environment. Madison WI (US): Soil Science
Society of America (SSSA) Special Publication No 23. p133-177.
Ohlendorf, H.M. 2003. Ecotoxicology of selenium. In: Hoffman, D.J., B.A. Rattner, G.A.
Burton, Jr., J. Cairns, Jr., editors. Handbook of ecotoxicology. 2nd
ed. Boca Raton, FL
(US): CRC Press Inc. p465-500.
Ohlendorf, H.M. 2007. Threshold values for selenium in Great Salt Lake: Selections by the
science panel. Final technical memorandum. Prepared by CH2M HILL for the Great Salt
Lake Science Panel. Salt Lake City, UT (US): Utah Department of Environmental Quality.
Accessed on-line at http://www.deq.utah.gov/Issues/GSL_WQSC/selenium.htm
Ohlendorf, H.M., S.M. Covington, E.R. Byron and C.A. Arenal. 2008. Approach for conducting
site-specific assessments of selenium bioaccumulation in aquatic systems. Washington DC
(US): North American Metals Council. Accessed on-line at
http://www.namc.org/selenium.html
240
Ohlendorf, H.M., S.M. Covington, E.R. Byron and C.A. Arenal. 2011. Conducting site-specific
assessments of selenium bioaccumulation in aquatic systems. Integrated Environmental
Assessment and Management 7(3):314-324.
Ohlendorf, H.M., J. DenBleyker, W.O. Moellmer and T. Miller. 2009. Development of a site-
specific standard for selenium in open waters of Great Salt Lake, Utah. Natural Resources
and Environmental Issues 15, Article 4. Accessed on-line at
http://digitalcommons.usu.edu/nrei/vol15/iss1/4/
Ohlendorf, H.M., and G.H. Heinz. 2011. Selenium in birds. In: W.N. Beyer and J.P. Meador,
editors. Environmental contaminants in biota: interpreting tissue concentrations. 2nd
ed.
Boca Raton, FL (US): CRC Press Inc., Taylor and Francis Group. p.669-701.
Ohlendorf, H.M., D.J. Hoffman, M.K. Saiki and T.W. Aldrich. 1986. Embryonic mortality and
abnormalities of aquatic birds: Apparent impacts of selenium from irrigation drainwater.
Science of the Total Environment 52:49-63.
Ohlendorf, H.M., A.W. Kilness, J.L. Simmons, R.K. Stroud, D.J. Hoffman and J.F. Moore. 1988.
Selenium toxicosis in wild aquatic birds. Journal of Toxicology and Environmental Health
24: 67-92.
Ohlendorf, H.M., and G.M. Santolo. 1994 Kesterson Reservoir — Past, present, and future: An
ecological risk assessment. In: Frankenberg, W.T., and S. Bensen, editors. Selenium in the
environment. New York, NY (US): Marcel Dekker, Inc. p 69-117.
Oldfield J. E. 2002. A brief history of selenium research: from alkali disease to prostate cancer
(from poison to prevention). American Society of Animal Science. Accessed on-line at
http://www.asas.org/Bios/Oldfieldhist.pdf
[Ontario MoE] Ontario Ministry of Environment. 2004. City of Greater Sudbury 2001 urban soil
survey. Toronto, ON (CA): Ontario Ministry of the Environment, Environmental Sciences
and Standards Division. Report No. SDB-008-3511-2003. Accessed on-line at
http://www.sudburysoilsstudy.com/EN/media/support/reports/2001SoilsData/VOL_I/MOE
_Report.pdf
Orr, P.L., K.R. Guiguer and C.K. Russel. 2006. Food chain transfer of selenium in lentic and
lotic habitats of a western Canadian watershed. Ecotoxicology and Environmental Safety
63:175-188.
Orr, P.L., C.I.E. Wiramanaden, M.D. Paine, W. Franklin, and C. Fraser. 2012. Food chain model
based on field data to predict westslope cutthroat trout (Oncorhynchus clarkii lewesi) ovary
selenium concentrations from water selenium concentrations in the Elk Valley, British
Columbia. Environmental Toxicology and Chemistry 31(3):672-680.
Ort, J.F., and J.D. Latshaw. 1978. The toxic level of sodium selenite in the diet of laying
chickens. Journal of Nutrition 108:1114-1120.

241
Outridge, P.M., A.M. Scheuhammer, G.A. Fox, B.M. Braune, L.M. White, L.J. Gregorich and C.
Keddy. 1999. An assessment of the potential hazards of environmental selenium for
Canadian water birds. Environmental Reviews 7:81-96.
Palace, V.P., N.M. Halden, P. Yang, R.E. Evans and G. Sterling. 2007. Determining residence
patterns of rainbow trout using laser ablation inductively coupled plasma mass
spectrometry (LA-ICP-MS) analysis of selenium in otoliths. Environmental Science and
Technology 41:3679-3683.
Palace, V.P., J.E. Spallholz, J. Holm, K. Wautier, R.E. Evans and C.L. Baron. 2004. Metabolism
of selenomethionine by rainbow trout (Oncorhynchus mykiss) embryos can generate
oxidative stress. Ecotoxicology and Environmental Safety 58:17-21.
Paveglio, F.L., and K.M. Kilbride. 2007. Selenium in aquatic birds from central California.
Journal of Wildlife Management 71(8):2550-2555.
Pease, W., K. Taylor, J. Lacy and M. Carlin. 1992. Technical report: Derivation of site-specific
water quality criteria for selenium in San Francisco Bay. Oakland, CA (US): San Francisco
Bay Regional Water Quality Control Board. 44p.
Peterson, J.A., and A.V. Nebeker. 1992. Estimation of waterborne selenium concentrations that
are toxicity thresholds for wildlife. Archives of Environmental Contamination and
Toxicology 23:154-162.
Phippen, B.W. 2003a. Water quality assessment of the Salmon River above Alces River (1981-
2002). Kamloops BC (CA): BC Ministry of Environment and Environment Canada
Canada-British Columbia Water Quality Monitoring Agreement. 43p. Accessed on-line at
http://a100.gov.bc.ca/appsdata/acat/documents/r11292/salmon_river_hyder_119706375841
1_8e248a68ce6db2058957a3c4c72b7f9946ebc46ad7f.pdf
Phippen, B.W. 2003b. Water quality assessment of the Peace River near Hyder, Alaska (1984-
2002). Kamloops BC (CA): BC Ministry of Environment and Environment Canada,
Canada-British Columbia Water Quality Monitoring Agreement. 42p. Accessed on-line at
http://www.env.gov.bc.ca/wat/wq/quality/peace_alces/peace_river_alces_river.pdf
Pieterek, T., and M. Pietrock. 2012. Comparative selenium toxicity to laboratory-reared and
field-collected Hyalella azteca (Amphipoda, Hyalellidae). Water, Air and Soil Pollution
223:4245-4252.
Pollack, B., and K.L. Machin. 2009. Effects of cadmium, mercury, and selenium on reproductive
indices in male lesser scaup (Aythya affinis) in the western boreal forest. Archives of
Environmental Contamination and Toxicology 54:730-739.
Pommen, L.W. 2005. Water quality assessment of Flathead River at International Border (1980-
2004). Victoria, BC (CA): BC Ministry of Environment and Environment Canada, Canada-
British Columbia Water Quality Monitoring Agreement. 48p. Accessed on-line at
http://www.env.gov.bc.ca/wat/wq/quality/flathead/flathead_river_wq_2004.pdf
242
Pond, G.J., M.E. Passmore, F.A. Borsuk, L. Reynolds and C.J. Rose. 2008. Downstream effects
of mountaintop coal mining: comparing biological conditions using family- and genus-
level macroinvertebrate bioassessment tools. Journal of the North American Benthological
Society 27(3):717-737.
Posthuma, L., G.W. Suter and T.P. Traas. 2002. Species sensitivity distributions in
ecotoxicology. Boca Raton, FL(US): CRC Press.
Presser, T. S. 1994a. Geologic origin and pathways of selenium from the California Coast
Ranges to the west-central San Joaquin Valley. In: Frankenberger, W.T. and S. Benson,
editors. Selenium in the environment. New York, NY (US): Marcel Dekker Inc. p139-156.
Presser, T.S. 1994b. The Kesterson effect. Environmental Management 18(3):437-454.
Presser, T.S., and S.N. Luoma. 2006. Forecasting selenium discharges to the San Francisco Bay-
Delta estuary: Ecological effects of a proposed San Luis Drain extension. Professional
Paper 1646. Reston, VA (US): U.S. Department of the Interior, U.S. Geological Survey.
209p.
Presser, T.S., and S.N. Luoma. 2010. A methodology for ecosystem-scale modeling of selenium.
Integrated Environmental Assessment and Management 6(4):685-710.
Presser, T.S., and H.M. Ohlendorf. 1987. Biochemical cycling of selenium in the San Joaquin
Valley, California, USA. Environmental Management 11(6):805-821.
Presser, T.S., D.Z. Piper, K.J. Bird, J.P. Skorupa, S.J. Hamilton, S.J. Detwiler and M.A.
Huebner. 2004. The Phosphoria Formation: A model for forecasting global selenium
sources to the environment. In: J.R. Hein, editor. Handbook of exploration and
environmental geochemistry. Amsterdam, NL: Elsevier. p299-319.
Presser, T.S., M.A. Sylvester and W.H. Low. 1994. Bioaccumulation of selenium from natural
geologic sources in Western States and its potential consequences. Environmental
Management 18(3):423-436.
Puls, R. 1994. Mineral levels in animal health: Diagnostic data. 2nd
ed. Clearbrook, BC (CA):
Sherpa International. 360p.
Purkerson, D.G., M.A. Doblin, S.M. Bollens, S.N. Luoma and G.A. Cutter. 2003. Selenium in
San Francisco Bay zooplankton: potential effects of hydrodynamics and food web
interactions. Estuaries 26(4A):956-969.
Pyle, G.G., S.M. Swanson, and D.M. Lehmkuhl. 2001. Toxicity for uranium mine-receiving
waters to caged fathead minnows, Pimephales promelus. Ecotoxicology and
Environmental Safety 48(2):202-214.
Quinn, C.F., M.L. Galeas, J.L. Freeman and E.A.H. Pilon-Smits. 2007. Selenium: Deterrence,
toxicity, and adaptation. Integrated Environmental Assessment and Management 3:460-
462.

243
Ralston, N.V.C., J. Unrine and D. Wallschläger. 2008. Biogeochemistry and analysis of selenium
and its species. Washington DC (US): North American Metals Council. 61p.
Rayman, M. 2000. The importance of selenium to human health. The Lancet 356:233-241.
Rayman, M. 2012. Selenium and human health. The Lancet 379:1256-1268.
Rayman, M., H.G. Infante and M. Sargent. 2008. Food-chain selenium and human health:
spotlight on speciation. British Journal of Nutrition 100:254-268.
Raymond, B.A., D.P. Shaw, K. Kim, J. Nener, C. Baldazzi, R. Brewer, G. Moyle, M. Sekela and
T. Tuominen. 2001. Fraser River Action Plan resident fish contaminant and health
assessment. Vancouver, BC (CA): Environment Canada, Environmental Conservation
Branch. Report no. DOE FRAP 1998-20. 429p. Accessed on-line at
http://research.rem.sfu.ca/frap/9820.pdf
Reilly, C. 2006. Selenium in food and health. Second edition. New York, NY (US): Springer
Science and Business Media LLC.
Rex, J.F., and N.B. Carmichael. 2002. Guidelines for monitoring fine sediment deposition in
streams. Filed test edition. Victoria, BC (CA): BC Ministry of Environment, Resource
Information and Standards Committee. 121p. Accessed on-line at
http://www.ilmb.gov.bc.ca/risc/pubs/aquatic/sediment/Sediment.pdf
Richardson, G.M. 1997. Compendium of Canadian human exposure factors for risk assessment.
Ottawa, ON (CA): O’Connor Associates Environmental Inc. (cited in Health Canada
2004b)
Riedel, G.F., and J.G. Sanders. 1996. The influence of pH and media compositions on the uptake
of inorganic selenium by Chlamydomonas reinhardtii. Environmental Toxicology and
Chemistry 15(9):1577-1583.
Rosenfeld, I., and O.A. Beath. 1964. Selenium in relation to public health. In: Selenium:
Geobotany, biochemistry, toxicity, and nutrition. New York, NY (US): Academic Press, p
279-289. (cited in OEHHA 2010).
Rudolph, B.L., I. Andreller and C.J. Kennedy. 2008. Reproductive success, early life stage
development, and survival of westslope cutthroat trout (Oncorhynchus clarki lewisi)
exposed to elevated selenium in an area of active coal mining. Environmental Science and
Technology 42:3109-3114.
Saiki, M.K., B.A. Martin, S.E. Schwarzbach and T.W. May. 2001. Effects of an agricultural
drainwater bypass on fishes inhabiting the Grassland Water District and the Lower San
Joaquin River, California. North American Journal of Fisheries Management 21:624-635.
Saiki, M.K., B.A. Martin and T.W. May. 2004. Reproductive status of western mosquitofish
inhabiting selenium-contaminated waters in the Grassland Water District, Merced County,
California. Archives of Environmental Contamination and Toxicology 47:363-369.

244
Sanders, R.W., and C.C. Gilmore. 1994. Accumulation of selenium in a model freshwater
microbial food web. Applied and Environmental Microbiology 60(8):2677-2683.
Sandholm, M., H.E. Oksanen and L. Pesonen. 1973. Uptake of selenium by aquatic organisms.
Limnology and Oceanography 18(3):496-499.
Santolo, G.M., J.T. Yamamoto, J.M. Pisenti and B.W. Wilson. 1999. Selenium accumulation and
effects on reproduction in captive American kestrels fed selenomethionine. Journal of
Wildlife Management 63:502-511.
Sappington, K.G. 2002. Development of aquatic life criteria for selenium: a regulatory
perspective on critical issues and research needs. Aquatic Toxicity 57:101-113.
Saskatchewan Environment. 2006. Surface water quality objectives. Interim ed. EPB 356.
Regina, SK (CA): Saskatchewan Ministry of Environment. Accessed on-line at
http://www.publications.gov.sk.ca/details.cfm?p=24517
Saskatchewan Ministry of Environment. 2008. Elevated lead, nitrate and selenium in drinking
water 1995-2008. Regina, SK (CA): Saskatchewan Ministry of Environment. Accessed on-
line at http://www.saskh2o.ca/PDF/MapLead_Nitrate_Selenium.pdf .
Schlekat, C.E., D.G. Purkerson and S.N. Luoma. 2004. Modeling selenium bioaccumulation
through arthropod food webs in San Francisco Bay, California, USA. Environmental
Toxicology and Chemistry 23(12):3003-3010.
Schultz, R., and R. Hermanutz. 1990. Transfer of toxic concentrations of selenium from parent to
progeny in the fathead minnow (Pimephales promelas). Environmental Contamination and
Toxicology 45:568-573.
Schwarz, C.J. 2011. Estimating tissue transfer functions for selenium in fish. Burnaby, BC(CA):
Department of Statistics and Actuarial Science, Simon Fraser University. Report prepared
for the BC Ministry of Environment. 113p. Accessed on-line at
http://www.env.gov.bc.ca/wat/wq/wq_guidelines.html (see Appendix A of the Se WQG
documents)
SciWrite. 2004. Uptake of selenium and productivity in waterfowl in the Elk River Valley,
British Columbia. Sparwood, BC (CA): Elk Valley Selenium Task Force. 42p.
Scott, W.B., and E.J. Crossman. 1973. Freshwater fishes of Canada. Fisheries Research Board of
Canada, Bulletin 184. Ottawa, ON (CA). 974p.
See, K.A., P.A. Lavercombe, J. Dillon and R. Ginsberg. 2006. Accidental death from acute
selenium poisoning. Medical Journal of Australia 185:388-389.
Seiler, R.L., J.P. Skorupa and L.A. Peltz. 1999. Areas susceptible to irrigation-induced selenium
contamination of water and biota in the Western United States. U.S. Geological Survey
Circular 1180. Accessed on-line at http://pubs.usgs.gov/circ/circ1180/pdf/circ1180.pdf
245
Seiler, R.L., J.P. Skorupa, D.L. Naftz and B.T. Nolan. 2003. Irrigation-induced contamination of
water, sediment, and biota in the Western United States – Synthesis of data from the
National Irrigation Water Quality Program. Denver, CO (US): U.S. Geological Survey,
National Irrigation Water Quality Program, Professional Paper 1655. 131p.
Severi, A. 2001. Toxicity of selenium to Lemna minor in relation to sulfate concentration.
Physiologia Plantarium 113:523-532.
Shamberger, R.J. 1969. Possible protective effect of selenium against human cancer. Canadian
Medical Association Journal 100:682.
Shamberger, R.J. 1985. The genotoxicity of selenium. Mutation Research/Reviews in Genetic
Toxicology 154(1):29-48.
Simmons, D.B.D., and D. Wallschläger. 2005. A critical review of the biogeochemistry and
ecotoxicology of selenium in lotic and lentic environments. Environmental Toxicology and
Chemistry 24(6):1331-1343.
Skorupa, J.P. 1998. Selenium poisoning of fish and wildlife in nature: Lessons from twelve real-
world examples. In: Frankenberger, W.T., and R.A. Engberg, editors. Environmental
chemistry of selenium. New York, NY (US): Marcel Dekker. p315-418.
Skorupa, J.P. 1999. Beware missing data and undernourished statistical models. Human and
Ecological Risk Assessment 5(6):1255-1262.
Skorupa, J.P., S.P. Morman and J.S. Sefchick-Edwards. 1996. Guidelines for interpreting
selenium exposures of biota associated with non-marine aquatic habitats. Sacramento CA
(US): U.S. Fish and Wildlife Service, National Irrigation Water Quality Program. 74p.
Skorupa, J.P., and H.M. Ohlendorf. 1991. Contaminants in drainage water and avian risk
thresholds. In: Dinar, A., and D. Zilberman, editors. The economics and management of
water and drainage in agriculture. New York, NY (US): Kluwer Academic Publishers.
p345-368.
Smith, M.I., and B.B. Westfall. 1936. The selenium problem in relation to public health. Public
Health Reports 51: 1496-1505.
Smith, M.I., and B.B. Westfall. 1937. Further field studies on the selenium problem in relation to
public health. Public Health Reports 52: 1375-1384.
Somers, G., B. Raymond and W. Uhlman. 1999. PEI water quality interpretive report.
Charlottetown, PE (CA): PEI Department of Environment, Energy and Forests. 74p.
Accessed on-line at http://www.gov.pe.ca/photos/original/waterquality_99.pdf
Sorensen, E.M. 1991. Metal poisoning in fish. Boca Raton, FL (US): CRC Press.
246
Sorenson, E.M., P.M. Cumbie, T.L. Bauer, J.S. Bell and C.W Harlan. 1984. Histopathology,
hematological, condition-factor, and organ weight changes associated with selenium
accumulation in fish from Belews Lake, North Carolina. Archives of Environmental
Contamination and Toxicology 13:153-162.
Spallholz, J.E. 1994. On the nature of selenium toxicity and carcinostatic activity. Free Radical
Biology and Medicine 17(1):45-64.
Spallholz, J.E. and D.J. Hoffman. 2002. Selenium toxicity: Cause and effects in aquatic birds.
Aquatic Toxicology 57:27-37.
Spencer, P., M.F. Bowman and M.G. Dube. 2008. A multitrophic approach to monitoring the
effects of metal mining in otherwise pristine and ecologically sensitive rivers in Northern
Canada. Integrated Environmental Assessment and Management 4(3):327-343.
Stanley, T.R., G.J. Smith, D.J. Hoffman, G.H. Heinz and R. Rosscoe. 1996. Effects of boron and
selenium on mallard reproduction and duckling growth and survival. Environmental
Toxicology and Chemistry 15(7):1124-1132.
[Stantec] Stantec Consulting Ltd. 2009. Metals in surface water, sediment, fish and blueberry
samples collected near Flin Flon Manitoba and Creighton Saskatchewan. File No.
160960429, April 2009. 193p. Accessed on-line at
http://www.flinflonsoilsstudy.com/documents/METALSINSURFACEWATERSEDIMEN
TFISHANDBLUEBERRYSAMPLES.pdf
Statistics Canada. 2010. Report on energy supply and demand in Canada 2008. Manufacturing
and Energy Division, Catalogue No. 57-003-X. February 2010. Accessed on-line at
http://dsp-psd.pwgsc.gc.ca/collection_2010/statcan/57-003-X/57-003-x2008000-eng.pdf
Stephan, C.E., D.I. Mount, D.J. Hansen, J.R. Gentile, G.A. Chapman and W.A. Brungs. 1985.
Guidelines for deriving numerical national water quality criteria for the protection of
aquatic organisms and their uses. Washington DC (US): U.S. EPA, report PB85-227049.
59p. Accessed on-line at http://water.epa.gov/scitech/swguidance/standards/criteria/aqlife/
Stewart, A.R., S.N. Luoma, C.E. Schletkat, M.A. Doblin and K.A. Hieb. 2004. Food web
pathway determines how selenium affects aquatic ecosystems: a San Francisco Bay case
study. Environmental Science and Technology 38:4519-4526.
Stewart, R., M. Grosell, D. Buchwalter, N. Fisher, S. Luoma, T. Mathews, P. Orr and W-X.
Wang. 2010. Bioaccumulation and trophic transfer of selenium. In: W.J. Adams, M.L.
Brooks, C.G. Delos, S.N. Luoma, W.A. Maher, H.M. Ohlendorf, T.S. Presser and D.P.
Shaw, editors. Proceedings from the SETAC workshop on ecological assessment of
selenium in the aquatic environment. February 2009, Pensacola. Boca Raton FL (US):
SETAC in collaboration with CRC Press. p93-139.
Stranges, S., S. Sieri, M. Vinceti, S. Grioni, E. Guallar, M. Laclaustra, P. Muti, F. Berrino and V.
Krogh. 2010. A prospective study of dietary selenium intake and risk of type 2 diabetes.
BMC Public Health 10:564.

247
Subramanian, K.S., and J.C. Méranger. 1984. A survey of sodium, potassium, barium, arsenic,
and selenium in Canadian drinking water supplies. Atomic Spectroscopy 5:34-36.
Sui, K.W., and S.S. Berman. 1989. The marine environment. In: Ihnat, M., editor. Occurrence
and distribution of selenium. Boca Raton, FL (US): CRC Press Inc., p263 – 294.
Suter, G.W., and L.W. Barnthouse. 2000. Modelling toxic effects on populations: Experience
from aquatic studies. In: Albers, P.H., G.H. Heinz and H.M. Ohlendorf, editors.
Environmental contaminants and terrestrial vertebrates: effects on populations,
communities, and ecosystems. Pensacola, FL (US): SETAC Special Publication, SETAC
Press. p177-187.
Sverdrup, H.U., M.W. Johnson and R.H. Fleming. 1942. The oceans, their physics, chemistry
and general biology. New York, NY (US): Prentice-Hall. 1087p. Accessed on-line at
http://ark.cdlib.org/ark:/13030/kt167nb66r/ and at
http://publishing.cdlib.org/ucpressebooks/view?docId=kt167nb66r
Swain, L.G. 2007a. Water quality assessment of Fraser River at Red Pass (1984-2004). Victoria,
BC (CA): BC Ministry of Environment and Environment Canada, Canada-British
Columbia Water Quality Monitoring Agreement. 42p. Accessed on-line at
http://www.env.gov.bc.ca/wat/wq/quality/wqfrrp/fraser_red_pass_2006.pdf
Swain, L.G. 2007b. Water quality assessment of Fraser River at Marguerite (1984-2004).
Victoria, BC (CA): BC Ministry of Environment and Environment Canada, Canada-British
Columbia Water Quality Monitoring Agreement. 80p. Accessed on-line at
http://www.env.gov.bc.ca/wat/wq/quality/sowqofr2/fraser_marguerite.pdf
Swain, L.G. 2007c. Water quality assessment of Fraser River at Hope (1979-2004). Victoria, BC
(CA): BC Ministry of Environment and Environment Canada, Canada-British Columbia
Water Quality Monitoring Agreement. 80p. Accessed on-line at
http://www.env.gov.bc.ca/wat/wq/quality/hope/wq_fraser_riv_hope_2004.pdf
Swain, L.G. 2007d. Water quality assessment of Elk River at Highway 93 near Elko (1968-
2005). Victoria, BC (CA): BC Ministry of Environment and Environment Canada, Canada-
British Columbia Water Quality Monitoring Agreement. 103p. Accessed on-line at
http://www.env.gov.bc.ca/wat/wq/quality/elk_riv_hwy93/elk_hwy93_05.pdf
Swain, L.G. 2007e. Water quality assessment of Elk River at Sparwood (2002-2005). Victoria,
BC (CA): BC Ministry of Environment and Environment Canada, Canada-British
Columbia Water Quality Monitoring Agreement. 67p. Accessed on-line at
http://www.env.gov.bc.ca/wat/wq/quality/elk_sparwood/elk_sparwood_05.pdf
Swift, M.C. 2002. Stream ecosystem response to, and recovery from, experimental exposure to
selenium. Journal of Aquatic Ecosystem Stress and Recovery 9:159-184.
Tashjian, D.H., S.J. Teh, A. Sogomonyan and S.S.O. Hung. 2006. Bioaccumulation and chronic
toxicity of dietary L-selenomethionine in juvenile white sturgeon (Acipenser
transmountanus). Aquatic Toxicology 79(4):401-409.

248
Teh, S.J., X. Deng, F-C. Teh, S.S.O. Hung, T. W-M. Fan, J.Liu and R.M. Higashi. 2004. Chronic
effects of dietary selenium on juvenile Sacramento splittail (Pogonichthys
macrolepidotus). Environmental Science and Technology 38:6085-6093.
Terry, N., A.M. Zayed, M.P. deSouza and A.S. Tarun. 2000. Selenium in higher plants. Annual
Review of Plant Physiology and Plant Molecular Biology 51:401-432.
Thomas, J.K., and D.M. Janz. 2011. Dietary selenomethionine exposure in adult zebrafish alters
swimming performance, energetics and the physiological stress response. Aquatic
Toxicology 102:79-86.
Thomas, B.V., A.W. Knight and K.L Maier. 1999. Selenium bioaccumulation by the water
boatman Trichocorixa reticulate (Guerin-Meneville). Archives of Environmental
Contamination and Toxicology 36:295-300.
Thompson, J.N., P. Erdody and D.C. Smith. 1975. Selenium content of food consumed by
Canadians. The Journal of Nutrition 105:274–77.
Thompson, P.A., J. Kurias and S. Mihok. 2005. Derivation and use of sediment quality
guidelines for ecological risk assessment of metals and radionuclides released to the
environment from uranium mining activities in Canada. Environmental Monitoring and
Assessment 110:71-85.
Turner, M.A., and A.L. Swick. 1983. The English-Wabigoon River system: IV. Interaction
between mercury and selenium accumulated from waterborne and dietary sources by
northern pike (Esox lucius). Canadian Journal of Fisheries and Aquatic Science 40:2241-
2250.
[USDOI] United States Department of the Interior. 1998. Guidelines for interpretation of the
biological effects of selected constituents in biota, water and sediment — Selenium.
National Irrigation Water Quality Program Information Report No. 3. November 1998.
47p. Accessed on-line at http://www.usbr.gov/niwqp/guidelines/pdf/Selenium.pdf
[USEPA] United States Environmental Protection Agency. 1987. Ambient water quality criteria
for selenium – 1987. EPA-440/5-87-008, September 1987. Washington, DC (US): Office
of Science and Technology, Office of Water, U.S. EPA. 128p. Accessed on line at
http://www.epa.gov/nscep/index.html
[USEPA] United States Environmental Protection Agency. 1991. National Primary and
Secondary Drinking Water Regulations, Final Rule, Selenium, January. U.S. EPA, Rules
and Regulations, 40 CFR Parts 141, 142, and 143, 56 FR (20):3538-9. Accessed online at
http://water.epa.gov/lawsregs/rulesregs/sdwa/chemicalcontaminantrules/upload/FR1-30-
91.pdf
[USEPA] United States Environmental Protection Agency. 1994. Determination of trace
elements in water and wastes by inductively coupled plasma – mass spectrometry.
Cincinnati, OH (US): U.S. Environmental Protection Agency. 57p. Accessed on-line at
http://water.epa.gov/scitech/methods/cwa/methods_index.cfm

249
[USEPA] United States Environmental Protection Agency. 1996a. Method 3050B: Acid
digestion of sediments, sludges and soils. Washington, DC (US): U.S. Environmental
Protection Agency. 12p. Accessed on-line at
http://www.epa.gov/osw/hazard/testmethods/sw846/pdfs/3050b.pdf
[USEPA] United States Environmental Protection Agency. 1996b. Method 3052: Microwave
assisted acid digestion of siliceous and organically bound based matrices. Washington, DC
(US): U.S. Environmental Protection Agency. 20p. Accessed on-line at
http://www.epa.gov/osw/hazard/testmethods/sw846/pdfs/3052.pdf
[USEPA] United States Environmental Protection Agency. 2000a. Guidance for assessing
chemical contaminant data for use in fish advisories. Volume 1. Fish Sampling and
Analysis. Third Edition. EPA 823-B-00-008. November 2000. Washington, DC (US): U.S.
Environmental Protection Agency, Office of Water.
[USEPA] United States Environmental Protection Agency. 2000b. Guidance for assessing
chemical contaminant data for use in fish advisories. Volume 2. Risk assessment and fish
consumption limits. Third Edition. EPA 823-B-00-008. November 2000. Washington, DC
(US): U.S. Environmental Protection Agency, Office of Water.
[USEPA] United States Environmental Protection Agency. 2000c. Overview of Risk
Management. Volume 3. Risk assessment and fish consumption limits. 3rd
edition. EPA
823-B-00-008. November 2000. Washington, DC (US): U.S. Environmental Protection
Agency, Office of Water.
[USEPA] United States Environmental Protection Agency. 2000d. Risk Communication.
Volume 4. Risk assessment and fish consumption limits. 3rd
edition. EPA 823-B-00-008.
November 2000. Washington, DC (US): U.S. Environmental Protection Agency, Office of
Water.
[USEPA] United States Environmental Protection Agency. 2004. Draft aquatic life water quality
criteria for selenium - 2004. EPA-822-D-04-001, November 2004. Washington DC (US):
U.S. Environmental Protection Agency, Office of Science and Technology. 90p. Accessed
on-line at
http://water.epa.gov/scitech/swguidance/standards/upload/2008_10_27_criteria_seleniums
_maintext.pdf
[USEPA] United States Environmental Protection Agency. 2006. EPA Science Advisory Board
(SAB) consultation on a proposed framework for revising the guidelines for deriving water
quality criteria for the protection of aquatic life. Summary of the minutes of the SAB
meeting Sept 21, 2005. Accessed on-line at
http://nepis.epa.gov/EPA/html/pubalphaindex.html
[USEPA] United States Environmental Protection Agency. 2009. Drinking water contaminants
— List of contaminants and their MCLs. EPA 816-F-09-0004, May 2009. Accessed on-
line at http://water.epa.gov/drink/contaminants/index.cfm#List

250
[USEPA] United States Environmental Protection Agency. 2011a. Letter from C. L. Campbell,
US EPA Region 8, to A. Smith, Utah Department of Environmental Quality, Re: EPA
Action on the Gilbert Bay selenium criterion and footnote (14). Dated December 12,
2011.Accessed on-line at
http://www.deq.utah.gov/workgroups/gsl_wqsc/docs/2012/Jan/2011UTGilbertBaySeEPA
ApprovalFinal.PDF
[USEPA] United States Environmental Protection Agency. 2011b. Appendix G: Summaries of
chronic studies considered for FCV derivation. In: Draft aquatic life water quality criteria
for selenium – 2011. Washington, DC (US): U.S. Environmental Protection Agency,
Office of Science and Technology. 101p.
[USEPA] United States Environmental Protection Agency. 2011c. Appendix C: Conversions. In:
Draft aquatic life water quality criteria for selenium – 2011. Washington, DC (US): U.S.
Environmental Protection Agency, Office of Science and Technology. 26p.
[USEPA Mid-Atlantic Region] United States Environment Protection Agency Mid-Atlantic
Region. 2010. Regional screening level (RSL) fish ingestion table. November 2010.
Accessed on-line at
http://www.epa.gov/reg3hwmd/risk/human/pdf/NOVEMBER_2010_FISH.pdf
[USGS] United States Geological Survey. 2008. 2007 Minerals yearbook – Selenium and
tellurium (advance release). Michael W. George, author, January 2008. Accessed on-line at
http://minerals.usgs.gov/minerals/pubs/commodity/selenium/myb1-2007-selen.pdf
[USGS] United States Geological Survey. 2009a. Minerals information. Accessed on-line at
http://minerals.usgs.gov/minerals/pubs/commodity/selenium/
[USGS] United States Geological Survey. 2009b. Mineral commodity summaries, January 2009.
Accessed on-line at http://minerals.usgs.gov/minerals/pubs/commodity/selenium/mcs-
2009-selen.pdf
[USGS] United States Geological Survey. 2009c. Bacterial formation of nano-scaled materials
from group 15 and 16 elements (Se, Te, and As). Nanatechnology. Accessed on-line at
http://microbiology.usgs.gov/nanotechnology_energy_sources.html
United States National Institute of Health. 2009. Dietary Supplement Fact Sheet: Selenium.
Bethesda, MD (US):. U.S. National Institute of Health, Office of Dietary Supplements.
Unrine, J.M., W.A. Hopkins, C.S. Romanek and B.P. Jackson. 2007. Bioaccumulation of trace
elements in omnivorous amphibian larvae: Implications for amphibian health and
contaminant transport. Environmental Pollution 149:182-192.
Utah Department of Health. 2010. Environmental Epidemiology Program. Accessed on-line at
http://www.fishadvisories.utah.gov/advisories.htm#utah

251
Utah Department of Health. 2011. Utah fish advisories. Division of Wildlife Resources and the
Utah Department of Environmental Quality. Accessed on-line at
http://www.fishadvisories.utah.gov/health_risks.htm
Valentine, J.L. 1997. Environmental occurrence of selenium in waters and related health
significance. Biomedical and Environmental Sciences 10:292-299.
Van Derveer, W.D., and S.P. Canton. 1997. Selenium sediment toxicity thresholds and
derivation of water quality criteria for freshwater biota of western streams. Environmental
Toxicology and Chemistry 16(6):1260-1268.
Van Kirk, R.W., and S.L. Hill. 2006. Demographic model predicts trout population response to
selenium based on individual-level toxicity. Ecological Modelling 206:407-420.
Vendeland, S.C., J.T. Deagen and J.A. Wanger. 1994. Uptake of selenite, selenomethionine and
selenate by brush border membrane vesicles isolated from rat small intestine. Biometals
7(4):305-312. Accessed on-line at http://www.ncbi.nlm.nih.gov/pubmed/7812115
Vidal, D., S.M. Bay and D. Schlenk. 2005. Effects of dietary selenomethionine on larval rainbow
trout (Oncorhynchus mykiss). Archives of Environmental Contamination and Toxicology
49:71-75.
Vinceti, M., E.T. Wei, C. Malagoli, M. Bergomi and G. Vivoli. 2001. Adverse health effects of
selenium in humans. Reviews of Environmental Health 16:233-251.
Vocke, R.W., K.L. Sears, J.J. O’Toole and R.B. Wildman. 1980. Growth responses of selected
freshwater algae to trace elements and scrubber ash slurry generated by coal-fired power
plants. Water Research 14(2): 141-150.
Waitkins, G.R., and C.W. Clark. 1945. Selenium dioxide: Preparation, properties and use as
oxidizing agent. Chemical Reviews 36(3):235-289.
Warmer, H., and R. van Dokkum. 2002. Water pollution control in the Netherlands: Policy and
practice 2001. Lelystad, NL: Institute for Inland Water Management and Waste Water
Treatment. RIZA report 2022.009. 77p. Accessed on-line at
http://www.helpdeskwater.nl/algemene-onderdelen/serviceblok/english/water-
quality/@1041/waterpollution/
Wayland, M., and R. Crosley. 2006. Selenium and other trace elements in aquatic insects in coal
mine-affected streams in the Rocky Mountains of Alberta, Canada. Archives of
Environmental Contamination and Toxicology 50:511-522.
Wayland, M., J. Kneteman and R. Crosley. 2006. The American dipper as a bioindicator of
selenium contamination in a coal mine-affected stream in west-central Alberta, Canada.
Environmental Monitoring and Assessment 123:285-298.

252
Wayland, M., R. Casey and E. Woodsworth. 2007. A dietary assessment of selenium risk to
aquatic birds on a coal mine affected stream in Alberta, Canada. Human and Ecological
Risk Assessment 13:823-842.
Webber, T.N. 1997. State of water quality of the Bear River at Stewart, BC 1987-1994. Victoria
BC (CA): Canada-British Columbia Water Quality Monitoring Agreement, Ministry of
Environment and Environment Canada. Accessed on-line at
http://www.env.gov.bc.ca/wat/wq/quality/bear/swqbrs.html
Weech, S.A., A.M. Scheuhammer and M.E. Wayland. 2011. Selenium accumulation and
reproduction in birds breeding downstream of a uranium mill in northern Saskatchewan,
Canada. Ecotoxicology 21(1):280-288
Wells, F.C., G.A. Jackson and W.J. Rogers. 1988. Reconnaissance investigation of water quality,
bottom sediment, and biota associated with irrigation drainage in the lower Rio Grande
Valley and Laguna Atascosa National Wildlife Refuge, Texas, 1986-87. Water Resources
Investigations Report 87-4277. Austin, TX (US): U.S. Geological Survey.
Wen, H., and J. Carignan. 2009. Ocean to continent transfer of atmospheric Se as revealed by
epiphytic lichens. Environmental Pollution 157:2790 – 2797.
West Virginia Department of Health and Human Resources. 2011. West Virginia fish
consumption advisories. Appendix C. Accessed on-line at
http://www.wvdhhr.org/fish/default.asp
[WV DEP] West Virginia Department of Environmental Protection. 2009.Emergency rule:
Requirements governing water quality standards (Title 47 Legislative Rule, Series 2).
Accessed on-line at
http://water.epa.gov/scitech/swguidance/standards/wqslibrary/wv_index.cfm
[WVDHHR] West Virginia Department of Health & Human Resources. 2010. Fish consumption
advisories available for 2010. Accessed on-line at http://www.wvdhhr.org/fish/current.asp
Wetzel R.G. 2001.Limnology - Lake and river ecosystems. San Diego, CA (US): Academic
Press. 1006 p.
Whanger, P.D. 1989. China, A country with both selenium deficiency and toxicity: Some
thoughts and impressions. Journal of Nutrition 119(9):1236-1239.
White, D.H., J.R. Bean and J.R. Longcore. 1977. Nationwide residues of mercury, lead,
cadmium, arsenic and selenium in starlings, 1973. Pesticides Monitoring Journal 11:35-39
(cited in Skorupa et al. 1996)
Williams M.J., R.S. Ogle, A.W. Knight and R.G. Burau. 1994. Effects of sulfate uptake on
toxicity in the green algae Selenastrum capricornutum. Archives of Environmental
Contamination and Toxicology 27:449-453.
253
Wiramanaden, C.I.E., E.K. Forster and K. Liber. 2010. Selenium distribution in a lake system
receiving effluent from a metal mining and milling operation in northern Saskatchewan,
Canada. Environmental Toxicology and Chemistry 29(3):606-616.
[WHO] World Health Organization. 2003. Selenium in drinking-water: Background document
for development of WHO guidelines for drinking-water quality. Report
WHO/SDE/WSH/03.04/13, Geneva, SZ: World Health Organization. 13p. Accessed on-
line at http://www.who.int/water_sanitation_health/dwq/chemicals/en/selenium.pdf
Wren, C.D. 1984. Distribution of metals in the tissues of beaver, racoon and otter from Ontario,
Canada. Science of the Total Environment 34:177-184.
Wren, C.D., P.M. Stokes and K.L. Fischer. 1986. Mercury levels in Ontario mink and otter
relative to food levels and environmental acidification. Canadian Journal of Zoology
64:2854-2859.
Wright, W.G. 1999. Oxidation and mobilization of selenium by nitrate in irrigation drainage.
Journal of Environmental Quality 28:1182-1187.
Yang, G., S. Yin, R. Zhou, L. Gu, B. Yan, Y. Liu and Y. Liu. 1989. Studies of safe maximal
daily dietary Se-intake in a seleniferous area in China. Part II. Relation between Se-
intake and the manifestation of clinical signs and certain biochemical alterations in blood
and urine. Journal of Trace Elements and Electrolytes in Health and Disease 3: 123-130.
Yang, G-Q., S-Z. Wang and R-H. Zhou. 1983. Endemic selenium intoxication of humans in
China. American Journal of Clinical Nutrition 37:872-881.
Yang, G-Q., and R-H. Zhou. 1994. Further observations on the human maximum safe dietary
selenium intake in a seleniferous area of China. Journal of Trace Elements and Electrolytes
in Health and Disease 8:159-165.
Yoshida, S. M. Haratake, T. Fuchigami and M. Nakayama. 2011. Selenium in seafood materials.
Journal of Health Science 57(3):215-224.
Young, T., K. Finley, W.J. Adams, J. Besser, W.D. Hopkins, D. Jolley, E. McNaughton, T.S.
Presser, D.P. Shaw and J. Unrine. 2010. What you need to know about selenium. In: W.J.
Adams, M.L. Brooks, C. G. Delos, S.N. Luoma, W.A. Maher, H.M. Ohlendorf, T.S.
Presser and D.P. Shaw, editors. Proceedings from the SETAC workshop on ecological
assessment of selenium in the aquatic environment. Pensacola, February 2009. Boca
Raton, FL (US): SETAC in collaboration with CRC Press. p.7-46.
Yu, R-Q., and W-X. Wang. 2004. Biological uptake of Cd, Se(IV) and Zn by Chlamydomonas
reinhardtii in response to different phosphate and nitrate additions. Aquatic Microbial
Ecology 35:163-173.
Yudovich, Ya.E., and M.P. Ketris. 2006. Selenium in coal: a review. International Journal of
Coal Geology 67:112-126.

254
Zhang, L., and W-X. Wang. 2007. Size-dependence of the potential for metal biomagnification
in early life stages of marine fish. Environmental Toxicology and Chemistry 26(4):787-
794.
Zubel, M. 2000. Groundwater conditions of the Columbia Valley Aquifer Cultus Lake, British
Columbia. Surrey, BC (CA): Ministry of Environment, Lands and Parks, Water
Management. 98p. Accessed on-line at
http://www.env.gov.bc.ca/wsd/plan_protect_sustain/groundwater/library/cvreport.pdf

255
Appendix A - Fish Tissue Regression Model
Estimating tissue transfer functions for Se in fish
Carl James Schwarz
Department of Statistics and Actuarial Science
Simon Fraser University
Burnaby, BC V5A 1S6
2011-09-28
This report, the associated tables and figures, and the Excel spreadsheets for the simple (separate
line for each species) and the random effects tissue transfer models may be accessed on-line at
BC MoE’s website for water quality guidelines under selenium:
http://www.env.gov.bc.ca/wat/wq/wq_guidelines.html

256
Appendix B - Summary of Consumption Guidelines for Utah, Michigan
and West Virginia
Table B.1 Safe eating guideline for fish, State of Utah (Utah Department of Health, Division of
Wildlife Resources, and the Utah Department of Environmental Quality, 2011).
Waterbody County Contaminant Species
Pregnant
Women &
Children
*4 oz.
meals/month
Adults
8 oz.
meals/month
Lower Ashley
Creek
drainage &
Stewart Lake
Uintah Selenium Fish/Ducks Avoid
Consumption
No more than
1
6 oz.
serving/month
Table B.2 Fish consumption advisory for selenium, Mount Storm and Upper Mud Lakes;
Pinnacle Creek, West Virginia (West Virginia Department of Health and Human Resources,
2011).
When the concentration of selenium reaches these levels in fish tissue, the recommended
fish consumption advice should restrict intake amounts to:
Minimum
(mg/kg or ppm)
Maximum
(mg/kg or ppm)
Group Meal Restriction
<2.50 1 Up to 225 meals per
year (no restrictions)
2.50 10.83 2 Up to 1 meal per
week
>10.83 23.47 3 Up to 2 meals per
month
>23.47 46.93 4 Up to 1 meal per
month
>46.93 93.86 5 Up to 6 meals per
year
>93.86 6 DO NOT EAT

257
Table B.3 Interim consumption screening values for total selenium, Goose Lake, Michigan
(Michigan Department of Community Health 2011).
Meal Category Total meals per
year
Selenium Fish Consumption Screening
Values µg/g wet weight
No Restrictions Not applicable less than or equal to (<) 2.5
One meal per week 52 great than (>) 2.5 to < 7.4
One meal per month 12 > 7.4 to ≤ 32
Six meals per year 6 > 32 to ≤ 64
Do Not Eat 0 > 64