ambitious nascent entrepreneurs and national innovativeness
TRANSCRIPT

H200702
Ambitious Nascent Entrepreneurs
and National Innovativeness
Kashifa Suddle
Jolanda Hessels
Zoetermeer, April, 2007
2
This report is published under the SCALES-initiative (SCientific AnaLysis of
Entrepreneurship and SMEs), as part of the 'SMEs and Entrepreneurship programme'
financed by the Netherlands Ministry of Economic Affairs.
Most recent EIM reports and much more on SMEs and Entrepreneurship can be found at:
www.eim.nl/smes-and-entrepreneurship.
address:
mail address:
telephone:
telefax:
website:
Italiëlaan 33
P.O. Box 7001
2701 AA Zoetermeer
+ 31 79 343 02 00
+ 31 79 343 02 01
www.eim.nl
The responsibility for the contents of this report lies with EIM. Quoting numbers or text in
papers, essays and books is permitted only when the source is clearly mentioned. No part of
this publication may be copied and/or published in any form or by any means, or stored in a
retrieval system, without the prior written permission of EIM.
EIM does not accept responsibility for printing errors and/or other imperfections.
3
Ambitious Nascent Entrepreneurs and National Innovativeness
Kashifa Suddlea and Jolanda Hessels
a
a EIM Business and Policy Research, P.O. Box 7001, 2701 AA Zoetermeer, the Netherlands [email protected] & [email protected]
ABSTRACT
This explorative study investigates whether ambitions amongst nascent entrepreneurs regarding innovation matter for the national level of innovativeness. We link ambitious nascent entrepreneurship to the national level of innovativeness for 36 countries participating in the Global Entrepreneurship Monitor. We find a significant positive relation between the level of nascent entrepreneurs who intend to offer a product or service that is new to all or to some of their customers and the national technology level. This suggests that ambitions to offer new products or services may contribute to higher levels of competition and knowledge spillovers, and consequently to the emergence of highly innovative economies. Our results also suggest that this relationship is non-existent in poor countries.
JEL-code: L26, M13, O31
Keywords: ambitions, nascent entrepreneurship, innovativeness
Acknowledgement: The authors would like to thank Roy Thurik and André van Stel for their
useful comments on earlier versions.
Corresponding author: Kashifa Suddle, EIM Business and Policy Research, P.O. Box 7001, 2701 AA Zoetermeer, the Netherlands, [email protected], tel. +31 79 343 02 74

4
INTRODUCTION
Both by academics and by policy makers, entrepreneurship is recognised as one of the driving forces behind economic growth (Schumpeter, 1934; Wennekers and Thurik, 1999; van Stel, Carree and Thurik, 2005). Entrepreneurship may contribute to economic growth, because entrepreneurs are important for introducing and realizing innovations (e.g. Audretsch and Thurik, 2000; Autio, 1994; Acs and Audretsch, 2003). Innovative entrepreneurs are considered as one of the main links between entrepreneurship and economic growth (Minniti, Bygrave and Autio, 2006). Furthermore, (technological) innovation is regarded as a major force for economic growth (Rosenberg, 2004). As part of the new partnership for growth and jobs, the European Commission has indicated that it should be a key priority for the Member States of the European Union to invest more in knowledge and innovation (Commission of the European Communities, 2006). The idea is that the provision of innovative goods and services by the private sector will translate into growth and jobs. This paper concentrates on the relationship between innovative entrepreneurial ambitions and national levels of innovativeness. In the lifecycle of business startups, entrepreneurial activity starts from the point that potential entrepreneurs are involved in concrete activities to start up a new business before actually owning their new business. This pre-startup phase is also known as nascent entrepreneurship (Reynolds and White, 1992). This stage of the entrepreneurial process is vital for the further development of the firm, as a significant proportion of those attempting to establish a business fail (van Gelderen, Thurik and Bosma, 2006). Research on nascent entrepreneurship tends to focus either on explaining why some people are involved in nascent entrepreneurship and others are not, or on why some nascent entrepreneurs make the transition into business and why others do not (Johnson, Parker and Wijbenga, 2006). However, there are hardly any studies that link nascent entrepreneurship to macro-economic outcomes (an exception is a study by Wennekers, van Stel, Thurik and Reynolds. (2005) that investigates the relationship between nascent entrepreneurship and the level of economic development). Innovative entrepreneurship starts with nascent entrepreneurs that have the ambition to introduce or realize a new business idea. We intend to contribute to the empirical literature on entrepreneurship and macro-economic outcomes by investigating whether ambitions regarding innovativeness amongst nascent entrepreneurs make a significant contribution to national levels of innovation. We study the impact of expectations about innovativeness among nascent entrepreneurs on a related macro-economic indicator for national levels of innovation, i.e. the technology index. This technology index is taken from the Global Competitiveness Report 2005-2006. The study provides insight into the question whether entrepreneurial ambitions are important for developing innovative competitive economies. This is not straightforward as the ambitions of these entrepreneurs are yet to be realised at the time these ambitions are expressed (Stam, Suddle, Hessels and van Stel, 2006). We use macro-level analysis so that it will be possible to incorporate direct as well as indirect effects of innovative ambitions amongst nascent entrepreneurs (e.g. through increased levels of competition and knowledge spillovers) on macro-economic outcomes. The structure of the paper is as follows. First, we will present a review of the theoretical and empirical literature on the link between (nascent) entrepreneurship, innovation and macro-economic outcomes. In the empirical part of the paper we will present the data and research method and the results of the empirical analysis of the link between ambitious nascent entrepreneurs and national innovativeness. Finally, we discuss the outcomes and present some conclusions.

5
LITERATURE REVIEW
Entrepreneurship and innovation Innovation involves the targeted renewal of products, services or working methods. Schumpeter (1934) believed that innovation was the central characteristic of the entrepreneurial undertaking, as he argues that one behaves as an entrepreneur only when carrying out innovations (Carland et al., 1984). In literature, it is increasingly recognized that entrepreneurial small firms make an important contribution to the realization of innovations and to technological change and a country’s innovativeness (e.g. Audretsch and Thurik, 2000; Acs and Varga, 2005; Dolfsma and Van der Panne, 2006). The background for this increased recognition is that as a result of e.g. globalization, deregulation, processes of outsourcing and new emerging technologies, from the 1970s onwards there has been a shift from a “managed economy” to an “entrepreneurial economy” in developed economies (Audretsch and Thurik 2001, 2004). In the entrepreneurial economy the competitive advantage has become increasingly based on new knowledge or knowledge-based economic activity (Audretsch, 2004). Whereas after World War II until the beginning of the 1980s the general understanding was that mainly large firms, with economies of scale and scope, made an important contribution to innovation, since the 1980s it is increasingly regarded that small firms tend to have an innovative advantage. This innovative advantage stems for example from the fact that innovative activity will be generated more easily in an environment that is not subject to bureaucratic constraints (Link and Bozeman, 1991). In large firms the decision to innovate – which can be a risky decision, because it is often uncertain whether the innovation will be economically viable – has to survive several bureaucratic layers, while in small firms the decision to innovate is made by relatively few people. Innovative entrepreneurs can be considered as such in case of new-product announcements (Kleinknecht, Van Montfort and Brouwer 2002; Dolfsma and Van der Panne, 2006). Entrepreneurs may introduce innovations by offering products and services that are new or unique. Products or services may be regarded as truly innovative if they are perceived as new by customers, if there are no or few competitors that offer the same product or service and when it uses a technology or product that is new to the market (Minniti, Bygrave and Autio, 2006). Entrepreneurs innovate, for example, in order to be able to better address the demands of customers, to improve their competitiveness or to achieve better financial results for their businesses.
Nascent entrepreneurs and their ambitions Entrepreneurship starts with nascent entrepreneurs. Nascent entrepreneurs are those who are actively involved in setting up their own business. They are individuals who take steps to found a new business, but have not yet succeeded in making the transition to new business ownership (Carter, Gartner and Reynolds 1996). This pre-startup phase is in literature known under various names, amongst which organisational emergence (cf. Gartner, Bird and Starr, 1992) and gestation (cf. Reynolds and Miller, 1992). These terms are related to the first stage in the lifecycle of business startups, namely when potential entrepreneurs are involved in concrete activities to start up a new business before actually owning their new business. Some authors discern sub-phases in the pre-startup process (cf. Bhave, 1994). Van Gelderen, Thurik and Bosma (2006) report that usually four phases are being distinguished in literature. The first phase is characterised by the development of an intention to start an enterprise. The second phase concerns the recognition of an entrepreneurial opportunity and the creation of a business concept. In the third phase resources are assembled and the organisation is created. Finally, the organisation starts to exchange with the markets in the final phase. Nascent entrepreneurship is
6
considered the active pursuit of organisation creation, thus the second and third phase (van Gelderen, Thurik and Bosma, 2006). Although not all nascent entrepreneurs actually start a business, intentions have proven to be the best predictors of planned behaviour (Krueger, Reilly and Carsrud, 2000). Intentions are thus typically linked to emerging organisations, although the timing of the actual launch might be relatively unplanned. Katz and Gartner (1988) argue that the intention to create an organisation is relevant in identifying an organisation in the process of coming into existence. Not many studies have used nascent entrepreneurship as measure for entrepreneurship in their analysis, because normally nascent entrepreneurs are unregistered, which makes them difficult to sample (Reynolds, 1997; van Gelderen, Thurik and Bosma, 2006). However, with regard to nascent entrepreneurship the Global Entrepreneurship Monitor provides an international comparative measure, the nascent firm prevalence rate. This rate measures the number of adults (18 to 64 years old) per 100 involved in nascent business (new firm startup), defined as actively trying to start a new business, expecting to be a full or part owner, and not having paid salaries or wages for over three months. This index measures the concept of nascent entrepreneurship, as it refers to the first stage of the entrepreneurial process.
Entrepreneurship and macro-economic outcomes The literature dealing with the relationship between entrepreneurship and macro-economic outcomes is very diverse in the sense that different perspectives are being used regarding the level of analysis of macro-economic outcomes. Regarding this level of analysis, most studies relate entrepreneurship to economic development on the regional or on the national level. Research on the relationship between entrepreneurship and macro-economic outcomes is also diverse in the sense that different measures for entrepreneurship are used as subject of analysis. Carree and Thurik (2003) report that turbulence, concentration and the rate of business ownership are being used in literature as measures for entrepreneurial activity. Besides these measures, the rate of new firm formation is being used a lot (e.g. Audretsch and Fritsch, 2002). The Total early-stage Entrepreneurial Activity (TEA), an index developed by the Global Entrepreneurship Monitor, assesses the rate of national early-stage entrepreneurial activity and makes it possible to compare this across countries. Reynolds, Hay, Bygrave, Camp and Autio (2000) are the first to use this index as a measure for entrepreneurship. There are various ways in which entrepreneurial activity may affect economic development. For example, entrepreneurial activity may contribute to a higher degree of innovativeness (Acs and Audretsch, 2003), to enhanced competitiveness (Geroski, 1989) and may facilitate knowledge spillovers (Audretsch and Keilbach, 2004). Entrepreneurial activity is found to lead to economic growth in a number of empirical studies (e.g. Audretsch and Thurik, 2001; Carree and Thurik, 2003; van Stel, Carree and Thurik, 2005; Acs et al., 2005). Also, the net effect of new firm formation on economic development at the regional level is found to be significant positive (e.g. van Stel and Suddle, 2005; Audretsch and Keilbach, 2004). Using turbulence as a measure for entrepreneurial activity, several studies find a positive effect on economic output. Turbulence has been defined as the sum of entry and exit (e.g. Beesley and Hamilton, 1984; Acs and Audretsch, 1990; Baptista and Karaöz, 2006). Bosma and Nieuwenhuijsen (2002) find that turbulence positively affects total factor productivity growth for services and has no effect for manufacturing. Reynolds (1999), using American regional data for the period 1980-1992, finds that turbulence is related to economic growth. Innovative activity is regarded as one of the driving forces of competitiveness and economic growth of nations. Since the 1980s small entrepreneurial firms are increasingly regarded as

7
important sources of innovative activity. Entrepreneurs may contribute to economic growth, because they are important for introducing and realizing innovations (Autio, 1994; Acs and Audretsch, 2003). Furthermore, entrepreneurship may contributes to economic growth because it serves as a mechanism that facilitates the spill over of knowledge (Audretsch, 2004). When there are more entrepreneurs pursuing new ideas, the level of competition will be higher and the process of variety (i.e. a large number of different ideas being pursued) and selection will be more intense. This increases the probability of actual innovations taking place (i.e. of economically viable ideas being selected through the market). Taking all this into account, it is not surprising that innovative entrepreneurs are considered as one of the main links between entrepreneurship and economic growth (Minniti, Bygrave and Autio, 2006). Whereas policy makers used to stimulate entrepreneurship and start-ups in general, the focus is now being moved to innovative, fast-growing firms. Economic theory (Solow, 1957; Romer, 1990) points to technical change as the major source of productivity growth in the long run. Anecdotal evidence suggests that new technology (especially information technology) has substantially contributed to recent improvement in the productivity of firms. Also, consistent positive evidence has been found for the effect of high-potential start-ups (Wong, Ho and Autio, 2005) and fast-growing firms (Mason, 1985; Kemp, Nieuwenhuijsen and Bruins, 2000) on economic growth. We expect innovative entrepreneurs to contribute to national levels of innovation. This is not straightforward since (1) innovation is often associated with R&D in large firms and (2) because ambitions of nascents have yet to be realized (Stam, Suddle, Hessels and van Stel, 2006). We build on a growing body of literature that states that entrepreneurs are important for innovation in a knowledge-based economy and that emphasizes the importance of entrepreneurship for the discovery and exploitation of new knowledge (Shane and Venkataraman, 2005). Furthermore, we also build on literature that suggests that entrepreneurial activity plays a positive role in knowledge spillovers and therefore in technological change and economic growth (e.g. Acs and Varga, 2005). More specifically, we will focus on nascent entrepreneurs and their innovative ambitions. Studies into nascent entrepreneurship tend to focus on explaining why some people are involved in nascent entrepreneurship and some are not, and on why some nascents make the transition into business and why others do not (Johson, Parker and Wijbenga, 2006). Ambitions of nascent entrepreneurs have not been related as such to macro-economic development before. An exception is a study by Stam, Suddle, Hessels and van Stel (2006) where ambitious entrepreneurship regarding job growth expectations (high expectation entrepreneurship) is linked to GDP growth. The authors find a positive effect of high-expectation entrepreneurship on economic growth. In the present study we focus on ambitions amongst nascent entrepreneurs regarding innovativeness. Innovative entrepreneurship starts with nascents that intend to introduce or realize a new business idea. We will investigate the impact of ambitious nascent entrepreneurs on macro-economic outcomes in terms of national levels of innovation. An advantage of using the macro-level is that direct as wel as indirect effects (e.g. through knowledge spillovers) are incorporated in the analysis.
8
DATA & RESEARCH METHOD
In order to investigate whether nascent ambitious entrepreneurs have an impact on the national level of innovation, we perform some indicative regressions. We use a sample of 36 countries that participated in the Global Entrepreneurship Monitor (GEM) in 2002-2004. As we are interested in the consequences of ambitions of nascent entrepreneurs regarding innovativeness, we perform regression analysis. The data we use and the method of analysis are discussed in detail below. Our dependent variable is the technology index 2005, taken from the Global Competitiveness Report 2005-2006 (GCR) of the World Economic Forum. The main objective of the GCR is to assess the capacity of countries worldwide in achieving sustained economic growth. The main indicator that the GCR uses for this purpose is the Growth Competitiveness Index, the GCI. This indicator is constructed by assessing three major pillars of growth, namely technology, the quality of public institutions and the macro-economic environment. The technology index on its turn is constructed from three sub-indices: the innovation sub-index, the ICT sub-index and the technology transfer sub-index.1 As we are interested in the national innovative capacities of the participating countries, we use this technology index 2005 as a measure for national innovative capacity. The main independent variable we use in the regression analysis is the gross inflow into entrepreneurship. This is in our analysis represented by the metric nascent entrepreneurship. We use data on nascent entrepreneurship for 2002-2004. This data are taken from the GEM 2002-2004 Adult Population Surveys (Reynolds et al., 2002). These databases contains various entrepreneurial measures based on at least 2000 respondents per country. The nascent entrepreneurship rate is defined as the number of people actively involved in starting a new venture, as a percentage of the adult population (18-64 years of age). For the regressions we use some specific measures of ambitious nascent entrepreneurship. These ambitions concern innovativeness and are presented in Table 1. They were constructed by asking entrepreneurs and business owners to evaluate the newness of their product or service, the competition they face and the novelty of the technology that they use.
1
For a more elaborate discussion on the GCI, we refer to Lopez-Claros et al. (2005).

9
Variable name Variable definition in GEM Adult Population Survey
nascent new technology rate The number of nascent entrepreneurs that say that the technologies or procedures required for their product or service have been available for less than a year (as percentage of the adult population).
nascent new product rate The number of nascent entrepreneurs that consider their product or service new or unfamiliar to all of their potential customers (as percentage of the adult population).
nascent new product aggregate rate
The sum of the number of nascent entrepreneurs that consider their product or service new or unfamiliar to some of their potential customers and the number of nascent entrepreneurs that consider their product or service new or unfamiliar to all of their potential customers (as percentage of the adult population).
nascent competitors rate The number of nascent entrepreneurs that say no other competitors offer the same product or service to their potential customers (as percentage of the adult population).
nascent competitors aggregate rate
The sum of the number of nascent entrepreneurs that say no other competitors offer the same product or service to their potential customers and the number of nascent entrepreneurs that say some other competitors offer the same product or service to their potential customers (as percentage of the adult population).
Table 1: Measures for ambitious nascent entrepreneurship in GEM 2002-2004
Next to these main variables, we use some control variables. First, we use gross national income
per capita 2002 (logarithm)2, because we assume that the effect of income per capita on the dependent variable varies according to the value of income per capita. These data are taken from the World Development Indicators database of the World Bank. Gross national income per capita is expressed in (thousands of) purchasing power parities per US$. Furthermore, we use foreign direct investment (net inflows) for 2002 as percentage of GDP, also taken from the World Development Indicators database of the World Bank. Foreign direct investment (FDI) can be very beneficial for countries, as it brings with it technology, managerial skills and market access and thus accelerates growth and development (e.g. Borensztein, De Gregorio and Lee, 1998). The positive effect will in particular hold for developing countries, as FDI flowing into a relatively poor country will stimulate the local economy hugely by technology adoption. On the one hand, FDI will generate employment when a foreign company decides to establish in the host country. On the other hand, it will lead to a higher technology level, and the technological development in the host country will be enhanced. We thus expect FDI to impact the national innovativeness level in a positive way. Small business might become the subcontractors to the multinational corporations, which might create more room for entrepreneurship in small businesses. The total number of countries that participated in the GEM 2002-2004 Adult Population Survey is 44. As we use different data sources, not all countries participating in GEM 2002-2004 can be used in our analyses due to lack of data.3 Furthermore, since questions on innovative ambitions
2
The use of logarithms mitigates the possibility of biased estimates due to outliers. 3
Taiwan is excluded because no FDI data is available; Iceland is excluded because data on GDP per Capita and FDI is lacking. In addition, Jordan and Ecuador have been excluded from the analyses, because these countries only participated for one year in GEM in 2004 and some irregularities were
10
have only been asked to nascent entrepreneurs in the sample, we took a number of 100 nascents as a minimum requirement. Therefore, we have only included countries for which the average 2002-2004 nascent rates are based on a minimum of 100 nascents.4 The final sample for our regression analysis contains 36 valid observations. In order to account for the time effect, we use a three-year time lag for nascent entrepreneurship when estimating a country’s level of innovativeness. This is because the ambitions of the nascent entrepreneurs are yet to be realised. Not using the time lag would lead to reversed causality.5 The control variables are also lagged.
EMPIRICAL ANALYSIS
We carry out several regressions. First, we regress the level of nascent entrepreneurship6 on the technology index, using the final sample of 36 countries. We include per capita income and FDI as control variables. Next, we regress nascent ambitious entrepreneurship regarding innovativeness on the technology index. We assume that the impact of entrepreneurial activity is dependent upon the stage of economic development, following van Stel, Carree and Thurik (2005). Nascent entrepreneurship rates may reflect different types of entrepreneurs in countries with different development levels, implying different impacts on growth. Hence we allow for the possibility of different effects for rich and poor countries, by defining separate ambitious nascent entrepreneurship variables for these two groups of countries. We expect a more positive effect of the ambitious nascent entrepreneurship rate for rich countries on the national innovation level. As we expect the effect of foreign direct investments to be stronger in poor countries, we also include the FDI for the group of poor countries as a variable.7 Some descriptive statistics for the dependent variable in this study (the technology index) and the main independent variables (the nascent entrepreneurship rate) are presented below. Table 2 provides the nascent entrepreneurship rates and the specific ambitious nascent entrepreneurship rates for 2002-2004 as well as the technology index 2005.
observed in the data. However, including these two countries in the regression estimates yields similar results.
4
Japan, Mexico, Portugal and Rusland are excluded because the number of nascents for these countries was less than 100 for the period 2002-2004.
5
However, we do not claim that we can fully correct for reversed causality, as the variables tend to be autocorrelated over time.
6
In this way we can compare the impact of nascent entrepreneurs on national innovativeness and the impact of ambitious innovative entrepreneurs on national innovativeness. We can test whether ambitions regarding innovativeness matter.
7
A country is being classified as poor when the the gross national income per capita is less than 13000 US $ (following van Stel, Carree and Thurik, 2005).

11
Country
Nascent
entrepreneur-
ship rate
Nascent new
technology rate
Nascent
new product rate
Nascent new
product aggregate
rate
Nascent competitors
rate
Nascent competitors aggregate
rate
Technology
index 2005
Argentina 8.49 1.47 1.95 5.63 1.30 5.70 3.35
Australia 3.77 0.98 0.86 2.71 1.19 4.25 4.82
Belgium 2.13 0.33 0.31 1.14 0.25 1.13 4.18
Brazil 5.70 0.26 0.30 1.07 0.38 2.17 3.51
Canada 5.94 0.69 1.19 2.95 1.23 3.55 4.79
Chile 10.38 1.43 4.77 8.98 1.50 6.87 3.93
China 5.55 0.50 0.10 1.02 0.35 1.35 3.18
Croatia 2.81 0.33 0.25 0.64 0.29 1.27 3.48
Denmark 3.64 0.57 0.91 2.06 0.68 2.04 5.30
Finland 2.65 0.30 0.29 1.35 0.42 1.41 6.02
France 2.41 0.70 0.27 2.08 0.25 1.85 4.26
Germany 3.51 0.57 0.38 1.39 0.22 1.75 4.78
Greece 3.34 0.98 0.87 1.53 0.93 1.63 3.85
Hong Kong 2.01 0.12 0.04 0.85 0.05 0.62 4.21
Hungary 3.50 0.51 0.24 1.08 0.28 1.09 4.08
India 10.88 0.58 0.34 2.14 0.71 4.66 3.42
Ireland 5.64 0.54 0.75 1.98 1.06 3.29 4.07
Israel 3.38 0.53 0.84 1.71 0.55 1.54 4.87
Italy 3.75 0.63 0.71 1.50 0.33 1.30 3.68
Korea 5.87 0.62 1.72 4.04 0.39 2.18 5.26
Netherlands 2.55 0.28 0.57 0.92 0.39 1.55 4.68
New Zealand 9.11 1.23 1.07 3.10 1.52 5.18 4.47
Norway 5.22 0.74 0.53 1.88 0.66 2.55 4.87
Peru 31.38 5.99 6.83 21.17 12.87 15.77 3.01
Poland 3.67 0.47 0.29 1.49 0.26 1.39 3.77
Singapore 4.01 0.58 0.50 1.40 0.22 1.28 4.93
Slovenia 3.25 0.47 0.63 1.55 0.36 1.67 4.07
South Africa 4.48 1.54 0.80 1.29 0.80 2.47 3.62
Spain 2.27 0.08 0.36 1.19 0.16 0.87 4.21
Sweden 1.79 0.23 0.13 0.49 0.23 0.75 5.78
Switzerland 4.43 0.77 0.69 2.23 0.49 2.27 5.29
Thailand 11.68 4.61 0.81 5.38 1.22 6.09 3.69
Uganda 15.64 2.16 2.12 5.10 5.90 7.40 2.93
United Kingdom 2.49 0.52 0.52 1.36 0.52 2.00 4.66
United States 7.09 0.81 1.12 3.29 1.18 4.64 6.19
Venezuela 19.23 2.21 2.12 5.08 4.70 5.74 3.03
Table 2: (Ambitious) nascent entrepreneurship rates and the technology index for the 36 countries (Source:
GEM and World Economic Forum), weighted average rates, 2002-2004.

12
RESULTS
The regression results are presented in Table 3 to 8. All model specifications in Table 3-8 use FDI and income per capita as control variables. Each table presents 4 model specifications, based on the comparison of the effect in rich and in poor countries. Model 1 includes the effect of the nascent ambition rate and the effect of the nascent ambition rate in poor countries at the one hand, and the partial effect of FDI and the effect of FDI in poor countries on the other hand. Model 2 excludes the effect of the nascent ambition rate in poor countries, while model 3 excludes the effect of FDI in poor countries. Finally model 4 excludes both the effect of the nascent ambition rate in poor countries and the effect of FDI in poor countries, imposing two restrictions on the original model (model 1). All 4 models are estimated using consecutively the nascent rate, the nascent new technology rate, the nascent new product rate, the nascent new product aggregate rate, the nascent competitors rate and the nascent competitors aggregate rate, using the sample of 36 countries.
Nascent rate Model 1 Model 2 Model 3 Model 4
Constant -1.18
(0.7)
-2.49
(1.3)
-1.55
(0.9)
-3.66**
(2.1)
Nascent 0.073
(1.0)
-0.001
(0.1)
0.082
(1.2)
-0.002
(0.1)
Nascent poor -0.084
(1.1)
-0.093
(1.4)
FDI -0.032
(1.2)
-0.032
(1.6)
-0.033
(1.3)
-0.036**
(2.0)
FDI poor -0.044
(0.7)
0.088*
(1.7)
log (ycap) 0.56**
(3.0)
0.72**
(3.7)
0.60**
(3.0)
0.83**
(4.8)
R2 0.634 0.611 0.631 0.599
Adjusted R2 0.573 0.561 0.584 0.561
Log likelihood -26.5106 -27.6142 -26.6404 -28.1659
Table 3: Explaining national innovativeness from nascent entrepreneurs; N = 36.
Note: Absolute heteroscedastic-consistent t-values are in parentheses. * = Significant at a 0.10 level; ** = Significant at a 0.05 level.
13
Nascent new
technology rate Model 1 Model 2 Model 3 Model 4
Constant -1.96
(1.1)
-2.10
(1.3)
-2.789
(1.5)
-3.29**
(2.3)
Nascent NTR 0.017
(0.1)
-0.058
(1.6)
0.121
(0.3)
-0.058
(1.3)
Nascent NTR poor -0.077
(0.2)
-0.183
(0.5)
FDI -0.032*
(1.6)
-0.033*
(1.8)
-0.034*
(1.9)
-0.037*
(2.3)
FDI poor -0.082
(1.4)
-0.088*
(1.8)
log (ycap) 0.67**
(3.3)
0.69**
(4.0)
0.74**
(3.6)
0.80**
(5.3)
R2 0.616 0.616 0.607 0.604
Adjusted R2 0.552 0.566 0.559 0.566
Log likelihood -27.3604 -27.3830 -27.8063 -27.9432
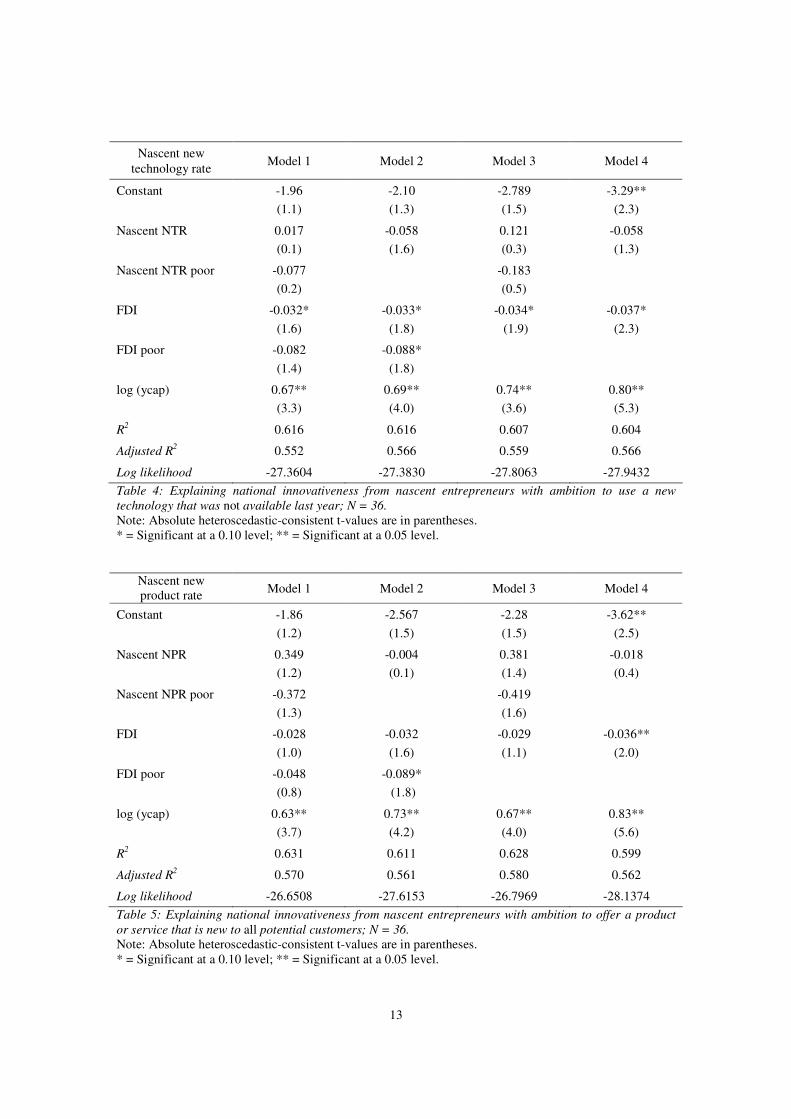
Table 4: Explaining national innovativeness from nascent entrepreneurs with ambition to use a new
technology that was not available last year; N = 36.
Note: Absolute heteroscedastic-consistent t-values are in parentheses. * = Significant at a 0.10 level; ** = Significant at a 0.05 level.
Nascent new product rate
Model 1 Model 2 Model 3 Model 4
Constant -1.86
(1.2)
-2.567
(1.5)
-2.28
(1.5)
-3.62**
(2.5)
Nascent NPR 0.349
(1.2)
-0.004
(0.1)
0.381
(1.4)
-0.018
(0.4)
Nascent NPR poor -0.372
(1.3)
-0.419
(1.6)
FDI -0.028
(1.0)
-0.032
(1.6)
-0.029
(1.1)
-0.036**
(2.0)
FDI poor -0.048
(0.8)
-0.089*
(1.8)
log (ycap) 0.63**
(3.7)
0.73**
(4.2)
0.67**
(4.0)
0.83**
(5.6)
R2 0.631 0.611 0.628 0.599
Adjusted R2 0.570 0.561 0.580 0.562
Log likelihood -26.6508 -27.6153 -26.7969 -28.1374
Table 5: Explaining national innovativeness from nascent entrepreneurs with ambition to offer a product
or service that is new to all potential customers; N = 36.
Note: Absolute heteroscedastic-consistent t-values are in parentheses. * = Significant at a 0.10 level; ** = Significant at a 0.05 level.

14
Nascent new product aggregate rate
Model 1 Model 2 Model 3 Model 4
Constant -1.323
(0.9)
-2.55
(1.5)
-1.58
(1.0)
-3.60**
(2.4)
Nascent NPAR 0.205
(1.6)
-0.001
(0.0)
0.215*
(1.9)
-0.007
(0.4)
Nascent NPAR poor -0.215*
(1.7)
-0.229**
(2.0)
FDI -0.026
(1.0)
-0.032
(1.6)
-0.027
(1.0)
-0.036**
(2.0)
FDI poor -0.031
(0.5)
0.087*
(1.9)
log (ycap) 0.57**
(3.3)
0.73**
(4.2)
0.59**
(3.4)
0.83**
(5.4)
R2 0.647 0.611 0.646 0.599
Adjusted R2 0.588 0.561 0.600 0.562
Log likelihood -25.8444 -27.6164 -25.9070 -28.1342
Table 6: Explaining national innovativeness from nascent entrepreneurs with ambition to offer a product
or service that is new to all potential customers and nascent entrepreneurs with ambition to offer a product
or service that is new to some of the potential customers; N = 38.
Note: Absolute heteroscedastic-consistent t-values are in parentheses. * = Significant at a 0.10 level; ** = Significant at a 0.05 level.
Nascent competitors rate
Model 1 Model 2 Model 3 Model 4
Constant -1.91
(1.2)
-2.49
(1.5)
-2.63
(1.6)
-3.61**
(2.5)
Nascent NCR 0.241
(0.8)
-0.005
(0.2)
0.286
(1.0)
-0.009
(0.2)
Nascent NCR poor -0.256
(0.9)
-0.306
(1.1)
FDI -0.032
(1.2)
-0.032
(1.6)
-0.035
(1.4)
-0.004*
(2.0)
FDI poor -0.068
(1.3)
-0.087 *
(1.7)
log (ycap) 0.65**
(3.7)
0.72**
(4.1)
0.72**
(4.1)
0.83**
(5.4)
R2 0.621 0.611 0.614 0.599
Adjusted R2 0.558 0.561 0.564 0.561
Log likelihood -27.1451 -27.6113 -27.4680 -28.1509
Table 7: Explaining national innovativeness from nascent entrepreneurs with ambition to offer a product
or service without having competitors; N = 36.
Note: Absolute heteroscedastic-consistent t-values are in parentheses. * = Significant at a 0.10 level; ** = Significant at a 0.05 level.
15
Nascent competitors aggregate rate
Model 1 Model 2 Model 3 Model 4
Constant -1.39
(0.8)
-2.71
(1.5)
-1.81
(1.1)
-3.83**
(2.5)
Nascent NCAR 0.120
(1.1)
-0.009
(0.3)
0.131
(1.2)
0.004
(0.1)
Nascent NCAR poor -0.135
(1.2)
-0.152
(1.4)
FDI -0.032
(1.2)
-0.033
(1.5)
-0.034
(1.3)
-0.036**
(2.0)
FDI poor -0.051
(0.9)
0.090*
(1.9)
log (ycap) 0.59**
(3.2)
0.74**
(4.0)
0.63**
(3.3)
0.85**
(5.3)
R2 0.634 0.611 0.630 0.599
Adjusted R2 0.573 0.561 0.583 0.561
Log likelihood -26.4986 -27.5884 -26.6822 -28.1644
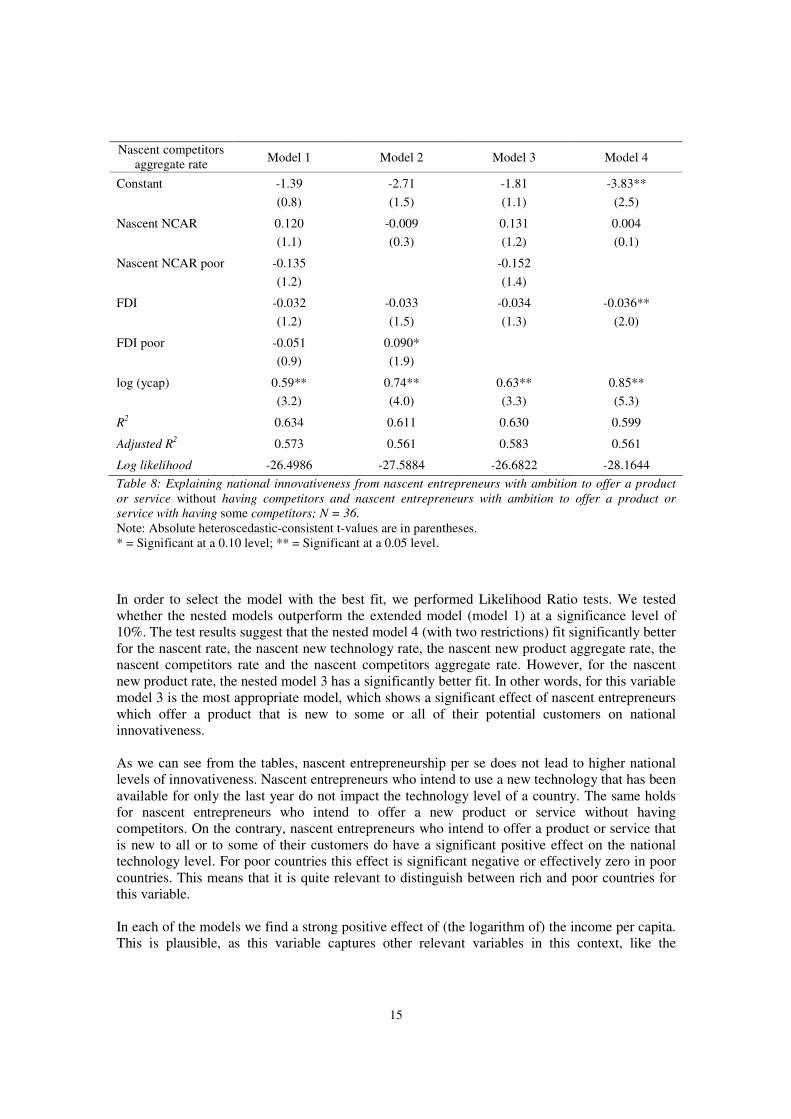
Table 8: Explaining national innovativeness from nascent entrepreneurs with ambition to offer a product
or service without having competitors and nascent entrepreneurs with ambition to offer a product or
service with having some competitors; N = 36.
Note: Absolute heteroscedastic-consistent t-values are in parentheses. * = Significant at a 0.10 level; ** = Significant at a 0.05 level.
In order to select the model with the best fit, we performed Likelihood Ratio tests. We tested whether the nested models outperform the extended model (model 1) at a significance level of 10%. The test results suggest that the nested model 4 (with two restrictions) fit significantly better for the nascent rate, the nascent new technology rate, the nascent new product aggregate rate, the nascent competitors rate and the nascent competitors aggregate rate. However, for the nascent new product rate, the nested model 3 has a significantly better fit. In other words, for this variable model 3 is the most appropriate model, which shows a significant effect of nascent entrepreneurs which offer a product that is new to some or all of their potential customers on national innovativeness. As we can see from the tables, nascent entrepreneurship per se does not lead to higher national levels of innovativeness. Nascent entrepreneurs who intend to use a new technology that has been available for only the last year do not impact the technology level of a country. The same holds for nascent entrepreneurs who intend to offer a new product or service without having competitors. On the contrary, nascent entrepreneurs who intend to offer a product or service that is new to all or to some of their customers do have a significant positive effect on the national technology level. For poor countries this effect is significant negative or effectively zero in poor countries. This means that it is quite relevant to distinguish between rich and poor countries for this variable. In each of the models we find a strong positive effect of (the logarithm of) the income per capita. This is plausible, as this variable captures other relevant variables in this context, like the
16
education level8. Foreign direct investment has a negative impact on the national technology level, while we expect a positive sign. The reason for this may be that the reversed positive effect of the technology level on FDI is stronger than the positive effect of FDI on the national technology level. Apparently, the negative effect of this reversed causality problem dominates the positive effect of FDI on the technology level. We are not able to correct for this causality effect, as we use cross-section for the technology level. However, though not significant, we see that the effect of the FDI in poor countries is positive. This suggests that the effect of FDI is stronger for poor countries than for rich countries. Due to the limited number of observations our regression results should be interpreted with some care.
SUMMARY & CONCLUSION
Entrepreneurial activity is recognised as one of the driving forces behind economic growth. In the lifecycle of business startups, entrepreneurial activity actually starts from the point that potential entrepreneurs are involved in concrete activities to start up a new business before they actually own their new business. This pre-startup phase is also known as nascent entrepreneurship. However, measuring nascent entrepreneurship is rather difficult, because nascent entrepreneurs are unregistered. The Global Entrepreneurship Monitor (GEM) assesses the rate of national entrepreneurial activity and makes it possible to compare this across countries. The nascent firm prevalence rate measures the number of adults (18 to 64 years old) per 100 involved in nascent business (new firm startup), defined as active, expect to be a full or part owner, and no salaries or wages paid for over three months. A recent study by Stam, Suddle, Hessels and van Stel (2006) indicates that entrepreneurs who have as goal right from the start to generate employment growth appear to contribute to economic growth at the macro level. This suggests that ambitions can be important in achieving actual growth. Whereas policy makers used to stimulate entrepreneurship and start-ups in general, the focus is now increasingly being moved to innovative, fast-growing firms. In order to investigate whether ambitions of nascent entrepreneurs regarding innovativeness have an impact on macro-economic output, we have performed some indicative regressions. We find that nascent entrepreneurship per se does not lead to higher national levels of innovativeness. With regard to innovative ambitions we find that nascent entrepreneurs who intend to introduce a new product or service (i.e. a product or service that is new to all or some of their customers) do contribute to higher levels of national innovativeness. For poor countries this effect is effectively non-existent. To the contrary we find that nascent entrepreneurs who intend to use a new technology (i.e. a technology that has been available for only one year) do not impact the technology level of a country. The same holds for nascent entrepreneurs who intend to offer a new product or service without having competitors. The results suggest that ambitious entrepreneurship positively contributes to national levels of innovativeness through the development of new products or services. Besides this direct effect on the national economy, indirect effects are likely to follow as well. When countries have a higher rate of nascent entrepreneurs that aim for new product development, this is likely to increase
8
As we have a limited set of observations (N=36) we choose to include only the income per capita as control variable, which can be seen as a “catch-all” variable, and not other relevant variables.

17
levels of competition and knowledge spillovers, and consequently also likely to contribute to the emergence of highly competitive economies. Also, when countries have higher levels of new innovative firms that launch new products or services, chances are higher that the best firms are selected for takeover by large established firms. Therefore, innovative ambitions of nascents may also contribute to national levels of innovation through large established firms. Due to the limited number of observations, our regression results should be interpreted with some care. It would be interesting to include more countries in future studies in order to get a more complete overview of the effect of ambitious nascent entrepreneurs on macro-economic output. In addition, micro-level analysis would provide more insight in the process a nascent entrepreneur goes through before he actually sets up a business. In order to get to know how concrete ambitions impact the way nascent entrepreneurs go through the entrepreneurial process, following nascent entrepreneurs would be worthwhile. Understanding the transition from ambitions into the realisation of these ambitions allows more effective policies to be drawn to encourage and stimulate high potential entrepreneurial activities (Stam, Suddle, Hessels and van Stel, 2006).

18
REFERENCES
Acs, Z.J., P. Arenius, M. Hay and M. Minniti (2005), ‘Global Entrepreneurship Monitor: 2004 executive report’, Babson Park, MA: Babson College and London: London Business School.
Acs, Z.J. and D.B. Audretsch (1990), Innovation and Small Firms, MIT Press, Cambridge Acs, Z.J. and D.B. Audretsch (2003), ‘Innovation and technological change’, in Acs, Z.J. and
D.B. Audretsch (eds.), Handbook of Entrepreneurship Research, Boston: Kluwer Academic Publishers, pp. 55-79.
Acs, Z.J. and A. Varga (2005), ‘Entrepreneurship, Agglomoration and Technological Change’, Small Business Economics, 24, pp. 323-334.
Audretsch, D.B. (2004), ‘Sustaining Innovation and Growth: Public Policy Support for Entrepreneurship’, Industry and Innovation, 11(3), pp. 167-191.
Audretsch, D.B. and M. Fritsch (2002), ‘Growth Regimes over Time and Space, Regional
Studies, 36, pp. 113-124. Audretsch, D.B. and M. Keilbach (2004) ‘Entrepreneurship Capital and Economic Performance’,
Regional Studies 38.8: 949-959. Audretsch, D.B. and A.R. Thurik (2000), ‘Capitalism and democracy in the 21st century: from the
managed to the entrepreneurial economy’, Journal of Evolutionary Economics, 10 (1), pp. 17-34.
Audretsch, D.B. and A.R. Thurik (2001), ‘What is new about the new economy: sources of growth in the managed and entrepreneurial economies’, Industrial and Corporate
Change, 10 (1), pp. 267-315. Audretsch, D.B. and A.R. Thurik. (2004), ‘The model of the entrepreneurial economy’,
International Journal of Entrepreneurship Education, 2(2), pp. 143-166. Autio, E. (1994), ‘New technology-based firms as agents of R&D and innovation’, Technovation,
14(4), pp. 259-273. Baptista, R. and M. Karaöz (2006), ‘Turbulence in High-Growth and Declining Industries’,
Working Paper Series, Lisbon. Beesley, M.E. and R.T. Hamilton (1984), ‘Small Firms’ Seedbed Role and the Concept of
Turbulence’, Journal of Industrial Economics, 33, pp. 217-232. Bhave, P.B. (1994), ‘A Process Model of Entrepreneurial Venture Creation’, Journal of Business
Venturing, 9, pp. 223-242. Borensztein, E., J. de Gregorio and J.W. Lee (1998), ‘How Does Foreign Direct Investment
Affect Economic Growth?’ Journal of International Economics, 45 (1), pp. 115-135. Bosma, N.S. and H.R. Nieuwenhuijsen (2002), ‘Turbulence and Productivity; An Analysis of 40
Dutch Regions in the Period 1988-1996’, EIM Scales Paper N200205, EIM Business and
Policy Research, Zoetermeer. Carland, J.W., F. Hoy, W.R. Boulton and J.A.C. Carland (1984), ‘Differentiating Entrepreneurs
from Small Business Owners: A Conceptualization’, The Academy of Management
Review, 9 (2), pp. 354-359. Carree, M.A. and A.R. Thurik (2003), ‘The Impact of Entrepreneurship on Economic Growth’,
in: Z.J. Acs and D.B. Audretsch (eds.), Handbook of Entrepreneurship Research, Boston, MA: Kluwer Academic Publishers, pp. 437-471.
Carter, N.M., W.B. Gartner and P.D. Reynolds (1996), ‘Exploring Start-Up Event Sequences’, Journal of Business Venturing, 11, pp. 151-166.
Commission of the European Communities (2006), Time to move up a gear. The new partnership
for growth and jobs, Brussels.

19
Dolfsma, W. and G. van der Panne (2006), ‘Currents and Sub-currents in the River of Innovations – Explaining Innovativeness using New-Product Announcements’, ERIM Report Series ERS-2006-036-ORG, Erasmus Research Institute of Management, Rotterdam.
Gartner, W.B., B.J. Bird and J.A. Starr (1992), ‘Acting as if: Differentiating entrepreneurial from organizational behavior’, Entrepreneurship: Theory and Practice, 16 (3), pp. 13-31.
Gelderen, M. van, A.R. Thurik and N. Bosma (2006), ‘Success and Risk Factors in the Pre-Startup Phase’, Small Business Economics, 26, pp. 319-335.
Geroski, P.A. (1989), ‘Entry, Innovation, and Productivity Growth’, Review of Economics and
Statistics, 71, pp. 572-578. Johnson, P.S., S.C. Parker and F. Wijbenga (2006), ‘Nascent Entrepreneurship Research:
Achievements and Opportunities’, Small Business Economics, 27, pp. 1-4. Katz, J. and W.B. Gartner (1988), ‘Properties of emerging organizations’, Academy of
Management Review, 13 (3), pp. 429-442. Kemp, R. H. Nieuwenhuijsen and A. Bruins (2000), ‘Bedrijvendynamiek, snelgroeiende
bedrijven en regionaal-economische ontwikkeling’ [in Dutch], EIM Business and Policy Research, Zoetermeer.
Kleinknecht, A., K. van Montfort and E. Brouwer (2002), ‘The non-trivial choice between innovation indicators’, Economics of Innovation and New Technology, 11, pp. 109-121.
Krueger, N.F., M.D. Reilly and A.L. Carsrud (2000), ‘Competing Models of Entrepreneurial Intentions’, Journal of Business Venturing, 15, pp. 411-432.
Link, A.N. and B. Bozeman (1991), ‘Innovative behavior in small-sized firms’, Small Business
Economics, 3 (3), pp. 179-184. Lopez-Claros, A., J. Blanke, M. Drzeniek, I. Mia and S. Zahidi (2005), ‘Policies and Institutions
Underpinning Economic Growth: Results from the Competitiveness Indexes’, in: Lopez-Claros, A., M.E. Porter and K. Schwab (eds.), The Global Competitiveness Report 2005-
2006, New York: Palgrave Macmillan, pp. 3-42. Mason, C.M. (1985), ‘The geography of ‘successful’ small firms in the United Kingdom’,
Environment and Planning A, 17, pp. 1499-1513. Minniti, M., W.D. Bygrave and E. Autio (2006), Global Entrepreneurship Monitor, 2005
Executive Report, Wellesley/London: Babson College and London Business School. Reynolds, P.D. and B. Miller (1992), ‘New firm gestation: Conception, birth, and implications for
research’, Journal of Business Venturing, 7, pp. 1-8. Reynolds, P.D. and S. White (1992), ‘Finding the Nascent Entrepreneur: Network Sampling and
Entrepreneurship Gestation’, in N. Churchill et al. (eds.), Frontiers in Entrepreneurship
Research, Wellesley: Babson College. Reynolds, P.D. (1997), ‘Who Starts New Firms? – Preliminary Explorations of Firms-in-
Gestation’, Small Business Economics, 9 pp. 449-462. Reynolds, P.D. (1999), ‘Creative Destruction: Source or Symptom of Economic Growth?’, in
Acs, Z.J., B. Carlsson and C. Karlsson (eds.), Entrepreneurship, Small and Medium-Sized
Enterprises and the Macroeconomy, Cambridge, UK: Cambridgfe University Press, pp. 97-136.
Reynolds, P., M. Hay, W.D. Bygrave, S.M. Camp and E. Autio (2000), Global Entrepreneurship
Monitor Executive Report, Kauffman Center for Entrepreneurial Leadership: Kansas City.
Reynolds, P.D., W.D. Bygrave, E. Autio, L.W. Cox, and M. Hay (2002), Global
Entrepreneurship Monitor, 2002 Executive Report, Babson College, London Business School and Kauffman Foundation.
Romer, P. M. (1990), ‘Endogenous Technical Change’, Journal of Political Economy, 98, pp. 71– 102. Rosenberg, N. (2004), Innovation and Economic Growth, OECD, Paris.

20
Schumpeter, J.A. (1934), The Theory of Economic Development, Cambridge, MA: Harvard University Press.
Shane, S. and S. Venkataraman (2000), ‘The Promise of Entrepreneurship as a Field of Research’, Academy of Management Review, 25, pp. 217-221.
Solow, R.M. (1957), ‘Technological Change and the Aggregate Production Function’, Review of
Economics and Statistics, 39, pp. 312-320. Stam, E., K. Suddle, S.J.A. Hessels and A.J. van Stel (2006), ‘High Growth Entrepreneurs, Public
Policies and Economic Growth’, EIM Scales Paper H200608, EIM Business and Policy Research, Zoetermeer.
Stel, A.J. van, and K. Suddle (2005), ‘The Impact of New Firm Formation on Regional Development in the Netherlands’, ERIM Report Series ERS-2005-075-ORG, Erasmus Research Institute of Management, Rotterdam.
Stel, A.J. van, M.A. Carree and A.R. Thurik (2005), ‘The Effect of Entrepreneurial Activity on National Economic Growth’, Small Business Economics, 24, pp. 311-321.
Wennekers, A.R.M. and A.R. Thurik (1999), ‘Linking Entrepreneurship and Economic Growth’, Small Business Economics, 13(1), pp. 27-55.
Wennekers, S., A. van Stel, R. Thurik, and P. Reynolds (2005), ‘Nascent Entrepreneurship and the Level of Economic Development’, Small Business Economics, 24(3), pp. 293-309.
Wong, P., Y. Ho and E. Autio (2005), ‘Entrepreneurship, Innovation and Economic Growth: Evidence from GEM data’, Small Business Economics, 24 (3), pp. 335-350.

21
The results of EIM's Research Programme on SMEs and Entrepreneurship are published in the
following series: Research Reports and Publieksrapportages. The most recent publications of both
series may be downloaded at: www.eim.net.
Recent Research Reports and Scales Papers
H200701 3-1-2007 Entrepreneurial diversity and economic growth
H200627 21-12-2006 Motivation Based Policies for an Entrepreneurial EU Economiy
H200626 19-12-2006 Export Orientation among New Ventures and Economic Growth
H200625 18-12-2006 Institutionele voorwaarden voor zelfstandig ondernemerschap
H200624 13-12-2006 Creative Destruction and Regional Competitiveness
H200623 6-12-2006 Entrepreneurship, Dynamic Capabilities and New Firm Growth
H200622 1-12-2006 Determinants of self-employment preference and realization of
women and men in Europe and the United States
H200621 1-12-2006 Is human resource management profitable for small firms?
H200620 23-11-2006 The entrepreneurial ladder and its determinants
H200619 20-11-2006 Knowledge Spillovers and Entrepreneurs’ Export Orientation
H200618 20-11-2006 The effects of new firm formation on regional development over
time: The case of Great Britain
H200617 11-10-2006 On the relationship between firm age and productivity growth
H200616 11-10-2006 Entrepreneurship and its determinants in a cross-country setting
H200615 2-10-2006 The Geography of New Firm Formation: Evidence from
Independent Start-ups and New Subsidiaries in the Netherlands
H200614 25-9-2006 PRISMA-K: een bedrijfstakkenmodel voor de korte termijn
H200613 25-9-2006 PRISMA-M: een bedrijfstakkenmodel voor de middellange
termijn
H200612 25-9-2006 PRISMA-MKB: modelmatige desaggregatie van
bedrijfstakprognose naar grootteklasse
H200611 25-9-2006 PRISMA-R: modelmatige desaggregatie van
bedrijfstakprognoses naar provincie
H200610 25-9-2006 Explaining engagement levels of opportunity and necessity
entrepreneurs
H200609 25-9-2006 The effect of business regulations on nascent and Young
business entrepreneurship
H200608 24-8-2006 High growth entrepreneurs, public policies and economic growth
H200607 18-8-2006 The decision to innovate
H200606 6-7-2006 Innovation and international involvement of Dutch SMEs
H200605 27-6-2006 Uncertainty avoidance and the rate of business ownership across
21 OECD countries, 1976-2004
H200604 22-6-2006 The Impact of New Firm Formation on Regional Development in
the Netherlands
H200603 21-6-2006 An Ambition to Grow
H200602 21-6-2006 Exploring the informal capital market in the Netherlands:
characteristics, mismatches and causes
H200601 22-5-2006 SMEs as job engine of the Dutch private economy
N200520 7-3-2006 High Performance Work Systems, Performance and
Innovativeness in Small Firms

22
N200519 1-2-2006 Entrepreneurial Culture as Determinant of Nascent
Entrepreneurship
N200518 26-1-2006 Social security arrangements and early-stage entrepreneurial
activity; an empirical analysis
N200517 23-1-2006 Determinants of Growth of Start-ups in the Netherlands
N200516 23-1-2006 Entrepreneurship in the old en new Europe
N200515 23-1-2006 Entrepreneurial engagement levels in the European Union
N200514 23-1-2006 Latent and actual entrepreneurship in Europe and the US: some
recent developments
N200513 20-1-2006 Determinants of self-employment preference and realisation of
women and men in Europe and the United States
N200512 20-1-2006 PRISMA-K: een bedrijfstakkenmodel voor de korte termijn
N200511 19-1-2006 Strategic Decision-Making in Small Firms: Towards a Taxonomy
of Entrepreneurial Decision-Makers
N200510 11-1-2006 Explaining female and male entrepreneurship at the country
level
N200509 11-1-2006 The link between family orientation, strategy and innovation in
Dutch SMEs: a longitudinal study
N200508 11-1-2006 From nascent to actual entrepreneurship: the effect of entry
barriers
N200507 11-1-2006 Do entry barriers, perceived by SMEs, affect real entry? Some
evidence from the Netherlands
H200503 6-12-2005 The Impact of New Firm Formation on Regional Development in
the Netherlands
N200506 5-9-2005 Entrepreneurial intentions subsequent to firm exit
N200505 5-9-2005 The relationship between successor and planning characteristics
and the success of business transfer in Dutch SMEs
H200502 31-8-2005 Product introduction by SMEs
H200501 12-5-2005 Kosten van inhoudelijke verplichtingen voor het bedrijfsleven
N200504 21-4-2005 Does Self-Employment Reduce Unemployment?
N200503 7-4-2005 Zipf's Law in Economics
N200502 31-3-2005 Early-stage entrepreneurial activity in the European Union: some
issues and challenges
N200501 31-3-2005 Scale effects in HRM Research