amedisys first quarter 2020 earnings call supplemental...
TRANSCRIPT

11
Amedisys First Quarter 2020 Earnings CallSupplemental SlidesMay 7th, 2020

2
This presentation may include forward-looking statements as defined by the Private
Securities Litigation Reform Act of 1995. These forward-looking statements are based
upon current expectations and assumptions about our business that are subject to a
variety of risks and uncertainties that could cause actual results to differ materially from
those described in this presentation. You should not rely on forward-looking statements as
a prediction of future events.
Additional information regarding factors that could cause actual results to differ materially
from those discussed in any forward-looking statements are described in reports and
registration statements we file with the SEC, including our Annual Report on Form 10-K
and subsequent Quarterly Reports on Form 10-Q and Current Reports on Form 8-K,
copies of which are available on the Amedisys internet website http://www.amedisys.com
or by contacting the Amedisys Investor Relations department at (225) 292-2031.
We disclaim any obligation to update any forward-looking statements or any changes in
events, conditions or circumstances upon which any forward-looking statement may be
based except as required by law.
www.amedisys.com
NASDAQ: AMED
We encourage everyone to visit the
Investors Section of our website at
www.amedisys.com, where we have
posted additional important
information such as press releases,
profiles concerning our business and
clinical operations and control
processes, and SEC filings.
Forward-looking statements

33
Q1 2020 Results

4
Our Key Areas of FocusStrategic areas of focus and progress made during Q1’20
• Home Health*: Total same store admissions +3%. Total same store volume +1%
• Hospice: Admissions +1%, ADC +4%
• Personal Care: Billable hours / quarter -10%
1
OrganicGrowth
• CMS has determined they will not update the Home Health Compare site in July 2020; thus no refresh was issued in March. Publicly reported home health data published for April 2020 will remain in place until the October 2020 refresh. We will receive our preview in late June 2020 for the October 2020 refresh
• Hospice quality –outperforming industry average in all hospice item set (HIS) categories
3
Clinical Initiatives
• Focusing on optimizing RN / LPN & PT / PTA staffing ratios. • Current LPN
Ratio: 45.0% (vs. 39.2% in 1Q’19)
• Current PTA Ratio: 46.3% (vs. 42.1% in 1Q’19)
4
Capacity and Productivity
• Aseracare deal signed 4/23• $235M
purchase price ($203M net of tax asset)
• 44 care centers• 14 states• $117M annual
revenue• Anticipated
close: 6/1
5
M&A
2
Recruiting / Retention
• Targeting industry leading employee retention amongst all employee categories
• Current total voluntary turnover ~19.5% (turnover impacted by inclusion of CCH in calculation)
• Focus on reduction of clinical turnover with heavy focus on clinicians and “early exits”
*Note: Home Health same store volume is defined as admissions plus recertifications
• 2020 Hospice rate update for AMED (in effect 10/1/19) ~0.5%
• 2021 proposed Hospice industry rule net +2.6% increase (+3.0% market based less 0.4% multifactor productivity adjustment)• 2021 CAP
amount will increase by 2.6% to $30,743.86
6
Regulatory

5
Highlights and Summary Financial Results (Adjusted): 1Q 2020(1)
Home Health total same store volume +1%, total same store admissions +3%. Hospice same store admissions +1%
AmedisysConsolidated
• Revenue Growth: +5%
• EBITDA: $53M (-3%)
• EBITDA Margin: 11% (-90 bps)
• EPS: $1.05 (-5%)
1Q’20
• Net debt: $216.5M
• Net Leverage ratio: 1.0x
• CFFO: $6.0M
• Free cash flow (4): $3.2M
• DSO: 46.6 (vs. Q4’19 of 40.9)
BalanceSheet &
CashFlow
1Q’20
Same Store (2)(3):• Total Volume: +1%• Total Admissions: +3%
Other Statistics:• Revenue per Episode: $2,734 (-3.7%)• Total Cost per Visit: $92.53 (+3.9%)• Medicare Recert Rate: 33.6% (-230
bps)Home Health
Growth Metrics (5):• Billable hours/quarter: -10% • Clients served: -8%
PersonalCare
Same Store Volume (3): • Admissions: +1%• ADC: +4%
Other Statistics:• Revenue per Day: $154.55
(+0.9%)• Cost per day: $83.64 (+2.6%)
Hospice
1Q’20 1Q’201Q’20
Adjusted Financial Results(1)
1Q’20
1. The financial results for the three-month periods ended March 31, 2019 and March 31, 2020 are adjusted for certain items and should be considered a non-GAAP financial measure. A reconciliation of these non-GAAP financial measures is included in the corresponding 8-K detailing quarterly results for each respective reporting period.
2. Same Store volume – Includes admissions and recertifications.3. Effective July 1, 2019, same store is defined as care centers that we have operated for at least the last 12 months and startups that are an expansion of a same store care center.4. Free cash flow defined as cash flow from operations less routine capital expenditures and required debt repayments.5. Includes acquisitions.
$ in Millions, except EPS 1Q19 1Q20 % Change
Home Health 310.1 303.6 -2.1%
Hospice 137.5 169.4 23.2%
Personal Care 20.2 18.7 -7.4%
Total Revenue 467.8$ 491.7$ 5.1%
Gross Margin % 41.3% 42.1%
Adjusted EBITDA 54.9 53.3 -2.9%
11.7% 10.8%
Adjusted EPS $1.11 $1.05 -5.4%
Free cash flow (4)$18.3 $3.2 -82.5%
66
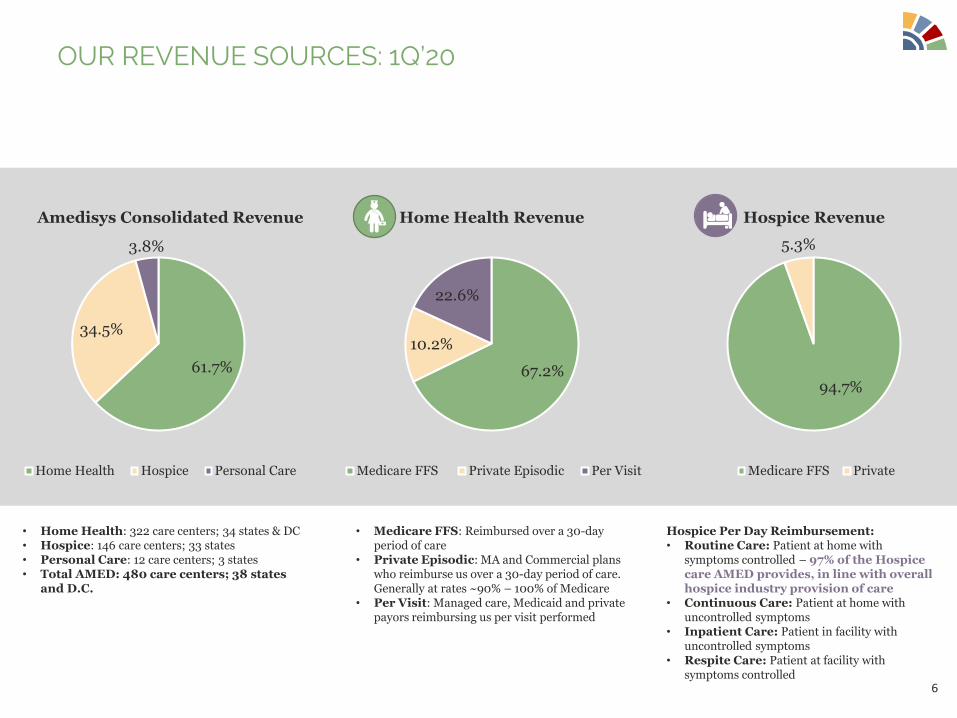
OUR REVENUE SOURCES: 1Q’20
67.2%
10.2%
22.6%
Home Health Revenue
Medicare FFS Private Episodic Per Visit
61.7%
34.5%
3.8%
Amedisys Consolidated Revenue
Home Health Hospice Personal Care
• Medicare FFS: Reimbursed over a 30-day period of care
• Private Episodic: MA and Commercial plans who reimburse us over a 30-day period of care. Generally at rates ~90% – 100% of Medicare
• Per Visit: Managed care, Medicaid and private payors reimbursing us per visit performed
94.7%
5.3%
Hospice Revenue
Medicare FFS Private
Hospice Per Day Reimbursement:• Routine Care: Patient at home with
symptoms controlled – 97% of the Hospice care AMED provides, in line with overall hospice industry provision of care
• Continuous Care: Patient at home with uncontrolled symptoms
• Inpatient Care: Patient in facility with uncontrolled symptoms
• Respite Care: Patient at facility with symptoms controlled
• Home Health: 322 care centers; 34 states & DC• Hospice: 146 care centers; 33 states • Personal Care: 12 care centers; 3 states• Total AMED: 480 care centers; 38 states
and D.C.
7
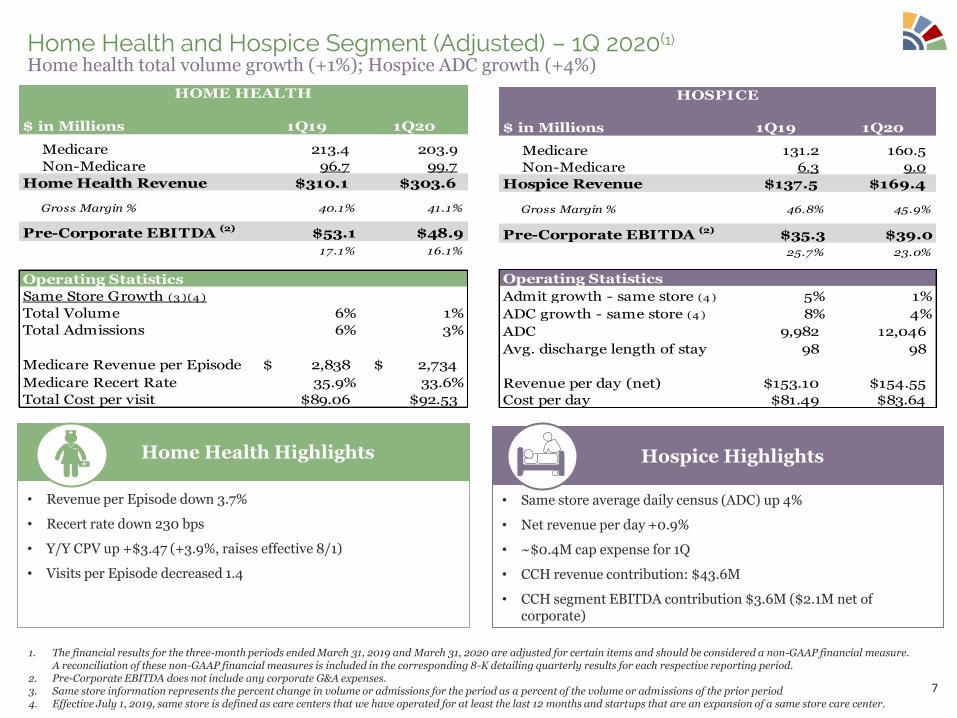
Home Health and Hospice Segment (Adjusted) – 1Q 2020(1)
• Revenue per Episode down 3.7%
• Recert rate down 230 bps
• Y/Y CPV up +$3.47 (+3.9%, raises effective 8/1)
• Visits per Episode decreased 1.4
Home Health Highlights
• Same store average daily census (ADC) up 4%
• Net revenue per day +0.9%
• ~$0.4M cap expense for 1Q
• CCH revenue contribution: $43.6M
• CCH segment EBITDA contribution $3.6M ($2.1M net of corporate)
Hospice Highlights
1. The financial results for the three-month periods ended March 31, 2019 and March 31, 2020 are adjusted for certain items and should be considered a non-GAAP financial measure. A reconciliation of these non-GAAP financial measures is included in the corresponding 8-K detailing quarterly results for each respective reporting period.
2. Pre-Corporate EBITDA does not include any corporate G&A expenses.3. Same store information represents the percent change in volume or admissions for the period as a percent of the volume or admissions of the prior period4. Effective July 1, 2019, same store is defined as care centers that we have operated for at least the last 12 months and startups that are an expansion of a same store care center.
Home health total volume growth (+1%); Hospice ADC growth (+4%)
$ in Millions 1Q19 1Q20
Medicare 213.4 203.9
Non-Medicare 96.7 99.7
Home Health Revenue $310.1 $303.6
Gross Margin % 40.1% 41.1%
Pre-Corporate EBITDA (2) $53.1 $48.9
17.1% 16.1%
Operating Statistics
Same Store Growth (3 )(4 )
Total Volume 6% 1%
Total Admissions 6% 3%
Medicare Revenue per Episode 2,838$ 2,734$
Medicare Recert Rate 35.9% 33.6%
Total Cost per visit $89.06 $92.53
HOME HEALTH
$ in Millions 1Q19 1Q20
Medicare 131.2 160.5
Non-Medicare 6.3 9.0
Hospice Revenue $137.5 $169.4
Gross Margin % 46.8% 45.9%
Pre-Corporate EBITDA (2) $35.3 $39.0
25.7% 23.0%
Operating Statistics
Admit growth - same store (4 ) 5% 1%
ADC growth - same store (4 ) 8% 4%
ADC 9,982 12,046
Avg. discharge length of stay 98 98
Revenue per day (net) $153.10 $154.55
Cost per day $81.49 $83.64
HOSPICE

8
General & Administrative Expenses – Adjusted (1,2)
Notes:
• Year over year total G&A as a percentage of revenue increased 170 basis points • Home Health segment G&A: 200 bps increase as % of revenue primarily due to raises and the addition of business
development resources; 40 bps due to change in staffing model (reclass of Clinical Manager Assistant role from Cost of Revenue to G&A)
• Hospice segment G&A: 180 bps increase as % of revenue – including $6.5M from acquisitions; remaining increase due to raises and the addition of resources to support growth
• Personal Care segment G&A: 200 bps increase as % of revenue • Corporate G&A: 10 bps decrease as a % of revenue – including $1.3M from acquisitions
• Total G&A as a percentage of revenue increased 70 bps sequentially
1. The financial results for the three-month periods ended March 31, 2019, June 30, 2019, September 30, 2019, December 31, 2019 and March 31, 2020
are adjusted for certain items and should be considered a non-GAAP financial measure. A reconciliation of these non-GAAP financial measures is
included in the corresponding 8-K detailing quarterly results for each respective reporting period.
2. Adjusted G&A expenses do not include depreciation and amortization.
Impacted by acquisitions and investments to drive volume growth
29.7% 29.6%
30.3%30.7%
31.4%
28.0%
29.0%
30.0%
31.0%
32.0%
1Q19 2Q19 3Q19 4Q19 1Q20
Total G&A as a Percent of Revenue
G&A as a Percent of Revenue
$ in Millions 1Q19 2Q19 3Q19 4Q19 1Q20
Home Health Segment - Total 71.4 74.0 75.6 76.3 75.8
% of HH Revenue 23.0% 23.2% 24.3% 24.1% 25.0%
Hospice Segment - Total 29.0 34.8 35.6 37.8 38.7
% of HSP Revenue 21.1% 21.9% 21.9% 23.0% 22.9%
Personal Care Segment - Total 3.1 3.1 3.0 3.0 3.3
% of PC Revenue 15.5% 14.9% 14.6% 14.9% 17.5%
Total Corporate Expenses 35.6 35.7 35.9 36.6 36.6
% of Total Revenue 7.6% 7.2% 7.3% 7.3% 7.5%
Total 139.1 147.6 150.1 153.7 154.4
% of Total Revenue 29.7% 29.6% 30.3% 30.7% 31.4%
1Q19 2Q19 3Q19 4Q19 1Q20
Salary and Benefits 19.6 20.6 20.8 20.9 20.0
Other 11.4 11.3 10.9 11.4 12.4
Corp. G&A Subtotal 31.0 31.9 31.7 32.3 32.4
Non-cash comp 4.6 3.8 4.2 4.3 4.2
Adjusted Corporate G&A 35.6 35.7 35.9 36.6 36.6
9
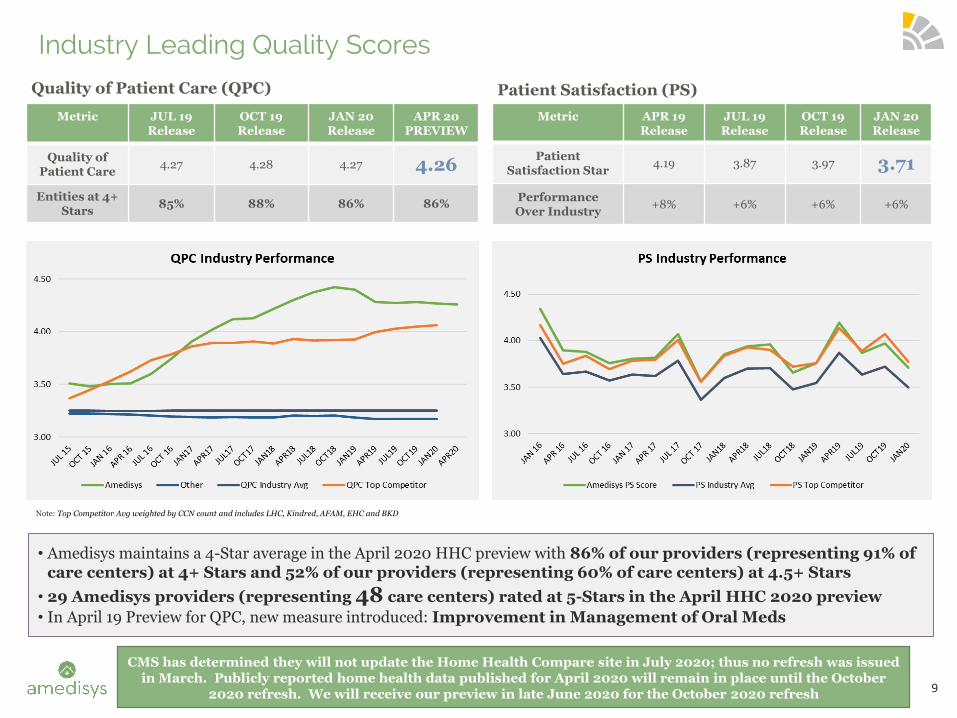
Industry Leading Quality Scores
Note: Top Competitor Avg weighted by CCN count and includes LHC, Kindred, AFAM, EHC and BKD
Metric JUL 19 Release
OCT 19 Release
JAN 20 Release
APR 20 PREVIEW
Quality of Patient Care
4.27 4.28 4.27 4.26
Entities at 4+ Stars
85% 88% 86% 86%
Metric APR 19Release
JUL 19 Release
OCT 19 Release
JAN 20 Release
Patient Satisfaction Star
4.19 3.87 3.97 3.71
Performance Over Industry
+8% +6% +6% +6%
Quality of Patient Care (QPC) Patient Satisfaction (PS)
• Amedisys maintains a 4-Star average in the April 2020 HHC preview with 86% of our providers (representing 91% of care centers) at 4+ Stars and 52% of our providers (representing 60% of care centers) at 4.5+ Stars
• 29 Amedisys providers (representing 48 care centers) rated at 5-Stars in the April HHC 2020 preview
• In April 19 Preview for QPC, new measure introduced: Improvement in Management of Oral Meds
CMS has determined they will not update the Home Health Compare site in July 2020; thus no refresh was issued in March. Publicly reported home health data published for April 2020 will remain in place until the October
2020 refresh. We will receive our preview in late June 2020 for the October 2020 refresh

10
Hospice Quality: Amedisys Hospice Continues to Move Towards Best-in-Class
HospiceQuality

11
Components 1Q19 4Q’19 1Q’20 YoY Variance Detail Initiatives
Salaries $61.54 $64.18 $64.42 $2.88 YoY increase due to planned wage increases and increased costs related to changes to our staffing model partially offset by optimization of discipline mix. Also, YoY increase due to fixed costs (training, PTO, etc.) on lower visits
Staffing mix optimization, productivity and scheduling improvement initiatives in place to help overcome planned salary increases
Contractors $3.08 $2.72 $2.47 ($0.61) YoY utilization improvement driving reduction in CPV
Focused efforts on filling positions with full-time clinicians
Benefits $10.30 $12.45 $9.98 ($0.32) YoY decrease primarily due to health insurance
Focus on cost containment and spend optimization with specific focus on high cost claims
Transportation & Supplies $6.13 $6.47 $6.69 $0.56
*Visiting Clinician CPV $81.05 $85.82 $83.56 $2.51
Clinical Managers $8.01 $8.44 $8.97 $0.96 Fixed cost associated with non-visiting clinicians and planned wage increases: increase driven by lower visit volumes
Unit cost reduced as volume increases
Total CPV $89.06 $94.26 $92.53 $3.47
Operational Excellence: Home Health Cost Per Visit (CPV)-AdjustedTotal CPV impacted by planned wage increases
*Note: Direct comparison with industry competitors CPV calculation
$25.00
$50.00
$75.00
$100.00
1Q19 4Q19 1Q20
Cost Per Visit (CPV)
Salaries Contractors Benefits Transportation
$81.05 $85.82 $83.56
12
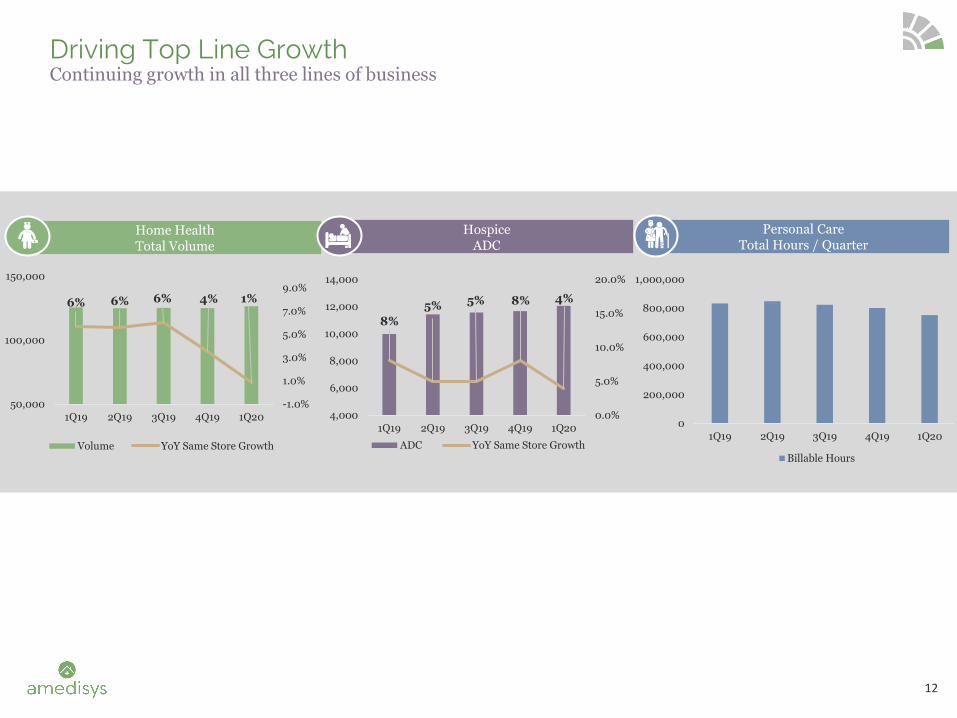
Driving Top Line GrowthContinuing growth in all three lines of business
6% 6% 6% 4% 1%
-1.0%
1.0%
3.0%
5.0%
7.0%
9.0%
50,000
100,000
150,000
1Q19 2Q19 3Q19 4Q19 1Q20
Volume YoY Same Store Growth
Home Health Total Volume
HospiceADC
8%
5% 5% 8% 4%
0.0%
5.0%
10.0%
15.0%
20.0%
4,000
6,000
8,000
10,000
12,000
14,000
1Q19 2Q19 3Q19 4Q19 1Q20
ADC YoY Same Store Growth
Personal CareTotal Hours / Quarter
0
200,000
400,000
600,000
800,000
1,000,000
1Q19 2Q19 3Q19 4Q19 1Q20
Billable Hours
13
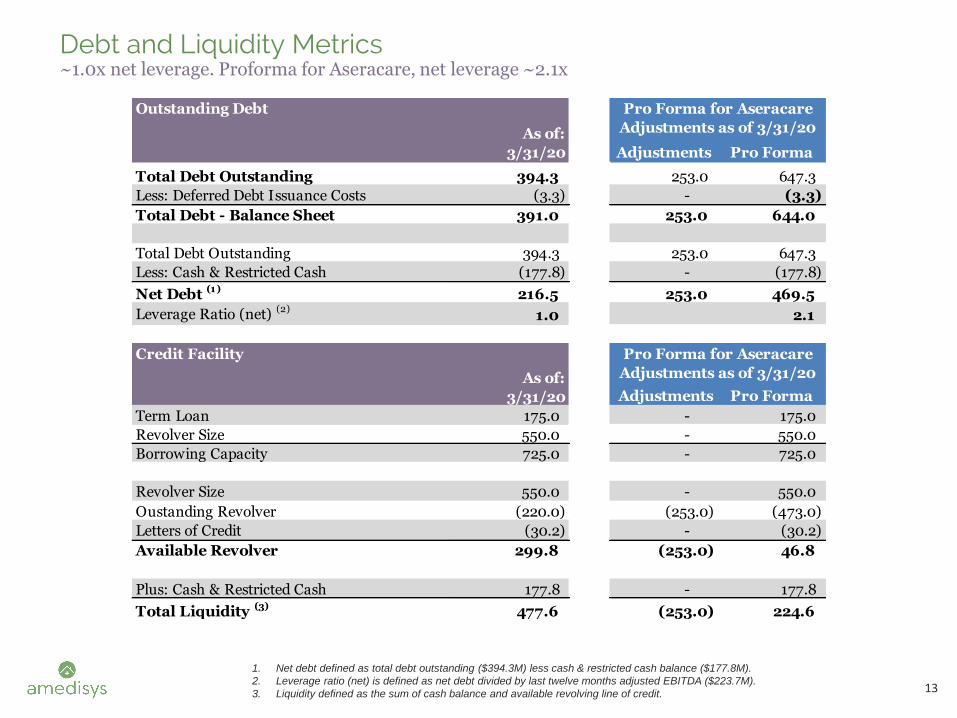
Debt and Liquidity Metrics~1.0x net leverage. Proforma for Aseracare, net leverage ~2.1x
1. Net debt defined as total debt outstanding ($394.3M) less cash & restricted cash balance ($177.8M).
2. Leverage ratio (net) is defined as net debt divided by last twelve months adjusted EBITDA ($223.7M).
3. Liquidity defined as the sum of cash balance and available revolving line of credit.
Adjustments Pro Forma
Total Debt Outstanding 394.3 253.0 647.3
Less: Deferred Debt Issuance Costs (3.3) - (3.3)
Total Debt - Balance Sheet 391.0 253.0 644.0
Total Debt Outstanding 394.3 253.0 647.3
Less: Cash & Restricted Cash (177.8) - (177.8)
Net Debt (1) 216.5 253.0 469.5
Leverage Ratio (net) (2)1.0 2.1
Adjustments Pro Forma
Term Loan 175.0 - 175.0
Revolver Size 550.0 - 550.0
Borrowing Capacity 725.0 - 725.0
Revolver Size 550.0 - 550.0
Oustanding Revolver (220.0) (253.0) (473.0)
Letters of Credit (30.2) - (30.2)
Available Revolver 299.8 (253.0) 46.8
Plus: Cash & Restricted Cash 177.8 - 177.8
Total Liquidity (3) 477.6 (253.0) 224.6
Pro Forma for Aseracare
Adjustments as of 3/31/20
Pro Forma for Aseracare
Adjustments as of 3/31/20As of:
3/31/20
Credit Facility
Outstanding Debt
As of:
3/31/20

14
Cash Flow Statement Highlights (1)
1. Free cash flow defined as cash flow from operations less routine capital expenditures and required debt repayments.
$ in Millions 1Q19 2Q19 3Q19 4Q19 1Q20
GAAP Net Income 31 .6 34.0 34.3 28.0 32.0
Changes in working capital (25.3) 1 2.6 (1 7 .2) 33 .8 (47 .5)
Depreciation and amortization 2.9 5.2 4.4 6.0 5.3
Non-cash compensation, includes 401 (k) match expense 9.0 7 .8 9.2 9.6 9.2
Deferred income taxes 3.3 2 .6 1 1 .9 (4.3) 1 .2
Other (1 .4) (2.9) 4.9 2 .1 5.8
Cash flow from operations 20.1 59.3 47.5 75.2 6.0
Capital expenditures - routine (1 .2) (0.3) (1 .2) (1 .0) (1 .2)
Required debt repay ments (0.6) (1 .7 ) (1 .5) (1 .8) (1 .6)
Free cash flow 18.3 57.3 44.8 72.4 3.2
Capital Deployment
Acquisitions (327 .9) (1 7 .5) - - (69.3)
Equity Inv estments (0.1 ) (0.1 ) - - -
Total (328.0) (17.6) - - (69.3)

15
Income Statement Adjustments (1)
1. The financial results for the three-month periods ended March 31, 2019, June 30, 2019, September 30, 2019, December 31, 2019 and March 31, 2020 are adjusted
for certain items and should be considered a non-GAAP financial measure. A reconciliation of these non-GAAP financial measures is included in the corresponding
8-K detailing quarterly results for each respective reporting period.
2. Planned closures consist of in-patient units acquired from Compassionate Care Hospice whose operations ceased in April 2019.
$000s Income Statement Line Item 1Q19 2Q19 3Q19 4Q19 1Q20
Revenue
Contingency Accrual Net Serv ice Rev enue 1 ,01 8$ 5,523$ -$ -$ -$
Planned Closures (2) Net Serv ice Rev enue (540) (8) - 6 -
Cost of Service
Planned Closures (2) Cost of Serv ice, Excluding Depreciation & Amortization 844 31 3 1 5 2 -
COVID-1 9 costs Cost of Serv ice, Excluding Depreciation & Amortization - - - - 1 ,01 7
G&A
Planned Closures (2) G&A, Salaries and benefits 37 6 - 2 -
Acquisition and integration costs G&A, Salaries and benefits 4,026 1 ,565 1 ,1 05 27 3 662
Planned Closures (2) G&A, Other 51 63 28 - -
Acquisition and integration costs G&A, Other 1 ,7 32 2,929 3,036 1 ,445 1 ,67 4
Legal fees - non-routine G&A, Other (1 32) 1 08 397 604 -
COVID-1 9 costs G&A, Other - - - - 1 2
Other Items
Asset impairment Asset impairment - - - 1 ,47 0 -
Legal settlements Total other (expense) income, net - - (1 ,437 ) - -
Interest component of certain items Interest expense 441 446 451 451 446
Other (income) expense, net Total other (expense) income, net (563) (2,688) 1 ,493 365 225
Total 6,914$ 8,257$ 5,088$ 4,618$ 4,036$
EPS Impact 0.16$ 0.19$ 0.11$ 0.10$ 0.09$

16
COVID-19

17
COVID-19: Total Q1’20 Impact = $3.2M (reported = $4.2M)Impact on volume, rate and gross margin as compared to internal forecast
HH & HOSP Total Admits Home Health Hospice
Actual 2.7% 1.2%
Forecast 6.1% 3.9%
Impact (3.4%) (2.7%)
COVID Impact to Revenue, Cost and Gross Margin
Volume Impact (4.6)
Rate Impact (1.0)
Total Home Health Revenue Impact (5.6)
Total Hospice Revenue Impact (0.6)
Total Personal Care Revenue Impact (0.3)
Total Consolidated Revenue Impact $(6.5)
COVID-19 Costs Actual ($M)
Training $0.6
Quarantine Pay $0.2
Supplies $0.2
Total $1.0
COVID-19 Costs Q1’20

18
COVID-19 Impact on March and Q1’20Home health referrals and admissions hit their low point the week of 4/5 and have begun to recover. Hospice referrals hit their low point week of 3/22 and have begun to recover
*Baseline defined as referrals and admits from pre-Covid-19 timeframe of 1/5/20 – 3/14/20
PPE Item Units Cost ($M)
Avg. Per Unit
Normalized Avg. Per
Unit
Months on Hand
N95 418,200 $2.3 $5.56 $0.60 6
EarloopSurgical Mask
1,460,200 $1.5 $1.02 $0.06 4
Isolation Gown 165,406 $0.8 $4.75 $0.48 3
Exam Glove 2,394,200 $0.2 $0.08 $0.04 2
Goggles / Face Shield
40,630 $0.2 $5.45 $2.52 6
Paper Bag 1,225,000 $0.1 $0.06 $0.06 2
Total - ~$5.1 - - -
PPE Received & On Order
HH: Consolidated Same Store HOSP: AMED + CCH (ex. Asana)
*Baseline defined as referrals and admits from pre-Covid-19 timeframe of 1/5/20 – 3/14/20
60%
70%
80%
90%
100%
3/15 3/22 3/29 4/5 4/12 4/19 4/26 (Est.)
Home Health Admits and Referrals: % of pre-COVID Baseline*
Total Referrals Total Admits
60%
70%
80%
90%
100%
3/15 3/22 3/29 4/5 4/12 4/19 4/26 (Est.)
Hospice Admits and Referrals: % of pre-COVID Baseline*
Total Referrals Total Admits
-
2,000
4,000
6,000
8,000
10,000
12,000
14,000
16,000
18,000
3/1 3/8 3/15 3/22 3/29 4/5 4/12 4/19 4/26
COVID-19 Related Missed Visits by Week
Hospice Home Health

19
PPE GraphsPPE inventory at care centers – not including centralized PPE supply. We have made significant progress providing our care centers with all critical PPE needed to care for COVID-19 symptomatic and COVID-19 positive patients
-
10,000
20,000
30,000
40,000
50,000
60,000
70,000
80,000
90,000
3/17 3/24 3/31 4/7 4/14 4/21 4/28
N95 Masks
-
50,000
100,000
150,000
200,000
250,000
300,000
350,000
3/17 3/24 3/31 4/7 4/14 4/21 4/28
Surgical Masks
-
5,000
10,000
15,000
20,000
25,000
3/17 3/24 3/31 4/7 4/14 4/21 4/28
Cloth Masks
-
10,000
20,000
30,000
40,000
50,000
3/17 3/24 3/31 4/7 4/14 4/21 4/28
Gowns

20
COVID-19: Financial Impacts from Recent Regulatory ActionsThe CARES Act and CMS Waivers provided quantifiable financial impacts to Amedisys; below is a summary of select key provisions
Topic Impact
Sequestration Holiday Suspension of 2% sequestration from May 1 – Dec. 31, 2020• AMED Impact: ~$21M impact
Advanced Accelerated Payments
CMS is authorized to provide accelerated or advance payments during the period of the PHE to any Medicare provider/supplier who submits a request to the appropriate MAC and meets the required qualifications• Submit a specific amount up to 100% of Medicare payment amount for a three-month period• Repayment begins 120 days after the date of issuance of payment and must be completed within
210 days from the date of the accelerated or advance payment was made• AMED Advanced Payment Opportunity: ~$359M – AMED decided not to apply for
Advanced Accelerated Payments due to lack of need and additional application provisions
Payroll Tax Deferral The CARES Act allows employers and self-employed individuals to defer payment of the employer share (6.2%) of the social security tax they otherwise are responsible for paying in 2020, effective for payments due after the date of enactment. Fifty percent (50%) of the deferred payroll taxes are due on December 31, 2021, and the remaining amounts are due on December 31, 2022.• AMED Impact: ~$50M
$100B Emergency Funding
Provides access to $100B in Emergency Funding for eligible healthcare providers• Funds can be used to cover lost revenue and costs associated with COVID-19• AMED Impact: ~$100M out of first $30B disbursements or ~6% of 2019 Medicare
FFS revenue• Treatment of funds continues to be under review