amendtments/additions in green deletions in blue
TRANSCRIPT

1
FUND FOR RESEARCH INTO INDUSTRIAL DEVELOPMENT,
GROWTH AND EQUITY (FRIDGE)
NEDLAC
STUDY TO PREPARE VARIOUS SOUTH AFRICAN
MANUFACTURING SECTORS FOR EFFECTIVE NEGOTIATIONS
FOR THE PROPOSED SACU/CHINA AND SACU/INDIA TRADE
NEGOTIATIONS.
REPORT NO 4
INDIA
STAINLESS STEEL
April 2006
Report by the Consortium:
Consult 101 Emerging Market Focus (Pty) Ltd Danie Jordaan CC Ozone Business Consulting (Pty) Ltd Tswelopele Associates
PARTS OF THE CONTENTS OF THIS REPORT ARE SENSITIVE WITH REGARD TO THE ENVISAGED TRADE NEGOTIATIONS AND ARE TO BE DEALT WITH AS CONFIDENTIAL BY THE COUNTER PART GROUP AND THE CONSULTANTS.
AMENDTMENTS/ADDITIONS IN GREEN DELETIONS IN BLUE

2
ABREVIATIONS
EAF Electric Arc Furnace
IF Induction Furnace
AOD Argon Oxygen Decarburisation
VOD Vacuum Oxygen Decarburisation
CAGR Compounded Annual Growth Rate
ISSDA Indian Stainless Steel Development Association
SASSDA South African Stainless Steel Development Association
NAMA
3
Table of Contents
EXECUTIVE SUMMARY..............................................................................................7
General ........................................................................................................................7
Recommendations from a defensive position. .........................................................14
The cross cutting perspective ..................................................................................14
The sector specific perspective................................................................................15
Recommendations from an offensive position .........................................................15
1 INTRODUCTION...................................................................................................23
2 SECTOR DEVELOPMENT POLICIES ..................................................................24
2.1 Strategy / Development Plan...........................................................................24
2.2 Incentives........................................................................................................26
3 Overview of Markets..............................................................................................26
3.1 Structure and size ...........................................................................................26
3.1.1 Structure ..................................................................................................26
3.2 Growth ............................................................................................................27
3.3 Consumption patterns .....................................................................................29
3.3.1 Present consumption patterns..................................................................29
3.3.2 Sectors consuming stainless steel ...........................................................33
3.3.3 Future consumption patterns....................................................................34
3.4 Distribution......................................................................................................36
4 Features of Industries............................................................................................37
4.1 Production.......................................................................................................37
4.1.1 Number of producers ...............................................................................38
4.1.2 Capacity...................................................................................................39
4.2 Types of Products ...........................................................................................40
4.3 Performance (expansion/decline) and Outlook................................................43
4.4 Employment ....................................................................................................46
4.5 Production costs & cost of capital....................................................................46

4
4.6 Pricing and logistics ........................................................................................48
4.6.1 Pricing......................................................................................................48
4.6.2 Logistics...................................................................................................49
4.7 Presence of multi-nationals .............................................................................50
4.8 Import and export structure (product groups) ..................................................50
4.9 Importance to the economy.............................................................................52
4.10 Considerations ................................................................................................53
5 PROTECTION AND ASSOCIATED ASPECTS .....................................................54
5.1 Tariffs..............................................................................................................55
5.1.1 Bindings and bound rates.........................................................................55
5.1.1.1 South Africa ......................................................................................55
5.1.1.2 India..................................................................................................55
5.1.2 Applied tariffs ...........................................................................................59
5.1.2.1 South Africa ......................................................................................59
5.1.2.2 India..................................................................................................59
5.1.3 Comparison..............................................................................................61
5.2.1 Introduction.....................................................................................................65
5.2.1.1 Trade policy measures......................................................................66
5.2.1.2 Technical regulations ...............................................................................66
5.2.1.3 Administrative procedures................................................................66
5.2.2 NTBs in import regimes ..................................................................................66
5.2.3 NTBs in India: General ...................................................................................67
5.3. Additional duties and taxes .............................................................................68
5.4. Customs procedures and delays .....................................................................69
5.5. Import restrictions and conditions....................................................................71
5.6 Licensing.........................................................................................................71
5.7. Customs valuation...........................................................................................72
5.8. Reference pricing and minimum import prices.................................................73
5.9. Labelling requirements....................................................................................73
5.10. Standards .......................................................................................................75
5.11. Government procurement ...............................................................................76
5.12. Investment ......................................................................................................76
5.13. Anticompetitive Practices ................................................................................77

5
5.14. Export taxes ....................................................................................................77
5.15. Intellectual property rights ...............................................................................77
5.16. The propensity to use trade remedies .............................................................78
5.16.1. Anti-dumping duties .................................................................................78
5.16.2. Countervailing duties................................................................................80
5.16.3. Safeguard measures................................................................................81
5.17. Other trade discriminatory measures...............................................................81
5.18. Considerations ................................................................................................83
6 TRADE FLOW ANALYSIS OF THE DEFENSIVE POSITION................................85
6.1 Introduction .....................................................................................................85
6.2 Comparative size ............................................................................................85
6.3 Export to the world ..........................................................................................86
6.3.1 Product categories ...................................................................................86
6.4 Destination......................................................................................................87
6.5 Export growth..................................................................................................88
6.6 Revealed comparative advantages .................................................................90
6.7 Imports of Stainless Steel by South Africa.......................................................91
6.7.1 Data .........................................................................................................91
6.7.2 South African imports of Stainless Steel from the world ...........................91
6.7.3 Origin of imports.......................................................................................92
6.7.4 Imports from India ....................................................................................93
6.7.5 Revealed comparitive advantages ...........................................................95
6.8 Considerations. ...............................................................................................96
7 TRADE FLOW ANALYSIS OF THE OFFENSIVE POSITION................................98
7.1 Introduction .....................................................................................................98
7.2 Product categories ..........................................................................................99
7.3 Origin ............................................................................................................100
7.4 Import growth ................................................................................................100
7.5 Revealed comparative disadvantages...........................................................101
7.6 Exports of Stainless Steel products by South Africa ......................................102
7.6.1 Data .......................................................................................................102
7.6.2 South African exports of Stainless Steel to the world .............................102

6
7.6.3 Destination of South African exports. .....................................................103
7.7 Revealed comparative advantages ...............................................................104
7.8 Considerations ..............................................................................................104
8 SYNTHESIS AND RECOMMENDATIONS..........................................................105
8.1 The defensive position ..................................................................................105
8.1.1 Considerations .......................................................................................105
8.1.2 Recommendations from a defensive position. ........................................109
The cross cutting perspective ................................................................................109
The sector specific perspective..............................................................................109
8.2 The offensive position ...................................................................................110
8.2.1 Considerations .......................................................................................110
8.2.2 Recommendations from an offensive position ........................................112
ADDENDUM A ......................................................................................................114
ADDENDUM B ......................................................................................................115
INDIA: GENERAL INCENTIVE SCHEMES ...........................................................115

7
EXECUTIVE SUMMARY
General
1. India does not want to be omitted from the preferential benefits of regional and
bi-lateral trade agreements especially with Asian partners. This entails numerous
trade agreements with regions-, trading blocks- and bi-lateral ones with
countries. .India’s current strategy is to secure economic relations with key
developing countries, firstly within the Asian region and secondly with selected
countries in other regions. India seeks to tie the trade interests of its South Asian
neighbours with its own growing economy. While the agreements focus on trade
facilitation a number of them extend beyond that in the form of Comprehensive
Economic Cooperation agreements.
2 India’s population is 23 times that of South Africa and its GDP just less than four
times. Sustained rapid growth (8%p.a.), a high investment ratio (28% of GDP)
and a large population promise to propel the Indian economy to one of the
largest mass markets in the world in the longer term. The Indian economy is
already the 10th largest in the world. Indian firms can thus expect to benefit from
economies of scale. Competition from Indian producers will in all probability be a
threat to their South African counterparts but Indian markets will offer
opportunities to South Africans.
3. Exchange rate movements between the Rupee and the Rand are not expected
to impact significantly on trade.
4. The Indian government has traditionally had a legacy of protectionism toward the
economy and this has translated into a bureaucratic system that is inefficient and
infected with some measure of corruption. However, as part of the reform
process, the government has endeavored to address bureaucratic obstacles and
to reduce corruption.
Reforms
8
5. Despite significant economic reforms, India still suffers from an underdeveloped
financial sector while India’s infrastructure faces the twin challenges of expansion
and modernisation. Incentives are to be introduced for investment in certain
sectors, which include telecommunication, ports, airports, railways, roads, energy
and construction.
These interventions will be to the benefit of the demand for stainless steel.
6. To further internationalisation, competitiveness and investment in industry, India
undertook a number of reforms that included the adoption of a market related
exchange rate; the privatisation of industries and their deregulation (de-
licensing). On the back of this India is receiving foreign direct investment that
together with the vibrant IT services sector and the upcoming middle class
consumers, are expected to support high growth. A range of tax and other
incentives apply.
7. The sectors that have been opened up to foreign competition by the liberalising
reform program is contributing to significant expansion in the production and
quality of durable consumer goods; motor cars; scooters; consumer electronics;
computer systems; and white goods.
Stainless Steel
8. The Indian stainless steel industry has grown at a rate of 16% over the last
fifteen years and has averaged growth of 20% over the last four years. The
exceptional growth of the last four years can be attributed to growth in exports to
China. Exports expanded by 55% p.a. between 1999 and 2004.
9. Production has increased from a low level in the early nineties to approximately.
1.7 million tonnes in 2004-2005, at a value of about US$ 2.2 billion. India’s share
of world production has increased from 2% in 1991-1992 to approximately. 7% in
2004-2005. It is estimated that by 2010, the production of stainless steel will
amount to 2.618 million tonnes and 4 million tonnes in 2016 . The production of
the CR-MN200 grade in which India has a competitive advantage is mainly used
in the manufacture of utensils.

9
10. Flat bars manufactured by primary producers are cold rolled (by stainless steel
re-rollers) into utensil grade sheets (referred to as Patta) and this is used
primarily for utensils applications. According to estimates, there are approx. 410
stainless steel re-rollers in India in the production of patta (Cr-Mn grade stainless
steel with a nickel content of less than 1% usually 0.5% nickel content). It is
estimated that patta production in India will increase from 1821 000 tonnes in
2005 to 2618 000 tonnes in 2010.
12 India currently holds a 10% share in the global market for kitchenware. The
global kitchenware market is currently dominated by China, but India has
experienced an increase in market share, rising from 5% in 2001-2002 to the
2005 figure of 10%. India would like to capture 25% market share by
2015.Consumption in this sector is estimated at approx. 874 000 tonnes and is
forecast to grow to 2186 000 tonnes by 2015-2016. Approx. 40% of the
kitchenware sector is export based and exports of kitchenware products have
been growing at a rate approx. 25% over the last four years
13. Stainless steel consumption in India is growing at 11.5% to 12% annually. It
amounted to approximately 1.153 million tonnes in 2004-2005. Flat products
constitute the majority of products consumed at 86% (CR-MN grade 72.4%) ,
whilst the balance is made up by long products. The high consumption ratio of
flat products is explained by the structure of Indian downstream stainless steel
consumption where the manufacture of utensils constitutes 70% of production as
against a world average of about 36%.
14. Industry specific policies are developed by the industry in conjunction with
government. The industry aims at improved availability; expansion of process
capacity; moving up the value chain; pricing and affordability; and extending and
expanding the market. Incentives available to industry include the duty drawback
scheme that reimburses producers for the import duties on raw materials.
15. Use of stainless steel in construction is predicted to increase from 28 million
tonnes in 2004 to 208 million tonnes in 2010 or from 2.4% to 9.1% of
consumption. Application in the transport sector is to increase from 24 million

10
tonnes to 104 million tonnes in 2010 (2.1% to 6.1% of consumption). The
remaining applications are also expected to increase in proportion to
consumption while the dominance of use of stainless steel in utensil manufacture
is set to decline to 62% of consumption in 2010.
16. Exports is 46 % of production. The Indian stainless steel industry is thus export
orientated and especially in the upstream part of the industry where the export of
flat rolled stainless steel >600mm is half of the total in tonnes. Imports of
stainless steel are 9% of production and also predominantly flat rolled stainless
steel >600mm. Exports is predicted to grow by 9% to 12 % p.a. over the next ten
years and imports by 12% to 15% annually.
17. South Africa’s consumption of stainless steel in 2005 was 149 928 tonnes (54
684 t exported after processing). Sectors consuming stainless steel include
Architecture, Building and Construction, Automotive, Infrastructure,
Petrochemicals and Mining.
18. Indian producers of primary products import raw materials like iron pellets, nickel
etc. The high prices of nickel on the global market pose a challenge for
producers.
19 The Indian stainless steel industry is on an expansionary path and geared toward
product improvement, capacity building and global expansion.
Trade
17. India’s bound tariff rate for stainless steel is 40%. Only 64% of the tariff headings
of Chapter 74 (Metal products) are bound. .
18. India’s basic (applied) duties now a days are very uniform, mostly at 15% (as
from 1 March 2005). The duty on stainless steel of Heading 72.19 is 10% (actual
applied rate), on other stainless steel (apparently) 20% and on products of
stainless steel 15%.The South African applied tariff is 5% on primary products
going up in steps of 5% to 20% on household products. .

11
19. However India’s tariff structure is not transparent with the contents of a large
number of notifications and general exemption notices not incorporated in
Schedule 1 (basic duty schedule). Furthermore, India applies additional taxes on
imports and their structure is not transparent. The most important of these is an
additional duty of generally 16% which is actually a central excise or value added
duty.
20 Tariff concessions granted by India may, therefore, in certain cases be of no real
value. During negotiations on tariff concessions, SACU should make sure that
the preferences offered by India will result in actual reductions in the currently
applied rates.
21 NTBs remain a major problem for exporters to India although the situation has
improved over the past few years. The NTBs with the most affect on exports to
India are policy unpredictability and uncertainty; customs procedures and delays;
customs valuation; port and other transport infrastructural problems; general
burdensome red tape; and labelling requirements.
22. India has become the country that uses anti-dumping duties most of all countries.
The sectors most subject to anti-dumping measures imposed by India are base
metals and products thereof (33.1%) that would include stainless steel.
23. Of countries against which anti-dumping investigations have been initiated, India
is fifth on the list in regard to the number of initiations. India is subject to more
countervailing measures than any other country.
24. Exports of stainless steel products by South Africa and India in US$ are similar in
size but South Africa’s imports less stainless steel products than India. Both
countries have a positive trade balance in the trade in stainless steel products
while South Africa has a positive balance with India.
25. India is exporting intermediate stainless steel products complemented by
downstream products especially hollowware and kitchen articles as well as

12
cutlery. However, compared to 2000 exports of stainless steel products by India,
in 2004 came to be dominated by intermediate products.
26. The destinations of Indian stainless steel exports are dispersed with the single
most important clients being China, USA and UAE. South Africa is the
destination of 1% of India’s stainless steel exports.
27 Revealed comparative advantages for India have been calculated in its exports
to the world in the products below and any concessions to India on them should
be avoided:
HS 7222 Other bars and rods of stainless steel; angles, shapes
and sections.
HS 7223 Wire of stainless steel. Delete
HS 7323 Table, kitchen or other household articles and parts
thereof, of iron or steel; iron or steel wool; pot scourers and
scouring or polishing pads, gloves and the like, of iron or steel.
HS 7221 Bars and rods, hot-rolled, in irregularly wound coils, of
stainless steel.
HS 8214 Other articles of cutlery (for example, hair clippers,
butchers' or kitchen cleavers, choppers and mincing knives,
paper knives); manicure or pedicure sets and instruments
(including nail files).
27. Although imports of intermediate products grew significantly in latter years, most
of South Africa’s imports are downstream stainless steel products. Prominent
among the latter are seamless pipes and tubes, knives, spoons and forks and
food industry machinery. Imports from the world amounted to US$ 282 million in
2004.

13
28. Most imports come from Germany, China and Italy. 4% of imports are from India.
29. South African imports of stainless steel products from India doubled from US$6.4
in 2000 to US$12.4 in 2004. Most categories showed increases but the more
prominent were imports of bars, rods and angles; wire; hollow and other
kitchenware, and knives spoons and forks. Imports of kitchen and hollowware
trebled between 2000 and 2005 and are the single most important stainless steel
imports from India.
30. In addition to the products mentioned above India has a comparative advantage
against South Africa in:
7220 Products of stainless steel of a width of less than 600 mm.
8215 Spoons, forks ladles, skimmers, cake-servers, fish-knives, butter-knives,
sugar-tongs and similar kitchen or tableware.
8212 Razor and razor blades (including razor blades blanks in strips).
Concessions on these products to India should be avoided
31. In 2004 India imported about US$500 million worth of stainless steel products. Of
that 45% was seamless pipes and tubes and a further 36% flat rolled products.
Imports of stainless steel products are thus growing to be highly concentrated In
2004. Import of seamless tubes pipes were almost 4 times and that of flat rolled
products 3 times higher than in 2000.
32. South Africa increased its supply of stainless steel products to the Indian market
from1 % in 2000 to 2% in 2004.
33. In 2004 South Africa exported US$ 1089 million, double the exports in
2000. However, exports remain concentrated in flat rolled intermediates. Export
growth in US$ averaged 23% p.a. between 2000 and 2004.

14
34. Italy and China are the major destinations of South African stainless steel
exports. About 2% of exports (90% flat rolled) went to India in 2004 up from !% in
2000.
35 South Africa has a comparative advantage in the export of flat-rolled products of
stainless steel with a width 600mm or more. Imports and exports of stainless
steel products by South Africa and India are becoming more intensive although
at a very low level.
37. Revealed comparative disadvantage calculations of India indicate that there may
be opportunities in exporting the following products to India because of India’s
comparative disadvantage in their trade:
7304 Tubes, pipes and hollow profiles
7222 Other bars and rods of stainless steel, angles, shapes and sections of
stainless steel
7221 Bars and rods, hot-rolled, in irregularly wound coils, of stainless steel.
38. While South Africa should be cautious in granting concessions in the trade in
stainless steel in a PTA with China, the Indian stainless steel market is
sufficiently attractive to pursue concessions from India in a PTA with them.
Considerations of the granting and of the winning of concessions should be done
in thorough consultation with the stainless steel industry.
Recommendations from a defensive position.
The cross cutting perspective
1. The Indian economy is 4 times South Africa’s and the population 23 times. India’s
economy is the 10th largest in the world with high growth potential. South Africa is
more open to international trade (66% of GDP) than India (31%). Indian exports to
South Africa are expanding and because of the difference in size and trade intensity,
the impact on the South African market can be much more extensive than the other
way round.

15
The sector specific perspective
2 By considering that India’s stainless steel sector is:
• undergoing robust growth in production, consumption and export;
• supported by a clear development strategy as developed by the Indian stainless
steel industry;
• backed by government development incentives;
• with the real threat of excess capacity that may impact adversely on trading
partners when conditions change for the worse,
• India’s competitive advantage in down stream stainless steel products; and
• South Africa’s greater vulnerability due to its openness to trade and the
comparative smallness of its economy;
should cause negotiators to be extremely careful in granting concessions on
stainless steel products to India.
3. Should any concessions be contemplated they need to be worked out in conjunction
with the constituents of the stainless steel sector.
4. The tariff headings that appear in paragraphs 14 and 16 represent areas of
competitive advantage by India that makes it dangerous to grant any concessions
with regard to them.
5. Negotiations may be complicated by:
• the Doha Round. The applied tariff rates of some product groups will be subject
to reduction over a period of time in terms of NAMA (non-agricultural market
access) if the Doha Round is successfully concluded. NAMA introduces a
degree of uncertainty with respect to future MNF tariff levels that may render
bilateral concessions premature; and
• WTO unfriendly subsidies and incentives that may be enjoyed by Indian firms.
Recommendations from an offensive position
From a cross cutting perspective
1. By considering that
• India is the second fastest growing economy of the world;
• Already is the 10th largest and destined to become even more important
with sustained high growth caused by increases in prosperity to be

16
generated by exports, India’s IT services sector and its growing segment
of middle class consumers;
suggest that opportunities for concessions on South African exports of stainless
steel products be pursued.
•
From a sector specific perspective
2. Because:
• India’s imports of stainless steel are predicted to grow faster than
consumption over the next ten years;
• .South African exports of predominantly flat rolled products to India are
growing rapidly although from a low base;.
• Applications in construction and transport are to become more prominent
to supplement the large amounts of stainless steel that is used in the
production of utensils,
could make it worth while for South Africa to request tariff concessions from
India.
3. Apart from South Africa’s apparent advantage in exporting flat rolled products
India may offer opportunities in the following where it seems to be at a
competitive disadvantage against the world at present.
• 7304 Tubes, pipes and hollow profiles
• 7222 Other bars and rods of stainless steel, angles, shapes and sections
of stainless steel
• 7221 Bars and rods, hot-rolled, in irregularly wound coils, of stainless
steel.
(These opportunities could be viable with or without a PTA)
4. Negotiations can be complicated by WTO unfriendly subsidies and incentives that
Indian producers may enjoy. A further complicating factor is South Africa’s very
narrow range of stainless steel products on offer that limit its ability to benefit from
PTA’s. This could become an issue where India may request concessions over a
range of down stream products where South Africa is at a competitive disadvantage.
Indian NTB’ s, furthermore, are a major deterrent to imports. Negotiators need to
ensure that tariff concessions are real and not eroded by non-tariff barriers;
17
Uncertainty on future tariff levels because of NAMA may render bi-lateral
concessions as premature.
3. Prospective exporters should enter the Indian market preferably in partnership
with an Indian counterpart in view of the NTB’s and other issues in doing
business in India. .
BACKGROUND
NEDLAC launched a study into the implications of the envisaged trade agreement
between SACU and India for a number of South African manufacturing sectors. It is
accepted that the trade agreement with India initially will be selective in the format of a
Preferential Trade Agreement (PTA) instead of a Free Trade Agreement (FTA). The
primary objectives of the study are to obtain an insight into the environment of doing
business in India and among others into the attributes of its stainless steel industry.
A number of aspects cut across the different sectors that NEDLAC singled out for
investigation. These aspects are. bi- and multi-lateral trade agreements that India has
entered into; macro aspects; the business environment; and the general trade and
industrial policies as opposed to sector specific ones. Although they are important in the
formulation of sector strategies in the coming trade negotiations it was required that they
be reported on separately. Thus, some of the more important implications for sector
strategies following the analysis of cross cutting aspects are recapped in the following
paragraphs.
TRADE AGREEMENTS
India supports multi-lateral trade relations through the WTO. Since it beliefs that the
multilateral system cannot drive south-south trade as such, India is pursuing bilateral
and regional trade agreements. These economic cooperation agreements need to be the
building blocs and drivers of global trade. India does not want to be omitted from the
preferential benefits of such trade arrangements and is willing to open its economy and
import more from regional countries

18
Implementation of the policy entails numerous trade agreements with regions-, trading
blocks- and bi-lateral ones with countries. .India’s current strategy is to secure economic
relations with key developing countries, firstly within the Asian region and secondly with
selected countries in other regions. India seeks to tie the trade interests of its South
Asian neighbours with its own growing economy. While the agreements focus on trade
facilitation a number of them extend beyond that in the form of Comprehensive
Economic Cooperation agreements.
In negotiating future FTAs, with developed countries in particular, India will seek to
secure benefits for its service sectors where its economy enjoys comparative
advantages while at the same time protecting some Indian services. India will also be
cautious to sign an FTA with China given China’s comparative advantage in
manufacturing, discrepancies like the low cost of finance in China and the notion that
China will benefit more than India because India’s tariffs are higher than China’s.
Negotiations for a PTA between South Africa and India will depart from a position where
average tariffs levied on imports from India are substantially lower than that faced by
South African exports to India. The Indian stainless steel industry are among those
expected to benefit from trade agreements. India would probably also negotiate for
benefits in the South African services sectors. However, it need to be mentioned that
India’s priority would be trade with its Asian partners and PTA with South Africa,
although important, would possibly lie on the periphery of the bigger picture of India’s
trade interests.
MACRO MATTERS
The South African and Indian economies are adapting to the demands of the global
economy coming from trade protective pasts. Both economies are relatively stable with
inflation under control and lower than 5%. Growth in the in Indian economy is
substantially more robust on the back of an investment ratio to GDP of almost 28%
compared with South Africa’s 16.5%. The norm for growth in GDP in recent years came
to 6% for India and 4% for South Africa. India strives to raise growth to 8% and South
Africa has a vision of 6% growth.
19
Investment in India and the financing thereof is fundamentally on a much sounder
footing than found in South Africa. However, growth in the Indian economy is
constrained by bottle necks in all spheres of infrastructure and by its stringent labour
regulations and opposition to privatisation. Therefore, inefficiency overhangs persists in
large pockets of the Indian economy that are in the hands of the public sector.
Bold programmes are underway to improve the supply of infrastructure. Construction of
infrastructure is a source of growth in its own right. In the mean time private concerns
find it necessary to erect own infrastructure to safeguard their operations.
India’s population is 23 times that of South Africa and its GDP just less than four times.
Sustained rapid growth and a large population promise to propel the Indian economy to
one of the largest mass markets in the world in the longer term. The Indian economy is
already the 10th largest in the world. Indian firms can thus expect to benefit from
economies of scale. Competition from Indian producers will in all probability be a threat
to their South African counterparts but Indian markets will offer opportunities to South
Africans.
The production structure of India portrays the pattern found in developing countries with
a dominating agricultural sector. The manufacturing sector is more prominent in the
South African economy than the contribution that manufacturing is making to the Indian
economy. The South African economy (66%) is substantially more exposed to
international trade than India’s (31%). Both countries run deficits in the import and export
of merchandise. However, India balances its deficit with strong IT export services and by
remittances from Indians living abroad. South Africa relies on capital inflows to balance
the trade account.
In 2004 the value of the Rand in $, and that of the Rupee, was practically the same as in
1999 at 7 Rupee to the Rand. The effect of the intermittent currency upheaval of
1999/2001 thus disappeared. If at all, future changes in the Rupee/Rand rate should
reflect a weakening of the Rand because of the fundamentals of the Indian balance of
payments being stronger than South Africa’s.
BUSINESS ENVIROMENT

20
India is relatively stable politically although terrorist activity (Kashmir) is the second
highest in the world. Tensions that may arise between the centre and state governments
some times may project some measure of political instability.
The Indian government has traditionally had a legacy of protectionism toward the
economy and this has translated into a bureaucratic system that is inefficient and
infected with some measure of corruption. However, as part of the reform process, the
government has endeavored to address bureaucratic obstacles for foreign investors
through the creation of investment agencies for investment approvals, reducing the
necessary licensing requirements and ceding more authority to state governments to
allow for easier investment and business facilitation. The government has made it a
priority to reduce corruption.
An Inter-State Trade Council was established to promote involvement of the States in
export promotion; assist in developing export related infrastructure; assist in removing
taxes and local levies imposed on inputs required for export production. The Indian
Government has a range of incentives and concessions available to eligible corporations
in certain specific industries. Broadly, the tax incentives include tax holidays for
corporate profits, accelerated depreciation allowances and deductibility of certain
expenses subject to certain conditions. Concessions apply to profits from new
undertakings and location in special economic zones. Various rebate and duty drawback
schemes exist to promote exports.
India has implemented significant economic reforms, but still suffers from an
underdeveloped financial sector while India’s infrastructure faces the twin challenges of
expansion and modernisation. The major area requiring upgrading and investment is the
transportation sector – roads, ports and airports, which is currently far below standard of
other emerging market economies and which poses a serious obstacle to development.
Incentives are to be introduced for investment in certain sectors, which include
telecommunication, ports, airports, railways, roads, energy and construction
development with a view to improving competitiveness of the Indian economy. Tax
incentives, customs duty concessions for imports of equipment/machinery and the
implementation of Special Economic Zones within the country would be further
incentives for investment. .

21
In recent years, India has emerged as a favourable investment destination. India has
emerged as an across the board low cost base. FDI into India targets the IT and
automotive industries and some metal industries.
Intellectual property rights in India, including patents, trademarks, copyright issues and
industrial designs is protected by a well-established statutory, administrative and judicial
framework that is constantly improved. However, the protection of intellectual property
remains an area of concern for foreign investors.
TRADE AND INDUSTRIAL POLICIES -GENERAL
To further internationalisation, competitiveness and investment in industry, India
undertook a number of reforms that included the adoption of a market related exchange
rate; the privatisation of industries and their deregulation (de-licensing). On the back of
this India is receiving foreign direct investment that together with the vibrant IT services
sector and the upcoming middle class consumers, are expected to support high growth.
A range of tax and other incentives apply.
The sectors that have been opened up to foreign competition by the liberalising reform
program is contributing to significant expansion in the production and quality of durable
consumer goods; motor cars; scooters; consumer electronics; computer systems; and
white goods. However, future manufacturing performance will depend on further reform
especially with regard to heavy industry largely still owned by the state. However, the
appetite for reform by the present coalition government seems to be less than that of its
predecessors.
Inadequate infrastructure, bureaucracy, restrictions in hiring and firing in the labour
market and improper access to finance for the small scale sector are the major
impediments to growth in India. The main obstacles that need to be addressed by the
government include reducing entry and exit barriers for the manufacturing sector and
reducing and then removing infrastructure bottlenecks. Bureaucracy proved to be a
major obstacle as well as investment in infrastructure by firms to avoid disruption of
activities.
22
The foregoing serves as background to the sector analysis of the stainless steel industry
and the ultimate formulation of a strategy for the sector to be followed in trade
negotiations. The emphasis of the sector analysis is to be on features of the Indian
stainless steel industry, the markets and on protection and associated aspects with an
evaluation of trade flows. Threats and opportunities are to be identified and defensive
and offensive strategies developed with regard to the envisaged trade deal.
CROSS CUTTING THREATS AND OPPORTUNITIES.
These can be summarised as below.
THREATS
1 The Indian economy is adapting from a protective past to the demands of
becoming a globalised economy. A number of reforms were introduced to
achieve that and growth progressed to more than 6% p.a. with a vision to sustain
8% growth p.a. However, the reforms are threatened by serious infrastructure
constraints, stringent labour regulations and opposition to privatisation.
2. A range of incentives is in force that includes tax holidays, accelerated
depreciation, tax concessions, EPZ and other development zones’ Liberal draw
back of duty compensation to exporters apply and exporters have preferential
access to finance.
3 India’s priority is to conclude trade agreements with Asian countries/trading
blocks. A PTA with South Africa may thus be less important than with its Asian
neighbors.
4 The applied tariff rates of some product groups will be subject to reduction over a
period of time in terms of NAMA (non-agricultural market access) if the Doha
Round is successfully concluded. NAMA introduce a degree of uncertainty with
respect to future MNF tariff levels that may render bi-lateral concessions pre-
mature.
5. The Indian economy is 4 times South Africa’s and the population 23 times. Its
economy is the 10th largest in the world with high growth potential. South Africa is
more open to international trade (66% of gdp) than India (31%) Indian exports to
South Africa are expanding and because of the difference in size and trade
intensity, the impact on the South African market can be much more extensive
than the other way round.

23
7. Although legislation is considered to be sufficient concerns about the
safeguarding of international property rights continue to prevail among foreign
investors..
OPPORTUNITIES
8 A PTA with India will start off with South African tariffs lower than India’s with the
benefit of the likelihood that Indian tariffs being lowered more than South Africa’s.
9. The Indian market is expanding and thus offers business opportunities Growing
prosperity is expected to be sustained by exports, India’s IT services sector and
its growing segment of middle class consumers.
10. Prevalence of non-tariff barriers, cumbersome bureaucracy and a predilection for
the use of trade remedies may distract from the attractiveness of trade
barriers.The Indian market should preferably be entered in partnership with a
local business counterpart.
1 INTRODUCTION
The Indian stainless steel market is currently on a wave of expansion. The opening of
the Indian economy and the economic growth that followed has provided the impetus for
the development and growth of the stainless steel market. The creation of the 200 series
grade has provided India with a niche in the global steel market and the Indian stainless
steel sector has expanded at a rate of 16% p.a. in recent years to reach a production
high of 1.7 million tonnes in 2004-2005. The challenge for the Indian stainless steel
industry is to promote growth, as stainless steel is consumed primarily for the
manufacture of utensils. Globally, 36.5% of the stainless steel consumption is in utensils,
15% in transport, 11% in construction, 19.4% in process equipment and 12% in welded
tubes. In India approximately 70% of consumption is in the form of utensils.
However, as economic growth in India continues, stainless steel is being increasingly
used in infrastructure development projects. Consumption of stainless steel is also on
the rise and is set to continue on an upward trend in the medium to long term.

24
2 SECTOR DEVELOPMENT POLICIES
2.1 Strategy / Development Plan
India is currently experiencing massive growth, in production, consumption and capacity
expansion. According to ISSDA (Indian Stainless Steel Development Association), the
following strategy for the strategic growth and direction of the stainless steel industry is
to be implemented in order to ensure continued and sustained growth.
The domestic steel industry is classified into three different segments:
• The technology dictated market: This refers to the need identified by Indian
manufacturers to update their technology.It is dependent on the growth of the
usage of end use products and has immense growth potential. In order to
achieve this potential, the grades and quality of stainless steel will have to be
improved over time, in order to keep up with technological advancements. This
segment is expected to grow at 15% per annum and improve its share from 22%
to 32% in the next ten years.
• The consumer dictated market: This segment is dependent on product delivery
at affordable prices. It is already a strong growing sector and is set to continue
along its present growth trend.
• Market development dictated: This refers to the introduction of new products
and applications in the Indian market. (an example is the introduction of 300
series hollowware to a targeted, upper income market.) This is dependent on
market development toward the integration of new applications. Market
development will involve education, promotion, new application and design
development etc. This market is expected to capture the primary focus in the
near future and will increase at an annual rate of 27%.
Strategic issues in the development of the stainless steel industry that still need to be
addressed include:

25
• Improved availability: While access to goods is not a current problem, it could
emerge in the future as demand continues to increase at high levels. The
strategy is that increased capacity should drive demand, rather than waiting for
demand to lead to an increase in capacity.
• Processing capacity expansion: The capacity at the processing levels is currently
not sufficient to cater for demand. The processing capacity in consumer dictated
markets like kitchenware etc are well established. Concerns regarding capacity
apply to the fabrication segment where there is a shortfall in skills, technology,
practices and quality of output. Effective capacity building is required in this area.
• Moving up the value chain: The stainless steel market is currently in a state of
evolution, whereby it is moving up the value chain. As a result, the share of the
lower quality Cr-Mn grade in the market is set to decrease, as other higher end
grades come into play.
• Pricing and affordability: Related to the above point is the question of pricing and
affordability in the market. Pricing has been a vital factor to consider in the Indian
market. The creation of the Cr-Mn series was to offer the end users a more
affordable option and remains a popular product. Whilst it is projected that the
prominence of other products is set to increase, the Cr-Mn grade will continue to
have a significant market hold in the medium to long term.
• Extending and expanding the market: The Indian market is regarded as being
very trade centric and inward looking, as opposed to proactively exploring
outside opportunities.
This strategic plan, as conceptualised by the main industry players in India is aimed at
internationalising the Indian stainless steel industry, not only in terms of building up
domestic capacity, but also with regards to developing and improving Indian stainless
steel to international standards.
26
2.2 Incentives
According to interviews conducted with relevant industry players in the Indian stainless
steel industry, stainless steel in India is not subsidised.
Previously, the stainless steel industry received various financial support mechanisms
from the Government in the form of duty drawbacks and duty exemptions for raw
material inputs for manufactured products for exports, tax breaks for exporters provided
by local governments in their respective states, preferential finance at lower bank
interest rates and export insurance in the event of non-payment by the importing party.
However, the majority of these schemes, most significantly the Duty Entitlement
Passbook Scheme (DEPB) have been cancelled by the Government. Currently the only
scheme still in place is the duty drawback scheme, whereby manufacturers are
reimbursed their import duty costs, if their products are to be exported. According to Dr
A.S Firoz, Chief Economist, Ministry of Steel, this is not regarded as an incentive by the
government, but simply as a measure to offset the high input costs of imported raw
materials. (See Addendum B for general incentive schemes.) No other significant
incentives for the stainless steel industry in India were identified.
During the course of interviews conducted with industry players in India, it was
categorically stated by producers (Jindal, Chandan), government (Dr Firoz, Ministry of
Steel) and foreign players in the market (Mr Tolani of Arcelor and Mr Rajesh Agarwal of
Stemcor) that no incentives are offered by government to the local industry.
3 OVERVIEW OF MARKETS
3.1 Structure and size
3.1.1 Structure
The Indian stainless steel industry is regarded as rather large and fragmented. It
consists of an elite group of large manufacturers who hold the majority of market share,

27
several small and medium enterprises and thousands of companies who operate in the
informal sector.
3.2 Growth
The stainless steel industry in India has grown by 16% over the last fifteen years and
has averaged growth of 20% over the last four years. Production, which amounted to
only 228,000 tonnes in 1991-1992, has risen to 1.7 million tonnes in 2004-2005, at a
value of approximately US$ 2.2 billion. Driven by this high growth rate, the current per
capita consumption of stainless steel in the country is 1.06kg. However, this remains
below the world consumption figure of 4.1kg, indicating that there is still room for
significant growth.
India’s share of world production has increased from 2% in 1991-1992 to approximately.
7% in 2004-2005. It is estimated that by 2010, the production of stainless steel will
amount to 2618 million tonnes.1 This is an indication of the scope of the Indian stainless
steel market and the potential for growth in the next few years.
The graph below provides an indication of the growth in production of stainless steel
over the last fifteen years. India experienced a sharp rise in production from 2001
onwards, which was driven largely by the demand for stainless steel that was coming
from China. Domestic demand also increased simultaneously (see figure 3.2) and as a
result, India’s production of stainless steel rose sharply.
Fig 3.1 Growth in production of Stainless Steel
1 Indian Stainless Steel Market Report 2005, Prepared by the Indian Stainless Steel Development
Association. See paragraph 4.1.2 below for specific projects.

28
0
200
400
600
800
1000
1200
1400
1600
1800
1991-
92
1992-
93
1993-
94
1994-
95
1995-
96
1996-
97
1997-
98
1998-
99
1999-
00
2000-
01
2001-
02
2002-
03
2003-
04
2004-
05
Year
Pro
du
cti
on
in
00
0 t
on
ne
Source: ISSDA Market Report 2005
In contrast, stainless steel production in South Africa has experienced a decline in
growth. In 2005, production declined sharply, almost to 2001 levels, reaching only 440
000 tonnes. In comparison, production in India increased to 1.7 million tonnes.
SA Stainless Steel Production
0
100000
200000
300000
400000
500000
600000
700000
1991
1993
1995
1997
1999
2001
2003
2005
Year
To
nn
es

29
3.3 Consumption patterns
3.3.1 Present consumption patterns
Stainless steel consumption in India has increased significantly over the last 14 years at
an annual compound growth rate of between 11.5% to 12%. Consumption of stainless
steel in 2004-2005 amounted to approximately 1.153 million tonnes. Apparent
consumption of stainless steel in South Africa amounted to 149 298 tonnes in 2005, with
54 684 tonnes destined for the export market, according to statistics from South African
Stainless Steel Development Association (SASSDA). As can be seen from the graphs
below, India consumers a greater amount of stainless steel than South Africa.
Consumption of stainless steel has increased due to increased infrastructure
development in the country, but also because stainless steel houseware products (200
series) in India are more popular and cheaper that stainless steel products in South
Africa. South Africa, on the other hand, has experienced a slight decline in apparent
consumption in recent years.
The graph below provides an indication of stainless steel consumption statistics in India
for the last 14 years:
Fig 3.2 Past Consumption of Stainless Steel – India

30
0
200
400
600
800
1000
1200
1400
1991-9
2
1992-9
3
1993-9
4
1994-9
5
1995-9
6
1996-9
7
1997-9
8
1998-9
9
1999-0
0
2000-0
1
2001-0
2
2002-0
3
2003-0
4
2004-0
5
Co
nsu
mp
tio
n i
n 0
00 t
on
nes
Source: ISSDA Market Report 2005
The graph below indicates the trend of consumption in South Africa, compared to India
(above). As can be seen, South Africa’s consumption is on a slight decline, whilst India’s
consumption of stainless steel has been constantly increasing:
Apparent consumption
0
40000
80000
120000
160000
200000
1999 2000 2001 2002 2003 2004 2005
Year
To
nn
es

31
Flat products currently make up the majority of stainless steel consumed in India, with a
market share of 86%, whilst the long products account for the balance. The Cr-Mn series
of stainless steel is the grade that is most in demand, commanding a 72.4% share of the
market. Cr-Mn with a nickel content of between 0.5 and 1% is used primarily in the
utensils market, while Cr-Mn with a nickel content of 1 to 4% is used in metal products
and in the construction industry. Austenitic grades like 304 and 316 are used mainly in
the industrial sector, whilst the automotive sector makes use of mainly ferritic grades.
The table below indicates consumption according to the different grades in India’s
stainless steel sector:
Table 3.1 Share of SS Consumptions by forms by grades (in %) – 2004-05 Form/Grade < 0.15 %
Ni
1-4% Ni 304 316 400 Others
HRC/P 0.0 9.9 13.7 7.5 3.1 14.2
CRC 0.0 58.7 43.5 18.5 23.1 26.4
Patta 100 0.0 0.0 0.0 0.0 0.0
Wire Tubes 0.0 13 7.3 0.0 13.4 14.7
Wire Rods 0.0 0.0 14.5 37.2 27.8 0.0
Bright Bars 0.0 6.3 6.4 7.3 13.7 10.4
Bars 0.0 11.8 10.5 14.9 18.6 21.2
Seamless
Tubes
0.0 0.0 3.4 14.0 0.0 11.4
Misc 0.0 0.3 0.6 0.6 0.3 1.7
100 100 100 100 100 100
Source: Primary Survey conducted by ISSDA, 2005
Major Grades of Stainless Steel2
304: A type of austenitic stainless steel (chromium-nickel), accounting for over half of
world production of stainless steel. This grade withstands ordinary corrosion in
2 Description of major grades of stainless steel adapted from ISSDA Stainless Steel Market
Survey 2005

32
architecture, provides durability in the food technology sector and resists most
chemicals.
316: Austenitic stainless steel (chromium-nickel), which contains 2-3% molybdenum
(304 has no molybdenum). The inclusion of this element gives the 316 grade a greater
resistance to different forms of deterioration.
409: Ferritic stainless steel (chromium stainless) that is suitable for high temperatures. It
has the lowest chromium content and is therefore less expensive than other grades.
410: This is a martensitic stainless steel (plain chromium, but extremely strong) that is a
low cost option for non-severe corrosive applications.
430: This ferritic grade (chromium) is the most widely used grade in decorative
applications, offering good corrosion resistance.
Cr-Mn / 200: This austenitic stainless steel is Cr-Mn alloy (1-4%) developed to conserve
nickel with manganese at a ration of 2% manganese for 1% of nickel. It does not have
the durability of the 300 series and its corrosion resistant properties and high
temperature threshold is far lower. Applications are generally confined to consumer
durables and decorative applications.
Different forms of stainless steel3
Stainless steel is found in several different forms, including plate, sheet, strip, foil, bar,
wire, pipes and tubes etc.
Sheets: This is a flat-rolled product in coils or cut lengths that are 610mm wide and less
than 4.76mm thick. It is produced in nearly all types except the free machining and
certain martensitic grades.
3 Description of different forms of stainless steel adapted from ISSDA Stainless Steel Market
Survey 2005
33
Strip: This is a flat-rolled product, available in coils or cut lengths, less than 610mm wide
and 0.13 to 4.76 mm thick. Cold rolled stainless steel strips are manufactured from hot
rolled, annealed and pickled strip by rolling between polished rolls.
Plate: This is a flat-rolled or forged product more than 250mm in width and at least
4.76mm in thickness. Exception to this are the highly alloyed ferritic grades, as well as
some of the martensitic and free machining grades. Plates are produced by hot rolling
from slabs that have been directly cast or rolled from ingots.
Foil: This is a flat rolled product, in coil form, that is up to 0.13mm thick and less than
610mm wide. It is produced from most of the 200 and 300 grades.
Bar: Bars are produced in straight lengths and are either hot or cold rolled.
Wire rods: These are produced through the hot-rolling of billets and are processed in to
bolts, screws and wires.
3.3.2 Sectors consuming stainless steel
Currently, the largest consumer of stainless steel in the country is the metals sector, for
the production of utensils, which accounts for 70.5% of total consumption. The majority
of utensil products are manufactured in the informal sector, which consists of more than
6000 production units across the country.
India currently holds 10% share in the global market for kitchenware. The global
kitchenware market is currently dominated by China, but India has experienced an
increase in market share, rising from 5% in 2001-2002 to the 2005 figure of 10%.
According to estimates by ISSDA, India would like to capture 25% market share by
2015.Consumption in this sector is estimated at approx. 874 000 tonnes and is forecast
to grow to 2186 000 tonnes by 2015-2016. Approx. 40% of the kitchenware sector is
export based and exports of kitchenware products have been growing at a rate approx.
25% over the last four years.

34
The utensils sector is a traditional sector making use of stainless steel, but recently, new
stainless steel consumers have emerged. The ABC sectors i.e. architecture, building
and construction sectors are emerging as significant end users of stainless steel in India,
as economic and infrastructure development in the country is on the increase. Stainless
steel is now being used in the transportation sector also, with a significant portion of
Delhi new railway system consisting of stainless steel. Lastly, consumption in the
automotive sector is also on the increase, though it has not yet reached significant
levels.
The diagram below represents the percentage consumption of stainless steel of each
sector for 2004-2005:
Table 3.2 Consumption Segments (2004 – 2005) Segment 000’ tonne
Process Industry 111
Engineering 53
Electro mechanical / Electronics 17.5
Construction 28
Transport 24
Metal Products(utensils) 874
Others 45
Total 1152.5
Source: All India Stainless Steel Industries Association
3.3.3 Future consumption patterns
It is projected that the consumption of stainless steel in India will increase drastically in
the medium to long term. Per capita consumption of stainless steel in India is currently
only 1.06 kg compared to 10-15 kg in developed countries. India is also currently
undergoing significant economic reform and infrastructure development and it is forecast
that the usage of stainless steel will be integral to this. The demand for stainless steel in
India is expected to increase at a rate of 12.4% over the next ten years. Current

35
consumption of stainless steel is 1.153 million tonnes and this is expected to increase to
approximately 2 million tonnes by 2010 and approximately 4 million tonnes by 2016. 4
The tables below provide an indication of the projected consumption of stainless steel,
by end use sectors and by product over the next ten years:
Table 3.3 Future Domestic Consumption Pattern of SS by End Use Sectors In 000’ tonne In % Sector
2004-
05
2010-
11
2015-
16
2004-
05
2010-
11
2015-
16
Process Industry 111 250 479 9.3 10.8 11.7
Engineering 53 125 251 4.6 5.4 6.2
Electro
mechanical/Electronics
18 57 115 1.5 2.5 2.8
Construction 28 209 500 2.4 9.1 12.3
Transport 24 104 250 2.1 4.5 6.1
Metal products 874 1433 2186 75.8 62.0 53.5
Others 46 132 302 4.0 5.7 7.4
Total 1154 2311 4084 100 100 100
Source: ISSDA Market Report 2005
Table 3.4 Projected Consumption by products forms (2015-16) India in 000 tonne Product
forms
Growth % 2005-06 2009-10 2015-16
HRP 14.7% 47.4 84.6 189.5
HRC/CRC 19.5% 185.6 394 1023
UG Flats 7.5% 830 1108 1710
4 Interview with Mr Ramesh Gopal, Executive Director, Indian Stainless Steel Development
Association, New Delhi, 6th February 2006

36
W. Tubes 20% 42 95 253
Bars 16.7% 57.7 113.6 270
BB 20% 37.4 89 225
W. Rods 18% 72.5 145 343
Seamless
Tubes
14.5% 15.2 26.6 60
Misc. 15.4% 2.3 4.2 9.6
Total 12.2% 1290 2059 4083
Source: ISSDA Market Report 2005
3.4 Distribution
Approximately fifty percent of stainless steel products such as coils, sheets, bars etc are
marketed through traders, whilst the balance is marketed directly by the manufacturers
of the products. Downstream products like pipes, fasteners and wires are also marketed
in the same fashion. Large end users tend to purchase directly from the manufacturers,
whilst small and medium enterprises procure through the traders of stainless steel. The
figure below depicts the distribution channels in India:
Fig 3.3 Distribution Channels – India

37
As can be observed, the distribution channels are fragmented and the products do not
travel in a seamless manner before reaching the end user. This is due to the fact there
are large product ranges, often small requirements, large distances between the
producer and end user and that there are several different players involved, which
results in a complicated distribution network.
4 FEATURES OF INDUSTRIES
4.1 Production
Stainless steel production in India began in earnest in the sixties – prior to that, stainless
steel was imported into the country from Japan, Europe etc. Salem Steel Plant began
the first stainless steel production, followed thereafter by Jindal Steel. The eighties and
early nineties saw the formation of several other mid-size stainless steel producers, as
well as hundreds of small scale producers.

38
4.1.1 Number of producers
Stainless steel producers in India are divided into two categories according to the
technology that they make use of. The first category is made up of primary units that
consist of melting and refining facilities, while the second category consists of units with
only melting facilities. All major manufacturers of stainless steel belong to the first
category as refining (through the usage of AOD/VOD converters) is necessary for
products of a good quality.
Currently, there are nineteen large producers of stainless steel in India with EAF/IF
melting and AOD/VOD facilities, which account for approximately 84% of the stainless
steel production in the country. These primary manufacturers include Jindal Stainless
Ltd, Shah Alloys Ltd, Mukund Ltd, Panchmahal, Viraj Alloys, FACOR, Ambica Steel etc.
Whilst Salem Steel is a major roller of stainless steel slabs, the company does not have
melting facilities. 5
The remaining 16% is made up by approximately 22 small scale induction furnace units
(in the formal sector) who produce only utensil grade sheets. The majority of these
companies are located in Delhi, Ahmedabad and Sonepat. The furnace capacity of these
units usually vary from 1 – 2 tonnes, whilst average per unit production is between 6000
– 12 000 tonnes per annum. These units are designed to manufacture only 200 series or
Cr-Mn (Ni <1%) grade, in the form of pencil ingots, which are then rolled into flat bars. 6
In addition to these producers, there are over 10 000 medium and small scale
processors of stainless steel in India7, most of whom work almost on an informal basis.
As a result, it is extremely difficult to ascertain the exact number of stainless steel
producers in the country.
5 Indian Stainless Steel Market Report 2005, Prepared by the Indian Stainless Steel
Development Association 6 Ibid
7 Information adapted from a speech entitled “Indian Stainless Steel Market: Evolution &
Prospects”, by Mrinmoy Roy, Executive Director, Salem Steel Plant, at the 8th World Stainless
Steel Conference in New Delhi, 7th November 2005

39
4.1.2 Capacity
The current manufacturing capacity of Indian manufacturers stands at 1.4 million
tonnes.8 Most of the larger stainless steel manufacturers in the country are currently
planning expansions of their current capacity in order to meet future projected demand.
It is estimated that approx. 1.35 million tonnes (1.1 million tonnes for flat products and
0.25 million tonnes for long products) of capacity is to be added over the short to
medium term. Several manufacturers have already implemented expansion plans in
order to increase their current capacity:
• Jindal has invested in a Greenfield plant in Orissa that will have a capacity of 0.8
million tonnes per annum
• Jindal is also increasing the capacity of its Hissar plant from 0.55 to 0.7 million
tonnes, bringing the new capacity to 0.15 million tonnes per annum
• ASP is expanding its plant at Durgapur that will then have a new capacity of 0.15
million tonnes per annum
• Viraj Alloys is increasing capacity from 0.1 million tonnes to 0.25 million tonnes,
bringing the new capacity level to 0.15 million tonnes per annum
• Panchmahal is implementing plans to increase its capacity to 0.1 million tonnes per
annum.
The above is by no means a comprehensive list of all the capacity expansion plans that
are being discussed in India. According to Mr Rajiv Rajvanshi from Jindal Stainless,
most of the larger manufacturers, including Jindal are exploring capacity expansion
plans and that the current capacity of the industry is set to increase. 9
8 Interview with Mr Raju Tolani, Director, Arcelor Stainless India Pvt Ltd, Mumbai, 31
st January
2006 9 Interview with Mr Rajiv Rajvanshi, Senior Executive Officer, Jindal Stainless, New Delhi, 6
th
February 2006
40
4.2 Types of Products
Most of the producers of stainless steel in India manufacture either flat or long products.
Larger companies like Jindal and Salem Steel focus on flat products, whilst other
companies like Mukund, Panchmahal, Isibars, FACOR, Viraj Alloys, Sunflag, SKM and
Chandan Steel are primarily into long products, though many of them also have
downstream processing facilities such as wire drawing, bright bar manufacturing, forging
etc. The various products being manufactured include:
• Hot Rolled Coils/Plates: The three main manufacturers of hot rolled coils are
Jindal, Shah Alloys and Salem Steel Pant. The plates that are manufactured
range in thickness from 5mm to 40mm and the coils that are manufactured range
in thickness from 3mm to 6mm, with widths up to 1800mm. The total capacity is
estimated at approx. 0.7 million tonnes per annum.
• Cold rolled coils: Jindal and Salem Steel are the two main processors of CR
coils, with other re-rollers including Hissar Metals, Quality Foils, Real Strips, KPT,
Sahu Refrigeration Swastik, Bhiwadi Rollwell, Bhandari Foils and Shah Alloys,
which is currently setting up a plant. Current production is approx. 1, 74,000
tonnes, whilst the capacity for production is estimated at 0.25 million tonnes. The
coils that are manufactured differ in thickness, ranging from .05mm to 4mm for
CR coils and 0.05 to 0.5mm for precision strips and foils.
• Utensil Grade flat bars: The current flat bar production in the country is approx.
0.87 million tonnes, with the major manufacturers being Jindal and Shah Alloys.
In addition, there are several small capacity IF producers also manufacturing flat
bars.
• Wire rods and bars
The table below provides an indication of the total current production of stainless steel
milled products:
Table 4.1 Current Production of SS Mill Products (2004-2005) S. No Product form Production in 000’

41
tonne
Flat Products
1 HRC 194
2 HRP 115
3 CRC 174
4 UG Sheets 872
5 Miscellaneous 2
Total flats 1357
Long products
1 Wire Rods 197
2 Bars and Rounds 109
3 Billets 45
Total Longs 351
Grand total 1708
Source: Primary Survey
Milled products are then processed into downstream products, which include utensil
grade sheets for utensils manufacture, welded and seamless pipes, bright bars, wires,
fasteners and forgings.
• Utensil grade sheets – the flat bars manufactured by primary producers are cold
rolled (by stainless steel re-rollers) into utensil grade sheets (referred to as Patta)
and this is used primarily for utensils applications. According to estimates, there
are approx. 410 stainless steel re-rollers in India in the following locations: Delhi,
Ahmedabad, Jagadhari and Bhiwadi. All production of patta is in Cr-Mn grade
stainless steel with a nickel content of less than 1% (usually 0.5% nickel content).
It is estimated that patta production in India will increase from 1821 000 tonnes in
2005 to 2618 000 tonnes in 2010.
The table below provides an estimation of patta production in India:
Table 4.2: Production of Utensil Grade Sheets / Patta (2004-2005)
Location Number of re-
rolling mills
Production of patta
(million tonnes per

42
annum)
Delhi 200 0.3
Jodhpur 100 0.24
Ahmedabad 60 0.2
Jagadhari and Bhiwadi 50 0.13
Total 410 0.87
• Welded pipes: It is estimated that there are approx. 32 manufacturers of welded
pipes in the country. Total production of these units in 2005 amounted to approx.
32, 000 tonnes. Major manufacturers include Quality Pipes, Apex Tube,
Ratnamani, Parkash Steelage, Doshi Tubes, Rajendra Mechanical. These
products are used mainly in the process industries, general engineering,
automobiles, architectural products and furniture.
• Drawn wires: There are approx. 12 wire drawing units in India, including
Panchmahal, Isibars, Nevetia Steel, Rajratna, Triveni Shinton, Venus, Macro
bars, Drowmet, Garg, Bansal wires, KEI and Bhansali. Total production in 2004-
2005 amounted to 58, 000 tonnes, of which 20% is Cr-Mn series, 50% in 300
series and the remainder 30% in 400 series.
• Bright bars: Major players include Isibars, Facor, Chandan, Shah Alloys, Viraj
Alloys, Venus, Macrobar, Ratnesh, Aditya, Nevetia and annual production in
2004-2005 totalled 85, 000 tonnes.
• Forging units: Production in 2005 stood at 28, 000 tonnes, with major players
including Isibars, Facor, Vipras and Ambica. Apart from these larger players,
there are many smaller manufacturing units in the country. Stainless steel
forgings are generally produced for export purposes.
• Fasteners: Production of fasteners was estimated at 10, 000 tonnes in 2004-
2005. The two major manufacturers are Kundan Fasteners and Agarwal
Fasteners. However, it should be noted that are approx. 75 additional players
operating on a small scale in fastener production.

43
• Seamless pipes and tubes: Current production of hot seamless tubes is 6,130
tonnes per annum, produced mainly by Sandvik Asia and NFC Hyderabad. Cold
seamless pipe manufacturers include Ratnamani, Suraj Stainless, Heavy Metals,
Parkash Steelage, Rajendra Mechanical etc and production was approx. 13, 800
tonnes in 2004-2005.
4.3 Performance (expansion/decline) and Outlook
The Indian stainless steel industry has achieved remarkable growth in the last fifteen
years. Growing from a low base in the early nineties, with production at a mere 228 000
the industry has expanded at a rate of 16%, with production in 2004-2005 amounting to
1.7 million tonnes, at a value of approx. US$ 2.2 billion. This growth coincides with the
economic reform process instituted in the nineties, followed by the opening of the Indian
economy and the subsequent growth that followed. According to a forecast by ISSDA,
the stainless steel sector will continue its upward growth to reach a production figure of
2618 million tonnes by 2010. The graph below plots the growth of the stainless steel
industry over the last years and also depicts the future projected growth of the sector:
Fig 4.1 Indian Stainless Steel production – The past, the present and the future

44
0
500
1000
1500
2000
2500
3000
1991-92 1995-96 1999-00 2003-04 2007-08 2009-10
Year
'000 t
on
ne
Source: “Indian Stainless Steel Market: Evolution & Prospects”, by Mrinmoy Roy,
Executive Director, Salem Steel Plant, at the 8th World Stainless Steel Conference in
New Delhi, 7th November 2005
Domestic demand previously focused primarily on the utensils or homeware sector,
which in the early nineties constituted almost 90% of consumption. Currently, the
utensils sector has a 72% market share, but this is expected to decrease as
consumption in other sectors, such as construction, transportation etc increases.
India has also focused primarily on the Cr-Mn or 200 series grade of stainless steel, as it
allowed Indian manufacturers to remain competitive at a time when the global stainless
markets was dictated by the high price of nickel. The Cr-Mn series has a very low nickel
content and is regarded as of lesser quality that the 300 and 400 series, but since India
catered primarily to a large domestic market, the product remained popular. During the
course of interviews with relevant industry players in India, many indicated that whilst the
200 series remains popular, there is also a demand for the 300 series and to a lesser
extent, of the 400 series, in certain value added industries where the focus on quality
and durability is more important. The graphs below provide an indication of the current
market share by grade of stainless steel and the projected market share scenario in
2010:

45
Fig 4.2 The Indian Scenario: How the scene is expected to transform
SCENARIO 2004-05
200 Series
72%
300 Series
22%
400 Series
6%
SCENARIO 2009-10
200 Series
62%
300 Series
29%
400 Series
9%
Source: “Indian Stainless Steel Market: Evolution & Prospects”, by Mrinmoy Roy,
Executive Director, Salem Steel Plant, at the 8th World Stainless Steel Conference in
New Delhi, 7th November 2005

46
4.4 Employment
According to industry experts who were interviewed, labour (semi-skilled and unskilled)
is plentiful in India, particularly in the rural areas, where most manufacturers have their
plants. Skilled labour is at a premium, due to India’s high economic growth and the influx
of foreign companies into the country. However, it was also indicated that Indians are
quick and eager learners and most foreign investors did not experience problems in
transferring skills to their local employees. Labour in India is regarded as inexpensive
with unskilled and semi-skilled workers earning between US$ 100 and US$ 120 per
month. It was indicated10 that salary trends differed significantly in India, differing from
company to company as well as differing from city to rural area and from state to state.
As a result, it is difficult to determine a norm for salaries in India. 11
Productivity in India is regarded as being quite high, though according to Mr Rajvanshi of
Jindal Stainless, the Chinese workers are far more productive that the Indian workers. 12
During interviews conducted, it was indicated that it is difficult to quantify the labour
component in the stainless steel industry, as much of the labour occurs in the informal
sector. A portion of production, particularly that of Cr-Mn grade, also takes place within
the informal sector. Such production and employment statistics are not formally reported
and this makes it difficult for the government and regulatory bodies to track. Wages paid
in the informal sector are also far less than that of the formal sector and differs from
place to place. i.e an informal worker in Mumbai would receive more money than an
informal worker in Jharkhand province, but still less that that of a worker formally
employed within the stainless steel sector.
4.5 Production costs & cost of capital
10
Interview with Mr Rajiv Rajvanshi, Senior Executive Officer, Jindal Stainless, New Delhi, 6th
February 2006 11
Interview with Mr Rajiv Rajvanshi, Senior Executive Officer, Jindal Stainless, New Delhi, 6th
February 2006 12
Interview with Mr Rajiv Rajvanshi, Senior Executive Officer, Jindal Stainless, New Delhi, 6th
February 2006

47
Input costs are currently the most significant factor with regards to stainless steel
manufacturing in India, as they have an impact on the final price of the product. The
production cost of stainless steel has been on the increase due to dramatically rising
input costs. Product prices have increased by 43% from Rs.13, 500 per tonne in 2002 to
Rs. 20,000 per tonne in 2004.
Whilst India has rich raw material deposits such as iron ore, ferrous ores, manganese
ore, chromate ore and aluminium, other items such as iron pellets, nickel etc have to be
imported. The most significant input cost is that of nickel. For some years, the global
nickel market has been extremely volatile and nickel prices have been subject to
extreme fluctuation.
In 2004, the import of nickel was subject to customs duty of 10%. Currently the import
duty on nickel stands at 5.5%. 13 This cut in import duty was as a direct result of lobbying
by the stainless steel industry in order for them to remain cost competitive. As part of the
export incentive scheme of the government, the import duty that is paid by the
manufacturers for raw material imports is refunded back to them if the products are to be
placed on the export market.14 Whilst this measure can be interpreted as allowing Indian
industry to remain competitive, Indian manufacturers and other industry players that
were interviewed do not see this as a subsidy, but rather as a measure to offset certain
costs such as electricity and freight, which according to them, is extremely high in India,
as opposed to other countries.
The cost of capital in India for the steel sector is currently 10 – 12%. As far as could be
determined, capital costs are not subsidised by the Indian government.
As part of the Government’s Small Scale Industries (SSI) Development Programme,
credit flow to the SSI sector has been streamlined. The credit policy is as follows:
13
Interview with Mr Dilip Chandan, Director, Chandan Steel, Mumbai, 1st February 2006
14 Interview with Dr A.S Firoz, Chief Economist, Economic Research Unit, Ministry of Steel,
Government of India, New Delhi, 8th February 2006
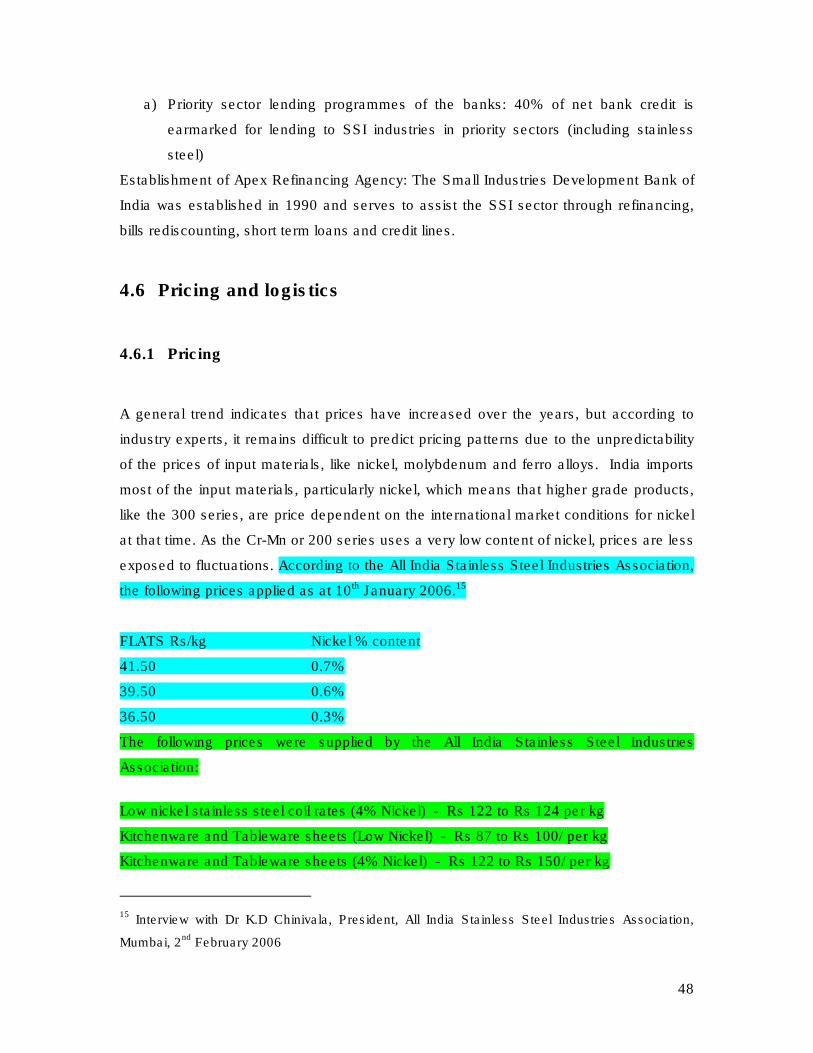
48
a) Priority sector lending programmes of the banks: 40% of net bank credit is
earmarked for lending to SSI industries in priority sectors (including stainless
steel)
Establishment of Apex Refinancing Agency: The Small Industries Development Bank of
India was established in 1990 and serves to assist the SSI sector through refinancing,
bills rediscounting, short term loans and credit lines.
4.6 Pricing and logistics
4.6.1 Pricing
A general trend indicates that prices have increased over the years, but according to
industry experts, it remains difficult to predict pricing patterns due to the unpredictability
of the prices of input materials, like nickel, molybdenum and ferro alloys. India imports
most of the input materials, particularly nickel, which means that higher grade products,
like the 300 series, are price dependent on the international market conditions for nickel
at that time. As the Cr-Mn or 200 series uses a very low content of nickel, prices are less
exposed to fluctuations. According to the All India Stainless Steel Industries Association,
the following prices applied as at 10th January 2006.15
FLATS Rs/kg Nickel % content
41.50 0.7%
39.50 0.6%
36.50 0.3%
The following prices were supplied by the All India Stainless Steel Industries
Association:
Low nickel stainless steel coil rates (4% Nickel) - Rs 122 to Rs 124 per kg
Kitchenware and Tableware sheets (Low Nickel) - Rs 87 to Rs 100/ per kg
Kitchenware and Tableware sheets (4% Nickel) - Rs 122 to Rs 150/ per kg
15
Interview with Dr K.D Chinivala, President, All India Stainless Steel Industries Association,
Mumbai, 2nd
February 2006

49
Kitchenware and Tableware sheets (produced by Salem) - Rs 240 to Rs 260 per kg
* Note: All the above rates are on FOR basis at the factory gate. Excise and VAT as applicable
according to their place of manufacture.
4.6.2 Logistics
Due to the poor, underdeveloped infrastructure in India, logistics proves to be a problem
for manufacturers. For manufacturers that are located in the interior of the country,
logistics is a problem, due to the poor condition of roads, as well as high fuel costs which
affect costing structures. In addition, most trucks can only transport up to 9 tonnes at a
time, which means that the transportation process is often long, arduous and riddled with
delays.
Manufacturers also face delays at ports due to lengthy customs procedures and due to
the inefficiency that exists at ports. According to Mr Rajesh Agarwal of Stemcor,16 due to
limited capacity, ports are often congested and there are often extensive delays. As a
result of this demand, freight is also very expensive. 17
Due to inefficiency in logistics, some of the larger manufacturing plants have shifted their
operations or have established plants in areas that are closer to the ports. Mr Rajvanshi
of Jindal Stainless indicated that Jindal is setting up a plant in Orissa, where it will have
easier and quicker access to a port that is not as busy and congested as in Mumbai and
the other main centres. Mr Rajvanshi also indicated that reliability of power supply was a
problem and that many of the more prominent manufacturers set up their own power
stations at their plants in order to ensure power supply. 18
16
Stemcor is a London based international trading company, involved primarily in the distribution
of steel and raw materials 17
Interview with Mr Rajesh Agarwal, General Manager, Stemcor India Private Limited, Mumbai,
3rd
February 2006 18
Interview with Mr Rajiv Rajvanshi, Senior Executive Officer, Jindal Stainless, New Delhi, 6th
February 2006

50
4.7 Presence of multi-nationals
According to Mr Ramesh Gopal of ISSDA, India has not yet experienced a proliferation
of investors in the stainless steel sector. 19 Companies that have currently invested in
the Indian market include:
� Swiss company Franke has set up a factory in Aurangabad that is involved in the
manufacturing of stainless steel sinks.
� IUP Jindal Metals & Alloys Ltd is a joint venture between Jindal Saw and IUP
Arcelor and is involved in the production of stainless steel strips and soft
magnetic nickel alloys.
Several trading companies that are involved in the trading of stainless steel are also
present in the Indian market. Amongst the larges are Glencore, Stemcor and Mitusi of
Japan.
4.8 Import and export structure (product groups)
Exports of stainless steel is currently estimated at 0.64 million tonnes, while imports are
approx. 0.11 million tonnes. Over the last 14 years, imports have remained more or less
constant, whilst exports experienced slight increases until 1999, when it expanded
rapidly. Exports recorded immense growth of 55% per annum from 1999 until 2004, at
which time there was a slight decline. The reason for the take off in Indian exports was
due to the huge demand from China. Hot rolled coils and plates > 600 mm width and
long products form the bulk of Indian exports, with almost 75% of the coils (Cr-Mn grade)
being exported to China. Flat products account for 50% of total exports, long products
for 30% and kitchenware is approximately. 13%.
The table below provides an indication of Indian exports of stainless steel by type of
product for the years 1999 and 2003:
19
Interview with Mr Ramesh Gopal, Executive Director, Indian Stainless Steel Development
Association, New Delhi, 6th February 2006

51
Table 4.2 Exports of SS products for India (tonne) Product Form 1999 2003
SS in Primary form 5595 56084
SS Rolled > 600 mm 9047 313574
SS Rolled < 600 mm 1963 27554
SS Bar / Rod Hot Rolled; SS
Angles/Shapes
35674 133941
SS Wires 16509 38970
SS Pipes/tubes 872 4048
SS Welded Pipes/tubes 187 913
SS Flanges/others 6359 15406
SS Kitchen articles 39333 95541
Sinks 298 1682
Total 117836 689716
Source: United Nation Statistics & Indian Ministry of Commerce
Imports into India have grown at 8% per annum over the last 14 years and have
accounted for approximately 12-15% of consumption in the country. India primarily
imports special grades, forms and finishes of stainless steel that is aimed specifically for
industrial requirements (use in automotive industry, surgical needles, engineering
industry). Major imports include CR coils > 600 mm (approx. 65% of total imports) and
seamless pipes and tubes.
Table 4.3 Indian Imports of SS Products by forms (tonne) Product Form 1999 2003
SS in Primary form 11617 11350
SS Rolled > 600 mm 51657 85291
SS Rolled < 600 mm 2581 7324
SS Bar / Rod Hot Rolled 2397 2889
SS Angles/shapes 3833 5324
SS Wires 2793 1908
SS Pipes/tubes 3152 6847
SS Welded Pipes/tubes 1790 2609

52
SS Flanges/others 1047 1859
SS Kitchen articles 29 111
Sinks 25 30
Total 82902 127545
Source: United Nations Statistics Division
ISSDA predicts that exports will grow between 9 – 16% per annum over the next ten
years, driven mainly by long products and by kitchenware.
4.9 Importance to the economy
In recent years, India has achieved high GDP growth and has attracted significant levels
of foreign direct investment. After China, India has now become the second most
attractive FDI destination worldwide. However, infrastructural inefficiencies in India are
an obstacle to growth and FDI and as a result, the government has implemented
massive infrastructure improvement and development plans.
Stainless steel plays an important role in these plans, as the main global demand driver
of stainless steel is the architectural, building & construction segment (ABC segment)
and automotive, railways and transport segment (ART segment). Globally around 20-
25% of the stainless steel consumption goes towards the ABC segment, whilst in India it
is currently about 1-2%. The total consumption of stainless steel in India is around 1.153
million tonnes, which is expected to grow approximately by 12% annually in the coming
years.
Considering the fact that India is yet to develop its basic infrastructure in terms of
upgrading its railways, including the development of metro trains for all major metro
cities, upgrading of the airports, shopping malls, multiplexes, residential and commercial
complexes etc, the demand going forward for stainless steel is expected to be
substantial. Stainless steel is expected to form an integral part of the infrastructure drive
in India.

53
4.10 Considerations
1. The Indian stainless steel industry has grown at a rate of 16% over the last
fifteen years and has averaged growth of 20% over the last four years.
Production has increased from a low level in the early nineties to approximately.
1.7 million tonnes in 2004-2005, at a value of about US$ 2.2 billion.
2. Stainless steel consumption in India grew at 11.5% to 12% annually, amounting
to approximately 1.153 million tonnes in 2004-2005. Flat products constitute the
majority of products consumed at 86%, whilst the balance is made up by long
products.
3. South Africa’s consumption of stainless steel in 2005 was 149 298 tonnes (54
684 t exported after processing).
4. Between 1999 and 2004 exports expanded by 55% p.a. because of Chinese
demand. It is predicted to grow by between 9 to 12 % p.a. over the next ten
years.
5. Imports increased by 8% p.a. the past 14 years and amounts to about 12 to 15%
of consumption.
6. Stainless steel producers in India are divided into two categories according to the
technology that they make use of. The first category is made up of primary units
that consist of melting and refining facilities, while the second category consists
of units with only melting facilities. Milled products are then processed into
downstream products, which include utensil grade sheets for utensils
manufacture, welded and seamless pipes, bright bars, wires, fasteners and
forgings.
7. Flat bars manufactured by primary producers are cold rolled (by stainless steel
re-rollers) into utensil grade sheets (referred to as Patta) and this is used
primarily for utensils applications. According to estimates, there are approx. 410
stainless steel re-rollers in India in the following locations: Delhi, Ahmedabad,
Jagadhari and Bhiwadi. All production of patta is in Cr-Mn grade stainless steel

54
with a nickel content of less than 1% (usually 0.5% nickel content). It is estimated
that patta production in India will increase from 1821 000 tonnes in 2005 to 2618
000 tonnes in 2010.
8 India currently holds 10% share in the global market for kitchenware. The global
kitchenware market is currently dominated by China, but India has experienced
an increase in market share, rising from 5% in 2001-2002 to the 2005 figure of
10%. According to estimates by ISSDA, India would like to capture 25% market
share by 2015.Consumption in this sector is estimated at approx. 874 000 tonnes
and is forecast to grow to 2186 000 tonnes by 2015-2016. Approx. 40% of the
kitchenware sector is export based and exports of kitchenware products have
been growing at a rate approx. 25% over the last four years.
7. Primary producers in India import selected raw materials, the most important of
which is nickel. Import duties on nickel currently stand at 5.5%.
8. India maintains a competitive edge with regards to the Cr-Mn / 200 series grade,
which has low nickel content and is significantly cheaper than products with high
nickel content.
9. India has a large pool of low cost labour, with the capability to manufacture
products of international standard.
10. The Indian stainless steel industry is geared toward product improvement,
capacity building and global expansion.
5 PROTECTION AND ASSOCIATED ASPECTS
This section deals with tariffs, non-tariff barriers and associated aspects in the respective
countries to enable policy makers/ trade negotiators to gauge the degree to which the
markets in these countries are accessible.

55
5.1 Tariffs
The extent of tariff bindings, bound rates and applied or actual rates are analysed.
5.1.1 Bindings and bound rates
Bound rates are the maximum rates a country is allowed to apply under its WTO
commitments. Countries generally increased the coverage of their tariff bindings
substantially during the Uruguay Round. In the case of most developing countries there
are substantial differences between bound and applied rates. This has the implication
that countries are allowed to increase current rates of duty up to the level of bound rates
without transgressing their WTO commitments. In the words of the WTO (Trade Policy
Review of Brazil, 2004): “--the average bound rate considerably exceeds the average
applied rate, thus imparting a degree of uncertainty to the tariff and providing scope for
the authorities to raise applied MFN rates”.
5.1.1.1 South Africa
All South African tariff lines are bound with the exception of Chapters 3 (fish), 27
(mineral oil and fuels) and 93 (arms and ammunition) and a few lines in chemicals. The
binding coverage is 96.4%.
The average bound rate for industrial products is 16.6%. The highest bound rate is 30%
with the exception of two product groups, namely clothing (45%) and motor vehicles
(50%).
5.1.1.2 India
Only 68.2% of India’s tariff lines for industrial products are bound. Bindings are at the 6-
digit level, as India implemented an 8-digit tariff system only in 2003. The average bound
rate for industrial (non-agricultural) products is 37.7%.
The following is a chart showing India’s bound rates per chapter taken from the WTO
Secretariat’s Report for the Trade Policy Review of India in 2002 (WTO Report):

56
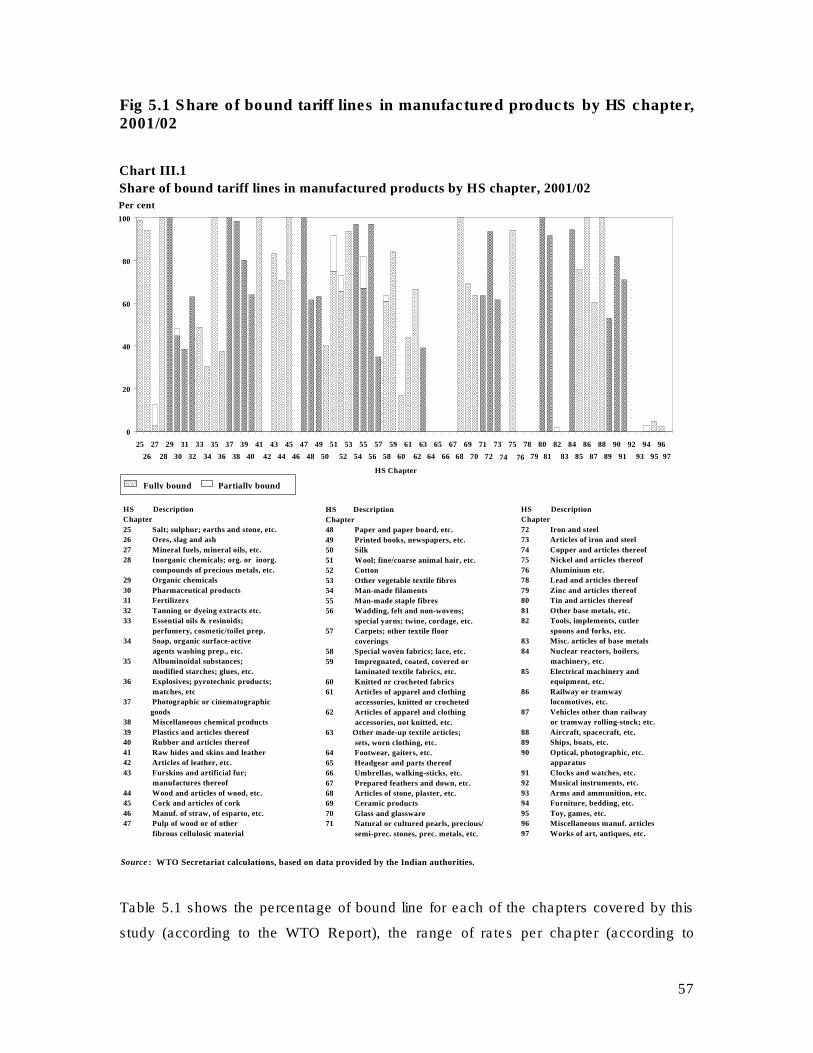
57
Fig 5.1 Share of bound tariff lines in manufactured products by HS chapter, 2001/02
Table 5.1 shows the percentage of bound line for each of the chapters covered by this
study (according to the WTO Report), the range of rates per chapter (according to
0
20
40
60
80
100
25 27 29 31 33 35 37 39 41 43 45 47 49 51 53 55 57 59 61 63 65 67 69 71 73 75 78 80 82 84 86 88 90 92 94 96
Per cent
HS Chapter
HS Description
Chapter
25 Salt; sulphur; earths and stone, etc.
26 Ores, slag and ash
27 Mineral fuels, mineral oils, etc.
28 Inorganic chemicals; org. or inorg.
compounds of precious metals, etc.
29 Organic chemicals
30 Pharmaceutical products
31 Fertilizers
32 Tanning or dyeing extracts etc.
33 Essential oils & resinoids;
perfumery, cosmetic/toilet prep.
34 Soap, organic surface-active
agents washing prep., etc.
35 Albuminoidal substances;
modified starches; glues, etc.
36 Explosives; pyrotechnic products;
matches, etc
37 Photographic or cinematographic
goods
38 Miscellaneous chemical products
39 Plastics and articles thereof
40 Rubber and articles thereof
41 Raw hides and skins and leather
42 Articles of leather, etc.
43 Furskins and artificial fur;
manufactures thereof
44 Wood and articles of wood, etc.
45 Cork and articles of cork
46 Manuf. of straw, of esparto, etc.
47 Pulp of wood or of other
fibrous cellulosic material
HS Description
Chapter
48 Paper and paper board, etc.
49 Printed books, newspapers, etc.
50 Silk
51 Wool; fine/coarse animal hair, etc.
52 Cotton
53 Other vegetable textile fibres
54 Man-made filaments
55 Man-made staple fibres
56 Wadding, felt and non-wovens;
special yarns; twine, cordage, etc.
57 Carpets; other textile floor
coverings
58 Special woven fabrics; lace, etc.
59 Impregnated, coated, covered or
laminated textile fabrics, etc.
60 Knitted or crocheted fabrics
61 Articles of apparel and clothing
accessories, knitted or crocheted
62 Articles of apparel and clothing
accessories, not knitted, etc.
63 Other made-up textile articles;
sets, worn clothing, etc.
64 Footwear, gaiters, etc.
65 Headgear and parts thereof
66 Umbrellas, walking-sticks, etc.
67 Prepared feathers and down, etc.
68 Articles of stone, plaster, etc.
69 Ceramic products
70 Glass and glassware
71 Natural or cultured pearls, precious/
semi-prec. stones, prec. metals, etc.
HS Description
Chapter
72 Iron and steel
73 Articles of iron and steel
74 Copper and articles thereof
75 Nickel and articles thereof
76 Aluminium etc.
78 Lead and articles thereof
79 Zinc and articles thereof
80 Tin and articles thereof
81 Other base metals, etc.
82 Tools, implements, cutler
spoons and forks, etc.
83 Misc. articles of base metals
84 Nuclear reactors, boilers,
machinery, etc.
85 Electrical machinery and
equipment, etc.
86 Railway or tramway
locomotives, etc.
87 Vehicles other than railway
or tramway rolling-stock; etc.
88 Aircraft, spacecraft, etc.
89 Ships, boats, etc.
90 Optical, photographic, etc.
apparatus
91 Clocks and watches, etc.
92 Musical instruments, etc.
93 Arms and ammunition, etc.
94 Furniture, bedding, etc.
95 Toy, games, etc.
96 Miscellaneous manuf. articles
97 Works of art, antiques, etc.
Chart III.1
Share of bound tariff lines in manufactured products by HS chapter, 2001/02
26 28 30 32 34 36 38 40 42 44 46 48 50 52 54 56 58 60 62 64 66 68 70 72 74 76 79 81 83 85 87 89 91 93 95 97
Source : WTO Secretariat calculations, based on data provided by the Indian authorities.
Fully bound Partially bound

58
India’s goods schedule under the Uruguay Round) and the comparative South African
range of bound rates.
In the case of some chapters, the WTO report shows a certain percentage of lines as
bound but India’s schedules do not contain any lines of such chapters. This is confusing.
An enquiry was sent to the WTO and details are awaited.
Table 5.1 India’s % bindings and the bound tariff rates of India and South Africa
Chapter India’s % of bound lines (6-digit level)
India’s bound rates: % (nb = not bound)
South Africa’s most common rates: %
28 100 40 0/5/10 29 100 40 (few at 25%) 10/15 30 48 40 (few at 25%) 10/15/20 31 38 5 10 32 63 40 (few at 25%) 0/10/15 33 48 40 20 34 32 40 10/15/20 35 100 40 10/20 36 37 40 10/15 38 98 40 10/15 39 80 40 15/20/30 40 64 40 15/20/30 41 100 25 15 42 0 Nb 30 50 40 * 17.5/30 51 93, some partially 40 * 17.5/30 52 74, some partially Yarn 25/40 * 17.5/30 53 95 Yarn 40 * 0/17.5 54 97 Yarn 40 * 17.5/30 55 82, some partially Fibres/yarn 40 * 17.5/30 56 98 40 * 17.5/20 57 36 * 30 58 63 40 * 25 59 85 40* 25/30 60 17 * 25 61 44 * 45 62 67 * 45 63 40 * 30 64 0 Nb 20/30 72 94 40 5/10 73 61 40 15/30 74 0 40 5/15/20/30 75 95 40 5/15 76 0 Nb 5/15/30
* Bound later and/or binding rates reduced.

59
South Africa’s bound rates show a distinct structure with an escalation from primary
products to final products in most chapters.
India’s binding schedule consists mostly of ceiling bindings with more than 90% of the
lines bound at a rate of 40%.
5.1.2 Applied tariffs
5.1.2.1 South Africa
South Africa’s tariffs are applied on the FOB value of imports.
The simple average tariff rate for industrial products is 11.4% according to the recent
exercise of compiling the bound rates of the tariff lines as at 1 January 2005, and the
applied rates, for the purpose of the Doha Round NAMA analysis.
A comparison of the South African and Indian applied rates in respect of the tariff lines
under the chapters covered by this study follows in par 5.1.3.
5.1.2.2 India
India’s customs duties are applied on a CIF basis. This means that the value for
calculation of the basic duty is up to 20% higher than South Africa’s FOB value basis.
Furthermore, the assessable value is CIF + 1%. This has the following affect:
Basic customs duty Effective customs duty
South Africa 15% 15%
India 15% 18.15%
In addition to the basic duty, India applies additional duties. These are dealt with under
non-tariff barriers The WTO Report shows an average MFN (most-favoured-nation)
applied tariff rate of 31.1% for India in 2001/02.
Table 5.2 shows the average rates and range of rates per main category in 1997/98 and
2001/02. Over the period of three years there was only a slight reduction in the average

60
rates per category in most categories although this was more pronounced in textiles and
clothing, footwear & leather and electrical machinery.
Table 5.2 Summary analysis of India's MFN tariff, 1997/98 and 2001/02
MFN 1997/1998 MFN 2001/02
No. of
lines
Average
(%)
Range
(%)
Average
(%)
Range
(%)
Non-agricultural products
(excl. petroleum)
4,435 35.4 0-192 31.1 0-170
Mineral products, precious
stones, etc.
335 37.5 0-45 30.6 0-55
Metals 588 32.5 10-45 32.0 5-35
Chemicals and photographic
supplies
840 34.6 0-192 33.8 0-170
Leather, rubber, footwear,
travel goods
146 39.8 0-45 32.1 0-35
Wood, pulp, paper and
furniture
248 30.1 0-45 29.3 0-35
Textiles and clothing 830 43.7 25-55 31.3 15-35
Transport equipment 122 41.7 3-45 40.5 3-105
Non-electric machinery 525 27.1 10-45 25.9 0-35
Electric machinery 257 34.7 15-45 26.8 0-35
Source: WTO Secretariat Report for the TPR of India in 2002.
Since then, India has substantially reduced the basic duties. The most common rate in
2004/05 was 20%. Most of the basic duty rates were cut in the 2005/06 budget and the
current rates on almost all of the products covered by this investigation are 15% as from
1 March 2005. The major exception is Chapter 72 where a rate of 20% is shown
(although this is not the effective applicable rate see par 5.1.3).

61
On the surface, India’s tariff structure, at least in respect of the basic duties, looks very
simple and uniform. In some chapters the duty shown in Schedule 1 is 15% without any
exceptions.
However, these rates may not be the actual rates as there are numerous ‘notifications’
or ‘general exemptions’ that exempt certain products from a duty or reduce the rate
(sometimes for specified uses or subject to elaborate conditions). In fact, India’s customs
tariff system is extremely complex and lacks transparency. This is confirmed in the WTO
(TPR) Report which states that “… the tariff remains complex and a number of
exemptions applied to products, industries, and end-users add to its complexity and lack
of transparency”. Similar statements are made a number of times in the Report and in
other study reports.
Many of the ‘notifications’ and ‘exemptions’, dating back to the nineties, although still
applicable, are not incorporated in a single tariff book with its schedules as in the case of
South Africa. It makes it difficult to establish what actual duties (and additional duties)
are applicable on the importation of certain products. For example, the duty on
passenger cars is shown as 100% - by far the highest of all duties – but General
Exemption No. 107 which deals with ‘Exemption and effective rates of basic and
additional duty for specified goods of Chapters 1 to 98’, exempts vehicles of 87.03 from
so much of the duty in the First Schedule that exceeds:
• 15% ‘if imported as completely knocked down (CKD) unit’
• 60% ‘if imported in any other form’.
5.1.3 Comparison
This section attempts to show a summary comparison of the customs duties of India and
South Africa, as in January 2006. The South African duties are at various rates and the
comparison is confined to a summary of rates.
The sources of tariff information for India for the comparison that follows are the website
of the Central Board of Excise and Customs20, www.cbec.gov.in, and a regularly
20
www.cbec.gov.in

62
updated publication by R.K.Jain, probably India’s foremost customs and excise expert 21,
under the title:
While the Central Board’s databases for various duties, cesses, exemptions etc are
separate, R. K. Jain’s publication attempts to capture these in one publication (of 1 712
pages). Its Schedule 1 shows basic duties, additional duties, cesses and total duty
D.ifferent It various parts also cover export policy with duty rates; additional duty (CVD);
MRP based valuation for additional duty; educational cess; other cesses; special duties
of customs; import tariff general exemptions; safeguard duties; anti-dumping duties; etc.
The publication has extensive footnotes linking the rates to general exemptions and
general notifications. However, it is still very difficult and sometimes not possible to
ascertain the effective rates payable.
While the Central Board’s databases for various duties, cesses, exemptions etc are
separate, R. K. Jain’s publication attempts to capture these in one publication (of 1 712
pages). Its Schedule 1 shows basic duties, additional duties, cesses and total duty
Different parts also cover export policy with duty rates; additional duty (CVD); MRP
based valuation for additional duty; educational cess; other cesses; special duties of
customs; import tariff general exemptions; safeguard duties; anti-dumping duties; etc.
The publication has extensive footnotes linking the rates to general exemptions and
general notifications. However, it is still very difficult and sometimes not possible to
ascertain the effective rates payable.
Table 5.3 Metals: Summary Comparison Between SA and India (basic) Duty Rates Per Chapter: January 2006 Chapter Brief description India: % RSA: % Comments 72 Iron and steel 20 0/5 Primary and some
intermediates – 0 73 Articles of iron & steel 15 0/5/10/15/20 Household articles
at 20 74 Copper & articles 15 0/10/20 Household articles
at 20 76 Aluminium & articles 15 0/5/10/20 Household articles
at 20
21 R.K. Jain’s Foreign Trade Policy ITC (HS) Classifications of Export & Import
Items with Customs Tariff Rates & Excemptions 2004-09 (Vol. 3) Oct. 2005 – 8th
EditioCENTAX PUBLICATIONS PVT.LTD

63
Although the basic duty rate shown for Chapter 72 is 20%, domestic exporters report
that the actual basic duty payable is only 5%. Every effort was made to establish the
source for this, tracking the schedules, exemption notices and available notifications, but
without success. The trail stopped at Exemption Notice 107 in terms of which imports
under Chapter 72 are exempted from basic duties of more than 10%.
The India Ministry of Steel website contains a summary of applied tariffs since the 2005-
06 Budget (March 2005). It shows that most steel products of Chapter 72 are in fact
subject to duties of 5%. However, in respect of stainless steel, only Heading 72.19 is
included in the list with an applied rate of 10%. It must be assumed that the other
headings are subject to the rate of 20% shown in Schedule No 1.
The tariffs in respect of stainless steel headings in Chapter 72 and downstream metal
products identified for coverage in the study are shown in Table 5.4:
It should be kept in mind that the applied rates of some product groups will be subject to
reduction over a period of time in terms of NAMA (non-agricultural market access) if the
Doha Round is successfully concluded. The implications cannot be evaluated before the
NAMA modalities have been finalised. The agreed modalities will have different effects
on the applied rates of the two countries depending on the current bound rates and the
difference between the bound and applied rates.
Table 5.4 Comparison of India and SA Applied Tariffs on Stainless Steel and
Certain Products as at January 2006
HS4
Description
India: %
(Frequency)
RSA: %
(Frequency)
7219
Flat-rolled products of stainless steel, of a
width of 600 mm or more
20 (54)
5 (14)
7220
Flat-rolled products of stainless steel, of a
width of less than 600 mm
20 (20)
5 (4)
7221
Bars and rods, hot-rolled, in irregularly
wound coils, of stainless steel
20 (4)
0 (1)

64
7222
Other bars and rods of stainless steel;
angles, shapes and sections of stainless
steel
20 (26)
0 (5)
7223 Wire of stainless steel 20 (4)
0 (1)
7304
Tubes, pipes and hollow profiles, seamless,
of iron (excluding cast iron) or steel
15 (29)
0 (5)
10 (3)
15 (5)
7304.10.20
[7304.10]
Line pipe of a kind used for oil or gas
pipelines: Of stainless steel
[Line pipe of a kind used for oil or gas
pipelines]*
–
0 (1)
7304.40
Other, of circular cross-section, of stainless
steel
15 (2)
0 (2)
7306
Other tubes, pipes and hollow profiles (for example,
open seam or welded, riveted or similarly closed), of
iron or steel
15 (15)
10 (7)
7306.40
Other, welded, of circular cross-section, of
stainless steel
15 (1)
10 (1)
8211
Knives with cutting blades, serrated or not
(including pruning knives), (excluding knives
of heading 82.08), and blades therefore*
15 (7)
0 (7)
15 (6)
20 (7)
8212
Razors and razor blades (including razor
blade blanks in strips)*
15 (6)
0 (3)
8213
Scissors, tailors' shears and similar shears,
and blades therefore*
15 (1)
0 (1)
8214
Other articles of cutlery (for example, hair
clippers, butchers' or kitchen cleavers,
choppers and mincing knives, paper knives);
manicure or pedicure sets and instruments
(including nail files)*
15 (6)
0 (2)
15 (2)
20 (1)

65
8215
Spoons, forks, ladles, skimmers, cake-
servers, fish-knives, butter-knives, sugar
tongs and similar kitchen or tableware*
15 (4)
30 (4)
8421
Centrifuges, including centrifugal dryers;
filtering or purifying machinery and
apparatus, for liquids or gases *
15 (22)
0 (13)
15 (4)
16 (1)
19 (1)
8434 Milking machines and dairy machinery* 15 (4) 0 (3)
8438
Machinery, not specified or included
elsewhere in this Chapter, for the industrial
preparation or manufacture of food or drink
(excluding machinery for the extraction or
preparation of animal or fixed vegetable fats
or oils)*
15 (15)
0 (8)
* Products of stainless steel not separately specified
5.2. Non tariff barriers
5.2.1 Introduction
Non-tariff barriers (NTBs) cover a wide range of barriers, measures or situations, other
than ordinary customs tariffs, that have the effect of restricting or discouraging trade.
NTBs can be arbitrarily categorised in three groups, namely:
• Trade policy measures;
• Technical regulations; and
• Administrative procedures.
Situations and conditions other than specific measures can also act as NTBs that
discourage imports into a country.
66
5.2.1.1 Trade policy measures
These include import licensing, import quotas, state trading enterprises, additional taxes,
reference prices, export assistance, subsidies, anti-dumping and countervailing duties
and safeguards. The extent of policy predictability, transparency and the regularity of
changes in policy and policy measures is also an important factor.
These include measures such as standards and technical specifications that are aimed
at protecting health, safety, the environment and the interests of consumers.
5.2.1.3 Administrative procedures
These cover a wide range of regulations, procedures and other factors that operate in a
manner that restrict or discourage imports. Examples are burdensome customs
procedures; a lack of transparency or consistency in customs and other import
procedures; slow customs clearing that causes delays; and services that are not user-
friendly.
Other situations or conditions that discourage imports are mainly related to infrastructure
such as inadequate port facilities causing congestion, problems with internal transport
infrastructure and facilities etc.
5.2.2 NTBs in import regimes
Substantial differences exist in the import regimes of countries and/or trade blocks.
Some countries apply virtually no trade policy measures to imports; have standards that
conform to international norms; and have efficient customs procedures. Such an import
regime does not have a significant negative effect on imports. At the other extreme,
cases exist of import regimes consisting of various, sometimes not transparent, trade
policy measures; complex and burdensome standards; and complex slow customs
procedures that cause delays. Such a regime will have a significant affect on imports
and in fact discourage imports. If an exporter in a particular country considers exports to
another country, the market potential and customs tariffs may not be the main
considerations while NTBs in the other country may be an equal or even more significant
factor that restrict or discourage imports.
5.2.1.2 Technical regulations

67
5.2.3 NTBs in India: General
According to reports, the trading and import environment in respect of India is complex
and difficult although the situation has improved over the past few years.
Most of the information in respect of India has been obtained from:
• The WTO Secretariat’s Report for India Trade Policy Review (TPR) of May
2002
• Doing Business In India: A Country Commercial Guide for U.S. Companies
(2005)
• USTR 2005 National trade Estimate Report on Foreign Trade Barriers
• The EU Market Access Sectoral Database for individual countries
• India Profile: Doing business – For Australian Exporters – Export assistance: The
Australia Trade Commission’s website under AUSTRADE.
• A report: “Identification of concrete trade obstacles to be removed through the
future WTO negotiations on trade facilitations or other negotiations in the
framework of the Doha development agenda: Study for the Market Access Unit of
Directorate General Trade European Commission – June 2004” funded by the
European Commission (EU Trade Obstacles Report)
• Market Access Analysis to identify and update the existing information on trade
barriers in third countries affecting EU exports of textiles and clothing, footwear
and leather: A report funded by the EC Commission: 1 March 2005
• EURATEX: Market Access for European Textiles and Clothing – A Memorandum
for Trade Commissioner Peter Mandelson, January 2005
• R.K. Jain’s Foreign Trade Policy: “ITC (HS) Classification of Export & Import
Items, Vol. 3, 8th Edition, Oct. 2005.
• Various government sources, particularly the Central Board of Excise and
Customs and the Director-General of Foreign Trade websites, including the
Customs tariff before and since the 2005-06 Budget, the numerous schedules,
annexures, and exemption and general notifications.
Exporters to India and Indian importers suffer from policy unpredictability.

68
The EU Trade Obstacles Report summarises the situation as follows:
“The rules of EXIM (export and import) Policy are published and available to operators.
However, it cannot be denied that import and export rules are complex and frequently
modified. This obliges operators to be constantly aware of the EXIM Policy rules and
their modifications. These constant changes in EXIM policy engender an obstacle for
EU SME wishing to develop trade with India. These companies must work in close co-
operation with Indian partners.
The importers and exporters stated that the transparency and their understanding of
EXIM policy and other trade rules affecting their daily trade could be improved through
consultation with private sectors prior to adoption of the rules.
According to private sector, over-regulation is one of the main problems of doing
business in India. In several cases, the rules are adopted without prior notification and
explanation of rules to private sectors’ representatives.”
Infrastructure in respect of ports and internal transport are major problems.
Red tape is also a disincentive. The World Bank estimates that Indian senior managers
spend about 14 percent of their time dealing with regulatory issues (compared with
about 8 percent for their Chinese counterparts). Starting a business in India takes 89
days, on average—more than twice as long as in China. Closing a business is just as
difficult.
Stainless steel and products thereof do not appear to be subject to sector specific NTBs.
They would however be affected by some of the issues covered in paragraphs 5.4 to
5.18.
5.3. Additional duties and taxes
The EU Trade Obstacles Report sums up the situation in India as follows:
“Multiplicity and complexity of import, and to a lesser extent, export rules, has been
identified as a real concern for private operators.

69
For example, India’s duty calculation is highly complex. According to Member States,
trade representatives, importers and EU companies, despite the duty structure
rationalisation of January 2004, duties remain high. The method of calculation of import
duties and the administration of tariffs through numerous notifications makes the tariff
structure extremely complicated and non-transparent.”
The duty structure has however been substantially simplified through the removal of
some of the additional duties.
In addition to the ordinary rate of duty – called the ‘basic duty’ - there are an ‘Additional
Duty of Customs’ – also called a ‘Countervailing Duty (CVD)’ – which is generally 16%
but different for certain products. This is actually a central excise duty or value added
tax. There also used to be a ‘Special Additional Duty of Customs’, also called an
‘Additional Duty for Special Excise Duty’ of 8% or 4%. Some products were exempted
from these ‘additional’ duties or a lower rate applied. This duty has been removed for
most products.
In addition to the basic duty and the additional duty, India also applies an educational
cess of 2% to imports. This calculated on the sum of the basic and CVD. The basic and
additional duties and other charges are calculated on a compounded (cumulative) basis.
A levy of 1% is added to the CIF value to come to the assessable value.
When the transport and insurance costs cannot be established, or is challenged, 20% is
added to the invoice price to come to the CIF value.
5.4. Customs procedures and delays
Even if applied tariffs remain high for various products a survey (EU Trade Obstacles
Report) confirmed that business losses suffered through delays at borders and
complicated customs procedures may exceed in many cases the costs of tariffs.
In the case of India, this involves a complex array of sometimes opaque documentation
requirements, valuation issues and multiple submissions of data to different agencies
(Customs, Ministry of Health, Ministry of Agriculture, etc). Various surveys have already

70
stressed how these problems represent a serious threat in meeting trade commitments
and development objectives.
These burdensome requirements combined with delays in clearance of goods, lack of
appropriate infrastructures for the storage of goods or their testing negatively affect
importers daily business.
The following table shows comparative port transit times between Indian and other
countries.
Table 5.6 Imports and exports - average days to clear customs
Category Brazil India China Bangladesh
Imports
Average 14.0 7.1 7.9 11.7
Longest 32.0 12.8 12.5 23.2
Exports
Average 8.7 5.4 5.4 8.8
Longest 16.8 8.0 8.0 14.0
Source: UNCTAD – World Bank Trade Facilitation Seminar, May 2004,
Another comparison at the same Seminar shows port transit times as follows. While
there are differences in the number of days, particularly in respect of India, these can be
explained by the fact that the results are from different studies and that one measures
customs clearance and the other port transit times.
Table 5.7 Port transit times (days)
Category Brazil India China Malaysia
Imports
Average 13.8 10.4 7.5 3.4
Longest 32.4 21.6 12.2 7.4
Exports
Average 8.4 6.1 6.6 2.6
Longest 16.9 9.3 8.1 6.1
Source: World Bank, Investment Climate Assessments

71
Delays are apparently caused mainly by:
• Compliance with requirements to be followed prior to import;
• Inadequate port facilities leading to congestion
• Burdensome documentary requirements;
• Customs valuation and classification issues; and
• Inspections to verify products’ compliance to requirements of other agencies.
5.5. Import restrictions and conditions
Import of goods into and export of goods out of India is governed by the Export-Import
Policy, 2002-2007 (EXIM policy), which is framed every five years. India's current five-
year trade policy has further liberalised imports and exports.
India used to have extensive import restrictions but has had to remove these in terms of
its Uruguay Round WTO commitments. The removal of import restrictions did not
happen at the entry into force of the Uruguay Round Commitments but substantially later
and over an extended period of time, partly after pressure from other WTO members
(consultations by several countries and a dispute by the US). In many cases this was
accompanied by an increase in tariffs.
For the most current information on India’s Prohibited Import List, see
http://exim.indiamart.com/freedlist/prohibited.html.
5.6 Licensing
In April 2001, Indian Authorities implemented a significant liberalisation of the import
restrictions through the removal of Quantitative Restrictions (QRs). All goods not
classified as prohibited or restricted in the ITC (HS) Classification of Export and Import of
items can be freely imported. Goods still subject to licensing is not available as the list is
being reviewed.
According to the EU Trade Barriers Report, the removal of trade barriers has in some
instances been followed by an increasing number of new non-tariff barriers affecting the
importation of EU products. In particular, India has strengthened the implementation of
labelling and certification requirements. According to the report:

72
“Sensitive products are subject to burdensome, time consuming, and sometimes
discretionary controls by various Indian Authorities on their composition and
compliance with Indian standards (foodstuffs, textiles, cosmetics, mineral water, etc.).”
There are basically four types of concern:
1. The standards are complex and sometimes difficult to comply with (e.g. for food
products);
2. There is a lack in personnel (health officers) and infrastructures to send samples
to the laboratories, to conduct the testing in accredited laboratories, lack of
testing equipment;
3. There is a multiplication of authorities involved in the same type of controls;
4. There is a lack of efficient appeal procedures to challenge the ruling made after
controls.”
Certain industries are still subject to compulsory industrial licensing, namely the
following:
1. Distillation and brewing of alcoholic drinks
2. Cigars and Cigarettes of Tabocco and Manufactured Tobacco substitutes
3. Electronic, Aerospace and Defence Equipment: all types
4. Industrial explosives including detonating fuses, safety fuses, gun powder,
nitrocellulose and matches
5. Hazardous chemicals
6. Drugs and pharmaceuticals (according to modified Drug Policy, 1994 as amended in
1999)
5.7. Customs valuation
According to the EU Trade Obstacles Report, Customs are alleged to challenge
discretionary and quite systematically the declared value of specific products. (textile
and clothing, watches, cosmetics and other consumer products). The importer is
required to deliver documents proving the accuracy of the declared value. In addition to
the invoice and the packing list, the importer must supply a price declaration assessment
together with a document from the chamber of commerce of the country of origin. In
some cases, catalogues of the product are required in order to prove the accuracy of the
declared value.

73
In several cases, these investigations are justified by the high level of under-invoicing.
However, these procedures are also considered in many cases as completely
discretionary.
In practice, given the limited efficiency of appeal procedures, importers prefer to settle
the problems directly with Customs than to wait for a lengthy appeal decision confirming
the first customs decision (demurrage costs). While the difference in estimation remains
“bearable” (20%), the importer will prefer accepting the modified customs value than
paying demurrage costs.
5.8. Reference pricing and minimum import prices
The Government of India fixed minimum import prices for certain imported steel
products, including hot rolled steel coils, cold rolled steel coils, hot rolled sheets, tin
plates, electrical sheets, and alloy steel bars and rods. Whether to impose or withdraw
the minimum import price for these products is the subject of an Indian government legal
confrontation with the Indian courts. (US Trade Summary Report, 2004).
5.9. Labelling requirements
In April 2001, Indian Authorities implemented a significant liberalisation of the import
restrictions (removal of Quantitative Restrictions (QRs) and a reduction of import duties.
All goods not classified as prohibited or restricted in ITC (HS) Classification of Export &
Import of items can be freely imported. However, since November 2000, the DGFT has
started the imposition of various non tariff barriers: the extension of packaging and
labelling requirements to imported consumer goods, the extension of mandatory
registration of BIS standards to imported products, etc.
India applies stringent labelling requirements in respect of pre-packaged goods.
All pre-packaged commodities, imported into India, shall in particular carry the following
declarations:
a) Name and address of the importer;
b) Generic or common name of the commodity packed,
74
c) Net quantity in terms of standards units;
d) Month and year of packing in which the commodity is manufactured or
packed or imported; and
e) The maximum retail sale price (MRP) at which the commodity packaged form
may be sold to the ultimate consumer. “This price shall include all taxes local
or otherwise, freight, transport charges, commission payable to dealers, and
all charges towards advertising, delivery, packing, forwarding and the like, as
the case may be.”
The MRP is calculated on the basis of different criteria (freight, insurance, internal
taxes). In India, each State has a different rate of sales tax and other taxes. Sales tax
varies from 8% to 20% in the state of final destination. It is often not possible to know in
advance the identity of products and of consumers, as well as the quantities, which will
be sold. Even if the importer can give to the exporter an accurate indication of internal
taxes to the importer, he will not be able to guarantee that the information on the
exchange rate is correct.
If an exporter supplies products aimed to be sold in various states, he will have to
produce as many different labels as there are States of final destination for each item
sold. This results in significant additional costs.
This issue is further complicated by the Customs requirement to provide one invoice by
different MRP, even for the same items (e.g. same watches aimed to be distributed and
sold in various States). According to various freight forwarders, if the importer cannot
comply with this requirement, Customs will charge the additional duty on the highest
MRP.
Compliance of the above-stated requirements has to be ensured before the import
consignments are cleared by Customs in India. The import of pre-packaged commodities
such as raw materials, components, bulk import etc., that need to undergo further
processing before they are sold to end consumers are not included under this labeling
requirement.

75
5.10. Standards
Indian standards are formulated by the Bureau of Indian Standards (BIS), which was
established as a statutory body under the Bureau of Standards Act, 1986, and became
operational on 1 April 1987. Standards are developed through 15 division councils,
covering a wide number of sectors. From its formation until 1 April 2001, the BIS had
developed 17,428 voluntary standards relating to a number of sectors. In order to
ensure their continued relevance, Indian standards are reviewed as and when
considered necessary, but at least once every five years.
Indian and foreign manufacturers who meet a BIS standard may carry the BIS
Certification Mark. The BIS Certification Mark was made mandatory for 133 items (both
locally produced and imported). The BIS laboratories provide conformity testing for
products (both domestic and imported) requiring BIS certification. Voluntary certificates
are also issued for environmentally friendly products (Ecomark), environmental
management systems, quality systems, and hazard analysis and critical control points
(HACCP). Licences granted for quality systems, environmental management systems,
and HAACP are valid for three years and must be renewed. The BIS carries out regular
surveillance audits and inspections to ensure that the systems and products meet the
relevant standards. All the BIS certification schemes are operated according to the
relevant ISO/IEC guides.
BIS is operating a product certification scheme for foreign manufacturers. In this
scheme, a license can be granted for any product against an Indian Standard specifying
product characteristics, which is amenable to certification. The schemes operate on self-
certification basis, whereby the manufacturer is permitted to apply the Standard Mark on
the product after ascertaining its conformity to the Indian Standard licenced for. Through
its surveillance operations the Bureau maintains a close vigil on the quality of goods
certified. Those desirous of obtaining the BIS licence have to apply to BIS in the
prescribed application form, which can also be downloaded from BIS web-site at
http://www.bis.org.in along with an application fee of Rs.1000/-.
The foreign manufacturer must set up a liaison/branch office located in India with the
permission of Reserve Bank of India, which shall meet all liabilities with respect to BIS
Act, Rules and Regulations for purpose of the BIS licence. The requirement to set up an

76
office in India shall not apply, if BIS enters into an MOU with the respective Foreign
Government for implementation of BIS Act, Rules, and Regulations including the punitive
provisions, or if the foreign manufacturer nominates an authourized representative
located in India who declares his consent to be responsible for compliance provisions of
BIS Act 1986, Rules and Regulations on behalf of the manufacturer as per terms and
conditions of the Agreement signed between BIS and the foreign manufacturer.
Processing charges of US $ 300 are required to be paid after scrutiny and recording of
application.
The applicant has to bear expenditure of travel, stay, miscellaneous expenses like visa
etc and per diem as applicable by BIS regulations for a team of officers (normally not
more than 2 officers) for their inspection visit to the manufacturing premises.
5.11. Government procurement
It has been reported that Indian government procurement practices and procedures are
neither transparent nor standardized. Foreign firms do not generally win Indian
government contracts.
5.12. Investment
According to the US Trade Summary of India (2004), Press Note 18, introduced by the
Ministry of Industry on December 14, 1998, poses major impediments to investment in
India. The following are the two most restrictive provisions of Press Note 18:
1) The automatic approval route is not available to foreign investors who wish to set up
new ventures in India or who wish to enter into new technical collaborations or
trademark agreements in India, if such foreign investors have or have previously had
any joint venture, technology transfer or trademark agreement in the same or allied
field in India. Such foreign investors would have to obtain an approval from the
Indian government; and
2) In its application, such foreign investor would have to give reasons for which it finds it
necessary to set up a new venture or enter into a technical collaboration or
trademark agreement. The onus is on the investor to provide adequate justification
to the satisfaction of the Indian government that its new proposal would not
jeopardize the interests of the existing venture or the stakeholders thereof.

77
The government may, at its discretion, approve or reject the application giving reasons
for such rejection.
In addition, the foreign investors who already have an equity stake in a venture in India,
and who want to increase their equity stake in the company, are required to obtain a
resolution of the Board of Directors of the Indian company prior to seeking Indian
government permission.
India also has extensive rules in regard to setting up an office in India, in terms of what
each type of office is allowed to do and not allowed to do.
Generally, FDI rules have been substantially liberated and FDI of up to 100% equity is
allowed under Automatic Route for all sectors/ activities except the following:
i) Industries retained under compulsory licensing:
ii) Manufacture of items reserved for small scale sector by non-SSI units; and
iii) When the proposed location attracts locational restriction.
5.13. Anticompetitive Practices
India suffers from a slow bureaucracy and regulatory bodies that reportedly apply
monopoly and fair trade regulations selectively. With little or no fear of government
action and with a clogged court system where cases languish for years, Indian firms face
few if any disincentives to engaging in anticompetitive business practices.
5.14. Export taxes
Various exports have been subject to export taxes but these have been or are being
removed. The export of raw hides and skins is subject to an export duty of 60%.
5.15. Intellectual property rights
India is on the USA’s IPR “Priority Watch List” of 14 countries for due to continuous
serious concerns about copyright and trademark infringements, inadequate enforcement
of intellectual property rights, and the need to greatly improve the processing of patent

78
applications in a manner that is consistent with their international obligations. This is
according the 2005 Special 301 Report.
5.16. The propensity to use trade remedies
Trade remedies are anti-dumping and countervailing (anti-subsidy) duties aimed at
countering unfair international trade practices.
5.16.1. Anti-dumping duties
India and South Africa are some of the most frequent users of anti-dumping measures.
Table 7.5 shows the number of anti-dumping measures imposed from January 1995 to
30 June 2005 (the latest data on the WTO website) by the top ten users of this measure
and their percentages of the total.
Table 5.7 Anti-dumping measures per country 1995 – 30/06/2005
Country/Bloc Number of
measures
% of total
measures
India 309 17.9
United States 229 13.2
European Community (EU 15) 200 11.6
Argentina 139 8.0
South Africa 113 6.5
Turkey 81 4.7
Mexico 71 4.1
Australia 65 3.8
Brazil 63 3.6
China 62 3.6
Other 536 23.0
Total 1 729 100.0%

79
Anti-dumping measures per country in respect of the sectors covered by the
investigations for India are shown in the following table:
Table 5.8 Sectoral: Distribution of Measures By Importing Member. From 01/01/95 to 30/06/05
Member/sector Chemicals Plastics Rubber Textiles Footwear Metals Total
Argentina 5 9 0 8 0 51 73
Australia 8 16 0 5 0 15 44
Brazil 15 7 0 1 0 20 43
Canada 2 0 0 0 2 60 64
Chile 0 0 0 0 1 4 5
China, P.R. 31 16 0 1 0 5 53
Colombia 1 1 0 0 0 9 11
Egypt 1 13 0 0 0 8 22
EU 38 15 1 21 5 70 150
India 142 48 0 39 1 29 259
Indonesia 7 0 0 0 0 12 19
Israel 0 1 0 2 0 2 5
Jamaica 1 0 0 0 0 0 1
Japan 0 0 0 3 0 0 3
Korea, Rep. of 14 1 0 0 0 5 20
Lithuania 1 0 0 0 0 0 1
Malaysia 3 2 0 0 0 0 5
Mexico 14 4 0 2 0 38 58
New Zealand 0 0 0 0 0 4 4
Pakistan 3 2 0 0 0 1 6
Paraguay 1 0 0 0 0 0 1
Peru 1 1 0 4 4 15 25
Philippines 1 1 0 2 0 3 7
Poland 1 2 0 2 0 0 5
Singapore 0 0 0 0 0 2 2
South Africa 18 20 0 10 0 30 78
Thailand 1 0 0 0 0 23 24
Trinidad and T. 0 1 0 1 0 0 2

80
Turkey 7 32 0 18 0 13 70
United States 29 10 0 5 0 139 183
Venezuela 0 3 0 2 4 14 23
Totals 01/01/95 345 205 1 126 17 572 1266
- 30/06/05
Anti-dumping measures have become a major trade policy instrument of India since
1995 when the country had to start phasing out import restrictions as required by its
obligations under the Uruguay Round of the WTO. India is now the single biggest user
of anti-dumping measures with 17.9% of the total number of measures imposed by all
countries over the period concerned.
Base metals and articles (Chapters 72 to 83) and chemicals (Chapters 28 to 38) are the
sectors most subject to anti-dumping measures with 33.1% and 20.0%, respectively, of
all measures. Plastics attracted 11.9% and textiles 7.3% of all measures. 46.0% of
India’s measures are in respect of chemicals.
India is fifth on the list of countries against which most anti-dumping investigations have
been initiated up to 30 June 2005, with 115 cases (4.2% of the total). China tops the list
with 434 cases (15.8%) followed by the Republic of Korea with 212 cases (7.7%).
5.16.2. Countervailing duties
Countervailing duties are applied against subsidies by exporting countries. Such duties
can be applied against prohibited subsidies, which are subsidies contingent on export
performance or upon the use of domestic over imported goods, or actionable subsidies.
The latter category, briefly, refers to financial contributions by a government or a public
body (such as a direct transfer of funds, government revenue foregone, the provision of
goods or services by a government, other than general infrastructure, and if a
government makes payments to a funding mechanism, or entrusts or directs a private
body to carry out any of these functions; or if there is any form of price or income
support; and a benefit is thereby conferred. A countervailing duty may be applied against
an actionable subsidy only if it is specific to an enterprise or industry or a group thereof.
81
During the period January 1995 to 31 December 2004, 108 countervailing duties have
been imposed by all countries. India has not imposed any countervailing duties.
India is on top of the list of counties against which countervailing duties have been
imposed. Of the total of 108 countervailing duties, 25 or 23.1% have been imposed
against India. Of these, 14 were in respect of metals, 3 in chemicals, 4 in plastics and 2
in textiles.
5.16.3. Safeguard measures
A safeguard is an action taken to protect a specific industry from such increase in
imports as to cause, or threaten to cause, serious injury. It is intended to prevent or
remedy serious injury and to facilitate adjustment. Safeguard action is taken if the
measure a country wish to impose would breach its WTO obligations, i.e. if the tariff
would exceed the bound rate of duty or if the country wishes to impose quantitative
restrictions on imports. Unlike anti-dumping and countervailing duties, which are applied
to specific countries and exporters, safeguard measures have to be applied to a product
imported irrespective of its source.
Currently a total of 68 safeguard measures or provisional safeguard measures are
applied by all countries. Of these, 8 are applied by India (11.8%), namely 7 in respect of
chemicals and 1 in plastics.
5.17. Other trade discriminatory measures
India applies a vast array of export support schemes base on the duty rebate and
drawback principles.
The Government of India introduced the Duty Entitlement Pass Book (DEPB) Scheme in
April 1997 by means of Customs Notification 34/97, after the abolishment of the
Passbook Scheme. The objective of the measure is to provide duty free imports for
export production, in other words to neutralise the incidence of customs duty on the
import content of the export product. The neutralisation is provided by way of grant of
duty credit against the export product. Thus, for exporters not desirous of going through

82
the licensing route, an optional facility is given under DEPB Scheme. In contrast to the
usual temporary duty-free importation of goods for processing, the Pass Book Scheme
may lead to an indirect subsidy of local Indian production.
The Duty Entitlement Pass Book (DEPB) Scheme entitles an exporter (both a
manufacturer-exporter and a merchant-exporter) for credit as a specified percentage of
FOB value of exports, made in freely convertible currency. The credit is available
against such export products and at such rates as specified by the Directorate General
of Foreign Trade (DGFT) by way of Public Notice, for import of raw materials,
intermediates, components, parts, packaging material etc.
The DEPB is valid for a period of 12 months from the date of issue. The DEPB and/or
the items imported against it are freely transferable and, as a consequence, frequently
sold.
The DEPB has emerged as a favourite instrument of export promotion. The DEPB rates
are available on wide-variety of items compared to the coverage under the drawback
scheme, which is limited to a few items. The DEPB entitlement is also liberal compared
to the drawback rate. Imports through the DEPB Scheme are exempt from special
additional duties (SAD) and therefore, SAD can be avoided by duty payment through
DEPB.
The scheme lacks a built-in obligation to import only goods that are consumed in
production of the exported goods. There is no verification system in place to check
whether the imports are actually consumed in the production process. It is not a
substitution drawback scheme because the imported goods do not need to be of the
same quantity and characteristics as the domestically sourced inputs that were used for
export production. Exporting producers are eligible for the DEPB benefits regardless of
whether they import any inputs at all. An exporter obtains the benefit by simply
exporting goods without the need to show that any input material was indeed imported;
thus, exporting producers which procure all of their inputs locally and do not import
goods which can be used as inputs are still entitled to the DEPB benefits.

83
5.18. Considerations
1. India’s bound tariff rates for industrial products are quite high, mostly at 40%. Many
sensitive products are not bound against tariff increases. Footwear (Chapter 64), copper
(Chapter 74) and aluminium (Chapter 76) are not bound at all; in the chemicals, plastics
and rubber sectors many lines are not bound; while in respect of textiles and clothing
there is a lack of clarity about bindings. All South Africa’s tariff lines in the relevant
sectors are bound with the exception of a few chemical lines.
2. India has substantially reduced its customs tariffs over the last number of years. The
basic duties are very uniform, mostly at 15% (as from 1 March 2005). However the tariff
structure is not transparent with the contents of a large number of notifications and
general exemption notices not incorporated in Schedule 1 (basic duty schedule). There
are a large number of partial exemptions, mostly reductions/exemptions for specified
uses, projects etc. The actual basic duties on certain products may be lower than those
indicated in Schedule 1, such as in the case of steel (actually applied duty of 5%
compared to 20% shown in Schedule 1). The duty on stainless steel of Heading 72.19 is
10% (actual applied rate), on other stainless steel (apparently) 20% and on products of
stainless steel 15%.
3. Tariff concessions granted by India may, therefore, in certain cases be of no real
value. During negotiations on tariff concessions, SACU should make sure that the
preferences offered by India will result in actual reductions in the currently applied rates.
4. India applies additional taxes on imports and the structure is not transparent. The
most important of these is an additional duty of generally 16% (lower for certain products
including some textiles), also called a CVD, which is actually a central excise or value
added duty. A further additional duty of 4/8% applicable earlier has been removed in
respect of almost all products. The situation in respect of additional taxes/duties has
been simplified and these are lower than those previously applicable.
5. NTBs remain a major problem for exporters to India although the situation has
improved over the past few years. The NTBs with the most affect on exports to India are
policy unpredictability and uncertainty; customs procedures and delays; customs

84
valuation; port and other transport infrastructural problems; general burdensome red
tape; and labelling requirements.
6. India has become the country that uses anti-dumping duties most of all countries. The
sectors most subject to anti-dumping measures imposed by India are base metals and
products thereof (33.1%).
5. Of countries against which anti-dumping investigations have been initiated, India is
fifth on the list in regard to the number of initiations. India is subject to more
countervailing measures than any other country.
8 Negotiations on tariff preferences should not start before the NAMA modalities
under the Doha Round have been finalised and the implications thereof on the applied
tariffs of the respective countries have been evaluated.

85
6 TRADE FLOW ANALYSIS OF THE DEFENSIVE POSITION
6.1 Introduction
The defensive position as determined by trade flows is analysed by the following
approach:
• An analysis of Stainless Steel exports by India to the world.
• An analysis of export growth of Stainless Steel by India to the world.
• The revealed comparative advantages22 of India.
• Exports of Stainless Steel by India to South Africa.
• Export penetration of India into RSA.
• Revealed comparative disadvantages of RSA against India.
A synthesis of the contents of this chapter and the previous ones appears in Chapter 12
In Chapter 12 the defensive position of the South African stainless steel industry is
formulated with regard to the SACU-India trade negotiations.
6.2 Comparative size
Table 6.1 Stainless Steel exports, imports: of India and South Africa 2000 and 2004 US$ million
Exports Imports
Year India SA India SA
2000 434 512 162 167
2004 1051 1089 509 282
Source Comtrade
The trade in stainless steel by South Africa and India is about of similar order. Imports
are less important to South Africa than to India.
22
See ADDENDUM A for an explanation RCA and an example for the calculation thereof.
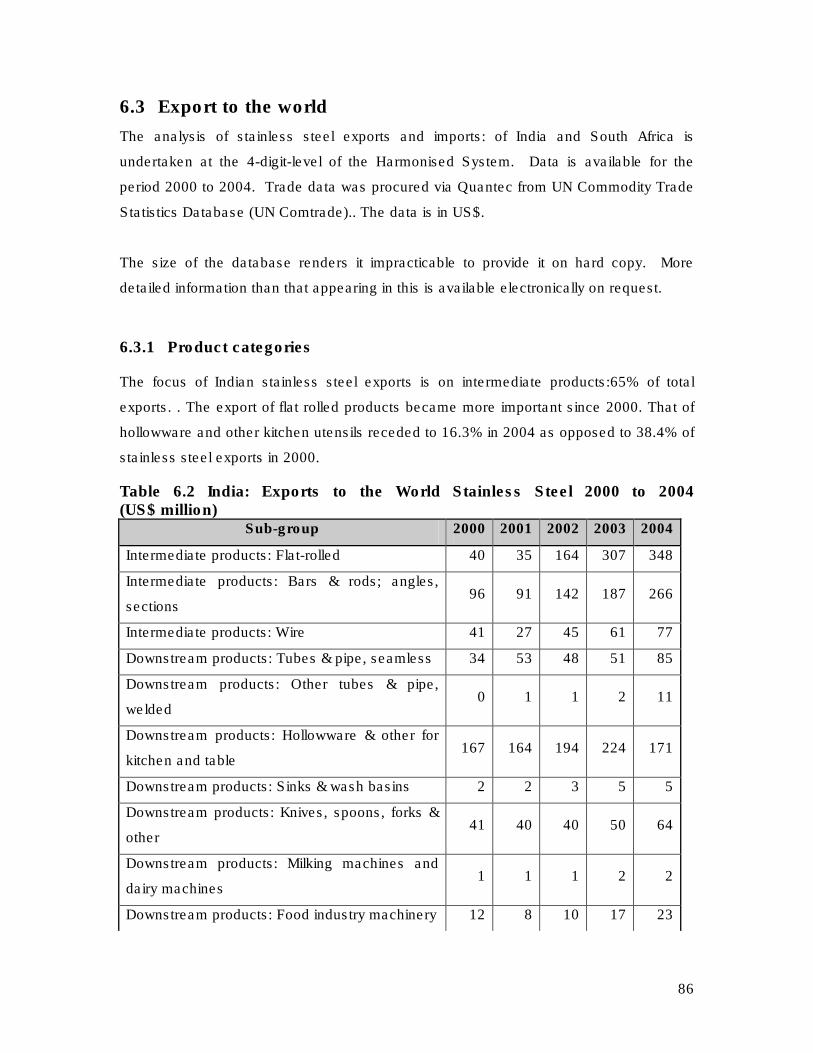
86
6.3 Export to the world
The analysis of stainless steel exports and imports: of India and South Africa is
undertaken at the 4-digit-level of the Harmonised System. Data is available for the
period 2000 to 2004. Trade data was procured via Quantec from UN Commodity Trade
Statistics Database (UN Comtrade).. The data is in US$.
The size of the database renders it impracticable to provide it on hard copy. More
detailed information than that appearing in this is available electronically on request.
6.3.1 Product categories
The focus of Indian stainless steel exports is on intermediate products:65% of total
exports. . The export of flat rolled products became more important since 2000. That of
hollowware and other kitchen utensils receded to 16.3% in 2004 as opposed to 38.4% of
stainless steel exports in 2000.
Table 6.2 India: Exports to the World Stainless Steel 2000 to 2004 (US$ million)
Sub-group 2000 2001 2002 2003 2004
Intermediate products: Flat-rolled 40 35 164 307 348
Intermediate products: Bars & rods; angles,
sections 96 91 142 187 266
Intermediate products: Wire 41 27 45 61 77
Downstream products: Tubes & pipe, seamless 34 53 48 51 85
Downstream products: Other tubes & pipe,
welded 0 1 1 2 11
Downstream products: Hollowware & other for
kitchen and table 167 164 194 224 171
Downstream products: Sinks & wash basins 2 2 3 5 5
Downstream products: Knives, spoons, forks &
other 41 40 40 50 64
Downstream products: Milking machines and
dairy machines 1 1 1 2 2
Downstream products: Food industry machinery 12 8 10 17 23

87
TOTAL 434 421 649 905 1051
6.4 Destination
China has overtaken the USA and the UAE as the major market for Indian stainless steel
exports. One percent of India’s stainless steel exports find their way to South Africa.
Table 6.3 Destination of exports of Stainless Steel by India 2000 to 2004 ($million and percentage share)
2000 2004
Partner USD
m %
USD
m %
China 10 2 212 20
USA 84 19 153 15
United Arab
Emirates 62 14 74 7
Germany 20 5 51 5
Rep. of Korea 0 0 35 3
Indonesia 3 1 32 3
Other Asia, nes 5 1 27 3
China, Hong
Kong SAR 15 3 25 2
Viet Nam 7 2 24 2
United
Kingdom 17 4 21 2
Turkey 4 1 18 2
Australia 6 1 16 2
Canada 9 2 15 1
Italy 14 3 15 1
Netherlands 5 1 14 1
Bangladesh 15 3 14 1
Malaysia 7 2 14 1
South Africa 7 2 13 1
Singapore 7 2 13 1

88
2000 2004
Partner USD
m %
USD
m %
Belgium 8 2 13 1
Sudan 2 1 12 1
Nigeria 15 4 12 1
Thailand 3 1 10 1
Saudi Arabia 7 2 10 1
Other 101 23 208 20
TOTAL 434 100 1051 100
6.5 Export growth
India achieves solid growth in its exports of intermediate products. However, as can be
seen from table 7.5 exports of some downstream products are gaining in importance
from a low level. Hollowware remains dominant among downstream exports but is
stagnating at a high level.
Table 6.4 Exports ports of Stainless Steel (product categories) by India to the World 2000 to 2004 (US$ million and percentage growth p.a.)
Sub-group 2000 2001 2002 2003 2004
Growth
2000-
2004
Intermediate products: Flat-rolled 40 35 164 307 348 91.8
Intermediate products: Bars &
rods; angles, sections 96 91 142 187 266 31.7
Intermediate products: Wire 41 27 45 61 77 22.9
Downstream products: Tubes &
pipe, seamless 34 53 48 51 85 19.2
Downstream products: Other tubes
& pipe, welded 0 1 1 2 11 126.2
Downstream products: Hollowware
& other for kitchen and table 167 164 194 224 171 3.7

89
Downstream products: Sinks &
wash basins 2 2 3 5 5 29.3
Downstream products: Knives,
spoons, forks & other 41 40 40 50 64 11.9
Downstream products: Milking
machines and dairy machines 1 1 1 2 2 45.1
Downstream products: Food
industry machinery 12 8 10 17 23 22.6
TOTAL 434 421 649 905 1051 28.8
Exports at 4-digit level and high growth appear in Table 10.5. Granting of concessions to
India in the export of these products should preferably be avoided.
Table 6.5 Exports of Stainless Steel (4xdigit HS) by India to the World 2000 to 2004 (US$ million and percentage growth p.a.) Exports US$20 million plus and growth higher than average.
Sub-group HS4 Description 2004
Growth
2000-
2004
Intermediate
products:
Flat-rolled
7219
Flat-rolled products of stainless
steel, of a width of 600 mm or
more.
299 98.4
Intermediate
products:
Bars & rods;
angles,
sections
7222
Other bars and rods of stainless
steel; angles, shapes and
sections of stainless steel.
217 36.6
Intermediate
products:
Wire
7223 Wire of stainless steel. 77 22.9
Downstream
products:
Tubes &
7304
Tubes, pipes and hollow
profiles, seamless, of iron
(excluding cast iron) or steel.
85 19.2

90
pipe,
seamless
Downstream
products:
Hollowware
& other for
kitchen and
table
7323
Table, kitchen or other
household articles and parts
thereof, of iron or steel; iron or
steel wool; pot scourers and
scouring or polishing pads,
gloves and the like, of iron or
steel.
171 3.7
Downstream
products:
Knives,
spoons,
forks &
other
8212
Razors and razor blades
(including razor blade blanks in
strips).
30 4.3
Downstream
products:
Food
industry
machinery
8438
Machinery, not specified or
included elsewhere in this
chapter, for the industrial
preparation or manufacture of
food or drink, (excluding
machinery for the extraction or
preparation of animal or fixed
vegetable fats or oils):
23 22.6
6.6 Revealed comparative advantages
The stainless steel products in which India has a comparative advantagr is shown in
table 6.6 . This is not an extensive list but two categories HS 7222 and HS 7223 are
also amongst those whose exports are growing fast. SACU should avoid concessions to
the products shown in table 6.6.
Table 6.6 Revealed comparative advantages of India exporting to the world. RCA India export to World
HS4 Description 2000 2001 2002 2003 2004
Other bars and rods of stainless steel; 2.7 3.1 3.4 3.1 4

91
RCA India export to World HS4 Description
2000 2001 2002 2003 2004
7222 angles, shapes and sections of stainless
steel.
7223 Wire of stainless steel. 4.2 3 3.6 3.6 3.7
7323
Table, kitchen or other household articles
and parts thereof, of iron or steel; iron or
steel wool; pot scourers and scouring or
polishing pads, gloves and the like, of iron or
steel.
6.1 6.2 4.5 3.9 3
7221
Bars and rods, hot-rolled, in irregularly
wound coils, of stainless steel. 3.5 2.9 3.4 3.5 2.4
8214
Other articles of cutlery (for example, hair
clippers, butchers' or kitchen cleavers,
choppers and mincing knives, paper knives);
manicure or pedicure sets and instruments
(including nail files).
3 2.5 1.6 1.7 2.2
6.7 Imports of Stainless Steel by South Africa
6.7.1 Data
Customs data from the South African Revenue Services is used. The analysis is for the
period 2000 to 2004. Data is analysed on the 4-digit-level of the HS. Exports are
measured in US$.
6.7.2 South African imports of Stainless Steel from the world
Although there are imports of intermediate products most of South Africa’s imports are
downstream stainless steel products. Prominent among the latter are seamless pipes
and tubes, knives, spoons and forks and food industry machinery.
Table 6.7 South African imports of Stainless Steel from the world – 2000 to 2004 (USD million)

92
Sub-group 2000 2001 2002 2003 2004
Intermediate products: Flat-rolled 17 19 15 28 49
Intermediate products: Bars & rods; angles,
sections 15 14 15 17 23
Intermediate products: Wire 9 10 11 14 17
Downstream products: Tubes & pipe, seamless 31 37 35 45 50
Downstream products: Other tubes & pipe,
welded 4 3 4 5 8
Downstream products: Hollowware & other for
kitchen and table 8 6 7 10 16
Downstream products: Sinks & wash basins 1 1 1 2 2
Downstream products: Knives, spoons, forks &
other 29 29 28 33 44
Downstream products: Milking machines and
dairy machines 4 4 2 7 9
Downstream products: Food industry machinery 50 30 26 36 62
TOTAL 167 152 144 197 282
Source: South African Customs and Excise
6.7.3 Origin of imports
South Africa imports from a number of countries with Germany, China and aggregate
imports of R282 million in 2004.
Table 6.8 Origin of imports of Stainless Steel by South Africa 2000 and 2004 (R million)
2000 2004
Partner USD
m %
USD
m %
Germany 34 20 37 13
China 7 4 27 10
Italy 10 6 26 9
United Kingdom 17 10 22 8
United States 12 7 18 7
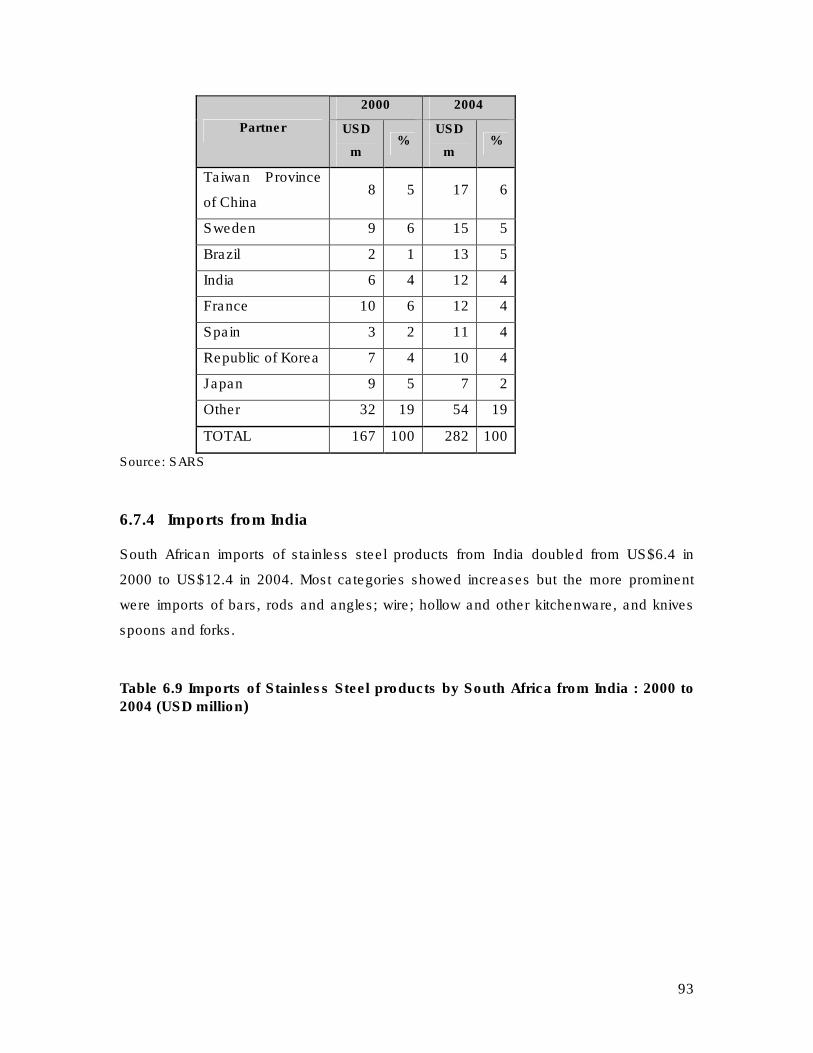
93
2000 2004
Partner USD
m %
USD
m %
Taiwan Province
of China 8 5 17 6
Sweden 9 6 15 5
Brazil 2 1 13 5
India 6 4 12 4
France 10 6 12 4
Spain 3 2 11 4
Republic of Korea 7 4 10 4
Japan 9 5 7 2
Other 32 19 54 19
TOTAL 167 100 282 100
Source: SARS
6.7.4 Imports from India
South African imports of stainless steel products from India doubled from US$6.4 in
2000 to US$12.4 in 2004. Most categories showed increases but the more prominent
were imports of bars, rods and angles; wire; hollow and other kitchenware, and knives
spoons and forks.
Table 6.9 Imports of Stainless Steel products by South Africa from India : 2000 to
2004 (USD million)

94
Source: SARS
In 2004 South Africa ran a positive balance of about US$14 million in its stainless steel
trade with India.
In table 10 appear data on sub headings beyond the 4 digit HS level in million Rand and
in physical units. There are consistent increases in the imports of kitchenware, razors
and blades and cutlery.
Table 6.10 South African imports of downstream stainless steel products 2000 to
2005 From India Rand million
HS Code Description 2000 2001 2002 2003 2004 2005
7304.10.20. Pipes 0.5 0.0 0.2 0.0 0.0 0.0
Sub-group 2000 2001 2002 2003 2004
Intermediate products: Flat-rolled 0.1 0 0 0.3 0.5
Intermediate products: Bars & rods;
angles, sec 1.9 1.7 1.7 1.6 2.9
Intermediate products: Wire 0.8 0.6 0.8 1.4 2.5
Downstream products: Tubes & pipe,
seamless 0.9 0.6 0.9 1 0.7
Downstream products: Other tubes &
pipe, welded 0.1 0.2 0.4 0.2 0.3
Downstream products: Hollowware &
other for kit 1.6 1.2 1.3 2.4 4.1
Downstream products: Sinks & wash
basins 0 0 0 0 0
Downstream products: Knives,
spoons, forks & ot 0.8 0.8 0.7 0.8 1.2
Downstream products: Milking
machines and dairy 0 0 0 0 0
Downstream products: Food industry
machinery 0.2 0.1 0.3 0.2 0.3
TOTAL 6.4 5.2 6 8 12.4
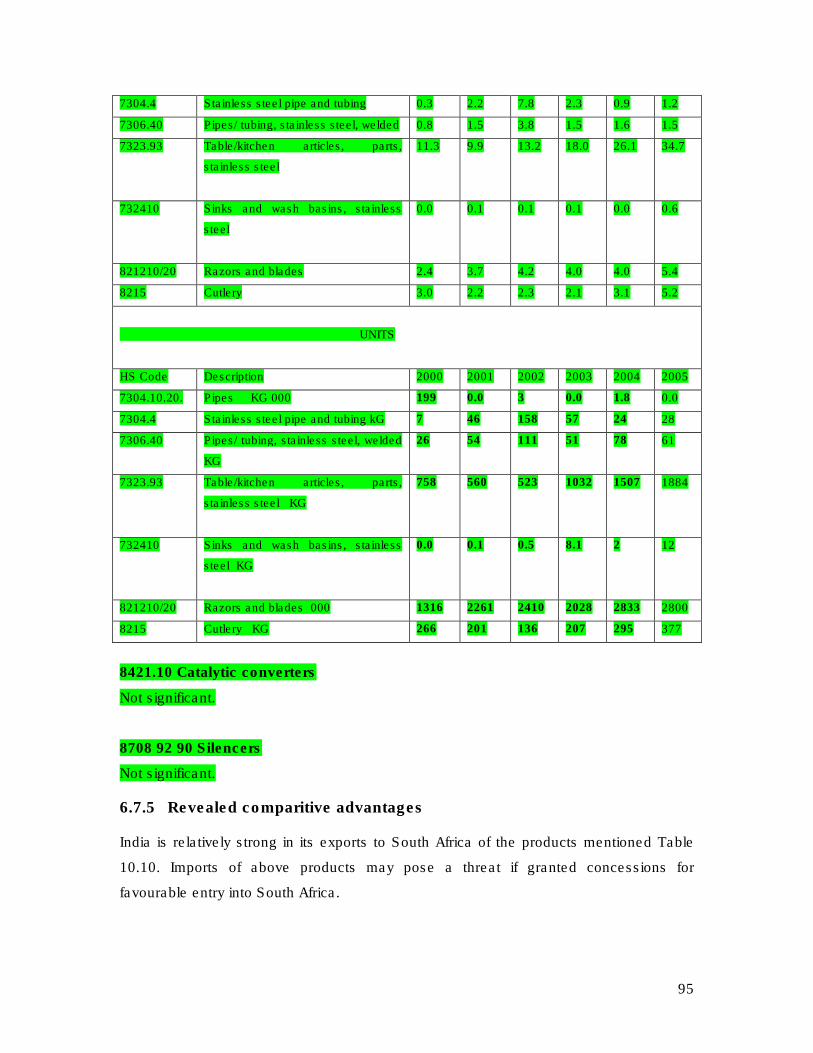
95
7304.4 Stainless steel pipe and tubing 0.3 2.2 7.8 2.3 0.9 1.2
7306.40 Pipes/ tubing, stainless steel, welded 0.8 1.5 3.8 1.5 1.6 1.5
7323.93 Table/kitchen articles, parts,
stainless steel
11.3 9.9 13.2 18.0 26.1 34.7
732410 Sinks and wash basins, stainless
steel
0.0 0.1 0.1 0.1 0.0 0.6
821210/20 Razors and blades 2.4 3.7 4.2 4.0 4.0 5.4
8215 Cutlery 3.0 2.2 2.3 2.1 3.1 5.2
UNITS
HS Code Description 2000 2001 2002 2003 2004 2005
7304.10.20. Pipes KG 000 199 0.0 3 0.0 1.8 0.0
7304.4 Stainless steel pipe and tubing kG 7 46 158 57 24 28
7306.40 Pipes/ tubing, stainless steel, welded
KG
26 54 111 51 78 61
7323.93 Table/kitchen articles, parts,
stainless steel KG
758 560 523 1032 1507 1884
732410 Sinks and wash basins, stainless
steel KG
0.0 0.1 0.5 8.1 2 12
821210/20 Razors and blades 000 1316 2261 2410 2028 2833 2800
8215 Cutlery KG 266 201 136 207 295 377
8421.10 Catalytic converters
Not significant.
8708 92 90 Silencers
Not significant.
6.7.5 Revealed comparitive advantages
India is relatively strong in its exports to South Africa of the products mentioned Table
10.10. Imports of above products may pose a threat if granted concessions for
favourable entry into South Africa.

96
Table 6.11 Revealed comparative advantages of Indian stainless steel exports to South Africa.
RCA of India exporting to SA HS4 Description
2000 2001 2002 2003 2004
7222
Other bars and rods of stainless steel; angles,
shapes and sections of stainless steel. 5.1 5.6 4.2 4.1 5.1
7220
Flat-rolled products of stainless steel, of a
width of less than 600 mm. 0 0 0 0.6 1.8
8215
Spoons, forks, ladles, skimmers, cake-
servers, fish-knives, butter-knives, sugar tongs
and similar kitchen or tableware.
2.5 2.3 1.6 1.9 1.5
8212
Razors and razor blades (including razor blade
blanks in strips). 0.9 1.1 0.9 1.1 1.2
6.8 Considerations.
1. Exports of stainless steel products by South Africa and India are similar in size
but South Africa’s imports of stainless steel products are less than that of India.
Both countries have a positive trade balance in the trade in stainless steel
products while South Africa has a positive balance with India.
2. India is exporting intermediate stainless steel products complemented by
downstream products especially hollowware and kitchen articles as well as
cutlery. However, downstream exports are stagnating while the major dynamic
the past five years was the rise in exports of intermediates like flat rolled
products, bars rods and wire. Compared to 2000 exports of stainless steel
products by India, in 2004 came to be dominated by intermediate products.
4. The destinations of Indian stainless steel exports are dispersed with the single
most important clients being China, USA and UAE. South Africa is the
destination of 1% of India’s stainless steel exports.
5. India have comparative advantages in its exports to the world in the products
below and any concessions to India on them should be avoided:
HS 7222 Other bars and rods of stainless steel; angles, shapes
and sections.

97
HS 7223 Wire of stainless steel.
HS 7323 Table, kitchen or other household articles and parts
thereof, of iron or steel; iron or steel wool; pot scourers and
scouring or polishing pads, gloves and the like, of iron or steel
(patta being the India specific material used). India share in world
trade amounts to 10% and the aim is to raise it to 25%.
HS 7221 Bars and rods, hot-rolled, in irregularly wound coils, of
stainless steel.
HS 8214 Other articles of cutlery (for example, hair clippers, butchers'
or kitchen cleavers, choppers and mincing knives, paper knives);
manicure or pedicure sets and instruments (including nail files).
5. Although imports of intermediate products grew significantly in latter years, most
of South Africa’s imports are downstream stainless steel products. Prominent
among the latter are seamless pipes and tubes, knives, spoons and forks and
food industry machinery. Imports from the world amounted to US$ 282 million in
2004.
6. Most imports come from Germany, China and Italy. 4% of imports are from India.
7. South African imports of stainless steel products from India doubled from US$6.4
in 2000 to US$12.4 in 2004. Most categories showed increases but the more
prominent were imports of bars, rods and angles; wire; hollow and other
kitchenware, and knives spoons and forks.
8. Imports of kitchen and hollowware (HS 7323.93) trebled between 2000 and 2005
in money terms and in units.

98
9. In addition to the products mentioned above India has a comparative advantage
against South Africa in:
7220 Flat-rolled products of stainless steel, of a width of less than
600 mm.
8215 Spoons, forks, ladles, skimmers, cake- servers, fish-knives,
butter-knives, sugar tongs and similar kitchen or tableware.
8212 Razors and razor blades (including razor blade blanks in
strips).
Concessions on these products to India should be avoided.
7 TRADE FLOW ANALYSIS OF THE OFFENSIVE POSITION
7.1 Introduction
The offensive position as determined by trade flows is analysed by the following
approach:
• An analysis of Stainless Steel imports by India from the world.
• An analysis of import growth of Stainless Steel products by India from the
world.
• The revealed comparative disadvantages of India of Stainless Steel
• Exports of Stainless Steel to India by South Africa.
• Export penetration of India by RSA. of Stainless Steel
• Revealed comparative advantages of RSA23 against India of Stainless Steel.
•
A synthesis of the contents of this chapter and the previous ones appears in Chapter 12.
In Chapter 12 the defensive position for stainless steel in negotiations is formulated for
the SACU-India -negotiations.
The analysis of the exports of Stainless Steel by India is undertaken at the 4-digit-level
of the Harmonised System. Data is available for the period 2000 to 2004. Trade data
was procured via Quantec from UN Commodity Trade Statistics Database (UN
Comtrade). The data is in US$.
23
See ADDENDUM A

99
The size of the database renders it impracticable to provide it on hard copy. More
detailed information than that appearing in this is available electronically on request.
7.2 Product categories
In 2004 India imported about US$500 million worth of stainless steel products. Of that
45% was seamless pipes and tubes and a further 36% flat rolled products. Imports of
stainless steel products are thus growing to be highly concentrated In 2004 import of
seamless tubes pipes were almost 4 times and that of flat rolled products 3 times higher
than in 2000.
Table 7.1 Imports of Stainless Steel products by India from the World 2000 to 2004 (US$ million)
Sub-group 2000 2001 2002 2003 2004
Intermediate products: Flat-rolled 59 72 68 129 182
Intermediate products: Bars & rods; angles,
sections 13 13 24 22 40
Intermediate products: Wire 5 5 6 7 12
Downstream products: Tubes & pipe,
seamless 62 74 101 176 230
Downstream products: Other tubes & pipe,
welded 2 3 2 3 5
Downstream products: Hollowware & other for
kitchen and table 1 0 1 1 1
Downstream products: Sinks & wash basins 0 0 0 0 0
Downstream products: Knives, spoons, forks &
other 4 6 5 10 10
Downstream products: Milking machines and
dairy machines 5 1 1 4 5
Downstream products: Food industry
machinery 11 15 11 20 23
TOTAL 162 191 219 371 509
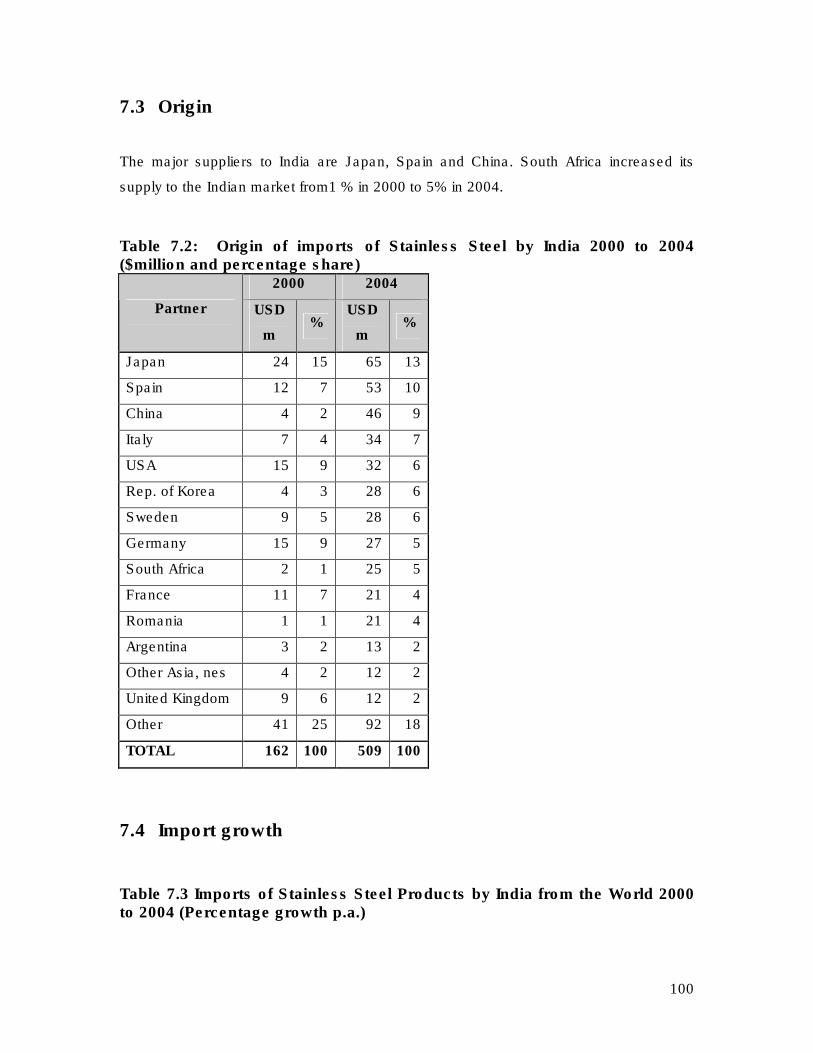
100
7.3 Origin
The major suppliers to India are Japan, Spain and China. South Africa increased its
supply to the Indian market from1 % in 2000 to 5% in 2004.
Table 7.2: Origin of imports of Stainless Steel by India 2000 to 2004 ($million and percentage share)
2000 2004
Partner USD
m %
USD
m %
Japan 24 15 65 13
Spain 12 7 53 10
China 4 2 46 9
Italy 7 4 34 7
USA 15 9 32 6
Rep. of Korea 4 3 28 6
Sweden 9 5 28 6
Germany 15 9 27 5
South Africa 2 1 25 5
France 11 7 21 4
Romania 1 1 21 4
Argentina 3 2 13 2
Other Asia, nes 4 2 12 2
United Kingdom 9 6 12 2
Other 41 25 92 18
TOTAL 162 100 509 100
7.4 Import growth
Table 7.3 Imports of Stainless Steel Products by India from the World 2000 to 2004 (Percentage growth p.a.)

101
Sub-group 2000 2001 2002 2003 2004
Growth
2000-
2004
Intermediate products: Flat-rolled 59 72 68 129 182 8
Intermediate products: Bars & rods;
angles, sections 13 13 24 22 40 33
Intermediate products: Wire 5 5 6 7 12 7
Downstream products: Tubes & pipe,
seamless 62 74 101 176 230 28
Downstream products: Other tubes &
pipe, welded 2 3 2 3 5 8
Downstream products: Hollowware &
other for kitchen and table 1 0 1 1 1 -11
Downstream products: Sinks & wash
basins 0 0 0 0 0 16
Downstream products: Knives, spoons,
forks & other 4 6 5 10 10 10
Downstream products: Milking machines
and dairy machines 5 1 1 4 5 -45
Downstream products: Food industry
machinery 11 15 11 20 23 2
TOTAL 162 191 219 371 509 16
Growth of stainless steel imports in US$ was 16% p.a. between 2000 and 2004.
7.5 Revealed comparative disadvantages
India seems to be at a comparative disadvantage in the trade in the products that are
shown in Table 11.4. Theoretically there may be opportunities in exporting these
products to India.
Table 7.4 RCDA of Indian Stainless Steel from the world HS4 Description RCA World exporting to India

102
2000 2001 2002 2003 2004
7304
Tubes, pipes and hollow profiles,
seamless, of iron (excluding cast
iron) or steel.
2.1 1.7 2.3 2.5 2.4
7223 Wire of stainless steel. 1.4 1.3 1.3 0.9 1.2
7222
Other bars and rods of stainless
steel; angles, shapes and sections
of stainless steel.
1.2 1.1 1.9 0.9 1.1
7221
Bars and rods, hot-rolled, in
irregularly wound coils, of stainless
steel.
0.8 0.5 1 0.9 1
7.6 Exports of Stainless Steel products by South Africa
7.6.1 Data
Customs data from the South African Revenue Services is used. The analysis is for the
period 2000 to 2004. Data is analysed on the 4-digit-level of the HS. Exports are
measured in USD.
7.6.2 South African exports of Stainless Steel to the world
In 2004 South Africa exported US$ 1089 million, double the exports in 2000. However,
exports remain concentrated in flat rolled intermediates. Export growth in US$ averaged
23% p.a. between 2000 and 2004.
Table 7.5 South African exports of Stainless Steel to the world – 2000 to 2004 (USD million)
Sub-group 2000 2001 2002 2003 2004
Intermediate products: Flat-rolled 424 311 386 634 973
Intermediate products: Bars & rods; angles,
sections 1 2 3 4 5
Intermediate products: Wire 0 0 0 0 1

103
Sub-group 2000 2001 2002 2003 2004
Downstream products: Tubes & pipe, seamless 34 33 25 35 55
Downstream products: Other tubes & pipe,
welded 16 15 15 17 16
Downstream products: Hollowware & other for
kitchen and table 2 2 6 9 9
Downstream products: Sinks & wash basins 2 2 3 3 3
Downstream products: Knives, spoons, forks &
other 6 5 6 6 5
Downstream products: Milking machines and
dairy machines 0 0 1 1 1
Downstream products: Food industry machinery 27 23 21 26 23
TOTAL 512 395 466 734 1089
Source: South African Customs and Excise
8421.10 Catalytic converters
South African exports to the world increased from USD 713 million in 2000 to
USD 1370 million in 2004.
8708 92 90 Silencers
Exports increased from USD56 million in 2000 to USD62 million in 2004.
7.6.3 Destination of South African exports.
Italy and China are the major destinations of stainless steel exports. About 2% of exports
(90% flat rolled) go to India up from !% in 2000.
Table 7.6 Destination of exports of Stainless Steel by South Africa 2000 and 2004 (R million)
2000 2004
Partner USD
m %
USD
m %
Italy 114 22 172 16
China 8 2 141 13
Thailand 50 10 89 8

104
2000 2004
Partner USD
m %
USD
m %
Germany 13 3 68 6
United States 48 9 62 6
United Kingdom 38 7 51 5
Mexico 82 16 51 5
Hong Kong Special
Administrati 21 4 45 4
Sweden 1 0 40 4
Republic of Korea 1 0 33 3
Malaysia 3 1 30 3
India 4 1 27 2
Singapore 6 1 24 2
Israel 9 2 23 2
Romania 0 0 19 2
Other 112 22 215 20
TOTAL 512 100 1089 100
Source: SARS
7.7 Revealed comparative advantages
South Africa has a comparative advantage in the export of flat-rolled products of
stainless steel with a width 600mm or more. Exports of welded tube and pipe( HS
7306.40) Catalytic converters (8421.10) and Silencers ( 8708 92 90) also demonstrate
competitive advantages.
7.8 Considerations
1 In 2004 India imported about US$500 million worth of stainless steel products. Of that
45% was seamless pipes and tubes and a further 36% flat rolled products. Imports of
stainless steel products are thus growing to be highly concentrated In 2004 import of
seamless tubes pipes were almost 4 times and that of flat rolled products 3 times higher
than in 2000.
2. South Africa increased its supply of stainless steel products to the Indian market
from1 % in 2000 to 5% in 2004.

105
3. Theoretically24 there may be opportunities in exporting the following products to India
because of India’s comparative disadvantage in their trade:
7304 Tubes, pipes and hollow profiles, seamless, of iron (excluding cast
iron) or steel.
7223 Wire of stainless steel.
7222 Other bars and rods of stainless steel; angles, shapes and sections
of stainless steel.
7221 Bars and rods, hot-rolled, in irregularly wound coils, of stainless
steel.
4. In 2004 South Africa exported US$ 1089 million, double the exports in 2000.
However, exports remain concentrated in flat rolled intermediates. Export growth in US$
averaged 23% p.a. between 2000 and 2004.
5. Italy and China are the major destinations of South African stainless steel exports.
About 2% of exports (90% flat rolled) went to India in 2004 up from !% in 2000.
6 South Africa has a comparative advantage in the export of flat-rolled products of
stainless steel with a width 600mm or more. Exports of catalytic converters and of
exhaust systems also show promise.
Imports and exports of stainless steel products by South Africa and India are becoming
more intensive although at a very low level.
8 SYNTHESIS AND RECOMMENDATIONS
8.1 The defensive position
8.1.1 Considerations
1. Sustained rapid growth, high investment, a large population, and a willingness to
support development with incentives, promise to propel the Indian economy to
one of the largest mass markets of the world. The Indian economy is already the
24
Not produced in South Africa.

106
10th largest in the world. Indian firms can thus expect to benefit from economies
of scale and a large home base. Competition from Indian producers will in all
probability be a threat to their South African counterparts.
2. The Indian government has traditionally had a legacy of protectionism toward the
economy and this has translated into a bureaucratic system that is inefficient and
infected with some measure of corruption. This may frustrate exporting to India.
However, as part of the reform process, the government has endeavored to
address bureaucratic obstacles and to reduce corruption.
3. The Indian stainless steel industry has grown at a rate of 16% over the last
fifteen years and has averaged growth of 20% over the last four years. The
exceptional growth of the last four years can be attributed to growth in exports to
China. Exports expanded by 55% p.a. between 1999 and 2004.
4. Industry specific policies are developed by the industry in conjunction with
government. The industry aims at improved availability; expansion of process
capacity; moving up the value chain; pricing and affordability; and extending and
expanding the market. India maintains a competitive edge with regards to the Cr-
Mn/200 series grade, which has low nickel content and is significantly cheaper
than products with high nickel content. India has a large pool of low cost labour,
with the capability to manufacture products of international standard. The Indian
stainless steel industry is on an expansionary path and geared toward product
improvement, capacity building and global expansion. This is backed by a clear
industry strategy and industry development incentives.
5. India’s share of world production has increased from 2% in 1991-1992 to
approximately. 7% in 2004-2005. It is estimated that by 2010, the production of
stainless steel will amount to 2.618 million tonnes and 4 million tonnes in 2016
compared with 1.7 million tonnes in 2004-2005. The Indian stainless steel
industry follows a policy of production pre-empting demand. Should some mishap
happen to growth in markets the Indian industry could become more aggressive
in its home and in export markets with negative consequences for the South
African stainless steel industry.

107
6. The Indian stainless steel industry is export orientated (46% of production ) and i
in the upstream part of the industry the export of flat rolled stainless steel
>600mm is half of the total in tonnes. Imports of stainless steel are 9% of
production and also predominantly flat rolled stainless steel >600mm. Exports is
predicted to grow by 9% to 12 % p.a. over the next ten years.
..
9. Export of kitchen and hollowware is 40% of production. India’s share in world
trade of these products is 10% and the aim is to raise it to 25%.
7. India’s bound tariff rate for stainless steel is 40%. Only 64% of the tariff headings
of Chapter 74 (Metal products) are bound. India could thus raise its much lower
applied rates to this higher level should circumstances require it
8. India’s duty on stainless steel of Heading 72.19 is 10% (actual applied rate), on
other stainless steel (apparently) 20% and on products of stainless steel
15%.The highest South African applied tariff is 30% although 20% is more
typical..
9. However India’s tariff structure is not transparent with the contents of a large
number of notifications and general exemption notices not incorporated in
Schedule 1 (basic duty schedule). Furthermore, India applies additional taxes on
imports and their structure is not transparent. The most important of these is an
additional duty of generally 16% which is actually a central excise or value added
duty.
10. Tariff concessions granted by India may, therefore, in certain cases be of no real
value. During negotiations on tariff concessions, SACU should make sure that
the preferences offered by India will result in actual reductions in the currently
applied rates.
11. NTBs remain a major problem for exporters to India although the situation has
improved over the past few years. The NTBs with the most affect on exports to
India are policy unpredictability and uncertainty; customs procedures and delays;

108
customs valuation; port and other transport infrastructural problems; and general
burdensome red tape.
12. India has become the pre-eminent exponent of anti-dumping duties of all
countries. The sectors most subject to anti-dumping measures imposed by India
are base metals and products thereof (33.1%) that would include stainless steel.
Of countries against which anti-dumping investigations have been initiated, India
is fifth on the list in regard to the number of initiations. India is subject to more
countervailing measures than any other country.
13. India have comparative advantages in its exports to the world in the products
below and any concessions to India on them should be handled with great care:
HS 7222 Other bars and rods of stainless steel; angles, shapes
and sections.
HS 7223 Wire of stainless steel.
HS 7323 Table, kitchen or other household articles and parts
thereof, of iron or steel; iron or steel wool; pot scourers and
scouring or polishing pads, gloves and the like, of iron or steel.
HS 7221 Bars and rods, hot-rolled, in irregularly wound coils, of
stainless steel.
HS 8214 Other articles of cutlery (for example, hair clippers,
butchers' or kitchen cleavers, choppers and mincing knives,
paper knives); manicure or pedicure sets and instruments
(including nail files).
14. South African imports of stainless steel products from India doubled from US$6.4
in 2000 to US$12.4 in 2004. Most categories showed increases but the more
prominent were imports of bars, rods and angles; wire; hollow and other

109
kitchenware, and knives spoons and forks. That of HS 7323.93 (kitchen and
hollowware) trebled between 2000 and 2005 in money terms and in units.South
Africa is the destination of 1% of India’s stainless steel exports.
15. India has a comparative advantage against South Africa in:
7220 Products of stainless steel of a width of less than 600 mm.
8215 Spoons, forks ladles, skimmers, cake-servers, fish-knives, butter-knives,
sugar-tongs and similar kitchen or tableware.
8212 Razor and razor blades (including razor blades blanks in strips).
Concessions on these products to India should be avoided
8.1.2 Recommendations from a defensive position.
The cross cutting perspective
6. The Indian economy is 4 times South Africa’s and the population 23 times.
India’s economy is the 10th largest in the world with high growth potential. South
Africa is more open to international trade (66% of GDP) than India (31%). Indian
exports to South Africa are expanding and because of the difference in size and
trade intensity, the impact on the South African market can be much more
extensive than the other way round.
The sector specific perspective
2 By considering that India’s stainless steel sector is:
• undergoing robust growth in production, consumption and export;
• supported by a clear development strategy as developed by the Indian stainless
steel industry;
• backed by government development incentives;
• with the real threat of excess capacity that may impact adversely on trading
partners when conditions change for the worse, and
• India’s competitive advantage in down stream stainless steel products,

110
should cause negotiators to be extremely careful in granting concessions on stainless
steel products to India.
3. Should any offers be contemplated they need to be worked out in conjunction with
the constituents of the stainless steel sector.
4. The tariff headings that appear in paragraphs 14 and 16 represent areas of
competitive advantage by India that makes it dangerous to grant any concessions
with regard to them.
5. Negotiations may be complicated by:
• the Doha Round. The applied tariff rates of some product groups will be subject
to reduction over a period of time in terms of NAMA (non-agricultural market
access) if the Doha Round is successfully concluded. NAMA introduces a
degree of uncertainty with respect to future MNF tariff levels that may render
bilateral concessions premature; and
• subsidies and incentives that may be enjoyed by Indian firms.
• high bound tariffs as a potential fall back to raise applied tariffs should
circumstances require that.
8.2 The offensive position
8.2.1 Considerations
1. The Indian economy is already the 10th largest in the world and driven by
economic reform, high investment and growth is to progress even further. Indian
markets will offer opportunities to South African business.
2. India’s infrastructure faces the twin challenges of expansion and modernisation.
Incentives are to be introduced for investment in certain sectors, which include
telecommunication, ports, airports, railways, roads, energy and construction.
Investment in infrastructure will be to the benefit of the demand for stainless
steel.
3. Stainless steel consumption in India is growing at 11.5% to 12% annually. It
amounted to approximately 1.153 million tonnes in 2004-2005. Flat products
constitute the majority of products consumed at 86% (CR-MN grade 72.4%).
70% of downstream stainless steel consumption is in the manufacture of utensils.

111
4. However, other applications are to become more prominent in future. Use of
stainless steel in construction is predicted to increase from 28 million tonnes in
2004 to 208 million tonnes in 2010 or from 2.4% to 9.1% of consumption..
Application in the transport sector is to increase from 24 million tonnes to 104
million tonnes in 2010 (2.1% to 6.1% of consumption). The remaining
applications are also expected to increase in proportion to consumption while the
dominance of use of stainless steel in utensil manufacture is set to decline to
62% of consumption in 2010.
5. Imports are predicted to remain important and set to grow by 12% to 15% over
the next ten years. That is marginally faster than the growth in consumption.
6. In 2004 India imported about US$500 million worth of stainless steel products. Of
that 45% was seamless pipes and tubes and a further 36% flat rolled products.
Imports of stainless steel products are thus growing to be highly concentrated In
2004 import of seamless tubes pipes were almost four times and that of flat
rolled products 3 times higher than in 2000.
7. South African exports of stainless steel amounted to US$ 1089 million in 2004.
This was double the amount of 2000 and a growth rate of 23% p.a. Exports
remain concentrated in flat rolled intermediates
8. South Africa increased its supply of stainless steel products to the Indian market
from US$ 4 million (1%) in 2000 to US$ 27 million (2%) in 2004. Imports and
exports of stainless steel products by South Africa and India are becoming more
intensive although at a very low level. South Africa has a positive trade balance
in the trade in stainless steel products with India.
9. South Africa has a comparative advantage in the export of flat-rolled products of
stainless steel with a width 600mm or more. Comparative advantages are
present for the exports of catalytic converters and exhausts systems.
Theoretically there may be opportunities in exporting the following products to
India because of India’s comparative disadvantage in their trade:

112
7304 Tubes, pipes and hollow profiles
7222 Other bars and rods of stainless steel, angles, shapes and sections of
stainless steel
7221 Bars and rods, hot-rolled, in irregularly wound coils, of stainless steel.
8.2.2 Recommendations from an offensive position
From a cross cutting perspective
1. By considering that
• India is the second fastest growing economy of the world;
• Already is the 10th largest and destined to become even more important
with sustained high growth caused by increases in prosperity to be
generated by exports, India’s IT services sector and its growing segment
of middle class consumers;
suggest that opportunities for concessions on South African exports of stainless
steel products be pursued.
From a sector specific perspective
2. Because:
• India’s imports of stainless steel are predicted to grow faster than
consumption over the next ten years;
• .South African exports of predominantly flat rolled products to India are
growing rapidly although from a low base;.
• Applications in construction and transport are to become more prominent
to supplement the large amounts of stainless steel that is used in the
production of utensils,
could make it worth while for South Africa to request tariff concessions from
India.
3. Apart from South Africa’s apparent advantage in exporting flat rolled products
India may offer opportunities in the following where it seems to be at a
competitive disadvantage against the world at present.
• 7304 Tubes, pipes and hollow profiles

113
• 7222 Other bars and rods of stainless steel, angles, shapes and sections
of stainless steel
• 7221 Bars and rods, hot-rolled, in irregularly wound coils, of stainless
steel.
(These opportunities could be viable with or without a PTA)
6. Considerations of concessions should be undertaken in full consultation with the
industry also because the industry’s perceptions of opportunities are those that really
matters as they would be the ones with the better chance to be turned into reality.
7. Negotiations can be complicated by WTO unfriendly subsidies and incentives that
Indian producers may enjoy. A further complicating factor is South Africa’s very
narrow range of stainless steel products on offer that limit its ability to benefit from
PTA’s. This could become an issue where India may request concessions over a
range of down stream products where South Africa is at a competitive disadvantage.
Indian NTB’ s, furthermore, are a major deterrent to imports. Negotiators need to
ensure that tariff concessions are real and not eroded by non-tariff barriers;
Uncertainty on future tariff levels because of NAMA may render bi-lateral
concessions as premature.
7. Prospective exporters should enter the Indian market preferably in partnership
with an Indian counterpart in view of the NTB’s and other issues in doing
business in India. .

114
ADDENDUM A
Revealed Comparative Advantage (RCA)
One of the most widely used measures of comparative advantage or international
competitiveness is the Revealed Comparative Advantage (RCA) index developed by
Balassa (1965). The RCA index compares a country’s global market share for a
particular product (sector) with its global market share for all goods traded. It can
therefore be used to identify a country’s comparative (competitive) advantage in the
production and export of specific products or sub-sectors.
Because the RCA index is based on actual trade flows, it highlights a country’s actual
competitive advantage in a particular product, despite the existence of trade barriers.
The Revealed Comparative Advantage (RCA) index used in this report was calculated
as follows:
where:
Xik = Exports from country i (SA/EU) for a specific sector k
Mjk = Imports from country j (SA/EU/World) for a specific sector k
Xit = Total exports (t) from country i (SA/EU)
Mjt = Total imports (t) from country j (SA/EU/World)
The Revealed Comparative Advantage (RCA) is a very good indicator of
competitiveness and general performance.
There are two ways of interpreting it:
If we talking about competitiveness in the total world market
It measures the share of South African exports in a specific sector relative to total export
share of world trade.
It measures the share of South African exports in the specific sector in world trade in that
sector relative to total SA export share of world trade.
=
jt
it
jk
ikik M
XM
XRCA

115
If we talking about competitiveness in the specific country or region
It measures the share of South African exports in a specific sector of that relative to total
SA export share of that country’s total imports.
It measures the share of South African exports in the specific sector in that country’s
total import in that sector relative to total SA export to that country share of the country
total import.
The difference comes from the fact that world imports equal world exports.
A value of greater than one indicates a revealed comparative advantage
EXAMPLE
RCA India exports to SA revealed comparative advantage HS7222 - Other bars and rods of
stainless steel; angles, shapes and sections of stainless steel.:
SA import from world 2004 for this heading is 18,509,788, SA total import from world for Stainless
Steel 2004 is 281,621,580. India’s export to SA for this line 2004 is 2,898,501, India’s total export
to SA for Stainless steel is 8,717,295.
RCA =(2898501 / 8717295) / (18509788 / 281621580) = 5.06 – grater than one. It means this
product has comparative advantage
ADDENDUM B
INDIA: GENERAL INCENTIVE SCHEMES
India applies a vast array of export support schemes based on the duty rebate and
drawback principles. These schemes and their main features are:
1. DUTY EXEMPTION & REMISSION SCHEMES

116
Duty exemption schemes enable duty free import of inputs
required for export production. An Advance Licence is
issued as a duty exemption scheme. A Duty Remission
Scheme enables post export replenishment/ remission of
duty on inputs used in the export product. Duty remission
schemes consist of (a) DFRC (Duty Free Replenishment
Certificate) and (b) DEPB (Duty Entitlement Passbook
Scheme).
DFRC permits duty free replenishment of inputs used in the
export product. DEPB allows drawback of import charges
on inputs used in the export product.
Advance Licence
for Annual
Requirement
4.1.10
Advance Licence can also be issued on the basis of annual
requirement for physical exports, intermediate supplies and
/ or deemed exports.
The entitlement in terms of CIF value of imports under this
scheme shall be up to 300% of the FOB value of physical
export and / or FOR value of deemed export in the
preceding licensing year or Rs 1 crore, whichever is higher.
Such licence shall have value addition as specified in
paragraph 4.1.6 of the Foreign Trade Policy.
EXPORT PROMOTION CAPITAL GOODS SCHEME
EPCG Scheme 5.1 The scheme allows import of capital goods for pre
production, production and post production (including
CKD/SKD thereof as well as computer software systems)
at 5% Customs duty subject to an export obligation
equivalent to 8 times of duty saved on capital goods
imported under EPCG scheme to be fulfilled over a period
of 8 years reckoned from the date of issuance of licence.

117
EXPORT ORIENTED UNITS (EOUs), ELECTRONICS HARDWARE TECHNOLOGY
PARKS (EHTPs), SOFTWARE TECHNOLOGY PARKS (STPs) AND BIO-
TECHNOLOGY PARKS (BTPs)
Eligibility 6.1 Units undertaking to export their entire production of goods
and services (except permissible sales in the DTA), may
be set up under the Export Oriented Unit (EOU) Scheme,
Electronic Hardware Technology Park (EHTP) Scheme,
Software Technology Park (STP) Scheme or Bio-
Technology Park (BTP) scheme for manufacture of goods,
including repair, re-making, reconditioning, re-engineering
and rendering of services. Trading units, however, are not
covered under these schemes.
(b) An EOU/EHTP/STP/BTP unit may import and/or
procure from DTA or bonded warehouses in DTA /
international exhibition held in India without
payment of duty all types of goods, including
capital goods, required for its activities, provided
they are not prohibited items of import in the ITC
(HS). Any permission required for import under any
other law shall be applicable. The units shall also
be permitted to import goods including capital
goods required for the approved activity, free of
cost or on loan/lease from clients. The import of
capital goods will be on a self certification basis.
Other Entitlements 6.12
Other entitlements of EOU/EHTP/STP/BTP units are as
under:
(a) Exemption from payment of Income Tax as per

118
the provisions of Section 10A and 10B of Income
Tax Act.
(b) Exemption from industrial licensing for
manufacture of items reserved for SSI sector.
( c) deleted
(d) Will be allowed to retain 100% of its export earning
in the EEFC account.
The Units will not be required to furnish bank
guarantee at the time of import or going for job
work in DTA, where the unit has (i) a turnover of
Rupees 5 crores or above, (ii) the unit is in
existence for at least three years and (iii) unit
having an unblemished track record.
100% FDI investment permitted through Automatic
Route similar to SEZ units.
SPECIAL ECONOMIC ZONES
Eligibility 7.1 (a) Special Economic Zone (SEZ) is a specifically
delineated duty free enclave and shall be deemed to
be foreign territory for the purposes of trade
operations and duties and tariffs.
(b) SEZ units shall be entitled for:-
(i) Exemption from Central Sales Tax.
(ii) Exemption from payment of Central Excise
Duty on all goods eligible for procurement by
the unit.
(iii) Deleted.
(iv) Reimbursement of Duty paid on fuels or any
other goods procured from DTA as per the
rate of drawback notified by the Directorate
General of Foreign Trade from the date of
such notification.

119
Other Entitlements Other entitlements of SEZ units are indicated in the Chapter
7 of the Handbook (Vol-1).
Entitlement for SEZ
Developer
7.23 For development, operation and maintenance of
infrastructure facilities in SEZs, the developer shall be
eligible for the following entitlements
(a) Income tax exemption as per 80 IA of the Income
Tax Act.
(b) Import/ procure goods without payment of
Customs/Excise duty.
(c) Exemption from Service tax.
(d) Exemption from CST.
FREE TRADE & WAREHOUSING ZONES
Objective 7A.1 The objective is to create trade-related infrastructure to
facilitate the import and export of goods and services with
freedom to carry out trade transactions in free currency.
The scheme envisages creation of world-class
infrastructure for warehousing of various products, state-
of-the-art equipment, transportation and handling facilities,
commercial office-space, water, power, communications
and connectivity, with one-stop clearance of import and
export formality, to support the integrated Zones as
‘international trading hubs’. These Zones would be
established in areas proximate to seaports, airports or dry
ports so as to offer easy access by rail and road.
Status 7A.2 The Free Trade & Warehousing Zones (FTWZ) shall be a
special category of Special Economic Zones with a focus
on trading and warehousing.
Entitlement of units 7A.6 (i) Income Tax exemption as per 80 IA of the Income
Tax Act.
120
(ii) Exemption from Service Tax.
(iii) Free foreign exchange currency transactions would
be permitted.
DEEMED EXPORTS
Deemed Exports 8.1 "Deemed Exports" refers to those transactions in which the
goods supplied do not leave the country and the payment
for such supplies is received either in Indian rupees or in
free foreign exchange.
Benefits to the
Supplier
8.4.1 (i) In respect of supplies made against Advance
Licence in terms of paragraphs 8.2(a) of the Policy,
the supplier shall be entitled to Advance Licence for
intermediate supplies.
PROMOTIONAL MEASURES
Assistance to States
for Infrastructure
Development of
Exports (ASIDE)
3.1 The State Governments shall be encouraged to participate
in promoting exports from their respective States. For this
purpose, Department of Commerce has formulated a
scheme called ASIDE.
Suitable provision has been made in the Annual Plan of the
Department of Commerce for allocation of funds to the
States on the twin criteria of gross exports and the rate of
growth of exports.

121
The States shall utilise this amount for developing
infrastructure such as roads connecting production centres
with the ports, setting up of Inland Container Depots and
Container Freight Stations, creation of new State level
export promotion industrial parks/zones, augmenting
common facilities in the existing zones, equity participation
in infrastructure projects, development of minor ports and
jetties, assistance in setting up of common effluent
treatment facilities, stabilizing power supply and any other
activity as may be notified by Department of Commerce
from time to time.
The DEPB scheme lacks a built-in obligation to import only goods that are consumed in
production of the exported goods. There is no verification system in place to check
whether the imports are actually consumed in the production process. It is not a
substitution drawback scheme because the imported goods do not need to be of the
same quantity and characteristics as the domestically sourced inputs that were used for
export production. Exporting producers are eligible for the DEPB benefits regardless of
whether they import any inputs at all. An exporter obtains the benefit by simply
exporting goods without the need to show that any input material was indeed imported;
thus, exporting producers which procure all of their inputs locally and do not import
goods which can be used as inputs are still entitled to the DEPB benefits.
EOUs and exporters in special economic zones, in addition to the duty drawbacks,
benefit from tax concessions and relief from other taxes such as services taxes.
India also has export finance, insurance, guarantee, export promotion and marketing
assistance schemes. In addition, their priority-sector lending requirements require
domestic banks to allocate 12% of total annual lending for exports.

122