american behavioral scientist - factor happiness · 2013-02-08 · types of dynamics possible for a...
TRANSCRIPT

http://abs.sagepub.com
American Behavioral Scientist
DOI: 10.1177/0002764203260208 2004; 47; 740 American Behavioral Scientist
Marcial Losada and Emily Heaphy Model
The Role of Positivity and Connectivity in the Performance of Business Teams: A Nonlinear Dynamics
http://abs.sagepub.com/cgi/content/abstract/47/6/740 The online version of this article can be found at:
Published by:
http://www.sagepublications.com
can be found at:American Behavioral Scientist Additional services and information for
http://abs.sagepub.com/cgi/alerts Email Alerts:
http://abs.sagepub.com/subscriptions Subscriptions:
http://www.sagepub.com/journalsReprints.navReprints:
http://www.sagepub.com/journalsPermissions.navPermissions:
http://abs.sagepub.com/cgi/content/refs/47/6/740 Citations
at OhioLink on March 11, 2009 http://abs.sagepub.comDownloaded from

ARTICLE
The Role of Positivity and Connectivityin the Performance of Business Teams
A Nonlinear Dynamics Model
MARCIAL LOSADAMeta Learning
EMILY HEAPHYUniversity of Michigan Business School
Connectivity, the control parameter in a nonlinear dynamics model of team performance ismathematically linked to the ratio of positivity to negativity (P/N) in team interaction. Byknowing the P/N ratio it is possible to run the nonlinear dynamics model that will portraywhat types of dynamics are possible for a team. These dynamics are of three types: pointattractor, limit cycle, and complexor (complex order, or “chaotic” in the mathematicalsense). Low performance teams end up in point attractor dynamics, medium perfomanceteams in limit cycle dynamics, and high performance teams in complexor dynamics.
Keywords: positivity; connectivity; team performance; nonlinear dynamics
Positive organizational scholars have made an explicit call for the use of non-linear models stating that their field “is especially interested in the nonlinearpositive dynamics . . . that are frequently associated with positive organizationalphenomena” (Cameron, Dutton, & Quinn, 2003, pp. 4-5). This article answersthis call by showing how a nonlinear dynamics model, the meta learning (ML)model, developed and validated against empirical time series data of businessteams by Losada (1999), can be used to link the positivity/negativity ratio (P/N)of a team with its connectivity, the control parameter in the ML model. P/N wasobtained by coding the verbal communication of the team in terms of approvingversus disapproving statements. In the ML model, positivity and negativityoperate as powerful feedback systems: negativity dampens deviations fromsome standard, while positivity acts as amplifying or reinforcing feedback thatexpands behavior. We will demonstrate how these P/N ratios determine the
740
Authors’ Note: We thank Kim Cameron, Arran Caza, Barbara Fredrickson, Giovanna Morchio,Ryan Quinn, and two anonymous reviewers for valuable comments on an earlier draft.
AMERICAN BEHAVIORAL SCIENTIST, Vol. 47 No. 6, February 2004 740-765DOI: 10.1177/0002764203260208© 2004 Sage Publications
at OhioLink on March 11, 2009 http://abs.sagepub.comDownloaded from

types of dynamics possible for a team. By running the ML model, one canobserve that different levels of connectivity create different nonlinear dynamicsthat, in turn, are associated with different levels of performance in businessteams. Hence, by making explicit the relationship between P/N and connectiv-ity, we will show that P/N can also be associated with the performance of theseteams. This finding has important implications for the emerging field of positiveorganizational scholarship. In addition, the advantage of using P/N as a proxyfor connectivity is that measures of P/N are much easier to generate than themeasures of connectivity used in the ML model. We will define these measureslater in the article, after providing the necessary context.
What is it that nonlinear dynamics models can contribute to our understand-ing of teams in organizations? Furthermore, what do they contribute to ourunderstanding of the impact of P/N in the performance of teams? Drawing on asubstantial literature in organizational and management theory, Stacey (1996)established that teams in particular and organizations in general are nonlinearfeedback networks that are continuously involved in ongoing processes of posi-tive and negative feedback. These networks cannot be fully understood usinglinear models because linear models fail to capture the complex dynamics inher-ent in these strong interaction processes that prevail in teams and organizations.One of the basic assumptions of linearity is that there is proportionality betweenthe input and output of a system. Mathematically, this is expressed by sayingthat the superposition principle applies, which means that the sum of the parts isequal to the whole. This is only possible if there is no interaction among the parts(i.e., the parts are independent).
Let us address this interaction issue by a means of a metaphor. Imagine thatwe are trying to understand the complex structure of a piece of music by Bach(see Figure 1) with the purpose of creating a variation. The “parts” in this musicare the different notes that comprise the score. If we use a linear approach,assuming that the superposition principle applies and, consequently, the “parts”are independent, we can try to address the problem by figuring out what are theprincipal components of this piece. So we proceed to sum the different notes andgroup them by categories, as we actually did in Figure 2. Now, how did that con-tribute to our goal of creating a variation on this piece? We learned that the prin-cipal components are a lot of Ds, B-flats, and Gs, which is a characteristic of anycomposition in G minor. We know what the principal components are, but we donot know anything about the relations, the connectivity, among these compo-nents. We missed the most essential characteristic of this piece of music, or ofany work of art, or any complex phenomenon in general: It is the interactionamong the parts, their connectivity, that is essential to our understanding of anyphenomenon whose complexity cannot be fully apprehended by a linearapproximation. This is something that Lao Tzu knew more than 2,500 years agowhen he said, “nonlinearity begets completeness; misjudgment createslinearity” (Lao Tzu, circa 600 BC, quoted in Tong, 1990, p. 1).
Losada, Heaphy / POSITIVITY AND CONNECTIVITY 741
at OhioLink on March 11, 2009 http://abs.sagepub.comDownloaded from

Does a nonlinear approach provide a better way to create a musical variation?The answer was provided by Dabby (1996), an engineer and musician fromMIT, who was able to create variations on music by Bach (and other composers)by utilizing a set of nonlinear differential equations that generate a phase spacetrajectory known as the Lorenz attractor. She used this attractor to map the origi-nal score into it and then changed the initial conditions in order to have a differ-ent set of trajectories in phase space while still preserving the overall dynamic
742 AMERICAN BEHAVIORAL SCIENTIST
Figure 1
at OhioLink on March 11, 2009 http://abs.sagepub.comDownloaded from

structure of the attractor (thus keeping the essence of Bach music). The resultwas a variation that professional musicians recognized as a variation of music byBach. Interestingly, the nonlinear differential equations that underlie the MLmodel belong to the same set of equations that Dabby used. These equations arewidely used across many scientific disciplines and are known as the Lorenz sys-tem (Thompson & Stewart, 1986) or Lorenz equations (Strogatz, 1994). LikeDabby’s application of the Lorenz equations to music, we can map the complexinterdependencies of team dynamics into the ML model.
In organizational studies, nonlinear dynamics is just beginning to enter theliterature. To the extent that nonlinear dynamics has been used, it has beenapplied more as a metaphor than as a method (Daneke, 1999; Lumley 1997) and
Losada, Heaphy / POSITIVITY AND CONNECTIVITY 743
Figure 2
at OhioLink on March 11, 2009 http://abs.sagepub.comDownloaded from

at the organizational level (Stacey, 1992, 1996; Thiétart & Forgues, 1995), notthe individual or group level. Complexity theorists, however, have realized theappropriateness and potential of nonlinear dynamics to understanding organiza-tional systems, including high-performing teams.
Much of today’s literature on high-performing teams seeks explanations . . . interms of linear causal relationships. Such an approach is exposed to error. . . . Newconceptual models are needed which can provide deeper insights. . . . Nonlinearmodels . . . appear to be prime candidates to open the door to more insightful waysof perceiving and managing organizations. (Lumley, 1997, pp. 14-15)
The second question (What do nonlinear models contribute to our under-standing of the impact of P/N on the performance of teams?) is the guidingtheme and main purpose of this article. To answer this question we will have toprovide some context about the previous work of the first author (Losada, 1999)and then we will be able to systematically show the links that exist betweenconnectivity and P/N.
METHODS AND DATA FROM CAPTURE LAB
We coded the verbal communication among team members along three bipo-lar dimensions, positivity/negativity, inquiry/advocacy, and other/self. By cod-ing the verbal communication of teams along these dimensions, we capturedhow positivity and negativity interact as powerful feedback systems to generatedifferent emotional spaces. Emotional spaces are created by the P/N ratios: highratios create expansive emotional spaces and low ratios create restrictive emo-tional spaces (Losada, 1999). Although some previous research has demon-strated that affect is related to performance (Brief & Weiss, 2002), much of thisresearch has looked at affect as a trait, and evaluated performance at the individ-ual level (Staw & Barsade, 1993). We use the ML model to demonstrate how theemotional dynamics generated by P/N ratios differentiate teams into high,medium, and low performance levels.
The ML model was developed out of the time series generated by observing60 strategic business unit (SBU) management teams from a large informationprocessing corporation. These teams were observed in the Capture Lab (a com-puterized lab especially designed for team research) while developing theirannual strategic plans. These SBU teams were selected on the basis of havingcomplete performance records provided by their company. Each team consistedof eight people. The first step in the data collection was the coding and qualita-tive observations of team meetings. Then a time series analysis of the data wasconducted. Coders were primarily University of Michigan students, trained bythe first author, to code the speech acts of the group. A speech act is a verbalutterance that, if written, would be separated by a period; in other words, a
744 AMERICAN BEHAVIORAL SCIENTIST
at OhioLink on March 11, 2009 http://abs.sagepub.comDownloaded from

typical speech act is a sentence or phrase. Each meeting was coded by three peo-ple. The interrater reliability coefficient was, on average, .97.
BIPOLAR DIMENSIONS
A speech act was coded as “positive” if the person speaking showed support,encouragement or appreciation (e.g., “that’s a good idea”), and it was coded as“negative” if the person speaking showed disapproval (e.g., “that’s about thedumbest thing I ever heard”), sarcasm, or cynicism. A speech act was coded as“inquiry” if it involved a question aimed at exploring and examining a positionand as “advocacy” if it involved arguing in favor of the speaker’s viewpoint. Aspeech act was coded as “self” if it referred to the person speaking or to the grouppresent at the lab or to the company the person speaking belonged, and it wascoded as “other” if the reference was to a person or group outside the company towhich the person speaking belonged. The coders used a software system calledGroupAnalyzer1 (Losada & Markovitch, 1990), which labeled each code with atime stamp. Data generated by the coders were later aggregated in one-minuteintervals. Time series analyses, including the auto-correlation and cross-correlation function, were performed on these aggregated data.
Positivity/negativity was used because of its high eliciting power as well asclarity for coding and feedback. It was an important dimension in Bales’s earlyand later work on small group processes (Bales, 1950, Bales & Cohen, 1979).Echeverría (1994) argues that positivity generates expansive emotional spacesthat open possibilities for action, whereas negativity creates restricted emotionalspaces that close possibilities for action. He writes,
Depending on the emotional space we are in, certain actions are possible and oth-ers are not—some possibilities open for us, others close. . . . In a state of enthusi-asm, our horizon of possible actions is widened. . . . Fear narrows the space of whatis possible. . . . Emotional spaces not only contain the actions that are possible,they also modulate the way in which we carry out those actions. (Echeverría, 1994,chap. 8)
This is similar to Fredrickson’s (1998) argument that positive emotionsbroaden thought-action repertoires and build durable physical, intellectual, andsocial resources. Most psychological and organizational research examines theeffects of either positive or negative emotions (Baumeister, Bratslavsky,Finkenauer, & Vohs, 2001; Fredrickson, 1998; Staw, Sutton, & Pelled, 1994).We avoid these dichotomies (Rathunde, 2000) and look at the effects of differentratios of positivity to negativity on the performance of business teams. This par-allels emotion researchers robust finding that valence (positive/negative dimen-sion) is the best discriminator between emotional states (Larsen & Diener, 1992;Smith & Ellsworth, 1985). Gottman found that married couples who did not
Losada, Heaphy / POSITIVITY AND CONNECTIVITY 745
at OhioLink on March 11, 2009 http://abs.sagepub.comDownloaded from
maintain a high ratio of positive to negative verbal and nonverbal behavior andexpressions were unable to sustain their relationship (Gottman, 1994; Ryan,Gottman, Murray, Carrère, & Swanson, 2000). At the organizational level, thework of Stacey (1992, 1996) has shown that it is the nonlinear interplay betweenpositive and negative feedback processes that characterizes an organizationcapacity to deal with increasingly complex environments.
Inquiry/advocacy was also chosen because of its eliciting power, and clarityfor coding and feedback. It is prominent in the work of Argyris and Schön(1978), as well as in Senge (1990) and Senge, Roberts, Ross, Smith, & Kleiner,(1994). According to these authors, balancing inquiry and advocacy should leadto more effective action.
Other/self was also a highly eliciting variable that in addition was easy tocode and provided clear and powerful feedback to participants. It has deepphilosophical roots described in Buber’s (1970) I and Thou, and has been devel-oped extensively in social psychology by Aron and his associates (Aron &Fraley, 1999). Csikszentmihaly and Rathunde (1998) refer to the balancebetween other and self when they describe the “complex person” as “one whohas the self-regulative capacity to move toward optimal experiences by negotiat-ing a better fit or synchrony of self with environment” (p. 651). Organizationalresearch tells us that this dimension plays a fundamental role in strategic plan-ning, where “environmental scan” and “internal scrutiny” are key components.Environmental scan leads to the identification of opportunities and threats,whereas internal scrutiny leads to the recognition of basic strengths and weak-nesses. One would expect high performance teams to be balanced in this dimen-sion (Hax & Majluf, 1991). Previous research has shown that teams with thegreatest orientation to their external environment had the highest performanceratings over time (Ancona, 1990).
The sample of 60 business teams was subdivided into three performance lev-els based on extensive business performance data. These data consisted of mea-sures of profitability (SBU profit and loss statements), customer satisfaction(surveys and interviews) and 360-degree evaluations (assessments of the teammembers by superiors, peers, and subordinates). By using standardized data,teams were categorized into high, medium, and low performance depending onthe levels achieved on these three criteria. A team was assigned to the high per-formance category if it achieved high ratings in all three measures. A team wasassigned to the low performance category if it had low ratings in all three mea-sures. Medium performance teams did not achieve ratings that were either con-sistently high or consistently low. The coders were blind to the performancelevel of the teams at the time of observation. Performance data were used to cate-gorize the teams only after their meeting had been observed and coded. Therewere 15 high performance teams, 26 medium performance teams, and 19 lowperformance teams.
746 AMERICAN BEHAVIORAL SCIENTIST
at OhioLink on March 11, 2009 http://abs.sagepub.comDownloaded from
FINDINGS FROM CAPTURE LAB
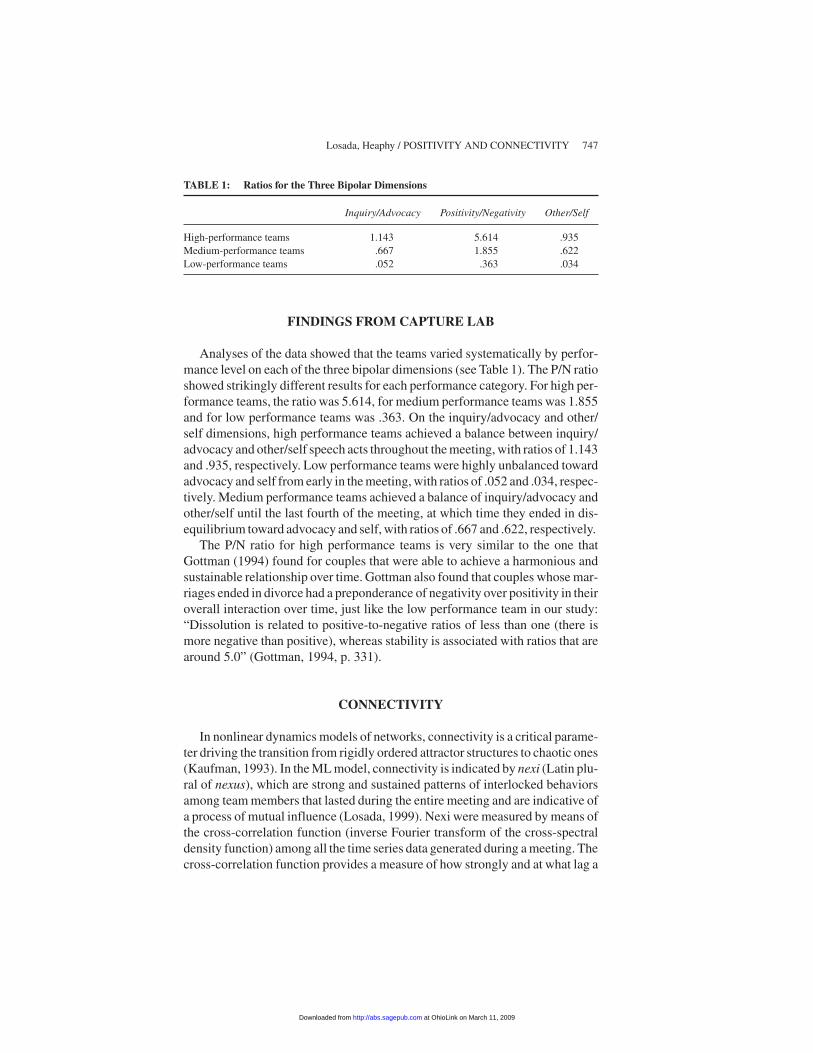
Analyses of the data showed that the teams varied systematically by perfor-mance level on each of the three bipolar dimensions (see Table 1). The P/N ratioshowed strikingly different results for each performance category. For high per-formance teams, the ratio was 5.614, for medium performance teams was 1.855and for low performance teams was .363. On the inquiry/advocacy and other/self dimensions, high performance teams achieved a balance between inquiry/advocacy and other/self speech acts throughout the meeting, with ratios of 1.143and .935, respectively. Low performance teams were highly unbalanced towardadvocacy and self from early in the meeting, with ratios of .052 and .034, respec-tively. Medium performance teams achieved a balance of inquiry/advocacy andother/self until the last fourth of the meeting, at which time they ended in dis-equilibrium toward advocacy and self, with ratios of .667 and .622, respectively.
The P/N ratio for high performance teams is very similar to the one thatGottman (1994) found for couples that were able to achieve a harmonious andsustainable relationship over time. Gottman also found that couples whose mar-riages ended in divorce had a preponderance of negativity over positivity in theiroverall interaction over time, just like the low performance team in our study:“Dissolution is related to positive-to-negative ratios of less than one (there ismore negative than positive), whereas stability is associated with ratios that arearound 5.0” (Gottman, 1994, p. 331).
CONNECTIVITY
In nonlinear dynamics models of networks, connectivity is a critical parame-ter driving the transition from rigidly ordered attractor structures to chaotic ones(Kaufman, 1993). In the ML model, connectivity is indicated by nexi (Latin plu-ral of nexus), which are strong and sustained patterns of interlocked behaviorsamong team members that lasted during the entire meeting and are indicative ofa process of mutual influence (Losada, 1999). Nexi were measured by means ofthe cross-correlation function (inverse Fourier transform of the cross-spectraldensity function) among all the time series data generated during a meeting. Thecross-correlation function provides a measure of how strongly and at what lag a
Losada, Heaphy / POSITIVITY AND CONNECTIVITY 747
TABLE 1: Ratios for the Three Bipolar Dimensions
Inquiry/Advocacy Positivity/Negativity Other/Self
High-performance teams 1.143 5.614 .935Medium-performance teams .667 1.855 .622Low-performance teams .052 .363 .034
at OhioLink on March 11, 2009 http://abs.sagepub.comDownloaded from
particular behavior of one person over time is interlocked with the behavior ofanother person. Only cross-correlations significant at the p ≤ .001 level wereused. These strong cross-correlations are the nexi that a team is able to generateand represent the level of connectivity of the team.2
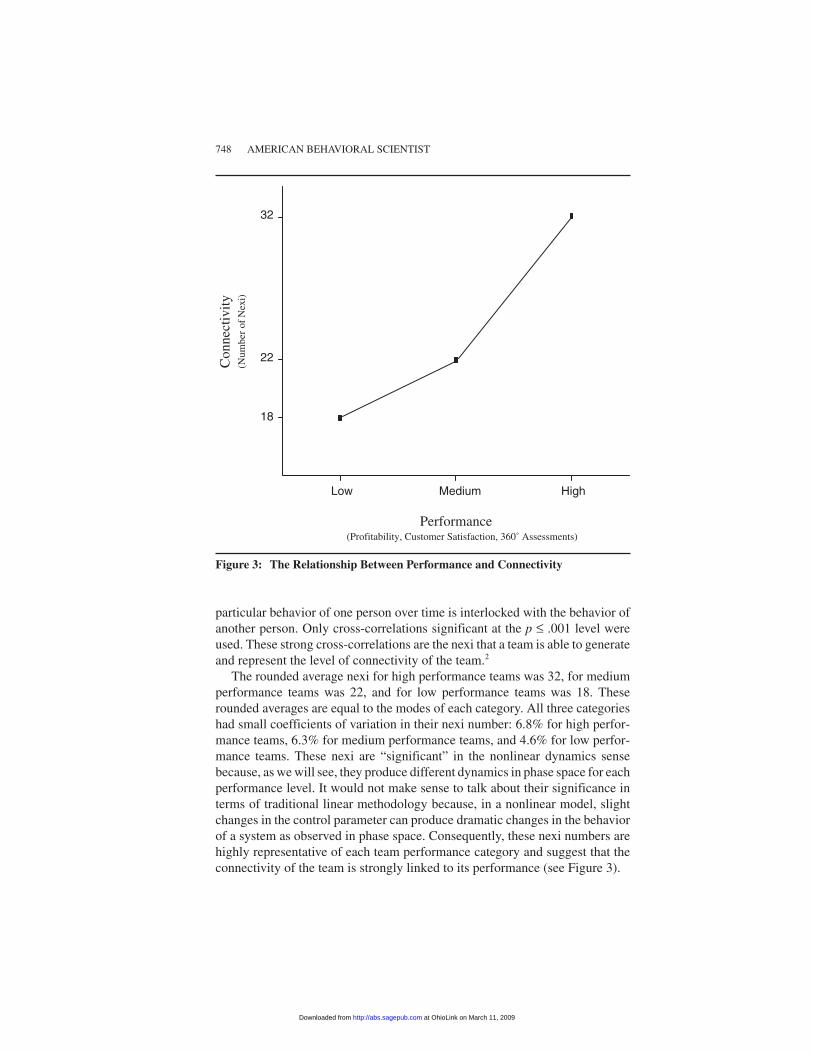
The rounded average nexi for high performance teams was 32, for mediumperformance teams was 22, and for low performance teams was 18. Theserounded averages are equal to the modes of each category. All three categorieshad small coefficients of variation in their nexi number: 6.8% for high perfor-mance teams, 6.3% for medium performance teams, and 4.6% for low perfor-mance teams. These nexi are “significant” in the nonlinear dynamics sensebecause, as we will see, they produce different dynamics in phase space for eachperformance level. It would not make sense to talk about their significance interms of traditional linear methodology because, in a nonlinear model, slightchanges in the control parameter can produce dramatic changes in the behaviorof a system as observed in phase space. Consequently, these nexi numbers arehighly representative of each team performance category and suggest that theconnectivity of the team is strongly linked to its performance (see Figure 3).
748 AMERICAN BEHAVIORAL SCIENTIST
Performance
Con
nect
ivity
(Num
ber
of N
exi)
32
22
18
Low Medium High
(Profitability, Customer Satisfaction, 360˚ Assessments)
Figure 3: The Relationship Between Performance and Connectivity
at OhioLink on March 11, 2009 http://abs.sagepub.comDownloaded from

QUALITATIVE OBSERVATIONS
Qualitative observations of the teams showed that high performance teamswere characterized by an atmosphere of buoyancy that lasted during the wholemeeting. By showing appreciation and encouragement to other members of theteam, they created emotional spaces that were expansive and opened possibili-ties for action and creativity as shown in their strategic mission statements. Instark contrast, low performance teams operated in very restrictive emotionalspaces created by lack of mutual support and enthusiasm, often in an atmo-sphere charged with distrust and cynicism. The medium performance teamsgenerated emotional spaces that were not as restrictive as the low performanceteams, but definitively not as expansive as the high performance teams. They didnot show the distrust and cynicism of low performance teams, but they also didnot manifest the mutual support and enthusiasm characteristic of highperformance teams.
NONLINEAR DYNAMICS MODELING
When time series data reveal strong interactions, as the existence of nexibetween team members did, the best way to model such interactions appropri-ately is by means of a nonlinear dynamics model. The purpose of the nonlineardynamics model is to enable us to understand what dynamics result from the dif-ferent connectivity levels of the teams. As described earlier, Echeverría’s (1994)concept of emotional space and Fredrickson’s (1998) broaden-and-build theorywould predict that greater positivity would broaden possible action, whereasmore negativity would narrow it. A nonlinear model will enable us to look at thesystematic effects of the P/N ratio on the system.
BACKGROUND ON NONLINEAR DYNAMICS MODELING
Phase space is a mathematical space spanned by the number of dimensionsin the system. In this case, the three bipolar variables represent three dimensionsin the system we are modeling. The control parameter is a critical component inthe sense that by varying it, and keeping all other parameters constant, one canobtain different configurations in phase space that will portray the dynamics ofthe team. State variables are the variables entered into the model. The threebipolar dimensions are the state variables for this model.
To build a nonlinear dynamics model, one must select state variables that willhave well-defined structures in phase space; if the variables entered into themodel are not critical to the model’s functioning (e.g., if any of the bipolardimensions were not significant) or if the patterns themselves are random (e.g.,there is no systematic differences in the speech acts of teams), no structure will
Losada, Heaphy / POSITIVITY AND CONNECTIVITY 749
at OhioLink on March 11, 2009 http://abs.sagepub.comDownloaded from

be generated. Nowak and Vallacher (1998) describe this property of nonlineardynamics models in the following passage:
If the selected variables are irrelevant to the dynamics of the system, then no struc-ture . . . appears, which is an indication that one should repeat this procedure with adifferent set of variables. The appearance of a well-defined pattern, on the otherhand, is a clear indication that one’s choice of variables is appropriate. The shapeof this pattern, meanwhile, provides insight into the relationships among the cho-sen variables. (p. 69)
In nonlinear dynamics, there are four different types of structure (Barton,1994; Ruelle, 1989). These structures are known as attractors. Mathematically,attractors represent the asymptotic tendency of the trajectories in phase space. Innonmathematical terms, attractors are like a gravitational field pulling behaviorstoward it. The attractors vary in the degree to which they are rigid or flexible.The most rigid is the fixed-point attractor, followed by the limit cycle or periodicattractor, the torus or quasi-periodic attractor, and finally, the most flexible is thechaotic attractor. We have coined the term complexor to describe chaotic attrac-tors. As we will see, chaotic attractors are important to our model, and wewanted a term that would accurately represent the nature of chaotic attractors.The common usage of the adjective chaotic implies disorder, which is the oppo-site of what a chaotic attractor represents. Disorder is produced by randomness.In contrast, all chaotic attractors are, by definition, deterministic. Mathemati-cally, the complexity of a chaotic attractor is given, among other things, by itsfractal nature, which is not observed in the other types of attractors. Thus, theword complexor is a contraction of two words: COMPLEX ORder. This moreaccurately portrays the structure and dynamics of what were originally namedchaotic attractors.
A sense of the explanatory power of complexors is given by Goldberger’s(Goldberger & Rigney, 1990) research at the Harvard Medical School. Thisresearch casts new light in our understanding of health and disease by showingthat disease can be considered as decomplexification (i.e., the onsetting of rigidorder such as limit cycles or fixed-point attractors), whereas health is associatedwith chaotic dynamics:
Chaotic dynamics appear to underlie the variability and adaptability necessary forresponding to a fluctuating environment . . . It is, to a large extent, the periodicitiesand patterns, the loss of chaos, in pathology that allow physicians to identify andclassify many features of the abnormal appearance and behavior of theirpatients . . . Health with its broadband spectrum and strange attractor dynamics is,necessarily, much harder to classify. (Goldberger & Rigney, 1990, p. 30)
In organization studies, the work of Brown and Eisenhardt (1997, p. 29) reflectssimilar ideas about complexors when they argue that “systems, which stay con-stantly poised between order and disorder, exhibit the most prolific, complexand continuous change.”
750 AMERICAN BEHAVIORAL SCIENTIST
at OhioLink on March 11, 2009 http://abs.sagepub.comDownloaded from

META LEARNING MODEL
The nonlinear differential equations on which the ML model was built can befound in Losada (1999). Here, we illustrate the ML model graphically and showhow to interpret the connections among the control parameter and state vari-ables of the model, as well as the resulting dynamics that are linked to each per-formance category.
Meta learning is defined as the “ability of a team to dissolve attractors thatclose possibilities for effective action and to evolve attractors that open possibil-ities for effective action” (Losada, 1999, p. 190). Dissolving attractors is a pro-cess that has similar implications to what Fredrickson and Levenson’s (1998)call the “undoing hypothesis”—positive emotions undo the effect of negativeemotions (see also Fredrickson, Mancuso, Branigan, & Tugade, 2000). Evolv-ing attractors that open possibilities for effective action is a process similar toFredrickson’s “broaden-and-build” theory of positive emotions (Fredrickson,1998, 2001). Fixed-point and limit cycle attractors are very rigid and stabledynamical structures that are hard to dissolve. By “meta learning,” teams areable to transcend these limiting attractors and reach the dynamics ofcomplexors. Complexors have a very different type of stability. The stability ofcomplexors is dynamic, flexible, and innovating (trajectories in a complexornever repeat themselves). This important characteristic of complexors allowshigh performing teams to respond adaptively and innovatively to continuouslychanging and challenging environmental demands.
Figure 4 shows that the control parameter of the ML model is connectivity,which is characterized by the average number of nexi found at each performancelevel. The effects of connectivity on the equilibrium structure of the three statevariables is described below.
When connectivity is high (nexi = 32), a dynamical balance is observedbetween inquiry/advocacy and other/self as well as a higher ratio of positivity tonegativity. When connectivity is at a medium level (nexi = 22), the ratio ofpositivity to negativity is much lower than for high performance teams, andthere is an unbalance toward advocacy and self. When connectivity is low (nexi= 18) there is a preponderance of negativity over positivity, and a very definitiveunbalance toward advocacy and self.
These different equilibrium states lead to different dynamics in phase space(shown in Figure 5). The equilibrium states generated by high connectivity oneach of the state variables leads to complexor dynamics, while medium connec-tivity and its associated equilibria in the state variables leads to limit cycledynamics. Low connectivity and its corresponding equilibria leads to fixed-point dynamics. Each one of these dynamics, in turn, is associated with differentperformance levels: point attractor dynamics lead to low performance, limitcycle attractor dynamics lead to medium performance and complexors lead tohigh performance.
Losada, Heaphy / POSITIVITY AND CONNECTIVITY 751
at OhioLink on March 11, 2009 http://abs.sagepub.comDownloaded from
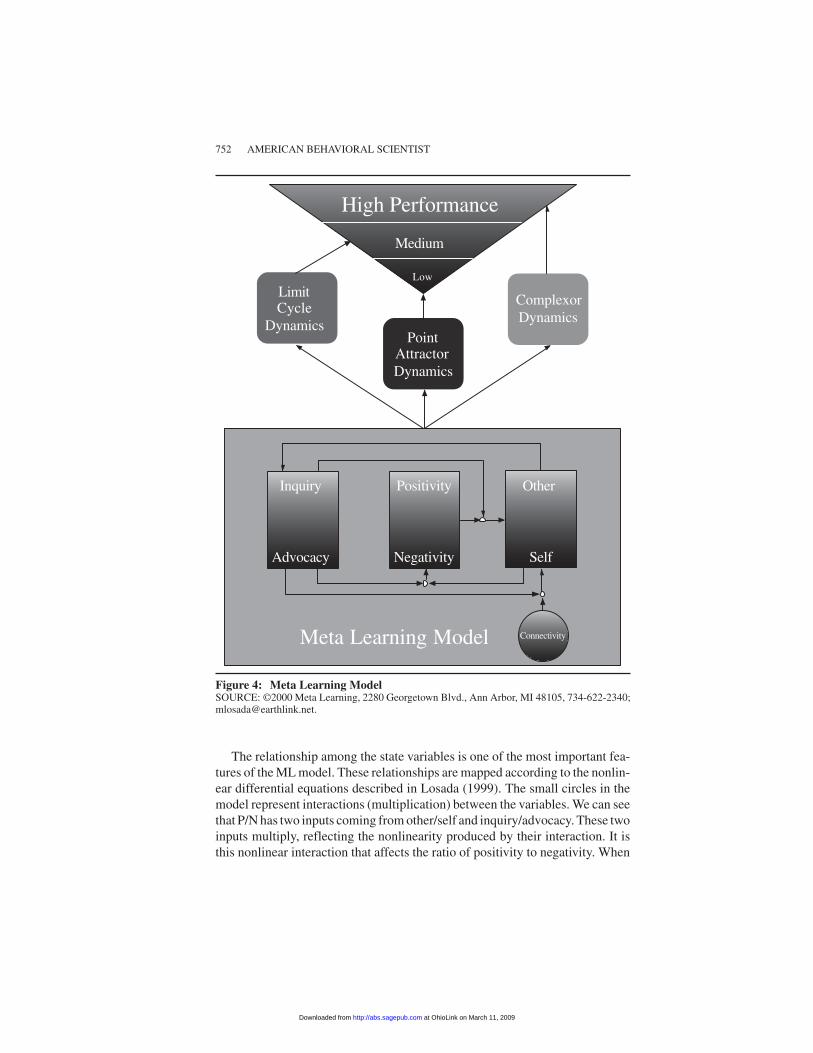
The relationship among the state variables is one of the most important fea-tures of the ML model. These relationships are mapped according to the nonlin-ear differential equations described in Losada (1999). The small circles in themodel represent interactions (multiplication) between the variables. We can seethat P/N has two inputs coming from other/self and inquiry/advocacy. These twoinputs multiply, reflecting the nonlinearity produced by their interaction. It isthis nonlinear interaction that affects the ratio of positivity to negativity. When
752 AMERICAN BEHAVIORAL SCIENTIST
Connectivity
Inquiry
Advocacy
Positivity
Negativity
Other
Self
Meta Learning Model
High Performance
Medium
Low Limit Cycle
Dynamics Complexor Dynamics
Point Attractor Dynamics
Figure 4: Meta Learning ModelSOURCE: ©2000 Meta Learning, 2280 Georgetown Blvd., Ann Arbor, MI 48105, 734-622-2340;[email protected].
at OhioLink on March 11, 2009 http://abs.sagepub.comDownloaded from

P/N is high, it generates an expansive emotional space, and when it is low, it gen-erates a restrictive emotional space.
Turning to the inputs and outputs of inquiry/advocacy, we can see that its inputcomes from other/self, meaning that the balance between inquiry/advocacy willdepend upon the balance achieved between other/self. Thus, for example, to dopowerful inquiry, we need to put ourselves sympathetically in the place of theperson to whom we are asking the question. There has to be as much interest inthe question we are asking as in the answer we are receiving. If not, inquiry canbe motivated by a desire to show off or to embarrass the other person, in whichcase it will not create a nexus with that team member. The outputs of inquiry/advocacy go to the input and output of positivity/negativity via a nonlinear
Losada, Heaphy / POSITIVITY AND CONNECTIVITY 753
Figure 5: Attractor Dynamics for High-, Medium-, and Low-Performing Teams
at OhioLink on March 11, 2009 http://abs.sagepub.comDownloaded from

interaction, which will create complex and subtle effects both in the emotionalspace generated by P/N and in how that space will affect the balance betweenother/self.
The control parameter, connectivity, enters the ML model via other/self afterinteracting with the inquiry/advocacy’s equilibria. Other/self also receives anonlinear input from the interaction of inquiry/advocacy with positivity/negativity. That is, the balance between other/self will be affected by the emo-tional space generated as the pattern of inquiry/advocacy interacts with the bal-ance achieved between positivity and negativity.
RUNNING THE META LEARNING MODEL:PHASE SPACE FINDINGS
A nonlinear dynamics model does not show cause and effect in a simple, lin-ear way. The “result” of a nonlinear dynamics model is a path in phase space thatreveals the dynamics of the system, not, as social scientists are accustomed toseeing, a regression coefficient revealing the slope of a line. When we run theML model, we get the attractor dynamics in phase space, shown in Figure 5. Thetop graphs represent the dynamics of high performance teams; the middlegraphs, the dynamics of medium performance teams; the bottom graphs cor-respond to low performance teams. The graphs on the left refer to inquiry/advocacy (x-axis) versus emotional space (y-axis). The graphs on the right cor-respond to other/self (x-axis) versus emotional space (y-axis). On the x-axis ofthe left-hand graphs, inquiry is to the left of the middle line and advocacy to theright side. On the x-axis of the right-side graphs, other is to the left side of themiddle line and self to the right side.
We know that emotional space is generated by the P/N ratio. The scale of they-axis does not represent directly the P/N ratio, but the outcome of the initialvalue (16) entered into the equation to eliminate the transient (this is a standardprocedure in nonlinear dynamics and in modeling in general) and the multipli-cation by the constant 8/3 (a constant used in all Lorenz system models). Byintroducing the initial value and multiplying by a constant we are creating an ini-tial emotional space that will stay there increased or decreased by the P/N ratio.
The top two graphs show that high performance teams are able to generatecomplexors in their dynamical interaction.3 It is interesting to note thatcomplexors can be generated only within a system where positive feedback isstronger than negative feedback. Both are needed because, without negativefeedback, the trajectories in phase space would be out of bounds, meaning thatthere would be no structure, but just scattered trajectories. On the other hand, ifnegative feedback were prevalent, the system would rapidly converge to a pointattractor or a limit cycle, depending on the strength of the negative feedback.High performance teams do not get trapped into limiting dynamics such as limitcycles and fixed-points because they are able to maintain a high ratio of
754 AMERICAN BEHAVIORAL SCIENTIST
at OhioLink on March 11, 2009 http://abs.sagepub.comDownloaded from

positivity to negativity. They also maintain an equilibrium between inquiry andadvocacy as well as between other and self. This dynamical equilibrium isvalidated by the empirical ratios reported in Table 1.
By contrast, the reader can observe that medium performance teams (middlegraphs) eventually settle into limit cycle attractors because there is not enoughpositivity in their interaction. By focusing on the right-hand side of each middlegraph, where the typical trajectory of a limit cycle is traced, one can readily seethis. These unbalanced dynamics are validated by the empirical ratios reportedin Table 1.
Because of the prevalence of negativity over positivity, low performanceteams have much poorer dynamics than the other teams: they settle very rapidlyinto a fixed-point attractor that is located in the advocacy side (bottom leftgraph) and self side (bottom right graph). Again, the unbalances of thesedynamics are validated by the empirical ratios reported in Table 1.
If we now look at all the phase space dynamics from bottom to top (i.e., fromrestrictive emotional spaces with low P/N ratios to expansive emotional spaceswith high P/N ratios) we can readily see a broadening pattern that supportsFredrickson’s theory that positive emotions broaden behavioral repertoires.That is, teams enact a broader range of behaviors at each successive level, fromlow to high performance teams (Fredrickson, 1998, 2001).
LINKING EMOTIONAL SPACE AND CONNECTIVITY
We now address the question of whether emotional space is linked to connec-tivity and how emotional space is specifically related to the positivity tonegativity ratio. To examine these relationships we need to introduce the notionof attractor focus.4 In Figure 3, the top four graphs, right and left, show a blankspace approximately in the middle of the attractor in each of its wings. Theseblank spaces are like the eye of a hurricane. Their centroids are the foci of theattractor. They keep the trajectories within bounds. If there were no foci wewould not have an attractor creating the dynamical structure we observe in thesefigures. In the bottom two graphs, for low performance teams, the foci are thepoint attractors toward which the trajectories very rapidly settle.
If we project all these foci over the y-axis (emotional space) we see that thenumbers we obtain are indeed very meaningful and illustrate how emotionalspace is linked to connectivity. The number obtained on the y-axis for high per-formance teams (both for inquiry/advocacy and other/self) is 31, for mediumperformance teams is 21, and for low performance teams is 17. These numbersare exactly the number of nexi minus one. Thus, we can now introduce theequation
E = c – 1, (1)
Losada, Heaphy / POSITIVITY AND CONNECTIVITY 755
at OhioLink on March 11, 2009 http://abs.sagepub.comDownloaded from

where E is emotional space, and c is connectivity (represented by the number ofnexi). Therefore, there is a direct and measurable relationship between emo-tional space and connectivity, as represented by the ML model. The conse-quences of this relationship are straightforward: Because connectivity is thecontrol parameter in the ML model, we can equally say that emotional spaceplays a crucial and determinant role in differentiating high-performance teamsfrom medium- and low-performance teams.
We can project emotional space by using the emotional space number (E = c– 1) as the radius of a circle over a plane with inquiry/advocacy and other/self asthe coordinates (see Figure 6). This alternative representation to a phase spacediagram allows us to visualize the emotional space areas for each performancelevel in relation to inquiry/advocacy and other-self in a single graph. The for-mula for calculating the area of a circle is r2; therefore we can represent emo-tional space as the area of a circle by πE2. For high-performance teams, the area
756 AMERICAN BEHAVIORAL SCIENTIST
OTHER
SELF
High Performance
Medium Performance
Low Performance
P/N = 5.625
P/N = 1.875
P/N = .375
INQ
UIR
Y
AD
VO
CA
CY
Figure 6: Emotional Space Projected Over Inquiry/Advocacy and Other/Self
at OhioLink on March 11, 2009 http://abs.sagepub.comDownloaded from

is 3,019.07; medium performance is 1,385.44, and low performance is 907.92.Looking at these values, we can see that high performance teams create emo-tional spaces with areas that are approximately three times larger than low per-formance teams, and approximately twice those of medium performance teams.Medium performance teams create areas that are about half as large as low per-formance teams. Notice also that high-performance teams are centered rightat the intersection of inquiry/advocacy and other/self, medium teams are off-centered toward other and self, whereas low-performance teams are definitivelycentered in self and advocacy.
LINKING EMOTIONAL SPACE AND P/N RATIOS
Examining the relationship between emotional space and P/N ratios providesfurther validation of the ML model by showing the relationship between theoriginal time series data and the nonlinear dynamics model. When running theML model initial values as well as scaling constants must be assigned. The ini-tial values eliminate transients, which represent features of the model that areneither essential nor lasting. The initial value for positivity/negativity is 16. Theconstants are used to scale the data, namely to be able to see the dynamics moreclearly. The structure of this model resembles a Lorenz attractor, a widely usedset of nonlinear differential equations, and scholars who use Lorenz attractorsagree to use 8/3 as a constant, in order to be able to compare findings acrossmodels and dynamics in many disciplines by just varying the control parameter.
With this background information, we can now calculate the P/N ratio. Toderive the P/N ratio from the attractor’s foci, we subtract the initial value andmultiply it by the inverse of the scaling constant (0.375). For example, for highperformance teams, we start with 31, subtract 16, and multiply by 0.375. Theresult is 5.625, which is very close to 5.614, the result obtained by looking at theoriginal time series data. We can now introduce the equation that allows us tocalculate the positivity to negativity ratio (P/N) from emotional space (E):
P/N = (E – i) b–1 (2)
where E is emotional space, i is the initial value of the positivity/negativity statevariable (equal to 16), and b–1 is the inverse scaling constant (equal to 0.375). Ifwe apply this formula to the E numbers for medium (21) and low-performanceteams (17), we obtain results that are equally close to the ones obtained by look-ing directly at the time series data, thus further validating the ML model (seeTable 2).
Losada, Heaphy / POSITIVITY AND CONNECTIVITY 757
at OhioLink on March 11, 2009 http://abs.sagepub.comDownloaded from

LINKING CONNECTIVITY AND P/N RATIOS
The final link we will make is between connectivity and P/N ratios. To dothis, we examine the effects of connectivity and P/N ratios separately on perfor-mance. First, we calculate the distances between the P/N ratios in the data gener-ated by the model. The distance between high performance (5.625) and mediumperformance (1.875) is 3.75 (i.e., 10 units of 0.375—the inverse constant of theML model). The distance between medium and low performance is 1.5 (i.e., 4inverse constant units). These distances are equivalent to the distances foundbetween the different performance levels in terms of nexi. So, we can concludethat positivity and connectivity have equivalent distances for each performancecategory.
This is illustrated by plotting the P/N ratios against performance (see Figure7). If we compare Figure 7 with Figure 3 (connectivity vs. performance) therelationship between connectivity and positivity is obvious. We can formalizethe relationship between positivity and connectivity by means of the equation
P/N = (c – i – 1) b–1 (3)
where P/N is the ratio of positivity to negativity, c is connectivity defined by thenumber of nexi, i is the initial value of the positivity/negativity state variable andb–1 is the inverse scaling constant.
Because connectivity is the control parameter in the ML model, we can con-clude that the ratio of positivity to negativity plays a determinant role as well indifferentiating high- from medium- and low-performance teams. Investigatingthis relationship was our main objective, as stated in the introduction.
DISCUSSION
THE POWER OF A RATIO OF P/N IN HUMAN INTERACTION
These analyses demonstrate a rather remarkable finding. Mathematically, wehave shown that the positivity/negativity state variable is as important as
758 AMERICAN BEHAVIORAL SCIENTIST
TABLE 2: Positivity/Negativity Ratios From Time Series and Model
Time Series Data Model Data
High-performance teams 5.614 5.625Medium-performance teams 1.855 1.875Low-performance teams 0.363 0.375
at OhioLink on March 11, 2009 http://abs.sagepub.comDownloaded from

connectivity, the control parameter, in determining the attractors in the nonlin-ear dynamics model. This means that in order to predict team performance, oneonly has to know the ratio of positive to negative interactions to find the nexivalue (connectivity), then run the ML model and find the type of attractordynamics (fixed point, limit cycle, complexor) that, in turn, indicate the level ofperformance associated with each of those particular attractors.
Interestingly, this finding parallels research on positivity and negativity inhuman dyadic interaction and neuroanatomy. On the dyadic level, Gottman’sresearch on married couples has shown that the best predictor of stable mar-riages is the ratio of positive to negative interactions: “In fact, the best discrimi-nation was obtained by a ratio of positive to negative codes” (Gottman, 1994, p.413). Where his “performance” variable was the sustainability and quality of amarital relationship, we found that this same ratio of positive to negative interac-tions is the critical differentiator between high-, medium-, and low-performingteams.
At the neurological level, recent research from the Laboratory of AffectiveNeuroscience proposes that there are two partially separable neural systemslinking neuroanatomy to emotions and affective style (Davidson, 1999).Located in the left prefrontal cortex, the approach system generates positiveaffect and is associated with moving toward a desired goal, whereas the with-drawal system, located in the amygdala and the right prefrontal cortex,
Losada, Heaphy / POSITIVITY AND CONNECTIVITY 759
Performance
5.625
1.875
0.375
Low Medium High
(Profitability, Customer Satisfaction, 360° Assessments)
P/N
Figure 7: Positivity to Negativity Ratios Versus Performance
at OhioLink on March 11, 2009 http://abs.sagepub.comDownloaded from

generates negative affect and is associated with aversive stimulation. An indi-vidual’s typical mood range can be predicted with a high level of accuracy bylooking at the ratio of activity in these two parts of the brain: “The more the ratiotilts to the right, the more unhappy or distressed a person tends to be, whereas themore activity tilts to the left, the more happy and enthusiastic” (Goleman, 2003.p. D5).
In our model, positivity and negativity operate as powerful feedback sys-tems: negativity dampens deviations from some standard, whereas positivityacts as amplifying or reinforcing feedback that expands behavior. The MLmodel demonstrates how these P/N ratios then determine the types of dynamicspossible for a team. When the P/N ratio is high, we get the dynamics ofcomplexors, which leads to high performance. With an inverted ratio in whichthere is more negative to positive interaction, a point attractor develops.
What would happen if the P/N ratio was extremely high, say 100 to 1? Is theresuch a thing as excess positivity? We learn from running the ML model with a P/N = 100, that a limit cycle would develop and the complexor structure would belost. The lesson here is that there can be excessive positivity, in which case ateam can become unrealistically Pollyannaish. By getting themselves locked ina limit cycle of positivity they lose the generating and innovating power of acomplexor. As we have seen, a complexor is generated and sustained by an ade-quate proportion of positivity/negativity where the tension of the polarity ismaintained.
One might wonder why are ratios powerful, and what there is in a ratio that isnot in a subtraction. The answer might be that ratios preserve the proportion ofthe elements in a compound. This is important for bipolar variables where onewants to have some measure of the “tension” inherent in the polarity. Subtrac-tion reduces the compound to one element (if it is a binary compound) and, con-sequently, the tension is lost and, with it, a critical piece of information.
CONNECTIONS, POSITIVITY,AND DURABLE RESOURCES
Underlying the ML model there is a complex interplay among human con-nections, P/N, emotions, and actions. Teams, according to their performancelevel, generated vastly different areas of emotional space depending on theirconnectivity and P/N ratio. In agreement with the theories of both Echeverríaand Fredrickson, expansive emotional spaces generated by high P/N ratiosopened possibilities for effective action. This is the “broaden” part of thebroaden-and-build theory. What is the “build” part? What are the durableresources of these teams? According to the ML model, the durable psychologi-cal and social resources are the strength and quantity of the connections (nexi)among team members. Low and medium performance teams do not haveenough of these resources to reach and sustain the level of performance we
760 AMERICAN BEHAVIORAL SCIENTIST
at OhioLink on March 11, 2009 http://abs.sagepub.comDownloaded from

observe in high performance teams. An important dynamical characteristic ofthese durable resources is that they enable or disable complexor dynamics. Thisfinding points to new research questions regarding how relationships and thequality of connections (Dutton & Heaphy, 2003) affect organizationalprocesses.
CONCLUSION
To have a comprehensive view of all the findings, we have summarized themin Table 3. In this table each of the team performance categories is characterizedby five descriptors: the type of dynamics generated in phase space, the level ofconnectivity achieved, the balanced obtained in terms of inquiry/advocacy, thebalance achieved in terms of other/self, and the emotional space generated bythe P/N ratio.
This table shows that low performance teams have a low level of connectiv-ity, which leads them to get stuck in negativity as well in advocacy and self-absorption. All of this generates the dynamics of a point attractor. Once a teamor an organization settles into the dynamics of point attractors, it is extremelydifficult to exit. Baumeister et al.’s (2001) article titled Bad Is Stronger ThanGood is correct in the sense that a point attractor (where negativity is larger thanpositivity) is an extremely stable and powerful attractor. It is the stabilityachieved by the second law of thermodynamics, when eventually everythingsettles into total homogeneity, an everlasting constant where nothing new everhappens. A point attractor in the time domain is a constant whose archetypicalimage is that of the cardiac monitor in emergency rooms reaching the flat lineaccompanied by the monotone beep that signals death. Organizations and teamswhere point attractors predominate are doomed to die in a chaotically complexworld that demands constant adaptation and innovation.
Losada, Heaphy / POSITIVITY AND CONNECTIVITY 761
TABLE 3: Team Performance Matrix
Inquiry- EmotionalDynamics Connectivity Advocacy Other-Self Space
Highperformance
Complexor High Balanced Balanced ExpansiveP >> N
Mediumperformance
Limit cycle Medium Unbalancedtowardadvocacy
Unbalancedtoward self
RestrictiveP > N
Lowperformance
Fixed point Low Entirely unbal-anced towardself
Entirely unbal-anced towardself
HighlyrestrictiveN > P
at OhioLink on March 11, 2009 http://abs.sagepub.comDownloaded from
Medium-performance teams fare better in the sense that they show an initialcapacity to balance inquiry/advocacy as well as other/self. They also have a P/Nratio in which positivity is slightly larger than negativity. Their connectivity isalso slightly greater than that of low-performance teams. The problem is thatthey are not able to sustain the benefits of these patterns. This is because theirconnectivity and positivity are not high enough to escape the entropic gravita-tional pull of negativity. So they end up in the dynamics of limit cycles withoutever reaching new places. In the end, medium-performance teams finished in thesame place where low-performance teams ended earlier in their interaction:advocacy and self-absorption.
In the Capture Lab sample, 75% of the teams were stuck in either point attrac-tors or limit cycles. Only 25% managed to escape these limiting attractors bycreating and sustaining a completely different type of dynamic that reflects a dif-ferent type of order, the “complex order” of a complexor. What is necessary toreach the liberating dynamics of a complexor? Whitehead, the eloquent philoso-pher of process, wrote
Order is not sufficient. What is required, is something much more complex. It isorder entering upon novelty; so that the massiveness of order does not degenerateinto mere repetition. (Whitehead, 1978, p. 339)
This is the big challenge. Our call, to teams and organizations, as well as forpositive organizational scholars, is to take on the challenge of identifying how tocreate a new, liberating and enriching order within organizations. This articlecontributes some of the answers that could lead to creating and implementingthe new order that “enters upon novelty.” We need to have teams within organi-zations that are able to tap into the liberating and creative power of positivity.Not the excess positivity of Pollyannaish optimism, but the grounded positivitywhere measured negative feedback has a necessary place in keeping thingsgoing within agreed objectives. We need to have organizations with teams thatare highly connected with the kind of durable resources that strong and lastingnexi generate. We need to have organizations where the polarity of other andself, of you and I, is integrated into a sense of we; where the polarity of inquiryand advocacy, of questions and answers, can drive a productive and ongoingdialogue; where the abundance of positivity, grounded in constructive negativefeedback, can generate the state of realistic enthusiasm that can propelorganizations to reach and uphold the heights of excellence.
NOTES
1. The software used in this data collection is a more advanced version of the one described inLosada and Markovitch (1990); the version used to collect data in this study generated its own timeseries analyses. More important, in the new version, any three dimensions could be programmed into
762 AMERICAN BEHAVIORAL SCIENTIST
at OhioLink on March 11, 2009 http://abs.sagepub.comDownloaded from

the software. Inquiry/Advocacy (I/A), Other/Self (O/S), and Positivity/Negativity (P/N) were usedin this study, but only P-N is mentioned in the 1990 text.
2. For a graphical representation of nexi (a group interaction diagram) using the cross-correla-tion function, see Losada, Sánchez, and Noble (1990). A good introduction for social scientists to thecross-correlation function can be found in Gottman (1981). Vittengl and Holt (1998) provide a clearapplication of it to a study of mood and social interaction.
3. We know these are complexors because they have a fractal dimension of 2.06.4. The foci of the attractor are also the points at which a Poincaré section is done. The Poincaré
section allows us to capture the dynamics of the system while reducing its dimensionality. SeeGuckenheimer and Holmes (1983, p. 95), for an illustration of a Poincaré section.
REFERENCES
Ancona, D. (1990). Outward bound: Strategies for team survival in an organization. The Academy ofManagement Journal, 33(2), 334-365.
Argyris, C., & Schön, D. (1978). Organizational learning: A theory of action perspective. Reading,MA: Addison-Wesley.
Aron, A., & Fraley, B. (1999). Relationship closeness as including other in self: cognitive underpin-nings and measures. Social Cognition, 17(2), 140-160.
Bales, R. F. (1950). Interaction process analysis: A method for the study of small groups. Reading,MA: Addison-Wesley.
Bales, R. F., & Cohen, S. P. (1979). SYMLOG: A system for the multilevel observation of groups.New York: Free Press.
Barton, S. (1994). Chaos, self-organization, and psychology. American Psychologist, 49(1), 5-14.Baumeister, R. F., Bratslavsky, E., Finkenauer, C., & Vohs, K. D. (2001). Bad is stronger than good.
Review of General Psychology, 5(4), 323-370.Brief, A. P., & Weiss, H. M. (2002). Organizational behavior: Affect in the workplace. Annual
Review of Psychology, 53, 279-307.Brown, S. L., & Eisenhardt, K. M. (1997). The art of continuous change: Linking complexity theory
and time-paced evolution in relentlessly shifting organizations. Administrative Science Quar-terly, 42(1), 1-34.
Buber, M. (1970). I and Thou (W. Kauffman, Trans.). New York: Touchstone.Cameron, K. S., Dutton, J. E., & Quinn, R. E. (2003). Foundations of positive organizational scholar-
ship. In K. Cameron, J. E. Dutton, & R. Quinn (Eds.), Positive Organizational Scholarship (pp.3-13). Thousand Oaks, CA: Berrett-Kohler.
Csikszentmihaly, M., & Rathunde, K. (1998). The development of the person: An experiential per-spective on the ontogenesis of psychological complexity. In W. Damon (Series Ed.) & R. M.Lerner (Vol. Ed.), Theoretical models of human development: Vol. 1. Handbook of Child Psy-chology (5th ed., pp. 635-684). New York: Wiley.
Dabby, D. S. (1996). Musical variations from a chaotic mapping. Chaos, 6, 95-107.Daneke, G. A. (1999). Systemic choices: Nonlinear dynamics and practical management. Ann
Arbor: University of Michigan Press.Davidson, R. (1999). The functional neuroanatomy of emotion and affective style. Trends in Cogni-
tive Science, 3(1), 11-21.Dutton, J. E., & Heaphy, E. D. (2003). Coming to life: The power of high quality connections at work.
In K. Cameron, J. E. Dutton, & R. Quinn. (Eds.), Positive Organizational Scholarship (pp. 263-278). Thousand Oaks, CA: Berrett-Kohler.
Echeverría, R. (1994). Ontologa del Lenguaje [Ontology of language]. Santiago de Chile: DolmenEdiciones.
Losada, Heaphy / POSITIVITY AND CONNECTIVITY 763
at OhioLink on March 11, 2009 http://abs.sagepub.comDownloaded from

Fredrickson, B. L. (1998). What good are positive emotions? Review of General Psychology, 2(3),300-319.
Fredrickson, B. L. (2001). The role of positive emotions in positive psychology. American Psycholo-gist, 56(3), 218-226.
Fredrickson, B. L., & Levenson, R. W. (1998). Positive emotions speed recovery from the cardiovas-cular sequelae of negative emotions. Cognition and Emotion, 12, 191-200.
Fredrickson, B. L., Mancuso, R. A., Branigan, C., & Tugade, M. M. (2000). The undoing effect ofpositive emotions. Motivation and Emotion, 24(4), 237-259.
Goldberger, A. L., & Rigney, D. R. (1990). Sudden death is not chaos. In S. Krasner (Ed.), The Ubiq-uity of Chaos (pp. 23-34). Washington, DC: American Association for the Advancement ofScience.
Goleman, D. (2003,February 4). Finding happiness: Cajole your brain to move to the left. The NewYork Times, p. D5.
Gottman, J. M. (1981). Time-series analysis: A comprehensive introduction for social scientists.New York: Cambridge University Press.
Gottman, J. M. (1994). What predicts divorce: The relationship between marital processes & maritaloutcomes. New York: Lawrence Earlbaum.
Guckenheimer, J., & Holmes, P. (1983). Nonlinear oscillations, dynamical systems, and bifurcationsof vector fields. New York: Springer-Verlag.
Hax, A. C., & Majluf, N. S. (1991). The strategy concept and process: A pragmatic approach. Read-ing. MA: Addison-Wesley.
Isen, A. (2000). Positive affect and decision-making. In M. Lewis & J. M. Haviland-Jones (Eds.),Handbook of emotions (2nd ed., pp. 417-435). New York: Guilford Press.
Kaufman, S. A. (1993). The origins of order. Oxford, UK: Oxford University Press.Larsen, R. J., & Diener, E. E. (1992). Promises and problems with the circumplex model of emotion.
Review of Personality and Social Psychology: Emotion and Social Behavior, 114, 25-59.Losada, M. (1999). The complex dynamics of high performance teams. Mathematical and Computer
Modelling, 30, 179-192.Losada, M., & Markovitch, S. (1990). A system for dynamic analysis of group interaction. Proceed-
ings of the 23rd Hawaii International Conference on System Sciences (vol. IV, pp. 101-110). LosAlamitos, CA: IEEE Computer Society Press.
Losada, M., Sánchez, P., & Noble, E. E. (1990, October 7-10). Collaborative technology and groupprocess feedback: Their impact on interactive sequences in meetings. Proceedings of the Confer-ence on Computer-Supported Cooperative Work, 53-64.
Lumley, T. (1997). Complexity and the learning organization: Addressing team performance in newscience terms. Complexity, 2(5), 14-22.
Nowak, A., & Vallacher, R. R. (1998). Dynamical social psychology. Cambridge, UK: CambridgeUniversity Press.
Parkinson, B. (1996). Emotions are social. British Journal of Psychology, 87, 663-683.Rathunde, K. (2000). Broadening and narrowing in the creative process: A commentary on
Fredrickson’s “broaden-and-build” model. Prevention and Treatment, 3(6), 1-6.Ruelle, D. (1989). Chaotic evolution and strange attractors. Cambridge, UK: Cambridge University
Press.Ryan, K. D., Gottman, J. M., Murray, J. D., Carrre, S., & Swanson, C. (2000). Theoretical and mathe-
matical modeling of marriage. In M. D. Lewis & I. Granic (Eds.), Emotion, development, andself-organization: Dynamic systems approaches to emotional development (pp. 349-372). Cam-bridge, UK: Cambridge University Press.
Senge, P. M. (1990). The fifth discipline: The art and practice of the learning organization. NewYork: Currency/Doubleday.
Senge, P. M., Roberts, C., Ross, R. B., Smith, B. J., & Kleiner, A. (1994). The fifth disciplinefieldbook: Strategies and tools for building a learning organization. New York: Currency/Doubleday.
764 AMERICAN BEHAVIORAL SCIENTIST
at OhioLink on March 11, 2009 http://abs.sagepub.comDownloaded from

Smith, C. A., & Ellsworth, P. C. (1985). Patterns of cognitive appraisal in emotion. Journal of Per-sonality and Social Psychology, 48(4), 813-838.
Stacey, R. D. (1992). Managing the unknowable: Strategic boundaries between order and chaos inorganizations. San Francisco: Jossey-Bass.
Stacey, R. D. (1996). Strategic management and organisational dynamics (2nd ed.). London:Pitman.
Staw, B. M., & Barsade, S. G. (1993). Affect and managerial performance: A test of the sadder-but-wiser vs. happier-and-smarter hypotheses. Administrative Science Quarterly, 28, 304-331.
Staw, B. M., Sutton, R. I., & Pelled, L. H. (1994). Employee positive emotion and favorable out-comes at the workplace. Organization Science, 5(1), 51-71.
Strogatz, S. H. (1994). Nonlinear dynamics and chaos theory. Reading, MA: Addison-Wesley.Thiétart, R. A., & Forgues, B. (1995). Chaos theory and organization. Organization Science, 6(1),
19-31.Thompson, J. M. T., & Stewart, H. B. (1986). Nonlinear dynamics and chaos. New York: John Wiley.Tong, H. (1990). Non-linear time series: A dynamical system approach. Oxford, UK: Clarendon
Press.Vittengl, J. R., & Holt, C. S. (1998). A time-series study of mood and social interaction. Motivation
and Emotion, 22(3), 255-275.Whitehead, A. N. (1978). Process and reality (corrected ed.). New York: Free Press.
MARCIAL LOSADA is cofounder and executive director of Meta Learning, a consultingorganization that specializes in team productivity. He pioneered work on applications ofnonlinear dynamics and complexity theory to detect patterns of interaction that undermineproductivity in business organizations and conducted studies on the interaction dynamicsand productivity of business teams that led to the implementation of a unique, scientificallybased, approach to increase productivity in low-performance teams.
EMILY HEAPHY’s research focuses on how high-quality relationships and social identityaffect organizational and interpersonal processes. She is a doctoral student of organiza-tional behavior and human resource management at the University of Michigan.
Losada, Heaphy / POSITIVITY AND CONNECTIVITY 765
at OhioLink on March 11, 2009 http://abs.sagepub.comDownloaded from