american crystal sugar company production methods, ... and . percent sugar content helping push...
TRANSCRIPT

competeevolve
improveendure
AmericAn crystAl sugAr compAny
2011 Annual report
American Crystal Sugar Company is a world-class agricultural
cooperative specializing in the production of sugar and related
agri-products. American Crystal is owned by about ,
shareholders who raise nearly percent of the nation’s sugarbeet
acreage in the Red River Valley of Minnesota and North Dakota.
Additional acres are contracted in eastern Montana and western
North Dakota. As the largest beet sugar producer in the United
States, the company utilizes innovative farming practices,
low-cost production methods, and sales and marketing leadership
to produce and sell about percent of America’s fi nest quality sugar.
American Crystal operates sugar factories in Crookston, East
Grand Forks, and Moorhead, Minnesota; Drayton and Hillsboro,
North Dakota; and in Sidney, Montana, under the name Sidney
Sugars Incorporated. The company’s technical services center
and corporate headquarters are also located in Moorhead.
Located in Bloomington, Minnesota, United Sugars Corporation
markets American Crystal’s sugar to retail and industrial customers
throughout the nation. Midwest Agri-Commodities Company,
based in San Rafael, California, globally markets American Crystal’s
agri-products such as sugarbeet pulp, molasses, CSB, and betaine.
AmericAn crystAl sugAr compAny 01

04
Being a leader in the sugar industry takes managing all
the details — large and small. It means never accepting
the status quo. It involves understanding how insightful
adjustments can lead to meaningful innovations and how
external challenges can turn into competitive advantages.
Many times it requires competing with previous
accomplishments — pushing the yield capacity of every
sugarbeet acre, refi ning already effi cient manufacturing
practices, and looking within company structures to
improve results.
Regardless of the changes required to move ahead,
American Crystal Sugar Company is positioned to
compete in a profi table, productive, and sustainable way.
compete
AmericAn crystAl sugAr compAny 0302
Being a leader in the sugar industry takes managing all
the details — large and small. It means never accepting
the status quo. It involves understanding how insightful
adjustments can lead to meaningful innovations and how
external challenges can turn into competitive advantages.
Many times it requires competing with previous
accomplishments — pushing the yield capacity of every
sugarbeet acre, refi ning already effi cient manufacturing
practices, and looking within company structures to
improve results.
Regardless of the changes required to move ahead,
American Crystal Sugar Company is positioned to
compete in a profi table, productive, and sustainable way.
compete

AmericAn crystAl sugAr compAny 05
American Crystal must challenge itself to examine vital opportunities that make our agricultural, processing, and marketing value grow over time.
evolve
Fiscal Year was pivotal for American Crystal Sugar Company. While the Company performed at top levels across nearly every functional area, three significant events underscored the year, including favorable sugar market dynamics, approval of biotech sugarbeet seed for the crop, and a labor dispute athat att racted regional att ention.
Sugar MarketDriven by increased demand, the world sugar market pushed domestic sugar prices higher, permitt ing American Crystal — through its marketing entity United Sugars Corporation — to sell its available supply while meeting customer commitments. Domestically, Mexico remained a signifi cant exporter of sugar to the U.S., yet this volume did not cause serious disruption thanks to strong demand and the USDA’s careful management of the sugar program.
Biotech SeedBeginning in , our shareholders rapidly adopted biotech seed varieties for sugarbeets due to weed control and other agronomic benefi ts. However, rulings in U.S. District Court put the use of this technology in jeopardy for the crop and beyond pending the outcome of a more in-depth Environmental Impact Statement by the USDA. In February , aft er working with the USDA, American Crystal and the sugarbeet industry received permission to use biotech seed varieties under strict compliance agreements for the and crops. While the future of biotech seed remains uncertain, the USDA issued a draft of its Environmental Impact Statement for public comment on October , . A fi nal draft is expected in , which will provide signifi cant future direction for biotech usage.
Labor NegotiationsIn May , the Company entered into negotiations with the Bakery, Confectionery, Tobacco Workers and Grain Millers union. Our goal was to achieve a fair labor accord that recognizes the important contributions union employees make while ensuring the Company remains a strong employer and competitor into the future. On July , American Crystal made a final fi ve-year contract off er that contained strong wage increases, quality healthcare, improved pension benefi ts, and other changes that allow for eff ective management of personnel matt ers such as promotions. Union employees rejected the off er and the existing labor contract expired on August . To preempt the potential for a strike during its beet processing campaign, the Company made the diffi cult decision to implement a lockout of its approximately , union employees. As of late November, the Company and union had not reached an agreement, continuing the labor impasse. The Company is committ ed to good faith bargaining in hopes of reaching an agreement.
08AmericAn crystAl sugAr compAny 07
Eff ective OperationsAmerican Crystal factories started the processing campaign strong and maintained operating consistency to set a new average slice record of , tons per day. Excellent beet storage also helped pace this performance, which produced . million hundredweight of sugar and , tons of agri-products over a campaign that ranged in length from to days at Red River Valley factories.
Noteworthy was the skillful implementation of $ million in new, replacement, and compliance investments. The largest factory investment was a two-year, $-million tower diff user installation at the Moorhead factory. Additional investments included dust control equipment at all factories. Agriculturally, two new pilers were added to our list of assets along with the construction of a new beet receiving station near Lynchburg, North Dakota., replacing an outdated station at Casselton, North Dakota.
Targeting SafetyContinuing a multi-year trend of lowering lost time accident rates, our frequency rate decreased again in Fiscal . The East Grand Forks factory recorded a full year with no lost time accidents while Moorhead Packaging and Warehousing eclipsed the two-year mark with no lost time accidents. American Crystal remains committ ed to our accident-free workplace goal.
Sidney Sugars IncorporatedPerformance was stronger at our Sidney Sugars factory this past year due to an increase in planted acres, improved crop yield, and solid sugar net selling prices. Fiscal-year planted acres rose to , and averaged a record . tons per acre and .percent sugar content helping push factory production to . million hundredweight.
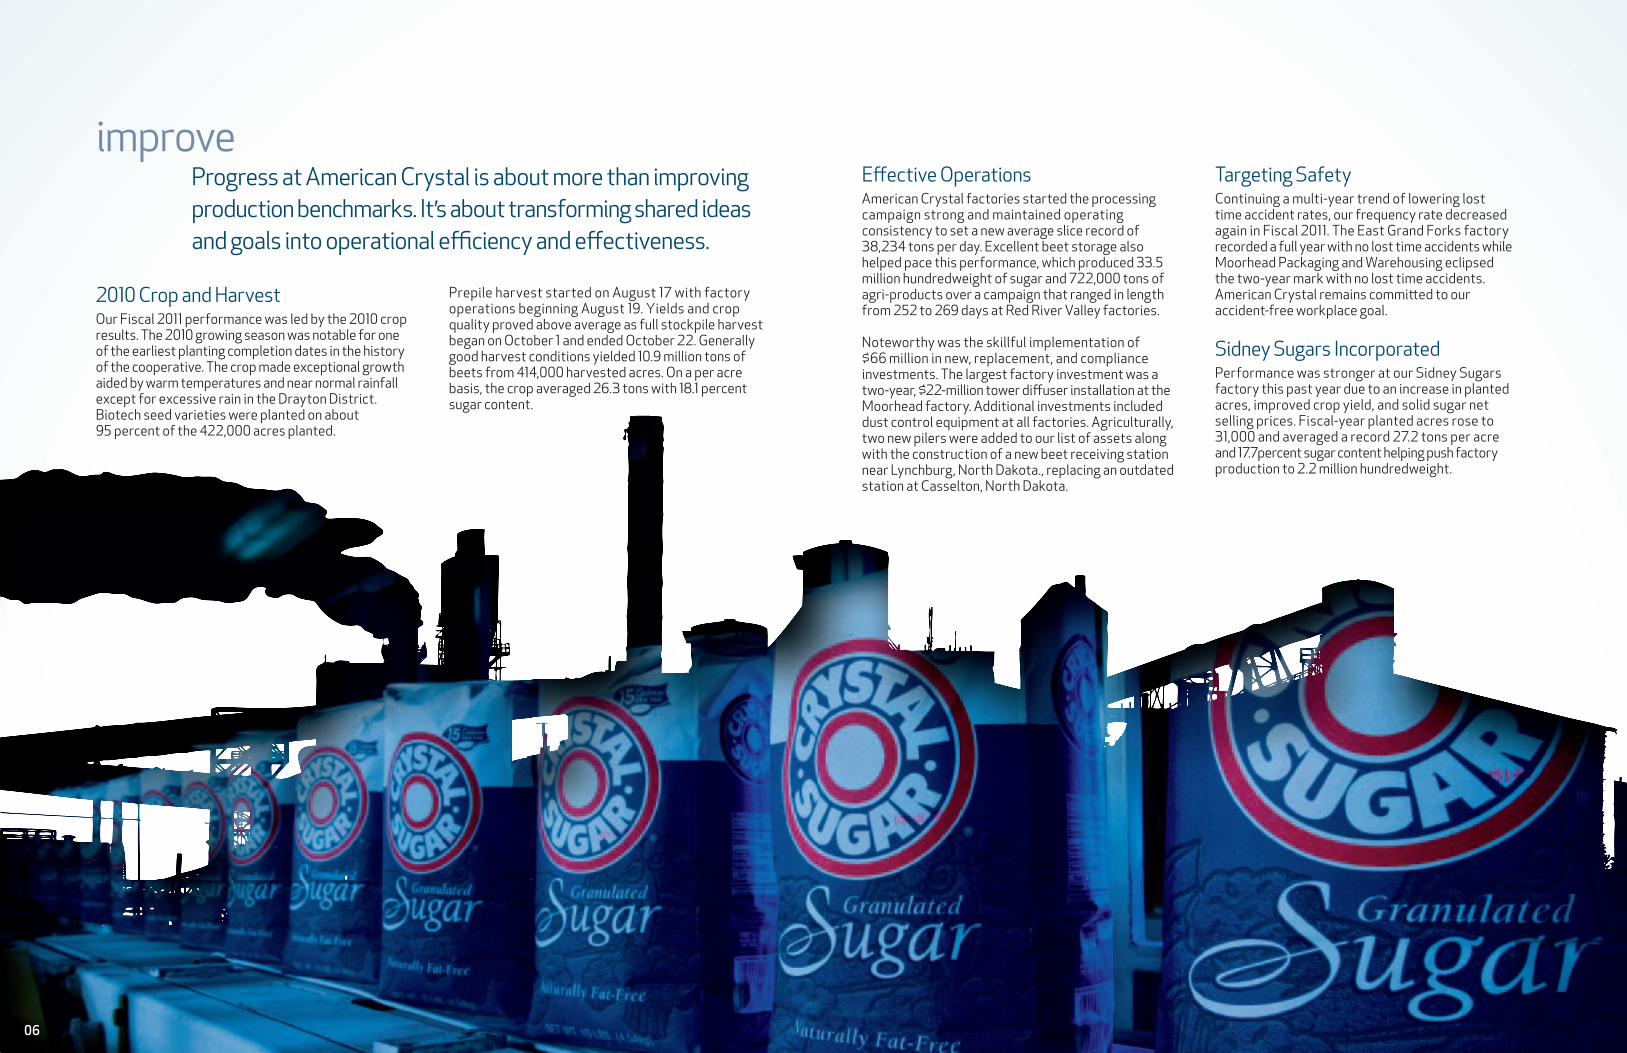
Crop and HarvestOur Fiscal performance was led by the crop results. The growing season was notable for one of the earliest planting completion dates in the history of the cooperative. The crop made exceptional growth aided by warm temperatures and near normal rainfall except for excessive rain in the Drayton District. Biotech seed varieties were planted on about percent of the , acres planted.
Prepile harvest started on August with factory operations beginning August . Yields and crop quality proved above average as full stockpile harvest began on October and ended October . Generally good harvest conditions yielded . million tons of beets from , harvested acres. On a per acre basis, the crop averaged . tons with . percent sugar content.
improveProgress at American Crystal is about more than improving production benchmarks. It’s about transforming shared ideas and goals into operational effi ciency and eff ectiveness.
06
Eff ective OperationsAmerican Crystal factories started the processing campaign strong and maintained operating consistency to set a new average slice record of , tons per day. Excellent beet storage also helped pace this performance, which produced . million hundredweight of sugar and , tons of agri-products over a campaign that ranged in length from to days at Red River Valley factories.
Noteworthy was the skillful implementation of $ million in new, replacement, and compliance investments. The largest factory investment was a two-year, $-million tower diff user installation at the Moorhead factory. Additional investments included dust control equipment at all factories. Agriculturally, two new pilers were added to our list of assets along with the construction of a new beet receiving station near Lynchburg, North Dakota., replacing an outdated station at Casselton, North Dakota.
Targeting SafetyContinuing a multi-year trend of lowering lost time accident rates, our frequency rate decreased again in Fiscal . The East Grand Forks factory recorded a full year with no lost time accidents while Moorhead Packaging and Warehousing eclipsed the two-year mark with no lost time accidents. American Crystal remains committ ed to our accident-free workplace goal.
Sidney Sugars IncorporatedPerformance was stronger at our Sidney Sugars factory this past year due to an increase in planted acres, improved crop yield, and solid sugar net selling prices. Fiscal-year planted acres rose to , and averaged a record . tons per acre and .percent sugar content helping push factory production to . million hundredweight.

Success is never guaranteed in the sugar industry. It’s why American Crystal is so acutely focused on fi ne tuning the fundamentals that bett er prepare us for what’s to come.
Trade & PolicyAmerican Crystal focused its government relations activities on maintaining the well-run sugar program and on introducing this program to newly-elected Members of Congress. The sugar program continues to operate at no cost to the federal government and it remains vital to the long-term stability of the U.S. sugar industry.
More than new representatives and senators were elected in November , including half of the House agriculture committ ee. American Crystal developed relationships with the new lawmakers in preparation for the Farm Bill. Congress conducted brinksmanship-style battles over funding, potentially threatening the farm bill budget; yet lawmakers and stakeholders appear to be approaching a re-write of the farm law in or .
Product PerspectivesAmerican Crystal and United Sugars know the importance and value of supplying customers with consistent, high quality sugar. From every manufacturing, packaging, and delivery perspective, we continue to work on innovative solutions to strengthen our position as the most reliable sugar supplier in North America.
From an agri-products standpoint, American Crystal and its marketing entity Midwest Agri-Commodities collaborated to produce and deliver top-level agri-products to Asia, Europe, and North America. Excellent demand for volume persists as we extend our status as a supplier of choice for customers in the livestock, dairy, poultry, and pet food industries.
CropWe experienced numerous weather extremes during the growing season. A cold, wet spring seriously delayed planting, prompting the Board of Directors to increase allowable acreage from , to ,.
Ultimately, , acres were planted; percent utilized biotech varieties, with the last acres seeded June . Cool temperatures in the early to mid-growing season, high rainfall in the Drayton and Moorhead Districts, and below normal rainfall in the Crookston District caused crop development to vary. Field abandonment totaled about , acres due to severe root rot and water damage. August and September’s low rainfall and high temperature favored crop development leading into pre-pile harvest on September and full stockpile harvest on October . Overall, total yield fell signifi cantly from the previous year as crop production costs rose due to higher planted acres.
OutlookAs long as local, national, and global changes occur, American Crystal Sugar Company must change as well. Only by meeting challenges head on and executing ambitious strategies will our organization continue to compete, evolve, improve, and endure. Through focused long-term planning, we can successfully utilize the tailwinds of today to navigate the headwinds of tomorrow.
endure
David BergPresident and Chief Executive Offi cer
Neil WidnerChairman, Board of Directors
AmericAn crystAl sugAr compAny 09

John Gudajtes–Director, Curtis Haugen–Vice Chairman, Brian Erickson–Director
EAST GRAND FORKS FACTORY DISTRICT HILLSBORO FACTORY DISTRICT
Jeff McInnes–Director, John Brainard–Director, David Mueller–Director
David Berg–President and Chief Executive Offi cerThomas Astrup–Vice President–Finance and Chief Financial Offi cerBrian Ingulsrud–Vice President–AdministrationDaniel Mott –Secretary and General CounselJoseph Talley–Chief Operating Offi cer
Dale Kuehl–Director, Wayne Tang–Director, William Hejl–Director
MOORHEAD FACTORY DISTRICT SENIOR MANAGEMENT
AmericAn crystAl sugAr compAny 1 1
Board of Directors and Senior Staff
American Crystal’s cooperative structure is supported by its board of directors and management team. This combination of governance and business expertise continues to translate into disciplined prosperity.
Additionally, this leadership team is charged with supporting American Crystal’s interests in the Red River Valley, around the country, and in Washington, D.C.
American Crystal’s Board of Directors is composed of shareholders representing the Company’s factory districts. Three directors are elected from each of the fi ve districts. New directors from the shareholder base are elected by American Crystal shareholders (for three-year terms that cannot exceed 12 consecutive years of service) during the fall factory district meetings each November. Aft er the Company’s annual meeting each December, election of the Board’s chairman takes place. This process provides continuous transition in the Board’s structure, as each new member brings a fresh perspective to enhance American Crystal’s strategic growth.
DRAYTON FACTORY DISTRICT
Robert Green–Director, Neil Widner–Chairman, William “Buzz” Baldwin–DirectorCurt Knutson–Director, Steve Williams–Director, Donald Andringa–Director
CROOKSTON FACTORY DISTRICT
10
John Gudajtes–Director, Curtis Haugen–Vice Chairman, Brian Erickson–Director
EAST GRAND FORKS FACTORY DISTRICT HILLSBORO FACTORY DISTRICT
Jeff McInnes–Director, John Brainard–Director, David Mueller–Director
David Berg–President and Chief Executive Offi cerThomas Astrup–Vice President–Finance and Chief Financial Offi cerBrian Ingulsrud–Vice President–AdministrationDaniel Mott –Secretary and General CounselJoseph Talley–Chief Operating Offi cer
Dale Kuehl–Director, Wayne Tang–Director, William Hejl–Director
MOORHEAD FACTORY DISTRICT SENIOR MANAGEMENT

The management of American Crystal Sugar Company is responsible for the preparation, integrity and fair presentation of the accompanying consolidated fi nancial statements and related information contained in this Annual Report. The consolidated fi nancial statements, which include amounts based on management’s estimates and judgments, have been prepared in conformity with accounting principles generally accepted in the United States of America.
The Company maintains accounting and internal control systems to provide reasonable assurance at reasonable cost that assets are safeguarded against loss from unauthorized use or disposition, that transactions are properly recorded and executed in accordance with management’s authorization, and that the fi nancial records provide a solid foundation from which to prepare the consolidated fi nancial statements. These systems are augmented by writt en policies, an organizational structure providing division of responsibilities and careful selection and training of qualifi ed personnel.
The Company’s consolidated fi nancial statements have been audited in accordance with standards of the Public Company Accounting Oversight Board (United States) by Eide Bailly LLP, independent auditors. The independent auditors were given unrestricted access to all fi nancial records and related data.
The Audit Committ ee of the Board of Directors meets with the independent auditors and management periodically to review their respective responsibilities and activities and to provide oversight to the Company’s accounting policies, internal controls and the fi nancial reporting process. The independent auditors have free access to the Board of Directors and its Audit Committ ee, with or without management present, to discuss the scope and results of their audits and the adequacy of the system of internal controls.
David A. BergPresident and Chief Executive Offi cer
Thomas S. AstrupVice President – Finance and Chief Financial Offi cer
Management’s Report on the Consolidated Financial Statements
Management’s Discussion of Operations
The harvest of the Red River Valley and Sidney sugarbeet crops grown during 2010 and processed during fi scal 2011 produced a total of 11.7 million tons of sugarbeets, or approximately 26.4 tons of sugarbeets per acre from approximately 445,000 acres. This represents an increase in total tons harvested of approximately 11.9 percent compared to the 2009 crop. The sugar content of the 2010 crop was 18.0 percent as compared to the 16.7 percent sugar content of the 2009 crop. The Company produced a total of approximately 35.6 million hundredweight of sugar from the 2010 crop, an increase of approximately 22.8 percent compared to the 2009 crop.
Revenue for the year ended August 31, 2011 was $1.5 billion, an increase of $338.9 million from the year ended August 31, 2010. The table on the right refl ects the percentage changes in product revenues, prices and volumes for the year ended August 31, 2011, as compared to the year ended August 31, 2010.
The increases in selling prices for sugar and betaine refl ect strong markets due to supply and demand factors. The decrease in the selling price of pulp, molasses and CSB is the result of lower prices for competing alternative products in the marketplace. The increase in the volumes of all our products refl ects the impact of more product availability due to larger sugarbeet crops and the increased sugar content of the sugarbeets this year as compared to the previous year.
Cost of sales for the years ended August 31, 2011, exclusive of payments to members for sugarbeets, increased $10.8 million as compared to the year ended August 31, 2010. This increase was primarily related to the following:
• Attheendofeachreportingperiod,productinventoriesarerecordedattheirnetrealizablevalue.Thechangeinthenetrealizablevalueof the product inventories from the beginning of the reporting period is recorded on the balance sheet as either an increase or decrease to inventories with a corresponding dollar for dollar adjustment to cost of sales on the statement of operations. The increase in the net realizable value of product inventories for the year ended August 31, 2011 was $64.6 million as compared to a decrease of $25.8 million for the previous year ended August 31, 2010 resulting in a $90.4 million favorable change in the cost of sales between the two years as shown in the table below:
¹ The change is primarily due to a 22.6 percent decrease in the hundredweight of sugar inventory as of August 31, 2010 as compared to August 31, 2009 partially off set by an 11.3 percent increase in the per hundredweight net realizable value of sugar inventory as of August 31, 2010 as compared to August 31, 2009; a 35.4 percent decrease in the tons of pulp inventory as of August 31, 2010 as compared to August 31, 2009; and a 47.3 percent decrease in the per ton net realizable value of pulp inventory as of August 31, 2010 as compared to August 31, 2009.
² The change is primarily due to a 42.7 percent increase in the hundredweight of sugar inventory as of August 31, 2011 as compared to August 31, 2010; a 14.8 percent increase in the per hundredweight net realizable value of sugar inventory as of August 31, 2011 as compared to August 31, 2010 partially off set by a 56.0 percent decrease in the tons of pulp inventory as of August 31, 2011 as compared to August 31, 2010; and a 4.7 percent decrease in the per ton net realizable value of pulp inventory as of August 31, 2011 as compared to August 31, 2010.
• Factory operating costs increased $42.1 million for the year ended August 31, 2011, as compared to the year ended August 31, 2010 primarily due to the increase in the tons harvested and processed this year.
• The cost recognized associatedwith the non-member sugarbeets increased$.million for the year endedAugust, ,whencompared to last year. This increase was primarily due to an increase in the per ton sugarbeet payment for the Sidney crop and an increase in the tons of sugarbeet harvested this year.
• IntheeventthattheCompany’sgrowerswouldnotbeabletoplantRoundupReady® sugarbeets or the growers would choose to plant conventional sugarbeet seed for the 2011 crop, the Company secured chemicals for the growers related to growing conventional sugarbeets. The Company has recognized an expense of approximately $9.9 million related to these chemicals.
• Duringfi scal,theCompany’ssugarmarketingagent,UnitedSugarsCorporation,purchasedandsoldadditionalsugartomeetourcustomers’ needs. The requirements for purchased sugar were much less in fi scal 2010. As a result, the costs associated with purchased sugar were $28.9 million higher for the year ended August 31, 2011, as compared to the year ended August 31, 2010.
Selling, general and administrative expenses increased $50.7 million for the year ended August 31, 2011, as compared to the year ended August 31, 2010. Selling expenses increased $47.5 million primarily due to an increase in shipping and handling costs associated with increased volumes of sugar and agri-products sold. General and administrative expenses increased $3.2 million due to increased labor and benefi t costs along with general cost increases.
Interest expense increased $ .7 million for the year ended August 31, 2011, as compared to the year ended August 31, 2010. This refl ects an increase in the average borrowing level for short-term debt and an increase in the average interest rate for long-term debt partially off set by a decrease in the average interest rate for short-term debt and a decrease in the average borrowing level for long-term debt.
Net proceeds att ributable to American Crystal Sugar Company increased $278.7 million for the year ended August 31, 2011, as compared to the year ended August 31, 2010. This increase was primarily due to more tons of sugar beets processed, higher sugar content of the sugarbeets and increased sugar selling prices.
Product Revenue Selling Price VolumeSugar 30.8% 16.2% 12.5%Pulp 11.1% -3.5% 15.1%Molasses 6.2% -7.5% 14.8%CSB 19.9% -0.9% 21.0%Betaine 21.6% 14.0% 6.6%
Change in the Net Realizable Value of Product Inventories
(In Millions) For the Years Ended August 31
2011 2010 Change
Beginning Product Inventories at Net Realizable Value $ 111.8 $ 137.6 $ (25.8) 1
Ending Product Inventories at Net Realizable Value (176.4) (111.8) (64.6)2
(Increase) Decrease in the Net Realizable Value of Product Inventories $ (64.6) $ 25.8 $ (90.4)
AmericAn crystAl sugAr compAny 1312

For the Years Ended August 31 (In Thousands) 2011 2010 2009
Net Revenue $ 1,542,777 $ 1,203,897 $ 1,200,229
Cost of Sales 431,620 420,842 405,714
Gross Proceeds 1,111,157 783,055 794,515
Selling, General and Administrative Expenses 289,649 238,905 244,174
Operating Proceeds 821,508 544,150 550,341
Other Income (Expense): Interest Income 1,225 150 209 Interest Expense, Net (9,6 84) (9,012) (10,058) Other, Net (322) (435) 3,943
Total Other Expense (8,781) (9,297) (5,906)
Proceeds Before Income Tax 812,727 534,853 544,435
Income Tax Expense (1,871) (2,309) (2,181)
Consolidated Net Proceeds 810,856 532,544 542,254
Less: Net Proceeds Att ributable to Noncontrolling Interests (6,025) (6,432) (6,103)
Net Proceeds Att ributable to American Crystal Sugar Company $ 804,831 $ 52 6 ,112 $ 536,151
Distributions of Net Proceeds Att ributable to American Crystal Sugar Company: Credited (Charged) to American Crystal Sugar Company’s Members’ Investments: Non-Member Business Income $ 8,741 $ 5,426 $ 2,309 Unit Retains Declared to Members 43,574 29,531 31,024
Net Credit to American Crystal Sugar Company’s Members’ Investments 52,315 34,957 33,333 Payments to Members for Sugarbeets, Net of Unit Retains Declared 752,516 491,155 502,818
Total $ 804,831 $ 5 2 6 ,112 $ 536,151
The Accompanying Notes are an Integral Part of These Consolidated Financial Statements.
Consolidated Statements of Operations
AmericAn crystAl sugAr compAny 1514
Report of Independent Registered Public Accounting Firm
To the Audit Committ ee of American Crystal Sugar CompanyMoorhead, Minnesota
We have audited the accompanying consolidated balance sheets of American Crystal Sugar Company and Subsidiaries as of August 31, 2011 and 2010, and the related consolidated statements of operations, changes in members’ investments and comprehensive income, and cash fl ows for the years ended August 31, 2011, 2010, and 2009. These consolidated fi nancial statements are the responsibility of the Company’s management. Our responsibility is to express an opinion on these consolidated fi nancial statements based on our audits.
We conducted our audits in accordance with standards of the Public Company Accounting Oversight Board (United States). Those standards require that we plan and perform the audit to obtain reasonable assurance about whether the fi nancial statements are free of material misstatement. The Company is not required to have, nor were we engaged to perform, an audit of its internal control over fi nancial reporting. Our audits included consideration of internal controls over fi nancial reporting as a basis for designing audit procedures that are appropriate in the circumstances, but not for the purpose of expressing an opinion on the eff ectiveness of the Company’s internal control over fi nancial reporting. Accordingly, we express no such an opinion. An audit also includes examining, on a test basis, evidence supporting the amounts and disclosures in the fi nancial statements, assessing the accounting principles used and signifi cant estimates made by management, as well as evaluating the overall fi nancial statement presentation. We believe that our audits provide a reasonable basis for our opinion.
In our opinion, the consolidated fi nancial statements referred to above present fairly, in all material respects, the fi nancial position of American Crystal Sugar Company and Subsidiaries as of August 31, 2011 and 2010, and the results of their operations and their cash fl ows for the years ended August 31, 2011, 2010, and 2009, in conformity with accounting principles generally accepted in the United States of America.
EIDE BAILLY LLPSioux Falls, South DakotaNovember 23, 2011

AssetsAugust 31 (In Thousands) 2011 2010
Current Assets: Cash and Cash Equivalents $ 127 $ 128
Receivables:
Trade 78,2 15 52,608
Members 5,8 8 9 5,195
Other 4,9 6 1 4,080
Advances to Related Parties 32,1 8 4 15,243
Inventories 244,0 3 8 204,117
Prepaid Expenses 739 815
Total Current Assets 366,1 5 3 282,186
Property and Equipment:
Land and Land Improvements 83,8 5 2 73,804
Buildings 134,5 3 4 124,533
Equipment 992,9 1 1 942,346
Construction in Progress 2,064 16,7 37
Less Accumulated Depreciation (814,946) (775, 904)
Net Property and Equipment 398,4 1 5 381,516
Net Property and Equipment Held for Lease 92,8 2 4 102,3 3 3
Other Assets: Investments in CoBank, ACB 7,34 8 8,7 7 1
Investments in Marketing Cooperatives 997 2,159
Other Assets 12,3 7 0 11,7 78
Total Other Assets 20,7 1 5 22,708
Total Assets $ 878,1 0 7 $ 788, 743
The Accompanying Notes are an Integral Part of These Consolidated Financial Statements.
Consolidated Balance Sheets
Liabilities and Members’ InvestmentsAugust 31 (In Thousands) 2011 2010
Current Liabilities: Short-Term Debt $ 66,197 $ 5,000 Current Maturities of Long-Term Debt 5,765 3 7 5 Accounts Payable 33,641 37,298 Advances Due to Related Parties 4,831 5,697 Other Current Liabilities 41,723 42,689 Amounts Due Growers 160,886 137,133
Total Current Liabilities 313,043 228,192
Long-Term Debt, Net of Current Maturities 128,640 140,698
Accrued Employee Benefits 63,844 77,584
Other Liabilities 11,081 11,659
Total Liabilities 516,608 458,133
Commitments and Contingencies
Members’ Investments: Preferred Stock 38,275 38,2 75 Common Stock 28 28 Additional Paid-In Capital 152,261 152,2 61 Unit Retains 207,599 193,7 79 Accumulated Other Comprehensive Income (Loss) (71,903) (85,986) Retained Earnings (Accumulated Deficit) (9,715) (18,456)
Total American Crystal Sugar Company Members’ Investments 316,545 279, 901
Noncontrolling Interests 44,954 50,709
Total Members’ Investments 361,499 330,610
Total Liabilities and Members’ Investments $ 878,107 $ 788,743
The Accompanying Notes are an Integral Part of These Consolidated Financial Statements.
Consolidated Balance Sheets
AmericAn crystAl sugAr compAny 1716

Accumulated Retained American Annual Preferred Common Additional Equity Other Comprehensive Earnings Crystal Sugar Noncontrolling Comprehensive For the Years Ended August 31 (In Thousands) Stock Stock Paid-In Capital Unit Retains Retention Income (Loss) (Accumulated Deficit) Company Total Interests Total Income (Loss) Balance, August 31, 2008 $ 38,275 $ 28 $ 152,261 $ 174,506 $ 1,155 $ (8,984) $ (25,965) $ 331,276 $ 59,839 $ 391,115 Non-Member Business Income — — — — — — 2,309 2,309 — 2,309 $ 2,309 Net Proceeds Noncontrolling Interests — — — — — — — — 6,103 6,103 — Distributions to Noncontrolling Interests — — — — — — — — (10,992) (10,992) — SFAS 158 Unrecognized Prior Service Costs — — — — — 1,644 — 1,644 — 1,644 1,644 SFAS 158 Unrecognized Gain/(Loss) — — — — — (51,624) — (51,624) — (51,624) (51,624) SFAS 158 Measurement Date Adjustment — — — — — — (226) (226) — (226) (226) OCI of Equity Method Investees — — — — — (4,755) — (4,755) — (4,755) (4,755) Forward Contract Foreign Currency Gain — — — — — 14 — 14 — 14 14 Unit Retains Withheld from Members — — — 31,024 — — — 31,024 — 31,024 — Payments of Unit Retains and Equity Retention to Members — — — (23,929) (1,155) — — (25,084) — (25,084) — Stock Issued/(Redeemed), Net — — — — — — — — — — —
Balance, August 31, 2009 38,275 28 152,261 181,601 — (63,705) (23,882) 284,578 54,950 339,528 $ (52,638)
Non-Member Business Income — — — — — — 5,426 5,426 — 5,426 $ 5,426 Net Proceeds Noncontrolling Interests — — — — — — — — 6,432 6,432 — Distributions to Noncontrolling Interests — — — — — — — — (10,673) (10,673) — SFAS 158 Unrecognized Prior Service Costs — — — — — 1,316 — 1,316 — 1,316 1,316 SFAS 158 Unrecognized Gain/(Loss) — — — — — (23,054) — (23,054) — (23,054) (23,054) OCI of Equity Method Investees — — — — — 1,262 — 1,262 — 1,262 1,262 Forward Contract Foreign Currency Loss — — — — — (34) — (34) — (34) (34) Interest Rate Contract — — — — — (1,771) — (1,771) — (1,771) (1,771) Unit Retains Withheld from Members — — — 29,531 — — — 29,531 — 29,531 — Payments of Unit Retains to Members — — — (17,353) — — — (17,353) — (17,353) — Stock Issued/(Redeemed), Net — — — — — — — — — — —
Balance, August 31, 2010 38,275 28 152,261 193,779 — (85,986) (18,456) 279,901 50,709 330,610 $ (16,855)
Non-Member Business Income — — — — — — 8,741 8,741 — 8,741 $ 8,741 Net Proceeds Noncontrolling Interests — — — — — — — — 6,025 6,025 — Distributions to Noncontrolling Interests — — — — — — — — (11,780) (11,780) — SFAS 158 Unrecognized Prior Service Costs — — — — — 989 — 989 — 989 989 SFAS 158 Unrecognized Gain/(Loss) — — — — — 14,445 — 14,445 — 14,445 14,445 OCI of Equity Method Investees — — — — — (812) — (812) — (812) (812) Forward Contract Foreign Currency Gain — — — — — 28 — 28 — 28 28 Interest Rate Contract — — — — — (567) — (567) — (567) (567) Unit Retains Withheld from Members — — — 43,574 — — — 43,574 — 43,574 — Payments of Unit Retains to Members — — — (29,754) — — — (29,754) — (29,754) — Stock Issued/(Redeemed), Net — — — — — — — — — — —
Balance, August 31, 2011 $ 38,275 $ 28 $ 152,261 $ 207,599 $ — $ (71,903) $ (9,715) $ 316,545 $ 44,954 $ 361,499 $ 22,824
The Accompanying Notes are an Integral Part of These Consolidated Financial Statements.
Consolidated Statements of Changes in Members’ Investments and Comprehensive Income
AmericAn crystAl sugAr compAny 1918

For the Years Ended August 31 (In Thousands) 2011 2010 2009
Cash Provided By (Used In) Operating Activities: Net Proceeds Attributable to American Crystal Sugar Company $ 804,831 $ 526,112 $ 536,151 Payments To/Due Members for Sugarbeets, Net of Unit Retains Declared (752,516) (491,155) (502,818) Add (Deduct) Non-Cash Items: Depreciation and Amortization 58,333 55,580 55,046 (Income)/Loss from Equity Method Investees 462 521 (636) Loss on the Disposition of Property and Equipment 512 535 1,049 Non-Cash Portion of Patronage Dividend from CoBank, ACB (75) (147) (165) Deferred Gain Recognition (63) (63) (108) Noncontrolling Interests 6,025 6,432 6,103 Changes in Assets and Liabilities: Receivables (27,182) 6,827 2,741 Inventories (39,921) (22,806) 7,017 Prepaid Expenses 81 38 312 Non-Current Pension Asset/Liability (1,552) 5,413 634 Advances To/Due to Related Parties (17,807) 11,335 (3,833) Accounts Payable (301) (1,681) (1,399) Other Liabilities 1,220 12,505 5,697 Amounts Due Growers 23,753 49,915 (33,715)Net Cash Provided By Operating Activities 55,800 159,361 72,076
Cash Provided By (Used In) Investing Activities: Purchases of Property and Equipment (66,208) (67,828) (45,479) Purchases of Property and Equipment Held for Lease (1,900) (2,648) (2,331) Proceeds from the Sale of Property and Equipment 78 26 18 Equity Distribution from CoBank, ACB 1,498 1,487 — Investments in Marketing Cooperatives (111) (154) 6 Changes in Other Assets (2,153) (439) (1,978 ) Net Cash (Used In) Investing Activities (68,796) (69,556) (49,764)
Cash Provided By (Used In) Financing Activities: Net Proceeds from (Payments on) Short-Term Debt 61,197 (40,989) 30,692 Proceeds from Issuance of Long-Term Debt 15,000 — 100,092 Long-Term Debt Repayment (21,668) (20,789) (117,021) Distributions to Noncontrolling Interests (11,780) (10,673) (10,992) Payment of Unit Retains and Equity Retention (29,754) (17,353) (25,084)Net Cash Provided By (Used In) Financing Activities 12,995 (89,804) (22,313)Increase (Decrease) In Cash and Cash Equivalents (1) 1 (1)Cash and Cash Equivalents, Beginning of Year 128 127 128Cash and Cash Equivalents, End of Year $ 127 $ 128 $ 127
Non-Cash Investing Activities: Purchases of Property and Equipment include the changes in accounts payable related to these purchases of ($3,356,000); $3,597,000 and $944,000 for the years ended August 31, 2011, 2010 and 2009, respectively.
The Accompanying Notes are an Integral Part of These Consolidated Financial Statements.
Consolidated Statements of Cash Flows(1) PRINCIPAL ACTIVITY AND SIGNIFICANT ACCOUNTING POLICIES:
Organization
American Crystal Sugar Company (Company) is a Minnesota agricultural cooperative corporation which processes and markets sugar as well as sugarbeet pulp, molasses, concentrated separated by-product (CSB), betaine (collectively, agri-products) and sugarbeet seed. Business done with its shareholders (members) constitutes “patronage business” as defined by the Internal Revenue Code, and the net proceeds therefrom are credited to members’ investments in the form of unit retains or distributed to members in the form of payments for sugarbeets. Members are paid the net amounts realized from the current year’s production less member operating costs determined in conformity with accounting principles generally accepted in the United States of America.
Basis of Presentation
The Company’s consolidated financial statements are comprised of American Crystal Sugar Company, its wholly-owned subsidiaries Sidney Sugars Incorporated (Sidney Sugars) and Crab Creek Sugar Company (Crab Creek), and ProGold Limited Liability Company (ProGold), a limited liability company in which the Company holds a 51 percent ownership interest.
Certain reclassifications have been made to the August 31, 2010, consolidated financial statements to conform with the August 31, 2011, presentation. These reclassifications had no effect on previously reported results of operations, cash flows or Members’ Investments.
All material inter-company transactions have been eliminated.
Revenue Recognition
Revenue from the sale of sugar, agri-products and seed is recorded when the product is delivered to the customer. Operating lease revenue is recognized as earned ratably over the term of the lease.
Operating Lease
ProGold owns a corn wet milling facility which it leases under an operating lease. On November 6, 2007, ProGold entered into an amended operating lease agreement with Cargill, Incorporated that superseded and replaced the previous ten year lease agreement. Payments are to be received monthly under the lease, which runs through December 31, 2017. The operating lease revenue is recognized as earned ratably over the term of the lease and to the extent that amounts received exceed amounts earned, deferred revenue is recorded. Expenses (including depreciation and interest) are charged against such revenue as incurred. The lease contains provisions for extension or modification of the lease terms at the end of the lease period. The lease also contains provisions for increased payments to be received during the lease period related to the plant’s capital additions.
Cash and Cash Equivalents
The Company considers all highly liquid investments with a maturity of three months or less when purchased to be cash equivalents. The Company places its temporary cash investments with high credit quality financial institutions. At times, such investments may be in excess of the applicable insurance limit.
Accounts Receivable and Credit Policies
The Company grants credit, individually and through its marketing cooperatives, to its customers, which are primarily companies in the food processing industry located throughout the United States.
Trade receivables are uncollateralized customer obligations due under normal trade terms requiring payment within 15 to 90 days from the invoice date. The receivables are non-interest bearing. Trade receivables are stated at the amount billed to the customer. Payments of trade receivables are allocated to the specific invoices identified on the customer’s remittance advice or, if unspecified, are applied to the earliest unpaid invoices.
Ongoing credit evaluations of customers’ financial condition are performed and the Company maintains a reserve for potential credit losses. The carrying amount of trade receivables is reduced by a valuation allowance that reflects the Company’s best estimate of the amounts that will not be collected. The Company determines a receivable to be uncollectable and is written off against the reserve based on several criteria including such items as the credit evaluation of a customer’s financial condition, the aging of the receivable and previous unsuccessful collection efforts.
Notes to the Consolidated Financial Statements
AmericAn crystAl sugAr compAny 2120
Inventories
Sugar, pulp, molasses and other agri-products inventories are valued at estimated net realizable value. Operating supplies, maintenance parts, and sugarbeet seed inventories are valued at the lower of average cost or market. Sugarbeets are valued at the projected gross per-ton beet payment related to that year’s crop.
Net Property and Equipment Property and equipment are recorded at cost less impairment. Indirect costs and construction period interest are capitalized as a component of the cost of qualified assets. Property and equipment are depreciated for financial reporting purposes principally using straight-line methods with estimated useful lives ranging from 3 to 33 years.
Net Property and Equipment Held for LeaseNet property and equipment held for lease are stated at cost, net of accumulated depreciation. Depreciation on assets placed in service is provided using the straight-line method with estimated useful lives ranging from 5 to 40 years.
Impairment of Long Lived Assets
The Company reviews its long lived assets for impairment whenever events indicate that the carrying amount of the asset may not be recoverable. An impairment loss is recorded when the sum of the future cash flows is less than the carrying amount of the asset. An impairment loss is measured as the amount by which the carrying amount of the asset exceeds its fair value. The fair value of assets is a significant estimate and it is at least reasonably possible that a change in the estimate could occur in the near term. No impairment was recognized in 2011, 2010 or 2009.
Related Parties
The following organizations are considered related parties for financial reporting purposes: United Sugars Corporation (United), Midwest Agri-Commodities Company (Midwest) and West Coast Beet Seed Company.
Investments
Investments in CoBank, ACB are stated at cost plus unredeemed patronage refunds received in the form of capital stock. Investments in Marketing Cooperatives include investments in United and Midwest, which are accounted for using the equity method.
Members’ Investments
Preferred and Common Stock - The ownership of common and preferred stock is restricted to a “farm operator” as defined by the bylaws of the Company. Each shareholder may own only one share of common stock and is entitled to one vote in the affairs of the Company. Each shareholder is required to grow a specified number of acres of sugarbeets in proportion to the shares of preferred stock owned. The preferred shares are non-voting. All transfers of stock must be approved by the Company’s Board of Directors and any shareholder desiring to sell stock must first offer it to the Company for repurchase at its par value. The Company has never exercised this repurchase option for preferred stock. The Company’s articles of incorporation do not allow dividends to be paid on either the common or preferred stock.
Unit Retains - The bylaws authorize the Company’s Board of Directors to require additional direct capital investments by members in the form of a variable unit retain per ton of up to a maximum of 10 percent of the weighted average gross per ton beet payment. All refunds and retirements of unit retains must be approved by the Board of Directors.
Equity Retention – The Payment-In-Kind (PIK) Certificate Purchase Agreement authorizes the Company to require additional direct capital investments by members participating in the PIK program. The amount of the equity contribution is calculated per hundredweight of PIK certificates and is approximately equivalent (on a Company-wide average basis) to the unit retain declared by the Company on the corresponding year’s sugarbeet crop. All refunds and retirements of equity retains must be approved by the Board of Directors. All remaining Equity Retentions were refunded during 2009.
Accumulated Other Comprehensive Income (Loss) - Accumulated Other Comprehensive Income (Loss) represents the cumulative net increase (decrease) in equity related to the recording of the over-funded or under-funded status of defined benefit postretirement plans, the Company’s portion of the other comprehensive income (loss) of equity method investees and the gain or loss related to foreign currency forward contracts and interest rate swap contracts. Consistent with the Company’s treatment of income taxes related to member-source income and expenses, accumulated other comprehensive income (loss) does not include any adjustment for income taxes.
Retained Earnings (Accumulated Deficit) - Retained earnings represents the cumulative net income (loss) resulting from non-member business, the 2009 pension measurement date adjustment and, for years prior to 1996, the difference between member income as determined for financial reporting purposes and for federal income tax reporting purposes.
Interest Expense, Net
The Company earns patronage dividends from CoBank, ACB based on the Company’s share of the net income earned by CoBank, ACB. These patronage dividends are applied against interest expense.
Income Taxes
The Company is a non-exempt cooperative for federal income tax purposes. As such, the Company is subject to corporate income taxes on its net income from non-member sources. The provision for income taxes relates to the results of operations from non-member business, state income taxes and certain other permanent differences between financial and income tax reporting. The Company also has various temporary differences between financial and income tax reporting, most notable of which is depreciation.
Deferred tax assets, less any applicable valuation allowance, and deferred tax liabilities are included in the financial statements at currently enacted income tax rates applicable to the period in which the deferred tax assets and liabilities are expected to be realized or settled.
Accounting Estimates
The preparation of the financial statements in conformity with accounting principles generally accepted in the United States of America requires management to make estimates and assumptions that affect the reported amounts of assets and liabilities at the date of the financial statements and the reported amounts of revenues and expenses during the reporting period. Actual results could differ from those estimates.
Fair Value Measurements
Fair value is defined as the price that would be received from selling an asset or paid to transfer a liability in an orderly transaction between market participants at the measurement date. When determining the fair value measurements for assets and liabilities required to be recorded at fair value, the Company considers the principal or most advantageous market in which it would transact and considers assumptions that market participants would use when pricing the asset or liability, such as inherent risk, transfer restrictions, and risk of nonperformance.
The fair value hierarchy requires the Company to maximize the use of observable inputs and minimize the use of unobservable inputs when measuring fair value. A financial instrument’s categorization within the fair value hierarchy is based upon the lowest level of input that is significant to the fair value measurement. Three levels of inputs may be used to measure fair value:
Level 1: Quoted prices in active markets for identical assets or liabilities.
Level 2: Includes the following inputs:
• quotedpricesinactivemarketsforsimilarassetsorliabilities,
• quotedpricesforidenticalorsimilarassetsorliabilitiesinmarketsthatarenotactive,
• orotherinputsthatareobservableorcanbecorroboratedbyobservablemarketdataforsubstantiallythefulltermoftheassetsorliabilities.
Level 3: Unobservable inputs that are supported by little or no market activity and that are significant to the fair value of the assets or liabilities.
Derivative Instruments and Hedging Activities
The Company recognizes all derivatives in its Consolidated Balance Sheet at fair value. On the date the derivative instrument is entered into, the Company designates the derivative as either (1) a hedge of the fair value of a recognized asset or liability, or of an unrecognized firm commitment (“fair value hedge”) or (2) a hedge of a forecasted transaction or of the variability of cash flows to be received or paid related to a recognized asset or liability (“cash flow hedge”). The Company has entered into foreign currency forward contracts and an interest rate swap, each of which have been designated as a cash flow hedge. Changes in the fair value of a derivative designated as a cash flow hedge are recorded in accumulated other comprehensive income (loss) and are reclassified into earnings as the underlying hedged item affects earnings.
Business Risk
The financial results of the Company’s operations may be directly and materially affected by many factors, including prevailing prices of sugar and agri-products, the Company’s ability to market its sugar competitively, the weather, government programs and regulations, and operating costs.
AmericAn crystAl sugAr compAny 2322
Concentration and Sources of Labor
Substantially all of the hourly employees at the Company’s factories, including full-time and seasonal employees, are represented by the Bakery, Confectionery, Tobacco Workers and Grain Millers (BCTGM) AFL-CIO. The collective bargaining agreement for the Red River Valley factory employees expired on July 31, 2011. The collective bargaining agreement for the Sidney, Montana, factory employees will expire on April 30, 2012. Office, clerical and management employees are not unionized, except for certain office employees at the Moorhead and Crookston, Minnesota, and Hillsboro, North Dakota, factories who are covered by the collective bargaining agreement with the BCTGM.
On July 31, 2011, the Red River Valley factory and clerical employees represented by the BCTGM rejected the Company’s new contract offer. On August 1, 2011, the Company locked out the union employees and secured contract replacement workers to ensure the continued operation of the Company’s factories in order to meet its obligations to its customers and shareholders. The Company cannot predict the time-frame for the resolution of this matter.
Shipping and Handling CostsThe costs incurred for the shipping and handling of products sold are classified in the consolidated financial statements as a selling expense on the Consolidated Statements of Operations. Shipping and handling costs were $196.2 million, $153.7 million and $159.7 million for the years ended August 31, 2011, 2010 and 2009, respectively.
Deferred Costs and Product Values
All costs incurred prior to the end of the Company’s fiscal year that relate to receiving and processing the subsequent year’s sugarbeet crop are deferred. Similarly, the net realizable values of products produced prior to the end of the Company’s fiscal year that relate to the subsequent year’s sugarbeet crop are deferred. The net result of these deferred costs and product values are recorded in the Company’s consolidated balance sheet in “Other Current Liabilities.” Deferred costs and product values were $3.3 million as of August 31, 2010. There were no deferred costs and product values for the subsequent year’s sugarbeet crop as of August 31, 2011 or 2009.
Recently Issued Accounting PronouncementsIn January 2010, the FASB issued an update to the authoritative guidance which contains amendments and clarification to the guidance related to the disclosures involving recurring or nonrecurring fair value measurements. The new disclosures and clarifications became effective and were adopted by the Company in the third quarter of fiscal 2010 except for the disclosures about purchases, sales, issuances and settlements in the roll forward activity in Level 3 fair value measurements which becomes effective for the Company in the first quarter of fiscal 2012. The Company does not expect that the adoption of this guidance will have a material effect on the Company’s financial statements.
In December 2010, the FASB issued an update to the authoritative guidance which modifies step one of the goodwill impairment test for reporting units with zero or negative carrying amounts. The guidance provided by this update becomes effective for the Company in the first quarter of fiscal 2012. The Company does not expect that the adoption of this guidance will have a material effect on the Company’s financial statements.
In May 2011, the FASB issued an update to the authoritative guidance which establishes common requirements for measuring fair value and for disclosing information about fair value measurements in accordance with U.S. generally accepted accounting principles (GAAP) and International Financial Reporting Standards (IFRS). The guidance provided by this update becomes effective for the Company in the third quarter of fiscal 2012. The Company does not expect that the adoption of this guidance will have a material effect on the Company’s financial statements.
In June 2011, the FASB issued an update to the authoritative guidance which improves the comparability, consistency and transparency of financial reporting and increases the prominence of items reported in other comprehensive income. The guidance provided by this update becomes effective for the Company in the first quarter of fiscal 2013. The Company does not expect that the adoption of this guidance will have a material effect on the Company’s financial statements.
In September 2011, the FASB issued an update to the authoritative guidance which reduces the complexity and cost by allowing for a qualitative evaluation about the likelihood of goodwill impairment to determine whether the calculation of the fair value of a reporting unit is required. The guidance provided by this update becomes effective for the Company in the first quarter of fiscal 2013. The Company does not expect that the adoption of this guidance will have a material effect on the Company’s financial statements.
(2) RECEIVABLES:There was no single customer attributable to the Company that accounted for 10 percent or more of the Company’s total receivables as of August 31, 2011 or 2010 or that accounted for 10 percent or more of the revenues of the Company for the years ended August 31, 2011, 2010 or 2009.
(3) INVENTORIES:
The major components of inventories as of August 31, 2011 and 2010 are as follows:
(In Thousands) 2011 2010
Refined Sugar, Pulp, Molasses, Other Agri-Products and Sugarbeet Seed $ 178,862 $ 154,602
Unprocessed Sugarbeets — 4,396Operating Supplies and Maintenance Parts 65,176 45,119Total Inventories $ 244,038 $ 204,117
(4) NET PROPERTY AND EQUIPMENT:
Indirect costs capitalized were $1.5 million, $1.4 million and $1.1 million in 2011, 2010 and 2009, respectively. Construction period interest capitalized was $ .6 million, $ .6 million and $ .4 million in 2011, 2010 and 2009, respectively. Depreciation expense was $45.4 million, $43.4 million and $43.1 million in 2011, 2010 and 2009, respectively. The Company had outstanding commitments totaling $6.5 million as of August 31, 2011, for equipment and construction contracts related to various capital projects.
(5) NET PROPERTY AND EQUIPMENT HELD FOR LEASE:
ProGold owns a corn wet-milling facility that it leases under an operating lease which runs through December 31, 2017. Under the terms of the operating lease, the lessee manages all aspects of the operations of the ProGold corn wet-milling facility.
Net Property and Equipment Held for Lease are stated at cost, net of accumulated depreciation. Depreciation expense was $11.4 million, $11.2 million and $11.2 million in 2011, 2010 and 2009, respectively. The components of Net Property and Equipment Held for Lease as of August 31, 2011 and 2010, are shown below:
(In Thousands) 2011 2010
Land and Land Improvements $ 8,134 $ 8,022
Buildings 41,655 41,345
Equipment 206,761 204,881
Construction in Progress 1,398 1,952
Less Accumulated Depreciation (165,124) (153,867)
Net Property and Equipment Held for Lease $ 92,824 $ 102,333
Future minimum payments to be received under the lease are as follows:
Fiscal year ending August 31, (In Thousands)
2012 $ 21,500
2013 21,500
2014 21,500
2015 21,500
2016 21,500
Thereafter 28,667
Total $ 136,167
(6) INVESTMENTS IN MARKETING COOPERATIVES:The Company has a 64 percent ownership interest and a 33 1/3 percent voting interest in United. The investment is accounted for using the equity method. Substantially all sugar products produced are sold by United as an agent for the Company. The amount of sales and related costs to be recognized by each owner of United is allocated based on its pro rata share of sugar production for the year. The owners provide United with cash advances on an ongoing basis for operating and marketing expenses incurred by United. The Company had outstanding advances to United of $30.5 million and $14.6 million as of August 31, 2011 and 2010, respectively. The Company provides administrative services for United and is reimbursed for costs incurred. The Company was reimbursed $1.0 million, $1.0 million and $ .9 million for services provided during 2011, 2010 and 2009, respectively.
The Company has a 55 percent ownership interest and a 25 percent voting interest in Midwest. The investment is accounted for using the equity method. Substantially all sugarbeet pulp, molasses and other agri-products produced are sold by Midwest as an agent for the Company. The amount of sales and related costs to be recognized by each owner of Midwest is allocated based on its pro rata share of production for each product for the year. The owners provide Midwest with cash advances on an ongoing basis for operating and marketing expenses incurred by Midwest. The Company had outstanding advances due to Midwest of $4.8 million and $5.7 million as of August 31, 2011 and 2010, respectively. The Company provides administrative services for Midwest and is reimbursed for costs incurred. The Company was reimbursed $129,000, $122,000 and $133,000 for services provided during 2011, 2010 and 2009, respectively. The owners of Midwest are guarantors of the short-term line of credit Midwest has with CoBank, ACB. As of August 31, 2011, Midwest had outstanding short-term debt with CoBank, ACB of $4.8 million, of which $2.1 million was guaranteed by the Company.
The Company has performed a complete analysis and has determined that its investments in United and Midwest do not meet the criteria of Variable Interest Entities and therefore such entities are not consolidated in the Company’s Consolidated Financial Statements.
AmericAn crystAl sugAr compAny 2524

(In Thousands) Fair Value of Asset Derivatives as of August 31
Balance Sheet Location 2011 2010
Derivatives Designated as Hedging Instruments:
Foreign Currency Forward Contracts Prepaid Expenses $ 4 $ —
Total Asset Derivatives: $ 4 $ —
(In Thousands) Fair Value of Asset Derivatives as of August 31
Balance Sheet Location 2011 2010
Derivatives Designated as Hedging Instruments:
Foreign Currency Forward Contracts Other Current Liabilities $ — $ 24
Interest Rate Contracts Other Current Liabilities 677 644
Interest Rate Contracts Other Long-Term Liabilities 1,661 1,127
Total Liability Derivatives $ 2,338 $ 1,795
(9) OPERATING LEASES:
The Company is party to operating leases for such items as rail cars, computer hardware and vehicles. Cargill, Incorporated has assumed responsibility for the payments on a rail car lease for the duration of that lease and accordingly, the lease payments are not included in the table below. Operating lease expense was $ 2.0 million, $ 1.8 million and $ 2.0 million for years ended August 31, 2011, 2010 and 2009, respectively. Future minimum payments under these obligations are as follows:
Fiscal year ending August 31, (In Thousands)
2012 $ 1,5182013 1,4562014 1,1722015 1,0912016 1,032Thereafter 5,435Total $ 11,704
Minimum annual principal payments for the next five years are as follows:
(In Thousands)
2012 $ 5,765 2013 $ 280 2014 $ 3002015 $ 315 2016 $ 335
The Company has a long-term debt line of credit through July 30, 2015, with CoBank, ACB of $110.8 million, against which $70.7 million in long-term letters of credit were outstanding as of August 31, 2011. The unused long-term line of credit as of August 31, 2011, was $40.1 million.
The short-term debt outstanding as of August 31, 2011 and 2010, is summarized below:
(In Thousands) 2011 2010
Commercial Paper, at a fixed interest rate of .36% to .37%, due 9/1/11 through 9/9/11. $ 66,197 $ 5,000
During the year ended August 31, 2011, the Company issued commercial paper to meet its short-term borrowing requirements. The Company has a seasonal line of credit through July 19, 2015, with a consortium of lenders led by CoBank, ACB of $350.0 million, against which there was no outstanding balance as of August 31, 2011, and a line of credit with Wells Fargo Bank for $1.0 million, against which there was no outstanding balance as of August 31, 2011. The Company’s commercial paper program provides short-term borrowings up to $350.0 million of which approximately $66.2 million was outstanding as of August 31, 2011. The Company had $3.3 million in short-term letters of credit outstanding as of August 31, 2011. Any borrowings under the commercial paper program along with outstanding short-term letters of credit will act to reduce the available credit under the CoBank, ACB seasonal line of credit by a commensurate amount. The unused short-term line of credit as of August 31, 2011, was $281.5 million.
The Company can borrow funds on a non-recourse basis from the Commodity Credit Corporation (CCC), with repayment of such funds secured by sugar. The Company did not utilize the CCC during fiscal 2011. The limitations on such borrowings are based on the amount of the Company’s sugar inventory and certain loan covenant restrictions by CoBank, ACB. As of August 31, 2011, the Company had the capacity to obtain non-recourse loans from the CCC of approximately $112.9 million.
During the year ended August 31, 2010, the Company borrowed from CoBank, ACB and issued commercial paper to meet its short-term borrowing requirements. The Company had a seasonal line of credit through July 30, 2012, with a consortium of lenders led by CoBank, ACB of $320.0 million, against which there was no outstanding balance as of August 31, 2010, and a line of credit with Wells Fargo Bank for $1.0 million, against which there was no outstanding balance as of August 31, 2010. The Company’s commercial paper program provided short-term borrowings up to $320.0 million of which approximately $5.0 million was outstanding as of August 31, 2010. The Company had $3.0 million in short-term letters of credit outstanding as of August 31, 2010. Any borrowings under the commercial paper program along with outstanding short-term letters of credit act to reduce the available credit under the CoBank, ACB seasonal line of credit by a commensurate amount. The unused short-term line of credit as of August 31, 2010, was $313.0 million.
Maximum borrowings, average borrowing levels and average interest rates for short-term debt for the years ended August 31, 2011 and 2010, follow:
(In Thousands, Except Interest Rates) 2011 2010
Maximum Borrowings $ 335,474 $ 221,372Average Borrowing Levels $ 175,374 $ 104,389Average Interest Rates .71% .83%
The terms of the loan agreements contain prepayment penalties along with certain covenants related to, among other matters, the: level of working capital; ratio of term liabilities to members’ investments; current ratio; interest coverage ratio; and investment in CoBank, ACB stock in amounts prescribed by the bank. Substantially all non-current assets are pledged to the senior lenders to provide security to support the Company’s seasonal and long-term financing. As of August 31, 2011 and 2010, the Company was in compliance with the terms of the loan agreements.
Interest paid, net of amounts capitalized, was $7.9 million, $9.1 million and $10.7 million for the years ended August 31, 2011, 2010 and 2009, respectively.
(7) LONG-TERM AND SHORT-TERM DEBT:
The long-term debt outstanding as of August 31, 2011 and 2010, is summarized below:
(In Thousands) 2011 2010
Term Loans from CoBank, ACB $ — $ 21,293
Term Loans from Insurance Companies, due in varying amounts through fiscal 2028, interest at fixed rates of 7.32% to 7.42%, with senior lien on substantially all non-current assets 50,000 50,000
Pollution Control and Industrial Development Revenue Bonds, due in varying amounts through fiscal 2027, interest at fixed rates of 5.35% to 5.94% and varying rates of .22% to .31% as of August 31, 2011, substantially secured by letters of credit 84,405 69,780
Total Long-Term Debt 134,405 141, 073
Less Current Maturities (5,765) (375)
Long-Term Debt, Net of Current Maturities $ 128,640 $ 140,698
(8) DERIVATIVE INSTRUMENTS AND HEDGING ACTIVITIES:
The Company, as a result of its operating and financing activities, is exposed to changes in foreign currency exchange rates and interest rates which may adversely affect its results of operations and financial position. In seeking to minimize the risks and/or costs associated with such activities, the Company may enter into derivative contracts.
The Company manages its foreign currency related risks primarily through the use of foreign currency forward contracts. The contracts held by the Company are denominated in Euros. The Company has entered into foreign currency forward contracts that are designated as cash flow hedges of exchange rate risk related to foreign currency-denominated purchases of equipment. Inputs used to measure the fair value of the foreign currency forward contracts are contained within level 1 of the fair value hierarchy. At August 31, 2011, the Company had cash flow hedges for approximately 140,000 Euros with a maturity date of November 15, 2011. At August 31, 2011, the fair value of the open contracts reflected a gain of approximately $4,000 recorded in accumulated other comprehensive income (loss) in members’ equity. At August 31, 2010, the Company had cash flow hedges for approximately 219,000 Euros with maturity dates of September 30 to October 29, 2010. At August 31, 2010, the fair value of the open contracts reflected a loss of approximately $24,000 recorded in accumulated other comprehensive income (loss) in members’ equity. Amounts deferred to accumulated other comprehensive income (loss) are reclassified into the cost of the equipment when the actual purchase takes place.
The Company is exposed to interest risk primarily through its borrowing activities. On December 24, 2009, the Company entered into an interest rate swap contract associated with a $27.3 million Industrial Development Revenue Bond issue that matures on September 1, 2019. The interest rate swap contract requires payment of a fixed interest rate of 2.827% and the receipt of a variable rate of interest based on the Securities Industry and Financial Market Association (SIFMA) index of .128% as of August 31, 2011, on $27.3 million of indebtedness. The Company has designated this interest rate swap contract as a cash flow hedge. Inputs used to measure the fair value of the interest rate swap contracts are contained within level 2 of the fair value hierarchy. As of August 31, 2011, the fair value of the cash flow hedge reflected a loss of approximately $2.3 million recorded in accumulated other comprehensive income (loss) and will be reclassified to interest expense over the life of the swap contract. No ineffectiveness was recognized in earnings during the quarter ended August 31, 2011, or during the years ended August 31, 2011 and 2010. The current period loss of $184,000 is classified as interest expense on the statements of operations. As of August 31, 2011, $677,000 of deferred net losses on the interest rate swap contract contained in accumulated other comprehensive income (loss) are expected to be reclassified to earnings during the next 12 months. As of August 31, 2010, the fair value of the cash flow hedge reflected a loss of approximately $1.8 million recorded in accumulated other comprehensive income (loss).
AmericAn crystAl sugAr compAny 2726

The assumptions used in the measurement of the Company’s benefit obligations are shown below:
Weighted Average Assumptions as of August 31, Pension Post-Retirement
2011 2010 2011 2010
Discount Rate 5.12% 5.00% 5.12% 5.00% Expected Return on Plan Assets 7.50% 7.50% N/A N/ARate of Compensation Increase(Non-Union Plan Only) 3.5% 3.5% N/A N/A
The following schedule reflects the expected pension and post-retirement benefit payments during each of the next five years and the aggregate for the following five years: Expected Benefit Payments(In Thousands) Pension Post-Retirement
2012 $ 6,876 $ 1,127 2013 7,223 1,237 2014 7,966 1,525 2015 8,689 1,850 2016 9,457 2,138 2017-2021 62,206 13,646 Total $ 102,417 $ 21,523
(10) EMPLOYEE BENEFIT PLANS:
Company-Sponsored Defined Benefit Pension and Other Post-Retirement Benefit Plans
Substantially all employees who meet eligibility requirements of age, date of hire and length of service are covered by a Company-sponsored retirement plan. As of August 31, 2011, the pension plans were funded as required by the funding standards set forth by the Employee Retirement Income Security Act (ERISA). The Company also has non-qualified supplemental executive retirement plans for certain employees.
Employees of the Company who are not members of a collective bargaining unit and who are newly hired, or re-hired, and employees who transfer from a union position to a nonunion position on or after September 1, 2007, are not eligible for participation in the defined benefit pension plan. These employees participate in a defined contribution plan as described later in this note.
The Company’s Investment Committee has the responsibility of managing the operations and administration of the Company’s retirement plans and trust. Investment allocation decisions are made by the Investment Committee, pursuant to an Investment Policy (Policy) that includes a target strategic asset allocation. The Investment Committee is committed to diversification to reduce the risk of large losses. The Policy allows some flexibility within the target asset allocation in recognition that market fluctuations may cause the allocation to a specific asset class to move up or down within a range. The Policy is reviewed periodically by the Investment Committee. The asset allocation targets within the Plan, include four areas; Domestic Equity, International Equity, Fixed Income and Cash. Domestic and International Equity consists primarily of publicly traded U.S. and Non-U.S. equities, respectively. The cash allocation is allowed only as necessary for impending benefit payments, lump sum contributions made by the company, or as authorized by the Investment Committee. The Policy does not allow direct use of derivatives, however, the Plan invests entirely in commingled or mutual funds, which may allow investment in derivatives. The stated goal is for each component of the plan to earn a rate of return greater than its corresponding benchmark. Progress of the plan against its return objectives will be measured over a full market cycle.
The following schedule reflects the percentage of pension plan assets by asset class as of the latest measurement date, August 31, 2011:
Percentage of Pension Plan Assets by Asset Class as of August 31, 2011
Asset Class Target Range Actual Allocation
Domestic Equity 40.0%-60.0% 47.7%
International Equity 15.0%-25.0% 19.0%
Fixed Income 20.0%-40.0% 33.3%
Cash 0.0%-5.0% 0.0%
There have been no changes in the valuation methodologies used at August 31, 2011 and 2010. The Plan’s investment in the common/collective trust consists of investments in the WF Equity Index G Trust Fund (Fund) managed by Wells Fargo Bank NA. The Fund is a medium for collective investment of certain qualified employee benefit plans in common stocks designed to approximate the performance of the S&P 500 Index. Substantially all of the Fund’s assets are in common stocks that make up the S&P 500 Index, however the fund may also invest in S&P 500 Index Futures, common funds or investment companies, cash or cash equivalents or other securities. The net asset value of the Fund is determined daily. All earnings, gains and losses of the Fund are reflected in the computation of the daily unit value and are realized by the plan upon withdrawal from the Fund. The fund has a daily redemption frequency and redemption notice period with no unfunded commitments. Registered investment companies are valued at the net asset value of shares held by the Plan at year end based on quoted market prices. The money market fund is valued at quoted market price, which is cost plus accrued interest.
The methods described above may produce a fair value calculation that may not be indicative of net realizable value or reflective of future fair values. Furthermore, while the Plan believes its valuation methods are appropriate and consistent with other market participants, the use of different methodologies or assumptions to determine the fair value of certain financial instruments could result in a different fair value measurement at the reporting date. To develop the expected long-term rate of return on assets assumption, the Company considered the historical returns and the future expectations for returns for each asset class, as well as, the target asset allocation of the pension portfolio. This resulted in the selection of the 7.5% long-term rate of return on assets assumption.
(In Thousands) Plan Assets at Fair Value August 31, 2011
Level 1 Level 2 Level 3 Total
Common/collective trusts $ — $ 46,919 $ — $ 46,919 Registered investment company
Fixed income 54,692 — — 54,692
Equity 31,480 — — 31,480
International equity 31,263 — — 31,263 Money market fund 69 — — 69 Total Plan Assets at Fair Value $ 117,504 $ 46,919 $ — $ 164,423
(In Thousands) Plan Assets at Fair Value August 31, 2010
Level 1 Level 2 Level 3 Total Common/collective trusts $ — $ 34,293 $ — $ 34,293 Registered investment company
Fixed income 47,924 — — 47,924
Equity 28,828 — — 28,828
International equity 27,062 — — 27,062 Money market fund 371 — — 371 Total Plan Assets at Fair Value $ 104,185 $ 34,293 $ — $ 138,478
The development of the discount rate was based on a bond matching model whereby a hypothetical portfolio of bonds with an “AA” or better rating by a nationally recognized debt rating agency was constructed to match the expected benefit payments under the Company’s pension plans through the year 2040. The reinvestment rate for benefit cash flow occurring after 2040 was discounted back to the year 2040 at a rate consistent with the yields on long-term zero-coupon bonds. The resulting present value was treated as additional benefit cash flow for the year 2040 and consistently applied as any other benefit cash flow during the bond matching process.
The Company has a medical plan and a Medicare supplement plan which are available to union retirees and certain non-union retirees. The costs of these plans are shared by the Company and plan participants. The Company’s post-retirement plan for certain non-union employees currently coordinates with Medicare’s medical coverage and provides tiered prescription drug coverage. The Company has determined that this plan is actuarially equivalent to Medicare Part D and therefore qualifies for the Federal subsidy provision in the Medicare Prescription Drug, Improvement, and Modernization Act of 2003. This provision allows the Company to receive a subsidy of 28 percent of the dollars spent providing prescription drug coverage. The Company also participates in the Federal Early Retiree Reinsurance Program which provides reimbursement of medical expenses for early and disability retirees between the ages of 55 and 65 who are not covered by Medicare.
The following schedules reflect the fair values of the pension plan assets by major category as of August 31, 2011 and 2010:
AmericAn crystAl sugAr compAny 2928

The estimated amounts that will be amortized from Accumulated Other Comprehensive Income at August 31, 2011, into net periodic benefit cost in fiscal 2012 are as follows:
(In Thousands) Pension Post-RetirementAccumulated Gain (Loss) $ (7,129) $ 707
The accumulated pension benefit obligation was $182.6 million and $174.9 million as of August 31, 2011 and 2010, respectively.
Long-Term Incentive Plan
The Company’s Long-Term Incentive Plan provides deferred compensation to certain key executives of the Company. The plan creates financial incentives that are based upon contract rights which are available to the executive under the terms of the plan, the value of which is determined by the Board of Directors. During 2011, 75.96 vested contract rights were exercised. In 2011, 198.63 contract rights were granted at a stated value of $3,250 per contract right. At August 31, 2011, the Board of Directors increased the value of the 1,239.32 contract rights previously granted from $2,550 to $3,250 per contract right. As of August 31, 2011, there were 1,437.95 contract rights issued and outstanding at a stated value of $3,250 per contract right, of which 1,004.90 were vested.
Defined Contribution PlansThe Company has qualified 401(k) plans for all eligible employees. The plans provide for immediate vesting of benefits. Participants may contribute a percentage of their gross earnings each pay period as provided in the participation agreement. The Company matches the non-union and eligible union year-round participants’ contributions up to 4 percent and 2 percent, respectively, of their gross earnings. The Company’s contributions to these plans totaled $1.9 million, $1.8 million and $1.8 million for the years ended August 31, 2011, 2010 and 2009, respectively.
Employees of the Company who are not members of a collective bargaining unit and who are newly hired, or rehired, and employees who transfer from a union position to a nonunion position on or after September 1, 2007, are no longer eligible for participation in the defined benefit pension plan but receive a 4% non-elective Company Contribution to a defined contribution plan. The Company Contribution has a six year vesting schedule. The Company’s Contributions to this plan totaled $136,000, $115,000 and $87,000 for the years ended August 31, 2011, 2010 and 2009, respectively.
Funded StatusFunded Status as of August 31, $ 27,870 $ 45,814 $ 33,412 $ 31,230Net Amount Recognized $ 27,870 $ 45,814 $ 33,412 $ 31,230
Amounts Recognized in the Balance SheetsCurrent Liabilities $ (6,876) $ (6,290) $ (1,127) $ (1,004) Noncurrent Liabilities (20,994) (39,524) (32,285) (30,226) Net Amount Recognized $ (27,870) $ (45,814) $ (33,412) $ (31,230)
Prior Service Cost Recognized in Accumulated Other Comprehensive Income Prior Service Cost Beginning of the Year $ (989) $ (2,305) $ — $ —Recognized in Periodic Cost 989 1,316 — —Amount Arising During the Year — — — —Prior Service Cost End of the Year $ — $ (989) $ — $ —
Accumulated Gain (Loss) Recognized in Accumulated Other Comprehensive IncomeAccumulated Gain (Loss) Beginning of the Year $ (84,852) $ (62,816) $ 6,633 $ 7,651Recognized in Periodic Cost 9,489 6,940 (809) (687)Amount Arising During the Year 6,232 (28,976) (467) (331)Accumulated Gain (Loss) End of the Year $ (69,131) $ (84,852) $ 5,357 $ 6,633
The following schedules set forth a reconciliation of the changes in the plans’ benefit obligation and fair value of assets for the years ending August 31, 2011 and 2010, and a statement of the funded status and amounts recognized in the Balance Sheets and Accumulated Other Comprehensive Income as of August 31, 2011 and 2010: Pension Post-Retirement(In Thousands) 2011 2010 2011 2010
Change in Benefit Obligation Obligation at the Beginning of the Year $ 184,292 $ 142,377 $ 31,230 $ 28,728Service Cost 4,573 3,632 641 968Interest Cost 9,044 9,126 1,534 1,854Plan Participant Contributions — — 436 377Government Subsidies — — 170 72Actuarial (Gain) Loss 458 34,644 467 331Benefits Paid (6,074) (5,487) (1,066) (1,100)Obligation at the End of the Year $ 192,293 $ 184,292 $ 33,412 $ 31,230
Change in Plan AssetsFair Value at the Beginning of the Year $ 138,478 $ 123,973 $ — $ —Actual Return on Plan Assets 16,919 15,593 — —Plan Participant Contributions — — 436 377Government Subsidies — — 170 72Employer Contributions 15,100 4,399 460 651Benefits Paid (6,074) (5,487) (1,066) (1,100)Fair Value at the End of the Year $ 164,423 $ 138,478 $ — $ —
The Company expects to make contributions of approximately $10.0 million to the defined benefit pension plans during the next fiscal year. The Company expects to make contributions in the next fiscal year of approximately $99,000 related to Supplemental Executive Retirement Plans. The Company also expects to contribute approximately $1.1 million to the post-retirement plans during the next fiscal year.
The following schedules provide the components of the Net Periodic Pension and Post-Retirement Costs for the years ended August 31, 2011, 2010 and 2009:
Components of Net Periodic Pension Cost (In Thousands) 2011 2010 2009
Service Cost $ 4,573 $ 3,632 $ 4,197Interest Cost 9,044 9,126 10,673Expected Return on Plan Assets (10,230) (9,924) (15,456)Retained Earnings Measurement Date Adjustment — — (226)Amortization of Prior Service Costs 989 1,316 1,644Amortization of Net (Gain) Loss 9,489 6,940 70Net Periodic Pension Cost $ 13,865 $ 11,090 $ 902
Components of Net Periodic Post-Retirement Cost (In Thousands) 2011 2010 2009
Service Cost $ 641 $ 968 $ 968Interest Cost 1,534 1,854 1,887Amortization of Net (Gain) Loss (809) (687) (675)Net Periodic Post-Retirement Cost $ 1,366 $ 2,135 $ 2,180
Prior service costs are amortized over the lesser of seven years or the length of the union contract that included the benefit change.
For measurement purposes, an 8.25 percent annual rate of increase in the per capita cost of covered healthcare benefits for participants under age 65 was assumed for 2011. The rate is assumed to decline to 5.5 percent over the next five years. For participants age 65 and older, a 9.25 percent annual rate of increase in the per capita cost of covered healthcare benefits was assumed for 2011. The rate is assumed to decline to 6.5 percent over the next five years.
Assumed healthcare trends can have a significant effect on the amounts reported for healthcare plans. A one percent change in the assumed healthcare trend rates would have the following effects:
(In Thousands) 1% Increase 1% Decrease
Effect on total service and interest cost components of net periodic post-retirement benefit costs $ 153 $ (123)Effect on the accumulated post-retirement benefit obligation $ 4,52 9 $ (3,761)
AmericAn crystAl sugAr compAny 3130

(In Thousands) For the Year Ended August 31, 2011
Sugar Leasing Consolidated
Net Revenue from External Customers $1,518,977 $ 23,800 $1,542,777Gross Proceeds $1,098,739 $ 12,418 $1,111 ,157Depreciation and Amortization $ 46,951 $ 11,382 $ 58,333Interest Income $ 1,225 $ — $ 1,225Interest Expense $ 9,683 $ 1 $ 9,684Loss from Equity Method Investees $ (462) $ — $ (462)Other Income/(Expense), Net $ 167 $ (27) $ 140Consolidated Net Proceeds $ 798,559 $ 12,297 $ 810,856Capital Additions $ 62,852 $ 1,900 $ 64,752
(In Thousands) For the Year Ended August 31, 2010
Sugar Leasing Consolidated
Net Revenue from External Customers $1,179,349 $ 24,548 $1,203,897Gross Proceeds $ 769,747 $ 13,308 $ 783,055Depreciation and Amortization $ 44,340 $ 11,240 $ 55,580Interest Income $ 150 $ — $ 150Interest Expense $ 9,011 $ 1 $ 9,012Loss from Equity Method Investees $ (521) $ — $ (521)Other Income/(Expense), Net $ 176 $ (90) $ 86Consolidated Net Proceeds $ 519,418 $ 13,126 $ 532,544Capital Additions $ 71,425 $ 2,648 $ 74,073
(In Thousands) For the Year Ended August 31, 2009
Sugar Leasing Consolidated
Net Revenue from External Customers $1,176,289 $ 23,940 $1,200,229Gross Proceeds $ 781,753 $ 12,762 $ 794,515Depreciation and Amortization $ 43,869 $ 11,177 $ 55,046Interest Income $ 207 $ 2 $ 209Interest Expense $ 10,058 $ — $ 10,058Income from Equity Method Investees $ 636 $ — $ 636Other Income/(Expense), Net $ 3,447 $ (140) $ 3,307Consolidated Net Proceeds $ 529,799 $ 12,455 $ 542,254Capital Additions $ 46,423 $ 2,331 $ 48,754
(In Thousands) As of August 31, 2011
Sugar Leasing Consolidated
Property and Equipment, Net $ 398,415 $ — $ 398,415Assets Held for Lease, Net $ — $ 92,824 $ 92,824Segment Assets $ 782,028 $ 96,079 $ 878,107
(In Thousands) As of August 31, 2010
Sugar Leasing Consolidated
Property and Equipment, Net $ 381,516 $ — $ 381,516Assets Held for Lease, Net $ — $ 102,333 $ 102,333Segment Assets $ 682,311 $ 106,432 $ 788,743
(12) SEGMENT REPORTING:The Company has identified two reportable segments: Sugar and Leasing. The sugar segment is engaged primarily in the production and marketing of sugar from sugarbeets. It also sells agri-products and sugarbeet seed. The leasing segment is engaged in the leasing of a corn wet milling plant used in the production of high-fructose corn syrup. The segments are managed separately. There are no inter-segment sales. The leasing segment has a major customer that accounts for all of that segment’s revenue.
Summarized financial information concerning the Company’s reportable segments is shown below:
(11) MEMBERS’ INVESTMENTS:The following schedule details the Preferred Stock and Common Stock as of August 31, 2011, 2010 and 2009:
Par Shares Shares Issued Value Authorized & Outstanding
Preferred Stock: August 31, 2011 $ 76.77 600,000 498,570August 31, 2010 $ 76.77 600,000 498,570August 31, 2009 $ 76.77 600,000 498,570
Common Stock: August 31, 2011 $ 10.00 4,000 2,780August 31, 2010 $ 10.00 4,000 2,768August 31, 2009 $ 10.00 4,000 2,812
32
(In Thousands) Fair Value of Assets as of August 31, 2011 Level 1 Level 2 Level 3 Total
Foreign Currency Forward Contracts $ 4 $ — $ — $ 4 Total $ 4 $ — $ — $ 4
(In Thousands) Fair Value of Liabilities as of August 31, 2011
Level 1 Level 2 Level 3 Total Interest Rate Contracts $ — $ 2,338 $ — $ 2,338
Total $ — $ 2,338 $ — $ 2,338
(In Thousands) Fair Value of Liabilities as of August 31, 2010
Level 1 Level 2 Level 3 Total Foreign Currency Forward Contracts $ 24 $ — $ — $ 24
Interest Rate Contracts — 1,771 — 1,771 Total $ 24 $ 1,771 $ — $ 1,795
(13) FAIR VALUE OF FINANCIAL INSTRUMENTS:Fair value is the price that would be received to sell an asset or paid to transfer a liability in an orderly transaction between market participants at the measurement date. Quoted market prices are generally not available for the Company’s financial instruments. Fair values are based on judgments regarding anticipated cash flows, future expected loss experience, current economic conditions, risk characteristics of various financial instruments and other factors. These estimates involve uncertainties and matters of judgment, and therefore, cannot be determined with precision. Changes in assumptions could significantly affect the estimates.
Long-Term Debt, Inclusive of Current Maturities - Based upon discounted cash flows and current borrowing rates with similar maturities, the fair value of the long-term debt as of August 31, 2011, was approximately $135.2 million in comparison to the carrying value of $134.4 million. The fair value of the long-term debt as of August 31, 2010, was approximately $141.8 million in comparison to the carrying value of $141.1 million.
Investments in CoBank, ACB and Investments in Marketing Cooperatives - The Company believes it is not practical to estimate the fair value of these investments without incurring excessive costs because there is no established market for these securities and equity interests, and it is inappropriate to estimate future cash flows which are largely dependent on future earnings of these organizations.
Foreign Currency Forward Contracts - Based on a variety of pricing factors, which include the market price of the foreign currency forward contract available in the dealer-market, the fair value of the open contracts as of August 31, 2011, was an asset of approximately $4,000. The fair value of the open contracts as of August 31, 2010 ,was a liability of approximately $24,000. Inputs used to measure the fair value of the foreign currency forward contracts are quoted prices in active markets for identical assets or liabilities and therefore are contained within level 1 of the fair value hierarchy. See the tables below.
Interest Rate Contracts - Based on the zero coupon method in which the term, notional amount, and repricing date of the interest rate swap match the term, repricing date, and principal amount of the interest-bearing liability on which the hedging interest payments are due, the fair value of the interest rate contract as of August 31, 2011, was a liability of approximately $2.3 million. The fair value of the interest rate contract as of August 31, 2010, was a liability of approximately $1.8 million. Inputs used to measure the fair value of the interest rate swap contracts are quoted prices in active markets for similar assets or liabilities and therefore are contained within level 2 of the fair value hierarchy. See the tables below.
The tables below reflect the assets and liabilities measured at fair value on a recurring basis as of August 31, 2011 and 2010.
AmericAn crystAl sugAr compAny 33

(15) ENVIRONMENTAL MATTERS:
The Company is subject to extensive federal and state environmental laws and regulations with respect to water and air quality, solid waste disposal and odor and noise control. The Company conducts an ongoing compliance program designed to meet these environmental laws and regulations. The Company believes that it is in substantial compliance with applicable environmental laws and regulations. From time to time, however, the Company may be involved in investigations or determinations regarding matters that may arise in the ordinary course of business. The Company works closely with all affected government agencies to resolve environmental issues that have arisen and believes such issues will be resolved without any material adverse effect on the Company.
The Company’s sugar manufacturing process is energy intensive and generates carbon dioxide and other “Greenhouse Gases” (GHGs). Several bills have been passed or introduced in the United States Senate and House of Representatives that would regulate GHG emissions to reduce the impact of global climate change. The Company believes that industries generating GHGs, including the Company, could be subject to either federal or state regulation relating to climate change policies in the relatively near future. These policies, if adopted, will increase the Company’s energy and other operating costs. Depending on how these policies address imports, the domestic sugar market may have a competitive disadvantage compared with imported sugar. These policies could have a significant negative impact on the Company’s beet payment to shareholders if the Company is not able to pass the increased costs on to its customers.
On November 25, 2008, the Company entered into a stipulation agreement with the Minnesota Pollution Control Agency (MPCA) related to hydrogen sulfide emissions from its Crookston, East Grand Forks and Moorhead, Minnesota factories. As part of the stipulation agreement, the Company has agreed to make certain capital expenditures over the subsequent three years and implement specified changes in operating procedures to contain hydrogen sulfide emissions at the Minnesota factories. The Company is on schedule with the agreed to changes.
On August 12, 2011, the Company received a Finding of Violation and Notice of Violation from the United States Environmental Protection Agency (EPA) for alleged violations of the Clean Air Act concerning certain air emissions at the Company’s three Minnesota factories. The Company has entered into discussions with the EPA concerning the alleged violations. The Company, at this time, cannot predict the outcome of these discussions or the financial impact, if any, resulting from the resolution of this matter.
Including the expenditures related to the MPCA stipulation agreement, the Company has identified capital expenditures for environmental related projects over the next three years at the Company’s factory locations of approximately $4.5 million.
(14) INCOME TAXES:As of August 31, 2011 and 2010, the Company had no unrecognized tax benefits. Any future accrued interest or penalties related to unrecognized tax benefits will be recognized in income tax expense if incurred. The Company is no longer subject to U.S. Federal income tax examinations by tax authorities for fiscal years 2007 and earlier. The Company is no longer subject to state income tax examinations by tax authorities for fiscal years 2007 and earlier.
Total income tax payments were $3.2 million, $ .17 million and $1.8 million for the years ended August 31, 2011, 2010 and 2009, respectively.
The Company’s net deferred tax liability included in Other Liabilities on the Company’s Balance Sheets as of August 31, 2011 and 2010, is reflected below:
(In Thousands) 2011 2010Deferred Tax Assets related to non-patronage source temporary differences $ 7,066 $ 8,299Deferred Tax Liability related to non-patronage source temporary differences 13,242 14,951Net Deferred Tax Liability $ 6,176 $ 6,652
Income tax expense/(benefit) for the years ended August 31, 2011, 2010 and 2009, is as follows:
(In Thousands) 2011 2010 2009Current Income Taxes $ 2,347 $ 1,096 $ 713Deferred Income Taxes (476) 1,213 1,468Total Income Tax Expense $ 1,871 $ 2,309 $ 2,181
A reconciliation of the Company’s effective tax rates for the years ended August 31, 2011, 2010 and 2009, is shown below:
2011 2010 2009Federal tax expense at statutory rate 35.0% 35.0% 35.0%State tax expense at statutory rate 6.0% 6.0% 6.0%Payments to members (40.6)% (40.4)% (40.6)%Other, net (0.1)% (0.2)% —Effective tax rate 0.3% 0.4% 0.4%
34
(16) LEGAL MATTERS:
On September 21, 2009, the U.S. District Court (District Court) ruled against the U.S. Department of Agriculture (USDA) finding that the USDA violated federal law by failing to prepare an Environmental Impact Statement (EIS) before deregulating Roundup Ready® sugarbeets. On August 13, 2010, at a District Court hearing on interim remedies, the District Court issued a ruling confirming the ability of the shareholders to harvest the 2010 root crop even though it was produced primarily from Roundup Ready® sugarbeet seed but vacated the original decision by USDA to deregulate the use of Roundup Ready® sugarbeet seed. As a result, the planting of Roundup Ready® sugarbeet seed after August 13, 2010, was prohibited until further action was taken by USDA.
On February 4, 2011, the USDA issued an Environmental Assessment that partially deregulated Roundup Ready® sugarbeet seed, an action that allowed for the planting of Roundup Ready® sugarbeet seed for the 2011 sugarbeet crop, subject to certain conditions. On March 23, 2011, the Company entered into a compliance agreement with the USDA that sets forth the growing conditions the Company and its shareholders must comply with in order to plant Roundup Ready® sugarbeet seed. On March 30, 2011, the Company’s Board of Directors authorized the planting of Roundup Ready® sugarbeet seed for the 2011 growing season. This authorization allowed the Company shareholders to choose between conventional sugarbeet seed and Roundup Ready® sugarbeet seed.
The compliance agreement between the Company and USDA includes a number of conditions that individual shareholders, and the Company as a whole, must strictly observe. Each shareholder desiring to plant Roundup Ready® sugarbeets must sign an addendum to their annual contract, under which they agree to comply with all regulatory requirements associated with planting Roundup Ready® sugarbeets. Failure to comply with the conditions may result in a shareholder not being permitted to harvest his or her crop. In addition, a shareholder’s noncompliance could result in a breach of the compliance agreement by the Company, which conceivably could mean that no Roundup Ready® sugarbeets planted by any shareholder would be harvested. If a significant number of shareholders are not allowed to harvest their Roundup Ready® sugarbeets for any reason the Company could experience material adverse financial consequences that would impact both the Company and its members.
In order to mitigate the risk of non-delivery by a shareholder who plants Roundup Ready® sugarbeet seed, both the Five Year Agreement that each shareholder already has in place with the Company as well as the Roundup Ready® addendum that must be signed in order to plant Roundup Ready® varieties, include language that obligates the shareholder to pay liquidated damages equal to the Company’s fixed costs if the shareholder’s Roundup Ready® sugarbeets are not harvested for legal or regulatory reasons. This liquidated damage requirement is in place to mitigate the financial risk to the Company in the event of a decision that prevents the harvest of Roundup Ready® sugarbeets by one or more shareholders.
The same plaintiffs who have repeatedly raised legal challenges to the planting of Roundup Ready® sugarbeets have made public statements that they plan to continue to oppose the use of the technology. Litigation is currently pending in two consolidated cases in the Federal District Court in Washington, D.C. concerning the scope and validity of the Environmental Assessment. No decision is expected in those cases before the spring of 2012. Although the Company believes the risk is low, the possibility exists that a subsequent ruling by the District Court could result in the inability of shareholders to plant Roundup Ready® sugarbeet seed in subsequent years.
On October 11, 2011, the USDA issued a draft Environmental Impact Statement (EIS) fully analyzing the impact of Roundup Ready® sugarbeets. The draft EIS considers the impact of one of three alternative regulatory approaches – the regulation, deregulation, or partial deregulation of Roundup Ready® sugarbeets. USDA indicated that its preferred alternative is to fully deregulate Roundup Ready® sugarbeets. After receiving and analyzing public comments on the draft EIS, USDA will issue a final EIS, likely sometime in 2012. The final EIS could then be subject to further legal challenge. In the meantime, the Company anticipates that the 2012 sugarbeet crop will again be planted under the compliance agreements that were signed in 2011. At this time there is no regulatory basis to allow planting of Roundup Ready® sugarbeet seed in 2013 and beyond. If Roundup Ready® sugarbeets are not deregulated as contemplated in the draft EIS, shareholders may be required to plant conventional sugarbeet seed.
Approximately 86% of the acres planted by shareholders for the 2011 crop utilized Roundup Ready® sugarbeet seed. In order to mitigate the risk of non-delivery by a shareholder who plants Roundup Ready® sugarbeet seed, both the five year agreement that each shareholder already has in place with the Company as well as a Roundup Ready® addendum that must be signed in order to plant Roundup Ready® varieties, include language that obligates the shareholder to pay liquidated damages equal to the Company’s fixed costs if their Roundup Ready® beets are not harvested for legal or regulatory reasons. This liquidated damage requirement is in place to ensure that a possible legal decision that prevents the harvest of Roundup Ready® beets will not financially damage the Company and those shareholders that grow conventional sugarbeets.
The BCTGM filed unfair labor practice charges against the Company with the National Labor Relations Board (NLRB) associated with the negotiations for a new collective bargaining agreement and the lockout of union employees upon the expiration of the previous collective bargaining agreement. The NRLB subsequently dismissed all the charges against the Company. However, the BCTGM has appealed the decisions by the NLRB. The Company intends to continue to vigorously defend its position but cannot predict the ultimate outcome of these matters.
(17) SUBSEQUENT EVENTS:
The Company has evaluated events through the date that the financial statements were issued, for potential recognition or disclosure in the August 31, 2011 financial statements.
AmericAn crystAl sugAr compAny 35

For the Years Ended August 31
(In Thousands, Except Per-Ton-Purchased and Per-Acre-Harvested Amounts) (Not Covered by Report of Independent Registered Public Accounting Firm) 2011 2010 2009 2008 2007 2006 2005 2004 2003 2002
Net Proceeds Attributable to American Crystal Sugar Company $ 804,831 $ 526,112 $ 536,151 $ 542,693 $ 601,392 $ 445,091 $ 373,260 $ 473,122 $ 361,902 $ 398,588 PIK Payment, including Equity Retention — — — — — — — — — (23,497) Non-Member (Income) Loss (8,741) (5,426) (2,309) 4,787 (2,286) (2,246) (2,475) (4,240) (5,799) 733
Member Gross Beet Payment 796,090 520,686 533,842 547,480 599,106 442,845 370,785 468,882 356,103 375,824 Unit Retains (43,574) (29,531) (31,024) (23,260) (35,705) (26,417) (18,840) (29,991) (17,486) (24,154)
Member Net Beet Payment $ 752,516 $ 491,155 $ 502,818 $ 524,220 $ 563,401 $ 416,428 $ 351,945 $ 438,891 $ 338,617 $ 351,670
Per Ton Purchased:
Net Proceeds Attributable to American Crystal Sugar Company $ 73.82 $ 53.42 $ 51.80 $ 46.63 $ 50.49 $ 50.50 $ 39.59 $ 47.2 9 $ 41.36 $ 49.47 PIK Payment, including Equity Retention — — — — — — — — — (2.92) Non-Member (Income) Loss (0.80) (0.55) (0.22) 0.41 (0.19) (0.25) (0.26) (0.43) (0.66) 0.09
Member Gross Beet Payment 73.02 52.87 51.58 47.04 50.30 50.25 39.33 46. 86 40. 70 46.64 Unit Retains (4.00) (3.00) (3.00) (2.00) (3.00) (3.00) (2.00) (3. 00) (2.00) (3.00)
Member Net Beet Payment $ 69.02 $ 49.87 $ 48.58 $ 45.04 $ 47.30 $ 47.25 $ 37.33 $ 43. 8 6 $ 38. 70 $ 43.64
Member Tons Harvested 10,902 9,849 10,349 11,639 11,911 8,813 9,427 10,006 8,749 8,058
Member Gross Beet Payment Per Acre Harvested $ 1,923 $ 1,177 $ 1,310 $ 1,107 $ 1,278 $ 947 $ 764 $ 945 $ 711 $ 829
Member Net Beet Payment Per Acre Harvested $ 1,818 $ 1,110 $ 1,234 $ 1,060 $ 1,201 $ 890 $ 725 $ 885 $ 676 $ 776
Distribution of Net Proceeds Attributable to American Crystal Sugar Company
Gross Beet Payment Per Average Ton (DOLLARS per ton)
Gross Beet Payment(MILLIONS of dollars)
Net Beet Payment(MILLIONS of dollars)
Gross Beet Payment Per Average Acre (DOLLARS per acre)
Net Beet Payment Per Average Ton (DOLLARS per ton)
Net Beet Payment Per Average Acre (DOLLARS per acre)
$0
$200
$400
$600
$800
$1000
$1200
$1400
$1800
$2000
$1600
08 10 1109070605040302$0
$10
$20
$30
$40
$50
$60
$70
$80
08 10 1109070605040302
$0
$100
$200
$300
$400
$500
$600
$700
$800
08 10 1109070605040302$0
$200
$400
$600
$800
$1000
$1200
$1400
$1800
$2000
$1600
08 10 1109070605040302
$0
$10
$20
$30
$40
$50
$60
$70
08 10 1109070605040302$0
$100
$200
$300
$400
$500
$600
$700
$800
08 10 1109070605040302
AmericAn crystAl sugAr compAny 3736
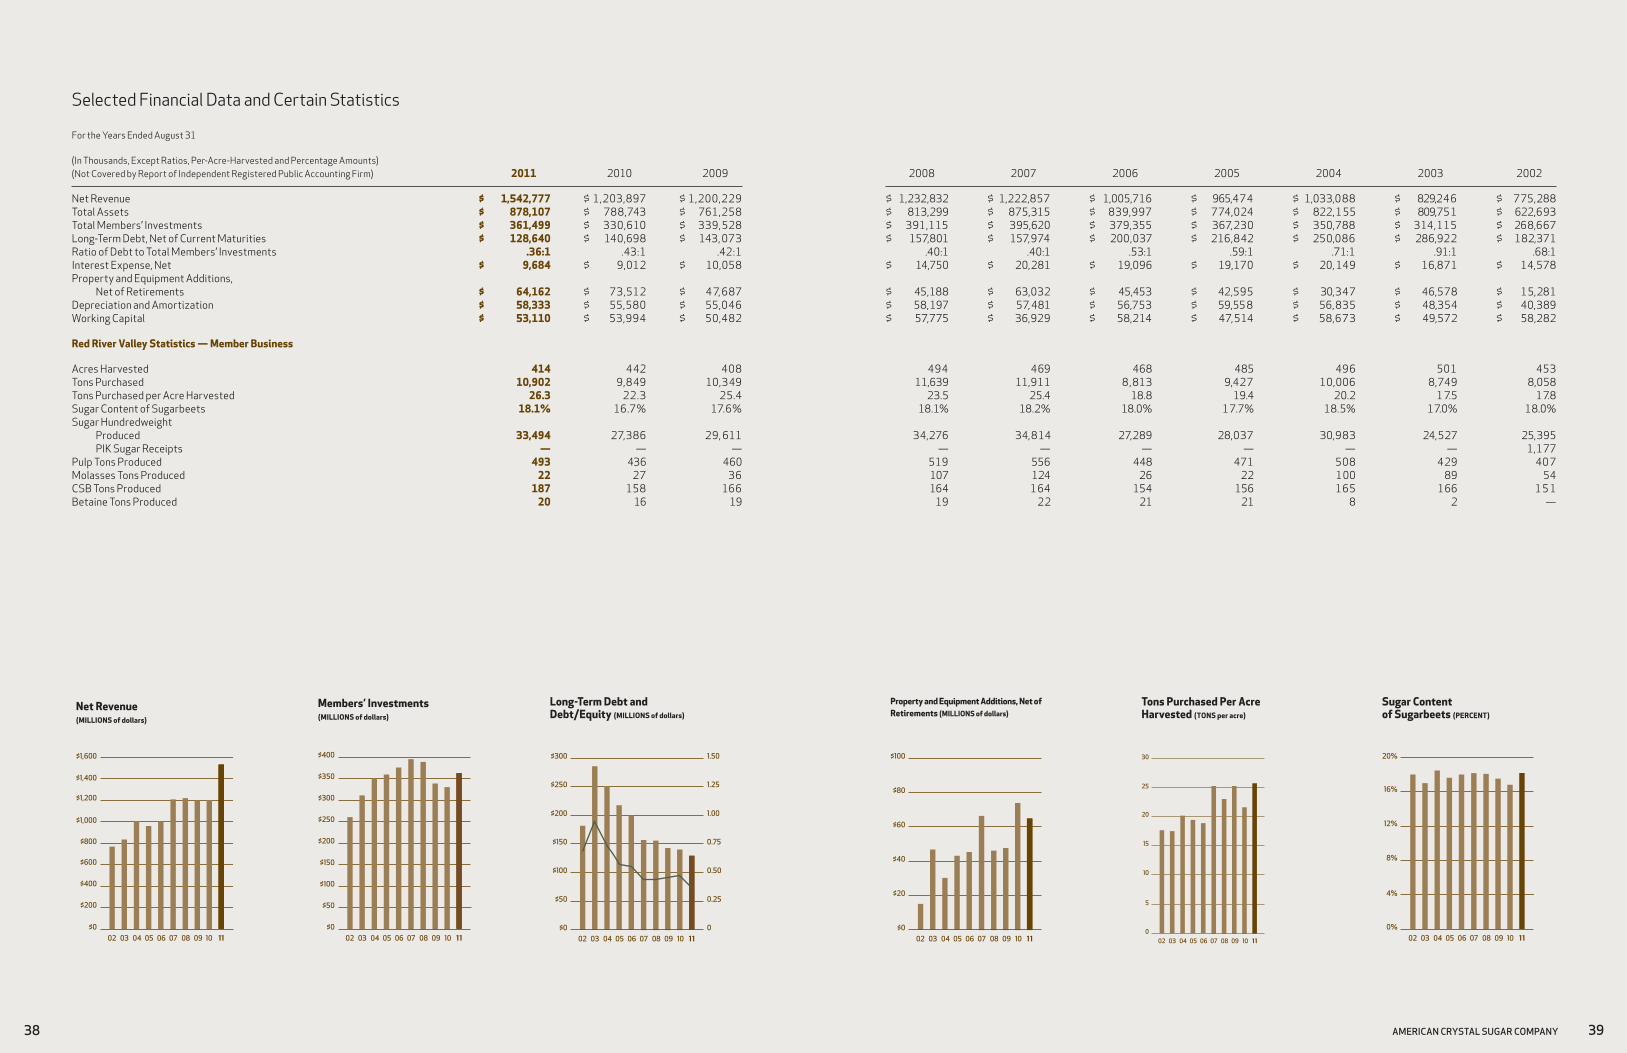
For the Years Ended August 31
(In Thousands, Except Ratios, Per-Acre-Harvested and Percentage Amounts) (Not Covered by Report of Independent Registered Public Accounting Firm) 2011 2010 2009 2008 2007 2006 2005 2004 2003 2002
Net Revenue $ 1,542,777 $ 1,203,897 $ 1,200,229 $ 1,232,832 $ 1,222,857 $ 1,005,716 $ 965,474 $ 1,033,088 $ 829,246 $ 775,288 Total Assets $ 878,107 $ 788,743 $ 761,258 $ 813,299 $ 875,315 $ 839,997 $ 774,024 $ 822,155 $ 809,751 $ 622,693 Total Members’ Investments $ 361,499 $ 330,610 $ 339, 528 $ 391,115 $ 395,620 $ 379,355 $ 367,230 $ 350,788 $ 314,115 $ 268,667 Long-Term Debt, Net of Current Maturities $ 128,640 $ 140,698 $ 143, 073 $ 157,801 $ 157,974 $ 200,037 $ 216,842 $ 250,086 $ 286,922 $ 182,371 Ratio of Debt to Total Members’ Investments .36:1 .43:1 .42:1 .40:1 .40:1 .53:1 .59:1 .71:1 .91:1 .68:1 Interest Expense, Net $ 9,684 $ 9,012 $ 10,058 $ 14,750 $ 20,281 $ 19,096 $ 19,170 $ 20, 149 $ 16,871 $ 14,578 Property and Equipment Additions, Net of Retirements $ 64,162 $ 73,512 $ 4 7, 687 $ 45,188 $ 63,032 $ 45,453 $ 42,595 $ 30,347 $ 46,578 $ 15,281 Depreciation and Amortization $ 58,333 $ 55,580 $ 55,046 $ 58,197 $ 57, 481 $ 56,753 $ 59,55 8 $ 56, 835 $ 48,354 $ 40,389 Working Capital $ 53,110 $ 53,994 $ 50,482 $ 57,775 $ 36,929 $ 58,214 $ 47,514 $ 58,673 $ 49,572 $ 58,282
Red River Valley Statistics — Member Business
Acres Harvested 414 442 408 494 469 468 485 496 501 453 Tons Purchased 10,902 9,849 10,349 11,639 11,911 8 , 813 9,427 10,006 8,749 8,058 Tons Purchased per Acre Harvested 26.3 22.3 25.4 23.5 25.4 18.8 19.4 20.2 1 7.5 17.8 Sugar Content of Sugarbeets 18.1% 16.7% 17.6% 18.1% 18.2% 18.0% 17.7% 18.5% 17.0% 18.0% Sugar Hundredweight Produced 33,494 27,386 29, 611 34,276 34,814 27,289 28,037 30,983 24,527 25,395 PIK Sugar Receipts — — — — — — — — — 1,177 Pulp Tons Produced 493 436 460 519 556 448 471 508 429 40 7 Molasses Tons Produced 22 27 36 107 124 26 22 100 89 54 CSB Tons Produced 187 158 166 164 164 154 156 165 166 15 1 Betaine Tons Produced 20 16 19 19 22 21 21 8 2 —
Selected Financial Data and Certain Statistics
Net Revenue(MILLIONS of dollars)
Members’ Investments(MILLIONS of dollars)
Long-Term Debt and Debt/Equity (MILLIONS of dollars)
Property and Equipment Additions, Net of Retirements (MILLIONS of dollars)
Tons Purchased Per Acre Harvested (TONS per acre)
Sugar Content of Sugarbeets (PERCENT)
0%
4%
8%
12%
16%
20%
08 10 11090706050403020
5
10
15
20
25
30
08 10 1109070605040302
$0
$20
$40
$60
$80
$100
08 10 1109070605040302
$0
$50
$100
$150
$200
$250
$300
0
0.25
0.50
0.75
1.00
1.25
1.50
08 10 1109070605040302
$0
$50
$100
$150
$200
$250
$300
$350
$400
08 10 1109070605040302
$0
$200
$400
$600
$800
$1,000
$1,200
$1,400
$1,600
08 10 1109070605040302
AmericAn crystAl sugAr compAny 3938

Marketing
Midwest Agri-CommoditiesCompany Headquarters999 Fift h Avenue, Suite 500San Rafael, CA 94901(415) 259-2720
James Eichenberger President
Darryl Salter Vice President–North American Operations
Kevin Christensen Vice President – Finance
United SugarsCorporation Headquarters7803 Glenroy Road, Suite 300Bloomington, MN 55439(952) 896-0131
John Doxsie President
Mike Kerber Vice President – Sales and Marketing – Consumer
Catherine Maruska Vice President – Operations
Dirk Swart Vice President–Sales and Marketing–Industrial
Paul Wengronowitz Vice President–Finance
Business Information
Executive Personnel
David A. BergPresident and ChiefExecutive Offi cer
Thomas S. AstrupVice President – Finance and ChiefFinancial Offi cer
Brian F. IngulsrudVice President – Administration
Joseph J. TalleyChief Operating Offi cer
Daniel C. Mo� Secretary and General Counsel
Kevin S. PriceDirector–Government Aff airs
Samuel S.M. WaiTreasurerAssistant Secretary
Teresa A. WarneCorporate ControllerAssistant TreasurerAssistant Secretary
Mark L. LembkeAssistant TreasurerAssistant Secretary
David L. MalmskogAssistant TreasurerAssistant Secretary
Ronald K. PetersonAssistant TreasurerAssistant Secretary
Lisa M. MaloyAssistant Secretary
Annual Meeting
The 2011 Annual Meetingof the members will be heldDecember 1, 2011, at theHoliday Inn, Fargo, ND
Auditors
Eide Bailly LLPSioux Falls, SD
Legal Counsel
Fredrikson & Byron PAMinneapolis, MN
Shareholder Information
The Treasury Departmentcan help members with beet payments, transferring shares, changes of address, and similar matt ers. For assistance, contact:
Karen Brown Stockholder Accounting Supervisor (1) 3-3
Financial Information
For information regardingAmerican Crystal businessoperations or fi nancialreports, shareholdersshould contact:
Thomas S. Astrup Vice President – Finance and Chief Financial Offi cer (1) 3-
News Media Inquiries
News media representativesand others needinginformation about AmericanCrystal corporate activitiesshould contact:
Jeff Schweitzer Public Relations Manager (1) 3-
40
Steve SingGeneral Manager
Russ FullmerAgricultural Manager
Crookston FactoryP.O. Box 600Crookston, MN 56716
David Walden Director, Factory Operations (1) 1-1
Drayton FactoryP.O. Box 190Drayton, ND 58225
Ron Koester Factory Manager (1) -33
East Grand Forks FactoryP.O. Box 357East Grand Forks, MN 56721
Lloyd Kennedy Factory Manager (1) 3-1
Hillsboro Factory121 Hwy 18 NEHillsboro, ND 58045
Brad Carlson Factory Manager (1) 3-313
Moorhead Factory2500 North 11th StreetMoorhead, MN 56560
Randy Axtman Factory Manager (1) 1-31
Sidney Sugars Factory35140 County Road 125Sidney, MT 59270(406) 433-3301
Thomas S. Astrup Chief Operating Offi cer
Jerry ChristensonAgronomy Manager(1) 1-1
Tom Newcomb Agronomy Manager(1) -33
Jerry ChristensonAgronomy Manager(1) 1-1
Greg RichardsAgronomy Manager(1) 1-
Greg RichardsAgronomy Manager(1) 1-

NorthThirdStreet•Moorhead,Minnesota•www.crystalsugar.com