american educational research journal - sage … educational research doi: 10.3102/0002831208319722...
TRANSCRIPT

http://aerj.aera.net
Journal American Educational Research
DOI: 10.3102/0002831208319722 2008; 45; 796 originally published online Jun 18, 2008; Am Educ Res J
Saddler, Susan Moran and Linda Mason Steve Graham, Paul Morphy, Karen R. Harris, Barbara Fink-Chorzempa, Bruce
Instructional Practices and AdaptationsTeaching Spelling in the Primary Grades: A National Survey of
http://aer.sagepub.com/cgi/content/abstract/45/3/796 The online version of this article can be found at:
Published on behalf of
http://www.aera.net
By
http://www.sagepublications.com
can be found at:American Educational Research Journal Additional services and information for
http://aerj.aera.net/cgi/alerts Email Alerts:
http://aerj.aera.net/subscriptions Subscriptions:
http://www.aera.net/reprintsReprints:
http://www.aera.net/permissionsPermissions:
by SJO TEMP 2008 on November 30, 2008 http://aerj.aera.netDownloaded from

Teaching Spelling in the Primary Grades:A National Survey of Instructional
Practices and Adaptations
Steve GrahamPaul Morphy
Karen R. HarrisVanderbilt University
Barbara Fink-ChorzempaState University of New York–New Paltz
Bruce SaddlerUniversity of Albany
Susan MoranUniversity of Maryland
Linda MasonPennsylvania State University
Primary grade teachers randomly selected from across the United Sates com-pleted a survey (N = 168) that examined their instructional practices inspelling and the types of adaptations they made for struggling spellers. Almostevery single teacher surveyed reported teaching spelling, and the vast major-ity of respondents implemented a complex and multifaceted instructionalprogram that applied a variety of research-supported procedures. Althoughsome teachers were sensitive to the instructional needs of weaker spellers andreported making many different adaptations for these students, a sizableminority of teachers (42%) indicated they made few or no adaptations. Inaddition, the teachers indicated that 27% of their students experienced diffi-culty with spelling, calling into question the effectiveness of their instructionwith these children.
KEYWORDS: elementary schools, survey research, instructional practices,spelling, spelling instruction
Mastering spelling is important to both writing and reading. Spellingerrors make text more difficult to read. They can also cause the reader
to devalue the quality of the writer’s message (Marshall, 1967; Marshall &
American Educational Research JournalSeptember 2008, Vol. 45, No. 3, pp. 796-825
DOI: 10.3102/0002831208319722© 2008 AERA. http://aerj.aera.net
by SJO TEMP 2008 on November 30, 2008 http://aerj.aera.netDownloaded from

Instructional Adaptations
797
Powers, 1969). Spelling difficulties can interfere with the execution of othercomposing processes (Berninger, 1999). Having to consciously think abouthow to spell a word while writing, for example, may tax a writer’s process-ing memory, leading him or her to forget ideas or plans he or she is tryingto retain in working memory (S. Graham, Harris, & Fink-Chorzempa, 2002).Spelling difficulties can even influence the words writers use when writing,as they are less likely to choose words they cannot spell (S. Graham & Harris,2005).
McCutchen (1988) and others (Berninger, 1999) have further argued thattranscriptions skills, such as spelling, shape young children’s approach towriting, as they are so cognitively demanding that children minimize the useof other composing processes, such as planning and revising, that exert con-siderable processing demands, too. The resulting approach to writing, whichpersists well beyond the primary grades, mainly involves telling what oneknows, with little attention directed to rhetorical goals, whole-text organiza-tion, or the needs of the reader (Scardamalia & Bereiter, 1986). Likewise,Berninger (Berninger, Mizokawa, & Bragg, 1991) found that primary-grade
STEVE GRAHAM is Currey Ingram Professor of Special Education and Literacy atVanderbilt University, Department of Special Education, Peabody #328, 230 AppletonPlace, Nashville, TN 37203-5721; e-mail: [email protected]. His researchinterests are writing, self-regulation, and learning disabilities.
PAUL MORPHY is a doctoral student in special education at Vanderbilt University,Department of Special Education, Peabody #328, 230 Appleton Place, Nashville,TN 37203-5721; e-mail: [email protected]. His research interests arestatistical analysis, meta-analysis, writing, and reading.
KAREN R. HARRIS is Currey Ingram Professor in Special Education and Literacy atVanderbilt University, Department of Special Education, Peabody #328, 230 AppletonPlace, Nashville, TN 37203-5721; e-mail: [email protected]. Her researchinterests are strategy instruction, self-regulation, writing, and learning disabilities.
BARBARA FINK-CHORZEMPA is an assistant professor in the Department ofEducational Studies, State University of New York–New Paltz, 1 Hawk Drive, NewPaltz, NY 12561; e-mail: [email protected]. Her research interests are reading,writing, and learning disabilities.
BRUCE SADDLER is an assistant professor of educational psychology and statisticsat the University at Albany, Education 226, 1400 Washington Avenue, Albany NY12222; e-mail: [email protected]. His research interests are sentence-combining instruction, strategy instruction, writing, and learning disabilities.
SUSAN MORAN received her PhD from the University of Maryland; e-mail:[email protected]. Her research interests are learning disabilities, self-monitoring,and writing.
LINDA MASON is an assistant professor in the Department of Educational andSchool Psychology and Special Education at Pennsylvania State University, 0210Cedar Building, University Park PA 16802; e-mail: [email protected]. Her research inter-ests are strategy instruction, reading, writing, and learning disabilities.
by SJO TEMP 2008 on November 30, 2008 http://aerj.aera.netDownloaded from

children who have difficulty with spelling avoid writing and develop a mind-set that they cannot write, leading to arrested writing development. In con-trast, learning about spelling can enhance early reading development byshaping children’s knowledge of phonemic awareness, strengthening theirgrasp of the alphabetic principle, and making sight words easier to remem-ber (Adams, 1990; Ehri, 1987; Moats, 2005/2006; Treiman, 1993).
Because spelling is so important to young children’s literacy develop-ment, it is critical that spelling is taught effectively during the primary grades.This should help minimize spelling’s constraints on writing as well as facili-tate the acquisition of foundational reading skills, such as word attack andword recognition (see Berninger et al., 1998, and S. Graham et al., 2002, forexamples of these effects). The success of such efforts depends, in part, onproviding spelling instruction that is responsive to children’s individual needs(S. Graham & Harris, 2002). As Corno and Snow (1986) noted, improved edu-cational outcomes depend on adjusting instruction to individual differencesamong children. This has become increasingly important in recent years, asschools have become more academically diverse (Fuchs & Fuchs, 1998), andmost students with disabilities now receive all or part of their education inregular classrooms. In addition, more children come from families livingbelow the poverty line, placing them at greater risk for academic difficulties(Stallings, 1995).
Although educational theorists, teachers, and students agree that instruc-tional adaptations are desirable (Randi & Corno, 2005; Schumm & Vaughn,1991; Tobias, 1995), there is very little information on how teachers adapttheir instruction to meet students’ needs. Pressley and colleagues (e.g.,Pressley, Rankin, & Yokoi, 1996; Wharton-McDonald, Pressley, & Hampston,1998) reported that outstanding literacy teachers deliver a common curricu-lum to all students but adjust their teaching within this framework to meetstudents’ individual needs, especially for those experiencing difficulty. Theseteachers provide considerable individualized instruction to children. Thisstands in contrast to other studies that found that typical teachers make fewadaptations (e.g., Baker & Zigmond, 1990; Fuchs & Fuchs, 1998) and thattheir students continue to struggle when adaptations are not made (e.g.,Phillips, Fuchs, Fuchs, & Hamlett, 1996).
The study reported here examined primary-grade teachers’ instructionaladaptations for children experiencing difficulty with spelling. We concen-trated specifically on these students because their spelling difficulties putthem at greater risk for writing problems and because they are less likely tobenefit from the potential positive impact of spelling on reading due theirslow rate of spelling growth. In contrast to Pressley and his colleagues (e.g.,Pressley et al., 1996; Wharton-McDonald et al., 1998), who examined theteaching and adaptations of outstanding primary-grade literacy teachers, wefocused our investigation on more typical teachers. A national sample of ran-domly selected primary-grade teachers was surveyed about their instructionalpractices in spelling and the types of adaptations they made for strugglingspellers.
Graham et al.
798 by SJO TEMP 2008 on November 30, 2008 http://aerj.aera.netDownloaded from

Relatively few studies have examined the spelling practices of contem-porary primary-grade teachers or the adaptations they make for strugglingspellers. Two recent national surveys of writing instruction (Cutler &Graham, in press; S. Graham, Harris, Fink-Chorzempa, & MacArthur, 2003)found that most primary-grade teachers reported teaching spelling, fre-quently encouraged the use of invented spelling, and taught spelling words,phonics for spelling, and strategies for spelling unknown words on at leasta weekly basis. The only study we were able to locate that examined theadaptations teachers typically make for struggling students was the abovesurvey by S. Graham et al. (2003), but only four of the questions askedfocused specifically on spelling. These teachers reported that they more fre-quently taught phonics for spelling and strategies for spelling unknownwords to weaker writers than stronger ones. They further encouraged weakerwriters to use invented spellings more often. It is important to note that a siz-able minority of teachers (42%) reported making few adaptations (zero totwo) for any part of their writing program for weaker writers, with 75% ofall adaptations made by just one third of the teachers.
To obtain information on adaptations for weaker spellers in this study,we asked teachers to indicate how often specific spelling activities and pro-cedures were used with weaker and stronger spellers in their class. If aspelling activity or procedure occurred more often with weaker spellers thanstronger spellers, then it represented a departure from the general teachingroutine and was considered an adaptation. The spelling activities and pro-cedures included in our survey were selected because each is a commonlyrecommended staple of primary-grade spelling instruction, it is reasonableto expect that teachers might adjust each technique when working withweaker spellers, and there is empirical evidence that the technique is effec-tive with these students (this third criteria was true for most, but not all, tech-niques; see Method). Teachers were also asked to identify any additionaladaptations they made for weaker spellers beyond the activities and proce-dures that they were queried about directly. Our approach was similar toS. Graham et al. (2003), except we focused on just spelling instead of writingin general. In addition to providing information about spelling adaptations,this survey provided needed information on how spelling is typically taughtin primary grades, including how much time is devoted to teaching spelling,the study of spelling words, teachers’ use of commercial materials, and howfrequently teachers use the selected spelling activities and procedures.
We did not anticipate that participating teachers would report makingadaptations for weaker spellers on all of the spelling activities and proce-dures surveyed, as some adaptations are more acceptable to teachers thanothers (Schumm & Vaughn, 1991). We did expect, however, that teacherswould report making some adjustments in how frequently specific spellingskills were taught as well as modifications in how they taught these skills andpromoted successful spelling during writing. Similar kinds of adjustmentswere reported for weaker writers in S. Graham et al. (2003). On the basis ofthis prior study, we also anticipated that most teachers would report making
Instructional Adaptations
799 by SJO TEMP 2008 on November 30, 2008 http://aerj.aera.netDownloaded from

Graham et al.
800
some adjustment in their instruction but that most of the adaptations wouldbe made by a small percentage of teachers and that there would be a sizableproportion of teachers who reported making few or even no adaptations. Onthe basis of findings from previous studies (Cutler & Graham, in press;S. Graham et al., 2003; Pressley et al., 1996; Wharton-McDonald et al., 1998),we further predicted that almost all participating teachers would indicatethey teach spelling. Although previous research does not provide a strongfoundation for predicting what spelling skills teachers would emphasize andhow they would be taught, we anticipated that teachers’ spelling instructionwould be multifaceted, involving the teaching of a variety of skills and usingmany different activities and procedures. This is consistent with most rec-ommended approaches for teaching spelling (e.g., S. Graham, 1999; Loomer,Fitzsimmons, & Strege, 1990; Schlagel, 2007).
Although the spelling practices surveyed in this study were not selectedso that specific theories of spelling instruction were contrasted, they do pro-vide some evidence on primary-grade teachers’ theoretical orientations. Thetwo basic theoretical orientations to teaching spelling are spelling-is-“caught”and spelling-is-“taught” approaches (S. Graham, 2000). With the former, it isassumed that spelling can be acquired as naturally and easily as speaking,by immersing children in literacy-rich environments where they have plentyof opportunities to read and write for real purposes. In contrast, with thespelling-is-taught approach, it is assumed that it is necessary to directly andsystematically teach children how to spell. There are three basic approachesto the spelling-is-taught orientation (Schlagel, 2007): memorization (e.g., stu-dents memorize the spelling of specific words), generalization (e.g., studentsare directly taught rules and skills for spelling unknown words), and devel-opmental (i.e., students connect and extend their grasp of the spelling sys-tem through the use of word study activities, such as word sorting). Byexamining the practices applied by the participating teachers, we can drawsome inferences about their theoretical approach to teaching spelling. Forexample, if teachers indicated that they applied the spelling activities andpractices surveyed, it is clear that they do not rely solely on a spelling-is-caught approach. Likewise, if they report that they teach students the skillsand strategies needed to spell unknown words, they do emphasize the gen-eralization method from the spelling-is-taught orientation. On the basis of aprevious study where primary grade teachers emphasized multiple instruc-tional orientations to teaching writing (S. Graham, Harris, Fink, & MacArthur,2002), we expected a similar pattern for spelling.
Method
Participants and Settings
A random sampling procedure, stratified by grade level, was used toidentify 248 first- through third-grade teachers from the population ofprimary-grade teachers in the United States. The names were selected froma comprehensive list of 558,444 primary-grade teachers in 72,000 private and
by SJO TEMP 2008 on November 30, 2008 http://aerj.aera.netDownloaded from

public schools compiled by Market Data Retrieval. A sample size of 248teachers is adequate for a population of 558,444 teachers under the follow-ing conditions (cf. Dillman, 2000): (a) A plus- or minus-5% sampling error isconsidered tolerable, (b) expected variation in teacher responses is set at .13and .87, (c) the statistical confidence level is set at 95%, and (d) a return rateof 70% is obtained. We determined expected variation in teacher responsesand the expected return rate by using data from S. Graham et al. (2003). Thisprior study used the same procedures as this investigation to calculate if ateacher made an adaptation and to solicit surveys from teachers. For eachitem in this previous study, there was a 13% chance that teachers wouldreport making an adaptation and an 87% chance they would not (thus, the.13–.87 ratio). Furthermore, 70% of their sample completed the survey. Usinga formula by Dillman (2000) and the first three conditions above (plus- orminus-5% sampling error; .13–.87 variation in responses, and a statistical con-fidence level of 95%), we needed 174 teachers to complete the survey tohave an adequate sample. Assuming a 70% return rate, the survey needed tobe sent to 248 teachers.
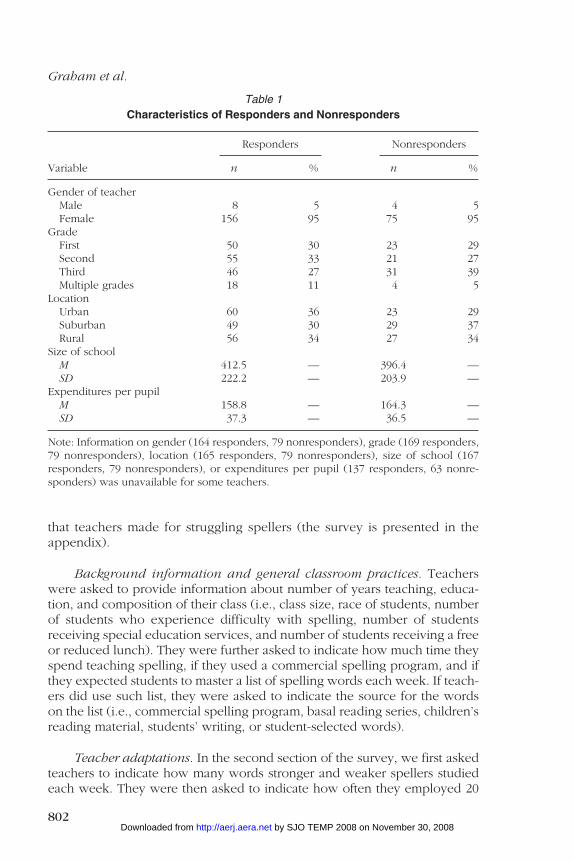
Of the 248 teachers identified, 68% (n = 169) agreed to participate inthe study. Demographic information for the 169 responders as well as the 79nonresponders is presented in Table 1. Chi-square analyses revealed no sta-tistically significant differences between responders and nonresponders interms of gender, grade, or location of the school (all ps > .17). Analyses ofvariance further indicated that there were no statistically significant differ-ences between responders and nonresponders in terms of school size orannual expenditures for materials per pupil. These findings provide evidencethat responders were representative of the whole sample.
Similar to previous surveys with primary-grade teachers (Cutler &Graham, in press; S. Graham et al., 2003) almost all of the teachers werefemales (see Table 1). For the most part, they were evenly distributed acrossthe three grades (but 11% of them taught multiple grades) as well as acrossurban, suburban, and rural locations. There was considerable variability inthe size of the schools that employed the teachers. As a group, the teachershad taught for slightly more than 16 years (range = 1 year to 48 years; SD =10.6 years). The average size of their class was 20.7 students (SD = 5.0), withapproximately 8.7% of students (SD = 7.0%) receiving free or reduced-costlunch. One tenth of their students (SD = 9.0) were receiving special educa-tion services, and the teachers indicated that 27% (SD = 20.5%) of theirstudents experienced difficulty with spelling. In addition, 65% (SD = 35%)of the teachers’ students were White, 16% Black (SD = 27%), 13% Hispanic(SD = 25%), 3% Asian (SD = 9%), and 4% Other (SD = 12%).
Survey Instrument
Teachers were asked to complete a questionnaire that included twoparts: One part included questions about the teacher, the classroom, and thegeneral spelling program, and the other assessed the types of adaptations
Instructional Adaptations
801 by SJO TEMP 2008 on November 30, 2008 http://aerj.aera.netDownloaded from
Graham et al.
802
that teachers made for struggling spellers (the survey is presented in theappendix).
Background information and general classroom practices. Teacherswere asked to provide information about number of years teaching, educa-tion, and composition of their class (i.e., class size, race of students, numberof students who experience difficulty with spelling, number of studentsreceiving special education services, and number of students receiving a freeor reduced lunch). They were further asked to indicate how much time theyspend teaching spelling, if they used a commercial spelling program, and ifthey expected students to master a list of spelling words each week. If teach-ers did use such list, they were asked to indicate the source for the wordson the list (i.e., commercial spelling program, basal reading series, children’sreading material, students’ writing, or student-selected words).
Teacher adaptations. In the second section of the survey, we first askedteachers to indicate how many words stronger and weaker spellers studiedeach week. They were then asked to indicate how often they employed 20
Table 1Characteristics of Responders and Nonresponders
Responders Nonresponders
Variable n % n %
Gender of teacherMale 8 5 4 5Female 156 95 75 95
GradeFirst 50 30 23 29Second 55 33 21 27Third 46 27 31 39Multiple grades 18 11 4 5
LocationUrban 60 36 23 29Suburban 49 30 29 37Rural 56 34 27 34
Size of schoolM 412.5 — 396.4 —SD 222.2 — 203.9 —
Expenditures per pupilM 158.8 — 164.3 —SD 37.3 — 36.5 —
Note: Information on gender (164 responders, 79 nonresponders), grade (169 responders,79 nonresponders), location (165 responders, 79 nonresponders), size of school (167responders, 79 nonresponders), or expenditures per pupil (137 responders, 63 nonre-sponders) was unavailable for some teachers.
by SJO TEMP 2008 on November 30, 2008 http://aerj.aera.netDownloaded from

specific spelling activities or practices, using a 7-point Likert-type scale. TheLikert-type scale, developed by Pressley et al. (1996), included the followingmarkers: 1 = never, 2 = several times a year, 3 = monthly, 4 = weekly, 5 =several times a week, 6 = daily, and 7 = several times a day. The higher thescore, the more often an activity or procedure occurred. For each item, therespondent first indicated how often a particular activity or procedure wasapplied with stronger spellers and then how often it was applied with weakerspellers (this was done on separate scales). A difference between the treat-ment of weaker and stronger spellers was viewed as an adaptation, and suchadaptation could involve providing more or less of an activity or instructionalprocedure to weaker spellers than stronger ones. Finally, respondents wereasked to identify any additional adaptations that were provided to weakerspellers in their classroom beyond what they typically did with students. Thisprovided teachers the opportunity to identify adaptations they were makingthat were not directly queried through the forced-response items.
The development of the second part of the survey involved six steps.First, we created a possible pool of items by identifying instructional prac-tices used by teachers in previous research studying the teaching of spellingin the primary grades (e.g., Bridge, Compton-Hall, & Cantrell, 1997; S. Grahamet al., 2003; Wharton-McDonald et al., 1998). Second, this was supplementedby examining current books and articles on the teaching of spelling (e.g.,Bear, Invernizzi, Templeton, & Johnston, 2000; Gentry & Gillett, 1993; Moats,1995) as well as reviews of the empirical literature on effective spelling prac-tices for young children (e.g., S. Graham, 1999; Loomer et al., 1990). Third,a description of each instructional activity or procedure was developed, andwe asked five primary-grade teachers to rate each item (using a 5-pointLikert-type scale ranging from 1 point for strongly disagree to 5 points forstrongly agree) on two dimensions: (a) primary-grade teachers typically usethe activity or procedure and (b) the activity or procedure can be adapted tohelp weaker spellers. We included all items on our survey that had a meanof 4.0 on both dimensions, yielding 21 items. Fourth, we created an initialversion of the survey, where one activity was answered by identifying thenumber of words stronger and weaker spellers study each week, and theother 20 items were answered via a Likert-type scale (see above). Fifth, weasked 3 primary-grade teachers to take the survey and record how long ittook to complete it. They then reexamined the survey to provide suggestionsfor improving wording on specific items and the layout of the instrument.These suggestions were incorporated into a final version of the scale. Sixth,we examined the internal consistency of the 20 Likert-type items using thedata from this study. Coefficient alpha was .83.
Five of the 21 activities or procedures asked teachers about their teach-ing of specific spelling skills and strategies (phonological awareness, phon-ics skills for spelling, strategies for determining the spelling of unknownwords, spelling rules, and dictionary skills). With the exception of teachingdictionary skills, there is empirical evidence that all of these activities areeffective with struggling spellers (see S. Graham, 1999; S. Graham et al., 2003).
Instructional Adaptations
803 by SJO TEMP 2008 on November 30, 2008 http://aerj.aera.netDownloaded from

Twelve items focused on how frequently teachers applied the followinginstructional procedures: reduce number of words studied each week, reteachspelling skills and strategies, use games to learn spelling skills, have studentswork together to learn spelling skills, use word-sorting activities to teachknowledge about spelling, apply computer programs to teach spelling, praisestudents’ correct spelling, apply reinforcement and other motivational strate-gies to foster spelling performance, conference with parents about theirchild’s spelling, teach spelling skills and strategies through minilessons as theneed arises, use mnemonics for remembering the spelling of a difficult word,and conference with students about their spelling. There is empirical evidencethat the first nine procedures listed above enhance the performance of weakerspellers (S. Graham, 1999; S. Graham et al., 2003). The final four proceduresfocused on spelling during writing. This included students’ use of spell check-ers, encouragement to use invented spellings, proofreading to correct spellingerrors, and providing students with feedback on words misspelled while writ-ing. Each of these practices was effective with weaker spellers in one or moreempirical studies (Gettinger, 1993; S. Graham, 1999).
Procedures
A cover letter, the survey instrument, and a stamped return envelopewere mailed to each teacher during the month of March. The cover letterindicated that we were conducting a survey to gather information on theteaching of spelling and types of adaptations made by teachers. Teacherswere asked to return materials in the next 2 weeks if possible. To encouragecompletion and return of the materials, we included a $2 bill in the packageas a thank-you for taking the time to fill out and return the surveys.
Forty-nine percent of the teachers (n = 122) completed and returnedthe survey in the first mailing. The second mailing occurred during the 1stweek of April and accounted for another 47 surveys (19%), bringing thegrand total to 68%.
Results
Missing Data
Examination of the responses of the 169 teachers indicated that 129 ofthem had some missing data, although actual percentage of data missingacross all surveys was small (mode = 1% of data missing). However, pre-liminary analysis of the missing data indicated patterns within subjects andacross items, suggesting that missing data were not random (e.g., some par-ticipants had more missing data than others). Due to the number of par-ticipants affected and systematic properties of the missing data, neitherlistwise deletion nor simple regression imputation was considered a properremedy. A multiple imputation of the missing values was completed usingan expectation-maximization algorithm (see J. W. Graham & Hofer, 2000).After eliminating 1 outlying participant who was missing 81% of all data,
Graham et al.
804 by SJO TEMP 2008 on November 30, 2008 http://aerj.aera.netDownloaded from

Instructional Adaptations
805
the SPSS missing-values module was employed. This procedure uses allinformation in the data set to impute values for missing data for all remain-ing participants (n = 168). This enhanced our ability to calculate unbiasedparameter estimates while preserving statistical power (J. W. Graham,Taylor, & Cumsille, 2001).
Analyses
First, we examined teachers’ responses to the classroom practice ques-tions as well as the Likert-type items assessing how often teachers reportedapplying 20 spelling activities and instructional practices with stronger andweaker spellers in order to draw a general picture of primary-grade spellinginstruction. Next, we examined the types of adaptations teachers made forweaker spellers. This second focus took three forms. One, we examined ifthere was a difference in how often teachers reported using each of the 21spelling activities or procedures with stronger and weaker spellers. For eachspelling activity or procedure, a one-way ANOVA (with type of speller as theindependent variable) was conducted. We reasoned that if teachers weremaking an adaptation for a specific activity or procedure, then the respec-tive F ratio should be statistically significant. Because of the large number ofanalyses (21), we set the alpha level at .01. A more conservative probabilitylevel was not set to help avoid the possibility of committing a Type II error.Skewness was evident for a majority of these items, so we also conductedeach analysis using a nonparametric procedure (Mann-Whitney U test). Theoutcomes for the nonparametric and parametric analyses were identical;thus, we report only the findings from the ANOVAs here.
Although we expected few if any differences in how often first-, second-,and third-grade teachers reported using the activities and proceduressurveyed (as most spelling materials apply the same basic formats and activi-ties in the primary grades; see, for example, Gentry, 2007), we did examine ifteachers’ reported use of a practice was related to grade taught. Practices suchas teaching phonemic awareness and teaching phonics for spelling might bemore common in the earlier grades as students are just starting to break thecode, whereas the use of a dictionary as a spelling aid may be more commononce students have acquired initial competence with spelling. We found onlythree instances where reported use of a practice was statistically related tograde taught (i.e., teaching phonological awareness, teaching phonics skillsfor spelling, and reteaching skills and strategies, with teachers indicating thatthey applied each practice more often with younger students). In no instancewas there an interaction between grade and type of speller; thus, scorespresented in subsequent sections are averaged across grades.
A second way teachers’ reported adaptations were examined was bycategorizing and tabulating responses to the open-ended question askingthem to identify additional adaptations made for weaker spellers (see furtherdiscussion of categorization procedures below). We included in this analysisonly adaptations not previously identified via the forced-response items.
by SJO TEMP 2008 on November 30, 2008 http://aerj.aera.netDownloaded from

Finally, we calculated total number of reported adaptations made by ateacher. This score was based on responses to the forced-response and theopen-ended questions. Any time a teacher marked a different score forstronger versus weaker spellers on a forced-response item, it was counted asan adaptation. These adaptations were summed with the number of new adap-tations identified from the open-ended question. We also examined if therewas a relationship between total number of adaptations and grade taught,school location (urban, suburban, and rural), and years spent teaching.
Spelling Instruction in the Primary Grades
Virtually all of the teachers reported teaching spelling, devoting an aver-age of almost 90 minutes a week to this skill (time spent teaching spellingwas not related to grade taught; p = .09). This is more than the 60 to 75 min-utes per week recommended in previous reviews of the experimental liter-ature (see, for example, Loomer et al., 1990). Nevertheless, there wasconsiderable variability in reported teaching time (SD = 70.64 minutes). Inaddition, 4 teachers did not teach spelling at all (scattered across all threegrade levels), 1 teacher devoted 2 minutes a week to it, and another 10 teach-ers spent only 10 to 20 minutes teaching it.
A slight majority of teachers (57%) reported using commercial materialsto teach some aspect of spelling. These teachers reported using a wide rangeof spelling programs, including stand-alone programs as well as ones thatwere part of a basal reading program. Whether they reported using a spellingprogram or not, most teachers (90%) indicated students were expected tomaster a list of spelling words each week. The sources for the words on theselists were varied and overlapped somewhat: 66% of teachers indicated thatwords came from spelling programs, 37% from basal readers, 30% from thematerial students read, 26% from students’ compositions, and 14% from stu-dent self-selection.
Table 2 presents how often teachers applied (ranging from never to sev-eral times a day) each of the 20 spelling activities and practices assessed witha Likert-type scale (tabulated for both stronger and weaker spellers). Five outof the 6 responding teachers reported using all but 2 of these activities andprocedures sometime during the school year. The other 2 procedures, com-puter programs as an aid for learning spelling words or skills and mnemon-ics as an aid for remembering difficult spellings, were used by 65% and 74%of teachers, respectively, at some point in the academic year. These data pro-vide additional verification that the 20 spelling activities and procedures arecommon elements of primary-grade spelling instruction.
On at a least a weekly basis, a majority of teachers reported applying16 activities with either stronger or weaker writers. In order of frequency, thesewere praise for correct spelling (94%), teaching phonics skills for spelling(92%), instruction in phonological awareness (88%), minilessons to teachspelling skills and strategies (86%), teacher feedback on misspellings (84%),using spelling games to teach skills and strategies (83%), spelling rules
Graham et al.
806 by SJO TEMP 2008 on November 30, 2008 http://aerj.aera.netDownloaded from

807
Tab
le 2
Ho
w O
ften
Pri
mar
y-G
rad
e T
each
ers
Rep
ort
ed U
sin
g S
pec
ific
Sp
ellin
g A
ctiv
itie
s an
d In
stru
ctio
nal
Pro
ced
ure
s
Spel
ling
Act
ivity
Se
vera
l Se
vera
l Se
vera
l or
Inst
ruct
ional
St
andar
dN
ever
Tim
es a
M
onth
ly
Wee
kly
Tim
es a
D
aily
Tim
es a
Pro
cedure
Mea
nD
evia
tion
(%)
Yea
r (%
)(%
)(%
)W
eek
(%)
(%)
Day
(%
)
Tea
ch S
pec
ific
Sk
ills
/Str
ateg
ies
Phonolo
gica
l aw
aren
ess
Stro
nge
r sp
elle
r4.
831.
291
57
2229
315
Wea
ker
spel
ler
4.97
1.25
15
718
3033
7Phonic
s fo
r sp
ellin
gSt
ronge
r sp
elle
r4.
821.
353
54
2627
306
Wea
ker
spel
ler
4.99
1.29
33
223
2933
7St
rate
gies
to s
pel
l unkn
ow
n w
ord
sSt
ronge
r sp
elle
r4.
321.
484
129
2823
214
Wea
ker
spel
ler
4.45
1.50
410
926
2421
6Sp
ellin
g ru
les
Stro
nge
r sp
elle
r4.
171.
182
710
4623
102
Wea
ker
spel
ler
4.21
1.21
37
945
2313
2D
ictio
nar
y sk
ills
Stro
nge
r sp
elle
r3.
111.
3510
2920
297
42
Wea
ker
spel
ler
3.09
1.35
1029
2129
64
2
Inst
ruct
ion
al A
ctiv
itie
sM
inile
ssons
Stro
nge
r sp
elle
r4.
551.
382
87
2727
244
Wea
ker
spel
ler
4.88
1.33
25
720
3029
7
(con
tin
ued
)
by SJO TEMP 2008 on November 30, 2008 http://aerj.aera.netDownloaded from

808
Tab
le 2
(co
ntin
ued)
Spel
ling
Act
ivity
Se
vera
l Se
vera
l Se
vera
l or
Inst
ruct
ional
St
andar
dN
ever
Tim
es a
M
onth
ly
Wee
kly
Tim
es a
D
aily
Tim
es a
Pro
cedure
Mea
nD
evia
tion
(%)
Yea
r (%
)(%
)(%
)W
eek
(%)
(%)
Day
(%
)
Ret
each
inga
Stro
nge
r sp
elle
r3.
711.
272
1823
2921
51
Wea
ker
spel
ler
4.07
1.25
113
1630
308
2Sp
ellin
g ga
mes
Stro
nge
r sp
elle
r3.
591.
412
710
4623
102
Wea
ker
spel
ler
3.68
1.43
37
945
2313
2St
uden
ts w
ork
toge
ther
St
ronge
r sp
elle
r3.
941.
459
810
4218
103
Wea
ker
spel
ler
4.00
1.48
107
941
2011
4W
ord
sortin
gSt
ronge
r sp
elle
r3.
291.
4917
1617
2719
50
Wea
ker
spel
ler
3.39
1.47
1613
1630
205
0Com
pute
r to
lea
rn s
pel
ling
Stro
nge
r sp
elle
r2.
601.
5035
2013
225
51
Wea
ker
spel
ler
2.70
1.60
3418
1223
85
1Pra
ise
studen
ts for
corr
ect sp
ellin
gSt
ronge
r sp
elle
r5.
261.
260
42
2121
3416
Wea
ker
spel
ler
5.41
1.26
03
223
2131
22U
se m
nem
onic
s fo
r har
d w
ord
sSt
ronge
r sp
elle
r2.
951.
6226
1914
2313
42
Wea
ker
spel
ler
3.02
1.68
2619
1420
147
1Rei
nfo
rcem
ent or
motiv
atio
n
stra
tegi
es to p
rom
ote
spel
ling
Stro
nge
r sp
elle
r3.
701.
5613
1410
3614
122
Wea
ker
spel
ler
3.79
1.58
1115
834
1812
2
(con
tin
ued
)
by SJO TEMP 2008 on November 30, 2008 http://aerj.aera.netDownloaded from

809
Tab
le 2
(co
ntin
ued)
Spel
ling
Act
ivity
Se
vera
l Se
vera
l Se
vera
l or
Inst
ruct
ional
St
andar
dN
ever
Tim
es a
M
onth
ly
Wee
kly
Tim
es a
D
aily
Tim
es a
Pro
cedure
Mea
nD
evia
tion
(%)
Yea
r (%
)(%
)(%
)W
eek
(%)
(%)
Day
(%
)
Confe
renci
ng
with
stu
den
tsa
Stro
nge
r sp
elle
r3.
311.
5117
1614
3215
51
Wea
ker
spel
ler
4.18
1.45
610
932
2813
4Par
ent co
nfe
rence
sa
Stro
nge
r sp
elle
r1.
990.
6817
725
60
00
Wea
ker
spel
ler
2.29
0.79
868
1211
10
0
Spel
lin
g W
hen
Wri
tin
gSt
uden
ts u
se s
pel
l ch
ecke
rsSt
ronge
r sp
elle
r2.
111.
664
129
2823
214
Wea
ker
spel
ler
2.11
1.66
410
926
2421
6Enco
ura
ge inve
nte
d s
pel
ling
Stro
nge
r sp
elle
r4.
741.
8411
54
1914
3513
Wea
ker
spel
ler
4.72
1.85
116
418
1436
12St
uden
t pro
ofrea
din
gSt
ronge
r sp
elle
r4.
201.
405
618
3020
192
Wea
ker
spel
ler
4.20
1.38
47
1730
2318
2Tea
cher
fee
dbac
k on m
issp
ellin
gsSt
ronge
r sp
elle
r4.
801.
403
310
2523
298
Wea
ker
spel
ler
4.78
1.41
33
1027
2126
10
Note
: n
ever
=sc
ore
of 1;
sev
era
l tim
es a
yea
r=
score
of 2;
mon
thly
=sc
ore
of 3;
wee
kly
=sc
ore
of 4;
sev
era
l tim
es a
wee
k=
score
of 5;
da
ily
=sc
ore
of 6;
sev
era
l tim
es a
da
y=
score
of 7.
a Sta
tistic
ally
sig
nific
ant diffe
rence
bet
wee
n s
tronge
r an
d w
eake
r w
rite
rs (
p<
.01)
.
by SJO TEMP 2008 on November 30, 2008 http://aerj.aera.netDownloaded from

Graham et al.
810
instruction (83%), encouraging invented spellings (80%), teaching strategiesfor spelling unknown words (77%), conferencing with students about theirspelling (77%), student use of spell checkers (76%), students helping eachother with spelling (76%), student proofreading theirs and others’ composi-tions (71%), reteaching spelling skills and strategies (70%), reinforcementand motivational strategies to teach spelling (63%), and using word sortingto teach spelling (55%).
At least monthly, a majority of teachers reported teaching dictionaryskills (62%) and using mnemonics as a way to help students remember dif-ficult spelling words (56%). At least several times a year, most teachers indi-cated conferencing with parents about their child’s spelling (92%) and usingcomputer programs to help students learn spelling words and skills (82%).
Spelling Adaptations: From Forced-Choice Items
Table 2 presents means and standard deviations for stronger and weakerspellers for the 20 spelling activities and practices assessed via Likert-typescales. Because weaker spellers, by definition, experience difficulty master-ing the task of spelling, we anticipated that teachers would provide moresupport and instruction to these students than to the stronger spellers in theirclassrooms. For the most part, this prediction was not supported by ouranalyses of the forced-response items, as only 3 of the 20 analyses were sta-tistically significant. In contrast to stronger spellers, teachers reported con-ferencing more often with the parents of weaker spellers, F(1, 334) = 29.00;MSe = 2.18, p < .001 (Cohen’s d = .57); conferencing more often withweaker spellers, F(1, 334) = 13.11; MSe = .55, p < .001 (Cohen’s d = .40); andreteaching skills and strategies to these students, F(1, 334) = 6.70; MSe =1.58, p = .009 (Cohen’s d = .28).
There was also a statistically significant difference for the item that askedteachers to indicate how many words they assigned to weekly spelling listsfor stronger and weaker spellers, F(1, 334) = 54.05; MSe = 31.44, p < .001(Cohen’s d = .75). Weaker spellers were assigned fewer words (M = 10.3;SD = 4.3) than stronger spellers (M = 14.8; SD = 6.7).
Additional Adaptations Identified Through the Open-Ended Question
Teacher responses to the open-ended question asking them to identifyadditional adaptations made for weaker spellers were tabulated and catego-rized by type. Excluded from this tabulation were any responses that namedan adaptation already evident from the forced-response items (e.g., if ateacher wrote, “I provide extra time teaching spelling rules,” and conjointlymarked a different Likert score for stronger and weaker spellers on the ques-tion that specifically asked about teaching spelling rules, the open-endedresponse was not counted as an adaptation).
In total, 109 of the respondents (65%) provided 294 potential adaptationswhen responding to the open-ended question. Of these, 190 were determinedto be unique. These 190 unique adaptations were then sorted into categories.
by SJO TEMP 2008 on November 30, 2008 http://aerj.aera.netDownloaded from

This process involved two steps. First, the first two authors read through allresponses and identified 10 categories that captured the range of teacherresponses. These categories were tutoring (from the teacher, another adult,or a peer), computer activities, modified spelling lists, modified proceduresfor teaching spelling words (flash cards, games, modified regular curriculaaddressing spelling, multiple minitests, brainstorming), spelling aids for writ-ing (memory facilitation, lists of common words, personal lists of misspelledwords), phonics or phonological awareness (explicit phonics, sound-basedword games), homework or family connection (all activities sent homeregardless of person implementing at home), additional materials (generaldictionaries, unique materials not specific to phonics), and test modifications(additional time, preparation time, retesting, and test-scoring modificationsnot including motivational strategies related to test results).
Next, the second author categorized all responses using the categoriesjust described. To establish reliability of the second author’s scoring, 31%(n = 32) of teacher’s responses (selected randomly) was independentlyrescored by a second rater. Reliability using Cohen’s kappa for number ofunique adaptations was .87 and .83 for the categorization of these uniqueadaptations.
The most frequent additional reported adaptation was tutoring or one-to-one help (32% of responses). This was followed by adaptations involvingmodified teaching procedures (24%). The next three most frequent adapta-tions focused on teaching phonics and phonological awareness to weakerspellers (11%), modifying the spelling lists (8%), and modifying homeworkassignments (8%). Less frequent adaptations included using spelling aids forwriting (6%), modifying testing procedures (6%), using the computer to aidspelling (3%), and using additional spelling materials (2%). Only 1% of adap-tations were classified as other.
Total Number of Adaptations
Total number of reported adaptations made by each teacher was calcu-lated by summing (a) the number of forced-response items where a differ-ent score was marked for stronger and weaker spellers and (b) the numberof additional adaptations obtained through our analyses of the open-endedquestion. For all teachers, the average number of adaptations from these twosources was 3.7. Number of reported adaptations was not significantlyrelated to grade taught (p = .07) or to whether teachers worked in an urban,suburban, or rural district (p = .11). There also was no statistically significantrelation between reported total adaptations and number of years spent teach-ing (r = –.11) or teachers’ estimates of how many of their students experi-enced spelling problems (r = –.05). It is important to note that there wasconsiderable variability in total reported adaptations, as the standard devia-tion was large when compared to the mean (SD = 3.2). When all adaptationswere summed together (forced response and open-ended), 42% (n = 70) ofthe teachers reported making just 0 to 2 adaptations. Considered differently,
Instructional Adaptations
811 by SJO TEMP 2008 on November 30, 2008 http://aerj.aera.netDownloaded from

Graham et al.
812
a total of 629 adaptations were reported by all teachers, and of these adap-tations, 67% (n = 422) were accounted for by just 24% of teachers (n = 41).
Discussion
Do Primary-Grade Teachers Teach Spelling and How Do They Teach It?
Although this study mainly focused on primary-grade teachers’ adapta-tions for struggling writers, it also yielded important information on howspelling is taught to young children nationwide. There are little data avail-able on contemporary spelling practices with young children. Consistentwith two other recent surveys (Cutler & Graham, in press; S. Graham et al.,2003) and our prediction, virtually all of the primary-grade teachers in thisstudy reported teaching spelling. Only 2% of the teachers reported not teachspelling at all, and slightly more than 90% indicated that they taught spellingfor at least 25 minutes per week. Thus, with the exception of a few partici-pants, enough time was devoted to teaching spelling to allow teachers theopportunity to make adaptations for weaker spellers.
As a group, the participating teachers indicated that they spend 90 min-utes a week teaching spelling. This exceeds the average of 60 minutesreported by primary-grade teachers in Cutler and Graham (in press) as wellas the traditional recommendation, based on studies that manipulated teach-ing time (see Loomer et al., 1990), that 60 to 75 minutes a week should bedevoted to teaching this skill. However, in both this and the Cutler andGraham (in press) investigation, there was considerable variability inreported teaching time. It is important to note that there was a sizable minor-ity of teachers in this study (45%) who spent less than the empirically sup-ported recommendation for teaching spelling, 60 to 75 minutes a week.
Although the present study did not query teachers on all possibleaspects of their spelling instruction, the findings from the current study wereconsistent with our prediction that primary-grade spelling instruction is mul-tifaceted, involving the teaching of a variety of skills as well as the applica-tion of many different activities and instructional procedures. In fact, therewas considerable consistency in teachers’ reports on how they taughtspelling, with many activities and instructional procedures applied by 70%or more of the teachers at least weekly. This included students learning anew list of words each week and the teaching of phonological awareness,phonics for spelling, spelling rules, and strategies for spelling unknownwords. Likewise, teachers reported providing minilessons, employing peerlearning activities, and using games at least weekly to help students acquirenew spelling words and skills. Teachers indicated they frequently praisedstudents for correct spelling, provided feedback on the words children mis-spelled, and held conferences with students about their spellings. They alsoreported encouraging students to use invented spellings, spell checkers, andproofreading at least weekly. There is experimental research evidence thatall but two of these practices enhance the spelling performance of studentsin general and struggling spellers in particular (see reviews by Loomer et al.,
by SJO TEMP 2008 on November 30, 2008 http://aerj.aera.netDownloaded from

1990; S. Graham, 1983, 1999; S. Graham & Miller, 1979; Wanzek et al., 2006).Such evidence is not available for conferencing with students and teachingminilessons as the need arises (neither of these techniques has been testedempirically).
Three other evidence-based practices (see Loomer et al., 1990; S. Graham, 1999) were applied by 50% of the teachers on a weekly basis. Thesewere reteaching skills and strategies, word sorting, and reinforcement orother motivational strategies. In contrast, teachers reported that they appliedthe following two research-supported practices (see review by S. Graham,1999) infrequently: (a) computer programs to teach spelling and (b) confer-encing with parents. The primary-grade teachers in S. Graham et al. (2003)also indicated that they rarely used computers during the writing period. Thisinfrequent use of computer technology is troubling and deserves furtherstudy.
Even though the majority of teachers reported that they frequently useda variety of research-supported practices to teach spelling, it is important tonote that they also indicted that 27% of their students, on average, experi-enced difficulty with spelling. Thus, according to their estimates, there wasa sizable proportion of students for whom their spelling instruction was noteffective. One possible reason for why this was the case is that teachers maynot apply these research-supported practices effectively—in the same waythey were applied in the studies validating their effectiveness. It is also pos-sible that the participating teachers combined these practices together inways that reduced their effectiveness or placed too much emphasis on oneprocedure and not enough on another. We did not assess either of these pos-sibilities, as the available research does not provide enough evidence toestablish clear guidelines for how practices should be combined or if thepractices we assessed are differentially effective. Because we did not con-duct a comprehensive survey of all instructional practices in spelling, includ-ing research-validated procedures, such as the test-study-test method or thecorrected-test method, for example (see S. Graham, 1983), it is further pos-sible that teachers did not apply a number of important instructional proce-dures when teaching spelling, reducing the overall effectiveness of theirefforts. Last, it is possible that teachers’ knowledge of English orthographyand spelling was incomplete, and this may have hampered the impact oftheir instruction (see Moats, 1995). Future research needs to examine abroader array of spelling practices, including additional research-supportedprocedures as well as the linkage between the use of such practices, teach-ers’ knowledge, and spelling achievement.
Our findings further provide some insight into primary-grade teachers’theoretical orientations to spelling instruction. Very few of them appeared toembrace only a spelling-is-caught orientation, as almost all of them spentsome time teaching children how to spell. Moreover, at least 2 out of every3 teachers reported applying procedures that were consistent with two of thespelling-is-taught approaches: memorization (students learned a list ofspelling words each week) and generalization (i.e., teaching phonemic
Instructional Adaptations
813 by SJO TEMP 2008 on November 30, 2008 http://aerj.aera.netDownloaded from

awareness, phonics skills for spelling, spelling rules, and strategies forspelling unknown words). In addition, 50% of them reported applying anactivity (i.e., word sorting) that is commonly used as a tool in the thirdspelling-is-taught approach, developmental (Schlagel, 2007). As predicted,most primary-grade teachers’ spelling instruction embraced multiple per-spectives. However, additional research is needed to determine how muchemphasis teachers also place on the spelling-is-caught approach. None ofthe items in this study provided data relevant to this orientation.
Do Primary Grade Teachers Adapt Instruction for Weaker Spellers?
On the basis of the S. Graham et al. (2003) investigation with writing,we expected that the primary-grade teachers in this study would reportadapting their instruction for weaker spellers, but most of the reported adap-tations would be made by a small percentage of teachers, with a sizableminority of teachers reporting few or no adaptations (0 to 2). These expec-tations were confirmed, as teachers as a group averaged 3.7 reported adap-tations, but two thirds of these adaptations were made by just one fourth ofthe teachers, with 42% of teachers making virtually no adaptations. Thesefigures are almost identical to S. Graham et al. (2003). Thus, only 1 in 4 teach-ers was highly sensitive to the needs of weaker spellers, whereas close toone half of them reported making few or no adjustments for these children.
Of the 21 spelling activities and procedures that were directly assessedin our survey, teachers reported making adaptations for only four: the num-ber of words studied each week (fewer words with weaker spellers), how fre-quently teachers held conferences about spelling with both students and theirparents (more often for weaker spellers and their parents), and how oftenthey retaught spelling skills and strategies (more often with weaker spellers).With the exception of conferencing with students (which has not been testedexperimentally), all three of these adaptations have improved the spellingperformance of struggling spellers in one or more research studies (seeS. Graham, 1999). It must be noted, however, that there was little practicaldifference between how often teachers reported reteaching skills and strate-gies and conferencing with parents of weaker and stronger spellers.
In contrast to S. Graham et al. (2003), primary-grade teachers in thisstudy did not report encouraging the use of invented spelling more oftenwith weaker than stronger students, nor did they report spending more timeteaching phonics for spelling or strategies for spelling unknown words toweaker students. These differences did not appear to be related to how oftenteachers in the two studies emphasized each of these practices in their class-room, as all three were used frequently and at a similar rate in both investi-gations. The differences may be a consequence of how the items wereworded (weaker “writers” in Graham et al., 2003, and weaker “spellers” inthis study), reflect differences in who participated in the two studies, or rep-resent a change in practices over time. Additional research is needed toresolve these discrepancies.
Graham et al.
814 by SJO TEMP 2008 on November 30, 2008 http://aerj.aera.netDownloaded from

As in the S. Graham et al. (2003) investigations, teachers in this studygenerated a broad list of additional modifications when asked to describeother modifications they made for weaker spellers. On average, the teachersreported making one additional adaptation beyond what was directlyassessed (39% of participants, however, did not report any additional adap-tations). The most common other adaptation reported by respondents wasthe use of tutoring by the teacher, another adult, or a peer. This categoryaccounted for one third of all additional adaptations (26% of all additionaladaptations in S. Graham et al., 2003, involved tutoring). One fourth of theother reported adaptations involved modifying procedures for teachingspelling words. This was followed by adaptations in the teaching of phonicsand phonemic awareness (11%), modifying the weekly spelling list (8%),assigning homework and making family connections (8%), supplying spellingaids for writing (6%), and modifying spelling tests (6%). Unfortunately, teach-ers rarely provided enough information about these additional adaptations forus to form judgments about their quality or effectiveness.
An important question raised by this study is why a sizable minority ofteachers (42%) reported making few or no adaptations for weaker spellers.One possible reason was that they believed that their spelling program wasso effective that adaptations were not needed. We think that this is anunlikely explanation, as teachers who provided two or fewer adaptationsindicated that 29% of their students had difficulty with spelling.
It is also possible that these teachers did not view adaptations as par-ticularly valuable and, consequently, were not willing to expend the energyneeded to adjust their instruction for weaker spellers. A recent study byS. Graham, Papadopoulou, and Santoro (2006) provides some support forthis contention. They examined the acceptability of the writing adaptationsprimary teachers reported employing in the S. Graham et al. (2003) investi-gation. Teachers were asked to rate each adaptation on five dimensions:effectiveness, suitability for struggling writers, possible negative impacts,their knowledge of how to implement, and time needed to implement. Aftercontrolling for teacher experience, class size, teacher efficacy, percentage ofstudents with writing difficulties, and percentage of students with specialneeds, they found that these five dimensions accounted for 29% of the vari-ability in teachers’ reported use of 14 different adaptations. Thus, teacherswere more likely to report making adaptations for struggling writers if theyviewed writing modifications as acceptable. Future research needs to exam-ine if these same factors influence teachers’ reported and observed use ofspelling adaptations.
Another possible reason why some teachers reported making few or noadaptations involves their knowledge about English orthography and spellingand how to teach this complex skill. Some teachers may feel that they donot know enough about spelling to risk modifying how they teach it.Unfortunately, we did not ask teachers about their prior preparation to teachspelling, nor did we try to determine the depth of their knowledge aboutspelling. Several recent national surveys, however, have asked teachers about
Instructional Adaptations
815 by SJO TEMP 2008 on November 30, 2008 http://aerj.aera.netDownloaded from

their preparedness to teach other aspects of writing. Eighty-eight percent ofthe primary-grade teachers in S. Graham et al. (2008) reported that they didnot receive adequate preparation in their teacher preparation programs toteach handwriting. Likewise, 71% of the participating high school teachers inKiuhara, Graham, and Hawkin (2008) indicated they received minimal to nopreparation to teach writing during college, and 44% continued to report thesame level of preparation when in-service and personal learning efforts wereincluded too. Clearly, additional research is needed to assess teachers’ pre-paredness to teach spelling and their knowledge about it, as the studies citedabove suggest that many teachers are not adequately prepared to teach writ-ing or its component skills.
Limitations and Assumptions
The present study was based on the assumption that primary-gradeteachers would be aware of the elements of their teaching and would be ableto relate this knowledge to questions about their teaching practices in thearea of spelling, just as other professionals can relate what they do whenqueried about their actions (Diaper, 1989). Although these findings must besupplemented by research where teachers’ practices and adaptations areobserved and not just reported, it is important to note that other survey stud-ies querying teachers about their literacy practices are corroborated by obser-vations of these same teachers’ classroom instruction (see, for instance,Bridge & Heibert, 1985; DeFord, 1985).
We also assumed that effective instruction for weaker spellers involvesadapting instruction. This assumption would be less valid if the instructionalprograms used by teachers were so powerful that each child developed thespelling skills needed for success at her or his grade level. This is an improb-able scenario, however, as there is no documentation that such a spellingprogram actually exists, and participating teachers indicated that 27% of theirstudents experienced difficulties with spelling.
When we queried teachers about their use of selected activities and pro-cedures with weaker and stronger spellers, it was tacitly assumed that animportant dimension in providing instruction to young, struggling spellersinvolves adjusting the frequency or quantity of specific aspects of instruc-tion. Although this assumption requires additional validation, providing extraspelling instruction to weaker spellers can boost these children’s spellingperformance (see Berninger et al., 1998; S. Graham et al., 2003).
Although the number of teachers who completed our survey and wereincluded in the data analysis (168) was slightly less than the number (174)we estimated that we needed to have an adequate sample (see Method), thishad a minimal impact on the confidence that can be placed in our findings(sampling error is now 5.1% instead of 5%). Although sampling error couldhave been reduced with a larger sample, the sampling error is well withinacceptable ranges for survey research (Dillman, 2000). Moreover, it wouldhave required a large increase in participants to significantly reduce sampling
Graham et al.
816 by SJO TEMP 2008 on November 30, 2008 http://aerj.aera.netDownloaded from

Instructional Adaptations
817
error in this study. For example, a plus- or minus-1% sampling error in thisinvestigation would require a 25-fold increase to 4,317 teachers sampled.
Last, it was possible that the procedures used to query teachers did notcapture all of their adaptations. The forced-response questions did not coverall possible adaptations, and although we asked an open-ended question inorder to obtain a more complete account, some teachers may still have failedto provide a full record. For instance, some adaptations may have not beenidentified because the teacher did not remember making them. Futureresearch can address this problem, at least in part, by asking additional ques-tions, applying direct observation, or using a combination of the two.
In summary, the findings from this study indicated that virtually allprimary-grade teachers teach spelling, with the vast majority of them imple-menting a complex and multifaceted instructional program that uses avariety of research-supported procedures. In addition, some teachers aresensitive to the needs of weaker spellers, making a variety of adaptations forthese students. A sizable minority of teachers, however, reported making fewor no adaptations. Equally troubling was the finding that teachers indicated27% of their students experienced difficulty with spelling, calling into questionthe effectiveness of their instruction.
by SJO TEMP 2008 on November 30, 2008 http://aerj.aera.netDownloaded from

Graham et al.
818
AppendixQuestionnaire
Dear Colleague,
We know very little about how teachers teach spelling and the types of adaptations they make for different children in their classrooms. To find out more about these topics, the Center to Accelerate Student Learning at the University of Maryland is conducting a survey with teachers from across the United States. I would like to ask you to complete the attached questionnaire, and return it in the enclosed self-addressed stamped envelope. Please return the questionnaire in the next two weeks if at all possible. You should be able to complete the questionnaire in 15 to 30 minutes. I have attached a $2 dollar bill to the survey, to say thank you for completing the questionnaire. Thank you for taking the time to complete and return the questionnaire.
Section 1: Please complete the following questions
1. How many years have you taught? What grade(s) do you currently teach?
2. Please check your highest educational level: Bachelor Masters Doctoral
3. How many children are in your classroom?
4. How many children in your classroom receive a free or reduced lunch?
5. How many of the children in your classroom are:
Asian Black Hispanic White Other
6. How many of the children in your classroom receive special education services?
7. How many children in your class experience difficulty with spelling?
8. During an average week, how many minutes do you spend teaching spelling?
9. Do you use a commercial program to teach spelling? Yes No
What program(s)?
10. Do students in your class study lists of spelling words? Yes No
If yes, please answer the following question:
Please check the source or sources for students’ spelling words. Spelling Series
Basal Reader Children’s Reading Material Students’ Writing
Student Selected Other:
(continued)
by SJO TEMP 2008 on November 30, 2008 http://aerj.aera.netDownloaded from

Instructional Adaptations
819
Good Spellers:Several
Times a Day Daily Several
Times a Week Weekly Monthly Several
Times a Year Never
Weaker Spellers:Several
Times a Day Daily Several
Times a Week Weekly Monthly Several
Times a Year Never
Good Spellers:Several
Times a Day Daily Several
Times a Week Weekly Monthly Several
Times a Year Never
Weaker Spellers:Several
Times a Day Daily Several
Times a Week Weekly Monthly Several
Times a Year Never
Good Spellers:Several
Times a Day Daily Several
Times a Week Weekly Monthly Several
Times a Year Never
Weaker Spellers:Several
Times a Day Daily Several
Times a Week Weekly Monthly Several
Times a Year Never
Section 2:
If you answered yes to question 10 above, please answer the 2 questions below:
1. During an average week, how many words are studied by good spellers?
How many words are studied by weaker spellers?
Please place a check on the item that indicates how often you do the following.
2. Check how often you conference with students about their spelling.
3. Check how often you provide spelling mini-lessons on "things" students need to know right now—skills, words, rules, strategies, or whatever.
4. Check how often you reteach spelling skills or strategies that were previously taught.
Good Spellers:Several
Times a Day Daily Several
Times a Week Weekly Monthly Several
Times a Year Never
Weaker Spellers:Several
Times a Day Daily Several
Times a Week Weekly Monthly Several
Times a Year Never
Good Spellers:Several
Times a Day Daily Several
Times a Week Weekly Monthly Several
Times a Year Never
Weaker Spellers:Several
Times a Day Daily Several
Times a Week Weekly Monthly Several
Times a Year Never
5. Check how often your students use a spell checker.
6. Check how often you teach strategies for spelling unknown words (e.g., writing a word out to see if it looks right, sounding it out, using a known word to help spell an unknown one, etc).
Appendix (continued)
by SJO TEMP 2008 on November 30, 2008 http://aerj.aera.netDownloaded from

Graham et al.
820
Good Spellers:Several
Times a Day Daily Several
Times a Week Weekly Monthly Several
Times a Year Never
Weaker Spellers:Several
Times a Day Daily Several
Times a Week Weekly Monthly Several
Times a Year Never
Good Spellers:Several
Times a Day Daily Several
Times a Week Weekly Monthly Several
Times a Year Never
Weaker Spellers:Several
Times a Day Daily Several
Times a Week Weekly Monthly Several
Times a Year Never
Good Spellers:Several
Times a Day Daily Several
Times a Week Weekly Monthly Several
Times a Year Never
Weaker Spellers:Several
Times a Day Daily Several
Times a Week Weekly Monthly Several
Times a Year Never
Good Spellers:Several
Times a Day Daily Several
Times a Week Weekly Monthly Several
Times a Year Never
Weaker Spellers:Several
Times a Day Daily Several
Times a Week Weekly Monthly Several
Times a Year Never
Good Spellers:Several
Times a Day Daily Several
Times a Week Weekly Monthly Several
Times a Year Never
Weaker Spellers:Several
Times a Day Daily Several
Times a Week Weekly Monthly Several
Times a Year Never
7. Check how often you teach phonics for spelling.
8. Check how often you encourage students to use invented spellings.
9. Check how often you teach phonological awareness skills (such as rhyming, identifying the individual sounds in a word, deleting or adding sounds in a word, substituting one sound for another in a word, and so forth)
10. Check how often your students use games to learn spelling words or skills.
11. Check how often students work together to learn spelling words or skills.
Appendix (continued)
(continued)
.
by SJO TEMP 2008 on November 30, 2008 http://aerj.aera.netDownloaded from

Instructional Adaptations
821
Good Spellers:Several
Times a Day Daily Several
Times a Week Weekly Monthly Several
Times a Year Never
Weaker Spellers:Several
Times a Day Daily Several
Times a Week Weekly Monthly Several
Times a Year Never
Good Spellers:Several
Times a Day Daily Several
Times a Week Weekly Monthly Several
Times a Year Never
Weaker Spellers:Several
Times a Day Daily Several
Times a Week Weekly Monthly Several
Times a Year Never
Good Spellers:Several
Times a Day Daily Several
Times a Week Weekly Monthly Several
Times a Year Never
Weaker Spellers:Several
Times a Day Daily Several
Times a Week Weekly Monthly Several
Times a Year Never
Weaker Spellers:Several
Times a Day Daily Several
Times a Week Weekly Monthly Several
Times a Year Never
Good Spellers:Several
Times a Day Daily Several
Times a Week Weekly Monthly Several
Times a Year Never
Weaker Spellers:Several
Times a Day Daily Several
Times a Week Weekly Monthly Several
Times a Year Never
Good Spellers:Several
Times a Day Daily Several
Times a Week Weekly Monthly Several
Times a Year Never
12. Check how often students in your class do word sorting activities (such as sorting words into different piles based on their spelling patterns, the sounds they begin or end with, and so forth).
13. Check how often you conference with parents about their children’s spelling.
14. Check how often you teach dictionary skills for spelling.
15. Check how often your students use the computer to help them learn new words or spelling skills.
16. Check how often you use reinforcement or other motivational strategies to promote spelling.
Appendix (continued)
by SJO TEMP 2008 on November 30, 2008 http://aerj.aera.netDownloaded from

Graham et al.
822
Good Spellers:Several
Times a Day Daily Several
Times a Week Weekly Monthly Several
Times a Year Never
Weaker Spellers:Several
Times a Day Daily Several
Times a Week Weekly Monthly Several
Times a Year Never
Good Spellers:Several
Times a Day Daily Several
Times a Week Weekly Monthly Several
Times a Year Never
Weaker Spellers:Several
Times a Day Daily Several
Times a Week Weekly Monthly Several
Times a Year Never
17. Check how often students are taught spelling rules.
18. Check how often students proofread their writing or the writing of others to correct spelling errors.
Good Spellers:Several
Times a Day Daily Several
Times a Week Weekly Monthly Several
Times a Year Never
Weaker Spellers:Several
Times a Day Daily Several
Times a Week Weekly Monthly Several
Times a Year Never
Good Spellers:Several
Times a Day Daily Several
Times a Week Weekly Monthly Several
Times a Year Never
Weaker Spellers:Several
Times a Day Daily Several
Times a Week Weekly Monthly Several
Times a Year Never
Good Spellers:Several
Times a Day Daily Several
Times a Week Weekly Monthly Several
Times a Year Never
Weaker Spellers:Several
Times a Day Daily Several
Times a Week Weekly Monthly Several
Times a Year Never
19. Check how often you teach students to use a mnemonic for remembering how to spell a difficult word.
20. Check how often you show (circle, underline, etc.) students the words that are misspelled in their writing
21. Check how often you praise students for correct spelling.
What types of additional assistance/instruction do you provide to students who are weaker spellers? Thisis beyond what you typically do with students. List as many examples as you can.
Appendix (continued)
by SJO TEMP 2008 on November 30, 2008 http://aerj.aera.netDownloaded from

Instructional Adaptations
823
References
Adams, M. (1990). Beginning to read: Thinking and learning about print. Cambridge,MA: MIT Press.
Baker, J., & Zigmond, N. (1990). Are regular education classes equipped toaccommodate students with learning disabilities. Exceptional Children, 56,515–526.
Bear, D., Invernizzi, M., Templeton, S., & Johnston, F. (2000). Words their way: Wordstudy for phonics, vocabulary, and spelling instruction. Upper Saddle River, NJ:Merrill.
Berninger, V. (1999). Coordinating transcription and text generation in working mem-ory during composing: Automatic and constructive processes. LearningDisability Quarterly, 22, 99–112.
Berninger, V., Mizokawa, D., & Bragg, R. (1991). Theory-based diagnosis and reme-diation of writing disabilities. Journal of School Psychology, 29, 57–79.
Berninger, V., Vaughn, K., Abbott, R., Brooks, A., Abbott, S., Rogan, L., et al. (1998).A multiple connections approach to early intervention for spelling problems:Integrating instructional, learner and stimulus variables. Journal of EducationalPsychology, 90, 587–605.
Bridge, C. A., Compton-Hall, M., & Cantrell, S. C. (1997). Classroom writing practicesrevisited: The effects of statewide reform on writing instruction. ElementarySchool Journal, 98, 151–170.
Bridge, C. A., & Hiebert, E. H. (1985). A comparison of classroom writing practices,teachers’ perceptions of their writing instruction, and textbook recommendationson writing practices. Elementary School Journal, 86, 155–172.
Corno, L., & Snow, R. (1986). Adapting teaching to differences among individuallearners. In M. Wittrock (Ed.), Third handbook of research on teaching(pp. 605–629). New York: Macmillan.
Cutler, L., & Graham, S. (in press). Primary grade writing instruction: A national survey.Journal of Educational Psychology.
DeFord, D. (1985). Validating the construct of theoretical orientation in reading.Reading Research Quarterly, 20, 351–367.
Diaper, D. (1989). Knowledge elicitation: Principles, techniques, and application.New York: Wiley.
Dillman, D. (2000). Mail and internet surveys. New York: Wiley.Ehri, L. (1987). Learning to read and spell words. Journal of Reading Behavior,
19, 5–31.Fuchs, L., & Fuchs, D. (1998). General educators’ instructional adaptations for stu-
dents with learning disabilities. Learning Disability Quarterly, 21, 23–33. Gentry, R. (2007). Spelling connections. Columbus, OH: Zaner-Bloser.Gentry, R., & Gillett, W. (1993). Teaching kids to spell. Portsmouth, NH: Heinemann.Gettinger, M. (1993). The effects of invented spelling and direct instruction on
spelling performance of second-grade boys. Journal of Applied BehaviorAnalysis, 26, 281–291.
Graham, J. W., & Hofer, S. M. (2000). Multiple imputation in multivariate research.In T. D. Little, K. U. Schnabel, & J. Baumert (Eds.), Modeling longitudinal andmultilevel data: Practical issues, applied approaches, and specific examples(pp. 201–218). Mahwah, NJ: Lawrence Erlbaum.
Graham, J. W., Taylor, B. J., & Cumsille, P. E. (2001). Planned missing-data designsin analysis of change. In L. M. Collins & A. G. Sayer (Eds.), New methods for theanalysis of change (pp. 335–353). Washington, DC: American PsychologicalAssociation.
by SJO TEMP 2008 on November 30, 2008 http://aerj.aera.netDownloaded from

Graham et al.
824
Graham, S. (1983). Effective spelling instruction. Elementary School Journal, 83,560–567.
Graham, S. (1999). Handwriting and spelling instruction for students with learningdisabilities: A review. Learning Disability Quarterly, 22, 78–98.
Graham, S. (2000). Should the natural learning approach replace traditional spellinginstruction. Journal of Educational Psychology, 92, 235–247.
Graham, S., & Harris, K. R. (2002). Prevention and intervention for struggling writers.In M. Shinn, G. Stoner, & H. Walker (Eds.), Interventions for academic andbehavior problems II: Preventive and remedial approaches (pp. 589–610).Bethesda, MD: National Association of School Psychologists.
Graham, S., & Harris, K. R. (2005, February). The impact of handwriting and spellinginstruction on the writing and reading performance of at-risk first grade writers.Presentation at Pacific Coast Research Conference, San Diego, CA.
Graham, S., Harris, K. R., & Fink-Chorzempa, B. (2002). Contributions of spellinginstruction to the spelling, writing, and reading of poor spellers. Journal ofEducational Psychology, 94, 669–686.
Graham, S., Harris, K. R., Fink-Chorzempa, B., & MacArthur, C. (2003). Primary gradeteachers’ instructional adaptations for struggling writers: A national survey.Journal of Educational Psychology, 95, 279–292.
Graham, S., Harris, K. R., Mason, L., Fink-Chorzempa, B., Moran, S., & Saddler, B.(2008). How do primary grade teachers teach handwriting: A national survey.Reading and Writing: An Interdisciplinary Journal, 21, 49–69.
Graham, S., & Miller, L. (1979). Spelling research and practice: A unified approach.Focus on Exceptional Children, 12, 1–16.
Graham, S., Papadopoulou, E., & Santoro, J. (2006, April). Acceptability of writingadaptations and modifications in writing: A national survey. Paper presented atthe International Conference of the Council for Exceptional Children, Salt LakeCity, UT.
Kiuhara, S., Graham, S., & Hawkin, L. (2008). Teaching writing to high schoolstudents: A national survey. Manuscript submitted for publication.
Loomer, B., Fitzsimmons, R., & Strege, M. (1990). Spelling research and practice:Teacher’s edition. Iowa City, IA: Useful Learning.
Marshall, J. C. (1967). Writing neatness, composition errors, and essay grades.American Educational Research Journal, 4, 375–385.
Marshall, J. C., & Powers, J. M. (1969). Writing neatness, composition errors, andessay grades. Journal of Educational Measurement, 6(2), 97–101.
McCutchen, D. (1988). “Functional automaticity” in children’s writing: A problem ofmetacognitive control. Written Communication, 5, 306–324.
Moats, L. (1995). Spelling: Development, disability, and instruction. Baltimore: York.Moats, L. (2005/2006). How spelling supports reading: And why it is more regular
and predictable than you may think. American Educator, Winter, 12–43.Phillips, N., Fuchs, L., Fuchs, D., & Hamlett, C. (1996). Instructional variables affect-
ing student achievement: Case studies of two contrasting teachers. LearningDisabilities Research and Practice, 11, 24–33.
Pressley, M., Rankin, J., & Yokoi, L. (1996). A survey of instructional practices of pri-mary grade teachers nominated as effective in promoting literacy. ElementarySchool Journal, 96, 363–384.
Randi, J., & Corno, L. (2005). Teaching and learner variation. British Journal ofEducational Psychology, 2, 47–69.
Scardamalia, M., & Bereiter, C. (1986). Written composition. In M. Wittrock (Ed.),Handbook of research on teaching (3rd ed., pp. 778–803). New York: Macmillan.
by SJO TEMP 2008 on November 30, 2008 http://aerj.aera.netDownloaded from

Schlagel, B. (2007). Best practices in spelling and handwriting. In S. Graham, C. MacArthur, & J. Fitzgerald (Eds.), Best practices in writing instruction(pp. 179–201). New York: Guilford.
Schumm, J. S., & Vaughn, S. (1991). Making adaptations for mainstreamed students:General classroom teachers’ perspectives. Remedial and Special Education, 12,18–27.
Stallings, J. (1995). Ensuring teaching and learning in the 21st century. EducationalResearcher, 24, 4–8.
Tobias, S. (1995). Interest and metacognitive word knowledge. Journal ofEducational Psychology, 87, 399–405.
Treiman, R. (1993). Beginning to spell. New York: Oxford University Press.Wanzek, J., Vaughn, S., Wexler, J., Swanson, E. A., Edmonds, M., & Kim, A.-H. (2006).
A synthesis of spelling and reading interventions and their effects on the spellingoutcomes of students with LD. Journal of Learning Disabilities, 39, 528–543.
Wharton-McDonald, R., Pressley, M., & Hampston, J. M. (1998). Literacy instructionin nine first-grade classrooms: Teacher characteristics and student achievement.Elementary School Journal, 99, 101–128.
Manuscript received April 23, 2007Revision received February 5, 2008
Accepted April 16, 2008
Instructional Adaptations
825 by SJO TEMP 2008 on November 30, 2008 http://aerj.aera.netDownloaded from