american eels in virginia mountain streams dolloff afs 2018 va mount… · american eels in...
TRANSCRIPT

American Eels in Virginia Mountain
Streams
Andy Dolloff1 ,Craig Roghair1, Colin
Krause1, Dawn Kirk2, Scott Smith3, Andy
Strickland4
1US Forest Service, Southern Research Station2GW-Jeff National Forest
3 Virginia DGIF4 Florida FWC
American Fisheries Society, Atlantic City, August 2018
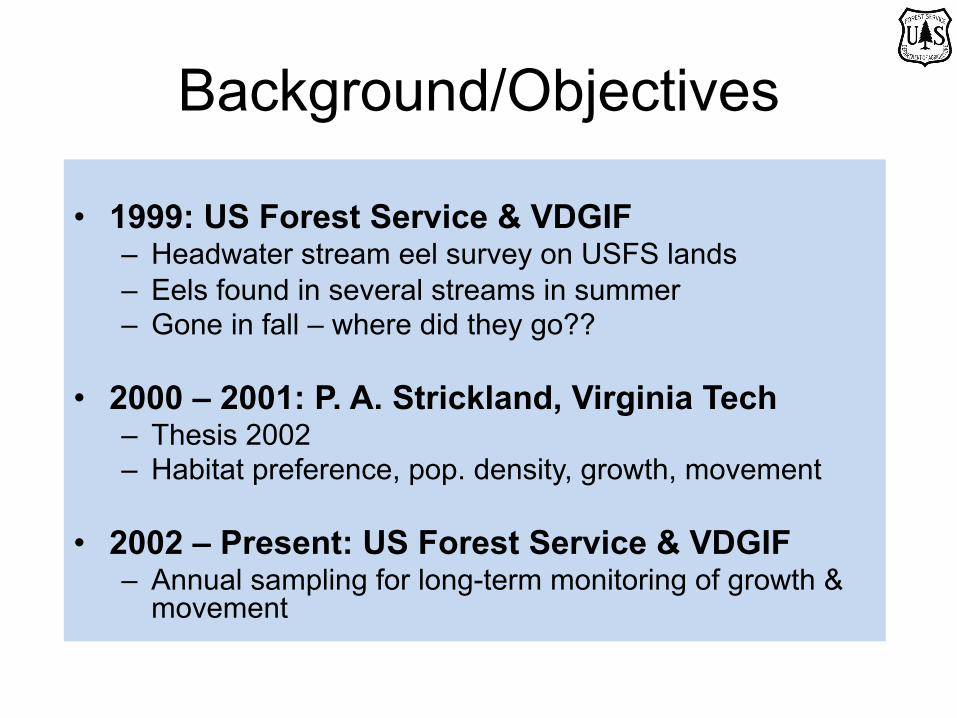
Background/Objectives
• 1999: US Forest Service & VDGIF– Headwater stream eel survey on USFS lands
– Eels found in several streams in summer
– Gone in fall – where did they go??
• 2000 – 2001: P. A. Strickland, Virginia Tech– Thesis 2002
– Habitat preference, pop. density, growth, movement
• 2002 – Present: US Forest Service & VDGIF– Annual sampling for long-term monitoring of growth &
movement

Study Sites
Rappahannock R.
James River
Lexington

Study Sites
Shoe Cr.2 km sample reach
S.F. Tye R.2 km sample reach
Stream Description
Habitat• pool, riffle• gravel, cobble, boulder• gradient 5%• Avg. width 8 m
Fish• American Eel • Blacknose Dace• Bluehead Chub• Brook Trout• Central Stoneroller• Longnose Dace• Mountain Redbelly dace• Rosyside Dace• Torrent Sucker• and others
S.F. Tye River
Shoe Creek

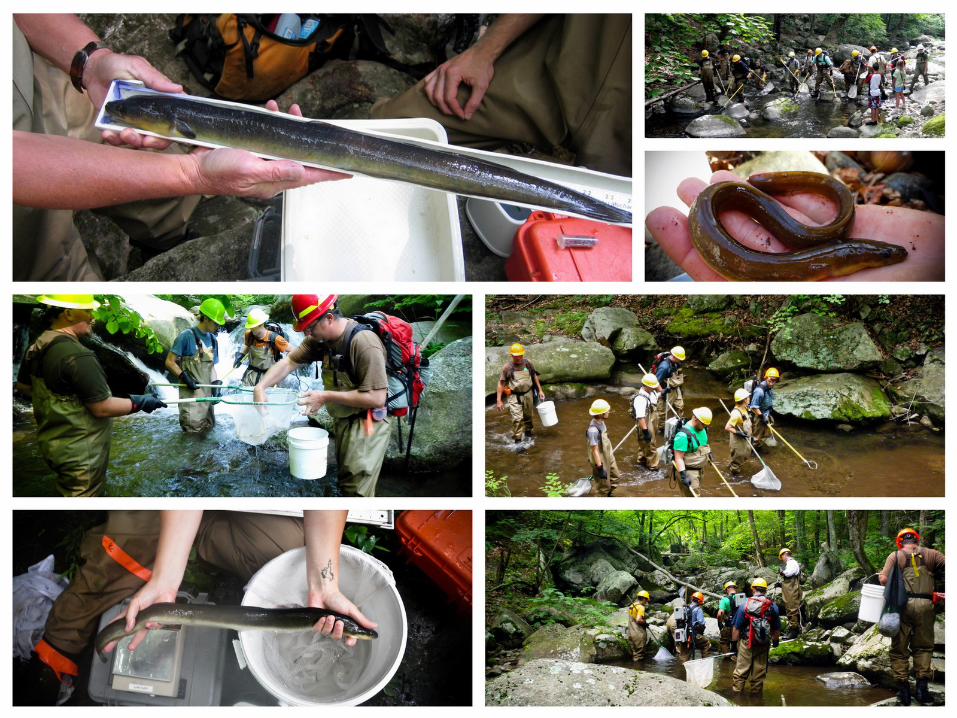
Methods• 2000-2001 P. A. Strickland
– 2 km reaches, 3 streams– Multiple pass efishing for population est.– Radio telemetry for movement & habitat
preference– PIT (passive integrated transponder)
tagging for growth estimates
• 2002-Present USFS– 2 km reaches, 2 streams– Single pass efishing in summer– PIT tagging– Location, length, & weight
Shoe Creek
ww
w.fli
ckriv
er.c
om
Electrofishing
PIT tag
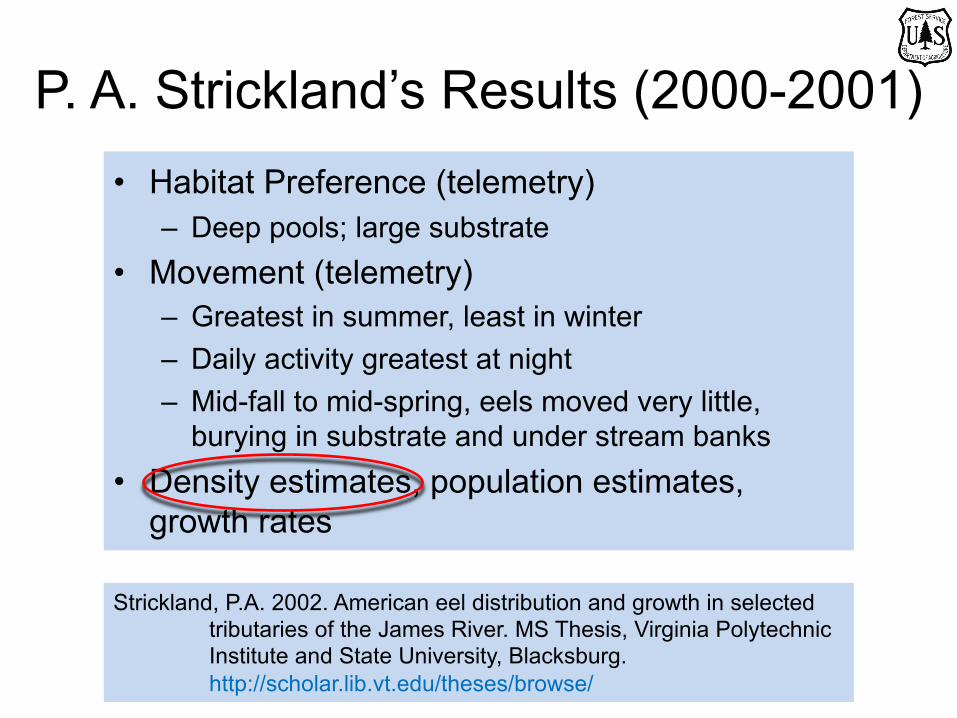
P. A. Strickland’s Results (2000-2001)• Habitat Preference (telemetry)
– Deep pools; large substrate• Movement (telemetry)
– Greatest in summer, least in winter– Daily activity greatest at night– Mid-fall to mid-spring, eels moved very little,
burying in substrate and under stream banks• Density estimates, population estimates,
growth rates
Strickland, P.A. 2002. American eel distribution and growth in selected tributaries of the James River. MS Thesis, Virginia Polytechnic Institute and State University, Blacksburg.http://scholar.lib.vt.edu/theses/browse/

P. A. Strickland’s Results (2000-2001)
0
1
2
3
4
5
6
7
S.F. Piney R. Shoe Cr. S.F. Tye R.
Den
sity
(eel
s/10
0 m
2 )
2000 2001 2000 20012000 2001
USFS continues monitoring in Shoe Cr. & Tye R. b/c of high densities.
Comparison Data:<2 eels/100 m2 in James R. & Shenandoah R. drainage streams
(Smogor et al. 1995, Goodwin and Angermeier 2003)

Strickland & USFS Results (1999-2018)Results:• PIT tagging• Size• Growth• Range• Recapture rates

S.F. Tye River Shoe Creek
# Tag Yrs. 18(2000 – 2018*)
6(1999 – 2004)
# Recap. Yrs. 17(2001 – 2018*)
11(2000 – 2010)
# Captured(new eels only) 1,978 543
# Tagged 1,748 283# Recaptured(no duplicates)
770(44%)
115(41%)
Tagging Summary
*Did not sample in 2011

Size
Comparison Data:Adults 220 – 1,000 mm (Jenkins and Burkhead 1993)
Lower Potomac tribs, 76 - 820 mm (Goodwin and Angermeier 2003)Shenandoah drainage, 292 – 1,023 mm (Goodwin and Angermeier 2003)
Length and weights typical for VA streams.
0
100
200
300
400
500
600
700
800
S.F. Tye R. Shoe Cr.
Leng
th (m
m)
Length (mm)
0
100
200
300
400
500
600
700
800
S.F. Tye R. Shoe Cr.
Wei
ght (
g)
Weight (g)
(n = 3,312) (n = 682) (n = 3,312) (n = 682)
372339
85 64

Annual Growth
Comparison Data:Shenandoah drainage, 43 mm/yr. (Goodwin 1999)
Coastal GA streams, 57-62 mm/yr. (Helfman et al. 1984)Coastal RI streams, 23-33 mm/yr. (Oliveira 1999)
Coastal ME rivers, 18-32 mm/yr. (Oliveira and McCleave 2002)
Growth variable; comparisons difficult.
0
50
100
150
200
S.F. Tye R. Shoe Cr.
Leng
th (m
m)
Growth/Year (mm)
0
50
100
150
200
S.F. Tye R. Shoe Cr.W
eigh
t (g)
Growth/Year (g)
(n = 760) (n = 103) (n = 760) (n = 103)
21 25 19 22

Rangei.e. the difference
between min. & max.
capture distance
100 58
(n = 760) (n = 103)
When recaptured, the majority of eels were very close to
the location they were 1st captured at 1-17 years earlier.
Radio Telemetry(Strickland 2002)
Summer Mean Range (m) n
2000 228 (±114) 18
2001 36 (±24) 15
0
500
1,000
1,500
2,000
S.F. Tye R. Shoe Cr.
Ran
ge (m
)

Multiple Recaptures~40% of recaptured eels were recaptured 2 or more times.
S.F. Tye River (1,748 tagged, 770 recap.) Shoe Creek (283 tagged, 115 recap.)
45%
55%
38%
62%424
177
107
3819 3 2
0
50
100
150
200
250
300
350
400
450
1 2 3 4 5 6 8
# E
els
Times Recaptured
71
30
11
0 3
0
10
20
30
40
50
60
70
80
1 2 3 4 5
Times Recaptured

New Recaptures per Sample Year
Tag YearTotal
Tagged 2000 2001 2002 2003 2004 2005 2006 2007 2008 2009 2010 2012 2013 2014 2015 2016 2017 2018
S. F
. Tye
Riv
er
2000 279 97 32 11 8 7 6 4 4 2 5 1 2 1 1 12001 225 56 18 15 10 3 4 5 2 4 32002 149 25 16 8 8 3 4 2 4 1 12003 76 11 8 3 1 4 1 3 4 1 1 1 12004 116 21 8 3 6 7 4 10 4 3 1 12005 72 10 5 8 5 3 3 1 1 1 12006 49 6 6 2 2 4 12007 61 8 5 2 7 4 2 3 12008 67 4 6 8 1 2 1 42009 62 10 5 1 6 1 2 12010 88 13 4 6 4 3 52012 98 8 8 6 9 7 42013 38 3 3 3 12014 73 5 10 4 42015 47 1 5 32016 59 9 32017 112 15
Sho
e C
reek
1999 68 22 5 1 2 1 12000 93 19 7 3 4 1 1 1 2 12001 41 3 4 2 1 1 32002 22 2 3 1 2 1 12003 16 2 1 1 1 12004 43 1 5 3 4 1
New RecapturesEvery year we sample, we often catch eels that
have never been recaptured before!
97 65 43 45 32 24 18 16 14 14 7 4 2 1 1 1 0
New + Multiple Recaptures

Tag Year
Total Tagged 2000 2001 2002 2003 2004 2005 2006 2007 2008 2009 2010 2012 2013 2014 2015 2016 2017 2018
Total New
Recaps
% Recaps at 1st
Sample Yr.
Total % Recaps
S. F
. Tye
Riv
er
2000 279 97 32 11 8 7 6 4 4 2 5 1 2 1 1 1 182 35% 65%2001 225 56 18 15 10 3 4 5 2 4 3 120 25% 53%2002 149 25 16 8 8 3 4 2 4 1 1 72 17% 48%2003 76 11 8 3 1 4 1 3 4 1 1 1 1 39 14% 51%2004 116 21 8 3 6 7 4 10 4 3 1 1 68 18% 59%2005 72 10 5 8 5 3 3 1 1 1 1 38 14% 53%2006 49 6 6 2 2 4 1 21 12% 43%2007 61 8 5 2 7 4 2 3 1 32 13% 52%2008 67 4 6 8 1 2 1 4 26 6% 39%2009 62 10 5 1 6 1 2 1 26 16% 42%2010 88 13 4 6 4 3 5 35 15% 40%2012 98 8 8 6 9 7 4 42 8% 43%2013 38 3 3 3 1 10 8% 26%2014 73 5 10 4 4 23 7% 32%2015 47 1 5 3 9 2% 19%2016 59 9 3 12 15% 20%2017 112 15 15 13% 13%
Avg. 14% 41%
Shoe
Cre
ek
1999 68 22 5 1 2 1 1 32 32% 47%2000 93 19 7 3 4 1 1 1 2 1 39 20% 42%2001 41 3 4 2 1 1 3 14 7% 34%2002 22 2 3 1 2 1 1 10 9% 45%2003 16 2 1 1 1 1 6 13% 38%2004 43 1 5 3 4 1 14 2% 33%
Avg. 14% 40%
New RecapturesIf you sample once after tagging, the % recaptured is low.

Tag Year
Total Tagged 2000 2001 2002 2003 2004 2005 2006 2007 2008 2009 2010 2012 2013 2014 2015 2016 2017 2018
Total New
Recaps
% Recaps at 1st
Sample Yr.
Total % Recaps
S. F
. Tye
Riv
er
2000 279 97 32 11 8 7 6 4 4 2 5 1 2 1 1 1 182 35% 65%2001 225 56 18 15 10 3 4 5 2 4 3 120 25% 53%2002 149 25 16 8 8 3 4 2 4 1 1 72 17% 48%2003 76 11 8 3 1 4 1 3 4 1 1 1 1 39 14% 51%2004 116 21 8 3 6 7 4 10 4 3 1 1 68 18% 59%2005 72 10 5 8 5 3 3 1 1 1 1 38 14% 53%2006 49 6 6 2 2 4 1 21 12% 43%2007 61 8 5 2 7 4 2 3 1 32 13% 52%2008 67 4 6 8 1 2 1 4 26 6% 39%2009 62 10 5 1 6 1 2 1 26 16% 42%2010 88 13 4 6 4 3 5 35 15% 40%2012 98 8 8 6 9 7 4 42 8% 43%2013 38 3 3 3 1 10 8% 26%2014 73 5 10 4 4 23 7% 32%2015 47 1 5 3 9 2% 19%2016 59 9 3 12 15% 20%2017 112 15 15 13% 13%
Avg. 14% 41%
Shoe
Cre
ek
1999 68 22 5 1 2 1 1 32 32% 47%2000 93 19 7 3 4 1 1 1 2 1 39 20% 42%2001 41 3 4 2 1 1 3 14 7% 34%2002 22 2 3 1 2 1 1 10 9% 45%2003 16 2 1 1 1 1 6 13% 38%2004 43 1 5 3 4 1 14 2% 33%
Avg. 14% 40%
New RecapturesAdditional sample years increases % recaptured.

Recapture RatesThe more years we sample, the higher the % recaptured.
0%
10%
20%
30%
40%
50%
60%
70%
1716151413121110987654321
% R
ecap
ture
d
Years Since Tagging (i.e. # of samples)
% Recaptures - S.F. Tye River

200
300
400
500
600
700
2000 2010
Leng
th (m
m)
386
293
(n = 278) (n = 14)
Eels Recaptured 10 Years Later
S.F. Tye River
Eels recaptured 10 yrs.
later were <400 mm
when tagged.
Tagging small eels offers long-term recapture possibilities.

0
5
10
15
20
150 250 350 450 550 650 750
Year
s Si
nce
Tagg
ing
Length at Tagging (mm)
Eel Length vs. Years Since Tagged
S.F. Tye River
Estimated 15 – 20 years of recapture data for eels tagged when <400 mm.
Yrs. To Maturation4 - 18 yrs. (Jenkins and Burkhead 1993)
8 - 24 yrs. (ASMFC 2000)

Study SitesStream Description
Habitat• pool, riffle• gravel, cobble, boulder• gradient 10%• avg. width 3.5 m
Fish• American eel• Blacknose dace• Bluehead chub• Brook trout• Common shiner• Fallfish• Longnose dace• Mottled sculpin• Mountain redbelly dace• Rosyside dace• Smallmouth bass• Torrent sucker• White sucker
Staunton R.3.5 km sample reach
Staunton River

0
100
200
300
400
500
600
700
800
1992
1994
1996
1998
2000
2002
2004
2006
2008
2010
2012
2014
2016
Leng
th (m
m)
Year
Embrey dam removed 2004 • 6.7 m high (22 ft)• Located 153 km (95 mi)
downstream of Staunton R.
Eels in the Staunton Riverdam removal eels return
http://ian.umces.edu
http://ian.umces.edu
Hitt et al. also found an increase small eels after the removal of Embrey dam.Nathaniel P. Hitt, Sheila Eyler & John E. B. Wofford (2012): Dam Removal Increases
American Eel Abundance in Distant Headwater Streams, Transactions of theAmerican Fisheries Society, 141:5, 1171-1179

Conclusions• Highly mobile or highly sedentary
depending on life stage• Don’t move much in headwaters• Stay a long time
– Local conditions important• Long-term studies have great benefits
– High recapture %• Small eels return in Staunton

Future Work
• Continue annual sampling• Additional data analysis
– Annual mortality• Expand PIT tagging to Rapidan
headwaters?• Any PIT monitoring downstream on
James River?