american electric power 2011 annual report electric transmission texas, llc, an equity interest...
TRANSCRIPT

Appendix A to the Proxy Statement
American Electric Power 2011 Annual Report
Audited Consolidated Financial Statements and Management’s Financial Discussion and Analysis


CONTENTS
AMERICAN ELECTRIC POWER
1 Riverside Plaza
Columbus, Ohio 43215-2373
Glossary of Terms i
Forward-Looking Information iv
AEP Common Stock and Dividend Information vi
Selected Consolidated Financial Data 1
Management’s Financial Discussion and Analysis 2
Reports of Independent Registered Public Accounting Firm 43-44
Management’s Report on Internal Control Over Financial Reporting 45
Consolidated Statements of Income 46
Consolidated Statements of Comprehensive Income (Loss) 47
Consolidated Statements of Changes in Equity 48
Consolidated Balance Sheets 49-50
Consolidated Statements of Cash Flows 51
Index of Notes to Consolidated Financial Statements 52
Corporate and Shareholder Information 148
Executive Leadership Team 149

i
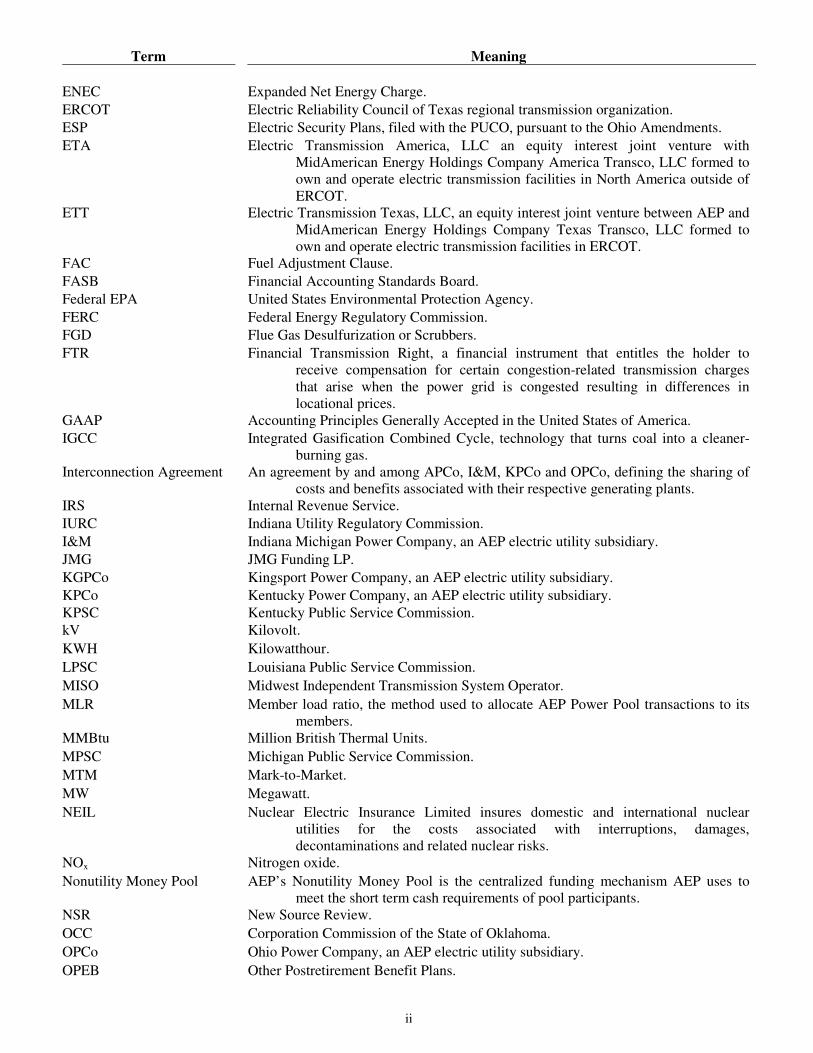
GLOSSARY OF TERMS
When the following terms and abbreviations appear in the text of this report, they have the meanings indicated below.
Term Meaning AEGCo AEP Generating Company, an AEP electric utility subsidiary. AEP or Parent American Electric Power Company, Inc., a holding company. AEP Consolidated AEP and its majority owned consolidated subsidiaries and consolidated affiliates.
AEP Credit AEP Credit, Inc., a subsidiary of AEP which factors accounts receivable and accrued utility revenues for affiliated electric utility companies.
AEP East companies APCo, I&M, KPCo and OPCo.
AEP Foundation AEP charitable organization created in 2005 for charitable contributions in the communities in which AEP’s subsidiaries operate.
AEP Power Pool Members are APCo, I&M, KPCo and OPCo. The AEP Power Pool shares the generation, cost of generation and resultant wholesale off-system sales of the member companies.
AEP System or the System American Electric Power System, an integrated electric utility system, owned and operated by AEP’s electric utility subsidiaries.
AEP West companies PSO, SWEPCo, TCC and TNC.
AEPEP AEP Energy Partners, Inc., a subsidiary of AEP dedicated to wholesale marketing and trading, asset management and commercial and industrial sales in the deregulated Texas market.
AEPES AEP Energy Services, Inc., a subsidiary of AEP Resources, Inc.
AEPSC American Electric Power Service Corporation, a service subsidiary providing management and professional services to AEP and its subsidiaries.
AFUDC Allowance for Funds Used During Construction.
AOCI Accumulated Other Comprehensive Income.
APCo Appalachian Power Company, an AEP electric utility subsidiary.
APSC Arkansas Public Service Commission. ASU Accounting Standard Update. BOA Bank of America Corporation. CAA Clean Air Act. CLECO Central Louisiana Electric Company, a nonaffiliated utility company.
CO2 Carbon Dioxide and other greenhouse gases.
Cook Plant Donald C. Cook Nuclear Plant, a two-unit, 2,191 MW nuclear plant owned by I&M.
CSPCo Columbus Southern Power Company, a former AEP electric utility subsidiary that was merged into OPCo effective December 31, 2011.
CSW Central and South West Corporation, a subsidiary of AEP (Effective January 21, 2003, the legal name of Central and South West Corporation was changed to AEP Utilities, Inc.).
CSW Operating Agreement Agreement, dated January 1, 1997, as amended, by and among PSO and SWEPCo governing generating capacity allocation, energy pricing, and revenues and costs of third party sales. AEPSC acts as the agent.
CTC Competition Transition Charge, a transition charge applied to TCC’s transmission and distribution rates for stranded costs and other true-up amounts as required by the Texas Restructuring Legislation.
CWIP Construction Work in Progress. DCC Fuel DCC Fuel LLC, DCC Fuel II LLC, DCC Fuel III LLC and DCC Fuel IV LLC,
consolidated variable interest entities formed for the purpose of acquiring, owning and leasing nuclear fuel to I&M.
DETM Duke Energy Trading and Marketing L.L.C., a risk management counterparty. DHLC Dolet Hills Lignite Company, LLC, a wholly-owned lignite mining subsidiary of
SWEPCo. E&R Environmental compliance and transmission and distribution system reliability.
EIS Energy Insurance Services, Inc., a nonaffiliated captive insurance company.
ii
Term Meaning
ENEC Expanded Net Energy Charge.
ERCOT Electric Reliability Council of Texas regional transmission organization.
ESP Electric Security Plans, filed with the PUCO, pursuant to the Ohio Amendments.
ETA Electric Transmission America, LLC an equity interest joint venture with MidAmerican Energy Holdings Company America Transco, LLC formed to own and operate electric transmission facilities in North America outside of ERCOT.
ETT Electric Transmission Texas, LLC, an equity interest joint venture between AEP and MidAmerican Energy Holdings Company Texas Transco, LLC formed to own and operate electric transmission facilities in ERCOT.
FAC Fuel Adjustment Clause.
FASB Financial Accounting Standards Board.
Federal EPA United States Environmental Protection Agency.
FERC Federal Energy Regulatory Commission.
FGD Flue Gas Desulfurization or Scrubbers.
FTR Financial Transmission Right, a financial instrument that entitles the holder to receive compensation for certain congestion-related transmission charges that arise when the power grid is congested resulting in differences in locational prices.
GAAP Accounting Principles Generally Accepted in the United States of America.
IGCC Integrated Gasification Combined Cycle, technology that turns coal into a cleaner-burning gas.
Interconnection Agreement An agreement by and among APCo, I&M, KPCo and OPCo, defining the sharing of costs and benefits associated with their respective generating plants.
IRS Internal Revenue Service.
IURC Indiana Utility Regulatory Commission.
I&M Indiana Michigan Power Company, an AEP electric utility subsidiary.
JMG JMG Funding LP.
KGPCo Kingsport Power Company, an AEP electric utility subsidiary.
KPCo Kentucky Power Company, an AEP electric utility subsidiary.
KPSC Kentucky Public Service Commission.
kV Kilovolt.
KWH Kilowatthour.
LPSC Louisiana Public Service Commission.
MISO Midwest Independent Transmission System Operator.
MLR Member load ratio, the method used to allocate AEP Power Pool transactions to its members.
MMBtu Million British Thermal Units.
MPSC Michigan Public Service Commission.
MTM Mark-to-Market.
MW Megawatt.
NEIL Nuclear Electric Insurance Limited insures domestic and international nuclear utilities for the costs associated with interruptions, damages, decontaminations and related nuclear risks.
NOx Nitrogen oxide.
Nonutility Money Pool AEP’s Nonutility Money Pool is the centralized funding mechanism AEP uses to meet the short term cash requirements of pool participants.
NSR New Source Review.
OCC Corporation Commission of the State of Oklahoma.
OPCo Ohio Power Company, an AEP electric utility subsidiary.
OPEB Other Postretirement Benefit Plans.

iii
Term Meaning
OTC Over the counter.
OVEC Ohio Valley Electric Corporation, which is 43.47% owned by AEP.
PJM Pennsylvania – New Jersey – Maryland regional transmission organization.
PM Particulate Matter.
POLR Provider of Last Resort revenues.
PSO Public Service Company of Oklahoma, an AEP electric utility subsidiary.
PUCO Public Utilities Commission of Ohio.
PUCT Public Utility Commission of Texas.
Registrant Subsidiaries AEP subsidiaries which are SEC registrants; APCo, I&M, OPCo, PSO and SWEPCo.
Risk Management Contracts Trading and nontrading derivatives, including those derivatives designated as cash flow and fair value hedges.
Rockport Plant A generating plant, consisting of two 1,300 MW coal-fired generating units near Rockport, Indiana, owned by AEGCo and I&M.
RTO Regional Transmission Organization, responsible for moving electricity over large interstate areas.
Sabine Sabine Mining Company, a lignite mining company that is a consolidated variable interest entity.
SEET Significantly Excessive Earnings Test.
SEC U.S. Securities and Exchange Commission.
SIA System Integration Agreement, effective June 15, 2000, provides contractual basis for coordinated planning, operation and maintenance of the power supply sources of the combined AEP.
SNF Spent Nuclear Fuel.
SO2 Sulfur Dioxide.
SPP Southwest Power Pool regional transmission organization.
Stall Unit J. Lamar Stall Unit at Arsenal Hill Plant.
SWEPCo Southwestern Electric Power Company, an AEP electric utility subsidiary.
TCC AEP Texas Central Company, an AEP electric utility subsidiary.
Texas Restructuring Legislation
Legislation enacted in 1999 to restructure the electric utility industry in Texas.
TNC AEP Texas North Company, an AEP electric utility subsidiary.
Transition Funding AEP Texas Central Transition Funding I LLC and AEP Texas Central Transition Funding II LLC, wholly-owned subsidiaries of TCC and consolidated variable interest entities formed for the purpose of issuing and servicing securitization bonds related to Texas restructuring law.
True-up Proceeding A filing made under the Texas Restructuring Legislation to finalize the amount of stranded costs and other true-up items and the recovery of such amounts.
Turk Plant John W. Turk, Jr. Plant.
Utility Money Pool AEP System’s Utility Money Pool is the centralized funding mechanism AEP uses to meet the short term cash requirements of pool participants.
VIE Variable Interest Entity.
Virginia SCC Virginia State Corporation Commission.
WPCo Wheeling Power Company, an AEP electric utility subsidiary.
WVPSC Public Service Commission of West Virginia.
iv
FORWARD-LOOKING INFORMATION This report made by AEP and its Registrant Subsidiaries contains forward-looking statements within the meaning of Section 21E of the Securities Exchange Act of 1934. Many forward-looking statements appear in “Item 7 – Management’s Financial Discussion and Analysis,” but there are others throughout this document which may be identified by words such as “expect,” “anticipate,” “intend,” “plan,” “believe,” “will,” “should,” “could,” “would,” “project,” “continue” and similar expressions, and include statements reflecting future results or guidance and statements of outlook. These matters are subject to risks and uncertainties that could cause actual results to differ materially from those projected. Forward-looking statements in this document are presented as of the date of this document. Except to the extent required by applicable law, we undertake no obligation to update or revise any forward-looking statement. Among the factors that could cause actual results to differ materially from those in the forward-looking statements are:
• The economic climate and growth in, or contraction within, our service territory and changes in market demand and demographic patterns.
• Inflationary or deflationary interest rate trends.
• Volatility in the financial markets, particularly developments affecting the availability of capital on reasonable terms and developments impairing our ability to finance new capital projects and refinance existing debt at attractive rates.
• The availability and cost of funds to finance working capital and capital needs, particularly during periods when the time lag between incurring costs and recovery is long and the costs are material.
• Electric load, customer growth and the impact of retail competition, particularly in Ohio due to the February 2012 PUCO rehearing order.
• Weather conditions, including storms, and our ability to recover significant storm restoration costs through applicable rate mechanisms.
• Available sources and costs of, and transportation for, fuels and the creditworthiness and performance of fuel suppliers and transporters.
• Availability of necessary generating capacity and the performance of our generating plants.
• Our ability to resolve I&M’s Donald C. Cook Nuclear Plant Unit 1 restoration and outage-related issues through warranty, insurance and the regulatory process.
• Our ability to recover regulatory assets and stranded costs in connection with deregulation.
• Our ability to recover increases in fuel and other energy costs through regulated or competitive electric rates.
• Our ability to build or acquire generating capacity, and transmission lines and facilities (including our ability to obtain any necessary regulatory approvals and permits) when needed at acceptable prices and terms and to recover those costs (including the costs of projects that are cancelled) through applicable rate cases or competitive rates.
• New legislation, litigation and government regulation, including oversight of nuclear generation, energy commodity trading and new or heightened requirements for reduced emissions of sulfur, nitrogen, mercury, carbon, soot or particulate matter and other substances or additional regulation of fly ash and similar combustion products that could impact the continued operation and cost recovery of our plants and related assets.
• A reduction in the federal statutory tax rate.
• Timing and resolution of pending and future rate cases, negotiations and other regulatory decisions, including rate or other recovery of new investments in generation, distribution and transmission service and environmental compliance.
• Resolution of litigation.
• Our ability to constrain operation and maintenance costs.
• Our ability to develop and execute a strategy based on a view regarding prices of electricity, natural gas and other energy-related commodities.
• Changes in the creditworthiness of the counterparties with whom we have contractual arrangements, including participants in the energy trading market.
• Actions of rating agencies, including changes in the ratings of our debt.
• Volatility and changes in markets for electricity, natural gas, coal, nuclear fuel and other energy-related commodities.

v
• Changes in utility regulation, including the implementation of ESPs and the expected legal separation and transition to market for generation in Ohio and the allocation of costs within regional transmission organizations, including PJM and SPP.
• Accounting pronouncements periodically issued by accounting standard-setting bodies.
• The impact of volatility in the capital markets on the value of the investments held by our pension, other postretirement benefit plans, captive insurance entity and nuclear decommissioning trust and the impact on future funding requirements.
• Prices and demand for power that we generate and sell at wholesale.
• Changes in technology, particularly with respect to new, developing or alternative sources of generation.
• Our ability to recover through rates or market prices any remaining unrecovered investment in generating units that may be retired before the end of their previously projected useful lives.
• Our ability to successfully manage negotiations with stakeholders and obtain regulatory approval to terminate or amend the Interconnection Agreement and break up or modify the AEP Power Pool.
• Evolving public perception of the risks associated with fuels used before, during and after the generation of electricity, including nuclear fuel.
• Other risks and unforeseen events, including wars, the effects of terrorism (including increased security costs), embargoes, cyber security threats and other catastrophic events.
The forward looking statements of AEP and its registrant subsidiaries speak only as of the date of this report or as of the date they are made. AEP and its Registrant Subsidiaries expressly disclaim any obligation to update any forward-looking information.

vi
AEP COMMON STOCK AND DIVIDEND INFORMATION The AEP common stock quarterly high and low sales prices, quarter-end closing price and the cash dividends paid per share are shown in the following table: Quarter-End
Quarter Ended High Low Closing Price Dividend
December 31, 2011 $ 41.71 $ 35.85 $ 41.31 $ 0.47
September 30, 2011 38.98 33.09 38.02 0.46
June 30, 2011 38.99 34.37 37.68 0.46
March 31, 2011 36.92 33.47 35.14 0.46
December 31, 2010 $ 37.94 $ 34.92 $ 35.98 $ 0.46
September 30, 2010 36.93 31.87 36.23 0.42
June 30, 2010 35.00 28.17 32.30 0.42
March 31, 2010 36.86 32.68 34.18 0.41
AEP common stock is traded principally on the New York Stock Exchange. At December 31, 2011, AEP had approximately 87,000 registered shareholders.
COMPARISON OF 5 YEAR CUMULATIVE TOTAL RETURN*Among American Electric Power Company, Inc., the S&P 500 Index
and the S&P Electric Utilities Index
105
66
84
97 99
101
113
8493
122
9491
123
98
118
$0
$20
$40
$60
$80
$100
$120
$140
12/06 12/07 12/08 12/09 12/10 12/11
American Electric Power Company, Inc. S&P 500 S&P Electric Utilities
*$100 invested on 12/31/06 in stock or index, including reinvestment of dividends.
Fiscal year ending December 31.
Copyright© 2012 S&P, a division of The McGraw-Hill Companies Inc. All rights reserved.

1
AMERICAN ELECTRIC POWER COMPANY, INC. AND SUBSIDIARY COMPANIES SELECTED CONSOLIDATED FINANCIAL DATA
2011 2010 2009 2008 2007
(dollars in millions, except per share amounts)
STATEMENTS OF INCOME DATA
Total Revenues $ 15,116 $ 14,427 $ 13,489 $ 14,440 $ 13,380 Operating Income $ 2,782 $ 2,663 $ 2,771 $ 2,787 $ 2,319 Income Before Discontinued Operations and Extraordinary Items $ 1,576 $ 1,218 $ 1,370 $ 1,376 $ 1,153
Discontinued Operations, Net of Tax - - - 12 24
Income Before Extraordinary Items 1,576 1,218 1,370 1,388 1,177
Extraordinary Items, Net of Tax 373 - (5) - (79)
Net Income 1,949 1,218 1,365 1,388 1,098 Net Income Attributable to Noncontrolling Interests 3 4 5 5 6
NET INCOME ATTRIBUTABLE TO AEP SHAREHOLDERS 1,946 1,214 1,360 1,383 1,092
Preferred Stock Dividend Requirements of Subsidiaries Including
Capital Stock Expense 5 3 3 3 3
EARNINGS ATTRIBUTABLE TO AEP COMMON SHAREHOLDERS $ 1,941 $ 1,211 $ 1,357 $ 1,380 $ 1,089
BALANCE SHEETS DATA
Total Property, Plant and Equipment $ 55,670 $ 53,740 $ 51,684 $ 49,710 $ 46,145
Accumulated Depreciation and Amortization 18,699 18,066 17,340 16,723 16,275
Total Property, Plant and Equipment – Net $ 36,971 $ 35,674 $ 34,344 $ 32,987 $ 29,870
Total Assets $ 52,223 $ 50,455 $ 48,348 $ 45,155 $ 40,319 Total AEP Common Shareholders’ Equity $ 14,664 $ 13,622 $ 13,140 $ 10,693 $ 10,079 Noncontrolling Interests $ 1 $ - $ - $ 17 $ 18 Cumulative Preferred Stock Not Subject to Mandatory Redemption $ - $ 60 $ 61 $ 61 $ 61 Long-term Debt (a) $ 16,516 $ 16,811 $ 17,498 $ 15,983 $ 14,994 Obligations Under Capital Leases (a) $ 458 $ 474 (b) $ 317 $ 325 $ 371
AEP COMMON STOCK DATA
Basic Earnings (Loss) per Share Attributable to AEP Common Shareholders:
Income Before Discontinued Operations and Extraordinary Items $ 3.25 $ 2.53 $ 2.97 $ 3.40 $ 2.87
Discontinued Operations, Net of Tax - - - 0.03 0.06
Income Before Extraordinary Items 3.25 2.53 2.97 3.43 2.93
Extraordinary Items, Net of Tax 0.77 - (0.01) - (0.20)
Total Basic Earnings per Share Attributable to AEP Common Shareholders $ 4.02 $ 2.53 $ 2.96 $ 3.43 $ 2.73
Weighted Average Number of Basic Shares Outstanding (in millions) 482 479 459 402 399 Market Price Range:
High $ 41.71 $ 37.94 $ 36.51 $ 49.11 $ 51.24
Low $ 33.09 $ 28.17 $ 24.00 $ 25.54 $ 41.67 Year-end Market Price $ 41.31 $ 35.98 $ 34.79 $ 33.28 $ 46.56 Cash Dividends Declared per AEP Common Share $ 1.85 $ 1.71 $ 1.64 $ 1.64 $ 1.58 Dividend Payout Ratio 46.02% 67.59% 55.41% 47.8% 57.9% Book Value per AEP Common Share $ 30.36 $ 28.32 $ 27.49 $ 26.35 $ 25.17
(a) Includes portion due within one year.
(b) Obligations Under Capital Leases increased primarily due to capital leases under new master lease agreements for property that was previously leased
under operating leases.

2
AMERICAN ELECTRIC POWER COMPANY, INC. AND SUBSIDIARY COMPANIES MANAGEMENT’S FINANCIAL DISCUSSION AND ANALYSIS
EXECUTIVE OVERVIEW
Company Overview
American Electric Power Company, Inc. (AEP) is one of the largest investor-owned electric public utility holding companies in the United States. Our electric utility operating companies provide generation, transmission and distribution services to more than five million retail customers in Arkansas, Indiana, Kentucky, Louisiana, Michigan, Ohio, Oklahoma, Tennessee, Texas, Virginia and West Virginia.
Our subsidiaries operate an extensive portfolio of assets including:
• Almost 36,500 megawatts of generating capacity, one of the largest complements of generation in the U.S.
• Approximately 39,000 miles of transmission lines, including 2,116 miles of 765kV lines, the backbone of the electric interconnection grid in the Eastern U.S.
• Approximately 223,000 miles of distribution lines that deliver electricity to 5.3 million customers.
• Substantial commodity transportation assets (more than 7,600 railcars, approximately 3,300 barges, 61 towboats, 29 harbor boats and a coal handling terminal with 18 million tons of annual capacity). Our commercial barging operations annually transport approximately 44 million tons of coal and dry bulk commodities. Approximately 37% of the barging is for transportation of agricultural products, 31% for coal, 16% for steel and 16% for other commodities.
CSPCo-OPCo Merger
On December 31, 2011, CSPCo merged into OPCo with OPCo being the surviving entity. All prior disclosed amounts have been recast as if the merger occurred on the first day of the earliest reporting period. All contracts and operations of CSPCo and its subsidiary are now part of OPCo. The merger had no impact on our prior reported net income, cash flow or financial condition.
January 2012 – May 2016 Ohio ESP
In December 2011, the PUCO approved a modified stipulation for a new ESP for the period January 2012 through May 2016 that includes a standard service offer (SSO) pricing for generation. Various parties, including OPCo, filed requests for rehearing with the PUCO. In February 2012, the PUCO issued an entry on rehearing which rejected the modified stipulation and ordered a return to the 2011 ESP rates until a new rate plan is approved. Under the February 2012 rehearing order, OPCo has 30 days to notify the PUCO whether it plans to modify or withdraw its original application as filed in January 2011. Management is currently evaluating its options and the potential financial and operational impacts on OPCo. See “Ohio Electric Security Plan Filing” section of Note 3.
Ohio Customer Choice
In our Ohio service territory, various competitive retail electric service (CRES) providers are targeting retail customers by offering alternative generation service. As a result, in comparison to 2010, we lost approximately $132 million of generation and transmission related gross margin. We are recovering a portion of lost margins through collection of capacity and transmission revenues from competitive CRES providers, off-system sales and new revenues from our CRES provider. AEP Retail Energy Partners LLC, our CRES provider and member of our Generating and Marketing segment, targets retail customers in Ohio, both within and outside of our retail service territory. As a result of the February 2012 order on rehearing, OPCo is subject to significant risk of revenue loss associated with customer switching, which could materially reduce future net income and cash flows and materially impact financial condition. Currently, there are no limitations on the obligation of OPCo to provide below cost capacity rate pricing to alternative suppliers to support customers switching in Ohio. As a result of customer switching, for every 10% decline in the number of retail customers, management estimates OPCo could lose approximately $75 million of generation gross margin, net of estimated off-system sales. On February 27, 2012, OPCo filed a Motion for Relief and Request for Expedited Ruling with the PUCO related to the review of capacity charges. The filing seeks a decision within 90 days and the avoidance of an immediate change to pricing for capacity at the Reliability Pricing Model auction price, which is substantially below OPCo’s cost. We are evaluating our options to challenge this capacity pricing issue.

3
In January 2012, we entered into an agreement to acquire BlueStar Energy Holdings, Inc. (BlueStar) and its independent retail electric supplier BlueStar Energy Solutions. BlueStar provides electric supply for retail customers in Ohio, Illinois and other deregulated electricity markets and also provides energy solutions, including demand response and energy efficiency services, nationwide. BlueStar has approximately 21,000 customer accounts. Consummation of the transaction is subject to regulatory and other approvals. The transaction is expected to close in the first quarter of 2012. Corporate Separation In January 2012, the PUCO approved a corporate separation plan of OPCo’s generation assets to complete the transition to a fully competitive generation market by June 2015, which includes the transfer of generation assets to a nonregulated AEP subsidiary at net book value. In February 2012, as part of the PUCO’s entry on rehearing which rejected the ESP modified stipulation, the PUCO revoked its approval of OPCo’s corporate separation plan. Any proposed corporate separation plan will require approval by the PUCO and the FERC. Management intends to pursue Ohio corporate separation in future regulatory proceedings. In February 2012, prior to the PUCO revoking OPCo’s corporate separation plan, applications were filed with the FERC proposing to establish a new power cost sharing agreement between APCo, I&M and KPCo and transfer OPCo’s generation assets to APCo, KPCo and a nonregulated AEP subsidiary. In conjunction with these filings, APCo and KPCo, which are generation capacity deficit utilities, filed an application with the FERC to acquire approximately 2,400 MWs of OPCo’s 12,000 MW generation capacity at net book value. This acquisition would allow APCo and KPCo to satisfy their capacity reserve requirements in PJM and provide baseload generation to meet their customers’ energy requirements. As a result of the February 2012 ESP rehearing order, we are reviewing the recoverability of all OPCo generation assets and are in the process of withdrawing the PUCO and the FERC applications. We intend to file new FERC and PUCO applications related to corporate separation. To the extent existing generation assets and the cost of new equipment and converted facilities are not recoverable, it could materially reduce future net income and cash flows. Upon receipt of all regulatory approvals, the remaining generation assets of OPCo will be owned by a nonregulated AEP subsidiary.
If we receive all regulatory approvals, our results of operations related to generation currently owned by OPCo will be determined by our ability to sell power and capacity at a profit at rates determined by the prevailing market. Customer Demand In comparison to 2010, cooling degree days in 2011 were up 20% in our western region and down 7% in our eastern region. While cooling degree days in our eastern region were down in comparison to 2010, they were significantly higher than normal. Our weather-normalized residential and commercial sales remained relatively flat in comparison to 2010. Industrial sales increased 4% in 2011, primarily due to a significant increase in production from Ormet, a large aluminum company, and lesser increases from other industrial customers, reflecting an increase in production by several of our metals and refinery customers. Commercial margins decreased 6% during 2011 primarily due to the loss of retail customers in Ohio. See “Ohio Customer Choice” section below.
Texas Restructuring In July 2011, the Supreme Court of Texas overturned a 2006 PUCT order that denied recovery of capacity auction true-up amounts related to TCC securitized net recoverable stranded generation cost and remanded for reconsideration the treatment of certain tax balances under normalization rules. Based upon the Supreme Court of Texas’ reversal of the PUCT’s capacity auction true-up disallowance, TCC recorded $421 million of pretax income ($273 million, net of tax) in Extraordinary Items, Net of Tax on the statement of income in the third quarter of 2011. Also in 2011, TCC recorded $271 million in pretax Carrying Costs Income on the statement of income related to the debt component of carrying costs for the period from January 2002 through December 2011. This carrying costs income represents previously unrecorded earnings associated with restructuring in Texas since 2002. The total regulatory asset related to the capacity auction true-up as of December 31, 2011 was $692 million, excluding unrecognized equity carrying costs. TCC plans to continue to recognize debt carrying costs income until securitization occurs and plans to recognize equity carrying costs income as collected from customers over the life of the securitization. Securitization is expected to be completed in March 2012.

4
In December 2011, the PUCT approved an unopposed stipulation allowing TCC to recover $800 million, including carrying charges, and retain contested tax balances in full satisfaction of its true-up proceeding. TCC recorded the reversal of regulatory credits of $65 million ($42 million, net of tax) and the reversal of $89 million of accumulated deferred investment tax credits ($58 million, net of tax) in Extraordinary Items, Net of Tax on the statement of income in the fourth quarter of 2011. Also, in the fourth quarter of 2011, TCC recorded $52 million in pretax Carrying Costs Income on the statement of income. See the “Texas Restructuring Appeals” and “TCC Deferred Investment Tax Credits and Excess Deferred Federal Income Taxes” sections of Note 3.
Regulatory Activity The table below summarizes our significant 2011 regulatory activities: Requested Approved
Annual Requested Annual Approved Requested Return on Approved Return on Approved
Base Rate Common Base Rate Common Effective
Jurisdiction Change Equity Change Equity Date
(in millions) (in millions)
Indiana $ 149 11.15% $ (a) (a) (a)
Michigan 25 11.15% 15 10.2% April 2012
Ohio 94 11.15% - (b) 10.2% January 2012
Virginia 126 11.65% 55 10.9% February 2012
West Virginia 156 11.75% 51 10.0% April 2011
(a) The Indiana base rate case is presently under review at the IURC.
(b) Although the distribution base rate did not change, approximately $47 million was being recovered through the Distribution Investment Rider (DIR). Due to the February 2012 PUCO ESP entry on rehearing, which rejected the modified stipulation for a new ESP, collection of the DIR terminated. OPCo has the right to withdraw from the stipulation in its distribution base rate case. Management is currently evaluating all of its options.
2009 – 2011 Ohio ESP In 2011, the PUCO issued an order in the 2009 – 2011 ESP remand proceeding requiring OPCo to cease POLR billings and apply POLR collections since June 2011 first to the FAC deferral with any remaining balance to be credited to OPCo’s customers in November and December 2011. As a result, in comparison to 2010, we lost approximately $71 million of pretax income related to POLR. In February 2012, the Ohio Consumers’ Counsel (OCC) and the Industrial Energy Users-Ohio filed appeals with the Supreme Court of Ohio challenging various issues, including the PUCO’s refusal to order retrospective relief concerning the POLR charges collected during 2009 – 2011 and various aspects of the approved environmental carrying charge, which if ordered could total up to $698 million, excluding carrying costs. OPCo filed its 2010 Significantly Excessive Earnings Test (SEET) with the PUCO based upon the approach in the PUCO’s 2009 order. Subsequent testimony and legal briefs from intervenors recommended a refund of up to $62 million of 2010 earnings, which included off-system sales in the SEET calculation. In December 2011, the PUCO staff filed testimony that recommended a $23 million refund of 2010 earnings. In the fourth quarter of 2011, OPCo provided a reserve based upon management’s estimate of the probable amount for a PUCO ordered SEET refund. OPCo is required to file its 2011 SEET filing with the PUCO in 2012. Management does not currently believe that there are significantly excessive earnings in 2011. See “Ohio Electric Security Plan Filing” section of Note 3.

5
Virginia Rate Adjustment Clause In January 2012, the Virginia SCC issued an order related to a generation rate adjustment clause which requested recovery of the Dresden Plant costs. The order allows APCo to recover $26 million annually, effective March 2012. See “Rate Adjustment Clauses” section of Note 3. Turk Plant
SWEPCo is currently constructing the Turk Plant, a new base load 600 MW coal generating unit in Arkansas, which is expected to be in service in the fourth quarter of 2012. SWEPCo owns 73% (440 MW) of the Turk Plant and will operate the completed facility. SWEPCo’s share of construction costs is currently estimated to be $1.3 billion, excluding AFUDC, plus an additional $122 million for transmission, excluding AFUDC. SWEPCo submitted applications with the APSC, the LPSC and the PUCT for approval to build the Turk Plant. The APSC and the LPSC approved SWEPCo’s applications. However, in June 2010, the APSC issued an order which reversed and set aside the previously granted Certificate of Environmental Compatibility and Public Need (CECPN). The PUCT approved SWEPCo’s application with several conditions, including a Texas jurisdictional capital costs cap. In November 2011, the Texas Court of Appeals affirmed the PUCT’s order in all respects. As a result, in the fourth quarter of 2011, SWEPCo recorded a pretax write-off of $49 million in Asset Impairments and Other Related Charges on the statement of income related to the estimated excess of the Texas jurisdictional portion of the Turk Plant above the Texas jurisdictional capital costs cap. In December 2011, SWEPCo and the Texas Industrial Energy Consumers filed motions for rehearing at the Texas Court of Appeals which were denied in January 2012. SWEPCo intends to seek review of the Texas Court of Appeals decision at the Supreme Court of Texas. Several parties, including the Hempstead County Hunting Club, the Sierra Club and the National Audubon Society had challenged the air permit, the wastewater discharge permit and the wetlands permit that were issued for the Turk Plant. In 2011, SWEPCo entered into settlement agreements with these parties which resolved all outstanding issues related to the permits and the APSC’s grant of a CECPN. The parties dismissed all pending permit and CECPN challenges at the APSC, other administrative agencies and the courts. See “Turk Plant” section of Note 3. Cook Plant
In September 2008, I&M shut down Cook Plant Unit 1 (Unit 1) due to turbine vibrations, caused by blade failure, which resulted in a fire on the electric generator. Repair of the property damage and replacement of the turbine rotors and other equipment cost approximately $400 million. Management believes that I&M should recover a significant portion of repair and replacement costs through the turbine vendor’s warranty, insurance and the regulatory process. Due to the extensive lead time required to manufacture and install new turbine rotors, I&M repaired Unit 1 and it resumed operations in December 2009. The installation of the new turbine rotors and other equipment occurred during the refueling outage of Unit 1 in the fall of 2011. If the ultimate costs of the incident are not covered by warranty, insurance or through the related regulatory process or if any future regulatory proceedings are adverse, it could have an adverse impact on net income, cash flows and financial condition. See “Cook Plant Unit 1 Fire and Shutdown” section of Note 5. As a result of the nuclear plant situation in Japan following a March 2011 earthquake, the Nuclear Regulatory Commission (NRC) initiated a review of safety procedures and requirements for nuclear generating facilities. This review could increase procedures and testing requirements, require physical modifications to the plant and increase future operating costs at the Cook Plant. The NRC is also looking into the fuel used at eleven reactors, including the units at the Cook Plant. Their concern relates to fuel temperatures if abnormal conditions are experienced. We have been monitoring this issue and will respond to the NRC’s inquiry. In addition to the review by the NRC, Congress could consider legislation tightening oversight of nuclear generating facilities. We are unable to predict the impact of potential future regulation of nuclear facilities.

6
LITIGATION
In the ordinary course of business, we are involved in employment, commercial, environmental and regulatory litigation. Since it is difficult to predict the outcome of these proceedings, we cannot predict the eventual resolution, timing or amount of any loss, fine or penalty. We assess the probability of loss for each contingency and accrue a liability for cases that have a probable likelihood of loss if the loss can be estimated. For details on our regulatory proceedings and pending litigation see Note 3 – Rate Matters and Note 5 – Commitments, Guarantees and Contingencies. Adverse results in these proceedings have the potential to materially affect our net income, financial condition and cash flows. ENVIRONMENTAL ISSUES We are implementing a substantial capital investment program and incurring additional operational costs to comply with new environmental control requirements. We will need to make additional investments and operational changes in response to existing and anticipated requirements such as CAA requirements to reduce emissions of SO2, NOx, PM and hazardous air pollutants (HAPs) from fossil fuel-fired power plants, new proposals governing the beneficial use and disposal of coal combustion products and proposed clean water rules. We are engaged in litigation about environmental issues, have been notified of potential responsibility for the clean-up of contaminated sites and incur costs for disposal of SNF and future decommissioning of our nuclear units. We are also engaged in the development of possible future requirements including the items discussed below and reductions of CO2 emissions to address concerns about global climate change. We, along with various industry groups, affected states and other parties have challenged some of the Federal EPA requirements in court. The U.S. House of Representatives passed legislation called the Transparency in Regulatory Analysis of Impacts on the Nation (the TRAIN Act) that would delay implementation of certain Federal EPA rules and facilitate a comprehensive analysis of their impacts. The Senate is considering similar legislation. We believe that further analysis and better coordination of these environmental requirements would facilitate planning and lower overall compliance costs while achieving the same environmental goals. We will seek recovery of expenditures for pollution control technologies and associated costs from customers through rates in regulated jurisdictions. We should be able to recover certain of these expenditures through market prices in deregulated jurisdictions. If not, the costs of environmental compliance could materially affect future net income, cash flows and possibly financial condition. Environmental Controls Impact on the Generating Fleet
The rules and proposed environmental controls discussed in the next several sections will have a material impact on the generating units in the AEP System. We continue to evaluate the impact of these rules, project scope and technology available to achieve compliance. As of December 31, 2011, the AEP System had a total generating capacity of nearly 36,500 MWs, of which 23,900 MWs are coal-fired. We continue to refine the cost estimates of complying with these rules and other impacts of the environmental proposals on our coal-fired generating facilities. Based upon our estimates, investment to meet these proposed requirements ranges from approximately $6 billion to $7 billion between 2012 and 2020. These amounts include investments to convert 1,055 MWs of coal generation to natural gas capacity and the completion of 580 MWs of natural gas-fired generation in January 2012. The cost estimates will change depending on the timing of implementation and whether the Federal EPA provides flexibility in the final rules. The cost estimates will also change based on: (a) the states’ implementation of these regulatory programs, including the potential for state implementation plans or federal implementation plans that impose more stringent standards, (b) additional rulemaking activities in response to court decisions, (c) the actual performance of the pollution control technologies installed on our units, (d) changes in costs for new pollution controls, (e) new generating technology developments, (f) total MWs of capacity retired and replaced, including the type and amount of such replacement capacity and (g) other factors.

7
Subject to the factors listed above and based upon our continuing evaluation, we may retire the following plants or units of plants before or during 2015: Generating Company Plant Name and Unit Capacity
(in MWs) APCo Clinch River Plant, Unit 3 235 APCo Glen Lyn Plant 335 APCo Kanawha River Plant 400 APCo/OPCo Philip Sporn Plant, Units 1-4 600 I&M Tanners Creek Plant, Units 1-3 495 KPCo Big Sandy Plant, Unit 1 278 OPCo Conesville Plant, Unit 3 165 OPCo Kammer Plant 630 OPCo Muskingum River Plant, Units 1-4 840 OPCo Picway Plant 100 SWEPCo Welsh Plant, Unit 2 528
Total 4,606
Duke Energy Corporation, the operator of W. C. Beckjord Generating Station, has announced its intent to close the facility in 2015. OPCo owns 12.5% (54 MWs) of one unit at that station. Effective December 1, 2011, we revised book depreciation rates for certain OPCo generating units consistent with shortened depreciable lives for the generating units. This change in depreciable lives is expected to result in a $54 million increase in depreciation expense in 2012. However, as a result of the January and February 2012 PUCO orders and the expected corporate separation of OPCo’s generation assets and the termination of the AEP Power Pool, we are reviewing the recoverability of all OPCo generation assets. Plans for and the timing of conversion of some of our coal units to natural gas, installing emission control equipment on other units and closure of existing units will be impacted by changes in emission requirements and demand for power. As part of environmental compliance, we are evaluating options related to maturity of the lease for Rockport Plant Unit 2 in 2022. To the extent existing generation assets and the cost of new equipment and converted facilities are not recoverable, it could materially reduce future net income and cash flows. Clean Air Act Requirements The CAA establishes a comprehensive program to protect and improve the nation’s air quality and control sources of air emissions. The states implement and administer many of these programs and could impose additional or more stringent requirements. The Federal EPA issued the Clean Air Interstate Rule (CAIR) in 2005 requiring specific reductions in SO2 and NOx emissions from power plants. In 2008, the D.C. Circuit Court of Appeals issued a decision remanding CAIR to the Federal EPA. The Federal EPA issued the Cross-State Air Pollution Rule (CSAPR) (discussed in detail below) in August 2011 to replace CAIR. The CSAPR has been challenged in the courts, and the United States Court of Appeals for the D.C. Circuit issued an order in December 2011 staying the effective date of the rule pending judicial review. CAIR remains in effect while the litigation continues. Nearly all of the states in which our power plants are located are covered by CAIR. The Federal EPA issued the final maximum achievable control technology (MACT) standards for coal and oil-fired power plants (discussed in detail below) in February 2012. The Federal EPA issued a Clean Air Visibility Rule (CAVR), detailing how the CAA’s requirement that certain facilities install best available retrofit technology (BART) to address regional haze in federal parks and other protected areas. BART requirements apply to facilities built between 1962 and 1977 that emit more than 250 tons per year of certain pollutants in specific industrial categories, including power plants. CAVR will be implemented

8
through individual state implementation plans (SIPs) or, if SIPs are not adequate or are not developed on schedule, through federal implementation plans (FIPs). The Federal EPA proposed disapproval of SIPs in a few states, including Arkansas and Oklahoma. The Federal EPA finalized a FIP for Oklahoma that contains more stringent control requirements for SO2 emissions from affected units in that state and we have challenged the FIP in the Tenth Circuit Court of Appeals. No action has been finalized in Arkansas. If the Federal EPA is upheld and similar action is taken in Arkansas, it could increase the costs of compliance, accelerate the installation of required controls and/or force the premature retirement of existing units. In 2009, the Federal EPA issued a final mandatory reporting rule for CO2 and other greenhouse gases covering a broad range of facilities emitting in excess of 25,000 tons of CO2 emissions per year. The Federal EPA issued a final endangerment finding for greenhouse gas emissions from new motor vehicles in 2009. The Federal EPA determined that greenhouse gas emissions from stationary sources will be subject to regulation under the CAA beginning January 2011 and finalized its proposed scheme to streamline and phase-in regulation of stationary source CO2 emissions through the NSR prevention of significant deterioration and Title V operating permit programs through the issuance of final federal rules, SIP calls and FIPs. The Federal EPA is reconsidering whether to include CO2 emissions in a number of stationary source standards, including standards that apply to new and modified electric utility units and announced a settlement agreement to issue proposed new source performance standards for utility boilers. The Federal EPA has also issued new, more stringent national ambient air quality standards (NAAQS) for SO2, NOx and lead, and is currently reviewing the NAAQS for ozone and PM. States are in the process of evaluating the attainment status and need for additional control measures in order to attain and maintain the new NAAQS and may develop additional requirements for our facilities as a result of those evaluations. We cannot currently predict the nature, stringency or timing of those requirements. Notable developments in significant CAA regulatory requirements affecting our operations are discussed in the following sections. Cross-State Air Pollution Rule (formerly the Clean Air Act Transport Rule)
In July 2010, the Federal EPA issued a proposed rule to replace CAIR that would impose new and more stringent requirements to control SO2 and NOx emissions from fossil fuel-fired electric generating units in 31 states and the District of Columbia. In August 2011, the Federal EPA issued the final rule, CSAPR. The CSAPR relies on newly-created SO2 and NOx
allowances and individual state budgets to compel further emission reductions from electric utility generating units in 28 states. Interstate trading of allowances is allowed on a restricted sub-regional basis beginning in 2012. Arkansas and Louisiana are subject only to the seasonal NOx program in the final rule. Texas is subject to the annual programs for SO2 and NOx in addition to the seasonal NOx program. The annual SO2 allowance budgets in Indiana, Ohio and West Virginia have been reduced significantly in the final rule. A supplemental rule includes Oklahoma in the seasonal NOx program. The supplemental rule was finalized in December 2011, with an increased NOx emission budget for the 2012 compliance year. In October 2011, the Federal EPA released a proposed rule revising portions of the final CSAPR. The proposed rule would correct errors in unit-specific assumptions and make available additional allowances in 10 states, including Louisiana and Texas, and provide additional allowances for the new unit set aside in Arkansas. In addition, the proposed rule would make the allowance trading assurance provisions which restrict interstate trading of allowances effective January 1, 2014 instead of January 1, 2012. Numerous affected entities, states and other parties filed petitions to review the CSAPR in the United States Court of Appeals for the District of Columbia Circuit. Several of the petitioners filed motions to stay the implementation of the rule pending judicial review. In December 2011, the court granted the motions for stay and ordered the parties to submit schedules for expedited briefing in order to allow the case to be heard in April 2012. A final supplemental rule addressing seasonal NOx emissions in five states was finalized in December 2011 and has been the subject of separate appeals by certain Oklahoma entities, including PSO. The Federal EPA has announced that the provisions of the supplemental rule will not be enforced while the stay of the final CSAPR remains in effect.

9
The time frames and stringency of the required emission reductions, coupled with the lack of robust interstate trading and the elimination of historic allowance banks, pose significant concerns for the AEP System and our electric utility customers. Mercury and Other Hazardous Air Pollutants Regulation
In February 2012, the Federal EPA issued a rule addressing a broad range of HAPs from coal and oil-fired power plants. The rule establishes unit-specific emission rates for mercury, PM (as a surrogate for particles of nonmercury metal) and hydrogen chloride (as a surrogate for acid gases) for units burning coal on a site-wide 30-day rolling average basis. In addition, the rule proposes work practice standards, such as boiler tune-ups, for controlling emissions of organic HAPs and dioxin/furans. The effective date of the final rule is April 16, 2012 and compliance is required within three years. The final rule contains a slightly less stringent PM limit than the original proposal and allows operators to exclude periods of startup and shutdown from the emissions averaging periods. The compliance time frame remains a serious concern. A one-year administrative extension may be available if the extension is necessary for the installation of controls or to avoid a serious reliability problem. In addition, the Federal EPA issued an enforcement policy describing the circumstances under which an administrative consent order might be issued to provide a fifth year for the installation of controls or completion of reliability upgrades. We are concerned about the availability of compliance extensions and the inability to foreclose citizen suits being filed under the CAA for failure to achieve compliance by the required deadlines. Regional Haze
In March 2011, the Federal EPA proposed to approve in part and disapprove in part the regional haze SIP submitted by the State of Oklahoma through the Department of Environmental Quality. The Federal EPA is proposing to approve all of the NOx control measures in the SIP and disapprove the SO2 control measures for six electric generating units, including two units owned by PSO. The Federal EPA is proposing a FIP that would require these units to install technology capable of reducing SO2 emissions to 0.06 pounds per million British thermal units within three years of the effective date of the FIP. PSO submitted comments on the proposed action demonstrating that the cost-effectiveness calculations performed by the Federal EPA were unsound, challenging the period for compliance with the final rule and showing that the visibility improvements secured by the proposed SIP were significant and cost-effective. The Federal EPA finalized the FIP in December 2011. PSO will appeal the FIP and pursue its claims in the Tenth Circuit Court of Appeals. Coal Combustion Residual Rule
In June 2010, the Federal EPA published a proposed rule to regulate the disposal and beneficial re-use of coal combustion residuals, including fly ash and bottom ash generated at coal-fired electric generating units. The rule contains two alternative proposals. One proposal would impose federal hazardous waste disposal and management standards on these materials and another would allow states to retain primary authority to regulate the beneficial re-use and disposal of these materials under state solid waste management standards, including minimum federal standards for disposal and management. Both proposals would impose stringent requirements for the construction of new coal ash landfills and would require existing unlined surface impoundments to upgrade to the new standards or stop receiving coal ash and initiate closure within five years of the issuance of a final rule. In October 2011, the Federal EPA issued a notice of data availability requesting comments on a number of technical reports and other data received during the comment period for the original proposal and requesting comments on potential modeling analyses to update its risk assessment.

10
Currently, approximately 40% of the coal ash and other residual products from our generating facilities are re-used in the production of cement and wallboard, as structural fill or soil amendments, as abrasives or road treatment materials and for other beneficial uses. Certain of these uses would no longer be available and others are likely to significantly decline if coal ash and related materials are classified as hazardous wastes. In addition, we currently use surface impoundments and landfills to manage these materials at our generating facilities and will incur significant costs to upgrade or close and replace these existing facilities under the proposed solid waste management alternative. Regulation of these materials as hazardous wastes would significantly increase these costs. As the rule is not final, we are unable to determine a range of potential costs that are reasonably possible of occurring but expect the costs to be significant. Clean Water Act Regulations In April 2011, the Federal EPA issued a proposed rule setting forth standards for existing power plants that will reduce mortality of aquatic organisms pinned against a plant’s cooling water intake screen (impingement) or entrained in the cooling water. Entrainment is when small fish, eggs or larvae are drawn into the cooling water system and affected by heat, chemicals or physical stress. The proposed standards affect all plants withdrawing more than two million gallons of cooling water per day and establish specific intake design and intake velocity standards meant to allow fish to avoid or escape impingement. Compliance with this standard is required within eight years of the effective date of the final rule. The proposed standard for entrainment for existing facilities requires a site-specific evaluation of the available measures for reducing entrainment. The proposed entrainment standard for new units at existing facilities requires either intake flows commensurate with closed cycle cooling or achieving entrainment reductions equivalent to 90% or greater of the reductions that could be achieved with closed cycle cooling. Plants withdrawing more than 125 million gallons of cooling water per day must submit a detailed technology study to be reviewed by the state permitting authority. We are evaluating the proposal and engaged in the collection of additional information regarding the feasibility of implementing this proposal at our facilities. We submitted comments on the proposal in July and August 2011. Global Warming National public policy makers and regulators in the 11 states we serve have conflicting views on global warming. We are focused on taking, in the short term, actions that we see as prudent, such as improving energy efficiency, investing in developing cost-effective and less carbon-intensive technologies and evaluating our assets across a range of plausible scenarios and outcomes. We are also active participants in a variety of public policy discussions at state and federal levels to assure that proposed new requirements are feasible and the economies of the states we serve are not placed at a competitive disadvantage. While comprehensive economy-wide regulation of CO2 emissions might be achieved through future legislation, Congress has yet to enact such legislation. The Federal EPA continues to take action to regulate CO2 emissions under the existing CAA, permitting programs for new sources, and is expected to propose new source emissions standards for fossil fuel-fired plants in 2012. Several states have adopted programs that directly regulate CO2 emissions from power plants, but none of these programs are currently in effect in states where we have generating facilities. Certain of our states have passed legislation establishing renewable energy, alternative energy and/or energy efficiency requirements (including Michigan, Ohio, Texas and Virginia). We are taking steps to comply with these requirements. In order to meet these requirements and as a key part of our corporate sustainability effort, we pledged to increase our wind power from 2007 levels. By the end of 2011, we secured, through power purchase agreements, 1,893 MW of wind and solar power. We have taken measurable, voluntary actions to reduce and offset our CO2 emissions. We participated in a number of voluntary programs to monitor, mitigate and reduce CO2 emissions, but many of these programs have been discontinued due to anticipated legislative or regulatory actions. Through the end of 2010, we reduced our emissions by a cumulative 96 million metric tons from adjusted baseline levels in 1998 through 2001 under Chicago Climate Exchange (CCX) rules. Our total CO2 emissions in 2010, as reported to CCX, were 138 million metric tons. We estimate that our 2011 emissions were approximately 139 million metric tons.

11
Certain groups have filed lawsuits alleging that emissions of CO2 are a “public nuisance” and seeking injunctive relief and/or damages from small groups of coal-fired electricity generators, petroleum refiners and marketers, coal companies and others. We have been named in pending lawsuits, which we are defending. It is not possible to predict the outcome of these lawsuits or their impact on our operations or financial condition. See “Carbon Dioxide Public Nuisance Claims” and “Alaskan Villages’ Claims” sections of Note 5. Future federal and state legislation or regulations that mandate limits on the emission of CO2 would result in significant increases in capital expenditures and operating costs, which, in turn, could lead to increased liquidity needs and higher financing costs. Excessive costs to comply with future legislation or regulations might force our utility subsidiaries to close some coal-fired facilities and could lead to possible impairment of assets. As a result, mandatory limits could have a material adverse impact on our net income, cash flows and financial condition. Global warming creates the potential for physical and financial risk. The materiality of the risks depends on whether any physical changes occur quickly or over many decades and the extent and nature of those changes. The main physical risk from climate change that could affect AEP is changes in weather conditions. Our customers’ energy needs currently vary with weather conditions, primarily temperature and humidity. For residential customers, heating and cooling today represent their largest energy use. To the extent weather patterns change significantly, customers’ energy use could increase or decrease depending on the duration and magnitude of any changes. Increased energy use due to weather changes could require us to invest in more generating assets, transmission and other infrastructure in the long term to serve increased load, driving the overall cost of electricity higher. Decreased energy use due to weather changes (i.e. milder winters) could affect our financial condition through lower sales and decreased revenues. Extreme weather conditions in general require more system backup, adding to costs, and can contribute to increased system stresses, including service interruptions and increased storm restoration costs. We may not recover all costs related to mitigating these physical and financial risks. Weather conditions outside of our service territory could also have an impact on our revenues, either directly through changes in the patterns of our off-system power purchases and sales or indirectly through demographic changes as people adapt to changing weather. We buy and sell electricity depending upon system needs and market opportunities. Extreme weather conditions that create high energy demand could raise electricity prices, which could increase the cost of energy we provide to our customers and could provide opportunity for increased wholesale sales and higher margins. To the extent climate change affects a region’s economic health, it could also affect our revenues. Our financial performance is tied to the health of the regional economies we serve. The price of energy, as a factor in a region's cost of living as well as an important input into the cost of goods, has an impact on the economic health of our communities. The cost of additional regulatory requirements would normally be borne by consumers through higher prices for energy and purchased goods. For additional information on global warming, see Part I of the Annual Report under the headings entitled “Business – General – Environmental and Other Matters – Global Warming.”

12
RESULTS OF OPERATIONS SEGMENTS Our primary business is the generation, transmission and distribution of electricity. Within our Utility Operations segment, we centrally dispatch generation assets and manage our overall utility operations on an integrated basis because of the substantial impact of cost-based rates and regulatory oversight. Intersegment sales and transfers are generally based on underlying contractual arrangements and agreements. While our Utility Operations segment remains our primary business segment, the advancement of an area of our business prompted us to identify a new reportable segment. Starting in the fourth quarter of 2011, we established our new Transmission Operations segment as described below: Utility Operations
• Generation of electricity for sale to U.S. retail and wholesale customers.
• Transmission and distribution of electricity through assets owned and operated by our ten utility operating companies.
Transmission Operations
• Development, construction and operation of transmission facilities through investments in our wholly-owned transmission subsidiaries that were established in 2009 and our transmission joint ventures. These investments have FERC-approved returns on equity.
AEP River Operations
• Commercial barging operations that transport coal and dry bulk commodities primarily on the Ohio, Illinois and lower Mississippi Rivers.
Generation and Marketing
• Nonregulated generation in ERCOT.
• Marketing and risk management activities primarily in ERCOT and, to a lesser extent, Ohio in PJM and MISO.
The table below presents our consolidated Income Before Extraordinary Items by segment for the years ended December 31, 2011, 2010 and 2009. We reclassified prior year amounts to conform to the current year’s presentation. Years Ended December 31, 2011 2010 2009
(in millions) Utility Operations $ 1,549 $ 1,192 $ 1,325 Transmission Operations 30 9 4 AEP River Operations 45 37 47 Generation and Marketing 14 25 41 All Other (a) (62) (45) (47)
Income Before Extraordinary Items $ 1,576 $ 1,218 $ 1,370
(a) While not considered a reportable segment, All Other includes: • Parent’s guarantee revenue received from affiliates, investment income, interest income and interest expense and
other nonallocated costs. • Tax and interest expense adjustments related to our UK operations which were sold in 2004 and 2002.
• Forward natural gas contracts that were not sold with our natural gas pipeline and storage operations in 2004 and 2005. These contracts were financial derivatives which settled and expired in the fourth quarter of 2011.
• Revenue sharing related to the Plaquemine Cogeneration Facility which ended in the fourth quarter of 2011.

13
AEP CONSOLIDATED
2011 Compared to 2010
Income Before Extraordinary Items in 2011 increased $358 million compared to 2010 primarily due to:
• An increase in carrying costs income due to the third quarter 2011 recognition of a regulatory asset related to TCC capacity auction true-up amounts that were originally written off in 2005 and a related favorable fourth quarter 2011 resolution of contested tax items related to the TCC stranded cost settlement.
• A decrease in expenses as a result of the 2010 cost reduction initiatives.
• Successful rate proceedings in our various jurisdictions.
These increases were partially offset by:
• The loss of retail customers in Ohio to competitive retail electric service providers.
• Various Ohio adjustments in 2011, including:
• The impairments of Sporn Unit 5 and the FGD project at Muskingum River Unit 5.
• A net decrease due to unfavorable Ohio regulatory orders in 2011.
• The recording of an obligation to contribute to Partnership with Ohio and Ohio Growth Fund.
• The elimination of POLR charges, effective June 2011, in Ohio due to an October 2011 PUCO remand order.
• A fourth quarter 2011 write-off related to SWEPCo’s Texas jurisdictional portion of the Turk Plant as a result of the November 2011 Texas Court of Appeals decision upholding the Texas capital cost cap.
Average basic shares outstanding increased to 482 million in 2011 from 479 million in 2010. Actual shares outstanding were 483 million as of December 31, 2011. 2010 Compared to 2009
Income Before Extraordinary Items in 2010 decreased $152 million compared to 2009 primarily due to charges incurred related to the 2010 cost reduction initiatives. Average basic shares outstanding increased to 479 million in 2010 from 459 million in 2009. Actual shares outstanding were 481 million as of December 31, 2010. Our results of operations are discussed below by operating segment.

14
UTILITY OPERATIONS We believe that a discussion of the results from our Utility Operations segment on a gross margin basis is most appropriate in order to further understand the key drivers of the segment. Gross margin represents total revenues less the related direct cost of fuel, including consumption of chemicals and emissions allowances and purchased power. Years Ended December 31, 2011 2010 2009
(in millions) Revenues $ 14,200 $ 13,792 $ 12,803 Fuel and Purchased Power 5,455 4,996 4,420
Gross Margin 8,745 8,796 8,383 Other Operation and Maintenance 3,539 3,760 3,410 Asset Impairments and Other Related Charges 139 - - Depreciation and Amortization 1,613 1,598 1,561 Taxes Other Than Income Taxes 812 811 751
Operating Income 2,642 2,627 2,661 Interest and Investment Income 29 9 4 Carrying Costs Income 393 70 47 Allowance for Equity Funds Used During Construction 91 77 82 Interest Expense (886) (942) (916)
Income Before Income Tax Expense and Equity Earnings 2,269 1,841 1,878 Equity Earnings of Unconsolidated Subsidiaries 2 2 - Income Tax Expense 722 651 553
Income Before Extraordinary Items $ 1,549 $ 1,192 $ 1,325
Summary of KWH Energy Sales for Utility Operations
Years Ended December 31, 2011 2010 2009
(in millions of KWHs) Retail: Residential 61,655 61,944 58,232 Commercial 50,767 50,748 49,925 Industrial 59,667 57,333 54,428 Miscellaneous 3,100 3,083 3,048
Total Retail (a) 175,189 173,108 165,633 Wholesale 40,519 32,581 29,670
Total KWHs 215,708 205,689 195,303
(a) Includes energy delivered to customers served by AEP's Texas Wires Companies.
15
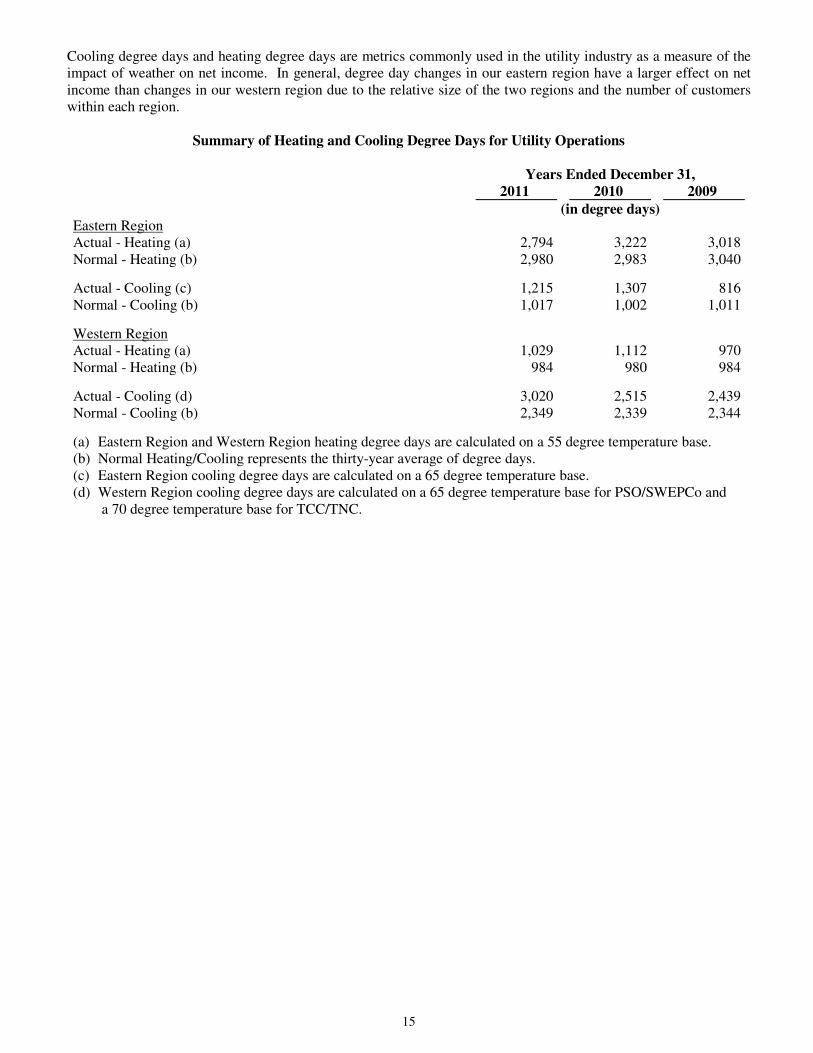
Cooling degree days and heating degree days are metrics commonly used in the utility industry as a measure of the impact of weather on net income. In general, degree day changes in our eastern region have a larger effect on net income than changes in our western region due to the relative size of the two regions and the number of customers within each region. Summary of Heating and Cooling Degree Days for Utility Operations Years Ended December 31, 2011 2010 2009
(in degree days) Eastern Region Actual - Heating (a) 2,794 3,222 3,018 Normal - Heating (b) 2,980 2,983 3,040 Actual - Cooling (c) 1,215 1,307 816 Normal - Cooling (b) 1,017 1,002 1,011 Western Region Actual - Heating (a) 1,029 1,112 970 Normal - Heating (b) 984 980 984 Actual - Cooling (d) 3,020 2,515 2,439 Normal - Cooling (b) 2,349 2,339 2,344 (a) Eastern Region and Western Region heating degree days are calculated on a 55 degree temperature base. (b) Normal Heating/Cooling represents the thirty-year average of degree days. (c) Eastern Region cooling degree days are calculated on a 65 degree temperature base. (d) Western Region cooling degree days are calculated on a 65 degree temperature base for PSO/SWEPCo and a 70 degree temperature base for TCC/TNC.

- THIS PAGE INTENTIONALLY LEFT BLANK -

16
2011 Compared to 2010 Reconciliation of Year Ended December 31, 2010 to Year Ended December 31, 2011 Income from Utility Operations Before Extraordinary Items (in millions) Year Ended December 31, 2010 $ 1,192 Changes in Gross Margin:
Retail Margins (139) Off-system Sales 44 Transmission Revenues 48 Other Revenues (4)
Total Change in Gross Margin (51)
Changes in Expenses and Other:
Other Operation and Maintenance 221 Asset Impairments and Other Related Charges (139) Depreciation and Amortization (15) Taxes Other Than Income Taxes (1) Interest and Investment Income 20 Carrying Costs Income 323 Allowance for Equity Funds Used During Construction 14 Interest Expense 56
Total Change in Expenses and Other 479
Income Tax Expense (71)
Year Ended December 31, 2011 $ 1,549
The major components of the decrease in Gross Margin, defined as revenues less the related direct cost of fuel, including consumption of chemicals and emissions allowances, and purchased power were as follows:
• Retail Margins decreased $139 million primarily due to the following:
• A $132 million decrease attributable to Ohio customers switching to alternative competitive retail electric service (CRES) providers.
• An $87 million decrease in weather-related usage in our eastern region primarily due to a 13% decrease in heating degree days and a 7% decrease in cooling degree days.
• An $84 million decrease in rate related margins for APCo due to the expiration of E&R cost recovery in Virginia.
• A $60 million decrease due to the elimination of POLR charges, effective June 2011, in Ohio as a result of the October 2011 PUCO remand order.
• A $51 million net decrease due to unfavorable Ohio and Virginia regulatory orders.
• A $30 million increase in other variable electric generation expenses.
These decreases were partially offset by:
• Successful rate proceedings in our service territories which include:
• A $120 million rate increase for OPCo.
• A $63 million rate increase for APCo.
• A $30 million rate increase for SWEPCo.
• A $27 million rate increase for KPCo.
• A $27 million rate increase for I&M.
• For the rate increases described above, $78 million of these increases relate to riders/trackers which have corresponding increases in other expense items below.
• A $38 million increase in weather-related usage in our western region primarily due to a 20% increase in cooling degree days, slightly offset by a 7% decrease in heating degree days.

17
• A $30 million increase due to increased SWEPCo gross margin from sales to customers previously served by Valley Electric Membership Corporation (VEMCO). SWEPCo acquired VEMCO assets and began serving VEMCO customers in October 2010.
• A $14 million increase related to TCC’s Transition Funding. This increase is offset by an increase in Depreciation and Amortization expenses.
• Margins from Off-system Sales increased $44 million primarily due to an increase in PJM capacity revenues and higher physical sales volumes, partially offset by lower trading and marketing margins.
• Transmission Revenues increased $48 million primarily due to net rate increases in PJM and increased transmission revenues for Ohio customers who have switched to alternative CRES providers. The increase in transmission revenues related to CRES providers partially offsets lost revenues included in Retail Margins above.
Expenses and Other and Income Tax Expense changed between years as follows:
• Other Operation and Maintenance expenses decreased $221 million primarily due to the following:
• A $280 million decrease due to expenses related to the cost reduction initiatives recorded in 2010.
• A $54 million decrease due to the second quarter 2010 write-off of APCo’s Virginia share of the Mountaineer Carbon Capture and Storage Product Validation Facility as denied for recovery by the Virginia SCC.
• A $42 million decrease in administrative and general expenses primarily due to a decrease in fringe benefit expenses.
• A $33 million decrease due to the first quarter 2011 deferral of 2010 costs related to storms and our cost reduction initiatives as allowed by the WVPSC.
• A $27 million decrease due to the favorable fourth quarter 2011 Asset Retirement Obligation adjustment for APCo related to the early closure and previous write-off of the Mountaineer Carbon Capture and Storage Product Validation Facility.
• An $11 million gain from the sale of land in January 2011.
These decreases were partially offset by: • A $54 million increase in demand side management, energy efficiency programs and other expenses
currently recovered dollar-for-dollar in rate recovery riders/trackers within Gross Margin. • A $41 million increase due to the first quarter 2011 write-off of a portion of the West Virginia share of
the Mountaineer Carbon Capture and Storage Product Validation Facility as denied for recovery by the WVPSC.
• A $35 million increase related to the fourth quarter 2011 recording of an obligation to contribute to Partnership with Ohio and Ohio Growth Fund as a result of the approved December 2011 Ohio stipulation agreement.
• A $33 million increase in storm-related expenses.
• A $33 million increase in plant outage and other plant operating and maintenance expenses.
• A $25 million increase due to the second quarter 2010 deferral of 2009 storm costs as allowed by the Virginia SCC.
• Asset Impairments and Other Related Charges in 2011 included the following:
• A third quarter 2011 plant impairment of $48 million for Sporn Unit 5.
• A third quarter 2011 plant impairment of $42 million for the FGD project at Muskingum River Unit 5.
• A fourth quarter 2011 write-off of $49 million related to SWEPCo’s Texas jurisdictional portion of the Turk Plant as a result of the November 2011 Texas Court of Appeals decision upholding the Texas capital cost cap.
• Depreciation and Amortization expenses increased $15 million primarily due to the following:
• A $23 million increase due to the amortization of carrying costs on deferred fuel as a result of the October 2011 Ohio POLR remand order.
• A $20 million increase in depreciation and amortization for TCC primarily due to increased amortization of TCC’s Securitized Transition Assets. This increase is partially offset by an increase in revenues within Gross Margin.
• Overall higher depreciable property balances.

18
These increases were partially offset by: • A $34 million decrease in depreciation and amortization for APCo primarily due to the expiration of
E&R amortization of deferred carrying costs in Virginia.
• Interest and Investment Income increased $20 million primarily due to interest income recorded in the third quarter of 2011 for favorable adjustments related to the 2001-2006 federal income tax audit.
• Carrying Costs Income increased $323 million due to the third quarter 2011 recognition of a regulatory asset related to TCC capacity auction true-up amounts that were originally written off in 2005 and a related favorable fourth quarter 2011 resolution of contested tax items related to the TCC stranded cost settlement.
• Allowance for Equity Funds Used During Construction increased $14 million primarily due to construction of the Turk and Dresden Plants and various environmental upgrades, partially offset by a decrease due to the completion of the Stall Unit in June 2010.
• Interest Expense decreased $56 million primarily due to lower outstanding long-term debt balances and lower long-term interest rates.
• Income Tax Expense increased $71 million primarily due to an increase in pretax book income, partially offset by the 2010 tax treatment associated with the future reimbursement of Medicare Part D retiree prescription drug benefits and by the recording of federal and state income tax adjustments resulting from the filing of the prior year tax returns.

- THIS PAGE INTENTIONALLY LEFT BLANK -

19
2010 Compared to 2009 Reconciliation of Year Ended December 31, 2009 to Year Ended December 31, 2010 Income from Utility Operations Before Discontinued Operations and Extraordinary Items (in millions) Year Ended December 31, 2009 $ 1,325 Changes in Gross Margin:
Retail Margins 602 Off-system Sales 53 Transmission Revenues 15 Other Revenues (257)
Total Change in Gross Margin 413
Changes in Expenses and Other:
Other Operation and Maintenance (350) Depreciation and Amortization (37) Taxes Other Than Income Taxes (60) Interest and Investment Income 5 Carrying Costs Income 23 Allowance for Equity Funds Used During Construction (5) Interest Expense (26) Equity Earnings of Unconsolidated Subsidiaries 2
Total Change in Expenses and Other (448)
Income Tax Expense (98)
Year Ended December 31, 2010 $ 1,192
The major components of the increase in Gross Margin, defined as revenues less the related direct cost of fuel, including consumption of chemicals and emissions allowances, and purchased power were as follows:
• Retail Margins increased $602 million primarily due to the following:
• Successful rate proceedings in our service territories which include:
• A $138 million increase in the recovery of E&R costs in Virginia, costs related to the Transmission Rate Adjustment Clause in Virginia and construction financing costs in West Virginia.
• A $49 million increase in the recovery of advanced metering costs in Texas.
• A $43 million net rate increase for KPCo.
• A $42 million net rate increase for SWEPCo.
• A $39 million net rate increase for I&M.
• A $37 million net rate increase for PSO.
• A $14 million net rate increase in our other jurisdictions.
• For the increases described above, $183 million of these increases relate to riders/trackers which have corresponding increases in other expense items.
• A $229 million increase in weather-related usage primarily due to a 60% increase in cooling degree days in our eastern service territory and 7% and 15% increases in heating degree days in our eastern and western service territories, respectively.
• A $78 million increase due to higher fuel and purchased power costs recorded in 2009 related to the Cook Plant Unit 1 (Unit 1) shutdown. This increase was offset by a corresponding decrease in Other Revenues as discussed below.
These increases were partially offset by:
• A $43 million decrease due to an unfavorable order related to the 2009 Significantly Excessive Earnings Test (SEET).
• A $38 million decrease due to the termination of an I&M unit power agreement.
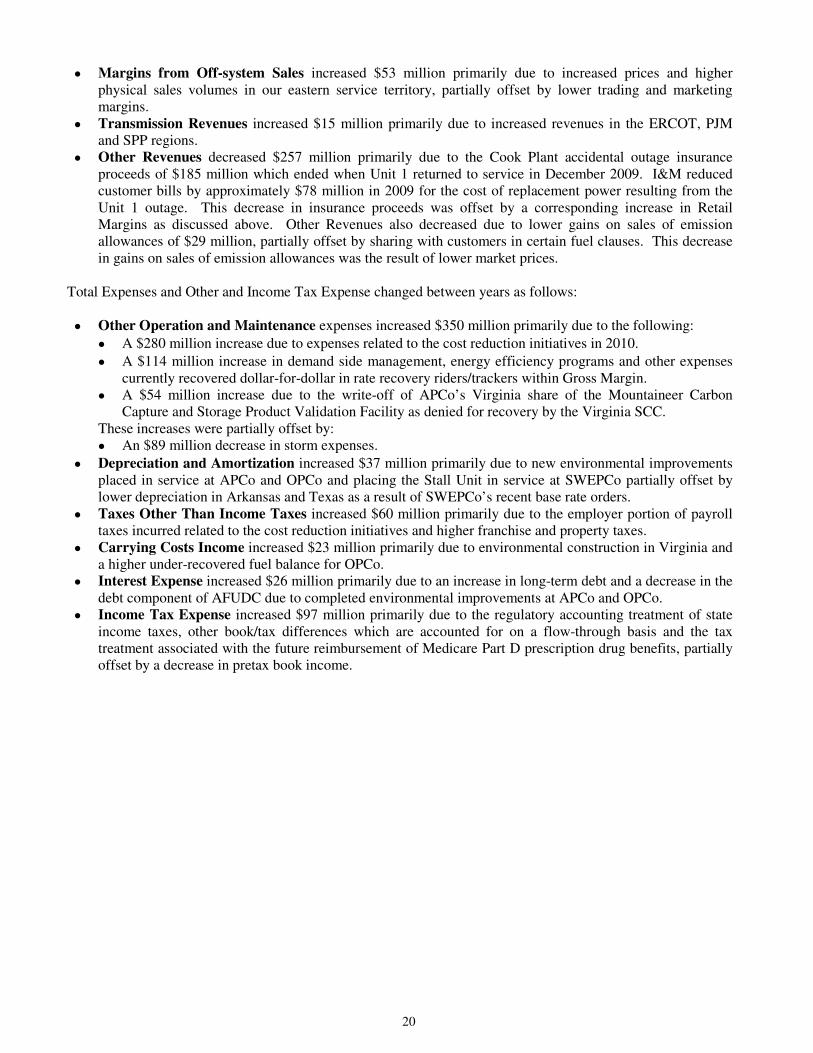
20
• Margins from Off-system Sales increased $53 million primarily due to increased prices and higher physical sales volumes in our eastern service territory, partially offset by lower trading and marketing margins.
• Transmission Revenues increased $15 million primarily due to increased revenues in the ERCOT, PJM and SPP regions.
• Other Revenues decreased $257 million primarily due to the Cook Plant accidental outage insurance proceeds of $185 million which ended when Unit 1 returned to service in December 2009. I&M reduced customer bills by approximately $78 million in 2009 for the cost of replacement power resulting from the Unit 1 outage. This decrease in insurance proceeds was offset by a corresponding increase in Retail Margins as discussed above. Other Revenues also decreased due to lower gains on sales of emission allowances of $29 million, partially offset by sharing with customers in certain fuel clauses. This decrease in gains on sales of emission allowances was the result of lower market prices.
Total Expenses and Other and Income Tax Expense changed between years as follows:
• Other Operation and Maintenance expenses increased $350 million primarily due to the following:
• A $280 million increase due to expenses related to the cost reduction initiatives in 2010.
• A $114 million increase in demand side management, energy efficiency programs and other expenses currently recovered dollar-for-dollar in rate recovery riders/trackers within Gross Margin.
• A $54 million increase due to the write-off of APCo’s Virginia share of the Mountaineer Carbon Capture and Storage Product Validation Facility as denied for recovery by the Virginia SCC.
These increases were partially offset by: • An $89 million decrease in storm expenses.
• Depreciation and Amortization increased $37 million primarily due to new environmental improvements placed in service at APCo and OPCo and placing the Stall Unit in service at SWEPCo partially offset by lower depreciation in Arkansas and Texas as a result of SWEPCo’s recent base rate orders.
• Taxes Other Than Income Taxes increased $60 million primarily due to the employer portion of payroll taxes incurred related to the cost reduction initiatives and higher franchise and property taxes.
• Carrying Costs Income increased $23 million primarily due to environmental construction in Virginia and a higher under-recovered fuel balance for OPCo.
• Interest Expense increased $26 million primarily due to an increase in long-term debt and a decrease in the debt component of AFUDC due to completed environmental improvements at APCo and OPCo.
• Income Tax Expense increased $97 million primarily due to the regulatory accounting treatment of state income taxes, other book/tax differences which are accounted for on a flow-through basis and the tax treatment associated with the future reimbursement of Medicare Part D prescription drug benefits, partially offset by a decrease in pretax book income.

21
TRANSMISSION OPERATIONS Wholly-owned Entities AEP Transmission Company, LLC (AEP Transco), a subsidiary of AEP, has seven wholly-owned transmission companies. The transmission companies have been approved by the applicable commissions in Indiana, Michigan, Ohio and Oklahoma. Applications for approval of the transmission companies have been filed with the APSC, the KPSC, the LPSC, the Virginia SCC and the WVPSC and are pending approval. These seven companies consist of:
AEP East Transmission Companies
• AEP Appalachian Transmission Company, Inc. (APTCo) (covering Virginia)
• AEP Indiana Michigan Transmission Company, Inc. (IMTCo)
• AEP Kentucky Transmission Company, Inc. (KTCo)
• AEP Ohio Transmission Company, Inc. (OHTCo)
• AEP West Virginia Transmission Company, Inc. (WVTCo) AEP West Transmission Companies
• AEP Oklahoma Transmission Company, Inc. (OKTCo)
• AEP Southwestern Transmission Company, Inc. (SWTCo) (covering Arkansas and Louisiana) The AEP East Transmission Companies and the AEP West Transmission Companies have FERC-approved returns on common equity of 11.49% and 11.20%, respectively. AEPSC and other AEP subsidiaries provide services to the transmission companies through service agreements. Therefore, the transmission companies do not have any employees. All of the transmission companies’ capital needs are provided by Parent, AEP Transco and/or the AEP Utility Money Pool. The Utility Money Pool is used to meet the short-term borrowing needs of AEP regulated utility subsidiaries. The Utility Money Pool operates in accordance with the terms and conditions approved in regulatory orders.

22
Joint Venture Initiatives We are currently participating in the following joint venture initiatives: Total Estimated AEP's
Projected Project Costs Investment at Approved
Project Completion Owners at December 31, Return on
Name Location Date (Ownership %) Completion 2011 Equity
(in thousands) ETT Texas 2017 MEHC Texas $ 3,100,000 (a) $ 223,527 9.96 %
(ERCOT) Transco, LLC (50%) AEP (50%)
PATH (b) West 2015 (c) FirstEnergy (50%) 2,100,000 (d) 28,929 12.4 %
Virginia AEP (50%)
Prairie Wind Kansas 2014 Westar Energy (50%) 225,000 1,986 12.8 % ETA (50%) (e)
Pioneer Indiana 2018 Duke Energy (50%) 1,000,000 - 12.54 %
AEP (50%)
RITELine IN Indiana 2019 RTD (25%) (f) 400,000 171 (g) 11.43 %
ETA (37.5%) (e) (f) AEPTHC (37.5%)
RITELine IL Illinois 2019 Commonwealth 1,200,000 14 11.43 %
Edison (75%) RTD (25%) (f)
(a) ETT’s current and future estimated project cost in ERCOT over the next several years is expected to be $3.1 billion.
Future projects will be evaluated on a case-by-case basis. (b) In September 2007, AEP Transmission Holding Company, LLC (AEPTHC) and AET PATH Company, LLC, a
subsidiary of FirstEnergy, Inc. (FirstEnergy), formed a joint venture by creating Potomac-Appalachian Transmission Highline, LLC (PATH) and its subsidiaries. The PATH subsidiaries will operate as transmission utilities owning certain electric transmission assets within PJM.
(c) PJM directed AEP and FirstEnergy to suspend current development efforts on the PATH Project, subject to those activities necessary to maintain the project in its current state, while PJM conducts more rigorous analysis of the potential need for the PATH Project as part of its continuing Regional Transmission Expansion Plan (RTEP) process. PJM’s announcement specifically indicated that PJM was not directing AEP and FirstEnergy to cancel or abandon the PATH Project.
(d) PATH consists of the “West Virginia Series,” which is owned equally by subsidiaries of FirstEnergy and AEP, and the “Allegheny Series” which is wholly-owned by a subsidiary of FirstEnergy. The total project is estimated to cost approximately $2.1 billion. AEP’s estimated share of the project cost is approximately $700 million.
(e) ETA is a 50/50 joint venture with MidAmerican Energy Holdings Company (MEHC) America Transco, LLC and AEP. ETA will be utilized as a vehicle to invest in selected transmission projects located in North America, outside of ERCOT. AEP owns 25% of Prairie Wind Transmission, LLC (Prairie Wind) through its ownership interest in ETA.
(f) RITELine Transmission Development, LLC (RTD) is a 50/50 joint venture with Exelon Transmission Company, LLC and ETA. AEP owns 62.5% of RITELine Indiana, LLC (RITELine IN) through its ownership interest in ETA and AEPTHC. AEP owns 6.25% of RITELine Illinois, LLC (RITELine IL) through its ownership interest in ETA.
(g) RITELine IN is a consolidated variable interest entity.
For the consolidated entities within our Transmission Operations segment, we forecast approximately $350 million, excluding AFUDC, of construction expenditures for 2012. For the equity investments within our Transmission Operations segment, we forecast approximately $116 million of AEP equity contributions in 2012 to support construction expenditures and the payment of operating expenses.
23
2011 Compared to 2010 Income Before Extraordinary Items from our Transmission Operations segment increased from $9 million in 2010 to $30 million in 2011 primarily due to an increase in transmission investments by ETT and OHTCo. 2010 Compared to 2009 Income Before Extraordinary Items from our Transmission Operations segment increased from $4 million in 2009 to $9 million in 2010 primarily due to an increase in transmission investments by ETT. AEP RIVER OPERATIONS 2011 Compared to 2010 Income Before Extraordinary Items from our AEP River Operations segment increased from $37 million in 2010 to $45 million in 2011 primarily due to increased coal exports, increased barge fleet size and the cost reduction initiatives in 2010, partially offset by higher fuel, maintenance and flood-related expenses. 2010 Compared to 2009 Income Before Extraordinary Items from our AEP River Operations segment decreased from $47 million in 2009 to $37 million in 2010 primarily due to expenses related to cost reduction initiatives, increased interest expense on new equipment financing, a property casualty loss in 2010 and a gain on the sale of two older towboats in 2009. GENERATION AND MARKETING
2011 Compared to 2010 Income Before Extraordinary Items from our Generation and Marketing segment decreased from $25 million in 2010 to $14 million in 2011 primarily due to lower gross margins at the Oklaunion Plant. 2010 Compared to 2009 Income Before Extraordinary Items from our Generation and Marketing segment decreased from $41 million in 2009 to $25 million in 2010 primarily due to reduced inception gains from ERCOT marketing activities, reduced plant performance due to lower power prices in ERCOT, partially offset by positive hedging activities on our generation assets and increased income from our wind farm operations. ALL OTHER
2011 Compared to 2010
Income Before Extraordinary Items from All Other decreased from a loss of $45 million in 2010 to a loss of $62 million in 2011 primarily due to a loss incurred in 2011 related to the settlement of litigation with BOA and Enron and a gain on the sale of our remaining shares of Intercontinental Exchange, Inc. (ICE) in 2010 partially offset by a contribution to AEP’s charitable foundation in 2010.
2010 Compared to 2009
Income Before Extraordinary Items from All Other increased from a loss of $47 million in 2009 to a loss of $45 million in 2010 primarily due to a gain on the sale of our remaining shares of ICE in 2010 and a decrease in various parent related expenses partially offset by a 2010 contribution to AEP’s charitable foundation and losses on the sales of assets.

24
AEP SYSTEM INCOME TAXES 2011 Compared to 2010 Income Tax Expense increased $175 million primarily due to an increase in pretax book income and the unrealized capital loss valuation allowance related to a deferred tax asset associated with the settlement of litigation with BOA and Enron, offset in part by the 2010 tax treatment associated with the future reimbursement of Medicare Part D retiree prescription drug benefits and by the recording of federal and state income tax adjustments resulting from the filing of prior year tax returns. 2010 Compared to 2009 Income Tax Expense increased $68 million primarily due to the regulatory accounting treatment of state income taxes, other book/tax differences which are accounted for on a flow-through basis and the tax treatment associated with the future reimbursement of Medicare Part D retiree prescription drug benefits, offset in part by a decrease in pretax book income. FINANCIAL CONDITION We measure our financial condition by the strength of our balance sheet and the liquidity provided by our cash flows. LIQUIDITY AND CAPITAL RESOURCES Debt and Equity Capitalization
December 31, 2011 2010
(dollars in millions) Long-term Debt, including amounts due within one year $ 16,516 50.3 % $ 16,811 52.8 % Short-term Debt 1,650 5.0 1,346 4.2
Total Debt 18,166 55.3 18,157 57.0 Preferred Stock of Subsidiaries - - 60 0.2 AEP Common Equity 14,664 44.7 13,622 42.8 Noncontrolling Interests 1 - - -
Total Debt and Equity Capitalization $ 32,831 100.0 % $ 31,839 100.0 %
Our ratio of debt-to-total capital decreased from 57% in 2010 to 55.3% in 2011 primarily due to an increase in common equity. This increase in common equity is primarily the result of the third quarter 2011 recognition of a regulatory asset related to TCC capacity auction true-up amounts that were originally written off in 2005 and a related favorable fourth quarter 2011 resolution of contested tax items related to the TCC stranded cost settlement. Liquidity Liquidity, or access to cash, is an important factor in determining our financial stability. We believe we have adequate liquidity under our existing credit facilities. At December 31, 2011, we had $3.25 billion in aggregate credit facility commitments to support our operations. Additional liquidity is available from cash from operations and a sale of receivables agreement. We are committed to maintaining adequate liquidity. We generally use short-term borrowings to fund working capital needs, property acquisitions and construction until long-term funding is arranged. Sources of long-term funding include issuance of long-term debt, sale-leaseback or leasing agreements or common stock.
25
Credit Facilities
We manage our liquidity by maintaining adequate external financing commitments. At December 31, 2011, our available liquidity was approximately $2.4 billion as illustrated in the table below: Amount Maturity
(in millions) Commercial Paper Backup: Revolving Credit Facility $ 1,500 June 2015 Revolving Credit Facility 1,750 July 2016
Total 3,250 Cash and Cash Equivalents 221
Total Liquidity Sources 3,471 Less: AEP Commercial Paper Outstanding 967 Letters of Credit Issued 134
Net Available Liquidity $ 2,370
We have credit facilities totaling $3.25 billion to support our commercial paper program. The credit facilities allow us to issue letters of credit in an amount up to $1.35 billion. In July 2011, we replaced the $1.5 billion facility due in 2012 with a new $1.75 billion facility maturing in July 2016 and extended the $1.5 billion facility due in 2013 to expire in June 2015. In March 2011, we terminated a $478 million credit facility, used for letters of credit to support variable rate debt. In March 2011, we also issued bilateral letters of credit to support the remarketing of $357 million of variable rate debt and reacquired $115 million which a trustee holds on our behalf. We use our commercial paper program to meet the short-term borrowing needs of the subsidiaries. The program is used to fund both a Utility Money Pool, which funds the utility subsidiaries, and a Nonutility Money Pool, which funds the majority of the nonutility subsidiaries. In addition, the program also funds, as direct borrowers, the short-term debt requirements of other subsidiaries that are not participants in either money pool for regulatory or operational reasons. The maximum amount of commercial paper outstanding during 2011 was $1.2 billion. The weighted-average interest rate for our commercial paper during 2011 was 0.4%.
Financing Plan
In March 2012, TCC plans to issue $800 million of securitization bonds as approved by the PUCT for recovery of capacity auction true-up amounts over 13 years. We are also evaluating potential securitization of certain deferred regulatory assets in Ohio and West Virginia. Recent legislation in Ohio allows the securitization of deferred FAC costs and certain other regulatory assets. Legislation has been introduced in West Virginia to allow the WVPSC to consider securitization of deferred ENEC costs. At December 31, 2011, we have $1.4 billion of long-term debt due within one year which includes $572 million of Pollution Control Bonds with mandatory tender dates and credit support for variable interest rates that requires the debt be classified as current. Also included in our long-term debt due within one year is $273 million of securitization bonds and DCC Fuel notes payable which will be repaid. We plan to refinance a portion of our maturities. Proceeds from new issuances and the TCC securitization may limit the amount of the remaining long-term debt due within one year that needs to be refinanced.

26
Securitized Accounts Receivables
In 2011, we renewed our receivables securitization agreement. The agreement provides a commitment of $750 million from bank conduits to purchase receivables with an increase to $800 million for the months of July, August and September to accommodate seasonal demand. A commitment of $375 million with the seasonal increase to $425 million expires in June 2012 and the remaining commitment of $375 million expires in June 2014. We intend to extend or replace the agreement expiring in June 2012 on or before its maturity. Debt Covenants and Borrowing Limitations
Our revolving credit agreements contain certain covenants and require us to maintain our percentage of debt to total capitalization at a level that does not exceed 67.5%. The method for calculating outstanding debt and capitalization is contractually defined in our revolving credit agreements. Debt as defined in the revolving credit agreements excludes junior subordinated debentures, securitization bonds and debt of AEP Credit. At December 31, 2011, this contractually-defined percentage was 51.1%. Nonperformance under these covenants could result in an event of default under these credit agreements. At December 31, 2011, we complied with all of the covenants contained in these credit agreements. In addition, the acceleration of our payment obligations, or the obligations of certain of our major subsidiaries, prior to maturity under any other agreement or instrument relating to debt outstanding in excess of $50 million, would cause an event of default under these credit agreements and in a majority of our non-exchange traded commodity contracts which would permit the lenders and counterparties to declare the outstanding amounts payable. However, a default under our non-exchange traded commodity contracts does not cause an event of default under our revolving credit agreements. The revolving credit facilities do not permit the lenders to refuse a draw on any facility if a material adverse change occurs. Utility Money Pool borrowings and external borrowings may not exceed amounts authorized by regulatory orders. At December 31, 2011, we had not exceeded those authorized limits. Dividend Policy and Restrictions
The Board of Directors declared a quarterly dividend of $0.47 per share in January 2012. Future dividends may vary depending upon our profit levels, operating cash flow levels and capital requirements, as well as financial and other business conditions existing at the time. Our income derives from our common stock equity in the earnings of our utility subsidiaries. Various financing arrangements and regulatory requirements may impose certain restrictions on the ability of our utility subsidiaries to transfer funds to us in the form of dividends. We have the option to defer interest payments on the AEP Junior Subordinated Debentures for one or more periods of up to 10 consecutive years per period. During any period in which we defer interest payments, we may not declare or pay any dividends or distributions on, or redeem, repurchase or acquire, our common stock. We do not believe restrictions related to our various financing arrangements and regulatory requirements will have any significant impact on Parent’s ability to access cash to meet the payment of dividends on its common stock. Credit Ratings We do not have any credit arrangements that would require material changes in payment schedules or terminations as a result of a credit downgrade, but our access to the commercial paper market may depend on our credit ratings. In addition, downgrades in our credit ratings by one of the rating agencies could increase our borrowing costs. Counterparty concerns about the credit quality of AEP or its utility subsidiaries could subject us to additional collateral demands under adequate assurance clauses under our derivative and non-derivative energy contracts.

27
CASH FLOW Managing our cash flows is a major factor in maintaining our liquidity strength. Years Ended December 31, 2011 2010 2009
(in millions) Cash and Cash Equivalents at Beginning of Period $ 294 $ 490 $ 411
Net Cash Flows from Operating Activities 3,788 2,662 2,475 Net Cash Flows Used for Investing Activities (2,890) (2,523) (2,916) Net Cash Flows from (Used for) Financing Activities (971) (335) 520
Net Increase (Decrease) in Cash and Cash Equivalents (73) (196) 79
Cash and Cash Equivalents at End of Period $ 221 $ 294 $ 490
Cash from operations and short-term borrowings provides working capital and allows us to meet other short-term cash needs. Operating Activities Years Ended December 31, 2011 2010 2009
(in millions) Net Income $ 1,949 $ 1,218 $ 1,365 Depreciation and Amortization 1,655 1,641 1,597 Other 184 (197) (487)
Net Cash Flows from Operating Activities $ 3,788 $ 2,662 $ 2,475
Net Cash Flows from Operating Activities were $3.8 billion in 2011 consisting primarily of Net Income of $1.9 billion and $1.7 billion of noncash Depreciation and Amortization. Other changes represent items that had a current period cash flow impact, such as changes in working capital, as well as items that represent future rights or obligations to receive or pay cash, such as regulatory assets and liabilities. Following a Supreme Court of Texas reversal of the PUCT’s capacity auction true-up disallowance and the PUCT’s approval of a stipulation agreement, we recorded Extraordinary Items, Net of Tax of $373 million for the 2011 recognition of a regulatory asset related to TCC capacity auction true-up amounts and the reversal of tax related regulatory credits. We also recorded $393 million in Carrying Costs Income primarily related to the Texas restructuring appeals. A significant change in other items includes the favorable impact of a decrease in fuel inventory. Deferred Income Taxes increased primarily due to bonus depreciation provisions in the Small Business Jobs Act and the Tax Relief, Unemployment Insurance Reauthorization and Jobs Creation Act, the settlement with BOA and Enron and an increase in tax versus book temporary differences from operations. In February 2011, we paid $425 million to BOA of which $211 million was used to settle litigation with BOA and Enron. The remaining $214 million was used to acquire cushion gas as discussed in Investing Activities below. During 2011, we also contributed $450 million to our qualified pension trust. Net Cash Flows from Operating Activities were $2.7 billion in 2010 consisting primarily of Net Income of $1.2 billion and $1.6 billion of noncash Depreciation and Amortization. Other changes represent items that had a current period cash flow impact, such as changes in working capital, as well as items that represent future rights or obligations to receive or pay cash, such as regulatory assets and liabilities. Other includes a $656 million increase in securitized receivables under the application of new accounting guidance for “Transfers and Servicing” related to our sale of receivables agreement. Significant changes in other items include an increase in under-recovered fuel primarily due to the deferral of fuel under the FAC in Ohio and higher fuel costs in Oklahoma, accrued tax benefits and the favorable impact of a decrease in fuel inventory. Deferred Income Taxes increased primarily due to a change in tax versus book temporary differences from operations. Accrued Taxes, Net increased primarily as a result of the receipt of a federal income tax refund of $419 million related to a net operating loss in 2009 that was carried back to 2007 and 2008. We also contributed $500 million to our qualified pension trust in 2010.

28
Net Cash Flows from Operating Activities were $2.5 billion in 2009 consisting primarily of Net Income of $1.4 billion and $1.6 billion of noncash Depreciation and Amortization. Other represents items that had a current period cash flow impact, such as changes in working capital, as well as items that represent future rights or obligations to receive or pay cash, such as regulatory assets and liabilities. Significant changes in other items include the negative impact on cash of an increase in coal inventory reflecting decreased customer demand for electricity, an increase in under-recovered fuel primarily in Ohio and West Virginia and an increase in accrued tax benefits resulting from a net income tax operating loss in 2009. Deferred Income Taxes increased primarily due to the American Recovery and Reinvestment Act of 2009 extending bonus depreciation provisions, a one-time change in tax accounting method and an increase in tax versus book temporary differences from operations. Investing Activities
Years Ended December 31, 2011 2010 2009
(in millions) Construction Expenditures $ (2,669) $ (2,345) $ (2,792) Acquisitions of Nuclear Fuel (106) (91) (169) Acquisitions of Assets (19) (155) (104) Acquisitions of Cushion Gas from BOA (214) - - Proceeds from Sales of Assets 123 187 278 Other (5) (119) (129)
Net Cash Flows Used for Investing Activities $ (2,890) $ (2,523) $ (2,916)
Net Cash Flows Used for Investing Activities were $2.9 billion in 2011 primarily due to Construction Expenditures for new generation, environmental, distribution and transmission investments. We paid $214 million to BOA for cushion gas as part of a litigation settlement. Net Cash Flows Used for Investing Activities were $2.5 billion in 2010 primarily due to Construction Expenditures for environmental, new generation, distribution and transmission investments. Proceeds from Sales of Assets in 2010 include $139 million for sales of Texas transmission assets to ETT. Net Cash Flows Used for Investing Activities were $2.9 billion in 2009 primarily due to Construction Expenditures for our new generation, environmental, distribution and transmission investments. Proceeds from Sales of Assets in 2009 includes $104 million relating to the sale of a portion of Turk Plant to joint owners as planned and $95 million for sales of Texas transmission assets to ETT. Financing Activities
Years Ended December 31, 2011 2010 2009
(in millions) Issuance of Common Stock, Net $ 92 $ 93 $ 1,728 Issuance/Retirement of Debt, Net (33) 497 (360) Retirement of Cumulative Preferred Stock (64) - - Dividends Paid on Common Stock (898) (824) (758) Other (68) (101) (90)
Net Cash Flows from (Used for) Financing Activities $ (971) $ (335) $ 520
Net Cash Flows Used for Financing Activities in 2011 were $971 million. Our net debt retirements were $33 million. The net retirements included retirements of $727 million of senior unsecured and other debt notes, $778 million of pollution control bonds and $159 million of securitization bonds offset by issuances of $710 million of notes, $627 million of pollution control bonds and an increase in short-term borrowing of $304 million. We paid common stock dividends of $898 million and $64 million to retire all of our subsidiaries’ preferred stocks. See Note 13 – Financing Activities.

29
Net Cash Flows Used for Financing Activities were $335 million in 2010. Our net debt issuances were $497 million. The net issuances included issuances of $952 million of notes and $326 million of pollution control bonds, a $531 million increase in commercial paper outstanding and retirements of $1.6 billion of notes, $148 million of securitization bonds and $222 million of pollution control bonds. Our short-term debt securitized by receivables increased $656 million under the application of new accounting guidance for “Transfers and Servicing” related to our sale of receivables agreement. We paid common stock dividends of $824 million. Net Cash Flows from Financing Activities were $520 million in 2009. Issuance of Common Stock, Net of $1.7 billion is comprised of our issuance of 69 million shares of common stock with net proceeds of $1.64 billion and additional shares through our dividend reinvestment, employee savings and incentive programs. Our net debt retirements were $360 million. The net retirements included the repayment of $2 billion outstanding under our credit facilities and retirement of $816 million of long-term debt and issuances of $1.9 billion of senior unsecured and debt notes and $431 million of pollution control bonds. We paid common stock dividends of $758 million. The following financing activities occurred during 2011: AEP Common Stock:
• During 2011, we issued 2.6 million shares of common stock under our incentive compensation, employee savings and dividend reinvestment plans and received net proceeds of $92 million.
Preferred Stock of Subsidiaries:
• During 2011, we paid $64 million to retire all outstanding shares of our subsidiaries’ preferred stock. Debt:
• During 2011, we issued approximately $1.3 billion of long-term debt, including $600 million of senior notes at interest rates ranging from 4.4% to 4.6%. We also issued $627 million of pollution control revenue bonds, including $225 million at interest rates ranging from 1.125% to 2% and $402 million at variable interest rates. The proceeds from these issuances were used to fund long-term debt maturities and our construction programs.
• During 2011, we entered into $975 million of interest rate derivatives and settled $974 million of such transactions. The settlements resulted in net cash receipts of $34 million. As of December 31, 2011, we had in place $907 million of notional interest rate derivatives designated as cash flow and fair value hedges.
In 2012:
• In January 2012, TCC retired $98 million of its outstanding Securitization Bonds.
• In January and February 2012, I&M retired $14 million of Notes Payable related to DCC Fuel.
• In February 2012, APCo retired $30 million of 6.05% Pollution Control Bonds due in 2024 and $19.5 million of 5% Pollution Control Bonds due in 2021.
• In February 2012, SWEPCo issued $275 million of 3.55% Senior Unsecured Notes due in 2022 and $65 million of 4.58% Notes Payable due in 2032.

30
BUDGETED CONSTRUCTION EXPENDITURES We forecast approximately $3.1 billion of construction expenditures excluding equity AFUDC and capitalized interest for 2012. For 2013 and 2014, we forecast construction expenditures ranging from $3.4 billion to $3.5 billion each year. The projected increases are generally the result of required environmental investment to comply with Federal EPA rules and additional transmission spending. Estimated construction expenditures are subject to periodic review and modification and may vary based on the ongoing effects of regulatory constraints, environmental regulations, business opportunities, market volatility, economic trends, weather, legal reviews and the ability to access capital. We expect to fund these construction expenditures through cash flows from operations and financing activities. Generally, the subsidiaries use cash or short-term borrowings under the money pool to fund these expenditures until long-term funding is arranged. The estimated expenditures include amounts for completion of the Turk Plant. APCo’s Dresden Plant was completed and placed in service in January 2012. SWEPCo’s Turk Plant is expected to be in-service in the fourth quarter of 2012. The 2012 estimated construction expenditures include generation, transmission and distribution related investments, as well as expenditures for compliance with environmental regulations as follows: Budgeted Construction Expenditures
(in millions) Environmental $ 511 Generation 781 Transmission 812 Distribution 847 Other 114
Total $ 3,065
OFF-BALANCE SHEET ARRANGEMENTS In prior periods, under a limited set of circumstances, we entered into off-balance sheet arrangements for various reasons including reducing operational expenses and spreading risk of loss to third parties. Our current guidelines restrict the use of off-balance sheet financing entities or structures to traditional operating lease arrangements that we enter in the normal course of business. The following identifies significant off-balance sheet arrangements. Rockport Plant Unit 2
AEGCo and I&M entered into a sale-and-leaseback transaction in 1989 with Wilmington Trust Company (Owner Trustee), an unrelated unconsolidated trustee for Rockport Plant Unit 2 (the Plant). The Owner Trustee was capitalized with equity from six owner participants with no relationship to AEP or any of its subsidiaries and debt from a syndicate of banks and certain institutional investors. The future minimum lease payments for AEGCo and I&M are $813 million and $813 million, respectively, as of December 31, 2011. The gain from the sale was deferred and is being amortized over the term of the lease, which expires in 2022. The Owner Trustee owns the Plant and leases it to AEGCo and I&M. Our subsidiaries account for the lease as an operating lease with the future payment obligations included in Note 12. The lease term is for 33 years with potential renewal options. At the end of the lease term, AEGCo and I&M have the option to renew the lease or the Owner Trustee can sell the Plant. We, as well as our subsidiaries, have no ownership interest in the Owner Trustee and do not guarantee its debt.

31
Railcars In June 2003, we entered into an agreement with BTM Capital Corporation, as lessor, to lease 875 coal-transporting aluminum railcars. The initial lease term was five years with three consecutive five-year renewal periods for a maximum lease term of twenty years. We intend to maintain the lease for the full lease term of twenty years via the renewal options. The lease is accounted for as an operating lease. The future minimum lease obligation is $34 million for the remaining railcars as of December 31, 2011. Under a return-and-sale option, the lessor is guaranteed that the sale proceeds will equal at least a specified lessee obligation amount which declines with each five-year renewal. At December 31, 2011, the maximum potential loss was approximately $25 million assuming the fair value of the equipment is zero at the end of the current five-year lease term. However, we believe that the fair value would produce a sufficient sales price to avoid any loss. We have other railcar lease arrangements that do not utilize this type of financing structure. CONTRACTUAL OBLIGATION INFORMATION Our contractual cash obligations include amounts reported on the balance sheets and other obligations disclosed in our footnotes. The following table summarizes our contractual cash obligations at December 31, 2011: Payments Due by Period Less Than After Contractual Cash Obligations 1 year 2-3 years 4-5 years 5 years Total
(in millions) Short-term Debt (a) $ 1,650 $ - $ - $ - $ 1,650 Interest on Fixed Rate Portion of Long-term Debt (b) 788 1,402 1,169 6,382 9,741 Fixed Rate Portion of Long-term Debt (c) 888 2,346 2,202 10,457 15,893 Variable Rate Portion of Long-term Debt (d) 545 111 6 - 662 Capital Lease Obligations (e) 96 148 102 285 631 Noncancelable Operating Leases (e) 316 552 471 1,235 2,574 Fuel Purchase Contracts (f) 2,867 3,918 2,574 3,108 12,467 Energy and Capacity Purchase Contracts (g) 104 213 217 1,066 1,600 Construction Contracts for Capital Assets (h) 682 918 821 1,663 4,084
Total $ 7,936 $ 9,608 $ 7,562 $ 24,196 $ 49,302
(a) Represents principal only excluding interest. (b) Interest payments are estimated based on final maturity dates of debt securities outstanding at December 31,
2011 and do not reflect anticipated future refinancing, early redemptions or debt issuances. (c) See “Long-term Debt” section of Note 13. Represents principal only excluding interest. (d) See “Long-term Debt” section of Note 13. Represents principal only excluding interest. Variable rate debt
had interest rates that ranged between 0.06% and 0.955% at December 31, 2011. (e) See Note 12. (f) Represents contractual obligations to purchase coal, natural gas, uranium and other consumables as fuel for
electric generation along with related transportation of the fuel. (g) Represents contractual obligations for energy and capacity purchase contracts. (h) Represents only capital assets for which we have signed contracts. Actual payments are dependent upon
and may vary significantly based upon the decision to build, regulatory approval schedules, timing and escalation of project costs.
Our $68 million liability related to uncertainty in Income Taxes is not included above because we cannot reasonably estimate the cash flows by period.

32
Our pension funding requirements are not included in the above table. As of December 31, 2011, we expect to make contributions to our pension plans totaling $208 million in 2012. Estimated contributions of $107 million in 2013 and $107 million in 2014 may vary significantly based on market returns, changes in actuarial assumptions and other factors. Based upon the benefit obligation and fair value of assets available to pay pension benefits, our pension plans were 86.2% funded as of December 31, 2011. In addition to the amounts disclosed in the contractual cash obligations table above, we make additional commitments in the normal course of business. These commitments include standby letters of credit, guarantees for the payment of obligation performance bonds and other commitments. At December 31, 2011, our commitments outstanding under these agreements are summarized in the table below:
Amount of Commitment Expiration Per Period
Less Than After
Other Commercial Commitments 1 year 2-3 years 4-5 years 5 years Total
(in millions) Standby Letters of Credit (a) $ 134 $ - $ - $ - $ 134
Guarantees of the Performance of Outside Parties (b) - - - 100 100
Guarantees of Our Performance (c) 402 7 20 36 465
Total Commercial Commitments $ 536 $ 7 $ 20 $ 136 $ 699
(a) We enter into standby letters of credit (LOCs) with third parties. These LOCs cover items such as gas and electricity risk
management contracts, construction contracts, insurance programs, security deposits and debt service reserves. AEP, on behalf of our subsidiaries, and/or the subsidiaries issued all of these LOCs in the ordinary course of business. There is no collateral held in relation to any guarantees in excess of our ownership percentages. In the event any LOC is drawn, there is no recourse to third parties. The maximum future payments of these LOCs are $134 million with maturities ranging from January 2012 to October 2012. Subsequent to December 31, 2011, standby LOCs have increased approximately $100 million as a result of declining market prices related to our risk management contracts. This increase is partially offset by a reduction of posted cash collateral of approximately $20 million. See “Letters of Credit” section of Note 5.
(b) See “Guarantees of Third-Party Obligations” section of Note 5. (c) We issued performance guarantees and indemnifications for energy trading and various sale agreements.
SIGNIFICANT TAX LEGISLATION The American Recovery and Reinvestment Tax Act of 2009 provided for several new grant programs, expanded tax credits and extended the 50% bonus depreciation provision enacted in the Economic Stimulus Act of 2008. The Small Business Jobs Act, enacted in September 2010, included a one-year extension of the 50% bonus depreciation provision. The Tax Relief, Unemployment Insurance Reauthorization and the Job Creation Act of 2010 extended the life of research and development, employment and several energy tax credits originally scheduled to expire at the end of 2010. In addition, this act extended the time for claiming bonus depreciation and increased the deduction to 100% starting in September 2010 through 2011 and decreasing the deduction to 50% for 2012. These enacted provisions did not have a material impact on net income or financial condition but had a favorable impact on cash flows in 2010 and 2011 and are expected to result in material future cash flow benefits in 2012. CRITICAL ACCOUNTING POLICIES AND ESTIMATES, NEW ACCOUNTING PRONOUNCEMENTS CRITICAL ACCOUNTING POLICIES AND ESTIMATES The preparation of financial statements in accordance with GAAP requires us to make estimates and assumptions that affect reported amounts and related disclosures, including amounts related to legal matters and contingencies. We consider an accounting estimate to be critical if:
• It requires assumptions to be made that were uncertain at the time the estimate was made; and
• Changes in the estimate or different estimates that could have been selected could have a material effect on our consolidated net income or financial condition.

33
We discuss the development and selection of critical accounting estimates as presented below with the Audit Committee of AEP’s Board of Directors and the Audit Committee reviews the disclosure relating to them. We believe that the current assumptions and other considerations used to estimate amounts reflected in our consolidated financial statements are appropriate. However, actual results can differ significantly from those estimates. The sections that follow present information about our critical accounting estimates, as well as the effects of hypothetical changes in the material assumptions used to develop each estimate. Regulatory Accounting
Nature of Estimates Required Our financial statements reflect the actions of regulators that can result in the recognition of revenues and expenses in different time periods than enterprises that are not rate-regulated. We recognize regulatory assets (deferred expenses to be recovered in the future) and regulatory liabilities (deferred future revenue reductions or refunds) for the economic effects of regulation. Specifically, we match the timing of expense and income recognition with regulated revenues. We also record liabilities for refunds, or probable refunds, to customers that have not been made.
Assumptions and Approach Used
When incurred costs are probable of recovery through regulated rates, we record them as regulatory assets on the balance sheet. We review the probability of recovery at each balance sheet date and whenever new events occur. Similarly, we record regulatory liabilities when a determination is made that a refund is probable or when ordered by a commission. Examples of new events that affect probability include changes in the regulatory environment, issuance of a regulatory commission order or passage of new legislation. The assumptions and judgments used by regulatory authorities continue to have an impact on the recovery of costs as well as the return of revenues, rate of return earned on invested capital and timing and amount of assets to be recovered through regulated rates. If recovery of a regulatory asset is no longer probable, we write off that regulatory asset as a charge against earnings. A write-off of regulatory assets or establishment of a regulatory liability may also reduce future cash flows since there will be no recovery through regulated rates. Effect if Different Assumptions Used
A change in the above assumptions may result in a material impact on our net income. Refer to Note 4 for further detail related to regulatory assets and liabilities. Revenue Recognition – Unbilled Revenues Nature of Estimates Required
We record revenues when energy is delivered to the customer. The determination of sales to individual customers is based on the reading of their meters, which we perform on a systematic basis throughout the month. At the end of each month, amounts of energy delivered to customers since the date of the last meter reading are estimated and the corresponding unbilled revenue accrual is recorded. This estimate is reversed in the following month and actual revenue is recorded based on meter readings. In accordance with the applicable state commission regulatory treatment in Arkansas, Louisiana, Oklahoma and Texas, PSO and SWEPCo do not record the fuel portion of unbilled revenue. The changes in unbilled electric utility revenues included in Revenue on our statements of income were $(81) million, $46 million and $55 million for the years ended December 31, 2011, 2010 and 2009, respectively. The changes in unbilled electric revenues are primarily due to changes in weather and rate increases. Accrued unbilled revenues for the Utility Operations segment were $468 million and $549 million as of December 31, 2011 and 2010, respectively.

34
Assumptions and Approach Used
For each operating company, we compute the monthly estimate for unbilled revenues as net generation less the current month’s billed KWH plus the prior month’s unbilled KWH. However, due to meter reading issues, meter drift and other anomalies, a separate monthly calculation limits the unbilled estimate within a range of values. This limiter calculation is derived from an allocation of billed KWH to the current month and previous month, on a cycle-by-cycle basis, and by dividing the current month aggregated result by the billed KWH. The limits are statistically set at one standard deviation from this percentage to determine the upper and lower limits of the range. The unbilled estimate is compared to the limiter calculation and adjusted for variances exceeding the upper and lower limits.
Effect if Different Assumptions Used
Significant fluctuations in energy demand for the unbilled period, weather, line losses or changes in the composition of customer classes could impact the accuracy of the unbilled revenue estimate. A 1% change in the limiter calculation when it is outside the range would increase or decrease unbilled revenues by 1% of the accrued unbilled revenues. Accounting for Derivative Instruments Nature of Estimates Required
We consider fair value techniques, valuation adjustments related to credit and liquidity and judgments related to the probability of forecasted transactions occurring within the specified time period to be critical accounting estimates. These estimates are considered significant because they are highly susceptible to change from period to period and are dependent on many subjective factors.
Assumptions and Approach Used
We measure the fair values of derivative instruments and hedge instruments accounted for using MTM accounting based on exchange prices and broker quotes. If a quoted market price is not available, we estimate the fair value based on the best market information available including valuation models that estimate future energy prices based on existing market and broker quotes, supply and demand market data and other assumptions. Fair value estimates, based upon the best market information available, involve uncertainties and matters of significant judgment. These uncertainties include projections of macroeconomic trends and future commodity prices, including supply and demand levels and future price volatility. We reduce fair values by estimated valuation adjustments for items such as discounting, liquidity and credit quality. We calculate liquidity adjustments by utilizing bid/ask spreads to estimate the potential fair value impact of liquidating open positions over a reasonable period of time. We calculate credit adjustments on our risk management contracts using estimated default probabilities and recovery rates relative to our counterparties or counterparties with similar credit profiles and contractual netting agreements. With respect to hedge accounting, we assess hedge effectiveness and evaluate a forecasted transaction’s probability of occurrence within the specified time period as provided in the original hedge documentation. Effect if Different Assumptions Used
There is inherent risk in valuation modeling given the complexity and volatility of energy markets. Therefore, it is possible that results in future periods may be materially different as contracts settle. The probability that hedged forecasted transactions will not occur by the end of the specified time period could change operating results by requiring amounts currently classified in Accumulated Other Comprehensive Income (Loss) to be classified into operating income.

35
For additional information regarding derivatives, hedging and fair value measurements, see Notes 9 and 10. See “Fair Value Measurements of Assets and Liabilities” section of Note 1 for fair value calculation policy. Long-Lived Assets Nature of Estimates Required
In accordance with the requirements of “Property, Plant and Equipment” accounting guidance, we evaluate long-lived assets for impairment whenever events or changes in circumstances indicate that the carrying amount of any such assets may not be recoverable including planned abandonments and a probable disallowance for rate-making on a plant under construction or the assets meet the held-for-sale criteria. We utilize a group composite method of depreciation to estimate the useful lives of long-lived assets. The evaluations of long-lived, held-and-used assets may result from abandonments, significant decreases in the market price of an asset, a significant adverse change in the extent or manner in which an asset is being used or in its physical condition, a significant adverse change in legal factors or in the business climate that could affect the value of an asset, as well as other economic or operations analyses. If the carrying amount is not recoverable, we record an impairment to the extent that the fair value of the asset is less than its book value. For assets held for sale, an impairment is recognized if the expected net sales price is less than its book value. For regulated assets, the earnings impact of an impairment charge could be offset by the establishment of a regulatory asset if rate recovery is probable. For nonregulated assets, any impairment charge is recorded against earnings. Assumptions and Approach Used
The fair value of an asset is the amount at which that asset could be bought or sold in a current transaction between willing parties other than in a forced or liquidation sale. Quoted market prices in active markets are the best evidence of fair value and are used as the basis for the measurement, if available. In the absence of quoted prices for identical or similar assets in active markets, we estimate fair value using various internal and external valuation methods including cash flow projections or other market indicators of fair value such as bids received, comparable sales or independent appraisals. We perform depreciation studies that include a review of any external factors that may affect the useful life to determine composite depreciation rates and related lives which are subject to periodic review by state regulatory commissions for cost-based regulated assets. The fair value of the asset could be different using different estimates and assumptions in these valuation techniques. Effect if Different Assumptions Used
In connection with the evaluation of long-lived assets in accordance with the requirements of “Property, Plant and Equipment” accounting guidance, the fair value of an asset can vary if different estimates and assumptions would have been used in our applied valuation techniques. The estimate for depreciation rates takes into account the history of interim capital replacements and the amount of salvage expected. In cases of impairment, we made our best estimate of fair value using valuation methods based on the most current information at that time. Fluctuations in realized sales proceeds versus the estimated fair value of the asset are generally due to a variety of factors including, but not limited to, differences in subsequent market conditions, the level of bidder interest, timing and terms of the transactions and our analysis of the benefits of the transaction. Pension and Other Postretirement Benefits We maintain a qualified, defined benefit pension plan (Qualified Plan), which covers substantially all nonunion and certain union employees, and unfunded, nonqualified supplemental plans (Nonqualified Plans) to provide benefits in excess of deductible amounts as permitted under the provisions of the tax law to be paid to participants in the Qualified Plan (collectively the Pension Plans). Additionally, we entered into individual employment contracts with certain current and retired executives that provide additional retirement benefits as a part of the Nonqualified Plans. We also sponsor other postretirement benefit plans to provide medical and life insurance benefits for retired employees (Postretirement Plans). The Pension Plans and Postretirement Plans are collectively the Plans.

36
For a discussion of investment strategy, investment limitations, target asset allocations and the classification of investments within the fair value hierarchy, see “Investments Held in Trust for Future Liabilities” and “Fair Value Measurements of Assets and Liabilities” sections of Note 1. See Note 7 for information regarding costs and assumptions for employee retirement and postretirement benefits. The following table shows the net periodic cost of the Plans: Years Ended December 31, Net Periodic Benefit Cost 2011 2010 2009
(in millions) Pension Plans $ 118 $ 141 $ 96 Postretirement Plans 73 111 141 The net periodic benefit cost is calculated based upon a number of actuarial assumptions, including expected long-term rates of return on the Plans’ assets. In developing the expected long-term rate of return assumption for 2012, we evaluated input from actuaries and investment consultants, including their reviews of asset class return expectations as well as long-term inflation assumptions. We also considered historical returns of the investment markets. We anticipate that the investment managers we employ for the Plans will invest the assets to generate future returns averaging 7.25%. The expected long-term rate of return on the Plans’ assets is based on our targeted asset allocation and our expected investment returns for each investment category. Our assumptions are summarized in the following table: Other Postretirement Pension Plans Benefit Plans
Assumed/ Assumed/ 2012 Expected 2012 Expected Target Long-Term Target Long-Term Asset Rate of Asset Rate of Allocation Return Allocation Return
Equity 45 % 8.75 % 66 % 8.50 % Fixed Income 45 % 5.25 % 33 % 5.08 % Other Investments 10 % 8.75 % - % - % Cash and Cash Equivalents - % - % 1 % 1.55 %
Total 100 % 100 %
We regularly review the actual asset allocation and periodically rebalance the investments to our targeted allocation. We believe that 7.25% is a reasonable estimate of the long-term rate of return on the Plans’ assets despite the recent market volatility. The Pension Plans’ assets had an actual gain of 8.1% and 13.4% for the years ended December 31, 2011 and 2010, respectively. The Postretirement Plans’ assets had an actual gain of 0.4% and 11.3% for the years ended December 31, 2011 and 2010, respectively. We will continue to evaluate the actuarial assumptions, including the expected rate of return, at least annually, and will adjust the assumptions as necessary. We base our determination of pension expense or income on a market-related valuation of assets, which reduces year-to-year volatility. This market-related valuation recognizes investment gains or losses over a five-year period from the year in which they occur. Investment gains or losses for this purpose are the difference between the expected return calculated using the market-related value of assets and the actual return based on the market-related value of assets. Since the market-related value of assets recognizes gains or losses over a five-year period, the future value of assets will be impacted as previously deferred gains or losses are recorded. As of December 31, 2011, we had cumulative losses of approximately $104 million that remain to be recognized in the calculation of the market-related value of assets. These unrecognized net actuarial losses may result in increases in the future pension costs depending on several factors, including whether such losses at each measurement date exceed the corridor in accordance with “Compensation – Retirement Benefits” accounting guidance.

37
The method used to determine the discount rate that we utilize for determining future obligations is a duration-based method in which a hypothetical portfolio of high quality corporate bonds similar to those included in the Moody’s Aa bond index is constructed with a duration matching the benefit plan liability. The composite yield on the hypothetical bond portfolio is used as the discount rate for the plan. The discount rate at December 31, 2011 under this method was 4.55% for the Qualified Plan, 4.4% for the Nonqualified Plans and 4.75% for the Postretirement Plans. Due to the effect of the unrecognized actuarial losses and based on an expected rate of return on the Pension Plans’ assets of 7.25%, discount rates of 4.55% and 4.4% and various other assumptions, we estimate that the pension costs for the Pension Plans will approximate $127 million, $150 million and $125 million in 2012, 2013 and 2014, respectively. Based on an expected rate of return on the Postretirement Plans’ assets of 7.25%, a discount rate of 4.75% and various other assumptions, we estimate costs will approximate $95 million, $88 million and $81 million in 2012, 2013 and 2014, respectively. Future actual costs will depend on future investment performance, changes in future discount rates and various other factors related to the populations participating in the Plans. The actuarial assumptions used may differ materially from actual results. The effects of a 50 basis point change to selective actuarial assumptions are included in the “Effect if Different Assumptions Used” section below. The value of the Pension Plans’ assets increased to $4.3 billion at December 31, 2011 from $3.9 billion at December 31, 2010 primarily due to $450 million of contributions. During 2011, the Qualified Plan paid $287 million and the Nonqualified Plans paid $7 million in benefits to plan participants. The value of the Postretirement Plans’ assets decreased to $1.4 billion at December 31, 2011 from $1.5 billion at December 31, 2010 primarily due to benefits paid exceeding contributions by the company and the participants. The Postretirement Plans paid $150 million in benefits to plan participants during 2011. Nature of Estimates Required
We sponsor pension and other retirement and postretirement benefit plans in various forms covering all employees who meet eligibility requirements. We account for these benefits under “Compensation” and “Plan Accounting” accounting guidance. The measurement of our pension and postretirement benefit obligations, costs and liabilities is dependent on a variety of assumptions.
Assumptions and Approach Used
The critical assumptions used in developing the required estimates include the following key factors:
• Discount rate
• Compensation increase rate
• Cash balance crediting rate
• Health care cost trend rate
• Expected return on plan assets Other assumptions, such as retirement, mortality and turnover, are evaluated periodically and updated to reflect actual experience.

38
Effect if Different Assumptions Used
The actuarial assumptions used may differ materially from actual results due to changing market and economic conditions, higher or lower withdrawal rates, longer or shorter life spans of participants or higher or lower lump sum versus annuity payout elections by plan participants. These differences may result in a significant impact to the amount of pension and postretirement benefit expense recorded. If a 50 basis point change were to occur for the following assumptions, the approximate effect on the financial statements would be as follows: Other Postretirement Pension Plans Benefit Plans
+0.5% -0.5% +0.5% -0.5%
(in millions) Effect on December 31, 2011 Benefit Obligations
Discount Rate $ (256) $ 281 $ (142) $ 159 Compensation Increase Rate 11 (10) - - Cash Balance Crediting Rate 45 (40) NA NA Health Care Cost Trend Rate NA NA 120 (109) Effect on 2011 Periodic Cost
Discount Rate (18) 19 (11) 12 Compensation Increase Rate 4 (4) - - Cash Balance Crediting Rate 13 (12) NA NA Health Care Cost Trend Rate NA NA 18 (16) Expected Return on Plan Assets (20) 20 (7) 7 NA Not Applicable NEW ACCOUNTING PRONOUNCEMENTS New Accounting Pronouncements Adopted During 2011 We adopted ASU 2011-5 “Presentation of Comprehensive Income” effective for the 2011 Annual Report including the deferral of the reclassification adjustment presentation provisions of ASU 2011-05 under the terms in ASU 2011-12, “Comprehensive Income (Topic 220): Deferral of the Effective Date for Amendments to the Presentation of Reclassifications of Items Out of Accumulated Other Comprehensive Income.” The standard requires other comprehensive income be presented as part of a single continuous statement of comprehensive income or in a statement of other comprehensive income immediately following the statement of net income. This standard changed the presentation of our financial statements but did not affect the calculation of net income, comprehensive income or earnings per share. See Note 2 for further discussion of accounting pronouncements.
Future Accounting Changes The FASB’s standard-setting process is ongoing and until new standards have been finalized and issued, we cannot determine the impact on the reporting of our operations and financial position that may result from any such future changes. The FASB is currently working on several projects including revenue recognition, contingencies, financial instruments, leases, insurance, hedge accounting and consolidation policy. We also expect to see more FASB projects as a result of its desire to converge International Accounting Standards with GAAP. The ultimate pronouncements resulting from these and future projects could have an impact on our future net income and financial position.

39
QUANTITATIVE AND QUALITATIVE DISCLOSURES ABOUT MARKET RISK Market Risks Our Utility Operations segment is exposed to certain market risks as a major power producer and through its transactions in wholesale electricity, coal and emission allowance trading and marketing contracts. These risks include commodity price risk, interest rate risk and credit risk. In addition, we are exposed to foreign currency exchange risk because occasionally we procure various services and materials used in our energy business from foreign suppliers. These risks represent the risk of loss that may impact us due to changes in the underlying market prices or rates. Our Generation and Marketing segment primarily transacts in wholesale energy marketing within ERCOT and, to a lesser extent, wholesale and retail energy contracts in Ohio within PJM and MISO. This segment is exposed to certain market risks as a marketer of wholesale and retail electricity. These risks include commodity price risk, interest rate risk and credit risk. These risks represent the risk of loss that may impact us due to changes in the underlying market prices or rates. All Other included natural gas operations which held forward natural gas contracts that were not sold with the natural gas pipeline and storage assets. These contracts were financial derivatives, which settled and expired in the fourth quarter of 2011. We employ risk management contracts including physical forward purchase and sale contracts and financial forward purchase and sale contracts. We engage in risk management of power, coal and natural gas and, to a lesser degree, heating oil and gasoline, emission allowance and other commodity contracts to manage the risk associated with our energy business. As a result, we are subject to price risk. The amount of risk taken is determined by the commercial operations group in accordance with the market risk policy approved by the Finance Committee of our Board of Directors. Our market risk oversight staff independently monitors our risk policies, procedures and risk levels and provides members of the Commercial Operations Risk Committee (CORC) various daily, weekly and/or monthly reports regarding compliance with policies, limits and procedures. The CORC consists of our Chief Operating Officer, Chief Financial Officer, Senior Vice President of Commercial Operations and Chief Risk Officer. When commercial activities exceed predetermined limits, we modify the positions to reduce the risk to be within the limits unless specifically approved by the CORC.

40
The following table summarizes the reasons for changes in total mark-to-market (MTM) value as compared to December 31, 2010: MTM Risk Management Contract Net Assets (Liabilities) Year Ended December 31, 2011
Generation
Utility and
Operations Marketing All Other Total
(in millions) Total MTM Risk Management Contract Net Assets at December 31, 2010 $ 91 $ 140 $ 2 $ 233 (Gain) Loss from Contracts Realized/Settled During the Period and Entered in a Prior Period (21) (22) (2) (45) Fair Value of New Contracts at Inception When Entered During the Period (a) 6 16 - 22 Net Option Premiums Received for Unexercised or Unexpired Option Contracts Entered During the Period - - - - Changes in Fair Value Due to Market Fluctuations During the Period (b) - (2) - (2) Changes in Fair Value Allocated to Regulated Jurisdictions (c) (17) - - (17)
Total MTM Risk Management Contract Net Assets at December 31, 2011 $ 59 $ 132 $ - 191
Commodity Cash Flow Hedge Contracts (5) Interest Rate and Foreign Currency Cash Flow Hedge Contracts (42) Fair Value Hedge Contracts - Collateral Deposits 107
Total MTM Derivative Contract Net Assets at December 31, 2011 $ 251
(a) Reflects fair value on primarily long-term structured contracts which are typically with customers that seek fixed pricing to limit their
risk against fluctuating energy prices. The contract prices are valued against market curves associated with the delivery location and delivery term. A significant portion of the total volumetric position has been economically hedged.
(b) Market fluctuations are attributable to various factors such as supply/demand, weather, etc. (c) Relates to the net gains (losses) of those contracts that are not reflected on the statements of income. These net gains (losses) are
recorded as regulatory liabilities/assets.
See Note 9 – Derivatives and Hedging and Note 10 – Fair Value Measurements for additional information related to our risk management contracts. The following tables and discussion provide information on our credit risk and market volatility risk.

41
Credit Risk We limit credit risk in our wholesale marketing and trading activities by assessing the creditworthiness of potential counterparties before entering into transactions with them and continuing to evaluate their creditworthiness on an ongoing basis. We use Moody’s Investors Service, Standard & Poor’s and current market-based qualitative and quantitative data as well as financial statements to assess the financial health of counterparties on an ongoing basis. We have risk management contracts with numerous counterparties. Since open risk management contracts are valued based on changes in market prices of the related commodities, our exposures change daily. As of December 31, 2011, our credit exposure net of collateral to sub investment grade counterparties was approximately 5.9%, expressed in terms of net MTM assets, net receivables and the net open positions for contracts not subject to MTM (representing economic risk even though there may not be risk of accounting loss). As of December 31, 2011, the following table approximates our counterparty credit quality and exposure based on netting across commodities, instruments and legal entities where applicable: Exposure Number of Net Exposure Before Counterparties of Credit Credit Net >10% of Counterparties
Counterparty Credit Quality Collateral Collateral Exposure Net Exposure >10%
(in millions, except number of counterparties) Investment Grade $ 611 $ 2 $ 609 1 $ 172 Split Rating 1 - 1 1 1 Noninvestment Grade 14 2 12 1 12 No External Ratings: Internal Investment Grade 280 4 276 1 128 Internal Noninvestment Grade 54 11 43 1 35
Total as of December 31, 2011 $ 960 $ 19 $ 941 5 $ 348
Total as of December 31, 2010 $ 946 $ 33 $ 913 7 $ 347
Value at Risk (VaR) Associated with Risk Management Contracts We use a risk measurement model, which calculates VaR, to measure our commodity price risk in the risk management portfolio. The VaR is based on the variance-covariance method using historical prices to estimate volatilities and correlations and assumes a 95% confidence level and a one-day holding period. Based on this VaR analysis, as of December 31, 2011, a near term typical change in commodity prices is not expected to have a material effect on our net income, cash flows or financial condition. The following table shows the end, high, average and low market risk as measured by VaR for the trading portfolio for the periods indicated:
VaR Model
Twelve Months Ended Twelve Months Ended December 31, 2011 December 31, 2010
End High Average Low End High Average Low
(in millions) (in millions) $ - $ 2 $ - $ - $ - $ 2 $ 1 $ -
We back-test our VaR results against performance due to actual price movements. Based on the assumed 95% confidence interval, the performance due to actual price movements would be expected to exceed the VaR at least once every 20 trading days.

42
As our VaR calculation captures recent price movements, we also perform regular stress testing of the portfolio to understand our exposure to extreme price movements. We employ a historical-based method whereby the current portfolio is subjected to actual, observed price movements from the last four years in order to ascertain which historical price movements translated into the largest potential MTM loss. We then research the underlying positions, price movements and market events that created the most significant exposure and report the findings to the Risk Executive Committee or the CORC as appropriate.
Interest Rate Risk We utilize an Earnings at Risk (EaR) model to measure interest rate market risk exposure. EaR statistically quantifies the extent to which our interest expense could vary over the next twelve months and gives a probabilistic estimate of different levels of interest expense. The resulting EaR is interpreted as the dollar amount by which actual interest expense for the next twelve months could exceed expected interest expense with a one-in-twenty chance of occurrence. The primary drivers of EaR are from the existing floating rate debt (including short-term debt) as well as long-term debt issuances in the next twelve months. As calculated on debt outstanding as of December 31, 2011 and 2010, the estimated EaR on our debt portfolio for the following twelve months was $29 million and $5 million, respectively.

43
REPORT OF INDEPENDENT REGISTERED PUBLIC ACCOUNTING FIRM To the Board of Directors and Shareholders of American Electric Power Company, Inc.: We have audited the accompanying consolidated balance sheets of American Electric Power Company, Inc. and subsidiary companies (the "Company") as of December 31, 2011 and 2010, and the related consolidated statements of income, comprehensive income (loss), changes in equity, and cash flows for each of the three years in the period ended December 31, 2011. These financial statements are the responsibility of the Company's management. Our responsibility is to express an opinion on these financial statements based on our audits. We conducted our audits in accordance with the standards of the Public Company Accounting Oversight Board (United States). Those standards require that we plan and perform the audit to obtain reasonable assurance about whether the financial statements are free of material misstatement. An audit includes examining, on a test basis, evidence supporting the amounts and disclosures in the financial statements. An audit also includes assessing the accounting principles used and significant estimates made by management, as well as evaluating the overall financial statement presentation. We believe that our audits provide a reasonable basis for our opinion. In our opinion, such consolidated financial statements present fairly, in all material respects, the financial position of American Electric Power Company, Inc. and subsidiary companies as of December 31, 2011 and 2010, and the results of their operations and their cash flows for each of the three years in the period ended December 31, 2011, in conformity with accounting principles generally accepted in the United States of America. As discussed in Note 2 to the consolidated financial statements, in 2011 the Company changed its method of presenting comprehensive income due to the adoption of FASB Accounting Standards Update No. 2011-05, Comprehensive Income (Topic 220): Presentation of Comprehensive Income. The change in presentation has been applied retrospectively to all periods presented. As discussed in Note 2 to the consolidated financial statements, on January 1, 2010, the Company adopted FASB Accounting Standards Update No. 2009-16, Transfers and Servicing
(Topic 860): Accounting for Transfers of Financial Assets. We have also audited, in accordance with the standards of the Public Company Accounting Oversight Board (United States), the Company's internal control over financial reporting as of December 31, 2011, based on the criteria established in Internal Control—Integrated Framework issued by the Committee of Sponsoring Organizations of the Treadway Commission and our report dated February 28, 2012 expressed an unqualified opinion on the Company's internal control over financial reporting. /s/ Deloitte & Touche LLP Columbus, Ohio February 28, 2012

44
REPORT OF INDEPENDENT REGISTERED PUBLIC ACCOUNTING FIRM To the Board of Directors and Shareholders of American Electric Power Company, Inc.: We have audited the internal control over financial reporting of American Electric Power Company, Inc. and subsidiary companies (the "Company") as of December 31, 2011, based on criteria established in Internal Control
— Integrated Framework issued by the Committee of Sponsoring Organizations of the Treadway Commission. The Company's management is responsible for maintaining effective internal control over financial reporting and for its assessment of the effectiveness of internal control over financial reporting, included in the accompanying Management’s Report on Internal Control Over Financial Reporting. Our responsibility is to express an opinion on the Company's internal control over financial reporting based on our audit. We conducted our audit in accordance with the standards of the Public Company Accounting Oversight Board (United States). Those standards require that we plan and perform the audit to obtain reasonable assurance about whether effective internal control over financial reporting was maintained in all material respects. Our audit included obtaining an understanding of internal control over financial reporting, assessing the risk that a material weakness exists, testing and evaluating the design and operating effectiveness of internal control based on the assessed risk, and performing such other procedures as we considered necessary in the circumstances. We believe that our audit provides a reasonable basis for our opinion. A company's internal control over financial reporting is a process designed by, or under the supervision of, the company's principal executive and principal financial officers, or persons performing similar functions, and effected by the company's board of directors, management, and other personnel to provide reasonable assurance regarding the reliability of financial reporting and the preparation of financial statements for external purposes in accordance with generally accepted accounting principles. A company's internal control over financial reporting includes those policies and procedures that (1) pertain to the maintenance of records that, in reasonable detail, accurately and fairly reflect the transactions and dispositions of the assets of the company; (2) provide reasonable assurance that transactions are recorded as necessary to permit preparation of financial statements in accordance with generally accepted accounting principles, and that receipts and expenditures of the company are being made only in accordance with authorizations of management and directors of the company; and (3) provide reasonable assurance regarding prevention or timely detection of unauthorized acquisition, use, or disposition of the company's assets that could have a material effect on the financial statements. Because of the inherent limitations of internal control over financial reporting, including the possibility of collusion or improper management override of controls, material misstatements due to error or fraud may not be prevented or detected on a timely basis. Also, projections of any evaluation of the effectiveness of the internal control over financial reporting to future periods are subject to the risk that the controls may become inadequate because of changes in conditions, or that the degree of compliance with the policies or procedures may deteriorate. In our opinion, the Company maintained, in all material respects, effective internal control over financial reporting as of December 31, 2011, based on the criteria established in Internal Control — Integrated Framework issued by the Committee of Sponsoring Organizations of the Treadway Commission. We have also audited, in accordance with the standards of the Public Company Accounting Oversight Board (United States), the consolidated financial statements as of and for the year ended December 31, 2011 of the Company and our report dated February 28, 2012 expressed an unqualified opinion on those financial statements and included an explanatory paragraph relating to the Company’s adoption of new accounting pronouncements in 2011 and 2010. /s/ Deloitte & Touche LLP Columbus, Ohio February 28, 2012
45
MANAGEMENT’S REPORT ON INTERNAL CONTROL OVER FINANCIAL REPORTING The management of American Electric Power Company, Inc. and subsidiary companies (AEP) is responsible for establishing and maintaining adequate internal control over financial reporting as such term is defined in Rule 13a- 15(f) and 15d-15(f) under the Securities Exchange Act of 1934, as amended. AEP’s internal control system was designed to provide reasonable assurance regarding the reliability of financial reporting and the preparation of financial statements for external purposes in accordance with generally accepted accounting principles. Because of its inherent limitations, internal control over financial reporting may not prevent or detect misstatements. Also, projections of any evaluation of effectiveness to future periods are subject to the risk that controls may become inadequate because of changes in conditions, or that the degree of compliance with the policies or procedures may deteriorate. Management assessed the effectiveness of AEP’s internal control over financial reporting as of December 31, 2011. In making this assessment, management used the criteria set forth by the Committee of Sponsoring Organizations of the Treadway Commission (COSO) in Internal Control – Integrated Framework. Based on management’s assessment, AEP’s internal control over financial reporting was effective as of December 31, 2011. AEP’s independent registered public accounting firm has issued an attestation report on AEP’s internal control over financial reporting. The Report of Independent Registered Public Accounting Firm appears on the previous page.

46
AMERICAN ELECTRIC POWER COMPANY, INC. AND SUBSIDIARY COMPANIES
CONSOLIDATED STATEMENTS OF INCOME For the Years Ended December 31, 2011, 2010 and 2009
(in millions, except per-share and share amounts)
2011 2010 2009
REVENUES
Utility Operations $ 14,091 $ 13,687 $ 12,733 Other Revenues 1,025 740 756
TOTAL REVENUES 15,116 14,427 13,489
EXPENSES
Fuel and Other Consumables Used for Electric Generation 4,421 4,029 3,478 Purchased Electricity for Resale 1,191 1,000 1,053 Other Operation 2,868 3,132 2,620 Maintenance 1,236 1,142 1,205 Asset Impairments and Other Related Charges 139 - - Depreciation and Amortization 1,655 1,641 1,597 Taxes Other Than Income Taxes 824 820 765
TOTAL EXPENSES 12,334 11,764 10,718
OPERATING INCOME 2,782 2,663 2,771 Other Income (Expense): Interest and Investment Income 27 38 11 Carrying Costs Income 393 70 47 Allowance for Equity Funds Used During Construction 98 77 82 Interest Expense (933) (999) (973)
INCOME BEFORE INCOME TAX EXPENSE AND EQUITY EARNINGS 2,367 1,849 1,938 Income Tax Expense 818 643 575 Equity Earnings of Unconsolidated Subsidiaries 27 12 7
INCOME BEFORE EXTRAORDINARY ITEMS 1,576 1,218 1,370 EXTRAORDINARY ITEMS, NET OF TAX 373 - (5)
NET INCOME 1,949 1,218 1,365 Net Income Attributable to Noncontrolling Interests 3 4 5
NET INCOME ATTRIBUTABLE TO AEP SHAREHOLDERS 1,946 1,214 1,360 Preferred Stock Dividend Requirements of Subsidiaries Including Capital Stock Expense 5 3 3
EARNINGS ATTRIBUTABLE TO AEP COMMON SHAREHOLDERS $ 1,941 $ 1,211 $ 1,357
WEIGHTED AVERAGE NUMBER OF BASIC AEP COMMON SHARES OUTSTANDING 482,169,282 479,373,306 458,677,534
BASIC EARNINGS (LOSS) PER SHARE ATTRIBUTABLE TO AEP COMMON SHAREHOLDERS
Income Before Extraordinary Items $ 3.25 $ 2.53 $ 2.97 Extraordinary Items, Net of Tax 0.77 - (0.01)
TOTAL BASIC EARNINGS PER SHARE ATTRIBUTABLE TO AEP COMMON SHAREHOLDERS $ 4.02 $ 2.53 $ 2.96
WEIGHTED AVERAGE NUMBER OF DILUTED AEP COMMON SHARES OUTSTANDING 482,460,328 479,601,442 458,982,292
DILUTED EARNINGS (LOSS) PER SHARE ATTRIBUTABLE TO AEP COMMON SHAREHOLDERS
Income Before Extraordinary Items $ 3.25 $ 2.53 $ 2.97 Extraordinary Items, Net of Tax 0.77 - (0.01)
TOTAL DILUTED EARNINGS PER SHARE ATTRIBUTABLE TO AEP COMMON SHAREHOLDERS $ 4.02 $ 2.53 $ 2.96
CASH DIVIDENDS DECLARED PER SHARE $ 1.85 $ 1.71 $ 1.64
See Notes to Consolidated Financial Statements beginning on page 52.

47
AMERICAN ELECTRIC POWER COMPANY, INC. AND SUBSIDIARY COMPANIES
CONSOLIDATED STATEMENTS OF COMPREHENSIVE INCOME (LOSS) For the Years Ended December 31, 2011, 2010 and 2009
(in millions)
2011 2010 2009
NET INCOME $ 1,949 $ 1,218 $ 1,365
OTHER COMPREHENSIVE INCOME (LOSS), NET OF TAXES
Cash Flow Hedges, Net of Tax of $18 in 2011, $14 in 2010 and $4 in 2009 (34) 26 7
Securities Available for Sale, Net of Tax of $1 in 2011, $4 in 2010 and $6 in 2009 (2) (8) 11
Reapplication of Regulated Operations Accounting Guidance for Pensions, Net of
Tax of $8 in 2009 - - 15
Amortization of Pension and OPEB Deferred Costs, Net of Tax of $13 in 2011,
$12 in 2010 and $13 in 2009 24 22 23
Pension and OPEB Funded Status, Net of Tax of $41 in 2011, $25 in 2010 and
$12 in 2009 (77) (47) 22
TOTAL OTHER COMPREHENSIVE INCOME (LOSS) (89) (7) 78
TOTAL COMPREHENSIVE INCOME 1,860 1,211 1,443
Total Comprehensive Income Attributable to Noncontrolling Interests 3 4 5
TOTAL COMPREHENSIVE INCOME ATTRIBUTABLE TO AEP
SHAREHOLDERS 1,857 1,207 1,438
Preferred Stock Dividend Requirements Including Capital Stock Expense 5 3 3
TOTAL COMPREHENSIVE INCOME ATTRIBUTABLE TO AEP
COMMON SHAREHOLDERS $ 1,852 $ 1,204 $ 1,435
See Notes to Consolidated Financial Statements beginning on page 52.

48
AMERICAN ELECTRIC POWER COMPANY, INC. AND SUBSIDIARY COMPANIES
CONSOLIDATED STATEMENTS OF CHANGES IN EQUITY
For the Years Ended December 31, 2011, 2010 and 2009
(in millions)
AEP Common Shareholders
Common Stock Accumulated
Other
Paid-in Retained Comprehensive Noncontrolling Shares Amount Capital Earnings Income (Loss) Interests Total
TOTAL EQUITY – DECEMBER 31, 2008 426 $ 2,771 $ 4,527 $ 3,847 $ (452) $ 17 $ 10,710
Issuance of Common Stock 72 468 1,311 1,779
Common Stock Dividends (753) (5) (758)
Preferred Stock Dividend Requirements of Subsidiaries (3) (3)
Purchase of JMG 37 (18) 19
Other Changes in Equity (51) 1 (50)
SUBTOTAL – EQUITY 11,697
NET INCOME 1,360 5 1,365
OTHER COMPREHENSIVE INCOME 78 78
TOTAL EQUITY – DECEMBER 31, 2009 498 3,239 5,824 4,451 (374) - 13,140
Issuance of Common Stock 3 18 75 93
Common Stock Dividends (820) (4) (824)
Preferred Stock Dividend Requirements of Subsidiaries (3) (3)
Other Changes in Equity 5 5
SUBTOTAL – EQUITY 12,411
NET INCOME 1,214 4 1,218
OTHER COMPREHENSIVE LOSS (7) (7)
TOTAL EQUITY – DECEMBER 31, 2010 501 3,257 5,904 4,842 (381) - 13,622
Issuance of Common Stock 3 17 75 92
Common Stock Dividends (894) (4) (898)
Preferred Stock Dividend Requirements of Subsidiaries (2) (2)
Loss on Reacquired Preferred Stock (4) (4)
Capital Stock Expense (16) (16)
Other Changes in Equity 11 (2) 2 11
SUBTOTAL – EQUITY 12,805
NET INCOME 1,946 3 1,949
OTHER COMPREHENSIVE LOSS (89) (89)
TOTAL EQUITY – DECEMBER 31, 2011 504 $ 3,274 $ 5,970 $ 5,890 $ (470) $ 1 $ 14,665
See Notes to Consolidated Financial Statements beginning on page 52.
49
AMERICAN ELECTRIC POWER COMPANY, INC. AND SUBSIDIARY COMPANIES
CONSOLIDATED BALANCE SHEETS
ASSETS
December 31, 2011 and 2010
(in millions) 2011 2010
CURRENT ASSETS
Cash and Cash Equivalents $ 221 $ 294 Other Temporary Investments
(December 31, 2011 and 2010 amounts include $281 and $287, respectively, related to Transition Funding and EIS) 294 416
Accounts Receivable:
Customers 690 683
Accrued Unbilled Revenues 106 195
Pledged Accounts Receivable - AEP Credit 920 949
Miscellaneous 150 137
Allowance for Uncollectible Accounts (32) (41)
Total Accounts Receivable 1,834 1,923
Fuel 657 837 Materials and Supplies 635 611 Risk Management Assets 193 232 Accrued Tax Benefits 51 389 Regulatory Asset for Under-Recovered Fuel Costs 65 81 Margin Deposits 67 88 Prepayments and Other Current Assets 165 145
TOTAL CURRENT ASSETS 4,182 5,016
PROPERTY, PLANT AND EQUIPMENT
Electric:
Generation 24,938 24,352
Transmission 9,048 8,576
Distribution 14,783 14,208 Other Property, Plant and Equipment (including nuclear fuel and coal mining) 3,780 3,846 Construction Work in Progress 3,121 2,758
Total Property, Plant and Equipment 55,670 53,740 Accumulated Depreciation and Amortization 18,699 18,066
TOTAL PROPERTY, PLANT AND EQUIPMENT - NET 36,971 35,674
OTHER NONCURRENT ASSETS
Regulatory Assets 6,026 4,943 Securitized Transition Assets 1,627 1,742 Spent Nuclear Fuel and Decommissioning Trusts 1,592 1,515 Goodwill 76 76 Long-term Risk Management Assets 403 410 Deferred Charges and Other Noncurrent Assets 1,346 1,079
TOTAL OTHER NONCURRENT ASSETS 11,070 9,765
TOTAL ASSETS $ 52,223 $ 50,455
See Notes to Consolidated Financial Statements beginning on page 52.

50
AMERICAN ELECTRIC POWER COMPANY, INC. AND SUBSIDIARY COMPANIES
CONSOLIDATED BALANCE SHEETS
LIABILITIES AND EQUITY
December 31, 2011 and 2010
(dollars in millions) 2011 2010
CURRENT LIABILITIES
Accounts Payable $ 1,095 $ 1,061 Short-term Debt:
Securitized Debt for Receivables - AEP Credit 666 690
Other Short-term Debt 984 656
Total Short-term Debt 1,650 1,346
Long-term Debt Due Within One Year
(December 31, 2011 and 2010 amounts include $293 and $237, respectively, related to Transition Funding, DCC Fuel and Sabine) 1,433 1,309
Risk Management Liabilities 150 129 Customer Deposits 289 273 Accrued Taxes 717 702 Accrued Interest 279 281 Regulatory Liability for Over-Recovered Fuel Costs 8 17 Deferred Gain and Accrued Litigation Costs - 448 Other Current Liabilities 990 952
TOTAL CURRENT LIABILITIES 6,611 6,518
NONCURRENT LIABILITIES
Long-term Debt
(December 31, 2011 and 2010 amounts include $1,674 and $1,857, respectively, related to Transition Funding, DCC Fuel and Sabine) 15,083 15,502
Long-term Risk Management Liabilities 195 141 Deferred Income Taxes 8,227 7,359 Regulatory Liabilities and Deferred Investment Tax Credits 3,195 3,171 Asset Retirement Obligations 1,472 1,394 Employee Benefits and Pension Obligations 1,801 1,893 Deferred Credits and Other Noncurrent Liabilities 974 795
TOTAL NONCURRENT LIABILITIES 30,947 30,255
TOTAL LIABILITIES 37,558 36,773
Cumulative Preferred Stock Not Subject to Mandatory Redemption - 60
Rate Matters (Note 3) Commitments and Contingencies (Note 5) EQUITY
Common Stock – Par Value – $6.50 Per Share:
2011 2010
Shares Authorized 600,000,000 600,000,000
Shares Issued 503,759,460 501,114,881
(20,336,592 shares and 20,307,725 shares were held in treasury at December 31, 2011 and
2010, respectively) 3,274 3,257 Paid-in Capital 5,970 5,904 Retained Earnings 5,890 4,842 Accumulated Other Comprehensive Income (Loss) (470) (381)
TOTAL AEP COMMON SHAREHOLDERS’ EQUITY 14,664 13,622
Noncontrolling Interests 1 -
TOTAL EQUITY 14,665 13,622
TOTAL LIABILITIES AND EQUITY $ 52,223 $ 50,455
See Notes to Consolidated Financial Statements beginning on page 52.

51
AMERICAN ELECTRIC POWER COMPANY, INC. AND SUBSIDIARY COMPANIES
CONSOLIDATED STATEMENTS OF CASH FLOWS
For the Years Ended December 31, 2011, 2010 and 2009
(in millions)
2011 2010 2009
OPERATING ACTIVITIES
Net Income $ 1,949 $ 1,218 $ 1,365 Adjustments to Reconcile Net Income to Net Cash Flows from Operating Activities: Depreciation and Amortization 1,655 1,641 1,597 Deferred Income Taxes 794 809 1,244 Gain on Settlement with BOA and Enron (51) - - Settlement of Litigation with BOA and Enron (211) - - Extraordinary Items, Net of Tax (373) - 5 Asset Impairments and Other Related Charges 139 - - Carrying Costs Income (393) (70) (47) Allowance for Equity Funds Used During Construction (98) (77) (82) Mark-to-Market of Risk Management Contracts 37 30 (59) Amortization of Nuclear Fuel 137 139 63 Pension Contributions to Qualified Plan Trust (450) (500) - Property Taxes (15) (21) (17) Fuel Over/Under-Recovery, Net (25) (253) (474) Change in Other Noncurrent Assets (112) (89) (152) Change in Other Noncurrent Liabilities 307 202 244 Changes in Certain Components of Working Capital: Accounts Receivable, Net 107 (866) 41 Fuel, Materials and Supplies 176 221 (475) Accounts Payable (44) (36) 8 Accrued Taxes, Net 193 179 (470) Other Current Assets 37 73 (73) Other Current Liabilities 29 62 (243)
Net Cash Flows from Operating Activities 3,788 2,662 2,475
INVESTING ACTIVITIES
Construction Expenditures (2,669) (2,345) (2,792) Change in Other Temporary Investments, Net 8 (4) 16 Purchases of Investment Securities (1,321) (1,918) (853) Sales of Investment Securities 1,379 1,817 748 Acquisitions of Nuclear Fuel (106) (91) (169) Acquisitions of Assets (19) (155) (104) Acquisition of Cushion Gas from BOA (214) - - Proceeds from Sales of Assets 123 187 278 Other Investing Activities (71) (14) (40)
Net Cash Flows Used for Investing Activities (2,890) (2,523) (2,916)
FINANCING ACTIVITIES
Issuance of Common Stock, Net 92 93 1,728 Issuance of Long-term Debt 1,328 1,270 2,306 Commercial Paper and Credit Facility Borrowings 488 565 127 Change in Short-term Debt, Net 744 770 119 Retirement of Long-term Debt (1,665) (1,993) (816) Retirement of Cumulative Preferred Stock (64) - - Commercial Paper and Credit Facility Repayments (928) (115) (2,096) Principal Payments for Capital Lease Obligations (71) (95) (82) Dividends Paid on Common Stock (898) (824) (758) Dividends Paid on Cumulative Preferred Stock (2) (3) (3) Other Financing Activities 5 (3) (5)
Net Cash Flows from (Used for) Financing Activities (971) (335) 520
Net Increase (Decrease) in Cash and Cash Equivalents (73) (196) 79 Cash and Cash Equivalents at Beginning of Period 294 490 411
Cash and Cash Equivalents at End of Period $ 221 $ 294 $ 490
See Notes to Consolidated Financial Statements beginning on page 52.

52
AMERICAN ELECTRIC POWER COMPANY, INC. AND SUBSIDIARY COMPANIES INDEX OF NOTES TO CONSOLIDATED FINANCIAL STATEMENTS
1. Organization and Summary of Significant Accounting Policies
2. New Accounting Pronouncements and Extraordinary Items
3. Rate Matters
4. Effects of Regulation
5. Commitments, Guarantees and Contingencies
6. Acquisitions, Dispositions and Impairments
7. Benefit Plans
8. Business Segments
9. Derivatives and Hedging
10. Fair Value Measurements
11. Income Taxes
12. Leases
13. Financing Activities
14. Stock-Based Compensation
15. Property, Plant and Equipment
16. Cost Reduction Initiatives
17. Unaudited Quarterly Financial Information
18. Goodwill and Other Intangible Assets

53
AMERICAN ELECTRIC POWER COMPANY, INC. AND SUBSIDIARY COMPANIES NOTES TO CONSOLIDATED FINANCIAL STATEMENTS
1. ORGANIZATION AND SUMMARY OF SIGNIFICANT ACCOUNTING POLICIES ORGANIZATION The principal business conducted by six of our electric utility operating companies is the generation, transmission and distribution of electric power. KGPCo, TCC and WPCo provide only transmission and distribution services. TNC engages in the transmission and distribution of electric power and is a part owner of the Oklaunion Plant operated by PSO. TNC leases its entire portion of the output of the plant through 2027 to a nonutility affiliate. AEGCo, a regulated electricity generation company, provides power to three of our regulated electric utility operating companies. These companies are subject to regulation by the FERC under the Federal Power Act and the Energy Policy Act of 2005. These companies maintain accounts in accordance with the FERC and other regulatory guidelines. These companies are subject to further regulation with regard to rates and other matters by state regulatory commissions. Seven wholly-owned transmission companies and several joint ventures have been approved by the FERC for our new transmission investments. These companies are subject to regulation by the FERC and maintain their accounts accordingly. We also engage in wholesale electricity, natural gas and other commodity marketing and risk management activities in the United States. In addition, our operations include nonregulated wind farms and barging operations and we provide various energy-related services.
CSPCo-OPCo Merger On December 31, 2011, CSPCo merged into OPCo with OPCo being the surviving entity. All prior disclosed amounts have been recast as if the merger occurred on the first day of the earliest reporting period. All contracts and operations of CSPCo and its subsidiary are now part of OPCo. The merger had no impact on our prior reported net income, cash flow or financial condition. SUMMARY OF SIGNIFICANT ACCOUNTING POLICIES
Rates and Service Regulation Our public utility subsidiaries’ rates are regulated by the FERC and state regulatory commissions in our eleven state operating territories. The FERC also regulates our affiliated transactions, including AEPSC intercompany service billings which are generally at cost, under the 2005 Public Utility Holding Company Act and the Federal Power Act. The FERC also has jurisdiction over the issuances and acquisitions of securities of our public utility subsidiaries, the acquisition or sale of certain utility assets and mergers with another electric utility or holding company. For non-power goods and services, the FERC requires that a nonregulated affiliate can bill an affiliated public utility company no more than market while a public utility must bill the higher of cost or market to a nonregulated affiliate. The state regulatory commissions also regulate certain intercompany transactions under various orders and affiliate statutes. Both the FERC and state regulatory commissions are permitted to review and audit the relevant books and records of companies within a public utility holding company system. The FERC regulates wholesale power markets and wholesale power transactions. Our wholesale power transactions are generally market-based. Wholesale power transactions are cost-based regulated when we negotiate and file a cost-based contract with the FERC or the FERC determines that we have “market power” in the region where the transaction occurs. We have entered into wholesale power supply contracts with various municipalities and cooperatives that are FERC-regulated, cost-based contracts. These contracts are generally formula rate mechanisms, which are trued up to actual costs annually. Our wholesale power transactions in the SPP region are cost-based due to PSO and SWEPCo having market power in the SPP region.

54
The state regulatory commissions regulate all of the distribution operations and rates of our retail public utilities on a cost basis. The state regulatory commissions also regulate the retail generation/power supply operations and rates except in Ohio and the ERCOT region of Texas. The ESP rates in Ohio continue the process of aligning generation/power supply rates over time with market rates. In the ERCOT region of Texas, the generation/supply business is under customer choice and market pricing and is conducted by Texas Retail Electric Providers (REPs). Through our nonregulated subsidiaries, we enter into short and long-term wholesale transactions to buy or sell capacity, energy and ancillary services in the ERCOT market. In addition, these nonregulated subsidiaries control certain wind and coal-fired generation assets, the power from which is marketed and sold in ERCOT. Effective November 2009, we had no active REPs in ERCOT. SWEPCo operates in the SPP area which includes a portion of Texas. In 2009, the Texas legislature amended its restructuring legislation for the generation portion of SWEPCo’s Texas retail jurisdiction to delay indefinitely restructuring requirements. As a result, SWEPCo reapplied accounting guidance for “Regulated Operations” to its Texas generation operations. The FERC also regulates our wholesale transmission operations and rates. The FERC claims jurisdiction over retail transmission rates when retail rates are unbundled in connection with restructuring. OPCo’s retail transmission rates in Ohio, APCo’s retail transmission rates in Virginia, I&M’s retail transmission rates in Michigan and TCC’s and TNC’s retail transmission rates in Texas are unbundled. OPCo’s retail transmission rates in Ohio, APCo’s retail transmission rates in Virginia and I&M’s retail transmission rates in Michigan are based on the FERC’s Open Access Transmission Tariff (OATT) rates that are cost-based. Although TCC’s and TNC’s retail transmission rates in Texas are unbundled, retail transmission rates are regulated, on a cost basis, by the PUCT. Bundled retail transmission rates are regulated, on a cost basis, by the state commissions. In addition, the FERC regulates the SIA, the Interconnection Agreement, the CSW Operating Agreement, the System Transmission Integration Agreement, the Transmission Agreement, the Transmission Coordination Agreement and the AEP System Interim Allowance Agreement, all of which allocate shared system costs and revenues to the utility subsidiaries that are parties to each agreement. Principles of Consolidation Our consolidated financial statements include our wholly-owned and majority-owned subsidiaries and variable interest entities (VIEs) of which we are the primary beneficiary. Intercompany items are eliminated in consolidation. We use the equity method of accounting for equity investments where we exercise significant influence but do not hold a controlling financial interest. Such investments are recorded as Deferred Charges and Other Noncurrent Assets on our balance sheets; equity earnings are included in Equity Earnings of Unconsolidated Subsidiaries on our statements of income. We have ownership interests in generating units that are jointly-owned with nonaffiliated companies. Our proportionate share of the operating costs associated with such facilities is included on our statements of income and our proportionate share of the assets and liabilities are reflected on our balance sheets. Variable Interest Entities The accounting guidance for “Variable Interest Entities” is a consolidation model that considers if a company has a controlling financial interest in a VIE. A controlling financial interest will have both (a) the power to direct the activities of a VIE that most significantly impact the VIE’s economic performance and (b) the obligation to absorb losses of the VIE that could potentially be significant to the VIE or the right to receive benefits from the VIE that could potentially be significant to the VIE. Entities are required to consolidate a VIE when it is determined that they have a controlling financial interest in a VIE and therefore, are the primary beneficiary of that VIE, as defined by the accounting guidance for “Variable Interest Entities.” In determining whether we are the primary beneficiary of a VIE, we consider factors such as equity at risk, the amount of the VIE’s variability we absorb, guarantees of indebtedness, voting rights including kick-out rights, the power to direct the VIE, variable interests held by related parties and other factors. We believe that significant assumptions and judgments were applied consistently. We are the primary beneficiary of Sabine, DCC Fuel, AEP Credit, Transition Funding and a protected cell of EIS. In addition, we have not provided material financial or other support to Sabine, DCC Fuel, Transition Funding, our protected cell of EIS and AEP Credit that was not previously contractually required. We hold a significant variable interest in DHLC and Potomac-Appalachian Transmission Highline, LLC West Virginia Series (West Virginia Series).

55
Sabine is a mining operator providing mining services to SWEPCo. SWEPCo has no equity investment in Sabine but is Sabine’s only customer. SWEPCo guarantees the debt obligations and lease obligations of Sabine. Under the terms of the note agreements, substantially all assets are pledged and all rights under the lignite mining agreement are assigned to SWEPCo. The creditors of Sabine have no recourse to any AEP entity other than SWEPCo. Under the provisions of the mining agreement, SWEPCo is required to pay, as a part of the cost of lignite delivered, an amount equal to mining costs plus a management fee. In addition, SWEPCo determines how much coal will be mined each year. Based on these facts, management concluded that SWEPCo is the primary beneficiary and is required to consolidate Sabine. SWEPCo’s total billings from Sabine for the years ended December 31, 2011, 2010 and 2009 were $128 million, $133 million and $99 million, respectively. See the tables below for the classification of Sabine’s assets and liabilities on our balance sheets. Our subsidiaries participate in one protected cell of EIS for approximately ten lines of insurance. EIS has multiple protected cells. Neither AEP nor its subsidiaries have an equity investment in EIS. The AEP System is essentially this EIS cell’s only participant, but allows certain third parties access to this insurance. Our subsidiaries and any allowed third parties share in the insurance coverage, premiums and risk of loss from claims. Based on our control and the structure of the protected cell and EIS, management concluded that we are the primary beneficiary of the protected cell and are required to consolidate its assets and liabilities. Our insurance premium expense to the protected cell for the years ended December 31, 2011, 2010 and 2009 were $48 million, $35 million and $30 million, respectively. See the tables below for the classification of the protected cell’s assets and liabilities on our balance sheets. The amount reported as equity is the protected cell’s policy holders’ surplus. I&M has nuclear fuel lease agreements with DCC Fuel LLC, DCC Fuel II LLC, DCC Fuel III LLC and DCC IV LLC (collectively DCC Fuel). DCC Fuel was formed for the purpose of acquiring, owning and leasing nuclear fuel to I&M. DCC Fuel purchased the nuclear fuel from I&M with funds received from the issuance of notes to financial institutions. Each entity is a single-lessee leasing arrangement with only one asset and is capitalized with all debt. DCC Fuel LLC, DCC Fuel II LLC, DCC Fuel III LLC and DCC Fuel IV LLC are separate legal entities from I&M, the assets of which are not available to satisfy the debts of I&M. Payments on the DCC Fuel LLC and DCC Fuel II LLC leases are made semi-annually and began in April 2010 and October 2010, respectively. Payments on the DCC Fuel III LLC lease are made monthly and began in January 2011. Payments on the DCC Fuel IV LLC lease are made quarterly and began in February 2012. Payments on the leases for the years ended December 31, 2011 and 2010 were $85 million and $59 million, respectively. No payments were made to DCC Fuel in 2009. The leases were recorded as capital leases on I&M’s balance sheet as title to the nuclear fuel transfers to I&M at the end of the 48, 54, 54 and 54 month lease term, respectively. Based on our control of DCC Fuel, management concluded that I&M is the primary beneficiary and is required to consolidate DCC Fuel. The capital leases are eliminated upon consolidation. See the tables below for the classification of DCC Fuel’s assets and liabilities on our balance sheets. AEP Credit is a wholly-owned subsidiary of AEP. AEP Credit purchases, without recourse, accounts receivable from certain utility subsidiaries of AEP to reduce working capital requirements. AEP provides a minimum of 5% equity and up to 20% of AEP Credit’s short-term borrowing needs in excess of third party financings. Any third party financing of AEP Credit only has recourse to the receivables securitized for such financing. Based on our control of AEP Credit, management has concluded that we are the primary beneficiary and are required to consolidate its assets and liabilities. See the tables below for the classification of AEP Credit’s assets and liabilities on our balance sheets. See “Securitized Accounts Receivables – AEP Credit” section of Note 13.

56
Transition Funding was formed for the sole purpose of issuing and servicing securitization bonds related to Texas restructuring law. Management has concluded that TCC is the primary beneficiary of Transition Funding because TCC has the power to direct the most significant activities of the VIE and TCC’s equity interest could potentially be significant. Therefore, TCC is required to consolidate Transition Funding. The securitized bonds totaled $1.7 billion and $1.8 billion at December 31, 2011 and 2010, respectively, and are included in current and long-term debt on the balance sheets. Transition Funding has securitized transition assets of $1.6 billion and $1.7 billion at December 31, 2011 and 2010, respectively, which are presented separately on the face of the balance sheets. The securitized transition assets represent the right to impose and collect Texas true-up costs from customers receiving electric transmission or distribution service from TCC under recovery mechanisms approved by the PUCT. The securitization bonds are payable only from and secured by the securitized transition assets. The bondholders have no recourse to TCC or any other AEP entity. TCC acts as the servicer for Transition Funding’s securitized transition assets and remits all related amounts collected from customers to Transition Funding for interest and principal payments on the securitization bonds and related costs. See the tables below for the classification of Transition Funding’s assets and liabilities on our balance sheets. The balances below represent the assets and liabilities of the VIEs that are consolidated. These balances include intercompany transactions that are eliminated upon consolidation. AMERICAN ELECTRIC POWER COMPANY, INC. AND SUBSIDIARY COMPANIES VARIABLE INTEREST ENTITIES December 31, 2011 (in millions) TCC SWEPCo I&M Protected Cell Transition
Sabine DCC Fuel of EIS AEP Credit Funding
ASSETS
Current Assets $ 48 $ 118 $ 121 $ 910 $ 220
Net Property, Plant and Equipment 154 188 - - -
Other Noncurrent Assets 42 118 6 1 1,580
Total Assets $ 244 $ 424 $ 127 $ 911 $ 1,800
LIABILITIES AND EQUITY
Current Liabilities $ 68 $ 103 $ 40 $ 864 $ 229
Noncurrent Liabilities 176 321 71 1 1,557
Equity - - 16 46 14
Total Liabilities and Equity $ 244 $ 424 $ 127 $ 911 $ 1,800
AMERICAN ELECTRIC POWER COMPANY, INC. AND SUBSIDIARY COMPANIES VARIABLE INTEREST ENTITIES December 31, 2010 (in millions)
TCC SWEPCo I&M Protected Cell Transition
Sabine DCC Fuel of EIS AEP Credit Funding
ASSETS
Current Assets $ 50 $ 92 $ 131 $ 924 $ 214
Net Property, Plant and Equipment 139 173 - - -
Other Noncurrent Assets 34 112 1 10 1,746
Total Assets $ 223 $ 377 $ 132 $ 934 $ 1,960
LIABILITIES AND EQUITY
Current Liabilities $ 33 $ 79 $ 33 $ 886 $ 221
Noncurrent Liabilities 190 298 85 1 1,725
Equity - - 14 47 14
Total Liabilities and Equity $ 223 $ 377 $ 132 $ 934 $ 1,960

57
DHLC is a mining operator that sells 50% of the lignite produced to SWEPCo and 50% to CLECO. SWEPCo and CLECO share the executive board seats and voting rights equally. Each entity guarantees 50% of DHLC’s debt. SWEPCo and CLECO equally approve DHLC’s annual budget. The creditors of DHLC have no recourse to any AEP entity other than SWEPCo. As SWEPCo is the sole equity owner of DHLC, it receives 100% of the management fee. SWEPCo’s total billings from DHLC for the years ended December 31, 2011, 2010 and 2009 were $62 million, $56 million and $43 million, respectively. We are not required to consolidate DHLC as we are not the primary beneficiary, although we hold a significant variable interest in DHLC. Our equity investment in DHLC is included in Deferred Charges and Other Noncurrent Assets on our balance sheets. Our investment in DHLC was: December 31, 2011 2010
As Reported on Maximum As Reported on Maximum the Balance Sheet Exposure the Balance Sheet Exposure
(in millions) Capital Contribution from SWEPCo $ 8 $ 8 $ 6 $ 6 Retained Earnings 1 1 2 2 SWEPCo's Guarantee of Debt - 52 - 48
Total Investment in DHLC $ 9 $ 61 $ 8 $ 56
We and FirstEnergy Corp. (FirstEnergy) have a joint venture in Potomac-Appalachian Transmission Highline, LLC (PATH). In February 2011, PJM directed that work on the PATH project be suspended. PATH is a series limited liability company and was created to construct, through its operating companies, a high-voltage transmission line project in the PJM region. PATH consists of the “West Virginia Series (PATH-WV),” owned equally by subsidiaries of FirstEnergy and AEP, and the “Allegheny Series” which is 100% owned by a subsidiary of FirstEnergy. Provisions exist within the PATH-WV agreement that make it a VIE. The “Allegheny Series” is not considered a VIE. We are not required to consolidate PATH-WV as we are not the primary beneficiary, although we hold a significant variable interest in PATH-WV. Our equity investment in PATH-WV is included in Deferred Charges and Other Noncurrent Assets on our balance sheets. We and FirstEnergy share the returns and losses equally in PATH-WV. Our subsidiaries and FirstEnergy’s subsidiaries provide services to the PATH companies through service agreements. As of December 31, 2011, PATH-WV had no debt outstanding. However, when debt is issued, the debt to equity ratio in each series should be consistent with other regulated utilities. The entities recover costs through regulated rates. Given the structure of the entity, we may be required to provide future financial support to PATH-WV in the form of a capital call. This would be considered an increase to our investment in the entity. Our maximum exposure to loss is to the extent of our investment. The likelihood of such a loss is remote since the FERC approved PATH-WV’s request for regulatory recovery of cost and a return on the equity invested. Our investment in PATH-WV was:
December 31, 2011 2010
As Reported on Maximum As Reported on Maximum the Balance Sheet Exposure the Balance Sheet Exposure
(in millions) Capital Contribution from AEP $ 19 $ 19 $ 18 $ 18 Retained Earnings 10 10 6 6
Total Investment in PATH-WV $ 29 $ 29 $ 24 $ 24

58
Accounting for the Effects of Cost-Based Regulation As the owner of rate-regulated electric public utility companies, our financial statements reflect the actions of regulators that result in the recognition of certain revenues and expenses in different time periods than enterprises that are not rate-regulated. In accordance with accounting guidance for “Regulated Operations,” we record regulatory assets (deferred expenses) and regulatory liabilities (future revenue reductions or refunds) to reflect the economic effects of regulation by matching expenses with their recovery through regulated revenues and income with its passage to customers through the reduction of regulated revenues. Due to the passage of legislation requiring restructuring and a transition to customer choice and market-based rates, we discontinued the application of “Regulated Operations” accounting treatment for the generation portion of our business in Ohio for OPCo and in Texas for TNC. In 2009, the Texas legislature amended its restructuring legislation for the generation portion of SWEPCo’s Texas retail jurisdiction to delay indefinitely restructuring requirements. As a result, SWEPCo reapplied accounting guidance for “Regulated Operations” to its Texas generation operations. Accounting guidance for “Discontinuation of Rate-Regulated Operations” requires the recognition of an impairment of stranded net regulatory assets and stranded plant costs if they are not recoverable in regulated rates. In addition, an enterprise is required to eliminate from its balance sheet the effects of any actions of regulators that had been recognized as regulatory assets and regulatory liabilities. Such impairments and adjustments are classified as an extraordinary item. Use of Estimates The preparation of these financial statements in conformity with GAAP requires management to make estimates and assumptions that affect the amounts reported in the financial statements and accompanying notes. These estimates include, but are not limited to, inventory valuation, allowance for doubtful accounts, goodwill, intangible and long-lived asset impairment, unbilled electricity revenue, valuation of long-term energy contracts, the effects of regulation, long-lived asset recovery, storm costs, the effects of contingencies and certain assumptions made in accounting for pension and postretirement benefits. The estimates and assumptions used are based upon management’s evaluation of the relevant facts and circumstances as of the date of the financial statements. Actual results could ultimately differ from those estimates. Cash and Cash Equivalents Cash and Cash Equivalents include temporary cash investments with original maturities of three months or less.
Other Temporary Investments Other Temporary Investments include funds held by trustees primarily for the payment of securitization bonds, marketable securities that we intend to hold for less than one year and investments by our protected cell of EIS. We classify our investments in marketable securities as available-for-sale or held-to-maturity in accordance with the provisions of “Investments – Debt and Equity Securities” accounting guidance. We do not have any investments classified as trading. Available-for-sale securities reflected in Other Temporary Investments are carried at fair value with the unrealized gain or loss, net of tax, reported in AOCI. Held-to-maturity securities reflected in Other Temporary Investments are carried at amortized cost. The cost of securities sold is based on the specific identification or weighted average cost method. In evaluating potential impairment of securities with unrealized losses, we considered, among other criteria, the current fair value compared to cost, the length of time the security's fair value has been below cost, our intent and ability to retain the investment for a period of time sufficient to allow for any anticipated recovery in value and current economic conditions. See “Fair Value Measurements of Other Temporary Investments” in Note 10.

59
Inventory
Fossil fuel inventories are generally carried at average cost. Materials and supplies inventories are carried at average cost. Accounts Receivable Customer accounts receivable primarily include receivables from wholesale and retail energy customers, receivables from energy contract counterparties related to our risk management activities and customer receivables primarily related to other revenue-generating activities. We recognize revenue from electric power sales when we deliver power to our customers. To the extent that deliveries have occurred but a bill has not been issued, we accrue and recognize, as Accrued Unbilled Revenues on our balance sheets, an estimate of the revenues for energy delivered since the last billing. AEP Credit factors accounts receivable on a daily basis, excluding receivables from risk management activities, for I&M, KGPCo, KPCo, OPCo, PSO, SWEPCo and a portion of APCo. Since APCo does not have regulatory authority to sell accounts receivable in its West Virginia regulatory jurisdiction, only a portion of APCo’s accounts receivable are sold to AEP Credit. AEP Credit has a receivables securitization agreement with bank conduits. Under the securitization agreement, AEP Credit receives financing from the bank conduits for the interest in the billed and unbilled receivables AEP Credit acquires from affiliated utility subsidiaries. Allowance for Uncollectible Accounts Generally, AEP Credit records bad debt expense based upon a 12-month rolling average of bad debt write-offs in proportion to gross accounts receivable purchased from participating AEP subsidiaries. For receivables related to APCo’s West Virginia operations, the bad debt reserve is calculated based on a rolling two-year average write-off in proportion to gross accounts receivable. For customer accounts receivables related to our risk management activities, accounts receivables are reviewed for bad debt reserves at a specific counterparty level basis. For the wires business of TCC and TNC, bad debt reserves are calculated using the specific identification of receivable balances greater than 120 days delinquent, and for those balances less than 120 days where the collection is doubtful. For miscellaneous accounts receivable, bad debt expense is recorded for all amounts outstanding 180 days or greater at 100%, unless specifically identified. Miscellaneous accounts receivable items open less than 180 days may be reserved using specific identification for bad debt reserves. Emission Allowances In regulated jurisdictions, we record emission allowances at cost, including the annual SO2 and NOx emission allowance entitlements received at no cost from the Federal EPA. In Ohio, we record allowances at the lower of cost or market for the period after our FAC expires in May 2015. We follow the inventory model for these allowances. We record allowances expected to be consumed within one year in Materials and Supplies and allowances with expected consumption beyond one year in Deferred Charges and Other Noncurrent Assets on our balance sheets. We record the consumption of allowances in the production of energy in Fuel and Other Consumables Used for Electric Generation on our statements of income at an average cost. We record allowances held for speculation in Prepayments and Other Current Assets on our balance sheets. We report the purchases and sales of allowances in the Operating Activities section of the statements of cash flows. We record the net margin on sales of emission allowances in Utility Operations Revenue on our statements of income because of its integral nature to the production process of energy and our revenue optimization strategy for our utility operations. The net margin on sales of emission allowances affects the determination of deferred fuel or deferred emission allowance costs and the amortization of regulatory assets for certain jurisdictions.

60
Property, Plant and Equipment and Equity Investments Regulated
Electric utility property, plant and equipment for our rate-regulated operations are stated at original purchase cost. Additions, major replacements and betterments are added to the plant accounts. Normal and routine retirements from the plant accounts, net of salvage, are charged to accumulated depreciation under the group composite method of depreciation. The group composite method of depreciation assumes that on average, asset components are retired at the end of their useful lives and thus there is no gain or loss. The equipment in each primary electric plant account is identified as a separate group. Under the group composite method of depreciation, continuous interim routine replacements of items such as boiler tubes, pumps, motors, etc. result in the original cost, less salvage, being charged to accumulated depreciation. The depreciation rates that are established take into account the past history of interim capital replacements and the amount of salvage received. These rates and the related lives are subject to periodic review. Removal costs are charged to regulatory liabilities. The costs of labor, materials and overhead incurred to operate and maintain our plants are included in operating expenses. Long-lived assets are required to be tested for impairment when it is determined that the carrying value of the assets may no longer be recoverable or when the assets meet the held-for-sale criteria under the accounting guidance for “Impairment or Disposal of Long-Lived Assets.” When it becomes probable that an asset in service or an asset under construction will be abandoned and regulatory cost recovery has been disallowed, the cost of that asset shall be removed from plant-in-service or CWIP and charged to expense. Equity investments are required to be tested for impairment when it is determined there may be an other-than-temporary loss in value. The fair value of an asset or investment is the amount at which that asset or investment could be bought or sold in a current transaction between willing parties, as opposed to a forced or liquidation sale. Quoted market prices in active markets are the best evidence of fair value and are used as the basis for the measurement, if available. In the absence of quoted prices for identical or similar assets or investments in active markets, fair value is estimated using various internal and external valuation methods including cash flow analysis and appraisals. Nonregulated
Our nonregulated operations generally follow the policies of our cost-based rate-regulated operations listed above but with the following exceptions. Property, plant and equipment of nonregulated operations and equity investments (included in Deferred Charges and Other Noncurrent Assets) are stated at fair value at acquisition (or as adjusted for any applicable impairments) plus the original cost of property acquired or constructed since the acquisition, less disposals. Normal and routine retirements from the plant accounts, net of salvage, are charged to accumulated depreciation for most nonregulated operations under the group composite method of depreciation. For nonregulated plant assets, a gain or loss would be recorded if the retirement is not considered an interim routine replacement. Removal costs are charged to expense. Allowance for Funds Used During Construction (AFUDC) and Interest Capitalization AFUDC represents the estimated cost of borrowed and equity funds used to finance construction projects that is capitalized and recovered through depreciation over the service life of regulated electric utility plant. For nonregulated operations, including generating assets owned by OPCo and certain generating assets in Texas, interest is capitalized during construction in accordance with the accounting guidance for “Capitalization of Interest”. We record the equity component of AFUDC in Allowance for Equity Funds Used During Construction and the debt component of AFUDC as a reduction to Interest Expense. Valuation of Nonderivative Financial Instruments
The book values of Cash and Cash Equivalents, Accounts Receivable, Short-term Debt and Accounts Payable approximate fair value because of the short-term maturity of these instruments. The book value of the pre-April 1983 spent nuclear fuel disposal liability approximates the best estimate of its fair value.

61
Fair Value Measurements of Assets and Liabilities
The accounting guidance for “Fair Value Measurements and Disclosures” establishes a fair value hierarchy that prioritizes the inputs used to measure fair value. The hierarchy gives the highest priority to unadjusted quoted prices in active markets for identical assets or liabilities (Level 1 measurement) and the lowest priority to unobservable inputs (Level 3 measurement). Where observable inputs are available for substantially the full term of the asset or liability, the instrument is categorized in Level 2. When quoted market prices are not available, pricing may be completed using comparable securities, dealer values, operating data and general market conditions to determine fair value. Valuation models utilize various inputs such as commodity, interest rate and, to a lesser degree, volatility and credit that include quoted prices for similar assets or liabilities in active markets, quoted prices for identical or similar assets or liabilities in inactive markets, market corroborated inputs (i.e. inputs derived principally from, or correlated to, observable market data) and other observable inputs for the asset or liability. For our commercial activities, exchange traded derivatives, namely futures contracts, are generally fair valued based on unadjusted quoted prices in active markets and are classified as Level 1. Level 2 inputs primarily consist of OTC broker quotes in moderately active or less active markets, as well as exchange traded contracts where there is insufficient market liquidity to warrant inclusion in Level 1. We verify our price curves using these broker quotes and classify these fair values within Level 2 when substantially all of the fair value can be corroborated. We typically obtain multiple broker quotes, which are non-binding in nature, but are based on recent trades in the marketplace. When multiple broker quotes are obtained, we average the quoted bid and ask prices. In certain circumstances, we may discard a broker quote if it is a clear outlier. We use a historical correlation analysis between the broker quoted location and the illiquid locations and if the points are highly correlated we include these locations within Level 2 as well. Certain OTC and bilaterally executed derivative instruments are executed in less active markets with a lower availability of pricing information. Long-dated and illiquid complex or structured transactions and FTRs can introduce the need for internally developed modeling inputs based upon extrapolations and assumptions of observable market data to estimate fair value. When such inputs have a significant impact on the measurement of fair value, the instrument is categorized as Level 3. We utilize our trustee’s external pricing service in our estimate of the fair value of the underlying investments held in the benefit plan and nuclear trusts. Our investment managers review and validate the prices utilized by the trustee to determine fair value. We perform our own valuation testing to verify the fair values of the securities. We receive audit reports of our trustee’s operating controls and valuation processes. The trustee uses multiple pricing vendors for the assets held in the trusts. Assets in the benefits and nuclear trusts, Cash and Cash Equivalents and Other Temporary Investments are classified using the following methods. Equities are classified as Level 1 holdings if they are actively traded on exchanges. Items classified as Level 1 are investments in money market funds, fixed income and equity mutual funds and domestic equity securities. They are valued based on observable inputs primarily unadjusted quoted prices in active markets for identical assets. Items classified as Level 2 are primarily investments in individual fixed income securities and cash equivalents funds. Fixed income securities do not trade on an exchange and do not have an official closing price but their valuation inputs are based on observable market data. Pricing vendors calculate bond valuations using financial models and matrices. The models use observable inputs including yields on benchmark securities, quotes by securities brokers, rating agency actions, discounts or premiums on securities compared to par prices, changes in yields for U.S. Treasury securities, corporate actions by bond issuers, prepayment schedules and histories, economic events and, for certain securities, adjustments to yields to reflect changes in the rate of inflation. Other securities with model-derived valuation inputs that are observable are also classified as Level 2 investments. Investments with unobservable valuation inputs are classified as Level 3 investments. Benefit plan assets included in Level 3 are primarily real estate and private equity investments that are valued using methods requiring judgment including appraisals.

62
Deferred Fuel Costs The cost of fuel and related emission allowances and emission control chemicals/consumables is charged to Fuel and Other Consumables Used for Electric Generation expense when the fuel is burned or the allowance or consumable is utilized. The cost of fuel also includes the cost of nuclear fuel burned which is computed primarily on the units-of-production method. In regulated jurisdictions with an active FAC, fuel cost over-recoveries (the excess of fuel revenues billed to customers over applicable fuel costs incurred) are generally deferred as current regulatory liabilities and under-recoveries (the excess of applicable fuel costs incurred over fuel revenues billed to customers) are generally deferred as current regulatory assets. These deferrals are amortized when refunded or when billed to customers in later months with the state regulatory commissions’ review and approval. The amount of an over-recovery or under-recovery can also be affected by actions of the state regulatory commissions. On a routine basis, state regulatory commissions review and/or audit our fuel procurement policies and practices, the fuel cost calculations and FAC deferrals. When a fuel cost disallowance becomes probable, we adjust our FAC deferrals and record provisions for estimated refunds to recognize these probable outcomes. Fuel cost over-recovery and under-recovery balances are classified as noncurrent when there is a phase-in plan or the FAC has been suspended or terminated. Changes in fuel costs, including purchased power in Kentucky for KPCo, in Indiana and Michigan for I&M, in Ohio (beginning in 2012 through May 2015) for OPCo, in Arkansas, Louisiana and Texas for SWEPCo, in Oklahoma for PSO and in Virginia for APCo are reflected in rates in a timely manner through the FAC. Changes in fuel costs, including purchased power in Ohio (beginning in 2009 through 2011) for OPCo and in West Virginia for APCo are reflected in rates through FAC phase-in plans. The FAC generally includes some sharing of off-system sales. In West Virginia for APCo, all of the profits from off-system sales are given to customers through the FAC. None of the profits from off-system sales are given to customers through the FAC in Ohio for OPCo. A portion of profits from off-system sales are given to customers through the FAC and other rate mechanisms in Oklahoma for PSO, Arkansas, Louisiana and Texas for SWEPCo, Kentucky for KPCo, Virginia for APCo and in Indiana and Michigan (all areas of Michigan beginning in December 2010) for I&M. Where the FAC or off-system sales sharing mechanism is capped, frozen or non-existent, changes in fuel costs or sharing of off-system sales impacted earnings. Revenue Recognition
Regulatory Accounting
Our financial statements reflect the actions of regulators that can result in the recognition of revenues and expenses in different time periods than enterprises that are not rate-regulated. Regulatory assets (deferred expenses) and regulatory liabilities (deferred revenue reductions or refunds) are recorded to reflect the economic effects of regulation in the same accounting period by matching expenses with their recovery through regulated revenues and by matching income with its passage to customers in cost-based regulated rates. When regulatory assets are probable of recovery through regulated rates, we record them as assets on our balance sheets. We test for probability of recovery at each balance sheet date or whenever new events occur. Examples of new events include the issuance of a regulatory commission order or passage of new legislation. If it is determined that recovery of a regulatory asset is no longer probable, we write off that regulatory asset as a charge against income. Traditional Electricity Supply and Delivery Activities Revenues are recognized from retail and wholesale electricity sales and electricity transmission and distribution delivery services. We recognize the revenues on our statements of income upon delivery of the energy to the customer and include unbilled as well as billed amounts. In accordance with the applicable state commission regulatory treatment, PSO and SWEPCo do not record the fuel portion of unbilled revenue.

63
Most of the power produced at the generation plants of the AEP East companies is sold to PJM, the RTO operating in the east service territory. We purchase power from PJM to supply our customers. Generally, these power sales and purchases are reported on a net basis as revenues on our statements of income. However, purchases of power in excess of sales to PJM, on an hourly net basis, used to serve retail load are recorded gross as Purchased Electricity for Resale on our statements of income. Other RTOs in which we participate do not function in the same manner as PJM. They function as balancing organizations and not as exchanges. Physical energy purchases arising from non-derivative contracts are accounted for on a gross basis in Purchased Electricity for Resale on our statements of income. Energy purchases arising from non-trading derivative contracts are recorded based on the transaction’s economic substance. Purchases under non-trading derivatives used to serve accrual based obligations are recorded in Purchased Electricity for Resale on our statements of income. All other non-trading derivative purchases are recorded net in revenues. In general, we record expenses when purchased electricity is received and when expenses are incurred, with the exception of certain power purchase contracts that are derivatives and accounted for using MTM accounting where generation/supply rates are not cost-based regulated. In jurisdictions where the generation/supply business is subject to cost-based regulation, the unrealized MTM amounts are deferred as regulatory assets (for losses) and regulatory liabilities (for gains).
Energy Marketing and Risk Management Activities We engage in wholesale electricity, natural gas, coal and emission allowances marketing and risk management activities focused on wholesale markets where we own assets and adjacent markets. Our activities include the purchase and sale of energy under forward contracts at fixed and variable prices and the buying and selling of financial energy contracts, which include exchange traded futures and options, as well as OTC options and swaps. We engage in certain energy marketing and risk management transactions with RTOs. We recognize revenues and expenses from wholesale marketing and risk management transactions that are not derivatives upon delivery of the commodity. We use MTM accounting for wholesale marketing and risk management transactions that are derivatives unless the derivative is designated in a qualifying cash flow hedge relationship or a normal purchase or sale. We include the unrealized and realized gains and losses on wholesale marketing and risk management transactions that are accounted for using MTM in Revenues on our statements of income on a net basis. In jurisdictions subject to cost-based regulation, we defer the unrealized MTM amounts and some realized gains and losses as regulatory assets (for losses) and regulatory liabilities (for gains). We include unrealized MTM gains and losses resulting from derivative contracts on our balance sheets as Risk Management Assets or Liabilities as appropriate. Certain qualifying wholesale marketing and risk management derivative transactions are designated as hedges of variability in future cash flows as a result of forecasted transactions (cash flow hedge). We initially record the effective portion of the cash flow hedge’s gain or loss as a component of AOCI. When the forecasted transaction is realized and affects net income, we subsequently reclassify the gain or loss on the hedge from AOCI into revenues or expenses within the same financial statement line item as the forecasted transaction on our statements of income. Excluding those jurisdictions subject to cost-based regulation, we recognize the ineffective portion of the gain or loss in revenues or expense immediately on our statements of income, depending on the specific nature of the associated hedged risk. In regulated jurisdictions, we defer the ineffective portion as regulatory assets (for losses) and regulatory liabilities (for gains). See “Accounting for Cash Flow Hedging Strategies” section of Note 9. Barging Activities
AEP River Operations’ revenue is recognized based on percentage of voyage completion. The proportion of freight transportation revenue to be recognized is determined by applying a percentage to the contractual charges for such services. The percentage is determined by dividing the number of miles from the loading point to the position of the barge as of the end of the accounting period by the total miles to the destination specified in the customer’s freight contract. The position of the barge at accounting period end is determined by our computerized barge tracking system.

64
Levelization of Nuclear Refueling Outage Costs In accordance with regulatory orders, I&M defers incremental operation and maintenance costs associated with periodic refueling outages at its Cook Plant and amortizes the costs over the period beginning with the month following the start of each unit’s refueling outage and lasting until the end of the month in which the same unit’s next scheduled refueling outage begins. I&M adjusts the amortization amount as necessary to ensure full amortization of all deferred costs by the end of the refueling cycle.
Maintenance
We expense maintenance costs as incurred. If it becomes probable that we will recover specifically-incurred costs through future rates, we establish a regulatory asset to match the expensing of those maintenance costs with their recovery in cost-based regulated revenues. In certain regulatory jurisdictions, we defer costs above the level included in base rates and amortize those deferrals commensurate with recovery through rate riders. Income Taxes and Investment Tax Credits We use the liability method of accounting for income taxes. Under the liability method, we provide deferred income taxes for all temporary differences between the book and tax basis of assets and liabilities which will result in a future tax consequence. When the flow-through method of accounting for temporary differences is reflected in regulated revenues (that is, when deferred taxes are not included in the cost of service for determining regulated rates for electricity), we record deferred income taxes and establish related regulatory assets and liabilities to match the regulated revenues and tax expense. We account for investment tax credits under the flow-through method except where regulatory commissions reflect investment tax credits in the rate-making process on a deferral basis. We amortize deferred investment tax credits over the life of the plant investment. We account for uncertain tax positions in accordance with the accounting guidance for “Income Taxes.” We classify interest expense or income related to uncertain tax positions as interest expense or income as appropriate and classify penalties as Other Operation.
Excise Taxes We act as an agent for some state and local governments and collect from customers certain excise taxes levied by those state or local governments on our customers. We do not recognize these taxes as revenue or expense. Government Grants For APCo’s commercial scale Carbon Capture and Sequestration facility at the Mountaineer Plant and OPCo’s gridSMART® demonstration program, APCo and OPCo are reimbursed by the Department of Energy for allowable costs incurred during the billing period. These reimbursements result in the reduction of Other Operation and Maintenance expenses on our statements of income or a reduction in Construction Work in Progress on our balance sheets. Debt We defer gains and losses from the reacquisition of debt used to finance regulated electric utility plants and amortize the deferral over the remaining term of the reacquired debt in accordance with their rate-making treatment unless the debt is refinanced. If we refinance the reacquired debt associated with the regulated business, the reacquisition costs attributable to the portions of the business subject to cost-based regulatory accounting are generally deferred and amortized over the term of the replacement debt consistent with its recovery in rates. Some jurisdictions require that these costs be expensed upon reacquisition. We report gains and losses on the reacquisition of debt for operations not subject to cost-based rate regulation in Interest Expense on our statements of income.

65
We defer debt discount or premium and debt issuance expenses and amortize generally utilizing the straight-line method over the term of the related debt. The straight-line method approximates the effective interest method and is consistent with the treatment in rates for regulated operations. We include the net amortization expense in Interest Expense on our statements of income. Goodwill and Intangible Assets When we acquire businesses, we record the fair value of all assets and liabilities, including intangible assets. To the extent that consideration exceeds the fair value of identified assets, we record goodwill. We do not amortize goodwill and intangible assets with indefinite lives. We test acquired goodwill and other intangible assets with indefinite lives for impairment at least annually at their estimated fair value. We test goodwill at the reporting unit level and other intangibles at the asset level. Fair value is the amount at which an asset or liability could be bought or sold in a current transaction between willing parties, that is, other than in a forced or liquidation sale. Quoted market prices in active markets are the best evidence of fair value and are used as the basis for the measurement, if available. In the absence of quoted prices for identical or similar assets in active markets, we estimate fair value using various internal and external valuation methods. We amortize intangible assets with finite lives over their respective estimated lives to their estimated residual values. We also review the lives of the amortizable intangibles with finite lives on an annual basis.
Investments Held in Trust for Future Liabilities We have several trust funds with significant investments intended to provide for future payments of pension and OPEB benefits, nuclear decommissioning and spent nuclear fuel disposal. All of our trust funds’ investments are diversified and managed in compliance with all laws and regulations. Our investment strategy for trust funds is to use a diversified portfolio of investments to achieve an acceptable rate of return while managing the interest rate sensitivity of the assets relative to the associated liabilities. To minimize investment risk, the trust funds are broadly diversified among classes of assets, investment strategies and investment managers. We regularly review the actual asset allocations and periodically rebalance the investments to targeted allocations when appropriate. Investment policies and guidelines allow investment managers in approved strategies to use financial derivatives to obtain or manage market exposures and to hedge assets and liabilities. The investments are reported at fair value under the “Fair Value Measurements and Disclosures” accounting guidance.
Benefit Plans
All benefit plan assets are invested in accordance with each plan’s investment policy. The investment policy outlines the investment objectives, strategies and target asset allocations by plan. The investment philosophies for our benefit plans support the allocation of assets to minimize risks and optimize net returns. Strategies used include:
• Maintaining a long-term investment horizon.
• Diversifying assets to help control volatility of returns at acceptable levels.
• Managing fees, transaction costs and tax liabilities to maximize investment earnings.
• Using active management of investments where appropriate risk/return opportunities exist.
• Keeping portfolio structure style-neutral to limit volatility compared to applicable benchmarks.
• Using alternative asset classes such as real estate and private equity to maximize return and provide additional portfolio diversification.

66
The investment policy for the pension fund allocates assets based on the funded status of the pension plan. The objective of the asset allocation policy is to reduce the investment volatility of the plan over time. Generally, more of the investment mix will be allocated to fixed income investments as the plan becomes better funded. Assets will be transferred away from equity investments into fixed income investments based on the market value of plan assets compared to the plan’s projected benefit obligation. The current target asset allocations are as follows: Pension Plan Assets Target
Equity 45.0 % Fixed Income 45.0 % Other Investments 10.0 % OPEB Plans Assets Target
Equity 66.0 % Fixed Income 33.0 % Cash 1.0 % The investment policy for each benefit plan contains various investment limitations. The investment policies establish concentration limits for securities. Investment policies prohibit the benefit trust funds from purchasing securities issued by AEP (with the exception of proportionate and immaterial holdings of AEP securities in passive index strategies). However, our investment policies do not preclude the benefit trust funds from receiving contributions in the form of AEP securities, provided that the AEP securities acquired by each plan may not exceed the limitations imposed by law. Each investment manager's portfolio is compared to a diversified benchmark index. For equity investments, the limits are as follows:
• No security in excess of 5% of all equities.
• Cash equivalents must be less than 10% of an investment manager's equity portfolio.
• No individual stock may be more than 10% of each manager's equity portfolio.
• No investment in excess of 5% of an outstanding class of any company.
• No securities may be bought or sold on margin or other use of leverage. For fixed income investments, the concentration limits must not exceed:
• 3% in any single issuer
• 5% private placements
• 5% convertible securities
• 60% for bonds rated AA+ or lower
• 50% for bonds rated A+ or lower
• 10% for bonds rated BBB- or lower For obligations of non-government issuers, the following limitations apply:
• AAA rated debt: a single issuer should account for no more than 5% of the portfolio.
• AA+, AA, AA- rated debt: a single issuer should account for no more than 3% of the portfolio.
• Debt rated A+ or lower: a single issuer should account for no more than 2% of the portfolio.
• No more than 10% of the portfolio may be invested in high yield and emerging market debt combined at any time.
A portion of the pension assets is invested in real estate funds to provide diversification, add return and hedge against inflation. Real estate properties are illiquid, difficult to value and not actively traded. The pension plan uses external real estate investment managers to invest in commingled funds that hold real estate properties. To mitigate investment risk in the real estate portfolio, commingled real estate funds are used to ensure that holdings are diversified by region, property type and risk classification. Real estate holdings include core, value-added and development risk classifications and some investments in Real Estate Investment Trusts (REITs), which are publicly traded real estate securities classified as Level 1.

67
A portion of the pension assets is invested in private equity. Private equity investments add return and provide diversification and typically require a long-term time horizon to evaluate investment performance. Private equity is classified as an alternative investment because it is illiquid, difficult to value and not actively traded. The pension plan uses limited partnerships and commingled funds to invest across the private equity investment spectrum. Our private equity holdings are with 11 general partners who help monitor the investments and provide investment selection expertise. The holdings are currently comprised of venture capital, buyout and hybrid debt and equity investment instruments. Commingled private equity funds are used to enhance the holdings’ diversity. We participate in a securities lending program with BNY Mellon to provide incremental income on idle assets and to provide income to offset custody fees and other administrative expenses. We lend securities to borrowers approved by BNY Mellon in exchange for cash collateral. All loans are collateralized by at least 102% of the loaned asset’s market value and the cash collateral is invested. The difference between the rebate owed to the borrower and the cash collateral rate of return determines the earnings on the loaned security. The securities lending program’s objective is providing modest incremental income with a limited increase in risk. We hold trust owned life insurance (TOLI) underwritten by The Prudential Insurance Company in the OPEB plan trusts. The strategy for holding life insurance contracts in the taxable Voluntary Employees' Beneficiary Association (VEBA) trust is to minimize taxes paid on the asset growth in the trust. Earnings on plan assets are tax-deferred within the TOLI contract and can be tax-free if held until claims are paid. Life insurance proceeds remain in the trust and are used to fund future retiree medical benefit liabilities. With consideration to other investments held in the trust, the cash value of the TOLI contracts is invested in two diversified funds. A portion is invested in a commingled fund with underlying investments in stocks that are actively traded on major international equity exchanges. The other portion of the TOLI cash value is invested in a diversified, commingled fixed income fund with underlying investments in government bonds, corporate bonds and asset-backed securities. Cash and cash equivalents are held in each trust to provide liquidity and meet short-term cash needs. Cash equivalent funds are used to provide diversification and preserve principal. The underlying holdings in the cash funds are investment grade money market instruments including commercial paper, certificates of deposit, treasury bills and other types of investment grade short-term debt securities. The cash funds are valued each business day and provide daily liquidity. Nuclear Trust Funds Nuclear decommissioning and spent nuclear fuel trust funds represent funds that regulatory commissions allow us to collect through rates to fund future decommissioning and spent nuclear fuel disposal liabilities. By rules or orders, the IURC, the MPSC and the FERC established investment limitations and general risk management guidelines. In general, limitations include:
• Acceptable investments (rated investment grade or above when purchased).
• Maximum percentage invested in a specific type of investment.
• Prohibition of investment in obligations of AEP or its affiliates.
• Withdrawals permitted only for payment of decommissioning costs and trust expenses. We maintain trust records for each regulatory jurisdiction. The trust assets may not be used for another jurisdiction’s liabilities. Regulatory approval is required to withdraw decommissioning funds. These funds are managed by external investment managers who must comply with the guidelines and rules of the applicable regulatory authorities. The trust assets are invested to optimize the net of tax earnings of the trust giving consideration to liquidity, risk, diversification and other prudent investment objectives. We record securities held in these trust funds as Spent Nuclear Fuel and Decommissioning Trusts on our balance sheets. We record these securities at fair value. We classify securities in the trust funds as available-for-sale due to their long-term purpose. Other-than-temporary impairments for investments in both debt and equity securities are considered realized losses as a result of securities being managed by an external investment management firm. The external investment management firm makes specific investment decisions regarding the equity and debt investments held in these trusts and generally intends to sell debt securities in an unrealized loss position as part of a tax optimization strategy. Impairments reduce the cost basis of the securities which will affect any future unrealized

68
gain or realized gain or loss due to the adjusted cost of investment. We record unrealized gains and other-than-temporary impairments from securities in these trust funds as adjustments to the regulatory liability account for the nuclear decommissioning trust funds and to regulatory assets or liabilities for the spent nuclear fuel disposal trust funds in accordance with their treatment in rates. Consequently, changes in fair value of trust assets do not affect earnings or AOCI. See the “Nuclear Contingencies” section of Note 5 for additional discussion of nuclear matters. See “Fair Value Measurements of Trust Assets for Decommissioning and SNF Disposal” section of Note 10 for disclosure of the fair value of assets within the trusts. Comprehensive Income (Loss) Comprehensive income (loss) is defined as the change in equity (net assets) of a business enterprise during a period from transactions and other events and circumstances from nonowner sources. It includes all changes in equity during a period except those resulting from investments by owners and distributions to owners. Comprehensive income (loss) has two components: net income (loss) and other comprehensive income (loss).
Accumulated Other Comprehensive Income (Loss) (AOCI) AOCI is included on our balance sheets in our equity section. Our components of AOCI as of December 31, 2011 and 2010 are shown in the following table:
December 31, Components 2011 2010
(in millions) Cash Flow Hedges, Net of Tax $ (23) $ 11 Securities Available for Sale, Net of Tax 2 4 Amortization of Pension and OPEB Deferred Costs, Net of Tax 81 57 Pension and OPEB Funded Status, Net of Tax (530) (453)
Total $ (470) $ (381)
Stock-Based Compensation Plans
At December 31, 2011, we had stock options, performance units, restricted shares and restricted stock units outstanding under The Amended and Restated American Electric Power System Long-Term Incentive Plan (LTIP). This plan was last approved by shareholders in April 2010. We maintain a variety of tax qualified and nonqualified deferred compensation plans for employees and non-employee directors that include, among other options, an investment in or an investment return equivalent to that of AEP common stock. This includes career share accounts maintained under the American Electric Power System Stock Ownership Requirement Plan, which facilitates executives in meeting minimum stock ownership requirements assigned to them by the HR Committee of the Board of Directors. Career shares are derived from vested performance units granted to employees under the LTIP. Career shares are equal in value to shares of AEP common stock and do not become payable to executives until after their service ends. Dividends paid on career shares are reinvested as additional career shares. We compensate our non-employee directors, in part, with stock units under the American Electric Power Company, Inc. Stock Unit Accumulation Plan for Non-Employee Directors. These stock units become payable in cash to directors after their service ends. In January 2006, we adopted accounting guidance for “Compensation - Stock Compensation” which requires the measurement and recognition of compensation expense for all share-based payment awards made to employees and directors, including stock options, based on estimated fair values.

69
We recognize compensation expense for all share-based awards with service only vesting conditions granted on or after January 2006 using the straight-line single-option method. Stock-based compensation expense recognized on our statements of income for the years ended December 31, 2011, 2010 and 2009 is based on awards ultimately expected to vest. Therefore, stock-based compensation expense has been reduced to reflect estimated forfeitures. Accounting guidance for “Compensation - Stock Compensation” requires forfeitures to be estimated at the time of grant and revised, if necessary, in subsequent periods if actual forfeitures differ from those estimates. For the years ended December 31, 2011, 2010 and 2009, compensation expense is included in Net Income for the performance units, career shares, restricted shares, restricted stock units and the non-employee director’s stock units. See Note 15 for additional discussion. Earnings Per Share (EPS) Shown below are income statement amounts attributable to AEP common shareholders: Years Ended December 31,
Amounts Attributable to AEP Common Shareholders 2011 2010 2009
(in millions) Income Before Extraordinary Items $ 1,568 $ 1,211 $ 1,362
Extraordinary Items, Net of Tax 373 - (5)
Net Income $ 1,941 $ 1,211 $ 1,357
Basic earnings per common share is calculated by dividing net earnings available to common shareholders by the weighted average number of common shares outstanding during the period. Diluted earnings per common share is calculated by adjusting the weighted average outstanding common shares, assuming conversion of all potentially dilutive stock options and awards. The following table presents our basic and diluted EPS calculations included on our statements of income: Years Ended December 31, 2011 2010 2009
(in millions, except per share data)
$/share $/share $/share
Earnings Attributable to AEP Common Shareholders $ 1,941 $ 1,211 $ 1,357
Weighted Average Number of Basic Shares Outstanding 482.2 $ 4.02 479.4 $ 2.53 458.7 $ 2.96
Weighted Average Dilutive Effect of:
Performance Share Units - - 0.1 - 0.3 -
Stock Options 0.1 - - - - -
Restricted Stock Units 0.2 - 0.1 - - -
Weighted Average Number of Diluted Shares
Outstanding 482.5 $ 4.02 479.6 $ 2.53 459.0 $ 2.96
Options to purchase 136,250 and 452,216 shares of common stock were outstanding at December 31, 2010 and 2009, respectively, but were not included in the computation of diluted earnings per share attributable to AEP common shareholders. Since the options’ exercise prices were greater than the average market price of the common shares, the effect would have been antidilutive. There were no antidilutive shares outstanding at December 31, 2011.

70
OPCo Revised Depreciation Rates Effective December 1, 2011, we revised book depreciation rates for certain of OPCo’s generating plants consistent with shortened depreciable lives for the generating units. This change in depreciable lives is expected to result in a $54 million increase in depreciation expense in 2012. Supplementary Information Years Ended December 31,
Related Party Transactions 2011 2010 2009
(in millions) AEP Consolidated Revenues – Utility Operations: Ohio Valley Electric Corporation (43.47% owned) $ - $ (20) (a) $ - AEP Consolidated Revenues – Other Revenues: Ohio Valley Electric Corporation – Barging and Other Transportation Services (43.47% Owned) 37 29 31 AEP Consolidated Expenses – Purchased Electricity for Resale: Ohio Valley Electric Corporation (43.47% Owned) 383 (b) 302 (b) 286
(a) The AEP Power Pool purchased power from OVEC to serve off-system sales through an agreement that began in January 2010 and ended in June 2010.
(b) The AEP Power Pool purchased power from OVEC to serve retail sales in 2011 and 2010. The total amount reported in 2011 and 2010 includes $66 million and $10 million, respectively, related to these agreements.
Years Ended December 31,
Cash Flow Information 2011 2010 2009
(in millions)
Cash Paid (Received) for:
Interest, Net of Capitalized Amounts $ 900 $ 958 $ 924
Income Taxes (118) (268) (98)
Noncash Investing and Financing Activities:
Acquisitions Under Capital Leases 54 225 86
Construction Expenditures Included in Current Liabilities at December 31, 380 267 348

71
2. NEW ACCOUNTING PRONOUNCEMENTS AND EXTRAORDINARY ITEMS NEW ACCOUNTING PRONOUNCEMENTS
We review the new accounting literature to determine its relevance, if any, to our business. The following represents a summary of final pronouncements that impact our financial statements. Pronouncements Adopted During 2011 The following standards were adopted during 2011. Consequently, their impact is reflected in the financial statements. The following paragraphs discuss their impact.
ASU 2011-05 “Presentation of Comprehensive Income” (ASU 2011-05)
We adopted ASU 2011-05 effective for the 2011 Annual Report. The standard requires other comprehensive income be presented as part of a single continuous statement of comprehensive income or in a statement of other comprehensive income immediately following the statement of net income. This standard requires retrospective application to all reporting periods presented in the financial statements. This standard changed the presentation of our financial statements but did not affect the calculation of net income, comprehensive income or earnings per share. The FASB deferred the reclassification adjustment presentation provisions of ASU 2011-05 under the terms in ASU 2011-12, “Comprehensive Income (Topic 220): Deferral of the Effective Date for Amendments to the Presentation of Reclassifications of Items Out of Accumulated Other Comprehensive Income.” EXTRAORDINARY ITEMS TCC Texas Restructuring In February 2006, the PUCT issued an order that denied recovery of capacity auction true-up amounts. Based on the February 2006 PUCT order, TCC recorded the disallowance as a $421 million ($273 million, net of tax) extraordinary loss in the December 31, 2005 financial statements. In July 2011, the Supreme Court of Texas reversed the PUCT’s February 2006 disallowance of capacity auction true-up amounts and remanded for reconsideration the treatment of certain tax balances under normalization rules. Based upon the Supreme Court of Texas reversal of the PUCT’s capacity auction true-up disallowance, TCC recorded a pretax gain of $421 million ($273 million, net of tax) in Extraordinary Items, Net of Tax on the statements of income in the third quarter of 2011. Following a remand proceeding, the PUCT allowed TCC to retain contested tax balances in full satisfaction of its true-up proceeding, including carrying charges. Based upon the PUCT order, TCC recorded the reversal of regulatory credits of $65 million ($42 million, net of tax) and the reversal of $89 million of accumulated deferred investment tax credits ($58 million, net of tax) in Extraordinary Items, Net of Tax on the statements of income in the fourth quarter of 2011. See “Texas Restructuring” section of Note AEP_RM. SWEPCo Texas Restructuring In August 2006, the PUCT adopted a rule extending the delay in implementation of customer choice in SWEPCo’s SPP area of Texas until no sooner than January 1, 2011. In May 2009, the governor of Texas signed a bill related to SWEPCo’s SPP area of Texas that requires continued cost of service regulation until certain stages have been completed and approved by the PUCT such that fair competition is available to all Texas retail customer classes. Based upon the signing of the bill, SWEPCo re-applied “Regulated Operations” accounting guidance for the generation portion of SWEPCo’s Texas retail jurisdiction effective second quarter of 2009. Management believes that a return to competition in the SPP area of Texas will not occur. The reapplication of “Regulated Operations” accounting guidance resulted in an $8 million ($5 million, net of tax) extraordinary loss.

72
3. RATE MATTERS
Our subsidiaries are involved in rate and regulatory proceedings at the FERC and their state commissions. Rate matters can have a material impact on net income, cash flows and possibly financial condition. Our recent significant rate orders and pending rate filings are addressed in this note. OPCo Rate Matters Ohio Electric Security Plan Filing
2009 – 2011 ESP
The PUCO issued an order in March 2009 that modified and approved the ESP which established rates at the start of the April 2009 billing cycle through 2011. OPCo collected the 2009 annualized revenue increase over the last nine months of 2009. The order also provided a phase-in FAC, which was authorized to be recovered through a non-bypassable surcharge over the period 2012 through 2018 or until securitized. The net FAC deferral as of December 31, 2011 was $521 million, excluding unrecognized equity carrying costs. Collection of the FAC began in January 2012. If OPCo is not ultimately permitted to fully recover its FAC deferral, it would reduce future net income and cash flows and impact financial condition. The PUCO’s March 2009 order was appealed to the Supreme Court of Ohio, which issued an opinion and remanded certain issues back to the PUCO. In October 2011, the PUCO issued an order in the remand proceeding. The order required OPCo to cease POLR billings and apply POLR collections since June 2011 first to the FAC deferral with any remaining balance to be credited to OPCo’s customers in November and December 2011. As a result, OPCo recorded a pretax write-off of $47 million on the statement of income related to POLR for the period June 2011 through October 2011. OPCo ceased collection of POLR billings in November 2011. The PUCO order also agreed with OPCo’s position that the ESP statute provided a legal basis for reflecting an environmental carrying charge in OPCo’s base generation rates. In addition, the PUCO rejected the intervenors’ proposed adjustments to the FAC deferral balance for POLR charges and environmental carrying charges for the period from April 2009 through May 2011. In February 2012, the Ohio Consumers’ Counsel (OCC) and the Industrial Energy Users-Ohio (IEU) filed appeals with the Supreme Court of Ohio challenging various issues, including the PUCO’s refusal to order retrospective relief concerning the POLR charges collected during 2009 – 2011 and various aspects of the approved environmental carrying charge, which if ordered could total up to $698 million, excluding carrying costs. In January 2011, the PUCO issued an order on the 2009 Significantly Excessive Earnings Test (SEET) filing and determined that 2009 earnings exceeded the PUCO determined threshold by 2.13%. As a result, the PUCO ordered a $43 million refund of pretax earnings to customers, which was recorded in OPCo’s 2010 statement of income. The PUCO ordered that the significantly excessive earnings be applied first to the FAC deferral, as of the date of the order, with any remaining balance to be credited to customers on a per kilowatt basis. That credit began with the first billing cycle in February 2011 and continued through December 2011. In May 2011, the IEU and the Ohio Energy Group (OEG) filed appeals with the Supreme Court of Ohio challenging the PUCO’s SEET decision. The OEG’s appeal seeks the inclusion of off-system sales (OSS) in the calculation of SEET, which, if ordered, could require an additional refund of $22 million based on the PUCO approved SEET calculation. The IEU’s appeal also sought the inclusion of OSS as well as other items in the determination of SEET, but did not quantify the amount. Management is unable to predict the outcome of the appeals. If the Supreme Court of Ohio ultimately determines that additional amounts should be refunded, it could reduce future net income and cash flows and impact financial condition. In July 2011, OPCo filed its 2010 SEET filing with the PUCO based upon the approach in the PUCO’s 2009 order. Subsequent testimony and legal briefs from intervenors recommended a refund of up to $62 million of 2010 earnings, which included OSS in the SEET calculation. In December 2011, the PUCO staff filed testimony that recommended a $23 million refund of 2010 earnings. In the fourth quarter of 2011, OPCo provided a reserve based upon management’s estimate of the probable amount for a PUCO ordered SEET refund.

73
OPCo is required to file its 2011 SEET filing with the PUCO in 2012. Management does not currently believe that there are significantly excessive earnings in 2011. Management is unable to predict the outcome of the unresolved litigation discussed above. If these proceedings, including future SEET filings, result in adverse rulings, it could reduce future net income and cash flows and impact financial condition. January 2012 – May 2016 ESP
In January 2011, OPCo filed an application with the PUCO to approve a new ESP that includes a standard service offer (SSO) pricing for generation. The filed ESP also included alternative energy resource requirements and addressed provisions regarding distribution service, energy efficiency requirements, economic development, job retention in Ohio, generation resources and other matters. In December 2011, a modified stipulation was approved by the PUCO which involved various issues pending before the PUCO. Various parties, including OPCo, filed requests for rehearing with the PUCO. In February 2012, the PUCO issued an entry on rehearing which rejected the modified stipulation and ordered a return to the 2011 ESP rates until a new rate plan is approved. Under the February 2012 rehearing order, OPCo has 30 days to notify the PUCO whether it plans to modify or withdraw its original application as filed in January 2011. Management is currently evaluating its options and the potential financial and operational impacts on OPCo. 2011 Ohio Distribution Base Rate Case In February 2011, OPCo filed with the PUCO for an annual increase in distribution rates of $94 million based upon an 11.15% return on common equity to be effective January 2012. In December 2011, a stipulation was approved by the PUCO which provided for no change in distribution rates and a new rider for a $15 million annual credit to residential ratepayers due principally to the inclusion of the rate base distribution investment in the Distribution Investment Rider (DIR). See the “January 2012 – May 2016 ESP” section above. The stipulation also approved recovery of certain distribution regulatory assets of $173 million as of December 31, 2011, excluding $154 million of unrecognized equity carrying costs. These assets and unrecognized carrying costs will be recovered in a distribution asset recovery rider over seven years with an additional long term debt carrying charge, effective January 2012. Due to the February 2012 PUCO ESP entry on rehearing which rejected the modified stipulation for a new ESP, collection of the DIR terminated. OPCo has the right to withdraw from the stipulation in the distribution base rate case. Management is currently evaluating all its options. If OPCo is not ultimately permitted to fully recover its costs and deferrals, it would reduce future net income and cash flows and impact financial condition. Sporn Unit 5
In October 2010, OPCo filed an application with the PUCO for the approval of a December 2010 closure of Sporn Unit 5 and the simultaneous establishment of a new non-bypassable distribution rider outside the rate caps established in the 2009 – 2011 ESP proceeding. In the third quarter of 2011, management decided to no longer offer the output of Sporn Unit 5 into the PJM market. Sporn Unit 5 is not expected to operate in the future, resulting in the removal of Sporn Unit 5 from the AEP Power Pool. As a result, in the third quarter of 2011, OPCo recorded a pretax write-off of $48 million in Asset Impairments and Other Related Charges on the statement of income. In January 2012, the PUCO issued an order which denied recovery of a new non-bypassable distribution rider and declined to exercise jurisdiction over the closure of Sporn Unit 5.

74
2009 Fuel Adjustment Clause Audit As required under the ESP orders, the PUCO selected an outside consultant to conduct the audit of the FAC for OPCo for the period of January 2009 through December 2009. In May 2010, the outside consultant provided its confidential audit report to the PUCO. The audit report included a recommendation that the PUCO review whether any proceeds from a 2008 coal contract settlement agreement which totaled $72 million should reduce OPCo’s FAC under-recovery balance. Of the total proceeds, approximately $58 million was recognized as a reduction to fuel expense prior to 2009 and $14 million was recognized as a reduction to fuel expense in 2009 and 2010, of which approximately $7 million was the retail jurisdictional share which reduced the FAC deferral in 2009 and 2010. In January 2012, the PUCO ordered that the remaining $65 million in proceeds from the 2008 coal contract settlement be applied against OPCo’s under-recovered fuel balance pending a PUCO decision in OPCo's February 2012 rehearing request. OPCo’s rehearing request stated that no additional gain should be credited to the FAC or at most only the retail share of the $58 million gain be applied to the FAC, which approximated $30 million. Further, the January 2012 PUCO order stated that a consultant be hired to review the coal reserve valuation and recommend whether any additional value should benefit ratepayers. Management is unable to predict the outcome of the consultant’s recommendation. If the PUCO ultimately determines that additional amounts related to the coal reserve valuation should benefit ratepayers, it could reduce future net income and cash flows and impact financial condition. 2010 Fuel Adjustment Clause Audit In May 2011, the PUCO-selected outside consultant issued its results of the 2010 FAC audit for OPCo. The audit report included a recommendation that the PUCO reexamine the carrying costs on the deferred FAC balance and determine whether the carrying costs on the balance should be net of accumulated income taxes. As of December 31, 2011, the amount of OPCo’s carrying costs that could potentially be at risk is estimated to be $15 million, excluding $17 million of unrecognized equity carrying costs. A decision from the PUCO is pending. Management is unable to predict the outcome of this proceeding. If the PUCO order results in a reduction in the carrying charges related to the FAC deferrals, it would reduce future net income and cash flows and impact financial condition. Ormet Interim Arrangement OPCo and Ormet, a large aluminum company, filed an application with the PUCO for approval of an interim arrangement governing the provision of generation service to Ormet. This interim arrangement was approved by the PUCO and was effective from January 2009 through September 2009. In March 2009, the PUCO approved a FAC in the ESP filing and the FAC aspect of the ESP order was upheld by the Supreme Court of Ohio. The approval of the FAC as part of the ESP, together with the PUCO approval of the interim arrangement, provided the basis to record a regulatory asset for the difference between the approved market price and the rate paid by Ormet. Through September 2009, the last month of the interim arrangement, OPCo had $64 million of deferred FAC costs related to the interim arrangement, excluding $2 million of unrecognized equity carrying costs. In November 2009, OPCo requested that the PUCO approve recovery of the deferral under the interim agreement plus a weighted average cost of capital carrying charge. The interim arrangement deferral is included in OPCo’s FAC phase-in deferral balance. In the ESP proceeding, intervenors requested that OPCo be required to refund the Ormet-related regulatory asset and requested that the PUCO prevent OPCo from collecting the Ormet-related revenues in the future. The PUCO did not take any action on this request in the 2009-2011 ESP proceeding. The intervenors raised the issue again in response to OPCo’s November 2009 filing to approve recovery of the deferral under the interim agreement and this issue remains pending before the PUCO. If OPCo is not ultimately permitted to fully recover its requested deferrals under the interim arrangement, it would reduce future net income and cash flows and impact financial condition. Economic Development Rider
In April 2010, the Industrial Energy Users-Ohio (IEU) filed a notice of appeal of the 2009 PUCO-approved Economic Development Rider (EDR) with the Supreme Court of Ohio. The EDR collects from ratepayers the difference between the standard tariff and lower contract billings to qualifying industrial customers, subject to PUCO approval. In June 2011, the Supreme Court of Ohio affirmed the PUCO’s decision and dismissed the IEU’s appeal.

75
In June 2010, the IEU filed a notice of appeal of the 2010 PUCO-approved EDR with the Supreme Court of Ohio raising the same issues as in the 2009 EDR appeal. In addition, the IEU added a claim that OPCo should not be able to take the benefits of the higher ESP rates while simultaneously challenging the ESP orders. In June 2011, the IEU voluntarily dismissed the 2010 EDR appeal issues that were the same issues dismissed by the Supreme Court of Ohio in its 2009 EDR appeal referenced above. In August 2011, the Supreme Court of Ohio affirmed the PUCO’s decision on the remaining issues.
Ohio IGCC Plant
In March 2005, OPCo filed an application with the PUCO seeking authority to recover costs of building and operating an IGCC power plant. Through December 31, 2011, OPCo has collected $24 million in pre-construction costs authorized in a June 2006 PUCO order and has incurred pre-construction costs. Intervenors have filed motions with the PUCO requesting all collected pre-construction costs be refunded to Ohio ratepayers with interest.
Management cannot predict the outcome of any cost recovery litigation concerning the Ohio IGCC plant or what effect, if any, such litigation would have on future net income and cash flows. However, if OPCo is required to refund pre-construction costs collected, it could reduce future net income and cash flows and impact financial condition.
SWEPCo Rate Matters
Turk Plant
SWEPCo is currently constructing the Turk Plant, a new base load 600 MW pulverized coal ultra-supercritical generating unit in Arkansas, which is expected to be in service in the fourth quarter of 2012. SWEPCo owns 73% (440 MW) of the Turk Plant and will operate the completed facility. The Turk Plant is currently estimated to cost $1.8 billion, excluding AFUDC, plus an additional $122 million for transmission, excluding AFUDC. SWEPCo’s share is currently estimated to cost $1.3 billion, excluding AFUDC, plus the additional $122 million for transmission, excluding AFUDC. As of December 31, 2011, excluding costs attributable to its joint owners and a provision for a Texas capital costs cap, SWEPCo has capitalized approximately $1.4 billion of expenditures (including AFUDC and capitalized interest of $220 million and related transmission costs of $104 million). As of December 31, 2011, the joint owners and SWEPCo have contractual construction obligations of approximately $125 million (including related transmission costs of $8 million). SWEPCo’s share of the contractual construction obligations is $94 million.
The APSC granted approval for SWEPCo to build the Turk Plant by issuing a Certificate of Environmental Compatibility and Public Need (CECPN) for the 88 MW SWEPCo Arkansas jurisdictional share of the Turk Plant. Following an appeal by certain intervenors, the Arkansas Supreme Court issued a decision that reversed the APSC’s grant of the CECPN. SWEPCo filed a notice with the APSC of its intent to proceed with construction of the Turk Plant but that SWEPCo no longer intends to pursue a CECPN to seek recovery of the originally approved 88 MW portion of Turk Plant costs in Arkansas retail rates.
The PUCT issued an order approving a Certificate of Convenience and Necessity (CCN) for the Turk Plant with the following conditions: (a) a cap on the recovery of jurisdictional capital costs for the Turk Plant based on the previously estimated $1.522 billion projected construction cost, excluding AFUDC and related transmission costs, (b) a cap on recovery of annual CO2 emission costs at $28 per ton through the year 2030 and (c) a requirement to hold Texas ratepayers financially harmless from any adverse impact related to the Turk Plant not being fully subscribed to by other utilities or wholesale customers. SWEPCo appealed the PUCT’s order contending the two cost cap restrictions are unlawful. The Texas Industrial Energy Consumers filed an appeal contending that the PUCT’s grant of a conditional CCN for the Turk Plant should be revoked because the Turk Plant is unnecessary to serve retail customers. In February 2010, the Texas District Court affirmed the PUCT’s order in all respects. In March 2010, SWEPCo and the Texas Industrial Energy Consumers appealed this decision to the Texas Court of Appeals. In November 2011, the Texas Court of Appeals affirmed the PUCT’s order in all respects. As a result, in the fourth quarter of 2011, SWEPCo recorded a pretax write-off of $49 million in Asset Impairments and Other Related Charges on the statement of income related to the estimated excess of the Texas jurisdictional portion of the Turk Plant above the Texas jurisdictional capital costs cap. In December 2011, SWEPCo and the Texas Industrial Energy Consumers filed motions for rehearing at the Texas Court of Appeals which were denied in January 2012. SWEPCo intends to seek review of the Texas Court of Appeals decision at the Supreme Court of Texas.

76
Several parties, including the Hempstead County Hunting Club, the Sierra Club and the National Audubon Society had challenged the air permit, the wastewater discharge permit and the wetlands permit that were issued for the Turk Plant. Those parties also sought a temporary restraining order and preliminary injunction to stop construction of the Turk Plant. The motion for preliminary injunction was partially granted in 2010. In 2011, SWEPCo entered into settlement agreements with these parties which resolved all outstanding issues related to the permits and the APSC’s grant of a CECPN. The parties dismissed all pending permit and CECPN challenges at the APSC, other administrative agencies and the courts. If SWEPCo cannot recover all of its investment and expenses related to the Turk Plant, it would materially reduce future net income and cash flows and materially impact financial condition. Texas Turk Plant Rate Plan In August 2011, SWEPCo requested approval of a plan from the PUCT for including the Turk Plant investment in Texas retail rates. SWEPCo’s application was dismissed in December 2011. The PUCT stated that, as a matter of policy, the PUCT would not order a return on CWIP outside of a full base rate case proceeding. SWEPCo intends to file a full base rate case in 2012 with a proposed rate increase closely aligned with the commercial operation date of the Turk Plant. TCC Rate Matters TEXAS RESTRUCTURING Texas Restructuring Appeals
Pursuant to PUCT restructuring orders, TCC securitized net recoverable stranded generation costs of $2.5 billion and is recovering the principal and interest on the securitization bonds through the end of 2020. TCC also refunded other net true-up regulatory liabilities of $375 million during the period October 2006 through June 2008 via a CTC credit rate rider under PUCT restructuring orders. TCC and intervenors appealed the PUCT’s true-up related orders. After rulings from the Texas District Court and the Texas Court of Appeals, TCC, the PUCT and intervenors filed petitions for review with the Supreme Court of Texas. In July 2011, the Supreme Court of Texas issued its opinion reversing the PUCT’s 2006 order denying recovery of capacity auction true-up amounts and remanding for reconsideration the treatment of certain tax balances under normalization rules. In December 2011, the PUCT approved an unopposed stipulation allowing TCC to recover $800 million, including carrying charges, and retain contested tax balances in full satisfaction of its true-up proceeding. The following actions resulted from these decisions:
• Based upon the Supreme Court of Texas’ reversal of the PUCT’s capacity auction true-up disallowance, TCC recorded $421 million of pretax income ($273 million, net of tax) in Extraordinary Items, Net of Tax on the statement of income in the third quarter of 2011.
• In 2011, TCC recorded $271 million in pretax Carrying Costs Income on the statement of income related to the debt component of carrying costs for the period from January 2002 through December 2011. This carrying costs income represents previously unrecorded earnings associated with restructuring in Texas since 2002. The total regulatory asset related to the capacity auction true-up as of December 31, 2011 was $692 million, excluding unrecognized equity carrying costs. TCC plans to continue to recognize debt carrying costs income until securitization occurs and plans to recognize equity carrying costs income as collected from customers over the life of the securitization.
• The PUCT allowed TCC to retain contested tax balances in full satisfaction of its true-up proceeding, including carrying charges. TCC recorded the reversal of regulatory credits of $65 million ($42 million, net of tax) in Extraordinary Items, Net of Tax on the statement of income in the fourth quarter of 2011. Also, in the fourth quarter of 2011, TCC recorded $52 million in pretax Carrying Costs Income on the statement of income. TCC also recorded the reversal of $89 million of accumulated deferred investment tax credits ($58 million, net of tax) in Extraordinary Items, Net of Tax on the statement of income in the fourth quarter of 2011. See the “TCC Deferred Investment Tax Credits and Excess Deferred Federal Income Taxes” section below.
77
• The Supreme Court of Texas reversed the Texas Court of Appeals’ decision and found that the PUCT could adjust the net book value for what it determined to be commercially unreasonable conduct. This portion of the decision is unfavorable, but was already reflected in the financial statements.
• The Supreme Court of Texas affirmed the PUCT’s finding that the sales price should be used to value TCC’s nuclear generation. This portion of the decision is favorable, but this issue will have no impact on TCC’s rate recovery as this was already reflected in the financial statements.
• The Supreme Court of Texas reversed the Texas Court of Appeals’ decision and found it was appropriate for the PUCT to take into account previously refunded excess mitigation credits to affiliate retail electricity providers. This portion of the decision upheld the PUCT’s decision.
• The PUCT decisions allowing recovery of construction work in progress balances and specifying the interest rate on stranded costs were upheld. These decisions are already reflected in the financial statements and were not addressed in the remand proceeding.
The approved stipulation resolved all remaining issues in these dockets. In December 2011, TCC filed an application with the PUCT for a financing order to recover the $800 million through the issuance of securitization bonds as permitted by Texas statutory provisions. In January 2012, the PUCT approved the request. TCC anticipates issuing the bonds in March 2012. TCC Deferred Investment Tax Credits and Excess Deferred Federal Income Taxes In 2006, the PUCT reduced recovery of the amount securitized by $103 million of tax benefits including associated carrying costs related to TCC’s generation assets. In 2006, TCC obtained a private letter ruling from the IRS which confirmed that such a reduction was an IRS normalization violation. In 2008, the IRS issued final regulations, which supported the IRS’s private letter ruling which would make the refunding of or the reduction of the amount securitized by such tax benefits a normalization violation. After the IRS issued its final regulations, the tax normalization issue was remanded to the PUCT for its consideration of additional evidence including the IRS regulations. In December 2011, the PUCT approved an unopposed stipulation allowing TCC to retain contested tax balances in full satisfaction of its true-up proceeding, including carrying charges, in final resolution of this issue. See the “Texas Restructuring Appeals” section above. TCC Excess Earnings In 2005, a Texas appellate court issued a decision finding that a PUCT order requiring TCC to refund to the Texas Retail Electric Providers excess earnings prior to and outside of the true-up process was unlawful under the Texas Restructuring Legislation. From 2002 to 2005, TCC refunded $55 million of excess earnings, including interest, under the overturned PUCT order. In the true-up proceeding, the PUCT adjusted stranded costs for TCC’s payment of excess earnings under the PUCT order. However, the PUCT did not properly recognize TCC’s payment of interest under the prior order, causing TCC to refund interest twice. The Supreme Court of Texas approved the PUCT treatment of these matters in the true-up case, noting that TCC could pursue its additional interest claim in further proceedings related to the excess earnings order. TCC agreed to dismiss its claims as part of the stipulation approved by the PUCT in the true-up proceeding. See the “Texas Restructuring Appeals” section above. The dismissal did not have any impact on TCC’s rate recovery as this was already reflected in the financial statements.

78
APCo and WPCo Rate Matters 2011 Virginia Biennial Base Rate Case In March 2011, APCo filed a generation and distribution base rate request with the Virginia SCC to increase annual base rates by $126 million based upon an 11.65% return on common equity. The return on common equity included a requested 0.5% renewable portfolio standards (RPS) incentive as allowed by law. In November 2011, the Virginia SCC issued an order which approved a $55 million increase in generation and distribution base rates, effective February 2012, and a 10.9% return on common equity, which included a 0.5% RPS incentive. The $55 million increase included $39 million related to an increase in depreciation rates. Rate Adjustment Clauses
In 2007, the Virginia law governing the regulation of electric utility service was amended to, among other items, provide for rate adjustment clauses (RACs) beginning in January 2009 for the timely and current recovery of costs of: (a) transmission services billed by an RTO, (b) demand side management and energy efficiency programs, (c) renewable energy programs, (d) environmental compliance projects and (e) new generation facilities, including major unit modifications. In accordance with Virginia law, APCo is deferring incremental environmental costs incurred after December 2008 and renewable energy costs incurred after December 2007 which are not being recovered in current revenues. As of December 31, 2011, APCo has deferred $24 million of environmental costs, excluding $6 million of unrecognized equity carrying costs, incurred from January 2009 through December 2010, $18 million of environmental costs, excluding $4 million of unrecognized equity carrying costs, incurred in 2011 and $44 million of renewable energy costs. In March 2011, APCo filed for approval of an environmental RAC, a renewable energy program RAC and a generation RAC. The environmental RAC requested recovery of $77 million of incremental environmental compliance costs incurred from January 2009 through December 2010. The renewable energy program RAC requested recovery of $6 million for the incremental portion of deferred wind power costs for the Camp Grove and Fowler Ridge projects through December 2010. The generation RAC requested recovery of the Dresden Plant, which was placed into service in January 2012. With Virginia SCC approval, APCo purchased the Dresden Plant from AEGCo in August 2011 for $302 million. In August 2011, a stipulation was filed with the Virginia SCC related to the generation RAC. The stipulation requested recovery of the Dresden Plant costs totaling up to $27 million annually, effective March 2012. In January 2012, the Virginia SCC issued an order which modified and approved the stipulation to allow APCo to recover $26 million annually, effective March 2012. In November 2011, the Virginia SCC issued an order which approved recovery of $6 million for the incremental portion of deferred wind power costs for the Camp Grove and Fowler Ridge projects, effective February 2012. In addition, the order found that APCo can recover the non-incremental deferred wind power costs of $27 million as of December 31, 2011 through the FAC. Also in November 2011, the Virginia SCC issued an order which approved environmental RAC recovery of $30 million to be collected over one year beginning in February 2012. The Virginia SCC denied recovery of certain environmental costs. As a result, in the fourth quarter of 2011, APCo recorded a pretax write-off of $31 million on the statement of income related to environmental compliance costs incurred from January 2009 through December 2010. In December 2011, APCo filed a notice of appeal with the Supreme Court of Virginia regarding the Virginia SCC’s environmental RAC decision. If the Virginia SCC were to disallow a portion of APCo’s deferred environmental compliance costs incurred since January 2011, it would reduce future net income and cash flows.

79
2010 West Virginia Base Rate Case In May 2010, APCo and WPCo filed a request with the WVPSC to increase annual base rates by $156 million based upon an 11.75% return on common equity. In March 2011, the WVPSC modified and approved a settlement agreement which increased annual base rates by approximately $51 million based upon a 10% return on common equity, effective April 2011. The settlement agreement also resulted in a pretax write-off of a portion of the Mountaineer Carbon Capture and Storage Product Validation Facility in March 2011. See “Mountaineer Carbon Capture and Storage Project” section below. In addition, the WVPSC allowed APCo to defer and amortize $18 million of previously expensed 2009 incremental storm expenses and allowed APCo and WPCo to defer and amortize $15 million of previously expensed costs related to the 2010 cost reduction initiatives, each over a period of seven years. Mountaineer Carbon Capture and Storage Project Product Validation Facility (PVF)
APCo and ALSTOM Power, Inc., an unrelated third party, jointly constructed a CO2 capture validation facility, which was placed into service in September 2009. APCo also constructed and owns the necessary facilities to store the CO2. In October 2009, APCo started injecting CO2 into the underground storage facilities. The injection of CO2 required the recording of an asset retirement obligation and an offsetting regulatory asset. In May 2011, the PVF ended operations. In APCo’s and WPCo’s May 2010 West Virginia base rate filing, APCo and WPCo requested rate base treatment of the PVF, including recovery of the related asset retirement obligation regulatory asset amortization and accretion. In March 2011, a WVPSC order denied the request for rate base treatment of the PVF largely due to its experimental operation. The base rate order provided that should APCo construct a commercial scale carbon capture and sequestration (CCS) facility, only the West Virginia portion of the PVF costs, based on load sharing among certain AEP operating companies, may be considered used and useful plant in service and included in future rate base. See “2010 West Virginia Base Rate Case” section above. In 2011, APCo recorded a net pretax write-off of $14 million in Other Operation expense on the statement of income related to the write-off of a portion of the West Virginia jurisdictional share of the PVF offset by an asset retirement obligation adjustment. As of December 31, 2011, APCo has recorded $14 million in Regulatory Assets on the balance sheet related to the PVF. If APCo cannot recover its remaining PVF investment and related accretion expenses, it would reduce future net income and cash flows. Carbon Capture and Sequestration Project with the Department of Energy (DOE) (Commercial Scale Project)
During 2010, AEPSC, on behalf of APCo, began the project definition stage for the potential construction of a new commercial scale CCS facility at the Mountaineer Plant. The DOE agreed to fund 50% of allowable costs incurred for the CCS facility up to a maximum of $334 million. A Front-End Engineering and Design (FEED) study was completed during the third quarter of 2011. Management postponed any further CCS project activities because of the uncertainty about the regulation of CO2. In June 2011, the FEED study costs were allocated among the AEP East companies, PSO and SWEPCo based on eligible plants that could potentially benefit from the carbon capture. As of December 31, 2011, APCo has incurred $34 million in total project costs and has received $20 million of DOE and other eligible funding resulting in $14 million of net costs, of which $8 million was written off. The remaining $6 million in net costs are recorded in Regulatory Assets on the balance sheet. If the costs of the CCS project cannot be recovered, it would reduce future net income and cash flows. APCo’s Filings for an IGCC Plant
Through December 31, 2011, APCo deferred for future recovery pre-construction IGCC costs of approximately $9 million applicable to its West Virginia jurisdiction, approximately $2 million applicable to its FERC jurisdiction and approximately $9 million applicable to its Virginia jurisdiction. APCo will not start construction of the IGCC plant until sufficient assurance of full cost recovery exists in Virginia and West Virginia. If the plant is cancelled, APCo plans to seek recovery of its prudently incurred deferred pre-construction costs. If the costs are not recoverable, it would reduce future net income and cash flows and impact financial condition.
80
APCo’s and WPCo’s Expanded Net Energy Charge (ENEC) Filing In September 2009, the WVPSC issued an order approving APCo’s and WPCo’s March 2009 ENEC request. The approved order provided for recovery of an under-recovered balance plus a projected increase in ENEC costs over a four-year phase-in period with an overall increase of $355 million and a first-year increase of $124 million, effective October 2009. In June 2010, the WVPSC approved a settlement agreement for $96 million, including $10 million of construction surcharges related to APCo’s and WPCo’s second year ENEC increase. The settlement agreement allows APCo to accrue a weighted average cost of a capital carrying charge on the excess under-recovery balance due to the ENEC phase-in as adjusted for the impacts of accumulated deferred income taxes. The new rates became effective in July 2010. In June 2011, the WVPSC issued an order approving a $98 million annual increase including $8 million of construction surcharges and $8 million of carrying charges related to APCo’s and WPCo’s third year ENEC increase. The order also allows APCo to accrue a fixed annual carrying cost rate of 4%. The new rates became effective in July 2011. Additionally, the order approved APCo’s request to purchase the Dresden Plant from AEGCo and approved deferral of post in-service Dresden Plant costs, including a return, for future recovery. APCo purchased the Dresden Plant from AEGCo in August 2011 for $302 million. As of December 31, 2011, APCo’s ENEC under-recovery balance of $359 million was recorded in Regulatory Assets on the balance sheet, excluding $7 million of unrecognized equity carrying costs. If the WVPSC were to disallow a portion of APCo’s and WPCo’s deferred ENEC costs, it could reduce future net income and cash flows and impact financial condition. PSO Rate Matters PSO 2008 Fuel and Purchased Power
In July 2009, the OCC initiated a proceeding to review PSO’s fuel and purchased power adjustment clause for the calendar year 2008 and also initiated a prudence review of the related costs. In March 2010, the Oklahoma Attorney General and the Oklahoma Industrial Energy Consumers (OIEC) recommended the fuel clause adjustment rider be amended so that the shareholder’s portion of off-system sales margins decrease from 25% to 10%. The OIEC also recommended that the OCC conduct a comprehensive review of all affiliate fuel transactions during 2007 and 2008. In July 2010, additional testimony regarding the 2007 transfer of ERCOT trading contracts to AEPEP was filed. The testimony included unquantified refund recommendations relating to re-pricing of those ERCOT trading contracts. Hearings were held in June 2011. If the OCC were to issue an unfavorable decision, it could reduce future net income and cash flows and impact financial condition. I&M Rate Matters
Michigan 2009 and 2010 Power Supply Cost Recovery (PSCR) Reconciliation (Cook Plant Unit 1 Fire and
Shutdown) In March 2010, I&M filed its 2009 PSCR reconciliation with the MPSC. The filing included an adjustment to exclude from the PSCR the incremental fuel cost of replacement power due to the Cook Plant Unit 1 (Unit 1) outage from mid-December 2008 through December 2009, the period during which I&M received and recognized accidental outage insurance proceeds. In October 2010, a settlement agreement was filed with the MPSC which included deferring the Unit 1 outage issue to the 2010 PSCR reconciliation. In November 2011, the MPSC approved a settlement agreement for the 2010 PSCR reconciliation which resolved the Unit 1 outage issue by ordering no disallowances associated with the Unit 1 outage issue. See the “Cook Plant Unit 1 Fire and Shutdown” section of Note 5.
81
2011 Michigan Base Rate Case
In July 2011, I&M filed a request with the MPSC for an annual increase in Michigan base rates of $25 million and a return on common equity of 11.15%. The request included an increase in depreciation rates that would result in a $6 million increase in annual depreciation expense. An interim rate increase of $16 million annually was implemented in January 2012, subject to refund.
In February 2012, the MPSC approved a settlement agreement which increased annual base rates by approximately $15 million, effective April 2012, based upon a return on common equity of 10.2% and included a $5 million annual increase in depreciation rates. The approved settlement agreement also excluded the Michigan jurisdictional share of the net costs of the Cook Plant Unit 1 (Unit 1) turbine replacement from rate base but provided for a return on and of the net cost as a regulatory asset, effective February 2012. As of December 31, 2011, the Michigan jurisdictional share of the net costs of the Unit 1 turbine replacement was $9 million. Future rate recovery of the regulatory asset will be reviewed in a future rate proceeding.
2011 Indiana Base Rate Case
In September 2011, I&M filed a request with the IURC for a net annual increase in Indiana base rates of $149 million based upon a return on common equity of 11.15%. The request included an increase in depreciation rates that would result in a $25 million increase in annual depreciation expense.
FERC Rate Matters
Seams Elimination Cost Allocation (SECA) Revenue Subject to Refund
In 2004, AEP eliminated transaction-based through-and-out transmission service charges and collected, at the FERC’s direction, load-based charges, referred to as RTO SECA through March 2006. Intervenors objected and the FERC set SECA rate issues for hearing and ordered that the SECA rate revenues be collected, subject to refund. The AEP East companies recognized gross SECA revenues of $220 million. In 2006, a FERC Administrative Law Judge issued an initial decision finding that the SECA rates charged were unfair, unjust and discriminatory and that new compliance filings and refunds should be made.
AEP filed briefs jointly with other affected companies asking the FERC to reverse the decision. In May 2010, the FERC issued an order that generally supported AEP’s position and required a compliance filing to be filed with the FERC by August 2010. In August 2010, the affected companies, including the AEP East companies, filed a compliance filing with the FERC. If the compliance filing is accepted, the AEP East companies would have to pay refunds of approximately $20 million including estimated interest of $5 million. The AEP East companies could also potentially receive payments up to approximately $10 million including estimated interest of $3 million. A decision is pending from the FERC.
The FERC has approved settlements applicable to $112 million of SECA revenue. The AEP East companies provided reserves for net refunds for SECA settlements applicable to the remaining $108 million of SECA revenues collected. Based on the analysis of the May 2010 order and the compliance filing, management believes that the reserve is adequate to pay the refunds, including interest, that will be required should the compliance filing be made final. Management cannot predict the ultimate outcome of this proceeding at the FERC which could impact future net income and cash flows.
Possible Termination of the Interconnection Agreement
In December 2010, each of the AEP Power Pool members gave notice to AEPSC and each other of their decision to terminate the Interconnection Agreement effective January 2014 or such other date approved by FERC, subject to state regulatory input. In February 2012, an application was filed with the FERC proposing to establish a new power cost sharing agreement between APCo, I&M and KPCo. If any of the AEP Power Pool members experience decreases in revenues or increases in costs as a result of the termination of the AEP Power Pool and are unable to recover the change in revenues and costs through rates, prices or additional sales, it could reduce future net income and cash flows. As a result of the February 2012 ESP rehearing order, management is in the process of withdrawing the PUCO and FERC applications. See “January 2012 – May 2016 ESP” section of the OPCo rate matters.

82
PJM/MISO Market Flow Calculation Settlement Adjustments During 2009, an analysis conducted by MISO and PJM discovered several instances of unaccounted for power flows on numerous coordinated flowgates. These flows affected the settlement data for congestion revenues and expenses and dated back to the start of the MISO market in 2005. In January 2011, PJM and MISO reached a settlement agreement where the parties agreed to net various issues to zero. In June 2011, the FERC approved the settlement agreement.

83
4. EFFECTS OF REGULATION
Regulatory assets are comprised of the following items:
December 31, Remaining 2011 2010 Recovery Period
Current Regulatory Assets (in millions)
Under-recovered Fuel Costs - earns a return $ 56 $ 73 1 year Under-recovered Fuel Costs - does not earn a return 9 8 1 year
Total Current Regulatory Assets $ 65 $ 81
Noncurrent Regulatory Assets
Regulatory assets not yet being recovered pending future proceedings to determine the recovery method and timing: Regulatory Assets Currently Earning a Return Storm Related Costs $ 24 $ 55 Economic Development Rider 13 6 Customer Choice Deferrals - 59 Line Extension Carrying Costs - 55 Acquisition of Monongahela Power - 8 Other Regulatory Assets Not Yet Being Recovered - 1 Regulatory Assets Currently Not Earning a Return Deferred Wind Power Costs 38 29 Environmental Rate Adjustment Clause 18 56 Mountaineer Carbon Capture and Storage Product Validation Facility 14 60 Special Rate Mechanism for Century Aluminum 13 13 Litigation Settlement 11 - Storm Related Costs 10 45 Acquisition of Monongahela Power - 4 Other Regulatory Assets Not Yet Being Recovered 14 4
Total Regulatory Assets Not Yet Being Recovered 155 395
Regulatory assets being recovered: Regulatory Assets Currently Earning a Return Capacity Auction True-Up 692 - 13 years Fuel Adjustment Clause 521 476 7 years Expanded Net Energy Charge 327 361 2 years Distribution Asset Recovery Rider 173 - 7 years Unamortized Loss on Reacquired Debt 92 93 32 years Storm Related Costs 65 38 7 years Meter Replacement Costs 39 4 29 years Transmission Cost Recovery Rider 28 - 2 years RTO Formation/Integration Costs 18 21 8 years Economic Development Rider 12 1 1 year Red Rock Generating Facility 10 10 45 years Other Regulatory Assets Being Recovered 15 17 various Regulatory Assets Currently Not Earning a Return Pension and OPEB Funded Status 2,308 2,161 13 years Income Taxes, Net 1,237 1,097 37 years Postemployment Benefits 47 51 4 years Cook Nuclear Plant Refueling Outage Levelization 41 54 2 years Storm Related Costs 35 21 7 years Expanded Net Energy Charge 32 - 6 years Environmental Rate Adjustment Clause 24 - 2 years Deferred PJM Fees 22 7 1 year Transmission Rate Adjustment Clause 20 19 2 years Deferred Restructuring Costs 18 6 7 years Unrealized Loss on Forward Commitments 16 10 2 years Asset Retirement Obligation 14 15 9 years Vegetation Management 11 13 1 year Restructuring Transition Costs 8 14 5 years Off-system Sales Margin Sharing - 13 Other Regulatory Assets Being Recovered 46 46 various
Total Regulatory Assets Being Recovered 5,871 4,548
Total Noncurrent Regulatory Assets $ 6,026 $ 4,943

84
Regulatory liabilities are comprised of the following items: December 31, Remaining 2011 2010 Refund Period
Current Regulatory Liabilities (in millions)
Over-recovered Fuel Costs - pays a return $ 5 $ 16 1 year
Over-recovered Fuel Costs - does not pay a return 3 1 1 year
Total Current Regulatory Liabilities $ 8 $ 17
Noncurrent Regulatory Liabilities and Deferred Investment Tax Credits
Regulatory liabilities not yet being paid: Regulatory Liabilities Currently Paying a Return Refundable Construction Financing Costs $ 53 $ 20 Other Regulatory Liabilities Not Yet Being Paid 5 - Regulatory Liabilities Currently Not Paying a Return
Over-recovery of Costs Related to gridSMART® 4 10 Other Regulatory Liabilities Not Yet Being Paid 4 11
Total Regulatory Liabilities Not Yet Being Paid 66 41
Regulatory liabilities being paid: Regulatory Liabilities Currently Paying a Return Asset Removal Costs 2,270 2,222 (a)
Advanced Metering Infrastructure Surcharge 78 61 9 years
Deferred Investment Tax Credits 27 32 11 years
Excess Earnings 13 13 42 years
Other Regulatory Liabilities Being Paid 4 4 various
Regulatory Liabilities Currently Not Paying a Return
Excess Asset Retirement Obligations for Nuclear Decommissioning
Liability 377 354 (b)
Deferred Investment Tax Credits 144 242 75 years
Spent Nuclear Fuel Liability 43 42 (b)
Unrealized Gain on Forward Commitments 41 60 5 years
Over-recovery of Transition Charges 41 38 10 years
Energy Efficiency/Peak Demand Reduction 40 10 1 year
Deferred State Income Tax Coal Credits 29 29 10 years
Over-recovery of PJM Expenses - 12
Other Regulatory Liabilities Being Paid 22 11 various
Total Regulatory Liabilities Being Paid 3,129 3,130
Total Noncurrent Regulatory Liabilities and Deferred Investment Tax
Credits $ 3,195 $ 3,171
(a) Relieved as removal costs are incurred.
(b) Relieved when plant is decommissioned.
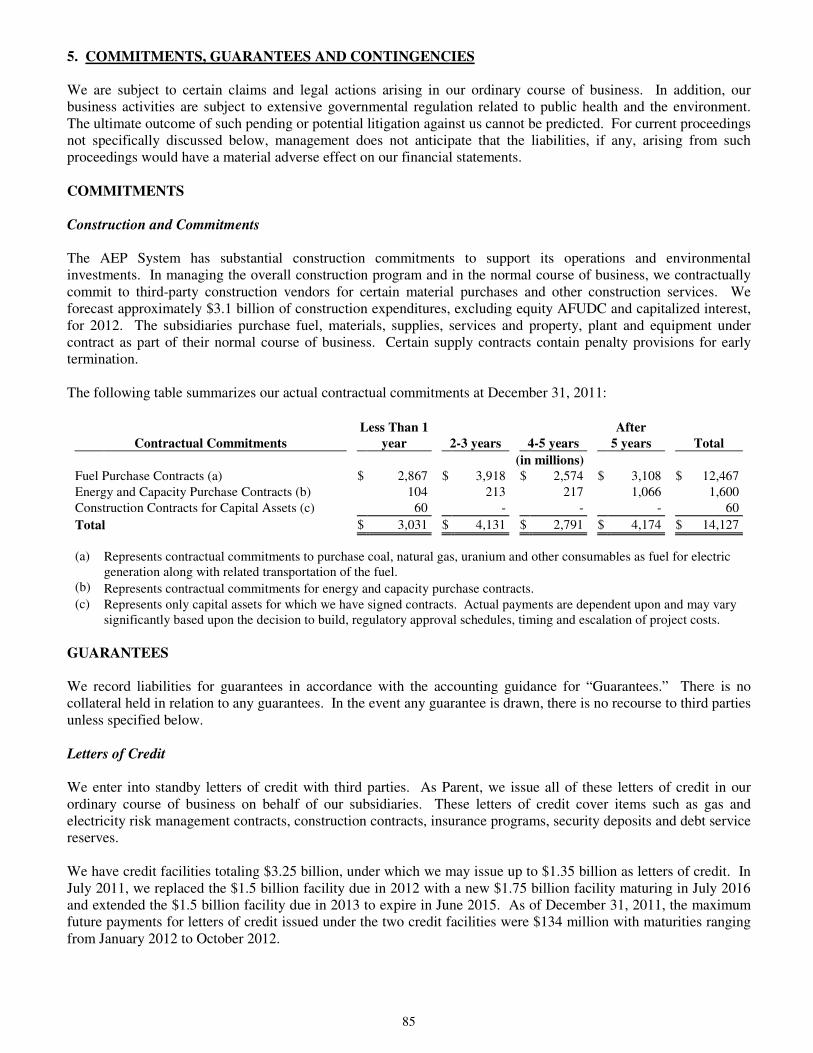
85
5. COMMITMENTS, GUARANTEES AND CONTINGENCIES We are subject to certain claims and legal actions arising in our ordinary course of business. In addition, our business activities are subject to extensive governmental regulation related to public health and the environment. The ultimate outcome of such pending or potential litigation against us cannot be predicted. For current proceedings not specifically discussed below, management does not anticipate that the liabilities, if any, arising from such proceedings would have a material adverse effect on our financial statements. COMMITMENTS Construction and Commitments The AEP System has substantial construction commitments to support its operations and environmental investments. In managing the overall construction program and in the normal course of business, we contractually commit to third-party construction vendors for certain material purchases and other construction services. We forecast approximately $3.1 billion of construction expenditures, excluding equity AFUDC and capitalized interest, for 2012. The subsidiaries purchase fuel, materials, supplies, services and property, plant and equipment under contract as part of their normal course of business. Certain supply contracts contain penalty provisions for early termination. The following table summarizes our actual contractual commitments at December 31, 2011: Less Than 1 After
Contractual Commitments year 2-3 years 4-5 years 5 years Total
(in millions)
Fuel Purchase Contracts (a) $ 2,867 $ 3,918 $ 2,574 $ 3,108 $ 12,467
Energy and Capacity Purchase Contracts (b) 104 213 217 1,066 1,600
Construction Contracts for Capital Assets (c) 60 - - - 60
Total $ 3,031 $ 4,131 $ 2,791 $ 4,174 $ 14,127
(a) Represents contractual commitments to purchase coal, natural gas, uranium and other consumables as fuel for electric
generation along with related transportation of the fuel.
(b) Represents contractual commitments for energy and capacity purchase contracts.
(c) Represents only capital assets for which we have signed contracts. Actual payments are dependent upon and may vary
significantly based upon the decision to build, regulatory approval schedules, timing and escalation of project costs.
GUARANTEES We record liabilities for guarantees in accordance with the accounting guidance for “Guarantees.” There is no collateral held in relation to any guarantees. In the event any guarantee is drawn, there is no recourse to third parties unless specified below. Letters of Credit We enter into standby letters of credit with third parties. As Parent, we issue all of these letters of credit in our ordinary course of business on behalf of our subsidiaries. These letters of credit cover items such as gas and electricity risk management contracts, construction contracts, insurance programs, security deposits and debt service reserves. We have credit facilities totaling $3.25 billion, under which we may issue up to $1.35 billion as letters of credit. In July 2011, we replaced the $1.5 billion facility due in 2012 with a new $1.75 billion facility maturing in July 2016 and extended the $1.5 billion facility due in 2013 to expire in June 2015. As of December 31, 2011, the maximum future payments for letters of credit issued under the two credit facilities were $134 million with maturities ranging from January 2012 to October 2012.

86
In March 2011, we terminated a $478 million credit agreement that was scheduled to mature in April 2011 and was used to support $472 million of variable rate Pollution Control Bonds. In March 2011, we remarketed $357 million of variable rate Pollution Control Bonds supported by bilateral letters of credit for $361 million. The letters of credit have maturities ranging from March 2013 to March 2014. The remaining $115 million of Pollution Control Bonds were reacquired and are held by trustees. In July 2011, we remarketed $45 million of variable rate Pollution Control Bonds supported by bilateral letters of credit for $46 million. The letters of credit mature in July 2014. Guarantees of Third-Party Obligations
SWEPCo As part of the process to receive a renewal of a Texas Railroad Commission permit for lignite mining, SWEPCo provides guarantees of mine reclamation. In July 2011, SWEPCo’s guarantee was increased from $65 million to $100 million due to expansion of the mining area. Since SWEPCo uses self-bonding, the guarantee provides for SWEPCo to commit to use its resources to complete the reclamation in the event the work is not completed by Sabine. This guarantee ends upon depletion of reserves and completion of final reclamation. Based on the latest study, we estimate the reserves will be depleted in 2036 with final reclamation completed by 2046 at an estimated cost of approximately $58 million. As of December 31, 2011, SWEPCo has collected approximately $54 million through a rider for final mine closure and reclamation costs, of which $2 million is recorded in Other Current Liabilities, $22 million is recorded in Deferred Credits and Other Noncurrent Liabilities and $30 million is recorded in Asset Retirement Obligations on our balance sheets. Sabine charges SWEPCo, its only customer, all of its costs. SWEPCo passes these costs to customers through its fuel clause. Indemnifications and Other Guarantees Contracts
We enter into several types of contracts which require indemnifications. Typically these contracts include, but are not limited to, sale agreements, lease agreements, purchase agreements and financing agreements. Generally, these agreements may include, but are not limited to, indemnifications around certain tax, contractual and environmental matters. With respect to sale agreements, our exposure generally does not exceed the sale price. The status of certain sale agreements is discussed in the “Dispositions” section of Note 6. As of December 31, 2011, there were no material liabilities recorded for any indemnifications. Lease Obligations
We lease certain equipment under master lease agreements. See “Master Lease Agreements” and “Railcar Lease” sections of Note 12 for disclosure of lease residual value guarantees. ENVIRONMENTAL CONTINGENCIES Carbon Dioxide Public Nuisance Claims In 2004, eight states and the City of New York filed an action in Federal District Court for the Southern District of New York against AEP, AEPSC, Cinergy Corp, Xcel Energy, Southern Company and Tennessee Valley Authority. The Natural Resources Defense Council, on behalf of three special interest groups, filed a similar complaint against the same defendants. The actions allege that CO2 emissions from the defendants’ power plants constitute a public nuisance under federal common law due to impacts of global warming and sought injunctive relief in the form of specific emission reduction commitments from the defendants. The trial court dismissed the lawsuits.

87
In September 2009, the Second Circuit Court of Appeals issued a ruling on appeal remanding the cases to the Federal District Court for the Southern District of New York. The Second Circuit held that the issues of climate change and global warming do not raise political questions and that Congress’ refusal to regulate CO2 emissions does not mean that plaintiffs must wait for an initial policy determination by Congress or the President’s administration to secure the relief sought in their complaints. In 2010, the U.S. Supreme Court granted the defendants’ petition for review. In June 2011, the U.S. Supreme Court reversed and remanded the case to the Court of Appeals, finding that plaintiffs’ federal common law claims are displaced by the regulatory authority granted to the Federal EPA under the CAA. After the remand, the plaintiffs asked the Second Circuit to return the case to the district court so that they could withdraw their complaints. The cases were returned to the district court and the plaintiffs’ federal common law claims were dismissed in December 2011. In October 2009, the Fifth Circuit Court of Appeals reversed a decision by the Federal District Court for the District of Mississippi dismissing state common law nuisance claims in a putative class action by Mississippi residents asserting that CO2 emissions exacerbated the effects of Hurricane Katrina. The Fifth Circuit held that there was no exclusive commitment of the common law issues raised in plaintiffs’ complaint to a coordinate branch of government and that no initial policy determination was required to adjudicate these claims. The court granted petitions for rehearing. An additional recusal left the Fifth Circuit without a quorum to reconsider the decision and the appeal was dismissed, leaving the district court’s decision in place. Plaintiffs filed a petition with the U.S. Supreme Court asking the court to remand the case to the Fifth Circuit and reinstate the panel decision. The petition was denied in January 2011. Plaintiffs refiled their complaint in federal district court. The court ordered all defendants to respond to the refiled complaints in October 2011. We believe the claims are without merit, and in addition to other defenses, are barred by the doctrine of collateral estoppel and the applicable statute of limitations. We intend to defend against the claims. We are unable to determine a range of potential losses that are reasonably possible of occurring. Alaskan Villages’ Claims In 2008, the Native Village of Kivalina and the City of Kivalina, Alaska filed a lawsuit in Federal Court in the Northern District of California against AEP, AEPSC and 22 other unrelated defendants including oil and gas companies, a coal company and other electric generating companies. The complaint alleges that the defendants' emissions of CO2 contribute to global warming and constitute a public and private nuisance and that the defendants are acting together. The complaint further alleges that some of the defendants, including AEP, conspired to create a false scientific debate about global warming in order to deceive the public and perpetuate the alleged nuisance. The plaintiffs also allege that the effects of global warming will require the relocation of the village at an alleged cost of $95 million to $400 million. In October 2009, the judge dismissed plaintiffs’ federal common law claim for nuisance, finding the claim barred by the political question doctrine and by plaintiffs’ lack of standing to bring the claim. The judge also dismissed plaintiffs’ state law claims without prejudice to refiling in state court. The plaintiffs appealed the decision. The defendants requested that the court defer setting this case for oral argument until after the Supreme Court issues its decision in the CO2 public nuisance case discussed above. The court accepted supplemental briefing on the impact of the Supreme Court’s decision and heard oral argument in November 2011. We believe the action is without merit and intend to defend against the claims. We are unable to determine a range of potential losses that are reasonably possible of occurring. The Comprehensive Environmental Response Compensation and Liability Act (Superfund) and State
Remediation By-products from the generation of electricity include materials such as ash, slag, sludge, low-level radioactive waste and SNF. Coal combustion by-products, which constitute the overwhelming percentage of these materials, are typically treated and deposited in captive disposal facilities or are beneficially utilized. In addition, our generating plants and transmission and distribution facilities have used asbestos, polychlorinated biphenyls and other hazardous and nonhazardous materials. We currently incur costs to dispose of these substances safely.

88
Superfund addresses clean-up of hazardous substances that have been released to the environment. The Federal EPA administers the clean-up programs. Several states have enacted similar laws. At December 31, 2011, our subsidiaries are named by the Federal EPA as a Potentially Responsible Party (PRP) for four sites for which alleged liability is unresolved. There are nine additional sites for which our subsidiaries have received information requests which could lead to PRP designation. Our subsidiaries have also been named potentially liable at four sites under state law including the I&M site discussed in the next paragraph. In those instances where we have been named a PRP or defendant, our disposal or recycling activities were in accordance with the then-applicable laws and regulations. Superfund does not recognize compliance as a defense, but imposes strict liability on parties who fall within its broad statutory categories. Liability has been resolved for a number of sites with no significant effect on net income. In 2008, I&M received a letter from the Michigan Department of Environmental Quality (MDEQ) concerning conditions at a site under state law and requesting I&M take voluntary action necessary to prevent and/or mitigate public harm. I&M started remediation work in accordance with a plan approved by MDEQ. I&M’s provision is approximately $10 million. As the remediation work is completed, I&M’s cost may continue to increase as new information becomes available concerning either the level of contamination at the site or changes in the scope of remediation required by the MDEQ. We cannot predict the amount of additional cost, if any. We evaluate the potential liability for each Superfund site separately, but several general statements can be made about our potential future liability. Allegations that materials were disposed at a particular site are often unsubstantiated and the quantity of materials deposited at a site can be small and often nonhazardous. Although Superfund liability has been interpreted by the courts as joint and several, typically many parties are named as PRPs for each site and several of the parties are financially sound enterprises. At present, our estimates do not anticipate material cleanup costs for any of our identified Superfund sites, except the I&M site discussed above. Amos Plant – State and Federal Enforcement Proceedings In March 2010, we received a letter from the West Virginia Department of Environmental Protection, Division of Air Quality (DAQ), alleging that at various times in 2007 through 2009 the units at Amos Plant reported periods of excess opacity (indicator of compliance with PM emission limits) that lasted for more than 30 consecutive minutes in a 24-hour period and that certain required notifications were not made. We met with representatives of DAQ to discuss these occurrences and the steps we have taken to prevent a recurrence. DAQ indicated that additional enforcement action may be taken, including imposition of a civil penalty of approximately $240 thousand. We have denied that violations of the reporting requirements occurred and maintain that the proper reporting was done. In March 2011, we resolved these issues through the entry of a consent order that included the payment of a $75 thousand civil penalty and certain improvements in our opacity reports. In March 2010, we received a request to show cause from the Federal EPA alleging that certain reporting requirements under Superfund and the Emergency Planning and Community Right-to-Know Act had been violated and inviting us to engage in settlement negotiations. The request includes a proposed civil penalty of approximately $300 thousand. We provided additional information to representatives of the Federal EPA. Based on the information we submitted, the Federal EPA determined that it will not further pursue enforcement for several alleged violations and we agreed to resolve the remaining allegations through a consent order that includes payment of a $36 thousand civil penalty. NUCLEAR CONTINGENCIES I&M owns and operates the two-unit 2,191 MW Cook Plant under licenses granted by the Nuclear Regulatory Commission (NRC). We have a significant future financial commitment to dispose of SNF and to safely decommission and decontaminate the plant. The licenses to operate the two nuclear units at the Cook Plant expire in 2034 and 2037. The operation of a nuclear facility also involves special risks, potential liabilities and specific regulatory and safety requirements. By agreement, I&M is partially liable, together with all other electric utility companies that own nuclear generating units, for a nuclear power plant incident at any nuclear plant in the U.S. Should a nuclear incident occur at any nuclear power plant in the U.S., the liability could be substantial.

89
Decommissioning and Low Level Waste Accumulation Disposal The cost to decommission a nuclear plant is affected by NRC regulations and the SNF disposal program. Decommissioning costs are accrued over the service life of the Cook Plant. The most recent decommissioning cost study was performed in 2009. According to that study, the estimated cost of decommissioning and disposal of low-level radioactive waste ranges from $831 million to $1.5 billion in 2009 nondiscounted dollars. The wide range in estimated costs is caused by variables in assumptions. I&M recovers estimated decommissioning costs for the Cook Plant in its rates. The amount recovered in rates was $14 million in 2011, $14 million in 2010 and $16 million in 2009. Reduced annual decommissioning cost recovery amounts reflect the units’ longer estimated life and operating licenses granted by the NRC. Decommissioning costs recovered from customers are deposited in external trusts. At December 31, 2011 and 2010, the total decommissioning trust fund balance was $1.3 billion and $1.2 billion, respectively. Trust fund earnings increase the fund assets and decrease the amount remaining to be recovered from ratepayers. The decommissioning costs (including interest, unrealized gains and losses and expenses of the trust funds) increase or decrease the recorded liability. I&M continues to work with regulators and customers to recover the remaining estimated costs of decommissioning the Cook Plant. However, future net income, cash flows and possibly financial condition would be adversely affected if the cost of SNF disposal and decommissioning continues to increase and cannot be recovered. SNF Disposal The Federal government is responsible for permanent SNF disposal and assesses fees to nuclear plant owners for SNF disposal. A fee of one mill per KWH for fuel consumed after April 6, 1983 at the Cook Plant is being collected from customers and remitted to the U.S. Treasury. At December 31, 2011 and 2010, fees and related interest of $265 million and $265 million, respectively, for fuel consumed prior to April 7, 1983 have been recorded as Long-term Debt and funds collected from customers along with related earnings totaling $308 million and $307 million, respectively, to pay the fee are recorded as part of Spent Nuclear Fuel and Decommissioning Trusts. I&M has not paid the government the pre-April 1983 fees due to continued delays and uncertainties related to the federal disposal program. In 2011, I&M signed a settlement agreement with the Federal government which permits I&M to make annual filings to recover certain SNF storage costs incurred as a result of the government’s delays in accepting SNF for permanent storage. Under the settlement agreement, I&M received $14 million to recover costs and will be eligible to receive additional payment of annual claims for allowed costs that are incurred through December 31, 2013. The proceeds reduced capital costs for dry cask storage. See “Fair Value Measurements of Trust Assets for Decommissioning and SNF Disposal” section of Note 10 for disclosure of the fair value of assets within the trusts. Nuclear Incident Liability I&M carries insurance coverage for property damage, decommissioning and decontamination at the Cook Plant in the amount of $1.8 billion. I&M purchases $1 billion of excess coverage for property damage, decommissioning and decontamination. Additional insurance provides coverage for a weekly indemnity payment resulting from an insured accidental outage. I&M utilizes an industry mutual insurer for the placement of this insurance coverage. Participation in this mutual insurance requires a contingent financial obligation of up to $41 million for I&M which is assessable if the insurer’s financial resources would be inadequate to pay for losses. The Price-Anderson Act, extended through December 31, 2025, establishes insurance protection for public liability arising from a nuclear incident at $12.6 billion and covers any incident at a licensed reactor in the U.S. Commercially available insurance, which must be carried for each licensed reactor, provides $375 million of coverage. In the event of a nuclear incident at any nuclear plant in the U.S., the remainder of the liability would be provided by a deferred premium assessment of $117.5 million on each licensed reactor in the U.S. payable in annual installments of $17.5 million. As a result, I&M could be assessed $235 million per nuclear incident payable in annual installments of $35 million. The number of incidents for which payments could be required is not limited.

90
In the event of an incident of a catastrophic nature, I&M is initially covered for the first $375 million through commercially available insurance. The next level of liability coverage of up to $12.2 billion would be covered by claims made under the Price-Anderson Act. If the liability were in excess of amounts recoverable from insurance and retrospective claim payments made under the Price-Anderson Act, I&M would seek to recover those amounts from customers through rate increases. In the event nuclear losses or liabilities are underinsured or exceed accumulated funds and recovery from customers is not possible, net income, cash flows and financial condition could be adversely affected. Cook Plant Unit 1 Fire and Shutdown
In September 2008, I&M shut down Cook Plant Unit 1 (Unit 1) due to turbine vibrations, caused by blade failure, which resulted in significant turbine damage and a small fire on the electric generator. This equipment, located in the turbine building, is separate and isolated from the nuclear reactor. The turbine rotors that caused the vibration were installed in 2006 and are within the vendor’s warranty period. The warranty provides for the repair or replacement of the turbine rotors if the damage was caused by a defect in materials or workmanship. Repair of the property damage and replacement of the turbine rotors and other equipment cost approximately $400 million. Management believes that I&M should recover a significant portion of these costs through the turbine vendor’s warranty, insurance and the regulatory process. Due to the extensive lead time required to manufacture and install new turbine rotors, I&M repaired Unit 1 and it resumed operations in December 2009 at slightly reduced power. The installation of the new turbine rotors and other equipment occurred as planned during the fall 2011 refueling outage of Unit 1. I&M maintains insurance through NEIL. As of December 31, 2011, we recorded $64 million in Prepayments and Other Current Assets on our balance sheets representing amounts due from NEIL under the insurance policies. Through December 31, 2011, I&M received partial payments of $203 million from NEIL for the cost incurred to date to repair the property damage. I&M also maintains a separate accidental outage policy with NEIL. In 2009, I&M recorded $185 million in revenue under the policy and reduced the cost of replacement power in customers’ bills by $78 million. NEIL is reviewing claims made under the insurance policies to ensure that claims associated with the outage are covered by the policies. The review by NEIL includes the timing of the unit’s return to service and whether the return should have occurred earlier reducing the amount received under the accidental outage policy. If the ultimate costs of the incident are not covered by warranty, insurance or through the regulatory process or if any future regulatory proceedings are adverse, it could have an adverse impact on net income, cash flows and financial condition. OPERATIONAL CONTINGENCIES Insurance and Potential Losses We maintain insurance coverage normal and customary for an integrated electric utility, subject to various deductibles. Our insurance includes coverage for all risks of physical loss or damage to our nonnuclear assets, subject to insurance policy conditions and exclusions. Covered property generally includes power plants, substations, facilities and inventories. Excluded property generally includes transmission and distribution lines, poles and towers. Our insurance programs also generally provide coverage against loss arising from certain claims made by third parties and are in excess of retentions absorbed by us. Coverage is generally provided by a combination of our protected cell of EIS and/or various industry mutual and/or commercial insurance carriers. See “Nuclear Contingencies” section of this footnote for a discussion of nuclear exposures and related insurance. Some potential losses or liabilities may not be insurable or the amount of insurance carried may not be sufficient to meet potential losses and liabilities, including, but not limited to, liabilities relating to damage to the Cook Plant and costs of replacement power in the event of an incident at the Cook Plant. Future losses or liabilities, if they occur, which are not completely insured, unless recovered from customers, could have a material adverse effect on our net income, cash flows and financial condition.

91
Fort Wayne Lease Since 1975, I&M has leased certain energy delivery assets from the City of Fort Wayne, Indiana under a long-term lease that expired on February 28, 2010. I&M negotiated with Fort Wayne to purchase the assets at the end of the lease and reached an agreement (subject to IURC approval) in 2010. The agreement required I&M to purchase the remaining leased property and settled claims Fort Wayne asserted. The agreement provided that I&M pay Fort Wayne a total of $39 million, including interest, over 15 years and Fort Wayne recognized that I&M is the exclusive electricity supplier in the Fort Wayne area. In August 2011, the IURC approved a settlement agreement with the Indiana Office of Utility Consumer Counselor. The transaction is final. Enron Bankruptcy In 2001, we purchased Houston Pipeline Company (HPL) from Enron. Various HPL-related contingencies and indemnities from Enron remained unsettled at the date of Enron’s bankruptcy. In connection with our acquisition of HPL, we entered into an agreement with BAM Lease Company, which granted HPL the exclusive right to use approximately 55 billion cubic feet (BCF) of cushion gas required for the normal operation of the Bammel gas storage facility. At the time of our acquisition of HPL, BOA and certain other banks (the BOA Syndicate) and Enron entered into an agreement granting HPL the exclusive use of the cushion gas. Also at the time of our acquisition, Enron and the BOA Syndicate released HPL from all prior and future liabilities and obligations in connection with the financing arrangement. After the Enron bankruptcy, the BOA Syndicate informed HPL of a purported default by Enron under the terms of the financing arrangement. This dispute was litigated in the Enron bankruptcy proceedings and in federal courts in Texas and New York. In 2007, the judge in the New York action issued a decision on all claims, including those that were pending trial in Texas, granting BOA summary judgment and dismissing our claims. In August 2008, the New York court entered a final judgment of $346 million. In May 2009, the judge awarded $20 million of attorneys’ fees to BOA. We appealed these awards. In October 2010, the Court of Appeals affirmed the New York district court’s decision as to the final judgment of $346 million plus interest and reversed the New York district court decision as to the judgment dismissing our claims against BOA in the Southern District of Texas. In 2005, we sold our interest in HPL for approximately $1 billion. Although the assets were legally transferred, we were unable to determine all costs associated with the transfer until the BOA litigation was resolved. We indemnified the buyer of HPL against any damages up to the purchase price resulting from the BOA litigation, including the right to use the 55 BCF of natural gas through 2031. As a result, we deferred the entire gain related to the sale of HPL (approximately $380 million) pending resolution of the Enron and BOA disputes. The deferred gain related to the sale of HPL, plus accrued interest and attorneys’ fees related to the New York court’s judgment, was $448 million at December 31, 2010 and was included in Current Liabilities – Deferred Gain and Accrued Litigation Costs on the balance sheet. In February 2011, we reached a settlement covering all claims with BOA and Enron for $425 million. As part of the settlement, we received title to the 55 BCF of natural gas in the Bammel storage facility and recorded this asset at fair value. Under the HPL sales agreement, we have a service obligation to the buyer for the right to use the cushion gas through May 2031. We recognized the obligation as a liability and will amortize it over the life of the agreement. The settlement resulted in a pretax gain of $51 million and a net loss after tax of $22 million primarily due to an unrealized capital loss valuation allowance of $56 million.

92
At the time of the settlement, the following table sets forth its impact on our 2011 financial statements: Statement of Income: (in millions) Other Operation Expense - Pretax Gain on Settlement $ 51 Income Tax Expense 73
Net Loss After Tax $ (22)
Cash Flow Statement: Net Income - Loss on Settlement with BOA and Enron $ (22) Deferred Income Taxes 91 Gain on Settlement with BOA and Enron (51) Settlement of Litigation with BOA and Enron (211) Accrued Taxes, Net (18) Acquisition of Cushion Gas from BOA (214)
Cash Paid $ (425)
Balance Sheet: Deferred Charges and Other Noncurrent Assets - Gas Acquired $ 214 Deferred Credits and Other Noncurrent Liabilities - Gas Service Liability 187 Accrued Taxes - Tax Benefit on Settlement with BOA and Enron 18 Deferred Income Taxes - Deferred Tax Benefit on Gas Service Liability 66 Natural Gas Markets Lawsuits In 2002, the Lieutenant Governor of California filed a lawsuit in Los Angeles County California Superior Court against numerous energy companies, including AEP, alleging violations of California law through alleged fraudulent reporting of false natural gas price and volume information with an intent to affect the market price of natural gas and electricity. AEP was dismissed from the case. A number of similar cases were also filed in California and in state and federal courts in several states making essentially the same allegations under federal or state laws against the same companies. AEP (or a subsidiary) is among the companies named as defendants in some of these cases. In 2008, we settled all of the cases pending against us in California. In July 2011, the judge in the Federal District Court in Las Vegas granted summary judgment dismissing the cases where AEP companies were defendants. Also in July 2011, the plaintiffs in these cases filed notices of appeal to the Ninth Circuit Court of Appeals. We will continue to defend the remaining cases where an AEP company is a defendant, all of which were dismissed by the Federal District Court in Las Vegas and are currently on appeal. We believe the provision we have for the remaining cases is adequate and the remaining exposure is immaterial. 6. ACQUISITIONS, DISPOSITIONS AND IMPAIRMENTS ACQUISITIONS Acquisition Anticipated Being Completed During the First Quarter of 2012 BlueStar Energy (Generation and Marketing segment)
In January 2012, we entered into an agreement to acquire BlueStar Energy Holdings, Inc. (BlueStar) and its independent retail electric supplier BlueStar Energy Solutions for approximately $70 million. BlueStar provides electric supply for retail customers in Ohio, Illinois and other deregulated electricity markets and also provides energy solutions, including demand response and energy efficiency services, nationwide. BlueStar has approximately 21,000 customer accounts. Consummation of the transaction is subject to regulatory and other approvals. The transaction is expected to close in the first quarter of 2012.
93
2010 Valley Electric Membership Corporation (Utility Operations segment) In October 2010, SWEPCo purchased certain transmission and distribution assets of Valley Electric Membership Corporation (VEMCO) for approximately $102 million and began serving VEMCO’s 30,000 customers in Louisiana. 2009 Oxbow Lignite Company and Red River Mining Company (Utility Operations segment) In December 2009, SWEPCo purchased 50% of the Oxbow Lignite Company, LLC (OLC) membership interest for $13 million. CLECO acquired the remaining 50% membership interest in the OLC for $13 million. The Oxbow Mine is located near Coushatta, Louisiana and is used as one of the fuel sources for SWEPCo’s and CLECO’s jointly-owned Dolet Hills Generating Station. SWEPCo accounts for OLC as an equity investment. Also, in December 2009, DHLC purchased mining equipment and assets for $16 million from the Red River Mining Company. DISPOSITIONS 2010 Electric Transmission Texas LLC (ETT) (Utility Operations segment) In 2010, TCC and TNC sold $66 million and $73 million, respectively, of transmission facilities to ETT. There were no gains or losses recorded on these sale transactions. Intercontinental Exchange, Inc. (ICE) (All Other) In April 2010, we sold our remaining 138,000 shares of ICE and recognized a $16 million gain. We recorded the gain in Interest and Investment Income on our statements of income for the year ended December 31, 2010. 2009 Electric Transmission Texas LLC (ETT) (Utility Operations segment)
In 2009, TCC and TNC sold $93 million and $2 million, respectively, of transmission facilities to ETT. There were no gains or losses recorded on these sale transactions. IMPAIRMENTS 2011 Turk Plant (Utility Operations segment)
In the fourth quarter of 2011, SWEPCo recorded a pretax write-off of $49 million in Asset Impairments and Other Related Charges on the statements of income related to the Texas jurisdictional portion of the Turk Plant as a result of the November 2011 Texas Court of Appeals decision upholding the Texas capital cost cap. Muskingum River Plant Unit 5 FGD Project (MR5) (Utility Operations segment) In September 2011, subsequent to the stipulation agreement filed with the PUCO, management determined that OPCo was not likely to complete the previously suspended MR5 project and that the project’s preliminary engineering costs were no longer probable of being recovered. As a result, in the third quarter of 2011, OPCo recorded a pretax write-off of $42 million in Asset Impairments and Other Related Charges on the statements of income.

94
Sporn Plant Unit 5 (Utility Operations segment)
In the third quarter of 2011, management decided to no longer offer the output of Sporn Unit 5 into the PJM market. Sporn Unit 5 is not expected to operate in the future, resulting in the removal of Sporn Unit 5 from the AEP Power Pool. As a result, in the third quarter of 2011, OPCo recorded a pretax write-off of $48 million in Asset Impairments and Other Related Charges on the statements of income. 7. BENEFIT PLANS For a discussion of investment strategy, investment limitations, target asset allocations and the classification of investments within the fair value hierarchy, see “Investments Held in Trust for Future Liabilities” and “Fair Value Measurements of Assets and Liabilities” sections of Note 1. We sponsor a qualified pension plan and two unfunded nonqualified pension plans. Substantially all of our employees are covered by the qualified plan or both the qualified and a nonqualified pension plan. We sponsor OPEB plans to provide medical and life insurance benefits for retired employees. We recognize the funded status associated with our defined benefit pension and OPEB plans in the balance sheets. Disclosures about the plans are required by the “Compensation – Retirement Benefits” accounting guidance. We recognize an asset for a plan’s overfunded status or a liability for a plan’s underfunded status, and recognize, as a component of other comprehensive income, the changes in the funded status of the plan that arise during the year that are not recognized as a component of net periodic benefit cost. We record a regulatory asset instead of other comprehensive income for qualifying benefit costs of our regulated operations that for ratemaking purposes are deferred for future recovery. The cumulative funded status adjustment is equal to the remaining unrecognized deferrals for unamortized actuarial losses or gains, prior service costs and transition obligations, such that remaining deferred costs result in an AOCI equity reduction or regulatory asset and deferred gains result in an AOCI equity addition or regulatory liability. Actuarial Assumptions for Benefit Obligations The weighted-average assumptions as of December 31 of each year used in the measurement of our benefit obligations are shown in the following table: Other Postretirement Pension Plans Benefit Plans
Assumptions 2011 2010 2011 2010
Discount Rate 4.55 % 5.05 % 4.75 % 5.25 %
Rate of Compensation Increase 4.85 % (a) 4.95 % (a) NA NA
(a) Rates are for base pay only. In addition, an amount is added to reflect target incentive compensation for exempt
employees and overtime and incentive pay for nonexempt employees.
NA Not applicable
We use a duration-based method to determine the discount rate for our plans. A hypothetical portfolio of high quality corporate bonds similar to those included in the Moody’s Aa bond index is constructed with a duration matching the benefit plan liability. The composite yield on the hypothetical bond portfolio is used as the discount rate for the plan. For 2011, the rate of compensation increase assumed varies with the age of the employee, ranging from 3.5% per year to 11.5% per year, with an average increase of 4.85%.

95
Actuarial Assumptions for Net Periodic Benefit Costs The weighted-average assumptions as of January 1 of each year used in the measurement of our benefit costs are shown in the following table: Other Postretirement Pension Plans Benefit Plans
2011 2010 2009 2011 2010 2009
Discount Rate 5.05 % 5.60 % 6.00 % 5.25 % 5.85 % 6.10 %
Expected Return on Plan Assets 7.75 % 8.00 % 8.00 % 7.50 % 8.00 % 7.75 %
Rate of Compensation Increase 4.85 % 4.60 % 5.90 % NA NA NA
NA Not Applicable
The expected return on plan assets was determined by evaluating historical returns, the current investment climate (yield on fixed income securities and other recent investment market indicators), rate of inflation and current prospects for economic growth. The health care trend rate assumptions as of January 1 of each year used for OPEB plans measurement purposes are shown below: Health Care Trend Rates 2011 2010
Initial 7.50 % 8.00 % Ultimate 5.00 % 5.00 % Year Ultimate Reached 2016 2016 Assumed health care cost trend rates have a significant effect on the amounts reported for the OPEB health care plans. A 1% change in assumed health care cost trend rates would have the following effects: 1% Increase 1% Decrease
(in millions) Effect on Total Service and Interest Cost Components of Net Periodic Postretirement Health
Care Benefit Cost $ 23 $ (18) Effect on the Health Care Component of the Accumulated Postretirement Benefit Obligation 274 (223) Significant Concentrations of Risk within Plan Assets In addition to establishing the target asset allocation of plan assets, the investment policy also places restrictions on securities to limit significant concentrations within plan assets. The investment policy establishes guidelines that govern maximum market exposure, security restrictions, prohibited asset classes, prohibited types of transactions, minimum credit quality, average portfolio credit quality, portfolio duration and concentration limits. The guidelines were established to mitigate the risk of loss due to significant concentrations in any investment. We monitor the plans to control security diversification and ensure compliance with our investment policy. At December 31, 2011, the assets were invested in compliance with all investment limits. See “Investments Held in Trust for Future Liabilities” section of Note 1 for limit details.
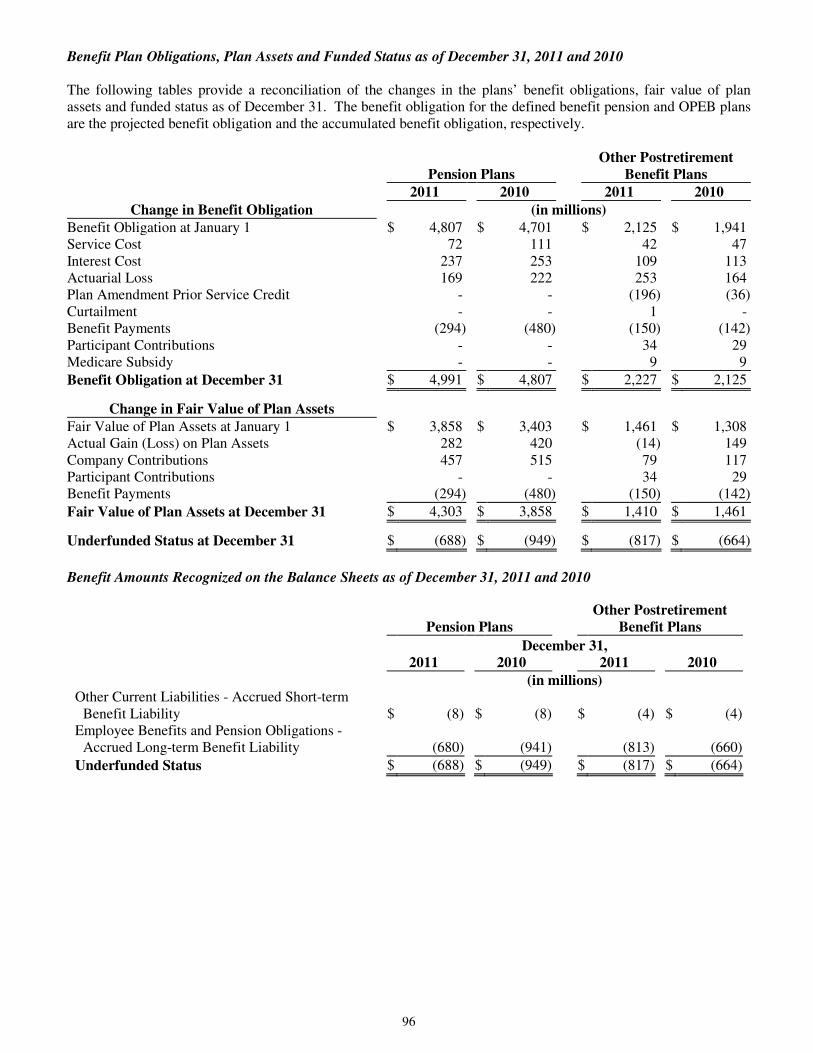
96
Benefit Plan Obligations, Plan Assets and Funded Status as of December 31, 2011 and 2010 The following tables provide a reconciliation of the changes in the plans’ benefit obligations, fair value of plan assets and funded status as of December 31. The benefit obligation for the defined benefit pension and OPEB plans are the projected benefit obligation and the accumulated benefit obligation, respectively. Other Postretirement Pension Plans Benefit Plans
2011 2010 2011 2010
Change in Benefit Obligation (in millions)
Benefit Obligation at January 1 $ 4,807 $ 4,701 $ 2,125 $ 1,941 Service Cost 72 111 42 47 Interest Cost 237 253 109 113 Actuarial Loss 169 222 253 164 Plan Amendment Prior Service Credit - - (196) (36) Curtailment - - 1 - Benefit Payments (294) (480) (150) (142) Participant Contributions - - 34 29 Medicare Subsidy - - 9 9
Benefit Obligation at December 31 $ 4,991 $ 4,807 $ 2,227 $ 2,125
Change in Fair Value of Plan Assets
Fair Value of Plan Assets at January 1 $ 3,858 $ 3,403 $ 1,461 $ 1,308 Actual Gain (Loss) on Plan Assets 282 420 (14) 149 Company Contributions 457 515 79 117 Participant Contributions - - 34 29 Benefit Payments (294) (480) (150) (142)
Fair Value of Plan Assets at December 31 $ 4,303 $ 3,858 $ 1,410 $ 1,461
Underfunded Status at December 31 $ (688) $ (949) $ (817) $ (664)
Benefit Amounts Recognized on the Balance Sheets as of December 31, 2011 and 2010 Other Postretirement Pension Plans Benefit Plans
December 31, 2011 2010 2011 2010
(in millions) Other Current Liabilities - Accrued Short-term Benefit Liability $ (8) $ (8) $ (4) $ (4) Employee Benefits and Pension Obligations - Accrued Long-term Benefit Liability (680) (941) (813) (660)
Underfunded Status $ (688) $ (949) $ (817) $ (664)

97
Amounts Included in AOCI and Regulatory Assets as of December 31, 2011 and 2010 Other Postretirement Pension Plans Benefit Plans
December 31, 2011 2010 2011 2010
Components (in millions) Net Actuarial Loss $ 2,208 $ 2,129 $ 979 $ 638 Prior Service Cost (Credit) 10 11 (210) (20) Transition Obligation - - 1 3
Recorded as
Regulatory Assets $ 1,818 $ 1,764 $ 479 $ 388 Deferred Income Taxes 140 132 102 81 Net of Tax AOCI 260 244 189 152 Components of the change in amounts included in AOCI and Regulatory Assets during the years ended December 31, 2011 and 2010 are as follows: Other Postretirement Pension Plans Benefit Plans
Years Ended December 31, 2011 2010 2011 2010
Components (in millions)
Actuarial Loss During the Year $ 201 $ 121 $ 370 $ 121 Prior Service Credit - - (191) (36) Amortization of Actuarial Loss (122) (89) (29) (29) Amortization of Prior Service Credit (Cost) (1) - 1 - Amortization of Transition Obligation - - (2) (27)
Change for the Year $ 78 $ 32 $ 149 $ 29

98
Pension and Other Postretirement Plans’ Assets The following table presents the classification of pension plan assets within the fair value hierarchy at December 31, 2011: Year End
Asset Class Level 1 Level 2 Level 3 Other Total Allocation
(in millions)
Equities:
Domestic $ 1,455 $ - $ - $ - $ 1,455 33.8 %
International 399 - - - 399 9.3 %
Real Estate Investment Trusts 104 - - - 104 2.4 %
Common Collective Trust -
International - 128 - - 128 3.0 %
Subtotal - Equities 1,958 128 - - 2,086 48.5 %
Fixed Income:
Common Collective Trust - Debt - 26 - - 26 0.6 %
United States Government and
Agency Securities - 566 - - 566 13.2 %
Corporate Debt - 985 6 - 991 23.0 %
Foreign Debt - 190 - - 190 4.4 %
State and Local Government - 48 - - 48 1.1 %
Other - Asset Backed - 26 - - 26 0.6 %
Subtotal - Fixed Income - 1,841 6 - 1,847 42.9 %
Real Estate - - 163 - 163 3.8 %
Alternative Investments - - 161 - 161 3.7 %
Securities Lending - 215 - - 215 5.0 %
Securities Lending Collateral (a) - - - (236) (236) (5.5) %
Cash and Cash Equivalents - 93 - - 93 2.2 %
Other - Pending Transactions and
Accrued Income (b) - - - (26) (26) (0.6) %
Total $ 1,958 $ 2,277 $ 330 $ (262) $ 4,303 100.0 %
(a) Amounts in "Other" column primarily represent an obligation to repay cash collateral received as part of the Securities
Lending Program. (b) Amounts in "Other" column primarily represent accrued interest, dividend receivables and transactions pending settlement.
The following table sets forth a reconciliation of changes in the fair value of assets classified as Level 3 in the fair value hierarchy for AEP’s pension assets: Corporate Real Alternative Total
Debt Estate Investments Level 3
(in millions)
Balance as of January 1, 2011 $ - $ 83 $ 130 $ 213
Actual Return on Plan Assets
Relating to Assets Still Held as of the Reporting Date - 22 9 31
Relating to Assets Sold During the Period - - 3 3
Purchases and Sales - 58 19 77
Transfers into Level 3 6 - - 6
Transfers out of Level 3 - - - -
Balance as of December 31, 2011 $ 6 $ 163 $ 161 $ 330

99
The following table presents the classification of OPEB plan assets within the fair value hierarchy at December 31, 2011: Year End
Asset Class Level 1 Level 2 Level 3 Other Total Allocation
(in millions)
Equities:
Domestic $ 348 $ - $ - $ - $ 348 24.7 %
International 380 - - - 380 27.0 %
Common Collective Trust -
Global - 99 - - 99 7.0 %
Subtotal - Equities 728 99 - - 827 58.7 %
Fixed Income:
Common Collective Trust - Debt - 69 - - 69 4.9 %
United States Government and
Agency Securities - 81 - - 81 5.7 %
Corporate Debt - 152 - - 152 10.8 %
Foreign Debt - 32 - - 32 2.3 %
State and Local Government - 9 - - 9 0.6 %
Other - Asset Backed - 2 - - 2 0.1 %
Subtotal - Fixed Income - 345 - - 345 24.4 %
Trust Owned Life Insurance:
International Equities - 46 - - 46 3.3 %
United States Bonds - 158 - - 158 11.2 %
Cash and Cash Equivalents 17 23 - - 40 2.9 %
Other - Pending Transactions and
Accrued Income (a) - - - (6) (6) (0.5) %
Total $ 745 $ 671 $ - $ (6) $ 1,410 100.0 %
(a) Amounts in "Other" column primarily represent accrued interest, dividend receivables and transactions pending settlement.

100
The following table presents the classification of pension plan assets within the fair value hierarchy at December 31, 2010: Year End
Asset Class Level 1 Level 2 Level 3 Other Total Allocation
(in millions)
Equities:
Domestic $ 1,350 $ 2 $ - $ - $ 1,352 35.1 %
International 403 - - - 403 10.4 %
Real Estate Investment Trusts 112 - - - 112 2.9 %
Common Collective Trust -
International - 163 - - 163 4.2 %
Subtotal - Equities 1,865 165 - - 2,030 52.6 %
Fixed Income:
United States Government and
Agency Securities - 634 - - 634 16.4 %
Corporate Debt - 672 - - 672 17.4 %
Foreign Debt - 127 - - 127 3.3 %
State and Local Government - 23 - - 23 0.6 %
Other - Asset Backed - 51 - - 51 1.3 %
Subtotal - Fixed Income - 1,507 - - 1,507 39.0 %
Real Estate - - 83 - 83 2.2 %
Alternative Investments - - 130 - 130 3.4 %
Securities Lending - 254 - - 254 6.6 %
Securities Lending Collateral (a) - - - (276) (276) (7.1) %
Cash and Cash Equivalents (b) - 127 - 2 129 3.3 %
Other - Pending Transactions and
Accrued Income (c) - - - 1 1 - %
Total $ 1,865 $ 2,053 $ 213 $ (273) $ 3,858 100.0 %
(a) Amounts in "Other" column primarily represent an obligation to repay cash collateral received as part of the Securities
Lending Program. (b) Amounts in "Other" column primarily represent foreign currency holdings. (c) Amounts in "Other" column primarily represent accrued interest, dividend receivables and transactions pending settlement.
The following table sets forth a reconciliation of changes in the fair value of real estate and alternative investments classified as Level 3 in the fair value hierarchy for the pension assets: Alternative Total
Real Estate Investments Level 3
(in millions)
Balance as of January 1, 2010 $ 90 $ 106 $ 196
Actual Return on Plan Assets
Relating to Assets Still Held as of the Reporting Date (7) 4 (3)
Relating to Assets Sold During the Period - 1 1
Purchases and Sales - 19 19
Transfers into Level 3 - - -
Transfers out of Level 3 - - -
Balance as of December 31, 2010 $ 83 $ 130 $ 213

101
The following table presents the classification of OPEB plan assets within the fair value hierarchy at December 31, 2010: Year End
Asset Class Level 1 Level 2 Level 3 Other Total Allocation
(in millions)
Equities:
Domestic $ 584 $ - $ - $ - $ 584 40.0 %
International 220 - - - 220 15.1 %
Common Collective Trust -
Global - 115 - - 115 7.9 %
Subtotal - Equities 804 115 - - 919 63.0 %
Fixed Income:
Common Collective Trust - Debt - 48 - - 48 3.3 %
United States Government and
Agency Securities - 93 - - 93 6.4 %
Corporate Debt - 110 - - 110 7.5 %
Foreign Debt - 25 - - 25 1.7 %
State and Local Government - 3 - - 3 0.2 %
Other - Asset Backed - 1 - - 1 0.1 %
Subtotal - Fixed Income - 280 - - 280 19.2 %
Trust Owned Life Insurance:
International Equities - 49 - - 49 3.3 %
United States Bonds - 163 - - 163 11.1 %
Cash and Cash Equivalents (a) 21 25 - 1 47 3.2 %
Other - Pending Transactions and
Accrued Income (b) - - - 3 3 0.2 %
Total $ 825 $ 632 $ - $ 4 $ 1,461 100.0 %
(a) Amounts in "Other" column primarily represent foreign currency holdings. (b) Amounts in "Other" column primarily represent accrued interest, dividend receivables and transactions pending settlement.
Determination of Pension Expense We base our determination of pension expense or income on a market-related valuation of assets which reduces year-to-year volatility. This market-related valuation recognizes investment gains or losses over a five-year period from the year in which they occur. Investment gains or losses for this purpose are the difference between the expected return calculated using the market-related value of assets and the actual return based on the market-related value of assets. Since the market-related value of assets recognizes gains or losses over a five-year period, the future value of assets will be impacted as previously deferred gains or losses are recorded. December 31,
Accumulated Benefit Obligation 2011 2010
(in millions)
Qualified Pension Plan $ 4,808 $ 4,659
Nonqualified Pension Plans 89 80
Total $ 4,897 $ 4,739

102
For our underfunded pension plans that had an accumulated benefit obligation in excess of plan assets, the projected benefit obligation, accumulated benefit obligation and fair value of plan assets of these plans at December 31, 2011 and 2010 were as follows: Underfunded Pension Plans
December 31,
2011 2010
(in millions)
Projected Benefit Obligation $ 4,991 $ 4,807
Accumulated Benefit Obligation $ 4,897 $ 4,739
Fair Value of Plan Assets 4,303 3,858
Underfunded Accumulated Benefit Obligation $ (594) $ (881)
Estimated Future Benefit Payments and Contributions We expect contributions and payments for the pension plans of $208 million and the OPEB plans of $99 million during 2012. The estimated pension benefit payments for the unfunded plan and contributions to the trust are at least the minimum amount required by the Employee Retirement Income Security Act plus payment of unfunded nonqualified benefits. For the qualified pension plan, we may make additional discretionary contributions to maintain the funded status of the plan. The contribution to the OPEB plans is generally based on the amount of the OPEB plans’ periodic benefit costs for accounting purposes as provided in agreements with state regulatory authorities, plus the additional discretionary contribution of our Medicare subsidy receipts. The table below reflects the total benefits expected to be paid from the plan or from our assets. The payments include the participants’ contributions to the plan for their share of the cost. In December 2011, we amended the prescription drug program for certain participants. The impact of the change is reflected in the Benefit Plan Obligation table as a plan amendment. As a result of this amendment to the plan, the Medicare subsidy receipts in the following table are reduced from prior published estimates. Future benefit payments are dependent on the number of employees retiring, whether the retiring employees elect to receive pension benefits as annuities or as lump sum distributions, future integration of the benefit plans with changes to Medicare and other legislation, future levels of interest rates and variances in actuarial results. The estimated payments for pension benefits and OPEB are as follows: Pension Plans Other Postretirement Benefit Plans
Pension Benefit Medicare Subsidy Payments Payments Receipts
(in millions) 2012 $ 327 $ 145 $ 9 2013 334 148 - 2014 354 153 - 2015 356 160 - 2016 360 168 - Years 2017 to 2021, in Total 1,864 955 2

103
Components of Net Periodic Benefit Cost
The following table provides the components of our net periodic benefit cost for the plans for the years ended December 31, 2011, 2010 and 2009: Other Postretirement Pension Plans Benefit Plans
Years Ended December 31,
2011 2010 2009 2011 2010 2009
(in millions)
Service Cost $ 72 $ 111 $ 104 $ 42 $ 47 $ 42
Interest Cost 237 253 254 109 113 110
Expected Return on Plan Assets (314) (312) (321) (109) (105) (80)
Curtailment - - - 1 - -
Amortization of Transition Obligation - - - 2 27 27
Amortization of Prior Service Cost (Credit) 1 - - (1) - -
Amortization of Net Actuarial Loss 122 89 59 29 29 42
Net Periodic Benefit Cost 118 141 96 73 111 141
Capitalized Portion (37) (44) (30) (22) (35) (44)
Net Periodic Benefit Cost Recognized as
Expense $ 81 $ 97 $ 66 $ 51 $ 76 $ 97
Estimated amounts expected to be amortized to net periodic benefit costs and the impact on the balance sheet during 2012 are shown in the following table: Other
Postretirement
Pension Plans Benefit Plans
Components (in millions)
Net Actuarial Loss $ 145 $ 59
Prior Service Credit (1) (18)
Transition Obligation - 1
Total Estimated 2012 Amortization $ 144 $ 42
Expected to be Recorded as
Regulatory Asset $ 116 $ 25
Deferred Income Taxes 10 6
Net of Tax AOCI 18 11
Total $ 144 $ 42
American Electric Power System Retirement Savings Plan
We sponsor the American Electric Power System Retirement Savings Plan, a defined contribution retirement savings plan for substantially all employees who are not members of the United Mine Workers of America (UMWA). It is a qualified plan offering participants an opportunity to contribute a portion of their pay with features under Section 401(k) of the Internal Revenue Code. The matching contributions to the plan are 100% of the first 1% of eligible employee contributions and 70% of the next 5% of contributions. The cost for matching contributions totaled $64 million in 2011, $61 million in 2010 and $74 million in 2009. UMWA Benefits We provide UMWA pension, health and welfare benefits for certain unionized mining employees, retirees and their survivors who meet eligibility requirements. UMWA trustees make final interpretive determinations with regard to all benefits. The pension benefits are administered by UMWA trustees and contributions are made to their trust funds. The health and welfare benefits are administered by us and benefits are paid from our general assets.

104
The UMWA pension benefits are administered through a multiemployer plan that is different from single-employer plans as an employer’s contributions may be used to provide benefits to employees of other participating employers. Required contributions not made by an employer may result in other employers bearing the unfunded plan obligations, while a withdrawing employer may be subject to a withdrawal liability. UMWA pension benefits are provided through the United Mine Workers of America 1974 Pension Plan (Employer Identification Number: 52-1050282, Plan Number 002), which under the Pension Protection Act of 2006 (PPA) was in Seriously Endangered Status for the plan years ending June 30, 2011 and 2010, without utilization of extended amortization provisions. The Plan is required under the PPA to adopt a funding improvement plan by May 25, 2012. Contributions in 2011, 2010 and 2009, which were made under a collective bargaining agreement that expires December 31, 2012, were immaterial and represent less than 5% of the total contributions in the plan’s latest annual report for the years ended June 30, 2011, 2010 and 2009. Contributions did not include a surcharge, and there are no minimum contributions for future years. 8. BUSINESS SEGMENTS Our primary business is the generation, transmission and distribution of electricity. Within our Utility Operations segment, we centrally dispatch generation assets and manage our overall utility operations on an integrated basis because of the substantial impact of cost-based rates and regulatory oversight. Intersegment sales and transfers are generally based on underlying contractual arrangements and agreements. While our Utility Operations segment remains our primary business segment, the advancement of an area of our business prompted us to identify a new reportable segment. Starting in the fourth quarter of 2011, we established our new Transmission Operations segment as described below: Utility Operations
• Generation of electricity for sale to U.S. retail and wholesale customers.
• Transmission and distribution of electricity through assets owned and operated by our ten utility operating companies.
Transmission Operations
• Development, construction and operation of transmission facilities through investments in our wholly-owned transmission subsidiaries that were established in 2009 and our transmission joint ventures. These investments have FERC-approved returns on equity.
AEP River Operations
• Commercial barging operations that transport coal and dry bulk commodities primarily on the Ohio, Illinois and lower Mississippi Rivers.
Generation and Marketing
• Nonregulated generation in ERCOT.
• Marketing and risk management activities primarily in ERCOT and, to a lesser extent, Ohio in PJM and MISO.
The remainder of our activities is presented as All Other. While not considered a reportable segment, All Other includes:
• Parent’s guarantee revenue received from affiliates, investment income, interest income and interest expense and other nonallocated costs.
• Tax and interest expense adjustments related to our UK operations which were sold in 2004 and 2002.
• Forward natural gas contracts that were not sold with our natural gas pipeline and storage operations in 2004 and 2005. These contracts were financial derivatives which settled and expired in the fourth quarter of 2011.
• Revenue sharing related to the Plaquemine Cogeneration Facility which ended in the fourth quarter of 2011.

105
The tables below present our reportable segment information for the years ended December 31, 2011, 2010 and 2009 and balance sheet information as of December 31, 2011 and 2010. These amounts include certain estimates and allocations where necessary. We reclassified prior year amounts to conform to the current year’s presentation. Nonutility Operations
Generation
Utility Transmission AEP River and All Other Reconciling
Operations Operations Operations Marketing (a) Adjustments Consolidated
(in millions)
Year Ended December 31, 2011
Revenues from:
External Customers $ 14,088 $ 3 $ 696 $ 305 $ 24 $ - $ 15,116
Other Operating Segments 112 5 20 1 8 (146) -
Total Revenues $ 14,200 $ 8 $ 716 $ 306 $ 32 $ (146) $ 15,116
Depreciation and Amortization $ 1,613 $ - $ 28 $ 25 $ 2 $ (13) (b) $ 1,655
Interest Income 29 - - (1) 17 (18) 27
Carrying Costs Income 393 - - - - - 393
Interest Expense 886 1 18 18 43 (33) (b) 933
Income Tax Expense (Credit) 722 2 24 (18) 88 - 818
Income (Loss) Before Extraordinary
Items $ 1,549 $ 30 $ 45 $ 14 $ (62) $ - $ 1,576
Extraordinary Items, Net of Tax 373 - - - - - 373
Net Income (Loss) $ 1,922 $ 30 $ 45 $ 14 $ (62) $ - $ 1,949
Gross Property Additions $ 2,405 $ 263 $ 18 $ 2 $ 214 $ - $ 2,902
Nonutility Operations
Generation
Utility Transmission AEP River and All Other Reconciling
Operations Operations Operations Marketing (a) Adjustments Consolidated
(in millions)
Year Ended December 31, 2010
Revenues from:
External Customers $ 13,687 $ - $ 566 $ 173 $ 1 $ - $ 14,427
Other Operating Segments 105 1 22 - 14 (142) -
Total Revenues $ 13,792 $ 1 $ 588 $ 173 $ 15 $ (142) $ 14,427
Depreciation and Amortization $ 1,598 $ - $ 24 $ 30 $ 2 $ (13) (b) $ 1,641
Interest Income 8 - - 2 31 (20) 21
Carrying Costs Income 70 - - - - - 70
Interest Expense 942 - 14 20 58 (35) (b) 999
Income Tax Expense (Credit) 651 (1) 19 (20) (6) - 643
Net Income (Loss) 1,192 9 37 25 (45) - 1,218
Gross Property Additions 2,440 35 23 1 1 - 2,500
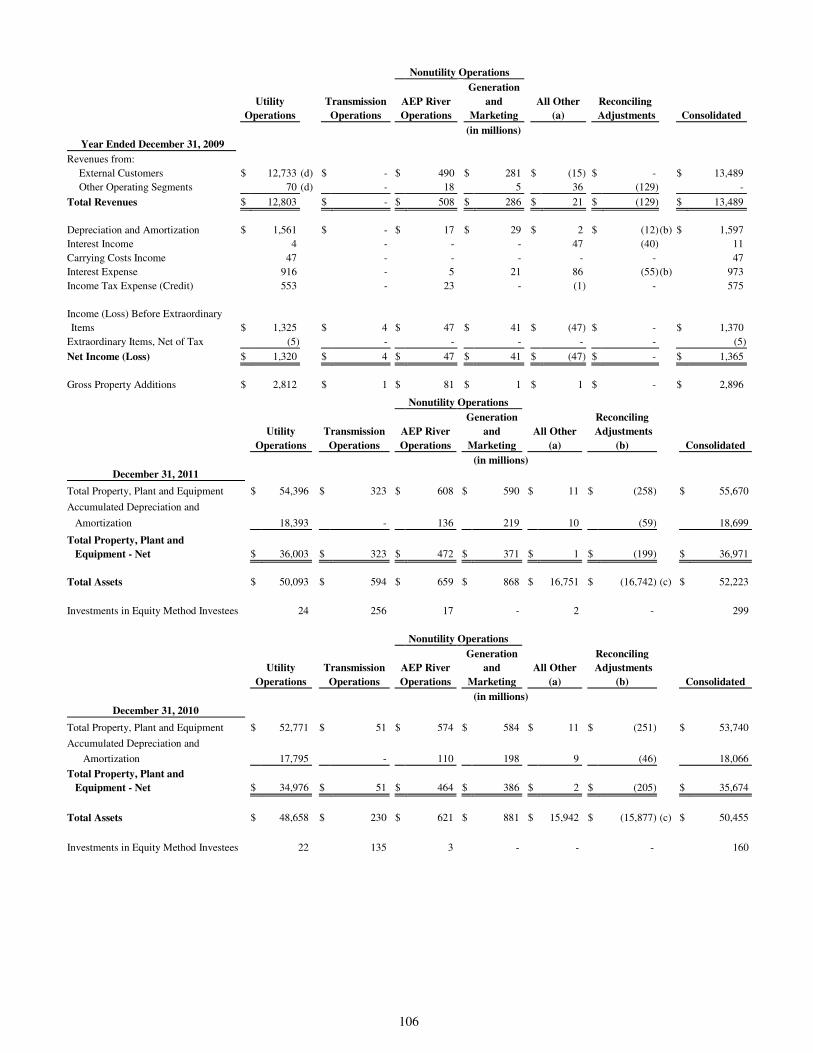
106
Nonutility Operations
Generation
Utility Transmission AEP River and All Other Reconciling
Operations Operations Operations Marketing (a) Adjustments Consolidated
(in millions)
Year Ended December 31, 2009
Revenues from:
External Customers $ 12,733 (d) $ - $ 490 $ 281 $ (15) $ - $ 13,489
Other Operating Segments 70 (d) - 18 5 36 (129) -
Total Revenues $ 12,803 $ - $ 508 $ 286 $ 21 $ (129) $ 13,489
Depreciation and Amortization $ 1,561 $ - $ 17 $ 29 $ 2 $ (12) (b) $ 1,597
Interest Income 4 - - - 47 (40) 11
Carrying Costs Income 47 - - - - - 47
Interest Expense 916 - 5 21 86 (55) (b) 973
Income Tax Expense (Credit) 553 - 23 - (1) - 575
Income (Loss) Before Extraordinary
Items $ 1,325 $ 4 $ 47 $ 41 $ (47) $ - $ 1,370
Extraordinary Items, Net of Tax (5) - - - - - (5)
Net Income (Loss) $ 1,320 $ 4 $ 47 $ 41 $ (47) $ - $ 1,365
Gross Property Additions $ 2,812 $ 1 $ 81 $ 1 $ 1 $ - $ 2,896 Nonutility Operations
Generation Reconciling
Utility Transmission AEP River and All Other Adjustments
Operations Operations Operations Marketing (a) (b) Consolidated
(in millions)
December 31, 2011
Total Property, Plant and Equipment $ 54,396 $ 323 $ 608 $ 590 $ 11 $ (258) $ 55,670
Accumulated Depreciation and
Amortization 18,393 - 136 219 10 (59) 18,699
Total Property, Plant and
Equipment - Net $ 36,003 $ 323 $ 472 $ 371 $ 1 $ (199) $ 36,971
Total Assets $ 50,093 $ 594 $ 659 $ 868 $ 16,751 $ (16,742) (c) $ 52,223
Investments in Equity Method Investees 24 256 17 - 2 - 299
Nonutility Operations
Generation Reconciling
Utility Transmission AEP River and All Other Adjustments
Operations Operations Operations Marketing (a) (b) Consolidated
(in millions)
December 31, 2010
Total Property, Plant and Equipment $ 52,771 $ 51 $ 574 $ 584 $ 11 $ (251) $ 53,740
Accumulated Depreciation and
Amortization 17,795 - 110 198 9 (46) 18,066
Total Property, Plant and
Equipment - Net $ 34,976 $ 51 $ 464 $ 386 $ 2 $ (205) $ 35,674
Total Assets $ 48,658 $ 230 $ 621 $ 881 $ 15,942 $ (15,877) (c) $ 50,455
Investments in Equity Method Investees 22 135 3 - - - 160

107
(a) All Other includes:
• Parent's guarantee revenue received from affiliates, investment income, interest income and interest expense and other nonallocated costs.
• Tax and interest expense adjustments related to our UK operations which were sold in 2004 and 2002.
• Forward natural gas contracts that were not sold with our natural gas pipeline and storage operations in 2004 and 2005. These contracts were financial derivatives which settled and expired in the fourth quarter of 2011.
• Revenue sharing related to the Plaquemine Cogeneration Facility which ended in the fourth quarter of 2011. (b) Includes eliminations due to an intercompany capital lease. (c) Reconciling Adjustments for Total Assets primarily include the elimination of intercompany advances to affiliates and intercompany accounts receivable
along with the elimination of AEP's investments in subsidiary companies. (d) PSO and SWEPCo transferred certain existing ERCOT energy marketing contracts to AEP Energy Partners, Inc. (AEPEP) (Generation and Marketing
segment) and entered into intercompany financial and physical purchase and sales agreements with AEPEP. As a result, we reported third-party net purchases or sales activity for these energy marketing contracts as Revenues from External Customers for the Utility Operations segment. This was offset by the Utility Operations segment's related net purchases for these contracts with AEPEP in Revenues from Other Operating Segments of $5 million for the years ended December 31, 2009. The Generation and Marketing segment also reported these purchase or sales contracts with Utility Operations as Revenues from Other Operating Segments. These affiliated contracts between PSO and SWEPCo with AEPEP ended in December 2009.
9. DERIVATIVES AND HEDGING OBJECTIVES FOR UTILIZATION OF DERIVATIVE INSTRUMENTS We are exposed to certain market risks as a major power producer and marketer of wholesale electricity, coal and emission allowances. These risks include commodity price risk, interest rate risk, credit risk and, to a lesser extent, foreign currency exchange risk. These risks represent the risk of loss that may impact us due to changes in the underlying market prices or rates. We manage these risks using derivative instruments. STRATEGIES FOR UTILIZATION OF DERIVATIVE INSTRUMENTS TO ACHIEVE OBJECTIVES Trading Strategies
Our strategy surrounding the use of derivative instruments for trading purposes focuses on seizing market opportunities to create value driven by expected changes in the market prices of the commodities in which we transact. Risk Management Strategies Our strategy surrounding the use of derivative instruments focuses on managing our risk exposures, future cash flows and creating value utilizing both economic and formal hedging strategies. To accomplish our objectives, we primarily employ risk management contracts including physical forward purchase and sale contracts, financial forward purchase and sale contracts and financial swap instruments. Not all risk management contracts meet the definition of a derivative under the accounting guidance for “Derivatives and Hedging.” Derivative risk management contracts elected normal under the normal purchases and normal sales scope exception are not subject to the requirements of this accounting guidance. We enter into power, coal, natural gas, interest rate and, to a lesser degree, heating oil and gasoline, emission allowance and other commodity contracts to manage the risk associated with our energy business. We enter into interest rate derivative contracts in order to manage the interest rate exposure associated with our commodity portfolio. For disclosure purposes, such risks are grouped as “Commodity,” as they are related to energy risk management activities. We also engage in risk management of interest rate risk associated with debt financing and foreign currency risk associated with future purchase obligations denominated in foreign currencies. For disclosure purposes, these risks are grouped as “Interest Rate and Foreign Currency.” The amount of risk taken is determined by the Commercial Operations and Finance groups in accordance with our established risk management policies as approved by the Finance Committee of our Board of Directors.

108
The following table represents the gross notional volume of our outstanding derivative contracts as of December 31, 2011 and 2010: Notional Volume of Derivative Instruments Volume
December 31, Unit of Primary Risk Exposure 2011 2010 Measure
(in millions) Commodity: Power 609 652 MWHs Coal 21 63 Tons Natural Gas 100 94 MMBtus Heating Oil and Gasoline 6 6 Gallons Interest Rate $ 226 $ 171 USD Interest Rate and Foreign Currency $ 907 $ 907 USD Fair Value Hedging Strategies
We enter into interest rate derivative transactions as part of an overall strategy to manage the mix of fixed-rate and floating-rate debt. Certain interest rate derivative transactions effectively modify our exposure to interest rate risk by converting a portion of our fixed-rate debt to a floating rate. Provided specific criteria are met, these interest rate derivatives are designated as fair value hedges. Cash Flow Hedging Strategies We enter into and designate as cash flow hedges certain derivative transactions for the purchase and sale of power, coal, natural gas and heating oil and gasoline (“Commodity”) in order to manage the variable price risk related to the forecasted purchase and sale of these commodities. We monitor the potential impacts of commodity price changes and, where appropriate, enter into derivative transactions to protect profit margins for a portion of future electricity sales and fuel or energy purchases. We do not hedge all commodity price risk. Our vehicle fleet and barge operations are exposed to gasoline and diesel fuel price volatility. We enter into financial heating oil and gasoline derivative contracts in order to mitigate price risk of our future fuel purchases. For disclosure purposes, these contracts are included with other hedging activities as “Commodity.” We do not hedge all fuel price risk. We enter into a variety of interest rate derivative transactions in order to manage interest rate risk exposure. Some interest rate derivative transactions effectively modify our exposure to interest rate risk by converting a portion of our floating-rate debt to a fixed rate. We also enter into interest rate derivative contracts to manage interest rate exposure related to future borrowings of fixed-rate debt. Our forecasted fixed-rate debt offerings have a high probability of occurrence as the proceeds will be used to fund existing debt maturities and projected capital expenditures. We do not hedge all interest rate exposure. At times, we are exposed to foreign currency exchange rate risks primarily when we purchase certain fixed assets from foreign suppliers. In accordance with our risk management policy, we may enter into foreign currency derivative transactions to protect against the risk of increased cash outflows resulting from a foreign currency’s appreciation against the dollar. We do not hedge all foreign currency exposure.

109
ACCOUNTING FOR DERIVATIVE INSTRUMENTS AND THE IMPACT ON OUR FINANCIAL STATEMENTS
The accounting guidance for “Derivatives and Hedging” requires recognition of all qualifying derivative instruments as either assets or liabilities on the balance sheets at fair value. The fair values of derivative instruments accounted for using MTM accounting or hedge accounting are based on exchange prices and broker quotes. If a quoted market price is not available, the estimate of fair value is based on the best information available including valuation models that estimate future energy prices based on existing market and broker quotes, supply and demand market data and assumptions. In order to determine the relevant fair values of our derivative instruments, we also apply valuation adjustments for discounting, liquidity and credit quality. Credit risk is the risk that a counterparty will fail to perform on the contract or fail to pay amounts due. Liquidity risk represents the risk that imperfections in the market will cause the price to vary from estimated fair value based upon prevailing market supply and demand conditions. Since energy markets are imperfect and volatile, there are inherent risks related to the underlying assumptions in models used to fair value risk management contracts. Unforeseen events may cause reasonable price curves to differ from actual price curves throughout a contract’s term and at the time a contract settles. Consequently, there could be significant adverse or favorable effects on future net income and cash flows if market prices are not consistent with our estimates of current market consensus for forward prices in the current period. This is particularly true for longer term contracts. Cash flows may vary based on market conditions, margin requirements and the timing of settlement of our risk management contracts. According to the accounting guidance for “Derivatives and Hedging,” we reflect the fair values of our derivative instruments subject to netting agreements with the same counterparty net of related cash collateral. For certain risk management contracts, we are required to post or receive cash collateral based on third party contractual agreements and risk profiles. For the December 31, 2011 and 2010 balance sheets, we netted $26 million and $8 million, respectively, of cash collateral received from third parties against short-term and long-term risk management assets and $133 million and $109 million, respectively, of cash collateral paid to third parties against short-term and long-term risk management liabilities.

110
The following tables represent the gross fair value impact of our derivative activity on our balance sheets as of December 31, 2011 and 2010: Fair Value of Derivative Instruments
December 31, 2011 Risk Management
Contracts Hedging Contracts
Interest Rate
and Foreign Balance Sheet Location Commodity (a) Commodity (a) Currency (a) Other (b) Total
(in millions)
Current Risk Management Assets $ 852 $ 24 $ - $ (683) $ 193
Long-term Risk Management Assets 641 15 - (253) 403
Total Assets 1,493 39 - (936) 596
Current Risk Management Liabilities 847 29 20 (746) 150 Long-term Risk Management Liabilities 483 15 22 (325) 195
Total Liabilities 1,330 44 42 (1,071) 345
Total MTM Derivative Contract Net Assets
(Liabilities) $ 163 $ (5) $ (42) $ 135 $ 251
Fair Value of Derivative Instruments
December 31, 2010 Risk Management
Contracts Hedging Contracts
Interest Rate
and Foreign
Balance Sheet Location Commodity (a) Commodity (a) Currency (a) Other (b) Total
(in millions)
Current Risk Management Assets $ 1,023 $ 18 $ 30 $ (839) $ 232
Long-term Risk Management Assets 546 12 2 (150) 410
Total Assets 1,569 30 32 (989) 642
Current Risk Management Liabilities 995 13 2 (881) 129
Long-term Risk Management Liabilities 387 6 3 (255) 141
Total Liabilities 1,382 19 5 (1,136) 270
Total MTM Derivative Contract Net Assets
(Liabilities) $ 187 $ 11 $ 27 $ 147 $ 372
(a) Derivative instruments within these categories are reported gross. These instruments are subject to master netting agreements and
are presented on the balance sheets on a net basis in accordance with the accounting guidance for "Derivatives and Hedging." (b) Amounts include counterparty netting of risk management and hedging contracts and associated cash collateral in accordance with
the accounting guidance for "Derivatives and Hedging." Amounts also include de-designated risk management contracts.

111
The table below presents our activity of derivative risk management contracts for the years ended December 31, 2011, 2010 and 2009: Amount of Gain (Loss) Recognized on
Risk Management Contracts
Years Ended December 31,
Location of Gain (Loss) 2011 2010 2009
(in millions)
Utility Operations Revenues $ 46 $ 85 $ 144
Other Revenues 20 9 19
Regulatory Assets (a) (22) (9) (28)
Regulatory Liabilities (a) (3) 38 (7)
Total Gain (Loss) on Risk Management Contracts $ 41 $ 123 $ 128
(a) Represents realized and unrealized gains and losses subject to regulatory accounting treatment
recorded as either current or noncurrent on the balance sheets. Certain qualifying derivative instruments have been designated as normal purchase or normal sale contracts, as provided in the accounting guidance for “Derivatives and Hedging.” Derivative contracts that have been designated as normal purchases or normal sales under that accounting guidance are not subject to MTM accounting treatment and are recognized on the statements of income on an accrual basis. Our accounting for the changes in the fair value of a derivative instrument depends on whether it qualifies for and has been designated as part of a hedging relationship and further, on the type of hedging relationship. Depending on the exposure, we designate a hedging instrument as a fair value hedge or a cash flow hedge. For contracts that have not been designated as part of a hedging relationship, the accounting for changes in fair value depends on whether the derivative instrument is held for trading purposes. Unrealized and realized gains and losses on derivative instruments held for trading purposes are included in Revenues on a net basis on the statements of income. Unrealized and realized gains and losses on derivative instruments not held for trading purposes are included in Revenues or Expenses on the statements of income depending on the relevant facts and circumstances. However, unrealized and some realized gains and losses in regulated jurisdictions for both trading and non-trading derivative instruments are recorded as regulatory assets (for losses) or regulatory liabilities (for gains) in accordance with the accounting guidance for “Regulated Operations.” Accounting for Fair Value Hedging Strategies For fair value hedges (i.e. hedging the exposure to changes in the fair value of an asset, liability or an identified portion thereof attributable to a particular risk), the gain or loss on the derivative instrument as well as the offsetting gain or loss on the hedged item associated with the hedged risk impacts Net Income during the period of change. We record realized and unrealized gains or losses on interest rate swaps that qualify for fair value hedge accounting treatment and any offsetting changes in the fair value of the debt being hedged in Interest Expense on our statements of income. During 2011 and 2010, we recognized gains of $3 million and $6 million, respectively, on our hedging instruments and offsetting losses of $6 million and $6 million, respectively, on our long-term debt. For 2011 and 2010, hedge ineffectiveness was immaterial. During 2009, we did not employ any fair value hedging strategies. Accounting for Cash Flow Hedging Strategies For cash flow hedges (i.e. hedging the exposure to variability in expected future cash flows attributable to a particular risk), we initially report the effective portion of the gain or loss on the derivative instrument as a component of Accumulated Other Comprehensive Income (Loss) on our balance sheets until the period the hedged item affects Net Income. We recognize any hedge ineffectiveness in Net Income immediately during the period of change, except in regulated jurisdictions where hedge ineffectiveness is recorded as a regulatory asset (for losses) or a regulatory liability (for gains).

112
Realized gains and losses on derivative contracts for the purchase and sale of power, coal, natural gas, and heating oil and gasoline designated as cash flow hedges are included in Revenues, Fuel and Other Consumables Used for Electric Generation or Purchased Electricity for Resale on our statements of income or in Regulatory Assets or Regulatory Liabilities on our balance sheets, depending on the specific nature of the risk being hedged. During 2011, 2010 and 2009, we designated commodity derivatives as cash flow hedges. We reclassify gains and losses on financial fuel derivative contracts designated as cash flow hedges from Accumulated Other Comprehensive Income (Loss) on our balance sheets into Other Operation expense, Maintenance expense or Depreciation and Amortization expense, as it relates to capital projects, on our statements of income. During 2011, 2010 and 2009, we designated heating oil and gasoline derivatives as cash flow hedges. We reclassify gains and losses on interest rate derivative hedges related to our debt financings from Accumulated Other Comprehensive Income (Loss) into Interest Expense in those periods in which hedged interest payments occur. During 2011, 2010 and 2009, we designated interest rate derivatives as cash flow hedges. The accumulated gains or losses related to our foreign currency hedges are reclassified from Accumulated Other Comprehensive Income (Loss) on our balance sheets into Depreciation and Amortization expense on our statements of income over the depreciable lives of the fixed assets designated as the hedged items in qualifying foreign currency hedging relationships. During 2011, 2010 and 2009, we designated foreign currency derivatives as cash flow hedges. During 2009, we recognized a $6 million gain in Interest Expense related to hedge ineffectiveness on interest rate derivatives designated in cash flow hedge strategies. During 2011, 2010 and 2009, hedge ineffectiveness was immaterial or nonexistent for all of the other cash flow hedge strategies disclosed above. The following tables provide details on designated, effective cash flow hedges included in Accumulated Other Comprehensive Income (Loss) on our balance sheets and the reasons for changes in cash flow hedges for the years ended December 31, 2011, 2010 and 2009. All amounts in the following tables are presented net of related income taxes. Total Accumulated Other Comprehensive Income (Loss) Activity for Cash Flow Hedges
Year Ended December 31, 2011
Interest Rate
and Foreign
Commodity Currency Total
(in millions)
Balance in AOCI as of December 31, 2010 $ 7 $ 4 $ 11
Changes in Fair Value Recognized in AOCI (5) (28) (33)
Amount of (Gain) or Loss Reclassified from AOCI
to Statement of Income/within Balance Sheet:
Utility Operations Revenues 3 - 3
Other Revenues (5) - (5)
Purchased Electricity for Resale (2) - (2)
Other Operation Expense (1) - (1)
Maintenance Expense (1) - (1)
Interest Expense - 4 4
Property, Plant and Equipment (1) - (1)
Regulatory Assets (a) 2 - 2
Regulatory Liabilities (a) - - -
Balance in AOCI as of December 31, 2011 $ (3) $ (20) $ (23)

113
Total Accumulated Other Comprehensive Income (Loss) Activity for Cash Flow Hedges
Year Ended December 31, 2010
Interest Rate
and Foreign
Commodity Currency Total
(in millions)
Balance in AOCI as of December 31, 2009 $ (2) $ (13) $ (15)
Changes in Fair Value Recognized in AOCI 9 13 22
Amount of (Gain) or Loss Reclassified from AOCI
to Statement of Income/within Balance Sheet:
Utility Operations Revenues - - -
Other Revenues (7) - (7)
Purchased Electricity for Resale 4 - 4
Interest Expense - 4 4
Regulatory Assets (a) 3 - 3
Regulatory Liabilities (a) - - -
Balance in AOCI as of December 31, 2010 $ 7 $ 4 $ 11
Total Accumulated Other Comprehensive Income (Loss) Activity for Cash Flow Hedges
Year Ended December 31, 2009
Interest Rate
and Foreign Commodity Currency Total
(in millions)
Balance in AOCI as of December 31, 2008 $ 7 $ (29) $ (22)
Changes in Fair Value Recognized in AOCI (6) 11 5
Amount of (Gain) or Loss Reclassified from AOCI
to Statement of Income/within Balance Sheet:
Utility Operations Revenues (15) - (15)
Other Revenues (15) - (15)
Purchased Electricity for Resale 29 - 29
Interest Expense - 5 5
Regulatory Assets (a) 5 - 5
Regulatory Liabilities (a) (7) - (7)
Balance in AOCI as of December 31, 2009 $ (2) $ (13) $ (15)
(a) Represents realized and unrealized gains and losses subject to regulatory accounting treatment recorded as either
current or noncurrent on the balance sheets.

114
Cash flow hedges included in Accumulated Other Comprehensive Income (Loss) on our balance sheets at December 31, 2011 and 2010 were: Impact of Cash Flow Hedges on the Balance Sheet December 31, 2011 Interest Rate and Foreign Commodity Currency Total
(in millions) Hedging Assets (a) $ 20 $ - $ 20 Hedging Liabilities (a) 25 42 67 AOCI Gain (Loss) Net of Tax (3) (20) (23) Portion Expected to be Reclassified to Net Income During the Next Twelve Months (3) (2) (5)
Impact of Cash Flow Hedges on the Balance Sheet December 31, 2010 Interest Rate and Foreign Commodity Currency Total
(in millions) Hedging Assets (a) $ 13 $ 25 $ 38 Hedging Liabilities (a) 2 4 6 AOCI Gain (Loss) Net of Tax 7 4 11 Portion Expected to be Reclassified to Net Income During the Next Twelve Months 3 (2) 1
(a) Hedging Assets and Hedging Liabilities are included in Risk Management Assets and Liabilities on our balance sheets.
The actual amounts that we reclassify from Accumulated Other Comprehensive Income (Loss) to Net Income can differ from the estimate above due to market price changes. As of December 31, 2011, the maximum length of time that we are hedging (with contracts subject to the accounting guidance for “Derivatives and Hedging”) our exposure to variability in future cash flows related to forecasted transactions is 30 months. Credit Risk We limit credit risk in our wholesale marketing and trading activities by assessing the creditworthiness of potential counterparties before entering into transactions with them and continuing to evaluate their creditworthiness on an ongoing basis. We use Moody’s, Standard and Poor’s and current market-based qualitative and quantitative data as well as financial statements to assess the financial health of counterparties on an ongoing basis. We use standardized master agreements which may include collateral requirements. These master agreements facilitate the netting of cash flows associated with a single counterparty. Cash, letters of credit and parental/affiliate guarantees may be obtained as security from counterparties in order to mitigate credit risk. The collateral agreements require a counterparty to post cash or letters of credit in the event an exposure exceeds our established threshold. The threshold represents an unsecured credit limit which may be supported by a parental/affiliate guaranty, as determined in accordance with our credit policy. In addition, collateral agreements allow for termination and liquidation of all positions in the event of a failure or inability to post collateral.

115
Collateral Triggering Events
Under the tariffs of the RTOs and Independent System Operators (ISOs) and a limited number of derivative and non-derivative contracts primarily related to our competitive retail auction loads, we are obligated to post an additional amount of collateral if our credit ratings decline below investment grade. The amount of collateral required fluctuates based on market prices and our total exposure. On an ongoing basis, our risk management organization assesses the appropriateness of these collateral triggering items in contracts. AEP and its subsidiaries have not experienced a downgrade below investment grade. The following table represents: (a) our aggregate fair value of such derivative contracts, (b) the amount of collateral we would have been required to post for all derivative and non-derivative contracts if our credit ratings had declined below investment grade and (c) how much was attributable to RTO and ISO activities as of December 31, 2011 and 2010: December 31,
2011 2010
(in millions)
Liabilities for Derivative Contracts with Credit Downgrade Triggers $ 32 $ 20
Amount of Collateral AEP Subsidiaries Would Have Been
Required to Post 39 45
Amount Attributable to RTO and ISO Activities 38 44
In addition, a majority of our non-exchange traded commodity contracts contain cross-default provisions that, if triggered, would permit the counterparty to declare a default and require settlement of the outstanding payable. These cross-default provisions could be triggered if there was a non-performance event by Parent or the obligor under outstanding debt or a third party obligation in excess of $50 million. On an ongoing basis, our risk management organization assesses the appropriateness of these cross-default provisions in our contracts. We do not anticipate a non-performance event under these provisions. The following table represents: (a) the fair value of these derivative liabilities subject to cross-default provisions prior to consideration of contractual netting arrangements, (b) the amount this exposure has been reduced by cash collateral we have posted and (c) if a cross-default provision would have been triggered, the settlement amount that would be required after considering our contractual netting arrangements as of December 31, 2011 and 2010: December 31,
2011 2010
(in millions)
Liabilities for Contracts with Cross Default Provisions Prior to Contractual
Netting Arrangements $ 515 $ 401
Amount of Cash Collateral Posted 56 81
Additional Settlement Liability if Cross Default Provision is Triggered 291 213

116
10. FAIR VALUE MEASUREMENTS
Fair Value Measurements of Long-term Debt The fair values of Long-term Debt are based on quoted market prices, without credit enhancements, for the same or similar issues and the current interest rates offered for instruments with similar maturities. These instruments are not marked-to-market. The estimates presented are not necessarily indicative of the amounts that we could realize in a current market exchange. The book values and fair values of Long-term Debt as of December 31, 2011 and 2010 are summarized in the following table: December 31, 2011 2010
Book Value Fair Value Book Value Fair Value
(in millions) Long-term Debt $ 16,516 $ 19,259 $ 16,811 $ 18,285 Fair Value Measurements of Other Temporary Investments Other Temporary Investments include funds held by trustees primarily for the payment of securitization bonds, marketable securities that we intend to hold for less than one year and investments by our protected cell of EIS. See “Other Temporary Investments” section of Note 1. The following is a summary of Other Temporary Investments: December 31, 2011
Gross Gross Estimated Unrealized Unrealized Fair Other Temporary Investments Cost Gains Losses Value
(in millions) Restricted Cash (a) $ 216 $ - $ - $ 216 Fixed Income Securities: Mutual Funds 64 - - 64 Equity Securities - Mutual Funds 11 3 - 14
Total Other Temporary Investments $ 291 $ 3 $ - $ 294
December 31, 2010
Gross Gross Estimated Unrealized Unrealized Fair Other Temporary Investments Cost Gains Losses Value
(in millions) Restricted Cash (a) $ 225 $ - $ - $ 225 Fixed Income Securities: Mutual Funds 69 - - 69 Variable Rate Demand Notes 97 - - 97 Equity Securities - Mutual Funds 18 7 - 25
Total Other Temporary Investments $ 409 $ 7 $ - $ 416
(a) Primarily represents amounts held for the payment of debt.

117
The following table provides the activity for our debt and equity securities within Other Temporary Investments for the years ended December 31, 2011, 2010 and 2009: Years Ended December 31,
2011 2010 2009
(in millions)
Proceeds from Investment Sales $ 268 $ 455 $ 35
Purchases of Investments 154 503 82
Gross Realized Gains on Investment Sales 4 16 -
Gross Realized Losses on Investment Sales - - -
At December 31, 2011 and 2010, we had no Other Temporary Investments with an unrealized loss position. In 2009, we recorded $9 million ($6 million, net of tax) of other-than-temporary impairments of Other Temporary Investments for equity investments of our protected cell captive insurance company. At December 31, 2011, fixed income securities are primarily debt based mutual funds with short and intermediate maturities. Mutual funds may be sold and do not contain maturity dates. The following table provides details of Other Temporary Investments included in Accumulated Other Comprehensive Income (Loss) on our balance sheet and the reasons for changes for the year ended December 31, 2011. All amounts in the following table are presented net of related income taxes. Total Accumulated Other Comprehensive Income (Loss) Activity for Other Temporary Investments
Year Ended December 31, 2011
(in millions)
Balance in AOCI as of December 31, 2010 $ 4
Changes in Fair Value Recognized in AOCI 1
Amount of (Gain) or Loss Reclassified from AOCI to Statement of Income:
Interest Income (3)
Balance in AOCI as of December 31, 2011 $ 2
Fair Value Measurements of Trust Assets for Decommissioning and SNF Disposal I&M records securities held in trust funds for decommissioning nuclear facilities and for the disposal of SNF at fair value. See “Nuclear Trust Funds” section of Note 1. The following is a summary of nuclear trust fund investments at December 31, 2011 and December 31, 2010: December 31, 2011 2010
Estimated Gross Other-Than- Estimated Gross Other-Than- Fair Unrealized Temporary Fair Unrealized Temporary Value Gains Impairments Value Gains Impairments
(in millions) Cash and Cash Equivalents $ 18 $ - $ - $ 20 $ - $ - Fixed Income Securities: United States Government 544 61 (1) 461 23 (1) Corporate Debt 54 5 (2) 59 4 (2) State and Local Government 330 - (2) 341 (1) -
Subtotal Fixed Income Securities 928 66 (5) 861 26 (3) Equity Securities - Domestic 646 215 (80) 634 183 (123)
Spent Nuclear Fuel and Decommissioning Trusts $ 1,592 $ 281 $ (85) $ 1,515 $ 209 $ (126)

118
The following table provides the securities activity within the decommissioning and SNF trusts for the years ended December 31, 2011, 2010 and 2009: Years Ended December 31,
2011 2010 2009
(in millions)
Proceeds from Investment Sales $ 1,111 $ 1,362 $ 713
Purchases of Investments 1,167 1,415 771
Gross Realized Gains on Investment Sales 33 12 28
Gross Realized Losses on Investment Sales 22 2 1
The adjusted cost of debt securities was $862 million and $835 million as of December 31, 2011 and 2010, respectively. The adjusted cost of equity securities was $431 million and $451 million as of December 31, 2011 and 2010, respectively. The fair value of debt securities held in the nuclear trust funds, summarized by contractual maturities, at December 31, 2011 was as follows: Fair Value of Debt Securities
(in millions) Within 1 year $ 62 1 year – 5 years 285 5 years – 10 years 350 After 10 years 231
Total $ 928

119
Fair Value Measurements of Financial Assets and Liabilities
For a discussion of fair value accounting and the classification of assets and liabilities within the fair value hierarchy, see the “Fair Value Measurements of Assets and Liabilities” section of Note 1. The following tables set forth, by level within the fair value hierarchy, our financial assets and liabilities that were accounted for at fair value on a recurring basis as of December 31, 2011 and 2010. As required by the accounting guidance for “Fair Value Measurements and Disclosures,” financial assets and liabilities are classified in their entirety based on the lowest level of input that is significant to the fair value measurement. Our assessment of the significance of a particular input to the fair value measurement requires judgment and may affect the valuation of fair value assets and liabilities and their placement within the fair value hierarchy levels. There have not been any significant changes in AEP’s valuation techniques. Assets and Liabilities Measured at Fair Value on a Recurring Basis December 31, 2011
Level 1 Level 2 Level 3 Other Total
Assets: (in millions)
Cash and Cash Equivalents (a) $ 6 $ - $ - $ 215 $ 221
Other Temporary Investments
Restricted Cash (a) 191 - - 25 216
Fixed Income Securities:
Mutual Funds 64 - - - 64
Equity Securities - Mutual Funds (b) 14 - - - 14
Total Other Temporary Investments 269 - - 25 294
Risk Management Assets
Risk Management Commodity Contracts (c) (f) 47 1,299 147 (945) 548
Cash Flow Hedges:
Commodity Hedges (c) 15 23 - (18) 20
De-designated Risk Management Contracts (d) - - - 28 28
Total Risk Management Assets 62 1,322 147 (935) 596
Spent Nuclear Fuel and Decommissioning Trusts
Cash and Cash Equivalents (e) - 5 - 13 18
Fixed Income Securities:
United States Government - 544 - - 544
Corporate Debt - 54 - - 54
State and Local Government - 330 - - 330
Subtotal Fixed Income Securities - 928 - - 928
Equity Securities - Domestic (b) 646 - - - 646
Total Spent Nuclear Fuel and Decommissioning Trusts 646 933 - 13 1,592
Total Assets $ 983 $ 2,255 $ 147 $ (682) $ 2,703
Liabilities:
Risk Management Liabilities
Risk Management Commodity Contracts (c) (f) $ 43 $ 1,209 $ 78 $ (1,052) $ 278
Cash Flow Hedges:
Commodity Hedges (c) - 43 - (18) 25
Interest Rate/Foreign Currency Hedges - 42 - - 42
Total Risk Management Liabilities $ 43 $ 1,294 $ 78 $ (1,070) $ 345

120
Assets and Liabilities Measured at Fair Value on a Recurring Basis
December 31, 2010
Level 1 Level 2 Level 3 Other Total
Assets: (in millions)
Cash and Cash Equivalents (a) $ 170 $ - $ - $ 124 $ 294
Other Temporary Investments
Restricted Cash (a) 184 - - 41 225
Fixed Income Securities:
Mutual Funds 69 - - - 69
Variable Rate Demand Notes - 97 - - 97
Equity Securities - Mutual Funds (b) 25 - - - 25
Total Other Temporary Investments 278 97 - 41 416
Risk Management Assets
Risk Management Commodity Contracts (c) (g) 20 1,432 112 (1,013) 551
Cash Flow Hedges:
Commodity Hedges (c) 11 17 - (15) 13
Interest Rate/Foreign Currency Hedges - 25 - - 25
Fair Value Hedges - 7 - - 7
De-designated Risk Management Contracts (d) - - - 46 46
Total Risk Management Assets 31 1,481 112 (982) 642
Spent Nuclear Fuel and Decommissioning Trusts
Cash and Cash Equivalents (e) - 8 - 12 20
Fixed Income Securities:
United States Government - 461 - - 461
Corporate Debt - 59 - - 59
State and Local Government - 341 - - 341
Subtotal Fixed Income Securities - 861 - - 861
Equity Securities - Domestic (b) 634 - - - 634
Total Spent Nuclear Fuel and Decommissioning Trusts 634 869 - 12 1,515
Total Assets $ 1,113 $ 2,447 $ 112 $ (805) $ 2,867
Liabilities:
Risk Management Liabilities
Risk Management Commodity Contracts (c) (g) $ 25 $ 1,325 $ 27 $ (1,114) $ 263
Cash Flow Hedges:
Commodity Hedges (c) 4 13 - (15) 2
Interest Rate/Foreign Currency Hedges - 4 - - 4
Fair Value Hedges - 1 - - 1
Total Risk Management Liabilities $ 29 $ 1,343 $ 27 $ (1,129) $ 270
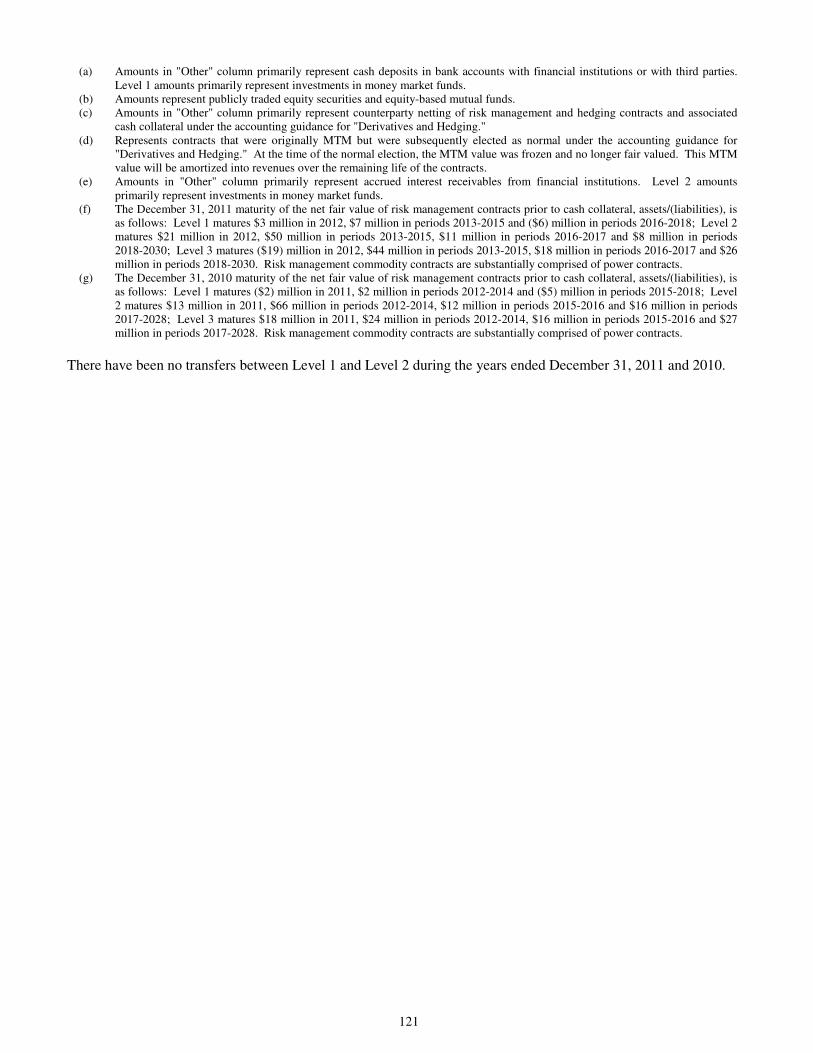
121
(a) Amounts in "Other" column primarily represent cash deposits in bank accounts with financial institutions or with third parties.
Level 1 amounts primarily represent investments in money market funds. (b) Amounts represent publicly traded equity securities and equity-based mutual funds. (c) Amounts in "Other" column primarily represent counterparty netting of risk management and hedging contracts and associated
cash collateral under the accounting guidance for "Derivatives and Hedging." (d) Represents contracts that were originally MTM but were subsequently elected as normal under the accounting guidance for
"Derivatives and Hedging." At the time of the normal election, the MTM value was frozen and no longer fair valued. This MTM value will be amortized into revenues over the remaining life of the contracts.
(e) Amounts in "Other" column primarily represent accrued interest receivables from financial institutions. Level 2 amounts primarily represent investments in money market funds.
(f) The December 31, 2011 maturity of the net fair value of risk management contracts prior to cash collateral, assets/(liabilities), is as follows: Level 1 matures $3 million in 2012, $7 million in periods 2013-2015 and ($6) million in periods 2016-2018; Level 2 matures $21 million in 2012, $50 million in periods 2013-2015, $11 million in periods 2016-2017 and $8 million in periods 2018-2030; Level 3 matures ($19) million in 2012, $44 million in periods 2013-2015, $18 million in periods 2016-2017 and $26 million in periods 2018-2030. Risk management commodity contracts are substantially comprised of power contracts.
(g) The December 31, 2010 maturity of the net fair value of risk management contracts prior to cash collateral, assets/(liabilities), is as follows: Level 1 matures ($2) million in 2011, $2 million in periods 2012-2014 and ($5) million in periods 2015-2018; Level 2 matures $13 million in 2011, $66 million in periods 2012-2014, $12 million in periods 2015-2016 and $16 million in periods 2017-2028; Level 3 matures $18 million in 2011, $24 million in periods 2012-2014, $16 million in periods 2015-2016 and $27 million in periods 2017-2028. Risk management commodity contracts are substantially comprised of power contracts.
There have been no transfers between Level 1 and Level 2 during the years ended December 31, 2011 and 2010.
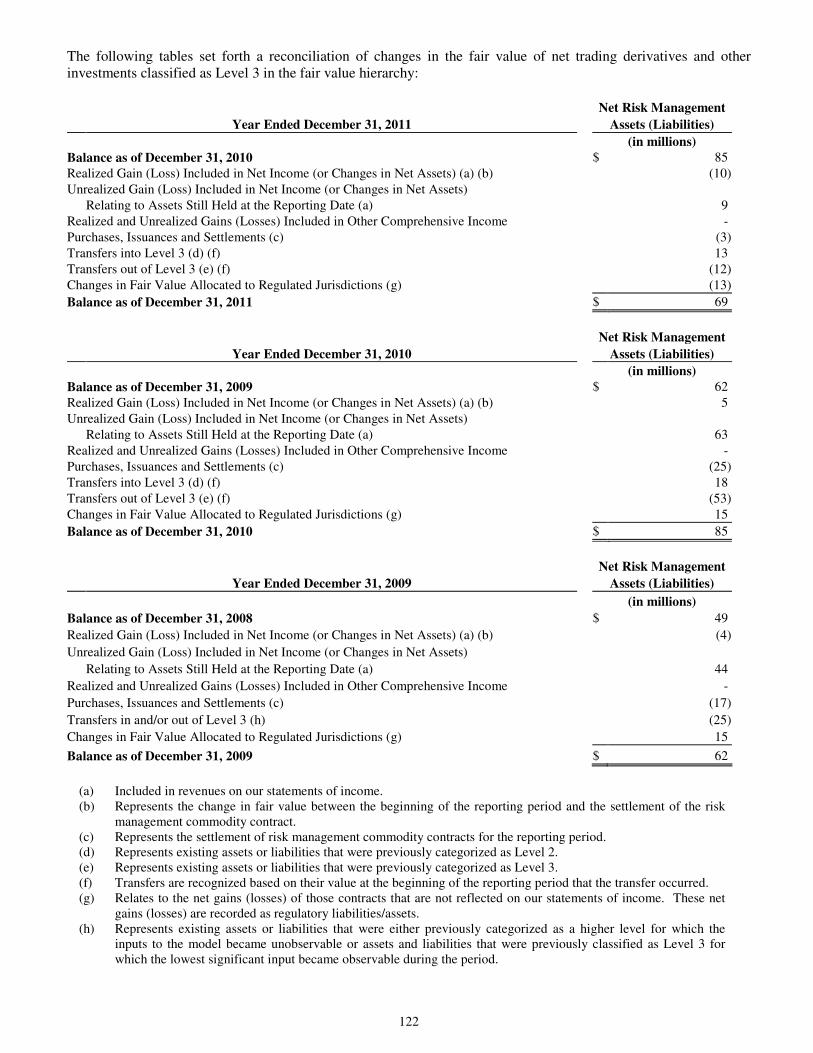
122
The following tables set forth a reconciliation of changes in the fair value of net trading derivatives and other investments classified as Level 3 in the fair value hierarchy: Net Risk Management
Year Ended December 31, 2011 Assets (Liabilities)
(in millions)
Balance as of December 31, 2010 $ 85
Realized Gain (Loss) Included in Net Income (or Changes in Net Assets) (a) (b) (10)
Unrealized Gain (Loss) Included in Net Income (or Changes in Net Assets)
Relating to Assets Still Held at the Reporting Date (a) 9
Realized and Unrealized Gains (Losses) Included in Other Comprehensive Income -
Purchases, Issuances and Settlements (c) (3)
Transfers into Level 3 (d) (f) 13
Transfers out of Level 3 (e) (f) (12)
Changes in Fair Value Allocated to Regulated Jurisdictions (g) (13)
Balance as of December 31, 2011 $ 69
Net Risk Management
Year Ended December 31, 2010 Assets (Liabilities)
(in millions)
Balance as of December 31, 2009 $ 62
Realized Gain (Loss) Included in Net Income (or Changes in Net Assets) (a) (b) 5
Unrealized Gain (Loss) Included in Net Income (or Changes in Net Assets)
Relating to Assets Still Held at the Reporting Date (a) 63
Realized and Unrealized Gains (Losses) Included in Other Comprehensive Income -
Purchases, Issuances and Settlements (c) (25)
Transfers into Level 3 (d) (f) 18
Transfers out of Level 3 (e) (f) (53)
Changes in Fair Value Allocated to Regulated Jurisdictions (g) 15
Balance as of December 31, 2010 $ 85
Net Risk Management
Year Ended December 31, 2009 Assets (Liabilities)
(in millions)
Balance as of December 31, 2008 $ 49
Realized Gain (Loss) Included in Net Income (or Changes in Net Assets) (a) (b) (4)
Unrealized Gain (Loss) Included in Net Income (or Changes in Net Assets)
Relating to Assets Still Held at the Reporting Date (a) 44
Realized and Unrealized Gains (Losses) Included in Other Comprehensive Income -
Purchases, Issuances and Settlements (c) (17)
Transfers in and/or out of Level 3 (h) (25)
Changes in Fair Value Allocated to Regulated Jurisdictions (g) 15
Balance as of December 31, 2009 $ 62
(a) Included in revenues on our statements of income. (b) Represents the change in fair value between the beginning of the reporting period and the settlement of the risk
management commodity contract. (c) Represents the settlement of risk management commodity contracts for the reporting period. (d) Represents existing assets or liabilities that were previously categorized as Level 2. (e) Represents existing assets or liabilities that were previously categorized as Level 3. (f) Transfers are recognized based on their value at the beginning of the reporting period that the transfer occurred. (g) Relates to the net gains (losses) of those contracts that are not reflected on our statements of income. These net
gains (losses) are recorded as regulatory liabilities/assets. (h) Represents existing assets or liabilities that were either previously categorized as a higher level for which the
inputs to the model became unobservable or assets and liabilities that were previously classified as Level 3 for which the lowest significant input became observable during the period.

123
11. INCOME TAXES The details of our consolidated income taxes before extraordinary items as reported are as follows: Years Ended December 31,
2011 2010 2009
(in millions)
Federal: Current $ 20 $ (134) $ (575)
Deferred 786 760 1,171
Total Federal 806 626 596
State and Local:
Current 37 (20) (76)
Deferred (25) 38 55
Total State and Local 12 18 (21)
International:
Current - (1) -
Deferred - - -
Total International - (1) -
Income Tax Expense $ 818 $ 643 $ 575
The following is a reconciliation of our consolidated difference between the amount of federal income taxes computed by multiplying book income before income taxes by the federal statutory tax rate and the amount of income taxes reported.
Years Ended December 31,
2011 2010 2009
(in millions) Net Income $ 1,949 $ 1,218 $ 1,365
Extraordinary Items, Net of Tax of $(112) million and $3 million in 2011
and 2009, respectively (373) - 5
Income Before Extraordinary Items 1,576 1,218 1,370
Income Tax Expense 818 643 575
Pretax Income $ 2,394 $ 1,861 $ 1,945
Income Taxes on Pretax Income at Statutory Rate (35%) $ 838 $ 651 $ 681
Increase (Decrease) in Income Taxes resulting from the following items:
Depreciation 41 47 31
Investment Tax Credits, Net (15) (16) (19)
Energy Production Credits (18) (20) (15)
State and Local Income Taxes, Net (22) 11 (14)
Removal Costs (20) (19) (19)
AFUDC (42) (33) (36)
Medicare Subsidy 1 12 (11)
Valuation Allowance 86 - -
Tax Reserve Adjustments 2 (16) (6)
Other (33) 26 (17)
Income Tax Expense $ 818 $ 643 $ 575
Effective Income Tax Rate 34.2 % 34.6 % 29.6 %

124
The following table shows elements of the net deferred tax liability and significant temporary differences: December 31,
2011 2010
(in millions)
Deferred Tax Assets $ 2,855 $ 2,519
Deferred Tax Liabilities (11,185) (10,009)
Net Deferred Tax Liabilities $ (8,330) $ (7,490)
Property Related Temporary Differences $ (5,963) $ (5,301)
Amounts Due from Customers for Future Federal Income Taxes (259) (250)
Deferred State Income Taxes (668) (622)
Securitized Transition Assets (621) (651)
Regulatory Assets (1,208) (867)
Postretirement Benefits 424 356
Accrued Pensions 149 218
Deferred Income Taxes on Other Comprehensive Loss 254 207
Accrued Nuclear Decommissioning (436) (395)
Net Operating Loss Carryforward 125 -
Tax Credit Carryforward 182 -
Valuation Allowance (86) -
All Other, Net (223) (185)
Net Deferred Tax Liabilities $ (8,330) $ (7,490)
AEP System Tax Allocation Agreement We, along with our subsidiaries, file a consolidated federal income tax return. The allocation of the AEP System’s current consolidated federal income tax to the AEP System companies allocates the benefit of current tax losses to the AEP System companies giving rise to such losses in determining their current tax expense. The tax benefit of the Parent is allocated to our subsidiaries with taxable income. With the exception of the loss of the Parent, the method of allocation reflects a separate return result for each company in the consolidated group. Federal and State Income Tax Audit Status We are no longer subject to U.S. federal examination for years before 2009. We completed the examination of the years 2007 and 2008 in April 2011 and settled all outstanding issues on appeal for the years 2001 through 2006 in October 2011. The settlements did not have a material impact on net income, cash flows or financial condition. The IRS examination of years 2009 and 2010 started in October 2011. Although the outcome of tax audits is uncertain, in management’s opinion, adequate provisions for federal income taxes have been made for potential liabilities resulting from such matters. In addition, we accrue interest on these uncertain tax positions. We are not aware of any issues for open tax years that upon final resolution are expected to have a material effect on net income. We, along with our subsidiaries, file income tax returns in various state, local and foreign jurisdictions. These taxing authorities routinely examine our tax returns and we are currently under examination in several state and local jurisdictions. We believe that we have filed tax returns with positions that may be challenged by these tax authorities. Management believes that adequate provisions for income taxes have been made for potential liabilities resulting from such challenges and the ultimate resolution of these audits will not materially impact net income. With few exceptions, we are no longer subject to state, local or non-U.S. income tax examinations by tax authorities for years before 2000.

125
Net Income Tax Operating Loss Carryforward In 2011, we sustained a federal net income tax operating loss of $226 million driven primarily by bonus depreciation, pension plan contributions and other book versus tax temporary differences. We also had state net income tax operating loss carryforwards as indicated in the table below. As a result, we accrued deferred federal, state and local income tax benefits in 2011. We expect to realize the federal, state and local cash flow benefit in future periods as there was insufficient capacity in prior periods to carry the net operating loss back. We anticipate future taxable income will be sufficient to realize the net income tax operating loss tax benefits before the federal carryforward expires after 2031. State Net Income
Tax Operating
Loss Year of State Carryforward Expiration
(in millions) Oklahoma $ 135 2031 Tennessee 13 2026 Virginia 358 2031 West Virginia 511 2031 We sustained federal, state and local net income tax operating losses in 2009 driven primarily by bonus depreciation, a change in tax accounting method related to units of property and other book versus tax temporary differences. As a result, we accrued current federal, state and local income tax benefits in 2009. We realized the federal cash flow benefit in 2010 as there was sufficient capacity in prior periods to carry the net operating loss back. Most of our state and local jurisdictions do not provide for a net operating loss carry back, therefore the state and local losses were carried forward to future periods. Tax Credit Carryforward
Federal and state net income tax operating losses sustained in 2009 and 2011 along with lower federal and state taxable income in 2010 resulted in unused federal and state income tax credits. At December 31, 2011, we have total federal tax credit carryforwards of $182 million and total state tax credit carryforwards of $74 million, not all of which are subject to an expiration date. If these credits are not utilized, the federal general business tax credits of $81 million will expire in the years 2028 through 2031 and the state coal tax credits of $29 million will expire in the years 2013 through 2021. We anticipate future federal taxable income will be sufficient to realize the tax benefits of the federal tax credits before they expire unused. We do not anticipate state taxable income will be sufficient in future periods to realize the tax benefits of all state income tax credits before they expire unused and we have provided a valuation allowance accordingly. Valuation Allowance We assess past results and future operations to estimate and evaluate available positive and negative evidence to evaluate whether sufficient future taxable income will be generated to use existing deferred tax assets. A significant piece of objective negative information evaluated were the net income tax operating losses sustained in 2009 and 2011. On the basis of this evaluation of available positive and negative evidence, as of December 31, 2011, a valuation allowance of $30 million for state tax credits, net of federal tax, and $56 million for an unrealized capital loss has been recorded in order to measure only the portion of the deferred tax assets that, more likely than not, will be realized. The amount of the deferred tax assets considered realizable, however, could be adjusted if estimates of future taxable income during the carryforward period are reduced or if objective negative evidence in the form of cumulative losses is no longer present and additional weight may be given to subjective evidence, such as our projections for growth. For a discussion of the tax implications of the unrealized capital loss resulting from our settlement with BOA and Enron, see “Enron Bankruptcy” section of Note 5.

126
Uncertain Tax Positions We recognize interest accruals related to uncertain tax positions in interest income or expense, as applicable, and penalties in Other Operation in accordance with the accounting guidance for “Income Taxes.” The following table shows amounts reported for interest expense, interest income and reversal of prior period interest expense: Years Ended December 31, 2011 2010 2009
(in millions) Interest Expense $ 8 $ 8 $ 1 Interest Income 22 11 5 Reversal of Prior Period Interest Expense 13 5 5 The following table shows balances for amounts accrued for the receipt of interest and the payment of interest and penalties: December 31, 2011 2010
(in millions) Accrual for Receipt of Interest $ 13 $ 42 Accrual for Payment of Interest and Penalties 6 21 The reconciliation of the beginning and ending amount of unrecognized tax benefits is as follows: 2011 2010 2009
(in millions) Balance at January 1, $ 219 $ 237 $ 237 Increase - Tax Positions Taken During a Prior Period 51 40 56 Decrease - Tax Positions Taken During a Prior Period (43) (43) (65) Increase - Tax Positions Taken During the Current Year 10 - 16 Decrease - Tax Positions Taken During the Current Year - (6) - Increase - Settlements with Taxing Authorities - - 1 Decrease - Settlements with Taxing Authorities (31) (2) - Decrease - Lapse of the Applicable Statute of Limitations (38) (7) (8)
Balance at December 31, $ 168 $ 219 $ 237
The total amount of unrecognized tax benefits that, if recognized, would affect the effective tax rate is $111 million, $112 million and $137 million for 2011, 2010 and 2009, respectively. We believe there will be no significant net increase or decrease in unrecognized tax benefits within 12 months of the reporting date. Federal Tax Legislation Under the Energy Tax Incentives Act of 2005, we filed applications with the United States Department of Energy and the IRS in 2008 for the West Virginia IGCC project and in July 2008 the IRS allocated the project $134 million in credits. In September 2008, we entered into a memorandum of understanding with the IRS concerning the requirements of claiming the credits. We had until July 2010 to meet certain minimum requirements under the agreement with the IRS or the credits would be forfeited. In July 2010, we forfeited the allocated tax credits.

127
The American Recovery and Reinvestment Tax Act of 2009 provided for several new grant programs and expanded tax credits and an extension of the 50% bonus depreciation provision enacted in the Economic Stimulus Act of 2008. The enacted provisions did not have a material impact on net income or financial condition. However, the bonus depreciation contributed to the 2009 federal net operating tax loss that resulted in a 2010 cash flow benefit of $419 million. The Patient Protection and Affordable Care Act and the related Health Care and Education Reconciliation Act (Health Care Acts) were enacted in March 2010. The Health Care Acts amend tax rules so that the portion of employer health care costs that are reimbursed by the Medicare Part D prescription drug subsidy will no longer be deductible by the employer for federal income tax purposes effective for years beginning after December 31, 2012. Because of the loss of the future tax deduction, a reduction in the deferred tax asset related to the nondeductible OPEB liabilities accrued to date was recorded in March 2010. This reduction did not materially affect our cash flows or financial condition. For the year ended December 31, 2010, deferred tax assets decreased $56 million, partially offset by recording net tax regulatory assets of $35 million in our jurisdictions with regulated operations, resulting in a decrease in net income of $21 million. The Small Business Jobs Act (the Act) was enacted in September 2010. Included in the Act was a one-year extension of the 50% bonus depreciation provision. The Tax Relief, Unemployment Insurance Reauthorization and the Job Creation Act of 2010 extended the life of research and development, employment and several energy tax credits originally scheduled to expire at the end of 2010. In addition, the Act extended the time for claiming bonus depreciation and increased the deduction to 100% for part of 2010 and 2011. The enacted provisions will not have a material impact on net income or financial condition but had a favorable impact on cash flows of $318 million in 2010. In December of 2011 the U.S. Treasury Department issued guidance regarding the deduction and capitalization of expenditures related to tangible property. The guidance was in the form of proposed and temporary regulations and generally is effective for tax years beginning in 2012. These regulations did not have an impact on either net income or cash flow in 2011. We are still evaluating the impact these regulations will have on future periods. State Tax Legislation Ohio House Bill 66 of 2005 imposed a commercial activity tax at a fully phased-in rate of 0.26% on all Ohio gross receipts. The tax was phased-in over a five-year period that began July 1, 2005 at 23% of the full 0.26% rate. As a result of this tax, expenses of approximately $14 million, $13 million and $11 million were recorded in 2011, 2010 and 2009, respectively, in Taxes Other Than Income Taxes. Legislation was passed by the state of Indiana in May 2011 enacting a phased reduction in corporate income tax rates from 8.5% to 6.5%. The current 8.5% Indiana corporate income tax rate is scheduled for a 0.5% reduction each year beginning after June 30, 2012 with the final reduction occurring in years beginning after June 30, 2015. In May 2011, Michigan repealed its Business Tax regime and replaced it with a traditional corporate net income tax with a rate of 6%, effective January 1, 2012. During the third quarter of 2011, the state of West Virginia determined that the state had achieved certain minimum levels of shortfall reserve funds and thus, the West Virginia corporate income tax rate will be reduced to 7.75% in 2012. The enacted provisions will not have a material impact on net income, cash flows or financial condition.

128
12. LEASES Leases of property, plant and equipment are for periods up to 60 years and require payments of related property taxes, maintenance and operating costs. The majority of the leases have purchase or renewal options and will be renewed or replaced by other leases. Lease rentals for both operating and capital leases are generally charged to Other Operation and Maintenance expense in accordance with rate-making treatment for regulated operations. Additionally, for regulated operations with capital leases, a capital lease asset and offsetting liability are recorded at the present value of the remaining lease payments for each reporting period. Capital leases for nonregulated property are accounted for as if the assets were owned and financed. The components of rental costs are as follows:
Years Ended December 31,
Lease Rental Costs 2011 2010 2009
(in millions) Net Lease Expense on Operating Leases $ 343 $ 343 $ 354
Amortization of Capital Leases 72 97 83
Interest on Capital Leases 32 26 13
Total Lease Rental Costs $ 447 $ 466 $ 450
The following table shows the property, plant and equipment under capital leases and related obligations recorded on our balance sheets. Capital lease obligations are included in Other Current Liabilities and Deferred Credits and Other Noncurrent Liabilities on our balance sheets. December 31,
Property, Plant and Equipment Under Capital Leases 2011 2010
(in millions)
Generation $ 104 $ 97
Other Property, Plant and Equipment 485 482
Total Property, Plant and Equipment Under Capital Leases 589 579
Accumulated Amortization 137 108
Net Property, Plant and Equipment Under Capital Leases $ 452 $ 471
Obligations Under Capital Leases
Noncurrent Liability $ 384 $ 398
Liability Due Within One Year 74 76
Total Obligations Under Capital Leases $ 458 $ 474
Future minimum lease payments consisted of the following at December 31, 2011: Noncancelable
Future Minimum Lease Payments Capital Leases Operating Leases
(in millions)
2012 $ 96 $ 316
2013 81 288
2014 67 264
2015 55 245
2016 47 226
Later Years 285 1,235
Total Future Minimum Lease Payments 631 $ 2,574
Less Estimated Interest Element 173
Estimated Present Value of Future Minimum
Lease Payments $ 458

129
Master Lease Agreements We lease certain equipment under master lease agreements. In December 2010, we signed a new master lease agreement with GE Capital Commercial Inc. (GE) for approximately $137 million to replace existing operating and capital leases with GE. We refinanced $60 million of capital leases and $77 million of operating leases. These assets were included in existing master lease agreements that were to be terminated in 2011 since GE exercised the termination provision related to these leases in 2008. In January 2011, we purchased $5 million of previously leased assets that were not included in the 2010 refinancing. In June 2011, we placed an additional $11 million of previously leased assets under a new capital lease. These obligations are included in the future minimum lease payments schedule earlier in this note. For equipment under the GE master lease agreements, the lessor is guaranteed receipt of up to 78% of the unamortized balance of the equipment at the end of the lease term. If the fair value of the leased equipment is below the unamortized balance at the end of the lease term, we are committed to pay the difference between the fair value and the unamortized balance, with the total guarantee not to exceed 78% of the unamortized balance. For equipment under other master lease agreements, the lessor is guaranteed a residual value up to a stated percentage of either the unamortized balance or the equipment cost at the end of the lease term. If the actual fair value of the leased equipment is below the guaranteed residual value at the end of the lease term, we are committed to pay the difference between the actual fair value and the residual value guarantee. At December 31, 2011, the maximum potential loss for these lease agreements was approximately $14 million assuming the fair value of the equipment is zero at the end of the lease term. Historically, at the end of the lease term the fair value has been in excess of the unamortized balance. Rockport Lease AEGCo and I&M entered into a sale-and-leaseback transaction in 1989 with Wilmington Trust Company (Owner Trustee), an unrelated, unconsolidated trustee for Rockport Plant Unit 2 (the Plant). The Owner Trustee was capitalized with equity from six owner participants with no relationship to AEP or any of its subsidiaries and debt from a syndicate of banks and securities in a private placement to certain institutional investors. The gain from the sale was deferred and is being amortized over the term of the lease, which expires in 2022. The Owner Trustee owns the Plant and leases it equally to AEGCo and I&M. The lease is accounted for as an operating lease with the payment obligations included in the future minimum lease payments schedule earlier in this note. The lease term is for 33 years with potential renewal options. At the end of the lease term, AEGCo and I&M have the option to renew the lease or the Owner Trustee can sell the Plant. AEP, AEGCo and I&M have no ownership interest in the Owner Trustee and do not guarantee its debt. The future minimum lease payments for this sale-and-leaseback transaction as of December 31, 2011 are as follows: Future Minimum Lease Payments AEGCo I&M
(in millions)
2012 $ 74 $ 74
2013 74 74
2014 74 74
2015 74 74
2016 74 74
Later Years 443 443
Total Future Minimum Lease Payments $ 813 $ 813
130
Railcar Lease In June 2003, AEP Transportation LLC (AEP Transportation), a subsidiary of AEP, entered into an agreement with BTM Capital Corporation, as lessor, to lease 875 coal-transporting aluminum railcars. The lease is accounted for as an operating lease. In January 2008, AEP Transportation assigned the remaining 848 railcars under the original lease agreement to I&M (390 railcars) and SWEPCo (458 railcars). The assignment is accounted for as operating leases for I&M and SWEPCo. The initial lease term was five years with three consecutive five-year renewal periods for a maximum lease term of twenty years. I&M and SWEPCo intend to renew these leases for the full lease term of twenty years via the renewal options. The future minimum lease obligations are $16 million for I&M and $18 million for SWEPCo for the remaining railcars as of December 31, 2011. These obligations are included in the future minimum lease payments schedule earlier in this note. Under the lease agreement, the lessor is guaranteed that the sale proceeds under a return-and-sale option will equal at least a lessee obligation amount specified in the lease, which declines from approximately 84% under the current five year lease term to 77% at the end of the 20-year term of the projected fair value of the equipment. I&M and SWEPCo have assumed the guarantee under the return-and-sale option. I&M’s maximum potential loss related to the guarantee is approximately $12 million and SWEPCo’s is approximately $13 million assuming the fair value of the equipment is zero at the end of the current five-year lease term. However, we believe that the fair value would produce a sufficient sales price to avoid any loss. Sabine Dragline Lease During 2009, Sabine, an entity consolidated in accordance with the accounting guidance for “Variable Interest Entities,” entered into capital lease arrangements with a nonaffiliated company to finance the purchase of two electric draglines to be used for Sabine’s mining operations totaling $47 million. The amounts included in the lease represented the aggregate fair value of the existing equipment and a sale-and-leaseback transaction for additional dragline rebuild costs required to keep the dragline operational. In addition to the 2009 transactions, Sabine has one additional $53 million dragline completed in 2008 that was financed under a capital lease. These capital lease assets are included in Other Property, Plant and Equipment on our December 31, 2011 and 2010 balance sheets. The short-term and long-term capital lease obligations are included in Other Current Liabilities and Deferred Credits and Other Noncurrent Liabilities on our December 31, 2011 and 2010 balance sheets. The future payment obligations are included in our future minimum lease payments schedule earlier in this note. I&M Nuclear Fuel Lease In December 2007, I&M entered into a sale-and-leaseback transaction with Citicorp Leasing, Inc. (CLI), an unrelated, unconsolidated, wholly-owned subsidiary of Citibank, N.A. to lease nuclear fuel for I&M’s Cook Plant. In December 2007, I&M sold a portion of its unamortized nuclear fuel inventory to CLI at cost for $85 million. The lease has a variable rate based on one month LIBOR and is accounted for as a capital lease with lease terms up to 60 months. The future payment obligations of $383 thousand are included in our future minimum lease payments schedule earlier in this note. The net capital lease asset is included in Other Property, Plant and Equipment and the short-term and long-term capital lease obligations are included in Other Current Liabilities and Deferred Credits and Other Noncurrent Liabilities, respectively, on our December 31, 2011 and 2010 balance sheets. The future minimum lease payments for this sale-and-leaseback transaction as of December 31, 2011 are $383 thousand for 2012, based on estimated fuel burn.

131
13. FINANCING ACTIVITIES
AEP Common Stock
In April 2009, we issued 69 million shares of common stock at $24.50 per share for net proceeds of $1.64 billion, which were primarily used to repay cash drawn under our credit facilities in the second quarter of 2009. Set forth below is a reconciliation of common stock share activity for the years ended December 31, 2011, 2010 and 2009: Held in
Shares of AEP Common Stock Issued Treasury
Balance, December 31, 2008 426,321,248 20,249,992
Issued 72,012,017 -
Treasury Stock Acquired - 28,866
Balance, December 31, 2009 498,333,265 20,278,858
Issued 2,781,616 -
Treasury Stock Acquired - 28,867
Balance, December 31, 2010 501,114,881 20,307,725
Issued 2,644,579 -
Treasury Stock Acquired - 28,867
Balance, December 31, 2011 503,759,460 20,336,592
Preferred Stock In December 2011, AEP subsidiaries redeemed all of their outstanding preferred stock with a par value of $60 million at a premium, resulting in a $2.8 million loss, which is included in Preferred Stock Dividend Requirements of Subsidiaries Including Capital Stock Expense on our statement of income. The redeemed shares are no longer outstanding and represent only the right to receive the applicable redemption price, to the extent the shares have not yet been presented for payment.

132
Long-term Debt
Weighted
Average
Interest
Rate at Outstanding at
December 31, Interest Rate Ranges at December 31, December 31,
Type of Debt and Maturity 2011 2011 2010 2011 2010
(in millions)
Senior Unsecured Notes
2011-2040 5.85% 0.955%-8.13% 0.702%-8.13% $ 11,737 $ 11,669
Pollution Control Bonds (a)
2011-2038 (b) 3.57% 0.06%-6.30% 0.29%-6.30% 2,112 2,263
Notes Payable (c)
2011-2026 4.77% 2.029%-8.03% 2.07%-8.03% 402 396
Securitization Bonds
2013-2020 5.36% 4.98%-6.25% 4.98%-6.25% 1,688 1,847
Junior Subordinated Debentures (d)
2063 8.75% 8.75% 8.75% 315 315
Spent Nuclear Fuel Obligation (e) 265 265
Other Long-term Debt
2011-2059 6.07% 3.00%-13.718% 1.3125%-13.718% 29 91
Fair Value of Interest Rate Hedges 7 6
Unamortized Discount, Net (39) (41)
Total Long-term Debt Outstanding 16,516 16,811
Long-term Debt Due Within One Year 1,433 1,309
Long-term Debt $ 15,083 $ 15,502
(a) For certain series of pollution control bonds, interest rates are subject to periodic adjustment. Certain series may be purchased on
demand at periodic interest adjustment dates. Letters of credit from banks, standby bond purchase agreements and insurance policies support certain series.
(b) Certain pollution control bonds are subject to redemption earlier than the maturity date. Consequently, these bonds have been classified for maturity purposes as Long-term Debt Due Within One Year on our balance sheets.
(c) Notes payable represent outstanding promissory notes issued under term loan agreements and credit agreements with a number of banks and other financial institutions. At expiration, all notes then issued and outstanding are due and payable. Interest rates are both fixed and variable. Variable rates generally relate to specified short-term interest rates.
(d) Debentures will mature on March 1, 2063, subject to extensions to no later than March 1, 2068, and are callable at par any time on or after March 1, 2013.
(e) Spent nuclear fuel obligation consists of a liability along with accrued interest for disposal of spent nuclear fuel (see "SNF Disposal" section of Note 5).

133
Long-term debt outstanding at December 31, 2011 is payable as follows:
After 2012 2013 2014 2015 2016 2016 Total
(in millions) Principal Amount $ 1,433 $ 1,383 $ 1,074 $ 1,496 $ 712 $ 10,457 $ 16,555
Unamortized Discount, Net (39)
Total Long-term Debt Outstanding $ 16,516
In January 2012, TCC retired $98 million of its outstanding Securitization Bonds. In January and February 2012, I&M retired $2 million and $12 million, respectively, of Notes Payable related to DCC Fuel. In February 2012, SWEPCo issued $275 million of 3.55% Senior Unsecured Notes due in 2022 and $65 million of 4.58% Notes Payable due in 2032. In February 2012, APCo retired $30 million of 6.05% Pollution Control Bonds due in 2024 and $19.5 million of 5% Pollution Control Bonds due in 2021. As of December 31, 2011, these bonds were classified for maturity purposes as Long-term Debt Due Within One Year on our balance sheet. As of December 31, 2011, trustees held, on our behalf, $478 million of our reacquired Pollution Control Bonds. Dividend Restrictions
Parent Restrictions The holders of our common stock are entitled to receive the dividends declared by our Board of Directors provided funds are legally available for such dividends. Our income derives from our common stock equity in the earnings of our utility subsidiaries. Pursuant to the leverage restrictions in our credit agreements, we must maintain a percentage of debt to total capitalization at a level that does not exceed 67.5%. The payment of cash dividends indirectly results in an increase in the percentage of debt to total capitalization of the company distributing the dividend. The method for calculating outstanding debt and capitalization is contractually defined in the credit agreements. None of AEP’s retained earnings were restricted for the purpose of the payment of dividends. We have issued $315 million of Junior Subordinated Debentures. The debentures will mature on March 1, 2063, subject to extensions to no later than March 1, 2068, and are callable at par any time on or after March 1, 2013. We have the option to defer interest payments on the debentures for one or more periods of up to 10 consecutive years per period. During any period in which we defer interest payments, we may not declare or pay any dividends or distributions on, or redeem, repurchase or acquire our common stock. We do not anticipate any deferral of those interest payments in the foreseeable future. Utility Subsidiaries’ Restrictions Various financing arrangements and regulatory requirements may impose certain restrictions on the ability of our utility subsidiaries to transfer funds to us in the form of dividends. Specifically, several of our public utility subsidiaries have credit agreements that contain a covenant that limits their debt to capitalization ratio to 67.5%. At December 31, 2011, the amount of restricted net assets of AEP’s subsidiaries that may not be distributed to Parent in the form of a loan, advance or dividend was approximately $6 billion. The Federal Power Act prohibits the utility subsidiaries from participating “in the making or paying of any dividends of such public utility from any funds properly included in capital account.” The term “capital account” is not defined in the Federal Power Act or its regulations. Management understands “capital account” to mean the value of the common stock. This restriction does not limit the ability of the utility subsidiaries to pay dividends out of retained earnings.

134
Lines of Credit and Short-term Debt We use our commercial paper program to meet the short-term borrowing needs of our subsidiaries. The program is used to fund both a Utility Money Pool, which funds the utility subsidiaries, and a Nonutility Money Pool, which funds the majority of the nonutility subsidiaries. In addition, the program also funds, as direct borrowers, the short-term debt requirements of other subsidiaries that are not participants in either money pool for regulatory or operational reasons. As of December 31, 2011, we had credit facilities totaling $3.25 billion to support our commercial paper program. The maximum amount of commercial paper outstanding during 2011 was $1.2 billion and the weighted average interest rate of commercial paper outstanding during the year was 0.4%. Our outstanding short-term debt was as follows:
December 31, 2011 2010
Outstanding Interest Outstanding Interest Type of Debt Amount Rate (a) Amount Rate (a)
(in millions) (in millions) Securitized Debt for Receivables (b) $ 666 0.27 % $ 690 0.31 % Commercial Paper 967 0.51 % 650 0.52 % Line of Credit – Sabine (c) 17 1.79 % 6 2.15 %
Total Short-term Debt $ 1,650 $ 1,346
(a) Weighted average rate. (b) Amount of securitized debt for receivables as accounted for under the "Transfers and Servicing"
accounting guidance. (c) This line of credit does not reduce available liquidity under AEP's credit facilities.
Credit Facilities For a discussion of credit facilities, see “Letters of Credit” section of Note 5. Securitized Accounts Receivable – AEP Credit AEP Credit has a receivables securitization agreement with bank conduits. Under the securitization agreement, AEP Credit receives financing from the bank conduits for the interest in the receivables AEP Credit acquires from affiliated utility subsidiaries. AEP Credit continues to service the receivables. These securitized transactions allow AEP Credit to repay its outstanding debt obligations, continue to purchase our operating companies’ receivables and accelerate AEP Credit’s cash collections. In July 2011, AEP Credit renewed its receivables securitization agreement. The agreement provides commitments of $750 million from bank conduits to finance receivables from AEP Credit with an increase to $800 million for the months of July, August and September to accommodate seasonal demand. A commitment of $375 million, with the seasonal increase to $425 million for the months of July, August and September, expires in June 2012 and the remaining commitment of $375 million expires in June 2014.

135
Accounts receivable information for AEP Credit is as follows:
Years Ended December 31,
2011 2010 2009
(dollars in millions) Proceeds from Sale of Accounts Receivable $ NA $ NA $ 7,043 Loss on Sale of Accounts Receivable NA NA 3 Average Variable Discount Rate on Sale of Accounts Receivable NA NA 0.57 % Effective Interest Rates on Securitization of Accounts Receivable 0.27 % 0.31 % NA Net Uncollectible Accounts Receivable Written Off 37 22 28 NA Not Applicable
December 31, 2011 2010
(in millions)
Accounts Receivable Retained Interest and Pledged as Collateral Less Uncollectible Accounts $ 902 $ 923
Total Principal Outstanding 666 690
Delinquent Securitized Accounts Receivable 38 50
Bad Debt Reserves Related to Securitization/Sale of Accounts Receivable 18 26
Unbilled Receivables Related to Securitization/Sale of Accounts Receivable 370 354
Customer accounts receivable retained and securitized for our operating companies are managed by AEP Credit. AEP Credit’s delinquent customer accounts receivable represents accounts greater than 30 days past due. 14. STOCK-BASED COMPENSATION As approved by shareholder vote, the Amended and Restated American Electric Power System Long-Term Incentive Plan (LTIP) authorizes the use of 20,000,000 shares of AEP common stock for various types of stock-based compensation awards, including stock options, to employees. A maximum of 10,000,000 shares may be used under this plan for full value share awards, which includes performance units, restricted shares and restricted stock units. The AEP Board of Directors and shareholders last approved the LTIP in 2010. The following sections provide further information regarding each type of stock-based compensation award granted by the Human Resources Committee of the Board of Directors (HR Committee). Stock Options We did not grant stock options in 2011, 2010 or 2009 but we do have outstanding stock options from grants in earlier periods that vested or were exercised in these years. The exercise price of all outstanding stock options equaled or exceeded the market price of AEP’s common stock on the date of grant. All outstanding stock options were granted with a ten-year term and generally vested, subject to the participant’s continued employment, in approximately equal 1/3 increments on January 1st of the year following the first, second and third anniversary of the grant date. We record compensation cost for stock options over the vesting period based on the fair value on the grant date. The LTIP does not specify a maximum contractual term for stock options. The total fair value of stock options vested and the total intrinsic value of options exercised are as follows:
Years Ended December 31,
Stock Options 2011 2010 2009
(in thousands)
Fair Value of Stock Options Vested $ - $ - $ 25
Intrinsic Value of Options Exercised (a) 1,202 2,058 106 (a) Intrinsic value is calculated as market price at exercise dates less the option exercise price.

136
A summary of AEP stock option transactions during the years ended December 31, 2011, 2010 and 2009 is as follows: 2011 2010 2009
Weighted Weighted Weighted
Average Average Average
Exercise Exercise Exercise
Options Price Options Price Options Price
(in thousands) (in thousands) (in thousands)
Outstanding at January 1, 551 $ 32.88 1,089 $ 32.78 1,128 $ 32.73
Granted - NA - NA - NA
Exercised/Converted (104) 27.39 (448) 31.53 (21) 27.20
Forfeited/Expired (126) 46.40 (90) 38.44 (18) 36.28
Outstanding at December 31, 321 29.35 551 32.88 1,089 32.78
Options Exercisable at December 31, 321 $ 29.35 551 $ 32.88 1,089 $ 32.78
NA Not Applicable
The following table summarizes information about AEP stock options outstanding and exercisable at December 31, 2011: Number Weighted of Options Average Weighted 2011 Range of Outstanding Remaining Average Aggregate Exercise Prices and Exercisable Life Exercise Price Intrinsic Value
(in thousands) (in years) (in thousands) $27.06-27.95 162 1.27 $ 27.47 $ 2,240 $30.76-38.65 159 2.12 31.26 1,599
Total 321 1.69 29.35 $ 3,839
We include the proceeds received from exercised stock options in common stock and paid-in capital. Performance Units Our performance units have a value upon vesting equal to the market value of shares of AEP common stock. The number of performance units held is multiplied by the performance score to determine the actual number of performance units realized. The performance score is determined at the end of the performance period based on performance measures, which include both performance and market conditions, established for each grant at the beginning of the performance period by the HR Committee and can range from 0% to 200%. For the three-year performance and vesting period ending on December 31, 2009, performance units were paid in cash or stock at the employee’s election unless they were needed to satisfy a participant’s stock ownership requirement. For the three-year performance and vesting periods ending on December 31, 2010 and 2011, performance units were paid in cash, unless they were needed to satisfy a participant’s stock ownership requirement. In that case, the number of units needed to satisfy the participant’s largest stock ownership requirement was mandatorily deferred as AEP Career Shares until after the end of the participant’s AEP career. AEP Career Shares are a form of non-qualified deferred compensation that have a value equivalent to shares of AEP common stock. AEP Career Shares are paid in cash after the participant’s termination of employment. Amounts equivalent to cash dividends on both performance units and AEP Career Shares accrue as additional units. We recorded compensation cost for performance units over the three-year vesting period. The liability for both the performance units and AEP Career Shares, recorded in Employee Benefits and Pension Obligations on our balance sheets, is adjusted for changes in value. The fair value of performance unit awards is based on the estimated performance score and the current 20-day average closing price of AEP common stock at the date of valuation.

137
The HR Committee awarded performance units and reinvested dividends on outstanding performance units and AEP Career Shares for the years ended December 31, 2011, 2010 and 2009 as follows:
Years Ended December 31,
Performance Units 2011 2010 2009
Awarded Units (in thousands) 7 736 1,179
Weighted Average Unit Fair Value at Grant Date $ 38.39 $ 35.43 $ 34.32
Vesting Period (in years) 3 3 3
Performance Units and AEP Career Shares Years Ended December 31,
(Reinvested Dividends Portion) 2011 2010 2009
Awarded Units (in thousands) 198 211 224
Weighted Average Grant Date Fair Value $ 37.31 $ 34.70 $ 28.82
Vesting Period (in years) (a) (a) (a) (a) The vesting period for the reinvested dividends on performance units is equal to the remaining life of the
related performance units. Dividends on AEP Career Shares vest immediately upon grant. In January 2012, the HR Committee awarded 545,685 units of performance units at a grant price of $41.38 for the three-year performance and vesting period ending on December 31, 2014. Performance scores and final awards are determined and certified by the HR Committee in accordance with the pre-established performance measures within approximately a month after the end of the performance period. The HR Committee has discretion to reduce or eliminate the value of final awards, but may not increase them. The performance scores for all open performance periods are dependent on two equally-weighted performance measures: (a) three-year total shareholder return measured relative to the electric utility and multi utility sub-industry segments of the Standard and Poor’s 500 Index and (b) three-year cumulative earnings per share measured relative to an AEP Board of Directors approved target. The value of each performance unit earned is equal to the average closing price of AEP common stock for the last 20 trading days of the performance period. The certified performance scores and units earned for the three-year period ended December 31, 2011, 2010 and 2009 were as follows: Years Ended December 31,
2011 2010 2009
Certified Performance Score 89.8 % 55.8 % 73.5 %
Performance Units Earned 1,216,926 489,013 593,175
Performance Units Mandatorily Deferred as AEP Career Shares 52,639 33,501 26,635
Performance Units Voluntarily Deferred into the Incentive
Compensation Deferral Program 42,502 6,583 27,855
Performance Units to be Paid in Cash 1,121,785 448,929 538,685
The cash payouts for the years ended December 31, 2011, 2010 and 2009 were as follows: Years Ended December 31,
2011 2010 2009
(in thousands)
Cash Payouts for Performance Units $ 15,985 $ 18,683 $ 30,034
Cash Payouts for AEP Career Share Distributions 2,777 3,594 2,184

138
Restricted Shares and Restricted Stock Units The independent members of the AEP Board of Directors granted 300,000 restricted shares to the then Chairman, President and CEO on January 2, 2004 upon the commencement of his AEP employment. Of these restricted shares, 50,000 vested on January 1, 2005, 50,000 vested on January 1, 2006, 66,666 vested on November 30, 2009, 66,667 vested on November 30, 2010 and 66,667 vested on November 30, 2011. Compensation cost for restricted shares is measured at fair value on the grant date and recorded over the vesting period. Fair value is determined by multiplying the number of shares granted by the grant date market closing price, which was $30.76. The maximum term for these restricted shares was eight years and dividends on these restricted shares were paid in cash. AEP has not granted other restricted shares. The HR Committee also grants restricted stock units (RSUs), which generally vest, subject to the participant’s continued employment, over at least three years in approximately equal annual increments. Additional RSUs granted as dividends vest on the same date as the underlying RSUs on which the dividends were awarded. Compensation cost is measured at fair value on the grant date and recorded over the vesting period. Fair value is determined by multiplying the number of units granted by the grant date market closing price. The maximum contractual term of outstanding RSUs is six years from the grant date. In 2010, the HR Committee granted a total of 165,520 of RSUs to four CEO succession candidates to better ensure the retention of these candidates. These grants vest, subject to the candidates’ continuous employment, in three approximately equal installments on August 3, 2013, August 3, 2014 and August 3, 2015. The HR Committee awarded RSUs, including units awarded for dividends, for the years ended December 31, 2011, 2010 and 2009 as follows:
Years Ended December 31,
Restricted Stock Units 2011 2010 2009
Awarded Units (in thousands) 121 873 130
Weighted Average Grant Date Fair Value $ 37.07 $ 35.24 $ 29.29 In January 2012, the HR Committee awarded 363,790 units of restricted stock units at a grant price of $41.38, which vest in three approximately equal annual increments on May 1, 2013, 2014 and 2015. The total fair value and total intrinsic value of restricted shares and restricted stock units vested during the years ended December 31, 2011, 2010 and 2009 were as follows:
Years Ended December 31,
Restricted Shares and Restricted Stock Units 2011 2010 2009
(in thousands)
Fair Value of Restricted Shares and Restricted Stock Units Vested $ 7,164 $ 6,044 $ 6,573
Intrinsic Value of Restricted Shares and Restricted Stock Units Vested (a) 8,017 5,993 5,445
(a) Intrinsic value is calculated as market price at exercise date.

139
A summary of the status of our nonvested restricted shares and RSUs as of December 31, 2011 and changes during the year ended December 31, 2011 are as follows: Weighted Average Nonvested Restricted Shares and Grant Date Restricted Stock Units Shares/Units Fair Value
(in thousands)
Nonvested at January 1, 2011 1,026 $ 34.88
Granted 121 37.07
Vested (213) 33.61
Forfeited (31) 35.35
Nonvested at December 31, 2011 903 35.46
The total aggregate intrinsic value of nonvested restricted shares and RSUs as of December 31, 2011 was $37 million and the weighted average remaining contractual life was 2.32 years. Other Stock-Based Plans We also have a Stock Unit Accumulation Plan for Non-employee Directors providing each non-employee director with AEP stock units as a substantial portion of their quarterly compensation for their services as a director. The number of stock units provided is based on the closing price of AEP common stock on the last trading day of the quarter for which the stock units were earned. Amounts equivalent to cash dividends on the stock units accrue as additional AEP stock units. The non-employee directors vest immediately upon award of the stock units. Stock units are paid in cash upon termination of board service or up to 10 years later if the participant so elects. Cash payments for stock units are calculated based on the average closing price of AEP common stock for the last 20 trading days prior to the distribution date. We recorded the compensation cost for stock units when the units are awarded and adjusted the liability for changes in value based on the current 20-day average closing price of AEP common stock at the date of valuation. We had no material cash payouts for stock unit distributions for the years ended December 31, 2011, 2010 and 2009. The Board of Directors awarded stock units, including units awarded for dividends, for the years ended December 31, 2011, 2010 and 2009 as follows:
Years Ended December 31,
Stock Unit Accumulation Plan for Non-Employee Directors 2011 2010 2009
Awarded Units (in thousands) 52 54 56
Weighted Average Grant Date Fair Value $ 37.72 $ 34.67 $ 29.56

140
Share-based Compensation Plans
Compensation cost and the actual tax benefit realized for the tax deductions from compensation cost for share-based payment arrangements recognized in income and total compensation cost capitalized in relation to the cost of an asset for the years ended December 31, 2011, 2010 and 2009 were as follows:
Years Ended December 31,
Share-based Compensation Plans 2011 2010 2009
(in thousands)
Compensation Cost for Share-based Payment Arrangements (a) $ 61,807 $ 28,116 $ 31,165
Actual Tax Benefit Realized 21,632 9,841 10,908
Total Compensation Cost Capitalized 11,608 4,689 5,956
(a) Compensation cost for share-based payment arrangements is included in Other Operation and Maintenance expenses
on our statements of income.
During the years ended December 31, 2011, 2010 and 2009, there were no significant modifications affecting any of our share-based payment arrangements. As of December 31, 2011, there was $47 million of total unrecognized compensation cost related to unvested share-based compensation arrangements granted under the LTIP. Unrecognized compensation cost related to the performance units and AEP Career Shares will change as the fair value is adjusted each period and forfeitures for all award types are realized. Our unrecognized compensation cost will be recognized over a weighted-average period of 1.49 years. Cash received from stock options exercised and actual tax benefit realized for the tax deductions from stock options exercised during the years ended December 31, 2011, 2010 and 2009 were as follows:
Years Ended December 31,
Share-based Compensation Plans 2011 2010 2009
(in thousands)
Cash Received from Stock Options Exercised $ 2,855 $ 14,134 $ 567
Actual Tax Benefit Realized for the Tax Deductions from Stock Options
Exercised 411 706 35 Our practice is to use authorized but unissued shares to fulfill share commitments for stock option exercises and RSU vesting. Although we do not currently anticipate any changes to this practice, we are permitted to use treasury shares, shares acquired in the open market specifically for distribution under the LTIP or any combination thereof for this purpose. The number of new shares issued to fulfill vesting RSUs is generally reduced to offset our tax withholding obligation.

141
15. PROPERTY, PLANT AND EQUIPMENT Depreciation, Depletion and Amortization We provide for depreciation of Property, Plant and Equipment, excluding coal-mining properties, on a straight-line basis over the estimated useful lives of property, generally using composite rates by functional class as follows:
2011 Regulated Nonregulated
Annual Annual
Functional Property, Composite Property, Composite
Class of Plant and Accumulated Depreciation Depreciable Plant and Accumulated Depreciation Depreciable
Property Equipment Depreciation Rate Ranges Life Ranges Equipment Depreciation Rate Ranges Life Ranges
(in millions) (in years) (in millions) (in years)
Generation $ 14,804 $ 6,692 1.6 - 3.8 % 9 - 132 $ 10,134 $ 3,904 2.6 - 3.5 % 20 - 66
Transmission 9,048 2,600 1.3 - 2.7 % 25 - 87 - - - - - % - - -
Distribution 14,783 3,828 2.4 - 4.0 % 11 - 75 - - - - - % - - -
CWIP 2,913 (a) 36 NM NM 208 1 NM NM
Other 2,587 1,246 1.7 - 9.3 % 5 - 55 1,193 392 NM NM
Total $ 44,135 $ 14,402 $ 11,535 $ 4,297
2010 Regulated Nonregulated
Annual Annual
Functional Property, Composite Property, Composite
Class of Plant and Accumulated Depreciation Depreciable Plant and Accumulated Depreciation Depreciable
Property Equipment Depreciation Rate Ranges Life Ranges Equipment Depreciation Rate Ranges Life Ranges
(in millions) (in years) (in millions) (in years)
Generation $ 14,147 $ 6,537 1.6 - 3.8 % 9 - 132 $ 10,205 $ 3,788 2.2 - 5.1 % 20 - 70
Transmission 8,576 2,481 1.4 - 3.0 % 25 - 87 - - - - - % - - -
Distribution 14,208 3,607 2.4 - 3.9 % 11 - 75 - - - - - % - - -
CWIP 2,615 (a) 47 NM NM 143 9 NM NM
Other 2,685 1,268 3.0 - 12.5 % 5 - 55 1,161 329 NM NM
Total $ 42,231 $ 13,940 $ 11,509 $ 4,126
2009 Regulated Nonregulated
Annual Annual
Composite Composite
Depreciation Depreciable Depreciation Depreciable
Functional Class of Property Rate Ranges Life Ranges Rate Ranges Life Ranges
(in years) (in years) Generation 1.6 - 3.8 % 9 - 132 1.9 - 3.3 % 20 - 70
Transmission 1.4 - 2.7 % 25 - 87 - - - % - - -
Distribution 2.4 - 3.9 % 11 - 75 - - - % - - -
CWIP NM NM NM NM
Other 4.2 - 12.8 % 5 - 55 NM NM
(a) Includes CWIP related to SWEPCo's Arkansas jurisdictional share of the Turk Plant.
NM Not Meaningful
We provide for depreciation, depletion and amortization of coal-mining assets over each asset's estimated useful life or the estimated life of each mine, whichever is shorter, using the straight-line method for mining structures and equipment. We use either the straight-line method or the units-of-production method to amortize mine development costs and deplete coal rights based on estimated recoverable tonnages. We include these costs in the cost of coal charged to fuel expense.

142
For rate-regulated operations, the composite depreciation rate generally includes a component for non-asset retirement obligation (non-ARO) removal costs, which is credited to Accumulated Depreciation and Amortization. Actual removal costs incurred are charged to Accumulated Depreciation and Amortization. Any excess of accrued non-ARO removal costs over actual removal costs incurred is reclassified from Accumulated Depreciation and Amortization and reflected as a regulatory liability. For nonregulated operations, non-ARO removal costs are expensed as incurred. Asset Retirement Obligations (ARO) We record ARO in accordance with the accounting guidance for “Asset Retirement and Environmental Obligations” for our legal obligations for asbestos removal and for the retirement of certain ash disposal facilities, closure and monitoring of underground carbon storage facilities at Mountaineer Plant, wind farms and certain coal mining facilities, as well as for nuclear decommissioning of our Cook Plant. We have identified, but not recognized, ARO liabilities related to electric transmission and distribution assets as a result of certain easements on property on which we have assets. Generally, such easements are perpetual and require only the retirement and removal of our assets upon the cessation of the property’s use. We do not estimate the retirement for such easements because we plan to use our facilities indefinitely. The retirement obligation would only be recognized if and when we abandon or cease the use of specific easements, which is not expected. The following is a reconciliation of the 2011 and 2010 aggregate carrying amounts of ARO: Carrying Amount
of ARO
(in millions)
ARO at December 31, 2009 $ 1,259
DHLC Deconsolidation (a) (12)
Accretion Expense 75
Liabilities Incurred 32
Liabilities Settled (20)
Revisions in Cash Flow Estimates 64
ARO at December 31, 2010 (b) 1,398
Accretion Expense 82
Liabilities Incurred 7
Liabilities Settled (26)
Revisions in Cash Flow Estimates 13
ARO at December 31, 2011 (c) $ 1,474
(a) We deconsolidated DHLC effective January 1, 2010 in accordance with the accounting guidance for
"Consolidations." As a result, we record only 50% of the final reclamation based on our share of the obligation instead of the previous 100%.
(b) The current portion of our ARO, totaling $4 million, is included in Other Current Liabilities on our 2010 balance sheet.
(c) The current portion of our ARO, totaling $2 million, is included in Other Current Liabilities on our 2011 balance sheet.
As of December 31, 2011 and 2010, our ARO liability was $1.5 billion and $1.4 billion, respectively, and included $979 million and $930 million, respectively, for nuclear decommissioning of the Cook Plant. As of December 31, 2011 and 2010, the fair value of assets that are legally restricted for purposes of settling the nuclear decommissioning liabilities totaled $1.3 billion and $1.2 billion, respectively, and are recorded in Spent Nuclear Fuel and Decommissioning Trusts on our balance sheets.

143
Allowance for Funds Used During Construction (AFUDC) and Interest Capitalization Our amounts of allowance for borrowed, including interest capitalized, and equity funds used during construction is summarized in the following table: Years Ended December 31, 2011 2010 2009
(in millions) Allowance for Equity Funds Used During Construction $ 98 $ 77 $ 82 Allowance for Borrowed Funds Used During Construction 63 53 67

144
Jointly-owned Electric Facilities We have electric facilities that are jointly-owned with nonaffiliated companies. Using our own financing, we are obligated to pay a share of the costs of these jointly-owned facilities in the same proportion as our ownership interest. Our proportionate share of the operating costs associated with such facilities is included in our statements of income and the investments and accumulated depreciation are reflected in our balance sheets under Property, Plant and Equipment as follows:
Company’s Share at December 31, 2011
Construction
Fuel Percent of Utility Plant Work in Accumulated
Type Ownership in Service Progress Depreciation
(in millions) W.C. Beckjord Generating Station (Unit No. 6) (a) Coal 12.5 % $ 19 $ - $ 8
Conesville Generating Station (Unit No. 4) (b) Coal 43.5 % 310 12 54
J.M. Stuart Generating Station (c) Coal 26.0 % 529 13 172
Wm. H. Zimmer Generating Station (a) Coal 25.4 % 771 20 377
Dolet Hills Generating Station (Unit No. 1) (f) Lignite 40.2 % 264 - 193
Flint Creek Generating Station (Unit No. 1) (g) Coal 50.0 % 118 6 63
Pirkey Generating Station (Unit No. 1) (g) Lignite 85.9 % 513 1 362
Oklaunion Generating Station (Unit No. 1) (e) Coal 70.3 % 401 2 208
Turk Generating Plant (h) Coal 73.33 % - 1,326 -
Transmission NA (d) 63 6 50
Company’s Share at December 31, 2010
Construction
Fuel Percent of Utility Plant Work in Accumulated
Type Ownership in Service Progress Depreciation
(in millions) W.C. Beckjord Generating Station (Unit No. 6) (a) Coal 12.5 % $ 19 $ - $ 8
Conesville Generating Station (Unit No. 4) (b) Coal 43.5 % 301 8 49
J.M. Stuart Generating Station (c) Coal 26.0 % 507 23 163
Wm. H. Zimmer Generating Station (a) Coal 25.4 % 771 10 366
Dolet Hills Generating Station (Unit No. 1) (f) Lignite 40.2 % 258 5 192
Flint Creek Generating Station (Unit No. 1) (g) Coal 50.0 % 116 7 62
Pirkey Generating Station (Unit No. 1) (g) Lignite 85.9 % 503 10 358
Oklaunion Generating Station (Unit No. 1) (e) Coal 70.3 % 395 4 201
Turk Generating Plant (h) Coal 73.33 % - 971 -
Transmission NA (d) 63 3 48
(a) Operated by Duke Energy Corporation, a nonaffiliated company. (b) Operated by OPCo. (c) Operated by The Dayton Power & Light Company, a nonaffiliated company. (d) Varying percentages of ownership. (e) Operated by PSO and also jointly-owned (54.7%) by TNC. (f) Operated by CLECO, a nonaffiliated company. (g) Operated by SWEPCo. (h) Turk Generating Plant is currently under construction with a projected commercial operation date in the fourth quarter of
2012. SWEPCo jointly owns the plant with Arkansas Electric Cooperative Corporation (11.67%), East Texas Electric Cooperative (8.33%) and Oklahoma Municipal Power Authority (6.67%). Through December 2011, construction costs totaling $374 million have been billed to the other owners.
NA Not Applicable

145
16. COST REDUCTION INITIATIVES In April 2010, we began initiatives to decrease both labor and non-labor expenses with a goal of achieving significant reductions in operation and maintenance expenses. A total of 2,461 positions was eliminated across the AEP System as a result of process improvements, streamlined organizational designs and other efficiencies. Most of the affected employees terminated employment May 31, 2010. The severance program provided two weeks of base pay for every year of service along with other severance benefits. We recorded a charge of $293 million to Other Operation expense during 2010 primarily related to severance benefits as the result of headcount reduction initiatives. The following table shows the cost reduction activity for the year ended December 31, 2011: Total
(in millions)
Balance as of December 31, 2010 $ 17
Incurred -
Settled (15)
Adjustments (2)
Balance as of December 31, 2011 $ -
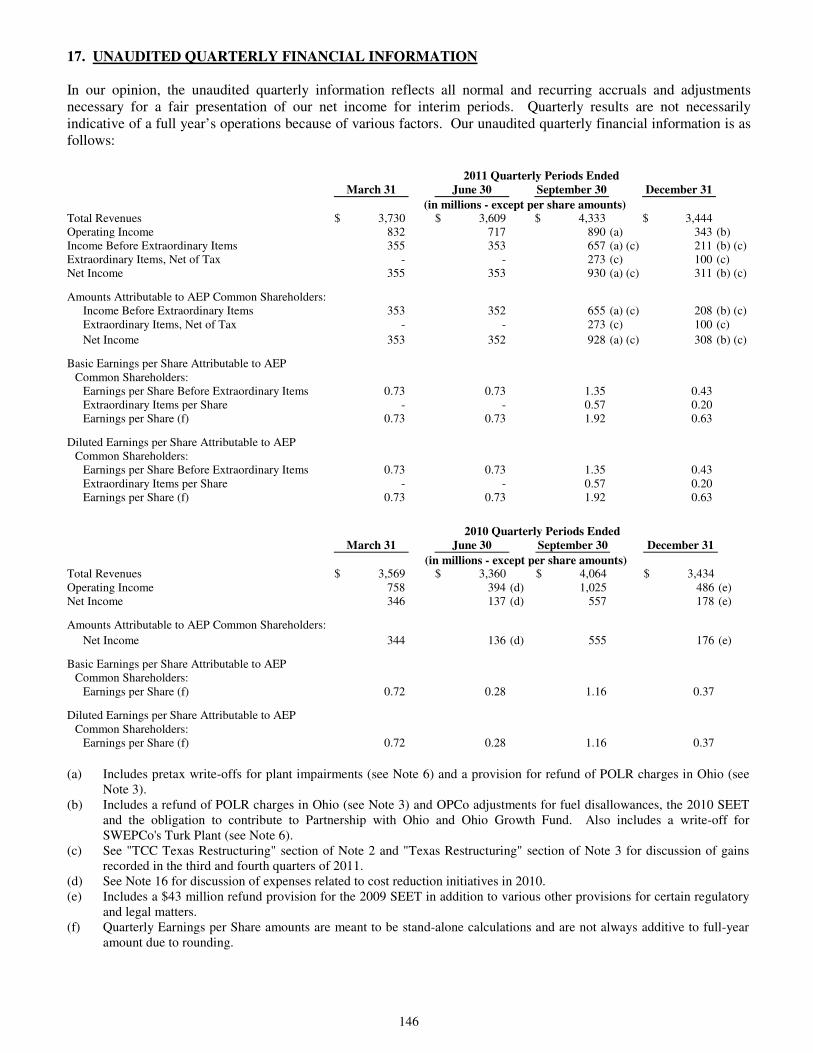
146
17. UNAUDITED QUARTERLY FINANCIAL INFORMATION In our opinion, the unaudited quarterly information reflects all normal and recurring accruals and adjustments necessary for a fair presentation of our net income for interim periods. Quarterly results are not necessarily indicative of a full year’s operations because of various factors. Our unaudited quarterly financial information is as follows: 2011 Quarterly Periods Ended March 31 June 30 September 30 December 31
(in millions - except per share amounts) Total Revenues $ 3,730 $ 3,609 $ 4,333 $ 3,444 Operating Income 832 717 890 (a) 343 (b) Income Before Extraordinary Items 355 353 657 (a) (c) 211 (b) (c) Extraordinary Items, Net of Tax - - 273 (c) 100 (c) Net Income 355 353 930 (a) (c) 311 (b) (c)
Amounts Attributable to AEP Common Shareholders: Income Before Extraordinary Items 353 352 655 (a) (c) 208 (b) (c) Extraordinary Items, Net of Tax - - 273 (c) 100 (c)
Net Income 353 352 928 (a) (c) 308 (b) (c)
Basic Earnings per Share Attributable to AEP Common Shareholders: Earnings per Share Before Extraordinary Items 0.73 0.73 1.35 0.43 Extraordinary Items per Share - - 0.57 0.20 Earnings per Share (f) 0.73 0.73 1.92 0.63
Diluted Earnings per Share Attributable to AEP Common Shareholders: Earnings per Share Before Extraordinary Items 0.73 0.73 1.35 0.43 Extraordinary Items per Share - - 0.57 0.20 Earnings per Share (f) 0.73 0.73 1.92 0.63
2010 Quarterly Periods Ended March 31 June 30 September 30 December 31
(in millions - except per share amounts) Total Revenues $ 3,569 $ 3,360 $ 4,064 $ 3,434 Operating Income 758 394 (d) 1,025 486 (e) Net Income 346 137 (d) 557 178 (e)
Amounts Attributable to AEP Common Shareholders:
Net Income 344 136 (d) 555 176 (e)
Basic Earnings per Share Attributable to AEP Common Shareholders: Earnings per Share (f) 0.72 0.28 1.16 0.37
Diluted Earnings per Share Attributable to AEP Common Shareholders: Earnings per Share (f) 0.72 0.28 1.16 0.37
(a) Includes pretax write-offs for plant impairments (see Note 6) and a provision for refund of POLR charges in Ohio (see
Note 3). (b) Includes a refund of POLR charges in Ohio (see Note 3) and OPCo adjustments for fuel disallowances, the 2010 SEET
and the obligation to contribute to Partnership with Ohio and Ohio Growth Fund. Also includes a write-off for SWEPCo's Turk Plant (see Note 6).
(c) See "TCC Texas Restructuring" section of Note 2 and "Texas Restructuring" section of Note 3 for discussion of gains recorded in the third and fourth quarters of 2011.
(d) See Note 16 for discussion of expenses related to cost reduction initiatives in 2010. (e) Includes a $43 million refund provision for the 2009 SEET in addition to various other provisions for certain regulatory
and legal matters. (f) Quarterly Earnings per Share amounts are meant to be stand-alone calculations and are not always additive to full-year
amount due to rounding.

147
18. GOODWILL AND OTHER INTANGIBLE ASSETS Goodwill
The changes in our carrying amount of goodwill for the years ended December 31, 2011 and 2010 by operating segment are as follows: Utility AEP River AEP Operations Operations Consolidated
(in millions) Balance at December 31, 2009 $ 37 $ 39 $ 76 Impairment Losses - - -
Balance at December 31, 2010 37 39 76 Impairment Losses - - -
Balance at December 31, 2011 $ 37 $ 39 $ 76
In the fourth quarters of 2011 and 2010, we performed our annual impairment tests. The fair values of the operations with goodwill were estimated using cash flow projections and other market value indicators. There were no goodwill impairment losses. We do not have any accumulated impairment on existing goodwill. Other Intangible Assets
Acquired intangible assets subject to amortization were $1.2 million at December 31, 2010, net of accumulated amortization and are included in Deferred Charges and Other Noncurrent Assets on our balance sheets. As of December 31, 2011, all acquired intangible assets were fully amortized. The amortization life, gross carrying amount and accumulated amortization by major asset class are as follows: December 31,
2011 2010
Gross Gross
Amortization Carrying Accumulated Carrying Accumulated
Life Amount Amortization Amount Amortization
(in years) (in millions)
Easements 10 $ 2.2 $ 2.2 $ 2.2 $ 2.2
Purchased Technology 10 10.9 10.9 10.9 9.7
Total $ 13.1 $ 13.1 $ 13.1 $ 11.9
Amortization of intangible assets was $1 million, $1 million and $3 million for 2011, 2010 and 2009, respectively. Other than goodwill, we have no intangible assets that are not subject to amortization.

148
CORPORATE AND SHAREHOLDER INFORMATION Corporate Headquarters 1 Riverside Plaza Columbus, OH 43215-2373 614-716-1000 AEP is incorporated in the State of New York. Stock Exchange Listing – The Company’s common stock is traded principally on the New York Stock Exchange under the ticker symbol AEP. Internet Home Page – Information about AEP, including financial documents, Securities and Exchange Commission (SEC) filings, news releases, investor presentations, shareholder information and customer service information, is available on the Company’s home page on the Internet at www.AEP.com/investors. Inquiries Regarding Your Stock Holdings – Registered shareholders (shares that you own, in your name) should contact the Company’s transfer agent, listed below, if you have questions about your account, address changes, stock transfer, lost certificates, direct deposits, dividend checks and other administrative matters. You should have your Social Security number or account number ready; the transfer agent will not speak to third parties about an account without the shareholder’s approval or appropriate documents. Transfer Agent & Registrar Computershare Trust Company, N.A. P.O. Box 43078 Providence, RI 02940-3078 For overnight deliveries: Computershare Trust Company, N.A. 250 Royall Street Canton, MA 02021-1011 Telephone Response Group:1-800-328-6955 Internet address: www.computershare.com/investor Hearing Impaired #: TDD: 1-800-952-9245 Beneficial Holders – (Stock held in a bank or brokerage account) – When you purchase stock and it is held for you by your broker, it is listed with the Company in the broker’s name, and this is sometimes referred to as “street name” or a “beneficial owner.” AEP does not know the identity of individual shareholders who hold their shares in this manner; we simply know that a broker holds a certain number of shares which may be for any number of customers. If you hold your stock in street name, you receive all dividend payments, annual reports and proxy materials through your broker. Therefore, questions about your account should be directed to your broker. Dividend Reinvestment and Direct Stock Purchase Plan – A Dividend Reinvestment and Direct Stock Purchase Plan is available to all investors. It is an economical and convenient method of purchasing shares of AEP common stock, through initial cash investments, cash dividends and/or additional optional cash purchases. You may obtain the Plan prospectus and enrollment authorization form by contacting the transfer agent or by visiting www.AEP.com/investors/buyandmanagestock. Financial Community Inquiries – Institutional investors or securities analysts who have questions about the Company should direct inquiries to Bette Jo Rozsa, 614-716-2840, [email protected]; Julie Sherwood, 614-716-2663, [email protected]; or Sara Macioch, 614-716-2835, [email protected]. Individual shareholders should contact Kathleen Kozero, 614-716-2819, [email protected]. Number of Shareholders – As of December 31, 2011, there were approximately 87,000 registered shareholders and approximately 407,000 shareholders holding stock in street name through a bank or broker. There were 483,422,868 shares outstanding at December 31, 2011. Form 10-K – Upon request, we will provide without charge a copy of our Form 10-K for the fiscal year ended December 31, 2011. A copy can be obtained via mail with a written request to AEP Investor Relations, by telephone at 1-800-237-2667 or electronically at [email protected].

149
Executive Leadership Team
Name Age Office
Nicholas K. Akins 51 President and Chief Executive Officer Lisa M. Barton 46 Executive Vice President – Transmission David M. Feinberg 42 Senior Vice President, General Counsel and Secretary Mark C. McCullough 52 Executive Vice President – Generation Robert P. Powers 57 Executive Vice President and Chief Operating Officer Brian X. Tierney 44 Executive Vice President and Chief Financial Officer Dennis E. Welch 60 Executive Vice President and Chief Administrative Officer

- THIS PAGE INTENTIONALLY LEFT BLANK -

- THIS PAGE INTENTIONALLY LEFT BLANK -

- THIS PAGE INTENTIONALLY LEFT BLANK -