american electric power american electric power system
TRANSCRIPT
This report is confidential and intended solely for the information and benefit of the immediate recipient thereof. It may not be distributed to a third party unless expressly allowed under the "Actuarial Certification" section herein.
American Electric Power
American Electric Power System Retirement Plan
Actuarial Valuation Report Pension Cost for Fiscal Year Ending December 31, 2013 under U.S. GAAP
Employer Contributions for Plan Year Beginning January 1, 2013
April 2013
CAD E-32 Attachment 1 Page 1 of 77

CAD E-32 Attachment 1 Page 2 of 77
American Electric Power System Retirement Plan i
Towers Watson Confidential
Table of Contents
Purposes of valuation ............................................................................................................................ 1
Section 1 : Summary of results ............................................................................................................. 3
Summary of valuation results ............................................................................................................. 3
Minimum required contribution and funding policy ............................................................................. 4
Change in minimum funding requirement and funding shortfall......................................................... 5
Funding ratios ..................................................................................................................................... 6
Benefit limitations ............................................................................................................................... 7
PBGC reporting requirements ............................................................................................................ 8
At-Risk status for determining minimum required contributions......................................................... 8
Pension cost and funded position ...................................................................................................... 8
Change in pension cost and funded position ..................................................................................... 9
Basis for valuation ............................................................................................................................ 10
Actuarial certification ........................................................................................................................... 11
Section 2 : Actuarial exhibits .............................................................................................................. 15
2.1 Summary of liabilities for minimum funding purposes ........................................................... 15
2.2 Change in plan assets during plan year ................................................................................ 16
2.3 Development of actuarial value of assets .............................................................................. 17
2.4 Calculation of minimum required contribution ........................................................................ 18
2.5 Calculation of estimated maximum deductible contribution ................................................... 19
2.6 ASC 960 (plan accounting) information ................................................................................. 20
2.7 Pension obligations and funded position under U.S. GAAP (ASC 715) ................................ 21
2.8 Pension cost under U.S. GAAP (ASC 715) ........................................................................... 22
2.9 Development of market-related value of assets under U.S. GAAP (ASC 715) ..................... 23
Section 3 : Participant data ................................................................................................................. 25
3.1 Summary of plan participants ................................................................................................ 25
3.2 Participant reconciliation ........................................................................................................ 27
3.3 Age and service distribution of participating employees ........................................................ 28
Appendix A : Statement of actuarial assumptions and methods .................................................... 31
Appendix B1 : Summary of plan provisions covered by the former East Retirement Plan ......... 39
Appendix B2 : Summary of plan provisions covered by the former West Retirement Plan ........ 46
Appendix C : Adjusted Funding Target Attainment Percentage (AFTAP) ...................................... 52
Appendix D : Results by business unit .............................................................................................. 57
CAD E-32 Attachment 1 Page 3 of 77

ii American Electric Power System Retirement Plan
Towers Watson Confidential
This page is intentionally blank
CAD E-32 Attachment 1 Page 4 of 77
American Electric Power System Retirement Plan 1
Towers Watson Confidential
Purposes of valuation American Electric Power (“AEP”) retained Towers Watson Pennsylvania Inc. (“Towers Watson”), to perform an actuarial valuation of the American Electric Power System Retirement Plan for the purpose of determining the following:
1. The minimum required contribution in accordance with ERISA and the Internal Revenue Code (IRC) for the plan year beginning January 1, 2013.
2. The estimated maximum tax-deductible contribution for the tax year in which the 2013 plan year ends in accordance with ERISA as allowed by the IRC. The maximum tax-deductible contribution should be finalized in consultation with the Company’s tax advisor.
3. Plan accounting information in accordance with FASB Accounting Standards Codification Topic 960 (ASC 960).
4. Determination of the Funding Target Attainment Percentage (FTAP) under IRC §430(d)(2), as reported in the Annual Funding Notice required under ERISA 101(f).
5. The value of benefit obligations as of January 1, 2013 and AEP‘s pension cost for fiscal year ending December 31, 2013 in accordance with FASB Accounting Standards Codification Topic 715 (ASC 715).
Limitations
This valuation has been conducted for the purposes described above and may not be suitable for any other purpose. In particular, please note the following:
1. This report is not intended to constitute a certification of the Adjusted Funding Target Attainment Percentage (AFTAP) under IRC §430 for any plan year.
2. This report does not determine the plan’s liquidity shortfall requirements (if any) under IRC §430(j)(4). If applicable, we will determine such requirements separately as requested by the Company.
3. This report does not determine liabilities on a plan termination basis, for which a separate extensive analysis would be required.
4. The cost method for the minimum required contribution is established under IRC §430 and may not in all circumstances produce adequate assets to pay benefits under all optional forms of payment available under the plan when benefit payments are due.
5. This valuation reflects our understanding of the relevant provisions of the Pension Protection Act of 2006 (PPA); the Worker, Retiree and Employer Recovery Act of 2008 (WRERA); the Preservation of Access to Care for Medicare Beneficiaries and Pension Relief Act of 2010 (PRA), and the Moving Ahead for Progress in the 21st Century Act (MAP-21). The IRS has yet to issue final guidance with respect to certain aspects of these laws. It is possible that future guidance may conflict with our understanding of these laws based on currently available guidance and could therefore affect results shown in this report.
6. Based on an election by AEP, the 2012 valuation reflected the provisions of MAP-21 for both minimum funding requirements and benefit restriction purposes. MAP-21 imposes corridors around the segment rates used for funding purposes for 2013 plan years, with optional applicability for 2012 plan years. Under MAP-21, the corridors do not apply for purposes of determining (i) unfunded vested benefits for PBGC premium purposes, (ii) whether an ERISA §4010 filing is required with PBGC, or (iii) the maximum tax-deductible contribution.
CAD E-32 Attachment 1 Page 5 of 77

2 American Electric Power Co.
Towers Watson Confidential
This page is intentionally blank
CAD E-32 Attachment 1 Page 6 of 77
American Electric Power System Retirement Plan 3
Towers Watson Confidential
Section 1: Summary of results
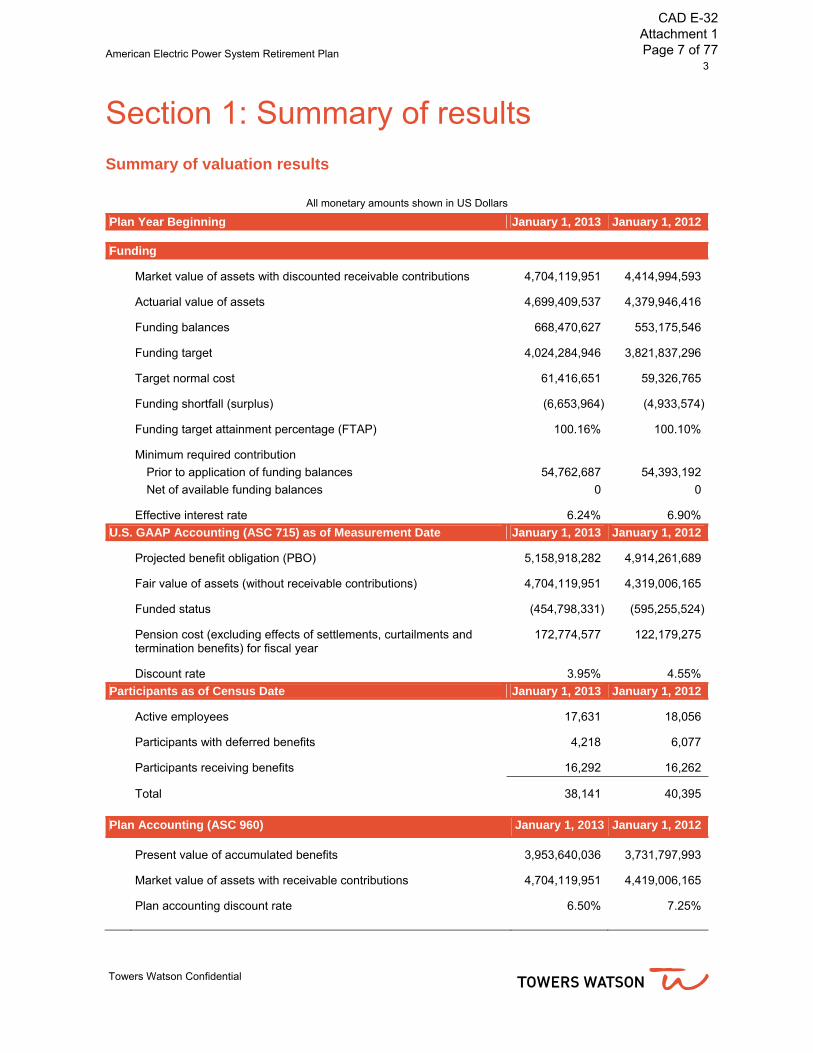
Summary of valuation results
All monetary amounts shown in US Dollars
Plan Year Beginning January 1, 2013 January 1, 2012
Funding
Market value of assets with discounted receivable contributions 4,704,119,951 4,414,994,593
Actuarial value of assets 4,699,409,537 4,379,946,416
Funding balances 668,470,627 553,175,546
Funding target 4,024,284,946 3,821,837,296
Target normal cost 61,416,651 59,326,765
Funding shortfall (surplus) (6,653,964) (4,933,574)
Funding target attainment percentage (FTAP) 100.16% 100.10%
Minimum required contribution
Prior to application of funding balances 54,762,687 54,393,192
Net of available funding balances 0 0
Effective interest rate 6.24% 6.90%
U.S. GAAP Accounting (ASC 715) as of Measurement Date January 1, 2013 January 1, 2012
Projected benefit obligation (PBO) 5,158,918,282 4,914,261,689
Fair value of assets (without receivable contributions) 4,704,119,951 4,319,006,165
Funded status (454,798,331) (595,255,524)
Pension cost (excluding effects of settlements, curtailments and termination benefits) for fiscal year
172,774,577 122,179,275
Discount rate 3.95% 4.55%
Participants as of Census Date January 1, 2013 January 1, 2012
Active employees 17,631 18,056
Participants with deferred benefits 4,218 6,077
Participants receiving benefits 16,292 16,262
Total 38,141 40,395
Plan Accounting (ASC 960) January 1, 2013 January 1, 2012
Present value of accumulated benefits 3,953,640,036 3,731,797,993
Market value of assets with receivable contributions 4,704,119,951 4,419,006,165
Plan accounting discount rate 6.50% 7.25%
CAD E-32 Attachment 1 Page 7 of 77

4 American Electric Power System Retirement Plan
Towers Watson Confidential
Minimum required contribution and funding policy
All monetary amounts shown in US Dollars
Plan Year Beginning January 1, 2013 January 1, 2012
Minimum Required Contribution [MRC]
Prior to application of funding balances 54,762,687 54,393,192
Net of available funding balances 0 0
Sponsor’s Funding Policy Contribution 100,000,000 200,000,000
Our understanding of the current sponsor’s funding policy is to contribute the greater of $100 million and the minimum required contribution. We understand that the sponsor may deviate from this policy based on cash, tax or other considerations. Contributions of $200,000,000 were made during plan year 2012 under this policy, with $100,000,000 applied to plan year 2011 and the remainder applied to plan year 2012.
The minimum required contribution for the 2013 plan year must be partially satisfied in quarterly installments during the plan year, with a final payment due by September 15, 2014. These requirements may be satisfied through contributions and/or an election to apply the available funding balances. The minimum required contribution is determined assuming it is paid as of the valuation date for the plan year. Contributions made on a date other than the valuation date must be adjusted for interest at the plan's effective interest rate. The minimum funding schedule, before reflecting any funding balance elections or amounts already contributed for the 2013 plan year prior to the issuance of this report, is shown below:
All monetary amounts shown in US Dollars
Due Date Amount
April 15, 2013 0
July 15, 2013 0
October 15, 2013 0
January 15, 2014 0
September 15, 2014 60,718,425
Because the plan does not have a funding shortfall, quarterly contributions for the 2013 plan year will not be required.
CAD E-32 Attachment 1 Page 8 of 77

American Electric Power System Retirement Plan 5
Towers Watson Confidential
Change in minimum funding requirement and funding shortfall
The minimum funding requirement increased from $54,393,192 for the 2012 plan year to $54,762,687 for the 2013 plan year, and the funding shortfall (surplus) declined from $(4,933,574) on January 1, 2012 to $(6,653,964) on January 1, 2013, as set forth below:
All monetary amounts shown in US Dollars
Minimum Funding Requirement
Funding Shortfall(Surplus)
Prior year 54,393,192 (4,933,574)
Change due to:
Expected based on prior valuation, contributions, and use of/creation of funding balances 7,306,644 47,334,525
Sponsor election to reduce funding balances 0 0
Unexpected noninvestment experience 1,070,255 7,370,516
Unexpected investment experience (62,770,091) (269,087,424)
Assumption changes 54,762,687 212,661,993
Method changes 0 0
Unpredictable contingent events 0 0
Becoming at-risk 0 0
Reflection of MAP-21 0 0
Plan amendments 0 0
Current year 54,762,687 (6,653,964)
Significant reasons for these changes include the following:
● The return on the actuarial value of assets since the prior valuation was greater than expected, which reduced the minimum funding requirement and the funding shortfall.
● The plan’s effective interest rate decreased 66 basis points compared to the prior year, which increased the minimum funding requirement and the funding shortfall.
● The required mortality table used to value the funding target and target normal cost was updated to include one additional year of projected mortality improvements, which increased the minimum funding requirement and the funding shortfall.
● The long-term cash balance interest crediting rate was changed from 4.50% to 4.00%, which decreased the minimum funding requirement.
● Assumed plan-related expenses of $3,568,058 were less than those in the prior year which decreased the minimum funding requirement.
Te plan’s e,985 for plan year 2011) were added to the target normal cost, which decreased the minimum funding requirement. Beginning in 2012 and per updated guidance regarding expenses, investment expenses will no longer be added to the target normal cost.
CAD E-32 Attachment 1 Page 9 of 77
6 American Electric Power System Retirement Plan
Towers Watson Confidential
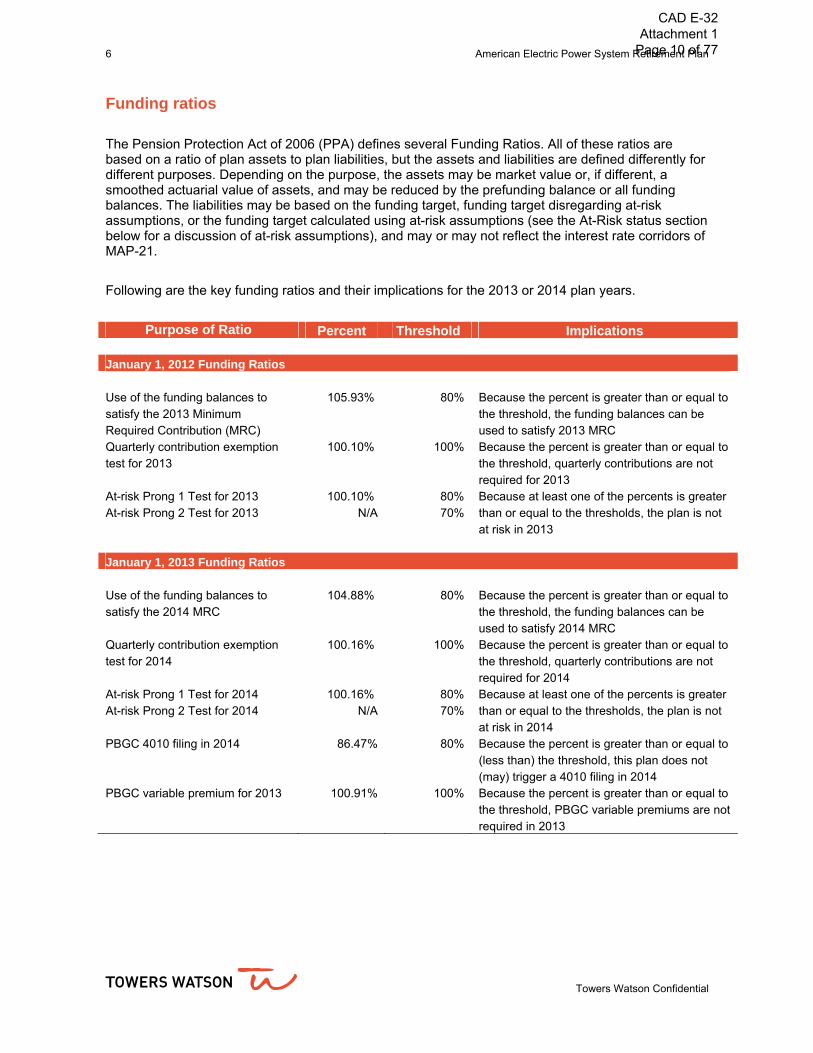
Funding ratios
The Pension Protection Act of 2006 (PPA) defines several Funding Ratios. All of these ratios are based on a ratio of plan assets to plan liabilities, but the assets and liabilities are defined differently for different purposes. Depending on the purpose, the assets may be market value or, if different, a smoothed actuarial value of assets, and may be reduced by the prefunding balance or all funding balances. The liabilities may be based on the funding target, funding target disregarding at-risk assumptions, or the funding target calculated using at-risk assumptions (see the At-Risk status section below for a discussion of at-risk assumptions), and may or may not reflect the interest rate corridors of MAP-21.
Following are the key funding ratios and their implications for the 2013 or 2014 plan years.
Purpose of Ratio Percent Threshold Implications January 1, 2012 Funding Ratios Use of the funding balances to satisfy the 2013 Minimum Required Contribution (MRC)
105.93% 80% Because the percent is greater than or equal to the threshold, the funding balances can be used to satisfy 2013 MRC
Quarterly contribution exemption test for 2013
100.10% 100% Because the percent is greater than or equal to the threshold, quarterly contributions are not required for 2013
At-risk Prong 1 Test for 2013 100.10% 80% Because at least one of the percents is greater than or equal to the thresholds, the plan is not at risk in 2013
At-risk Prong 2 Test for 2013 N/A 70%
January 1, 2013 Funding Ratios Use of the funding balances to satisfy the 2014 MRC
104.88% 80% Because the percent is greater than or equal to the threshold, the funding balances can be used to satisfy 2014 MRC
Quarterly contribution exemption test for 2014
100.16% 100% Because the percent is greater than or equal to the threshold, quarterly contributions are not required for 2014
At-risk Prong 1 Test for 2014 100.16% 80% Because at least one of the percents is greater than or equal to the thresholds, the plan is not at risk in 2014
At-risk Prong 2 Test for 2014 N/A 70%
PBGC 4010 filing in 2014 86.47% 80% Because the percent is greater than or equal to (less than) the threshold, this plan does not (may) trigger a 4010 filing in 2014
PBGC variable premium for 2013 100.91% 100% Because the percent is greater than or equal to the threshold, PBGC variable premiums are not required in 2013
CAD E-32 Attachment 1
Page 10 of 77

American Electric Power System Retirement Plan 7
Towers Watson Confidential
January 1, 2013 Funding Ratios (continued) Exempt from establishing SAB – prefunding balance applied to the 2013 MRC
116.77% 100% Because the percent is greater than or equal to the threshold, if prefunding balance is applied to the 2013 MRC, a new Shortfall Amortization Base (SAB) is not created
Exempt from establishing SAB – prefunding balance not applied to the 2013 MRC
116.77% 100% Because the percent is greater than or equal to the threshold, if prefunding balance is not applied to the 2013 MRC, a new Shortfall Amortization Base (SAB) is not created
Eliminate SABs 100.16% 100% Because the percent is greater than or equal to the threshold, the Shortfall Amortization Bases are eliminated
Benefit limitations
The Adjusted Funding Target Attainment Percentage (AFTAP) for the plan year beginning January 1, 2013 is 116.77%. This AFTAP reflects the segment interest rate corridors of MAP-21. This AFTAP may be changed by subsequent events.
Under the PPA, a plan may become subject to various benefit limitations if its AFTAP falls below certain thresholds.
If the AFTAP is below 60%, plans are prohibited from paying lump sums or other accelerated forms of distribution. If the AFTAP is at least 60% but less than 80%, the amounts which can be paid are limited. In addition, lump sums to the 25 highest paid employees may be restricted if a plan’s AFTAP is below 110%. These limitations do not apply to mandatory lump sum cash-outs of $5,000 or less. In addition, plans which were completely frozen before September 2005 are exempt from the restrictions on lump sums and other accelerated forms of distribution.
If the AFTAP is below 60%, benefit accruals must cease, amendments to improve benefits cannot become effective, and plant shutdown benefits and other Unpredictable Contingent Event Benefits (UCEBs) cannot be paid without being fully paid for. In addition, if the AFTAP would be below 80% reflecting a proposed amendment, the plan amendment cannot take effect unless actions are taken to increase plan assets.
To avoid these benefit limitations, a plan sponsor may take a variety of steps, including reducing the funding balances, contributing additional amounts to the plan for the prior plan year, contributing special “designated IRC §436 contributions” for the current plan year, or providing security outside the plan. Not all of these approaches are available for all of the restrictions discussed above. For example, restrictions on accelerated distributions cannot be avoided by making designated IRC §436 contributions.
CAD E-32 Attachment 1
Page 11 of 77
8 American Electric Power System Retirement Plan
Towers Watson Confidential
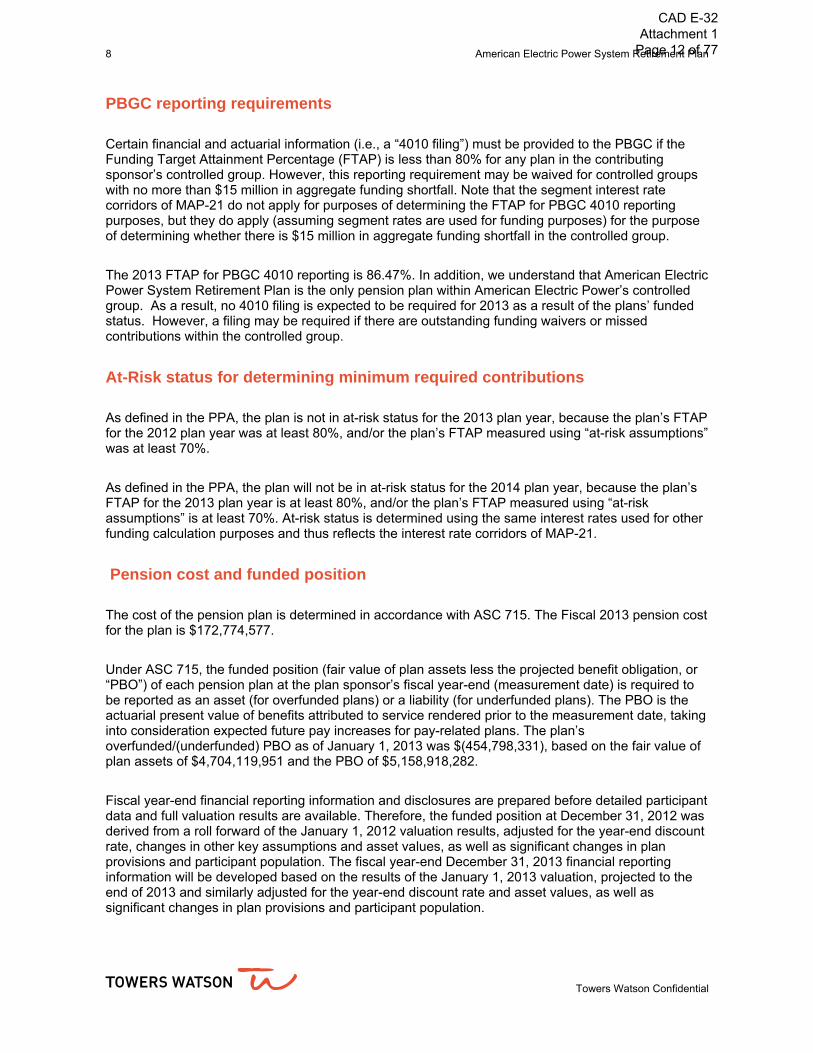
PBGC reporting requirements
Certain financial and actuarial information (i.e., a “4010 filing”) must be provided to the PBGC if the Funding Target Attainment Percentage (FTAP) is less than 80% for any plan in the contributing sponsor’s controlled group. However, this reporting requirement may be waived for controlled groups with no more than $15 million in aggregate funding shortfall. Note that the segment interest rate corridors of MAP-21 do not apply for purposes of determining the FTAP for PBGC 4010 reporting purposes, but they do apply (assuming segment rates are used for funding purposes) for the purpose of determining whether there is $15 million in aggregate funding shortfall in the controlled group.
The 2013 FTAP for PBGC 4010 reporting is 86.47%. In addition, we understand that American Electric Power System Retirement Plan is the only pension plan within American Electric Power’s controlled group. As a result, no 4010 filing is expected to be required for 2013 as a result of the plans’ funded status. However, a filing may be required if there are outstanding funding waivers or missed contributions within the controlled group.
At-Risk status for determining minimum required contributions
As defined in the PPA, the plan is not in at-risk status for the 2013 plan year, because the plan’s FTAP for the 2012 plan year was at least 80%, and/or the plan’s FTAP measured using “at-risk assumptions” was at least 70%.
As defined in the PPA, the plan will not be in at-risk status for the 2014 plan year, because the plan’s FTAP for the 2013 plan year is at least 80%, and/or the plan’s FTAP measured using “at-risk assumptions” is at least 70%. At-risk status is determined using the same interest rates used for other funding calculation purposes and thus reflects the interest rate corridors of MAP-21.
Pension cost and funded position
The cost of the pension plan is determined in accordance with ASC 715. The Fiscal 2013 pension cost for the plan is $172,774,577.
Under ASC 715, the funded position (fair value of plan assets less the projected benefit obligation, or “PBO”) of each pension plan at the plan sponsor’s fiscal year-end (measurement date) is required to be reported as an asset (for overfunded plans) or a liability (for underfunded plans). The PBO is the actuarial present value of benefits attributed to service rendered prior to the measurement date, taking into consideration expected future pay increases for pay-related plans. The plan’s overfunded/(underfunded) PBO as of January 1, 2013 was $(454,798,331), based on the fair value of plan assets of $4,704,119,951 and the PBO of $5,158,918,282.
Fiscal year-end financial reporting information and disclosures are prepared before detailed participant data and full valuation results are available. Therefore, the funded position at December 31, 2012 was derived from a roll forward of the January 1, 2012 valuation results, adjusted for the year-end discount rate, changes in other key assumptions and asset values, as well as significant changes in plan provisions and participant population. The fiscal year-end December 31, 2013 financial reporting information will be developed based on the results of the January 1, 2013 valuation, projected to the end of 2013 and similarly adjusted for the year-end discount rate and asset values, as well as significant changes in plan provisions and participant population.
CAD E-32 Attachment 1
Page 12 of 77

American Electric Power System Retirement Plan 9
Towers Watson Confidential
Change in pension cost and funded position
The pension cost increased from $122,179,275 in fiscal 2012 to $172,774,577 in fiscal 2013 and the funded position improved from $(595,255,524) to $(454,798,331), as set forth below:
Pension
Cost Funded
Position
Prior year 122,179,275 (595,255,524)
Change due to:
► Expected based on prior valuation and contributions during prior year (13,499,280 ) 223,476,225
► Unexpected noninvestment experience 6,801,993 (17,789,763)
► Unexpected investment experience 27,833,325 232,842,849
► Assumption changes 29,459,295 (298,072,118)
► Plan amendments 0 0
► Method change 0 0
► Interim events 0 0
Current year 172,774,577 (454,798,331)
Significant reasons for these changes include the following:
The return on the fair value of plan assets since the prior measurement date was greater than expected, which improved the funded position.
The return on the market-related value of plan assets, which reflects gradual recognition of asset gains and losses over the past five years, was less than expected, which increased the pension cost.
Contributions to the plan during the prior year reduced the pension cost and improved the funded position.
The discount rate declined 60 basis points compared to the prior year, which increased the pension cost and caused the funded position to deteriorate.
The mortality used to develop benefit obligations was updated for an additional year of mortality improvements which increased the pension cost and worsened the funded position.
The long-term cash balance interest crediting rate was changed from 4.50% to 4.00%, which decreased the pension cost and improved the funded position.
The lump sum conversion rate was changed from 6.25% to 5.10% and the mortality table used in lump sum conversions was updated to reflect an additional year of mortality improvements, which decreased the pension cost and improved the funded position.
CAD E-32 Attachment 1
Page 13 of 77

10 American Electric Power System Retirement Plan
Towers Watson Confidential
Basis for valuation
Appendix A summarizes the assumptions and methods used in the valuation. Appendix B summarizes the principal provisions of the plan being valued.
Changes in Assumptions
The discount rate decreased from 4.55% to 3.95%. The mortality table used to value the benefit obligations was updated from the RP2000 with projections to 2019 for annuitants and to 2027 for nonannuitants to RP2000 with projections to 2020 for annuitants and to 2028 for nonannuitants. The mortality used to convert to 417(e) based forms of payment was updated for an additional year of mortality improvements. The long-term cash balance interest crediting rate was changed from 4.50% to 4.00%. The lump sum coversion rate was changed from 6.25% to 5.10%.
Changes in Methods
None.
Changes in Benefits Valued
Benefit accruals were suspended for a small group of employees who transferred to AEP Energy (formerly known as BlueStar Energy Solutions).
CAD E-32 Attachment 1
Page 14 of 77
American Electric Power System Retirement Plan 11
Towers Watson Confidential
Actuarial certification This valuation has been conducted in accordance with generally accepted actuarial principles and practices. However please note the information discussed below regarding this valuation.
Reliances
In preparing the results presented in this report, we have relied upon information regarding plan provisions, participants, assets and sponsor elections provided by AEP and other persons or organizations designated by AEP. We have reviewed this information for overall reasonableness and consistency, but have neither audited nor independently verified this information. Based on discussions with and concurrence by the plan sponsor, assumptions or estimates may have been made if data were not available. We are not aware of any errors or omissions in the data that would have a significant effect on the results of our calculations. In addition, the results in this report are dependent on contributions reported for the prior plan year and maintenance of funding balance elections after the valuation date. We have relied on all the information provided as complete and accurate. The results presented in this report are directly dependent upon the accuracy and completeness of the underlying data and information. Any material inaccuracy in the data, assets, plan provisions or information regarding contributions or funding balance maintenance provided to us may have produced results that are not suitable for the purposes of this report and such inaccuracies, as corrected by AEP, may produce materially different results that could require that a revised report be issued.
Assumptions and methods under ERISA and the Internal Revenue Code for funding purposes
As prescribed by regulation, the plan sponsor selected key assumptions and funding methods (including asset valuation method and choice among prescribed interest rates including MAP-21 alternatives) employed in the development of the contribution amounts and communicated them to us in the email dated March 26, 2013. To the extent not prescribed by ERISA, the Internal Revenue Code and regulatory guidance from the Treasury and the IRS, or selected by the sponsor, the actuarial assumptions and methods employed in the development of the contribution amounts have been selected by Towers Watson, with the concurrence of the plan sponsor. It is beyond the scope of this actuarial valuation to analyze the reasonableness and appropriateness of prescribed methods and assumptions, or to analyze other sponsor elections from among the alternatives available for prescribed methods and assumptions.
Other than prescribed assumptions, ERISA and the Internal Revenue Code require the use of assumptions each of which is “reasonable (taking into account the experience of the plan and reasonable expectations), and which, in combination, offer the actuary’s best estimate of anticipated experience under the plan.” The results shown in this report have been developed based on actuarial assumptions that, to the extent evaluated or selected by Towers Watson, we consider to be reasonable and within the "best-estimate range" as described by the Actuarial Standards of Practice. Other actuarial assumptions could also be considered to be reasonable and within the best-estimate range. Thus, reasonable results differing from those presented in this report could have been developed by selecting different points within the best-estimate ranges for various assumptions.
CAD E-32 Attachment 1
Page 15 of 77

12 American Electric Power System Retirement Plan
Towers Watson Confidential
A summary of the assumptions and methods used is provided in Appendix A. Note that any subsequent changes in methods or assumptions for the 2013 plan year will change the results shown in this report and could result in plan qualification issues under IRC §436 if the application of benefit restrictions is affected by the change.
Assumptions and methods under ASC 715-30-35
As required by U.S. GAAP, the actuarial assumptions and methods employed in the development of the pension cost have been selected by the plan sponsor. Towers Watson has concurred with these assumptions and methods, except for the expected rate of return on plan assets selected as of January 1, 2013. Evaluation of the expected return assumption was outside the scope of Towers Watson’s assignment and would have required substantial additional work which we were not engaged to perform. ASC 715-30-35 requires that each significant assumption “individually represent the best estimate of a particular future event.”
Accumulated other comprehensive (income)/loss amounts shown in the report are shown prior to adjustment for deferred taxes. Any deferred tax effects in AOCI should be determined in consultation with AEP’s tax advisors and auditors.
Nature of actuarial calculations
The results shown in this report are estimates based on data that may be imperfect and on assumptions about future events that cannot be predicted with any certainty. The effects of certain plan provisions may be approximated, or determined to be insignificant and therefore not valued. Reasonable efforts were made in preparing this valuation to confirm that items that are significant in the context of the actuarial liabilities or costs are treated appropriately, and are not excluded or included inappropriately. The numbers shown in this report are not rounded, but this is for convenience only and should not imply precision, which is not a characteristic of actuarial calculations.
If overall future plan experience produces higher benefit payments or lower investment returns than assumed, the relative level of plan costs or contribution requirements reported in this valuation will likely increase in future valuations (and vice versa). Future actuarial measurements may differ significantly from the current measurements presented in this report due to many factors, including: plan experience differing from that anticipated by the economic or demographic assumptions; increases or decreases expected as part of the natural operation of the methodology used for the measurements (such as the end of an amortization period); and changes in plan provisions or applicable law. It is beyond the scope of this valuation to analyze the potential range of future pension contributions, but we can do so upon request.
See Basis for Valuation in Section 1 above for a discussion of any material events that have occurred after the valuation date that are not reflected in this valuation.
Limitations on use
This report is provided subject to the terms set out herein and in our master consulting services agreement dated July 29, 2004 and any accompanying or referenced terms and conditions.
CAD E-32 Attachment 1
Page 16 of 77
American Electric Power System Retirement Plan 13
Towers Watson Confidential
The information contained in this report was prepared for the internal use of AEP and its auditors, and any organization which provides benefit administration services for the plan, in connection with our actuarial valuation of the pension plan as described in Purposes of Valuation above. It is not intended for and may not be used for other purposes, and we accept no responsibility or liability in this regard. AEP may distribute this actuarial valuation report to the appropriate authorities who have the legal right to require AEP to provide them this report, in which case AEP will use best efforts to notify Towers Watson in advance of this distributionand will include the non-reliance notice included at the end of this report. Further distribution to, or use by, other parties of all or part of this report is expressly prohibited without Towers Watson’s prior written consent. In the absence of such consent and an express assumption of responsibility, Towers Watson accepts no responsibility for any consequences arising from any third party relying on this report or any advice relating to its contents. There are no other intended beneficiaries of this report or the work underlying it.
Professional qualifications
The undersigned consulting actuaries are members of the Society of Actuaries and meet the “Qualification Standards for Actuaries Issuing Statements of Actuarial Opinion in the United States” relating to pension plans. Our objectivity is not impaired by any relationship between American Electric Power and our employer, Towers Watson Pennsylvania Inc.
Joseph A. Perko, FSA, EA, MAAA Senior Consultant
Ryan S. Carney, FSA, EA, MAAA Senior Consultant
Towers Watson Pennsylvania Inc.
April 2013
CAD E-32 Attachment 1
Page 17 of 77

14 American Electric Power System Retirement Plan
Towers Watson Confidential
This page is intentionally blank
CAD E-32 Attachment 1
Page 18 of 77

American Electric Power System Retirement Plan 15
Towers Watson Confidential
Section 2: Actuarial exhibits
2.1 Summary of liabilities for minimum funding purposes
All monetary amounts shown in US Dollars
Plan Year Beginning January 1, 2013 January 1, 2012
A Funding Target (Disregarding At-risk Assumptions)
1 Funding target 4,024,284,946 3,821,837,296
2 Target normal cost 61,416,651 59,326,765
B Funding Target (At-risk Assumptions)
1 Funding target N/A N/A
2 Target normal cost N/A N/A
C Funding Target
1 Number of consecutive years at-risk 0 0
2 Funding target
a Active employees – non-vested benefits 46,678,501 41,529,674
b Active employees – vested benefits 1,477,502,076 1,343,713,475
c Participants with deferred benefits 223,969,681 284,120,904
d Participants receiving benefits 2,276,134,688 2,152,473,243
e Total funding target 4,024,284,946 3,821,837,296
3 Target normal cost 61,416,651 59,326,765
CAD E-32 Attachment 1
Page 19 of 77

16 American Electric Power System Retirement Plan
Towers Watson Confidential
2.2 Change in plan assets during plan year
All monetary amounts shown in US Dollars
Plan Year Beginning January 1, 2012
A Reconciliation of Market Value of Assets
1 Market value of assets at January 1, 2012 (including discounted contributions receivable)
4,414,994,598
2 Discounted contributions receivable at January 1, 2012 95,988,429
3 Market value of assets at January 1, 2012 (excluding contributions receivable)
4,319,006,165
4 Employer contributions
a For prior plan year 100,000,000
b For current plan year 100,000,000
c IRC §436 contributions for current plan year 0
d Total 200,000,000
5 Employee contributions 0
6 Benefit payments (366,485,121)
7 Administrative expenses paid by plan (3,568,058)
8 Transfers from/(to) other plans 0
9 Investment return 555,166,965
10 Market value of assets at January 1, 2013 (excluding contributions receivable)
4,704,119,951
11 Discounted contributions receivable at January 1, 2013 0
12 Market value of assets at January 1, 2013 (including discounted contributions receivable)
4,704,119,951
B Rate of Return on Invested Assets (i.e., for crediting unused funding balances)
1 Weighted invested assets 4,169,652,604
2 Rate of return 13.23%
CAD E-32 Attachment 1
Page 20 of 77
American Electric Power System Retirement Plan 17
Towers Watson Confidential
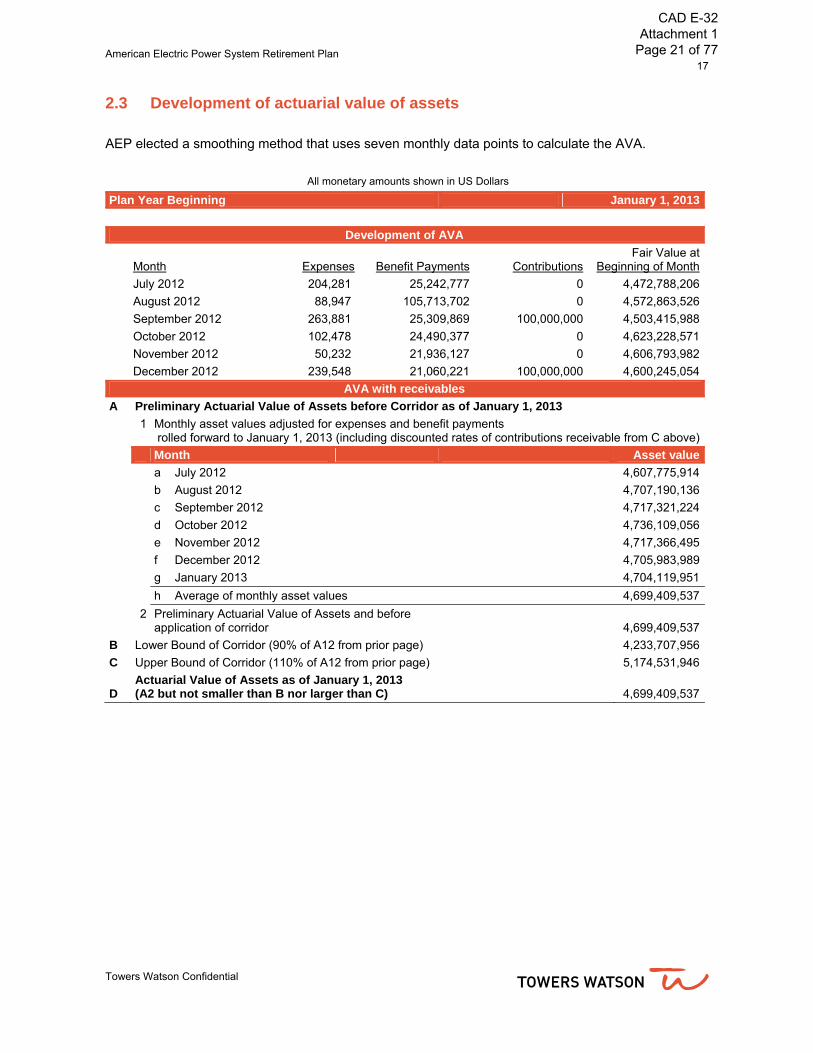
2.3 Development of actuarial value of assets
AEP elected a smoothing method that uses seven monthly data points to calculate the AVA.
All monetary amounts shown in US Dollars
Plan Year Beginning January 1, 2013
Development of AVA
Month Expenses Benefit Payments Contributions
Fair Value at Beginning of Month
July 2012 204,281 25,242,777 0 4,472,788,206
August 2012 88,947 105,713,702 0 4,572,863,526
September 2012 263,881 25,309,869 100,000,000 4,503,415,988
October 2012 102,478 24,490,377 0 4,623,228,571
November 2012 50,232 21,936,127 0 4,606,793,982
December 2012 239,548 21,060,221 100,000,000 4,600,245,054
AVA with receivables
A Preliminary Actuarial Value of Assets before Corridor as of January 1, 2013
1 Monthly asset values adjusted for expenses and benefit payments rolled forward to January 1, 2013 (including discounted rates of contributions receivable from C above)
Month Asset value
a July 2012 4,607,775,914
b August 2012 4,707,190,136
c September 2012 4,717,321,224
d October 2012 4,736,109,056
e November 2012 4,717,366,495
f December 2012 4,705,983,989
g January 2013 4,704,119,951
h Average of monthly asset values 4,699,409,537
2 Preliminary Actuarial Value of Assets and before application of corridor
4,699,409,537
B Lower Bound of Corridor (90% of A12 from prior page) 4,233,707,956
C Upper Bound of Corridor (110% of A12 from prior page) 5,174,531,946
D Actuarial Value of Assets as of January 1, 2013(A2 but not smaller than B nor larger than C) 4,699,409,537
CAD E-32 Attachment 1
Page 21 of 77
18 American Electric Power System Retirement Plan
Towers Watson Confidential
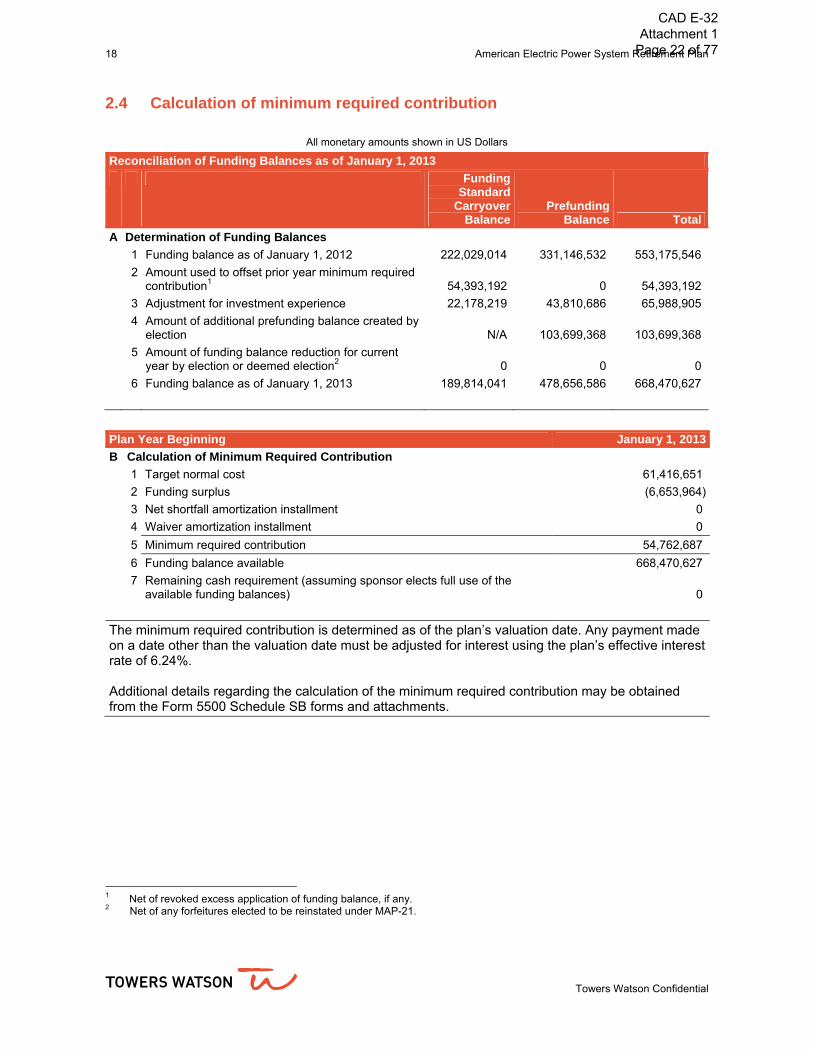
2.4 Calculation of minimum required contribution
All monetary amounts shown in US Dollars
Reconciliation of Funding Balances as of January 1, 2013
Funding Standard
Carryover Balance
Prefunding Balance Total
A Determination of Funding Balances
1 Funding balance as of January 1, 2012 222,029,014 331,146,532 553,175,546
2 Amount used to offset prior year minimum required contribution1 54,393,192 0 54,393,192
3 Adjustment for investment experience 22,178,219 43,810,686 65,988,905
4 Amount of additional prefunding balance created by election N/A 103,699,368 103,699,368
5 Amount of funding balance reduction for current year by election or deemed election2 0 0 0
6 Funding balance as of January 1, 2013 189,814,041 478,656,586 668,470,627
Plan Year Beginning January 1, 2013
B Calculation of Minimum Required Contribution
1 Target normal cost 61,416,651
2 Funding surplus (6,653,964)
3 Net shortfall amortization installment 0
4 Waiver amortization installment 0
5 Minimum required contribution 54,762,687
6 Funding balance available 668,470,627
7 Remaining cash requirement (assuming sponsor elects full use of the available funding balances) 0
The minimum required contribution is determined as of the plan’s valuation date. Any payment made on a date other than the valuation date must be adjusted for interest using the plan’s effective interest rate of 6.24%. Additional details regarding the calculation of the minimum required contribution may be obtained from the Form 5500 Schedule SB forms and attachments.
1 Net of revoked excess application of funding balance, if any. 2 Net of any forfeitures elected to be reinstated under MAP-21.
CAD E-32 Attachment 1
Page 22 of 77
American Electric Power System Retirement Plan 19
Towers Watson Confidential
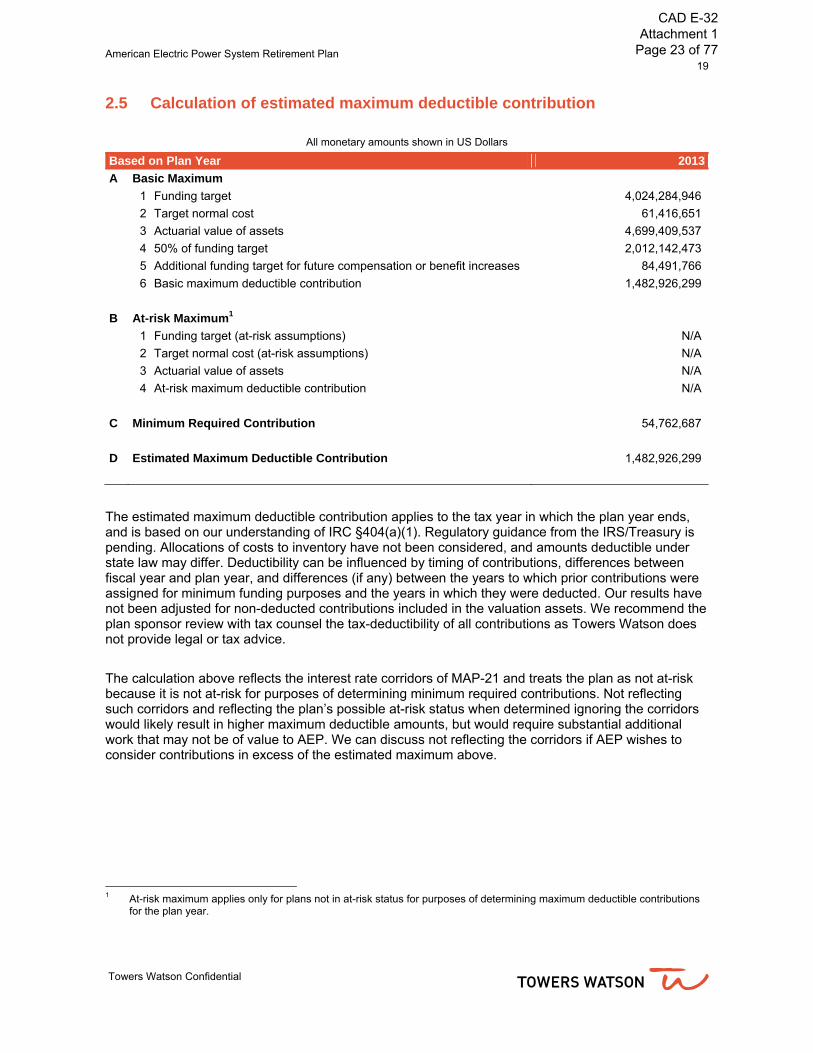
2.5 Calculation of estimated maximum deductible contribution
All monetary amounts shown in US Dollars
Based on Plan Year 2013
A Basic Maximum
1 Funding target 4,024,284,946
2 Target normal cost 61,416,651
3 Actuarial value of assets 4,699,409,537
4 50% of funding target 2,012,142,473
5 Additional funding target for future compensation or benefit increases 84,491,766
6 Basic maximum deductible contribution 1,482,926,299
B At-risk Maximum1
1 Funding target (at-risk assumptions) N/A
2 Target normal cost (at-risk assumptions) N/A
3 Actuarial value of assets N/A
4 At-risk maximum deductible contribution N/A
C Minimum Required Contribution 54,762,687
D Estimated Maximum Deductible Contribution 1,482,926,299
The estimated maximum deductible contribution applies to the tax year in which the plan year ends, and is based on our understanding of IRC §404(a)(1). Regulatory guidance from the IRS/Treasury is pending. Allocations of costs to inventory have not been considered, and amounts deductible under state law may differ. Deductibility can be influenced by timing of contributions, differences between fiscal year and plan year, and differences (if any) between the years to which prior contributions were assigned for minimum funding purposes and the years in which they were deducted. Our results have not been adjusted for non-deducted contributions included in the valuation assets. We recommend the plan sponsor review with tax counsel the tax-deductibility of all contributions as Towers Watson does not provide legal or tax advice.
The calculation above reflects the interest rate corridors of MAP-21 and treats the plan as not at-risk because it is not at-risk for purposes of determining minimum required contributions. Not reflecting such corridors and reflecting the plan’s possible at-risk status when determined ignoring the corridors would likely result in higher maximum deductible amounts, but would require substantial additional work that may not be of value to AEP. We can discuss not reflecting the corridors if AEP wishes to consider contributions in excess of the estimated maximum above.
1 At-risk maximum applies only for plans not in at-risk status for purposes of determining maximum deductible contributions
for the plan year.
CAD E-32 Attachment 1
Page 23 of 77
20 American Electric Power System Retirement Plan
Towers Watson Confidential
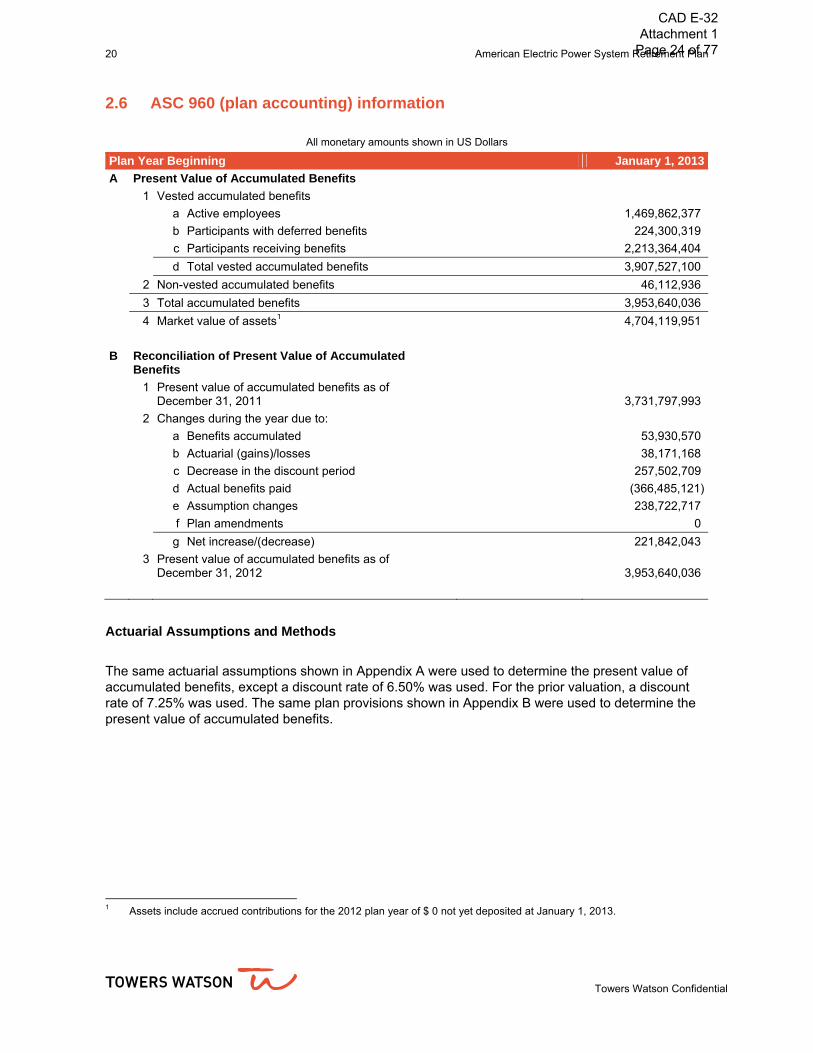
2.6 ASC 960 (plan accounting) information
All monetary amounts shown in US Dollars
Plan Year Beginning January 1, 2013
A Present Value of Accumulated Benefits
1 Vested accumulated benefits
a Active employees 1,469,862,377
b Participants with deferred benefits 224,300,319
c Participants receiving benefits 2,213,364,404
d Total vested accumulated benefits 3,907,527,100
2 Non-vested accumulated benefits 46,112,936
3 Total accumulated benefits 3,953,640,036
4 Market value of assets1 4,704,119,951
B Reconciliation of Present Value of Accumulated Benefits
1 Present value of accumulated benefits as of December 31, 2011 3,731,797,993
2 Changes during the year due to:
a Benefits accumulated 53,930,570
b Actuarial (gains)/losses 38,171,168
c Decrease in the discount period 257,502,709
d Actual benefits paid (366,485,121)
e Assumption changes 238,722,717
f Plan amendments 0
g Net increase/(decrease) 221,842,043
3 Present value of accumulated benefits as of December 31, 2012 3,953,640,036
Actuarial Assumptions and Methods
The same actuarial assumptions shown in Appendix A were used to determine the present value of accumulated benefits, except a discount rate of 6.50% was used. For the prior valuation, a discount rate of 7.25% was used. The same plan provisions shown in Appendix B were used to determine the present value of accumulated benefits.
1 Assets include accrued contributions for the 2012 plan year of $ 0 not yet deposited at January 1, 2013.
CAD E-32 Attachment 1
Page 24 of 77
American Electric Power System Retirement Plan 21
Towers Watson Confidential
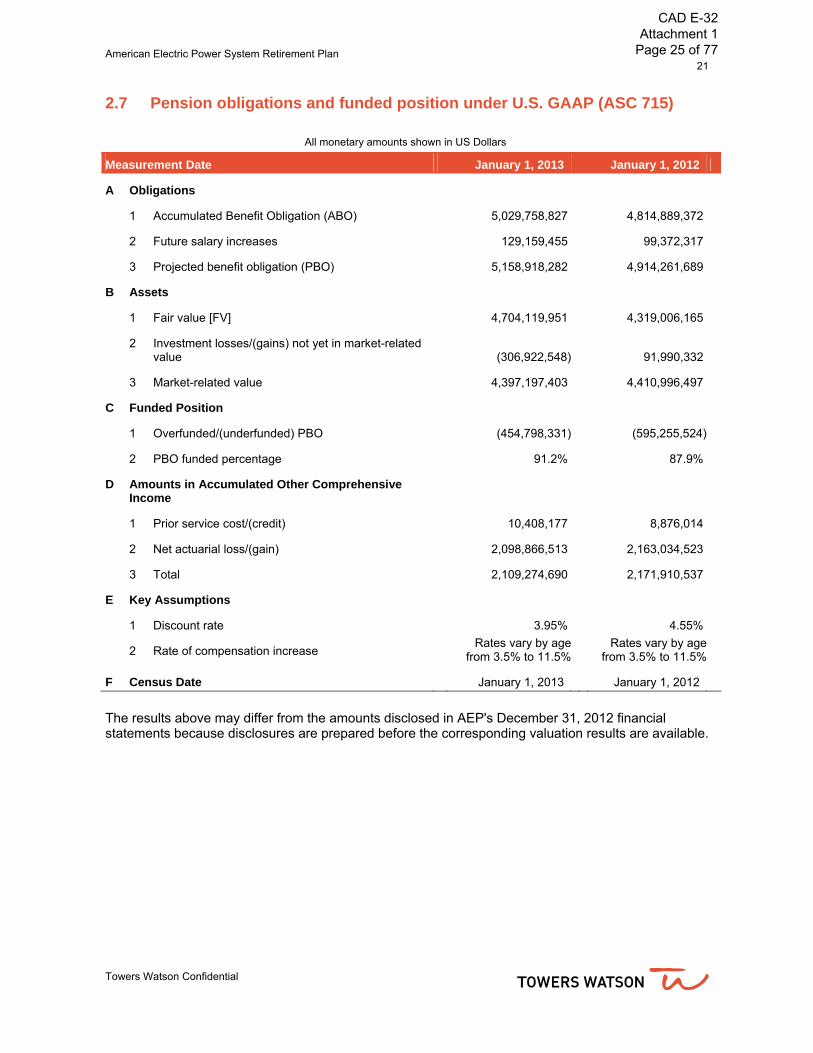
2.7 Pension obligations and funded position under U.S. GAAP (ASC 715)
All monetary amounts shown in US Dollars
Measurement Date January 1, 2013 January 1, 2012
A Obligations
1 Accumulated Benefit Obligation (ABO)
5,029,758,827
4,814,889,372
2 Future salary increases 129,159,455
99,372,317
3 Projected benefit obligation (PBO)
5,158,918,282
4,914,261,689
B Assets
1 Fair value [FV]
4,704,119,951
4,319,006,165
2 Investment losses/(gains) not yet in market-related value (306,922,548)
91,990,332
3 Market-related value 4,397,197,403
4,410,996,497
C Funded Position
1 Overfunded/(underfunded) PBO (454,798,331)
(595,255,524)
2 PBO funded percentage 91.2%
87.9%
D Amounts in Accumulated Other Comprehensive Income
1 Prior service cost/(credit) 10,408,177
8,876,014
2 Net actuarial loss/(gain) 2,098,866,513
2,163,034,523
3 Total 2,109,274,690
2,171,910,537
E Key Assumptions
1 Discount rate 3.95%
4.55%
2 Rate of compensation increase Rates vary by age
from 3.5% to 11.5% Rates vary by age
from 3.5% to 11.5%
F Census Date January 1, 2013
January 1, 2012
The results above may differ from the amounts disclosed in AEP's December 31, 2012 financial statements because disclosures are prepared before the corresponding valuation results are available.
CAD E-32 Attachment 1
Page 25 of 77

22 American Electric Power System Retirement Plan
Towers Watson Confidential
2.8 Pension cost under U.S. GAAP (ASC 715)
All monetary amounts shown in US Dollars
Fiscal Year Ending December 31, 2013 December 31, 2012
A Pension Cost
1 Service cost 68,688,725
75,709,045
2 Interest cost 199,615,109
219,570,788
3 Expected return on assets (277,771,978)
(318,756,058)
4 Net prior service cost/(credit) amortization 2,507,561
(1,532,165)
5 Net loss/(gain) amortization 179,735,160
147,187,665
6 Net periodic pension cost/(income) 172,774,577
122,179,275
7 Curtailments 0 0
8 Settlements 0 0
9 Special/contractual termination benefits 0 0
10 Total pension cost 172,774,577
122,178,652
B Key Assumptions1
1 Discount rate 3.95% 4.55%
2 Rate of return on assets 6.50% 7.25%
3 Cash balance crediting rate 4.00% 4.50%
3 Rate of compensation increase Rates vary by age
from 3.5% to 11.5% Rates vary by age
from 3.5% to 11.5%
C Census Date January 1, 2013 January 1, 2012
1 These assumptions were used to calculate Net Periodic Pension Cost/(Income) as of the beginning of the year. For other
assumptions used, as well as assumptions used for interim remeasurements, if any, refer to Appendix A.
CAD E-32 Attachment 1
Page 26 of 77
American Electric Power System Retirement Plan 23
Towers Watson Confidential
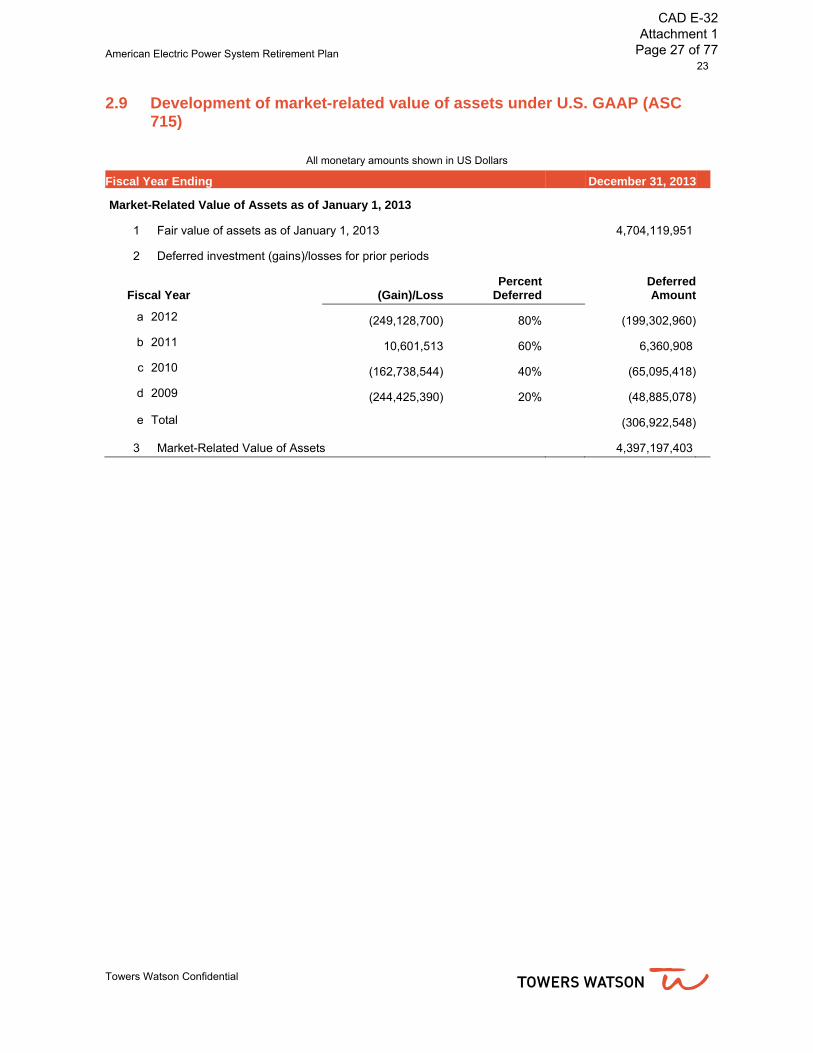
2.9 Development of market-related value of assets under U.S. GAAP (ASC 715)
All monetary amounts shown in US Dollars
Fiscal Year Ending December 31, 2013
Market-Related Value of Assets as of January 1, 2013
1 Fair value of assets as of January 1, 2013 4,704,119,951
2 Deferred investment (gains)/losses for prior periods
Fiscal Year (Gain)/LossPercent
Deferred DeferredAmount
a 2012 (249,128,700) 80% (199,302,960)
b 2011 10,601,513 60% 6,360,908
c 2010 (162,738,544) 40% (65,095,418)
d 2009 (244,425,390) 20% (48,885,078)
e Total (306,922,548)
3 Market-Related Value of Assets 4,397,197,403
CAD E-32 Attachment 1
Page 27 of 77

24 American Electric Power Co.
Towers Watson Confidential
This page is intentionally blank
CAD E-32 Attachment 1
Page 28 of 77

American Electric Power System Retirement Plan 25
Towers Watson Confidential
Section 3: Participant data 3.1 Summary of plan participants
All monetary amounts shown in US Dollars
Census Date January 1, 2013 January 1, 2012
A Active Employees
1 Number 17,631 18,056
2 Expected plan compensation for year beginning on the valuation date (limited by IRC §401(a)(17))
1,573,666,355 1,543,088,651
3 Average plan compensation 89,256 85,461
4 Average age 46.8 46.3
5 Average credited service 17.3 16.8
6 Average future working life (years) 10.51490 10.73200
7 Total accrued benefits 1,662,064,618 1,586,368,748
8 Average accrued benefits 94,269 87,858
B Participants with Deferred Benefits
1 Number (non-cash balance) 2,479 4,447
2 Total annual pension (non-cash balance) 21,017,548 34,295,063
3 Average annual pension (non-cash balance) 8,478 5,643
4 Number of cash balance 1,739 1,630
5 Total cash balance 137,581,778 129,672,074
6 Average cash balance 79,115 79,553
7 Average age 53.5 54.2
8 Distribution at January 1, 2013
NON-CASH BALANCE Age Number
Average annual pension
Under 40 20 19,136
40-44 42 8,349
45-49 280 6,518
50-54 716 7,630
55-59 814 8,748
60-64 592 9,713
65 and over 15 8,351
Total 2,479 8,478
CASH BALANCE Age Number
Average cash balance
Under 40 330 13,202
40-44 139 26,525
45-49 255 43,516
50-54 339 67,934
55-59 383 121,016
60-64 230 164,760
65 and over 63 177,274
Total 1,739 79,115
CAD E-32 Attachment 1
Page 29 of 77

26 American Electric Power System Retirement Plan
Towers Watson Confidential
C Participants Receiving Benefits
1 Number 16,292 16,262
2 Total annual pension 240,599,847 234,664,371
3 Average annual pension 14,768 14,430
4 Average age 73.70 73.50
5 Distribution at January 1, 2013
Age Number
Average annual pension
Under 55 97 4,866
55-59 743 16,915
60-64 2,228 20,889
65-69 3,235 15,244
70-74 2,586 12,311
75-79 2,497 14,290
80-84 2,364 14,346
85 and over 2,542 11,908
Total 16,292 14,768
CAD E-32 Attachment 1
Page 30 of 77
American Electric Power System Retirement Plan 27
Towers Watson Confidential
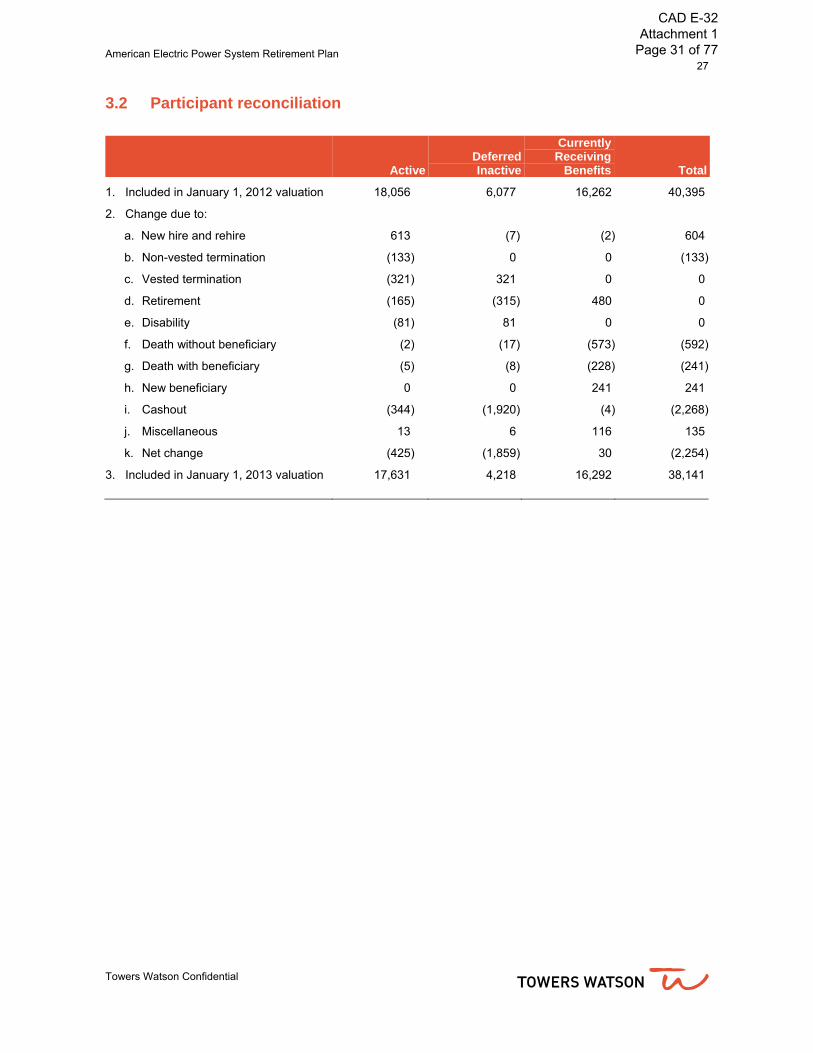
3.2 Participant reconciliation
ActiveDeferred Inactive
Currently Receiving
Benefits Total
1. Included in January 1, 2012 valuation 18,056 6,077 16,262 40,395
2. Change due to:
a. New hire and rehire 613 (7) (2) 604
b. Non-vested termination (133) 0 0 (133)
c. Vested termination (321) 321 0 0
d. Retirement (165) (315) 480 0
e. Disability (81) 81 0 0
f. Death without beneficiary (2) (17) (573) (592)
g. Death with beneficiary (5) (8) (228) (241)
h. New beneficiary 0 0 241 241
i. Cashout (344) (1,920) (4) (2,268)
j. Miscellaneous 13 6 116 135
k. Net change (425) (1,859) 30 (2,254)
3. Included in January 1, 2013 valuation 17,631 4,218 16,292 38,141
CAD E-32 Attachment 1
Page 31 of 77
28 American Electric Power System Retirement Plan
Towers Watson Confidential
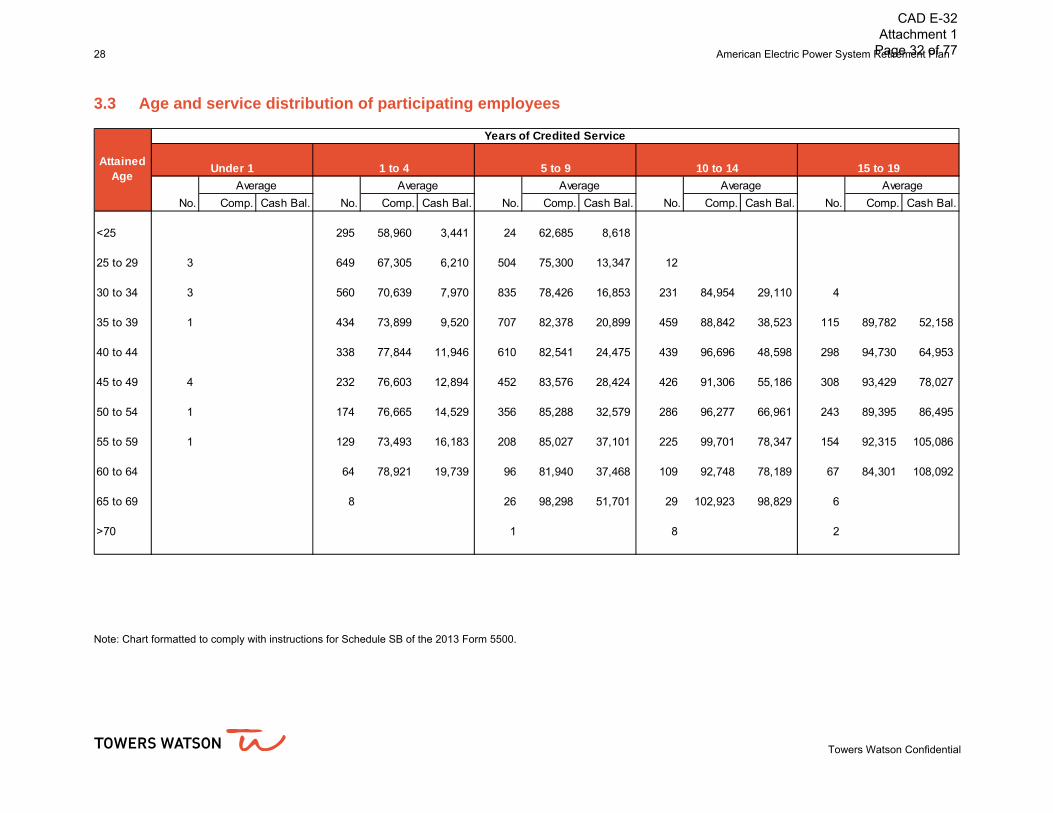
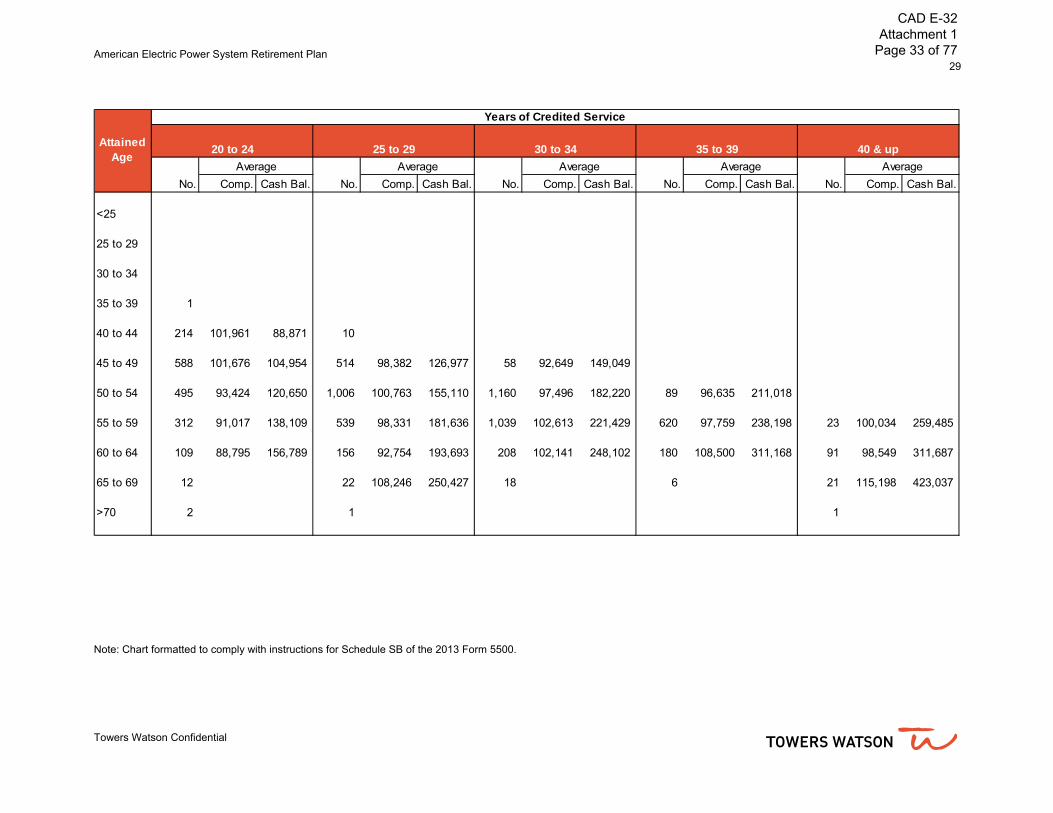
3.3 Age and service distribution of participating employees
Note: Chart formatted to comply with instructions for Schedule SB of the 2013 Form 5500.
Average Average Average Average Average
No. Comp. Cash Bal. No. Comp. Cash Bal. No. Comp. Cash Bal. No. Comp. Cash Bal. No. Comp. Cash Bal.
<25 0 0 0 295 58,960 3,441 24 62,685 8,618 0 0 0 0 0 0
25 to 29 3 0 0 649 67,305 6,210 504 75,300 13,347 12 0 0 0 0 0
30 to 34 3 0 0 560 70,639 7,970 835 78,426 16,853 231 84,954 29,110 4 0 0
35 to 39 1 0 0 434 73,899 9,520 707 82,378 20,899 459 88,842 38,523 115 89,782 52,158
40 to 44 0 0 0 338 77,844 11,946 610 82,541 24,475 439 96,696 48,598 298 94,730 64,953
45 to 49 4 0 0 232 76,603 12,894 452 83,576 28,424 426 91,306 55,186 308 93,429 78,027
50 to 54 1 0 0 174 76,665 14,529 356 85,288 32,579 286 96,277 66,961 243 89,395 86,495
55 to 59 1 0 0 129 73,493 16,183 208 85,027 37,101 225 99,701 78,347 154 92,315 105,086
60 to 64 0 0 0 64 78,921 19,739 96 81,940 37,468 109 92,748 78,189 67 84,301 108,092
65 to 69 0 0 0 8 0 0 26 98,298 51,701 29 102,923 98,829 6 0 0
>70 0 0 0 0 0 0 1 0 0 8 0 0 2 0 0
Years of Credited Service
15 to 19Under 1 1 to 4 5 to 9 10 to 14Attained
Age
CAD E-32 Attachment 1
Page 32 of 77
American Electric Power System Retirement Plan 29
Towers Watson Confidential
Note: Chart formatted to comply with instructions for Schedule SB of the 2013 Form 5500.
Average Average Average Average Average
No. Comp. Cash Bal. No. Comp. Cash Bal. No. Comp. Cash Bal. No. Comp. Cash Bal. No. Comp. Cash Bal.
<25 0 0 0 0 0 0 0 0 0 0 0 0 0 0 0
25 to 29 0 0 0 0 0 0 0 0 0 0 0 0 0 0 0
30 to 34 0 0 0 0 0 0 0 0 0 0 0 0 0 0 0
35 to 39 1 0 0 0 0 0 0 0 0 0 0 0 0 0 0
40 to 44 214 101,961 88,871 10 0 0 0 0 0 0 0 0 0 0 0
45 to 49 588 101,676 104,954 514 98,382 126,977 58 92,649 149,049 0 0 0 0 0 0
50 to 54 495 93,424 120,650 1,006 100,763 155,110 1,160 97,496 182,220 89 96,635 211,018 0 0 0
55 to 59 312 91,017 138,109 539 98,331 181,636 1,039 102,613 221,429 620 97,759 238,198 23 100,034 259,485
60 to 64 109 88,795 156,789 156 92,754 193,693 208 102,141 248,102 180 108,500 311,168 91 98,549 311,687
65 to 69 12 0 0 22 108,246 250,427 18 0 0 6 0 0 21 115,198 423,037
>70 2 0 0 1 0 0 0 0 0 0 0 0 1 0 0
Attained Age
Years of Credited Service
40 & up35 to 3930 to 3425 to 2920 to 24
CAD E-32 Attachment 1
Page 33 of 77

30 American Electric Power System Retirement Plan
Towers Watson Confidential
This page is intentionally blank
CAD E-32 Attachment 1
Page 34 of 77

American Electric Power System Retirement Plan 31
Appendix A : Statement of actuarial assumptions and methods
Actuarial Assumptions and Methods Contributions
Economic Assumptions
Interest rate basis:
Applicable month (published) October 2012
Yield curve basis Segment rates
MAP-21 applied for funding Yes
MAP-21 applied for benefit restrictions Yes
Funding interest rates:
Reflecting Corridors
Not Reflecting Corridors
First segment rate 4.94% 1.72%
Second segment rate 6.15% 4.58%
Third segment rate 6.76% 5.67%
Effective interest rate 6.24% 4.68%
Annual rates of increase
Compensation:
— Representative rates Age
< 26
26 – 30 31 – 35 36 – 40 41 – 45 46 – 50
> 50
Rate
11.50% 9.50% 7.50% 6.50% 5.00% 4.00% 3.50%
— Weighted average
4.95%
Cash balance crediting rate 4.00%
Lump sum/annuity conversion rate October 2012 segment rates
Future Social Security wage bases 4.00%
Statutory limits on compensation N/A
Expected rate of return on assets for prior year
7.25% but not greater than the third segment rate
CAD E-32 Attachment 1
Page 35 of 77

32 American Electric Power System Retirement Plan
Towers Watson Confidential
Demographic Assumptions
Inclusion Date The valuation date coincident with or next following the date on which the employee becomes a participant.
New or rehired employees It was assumed there will be no new or rehired employees.
Mortality
Healthy Separate rates for non-annuitants (based on RP-2000 “Employees” table without collar or amount adjustments, projected to 2028 using Scale AA and annuitants (based on RP-2000 “Healthy Annuitants” table without collar or amount adjustments, projected to 2020 using Scale AA.
Disabled Post-1994 current liability disabled
Lump sum/annuity conversion
Applicable 417(e) IRS Mortality Table
Termination Rates varying by age and service:
Percentage leaving during the year
Attained Age Less than five years of service
Five or more years of service
< 25 8.00% 8.00%
25 – 29 8.00% 6.00%
30 – 34 8.00% 5.00%
35 – 39 8.00% 3.00%
40 – 49 8.00% 2.50%
> 49 8.00% 4.00%
Disability Rates apply to employees not eligible to retire and vary by age and sex as indicated by the following sample values:
Percentage becoming disabled during the year
Age Male Female
20 0.060% 0.090%
30 0.060% 0.090%
40 0.074% 0.110%
50 0.178% 0.267%
60 0.690% 1.035%
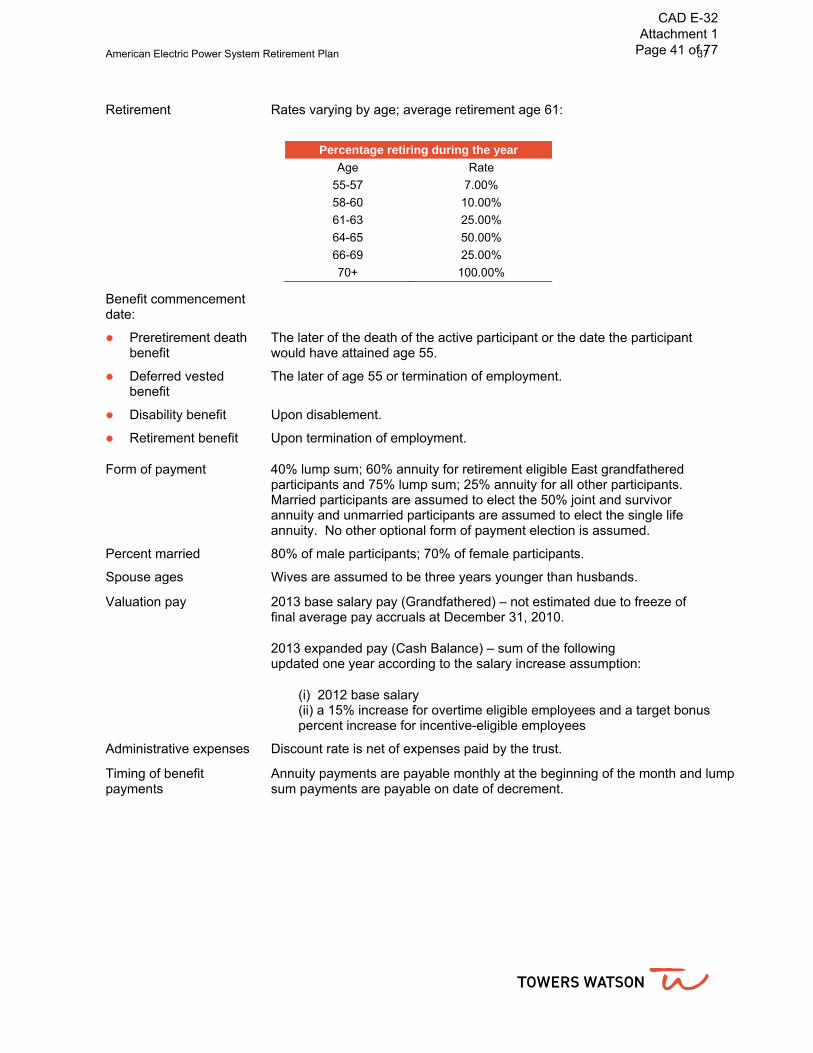
Retirement Rates varying by age; average retirement age 61:
Percentage retiring during the year
Age Rate
55-57 7.00%
58-60 10.00%
61-63 25.00%
64-65 50.00%
66-69 25.00%
70+ 100.00%
CAD E-32 Attachment 1
Page 36 of 77
American Electric Power System Retirement Plan 33
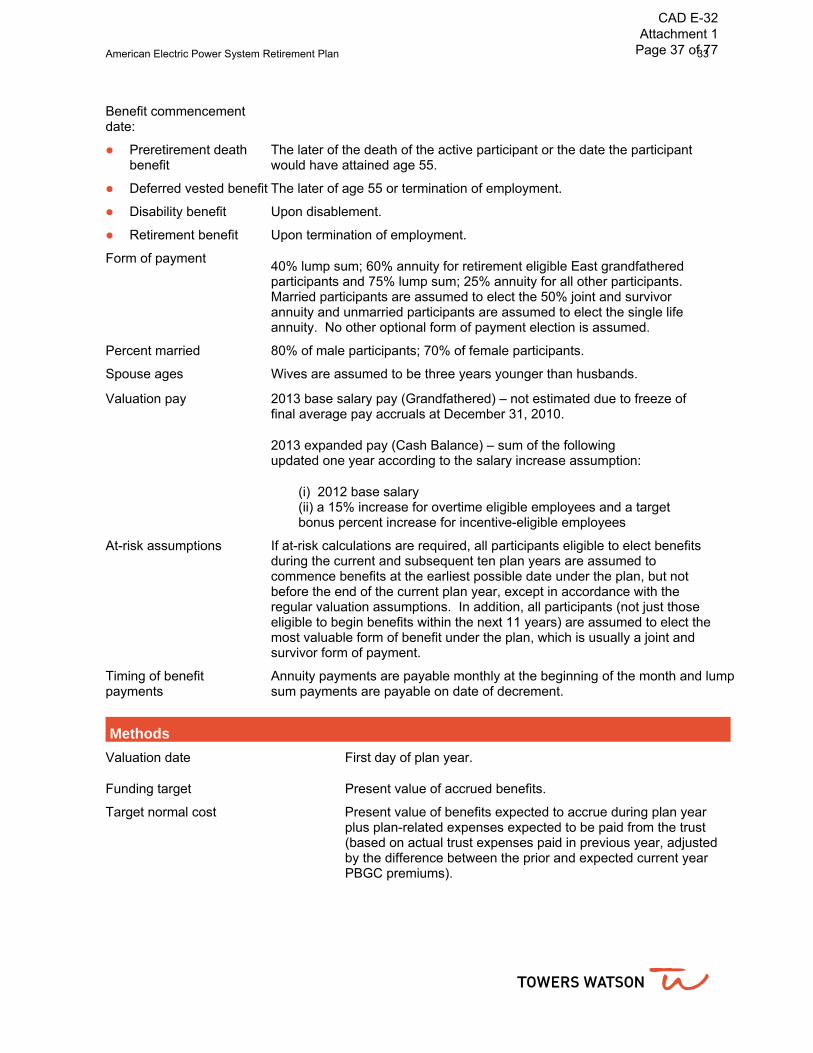
Benefit commencement date:
Preretirement death benefit
The later of the death of the active participant or the date the participant would have attained age 55.
Deferred vested benefit The later of age 55 or termination of employment.
Disability benefit Upon disablement.
Retirement benefit Upon termination of employment.
Form of payment 40% lump sum; 60% annuity for retirement eligible East grandfathered participants and 75% lump sum; 25% annuity for all other participants. Married participants are assumed to elect the 50% joint and survivor annuity and unmarried participants are assumed to elect the single life annuity. No other optional form of payment election is assumed.
Percent married 80% of male participants; 70% of female participants.
Spouse ages Wives are assumed to be three years younger than husbands.
Valuation pay 2013 base salary pay (Grandfathered) – not estimated due to freeze of final average pay accruals at December 31, 2010.
2013 expanded pay (Cash Balance) – sum of the following updated one year according to the salary increase assumption:
(i) 2012 base salary (ii) a 15% increase for overtime eligible employees and a target bonus percent increase for incentive-eligible employees
At-risk assumptions If at-risk calculations are required, all participants eligible to elect benefits during the current and subsequent ten plan years are assumed to commence benefits at the earliest possible date under the plan, but not before the end of the current plan year, except in accordance with the regular valuation assumptions. In addition, all participants (not just those eligible to begin benefits within the next 11 years) are assumed to elect the most valuable form of benefit under the plan, which is usually a joint and survivor form of payment.
Timing of benefit payments
Annuity payments are payable monthly at the beginning of the month and lump sum payments are payable on date of decrement.
Methods
Valuation date First day of plan year.
Funding target Present value of accrued benefits.
Target normal cost Present value of benefits expected to accrue during plan year plus plan-related expenses expected to be paid from the trust (based on actual trust expenses paid in previous year, adjusted by the difference between the prior and expected current year PBGC premiums).
CAD E-32 Attachment 1
Page 37 of 77
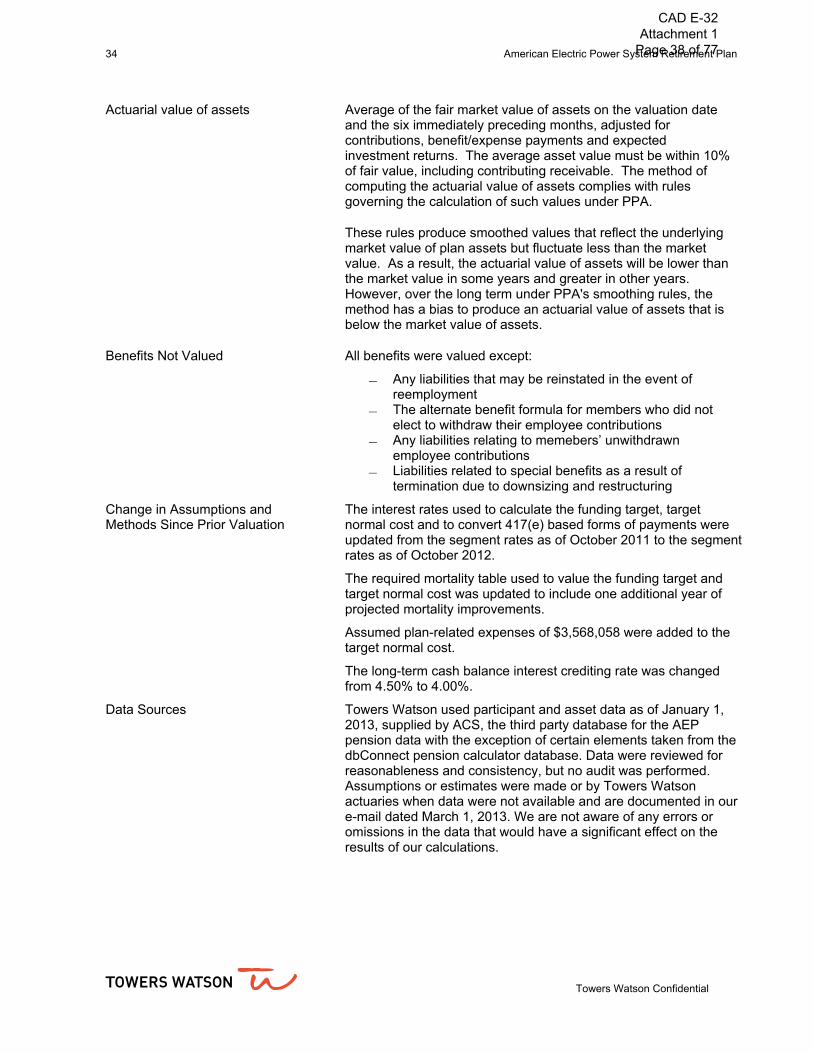
34 American Electric Power System Retirement Plan
Towers Watson Confidential
Actuarial value of assets Average of the fair market value of assets on the valuation date and the six immediately preceding months, adjusted for contributions, benefit/expense payments and expected investment returns. The average asset value must be within 10% of fair value, including contributing receivable. The method of computing the actuarial value of assets complies with rules governing the calculation of such values under PPA.
These rules produce smoothed values that reflect the underlying market value of plan assets but fluctuate less than the market value. As a result, the actuarial value of assets will be lower than the market value in some years and greater in other years. However, over the long term under PPA's smoothing rules, the method has a bias to produce an actuarial value of assets that is below the market value of assets.
Benefits Not Valued All benefits were valued except:
— Any liabilities that may be reinstated in the event of
reemployment — The alternate benefit formula for members who did not
elect to withdraw their employee contributions — Any liabilities relating to memebers’ unwithdrawn
employee contributions — Liabilities related to special benefits as a result of
termination due to downsizing and restructuring
Change in Assumptions and Methods Since Prior Valuation
The interest rates used to calculate the funding target, target normal cost and to convert 417(e) based forms of payments were updated from the segment rates as of October 2011 to the segment rates as of October 2012.
The required mortality table used to value the funding target and target normal cost was updated to include one additional year of projected mortality improvements.
Assumed plan-related expenses of $3,568,058 were added to the target normal cost.
The long-term cash balance interest crediting rate was changed from 4.50% to 4.00%.
Data Sources Towers Watson used participant and asset data as of January 1, 2013, supplied by ACS, the third party database for the AEP pension data with the exception of certain elements taken from the dbConnect pension calculator database. Data were reviewed for reasonableness and consistency, but no audit was performed. Assumptions or estimates were made or by Towers Watson actuaries when data were not available and are documented in our e-mail dated March 1, 2013. We are not aware of any errors or omissions in the data that would have a significant effect on the results of our calculations.
CAD E-32 Attachment 1
Page 38 of 77
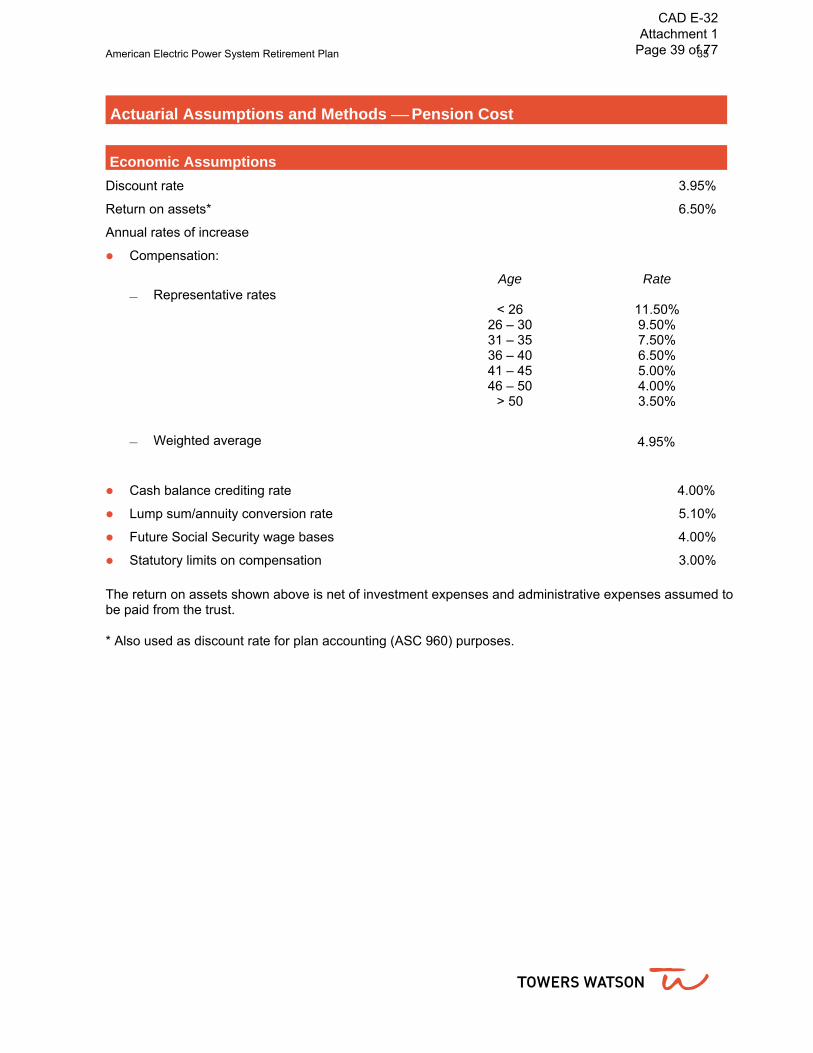
American Electric Power System Retirement Plan 35
Actuarial Assumptions and Methods Pension Cost
Economic Assumptions
Discount rate 3.95%
Return on assets* 6.50%
Annual rates of increase
Compensation:
— Representative rates Age
< 26
26 – 30 31 – 35 36 – 40 41 – 45 46 – 50
> 50
Rate
11.50% 9.50% 7.50% 6.50% 5.00% 4.00% 3.50%
— Weighted average
4.95%
Cash balance crediting rate 4.00%
Lump sum/annuity conversion rate 5.10%
Future Social Security wage bases 4.00%
Statutory limits on compensation 3.00%
The return on assets shown above is net of investment expenses and administrative expenses assumed to be paid from the trust.
* Also used as discount rate for plan accounting (ASC 960) purposes.
CAD E-32 Attachment 1
Page 39 of 77

36 American Electric Power System Retirement Plan
Towers Watson Confidential
Demographic Assumptions
Inclusion Date The valuation date coincident with or next following the date on which the employee becomes a participant.
New or rehired employees It was assumed there will be no new or rehired employees.
Mortality
Healthy Separate rates for (1) non-annuitants (based on RP-2000 “Employees” table without collar or amount adjustments, projected to 2028 using Scale AA and (2) annuitants (based on RP-2000 “Healthy Annuitants” table without collar or amount adjustments, projected to 2020 using Scale AA.
Disabled RP2000 disabled retiree, no projection.
Lump sum/annuity conversion Applicable 417(e) IRS Mortality Table
Termination Rates varying by age and service
Percentage leaving during the year
Attained Age Less than five years of service
Five or more years of service
< 25 8.00% 8.00%
25 – 29 8.00% 6.00%
30 – 34 8.00% 5.00%
35 – 39 8.00% 3.00%
40 – 49 8.00% 2.50%
> 49 8.00% 4.00%
Disability Rates apply to employees not eligible to retire and vary by age and sex a indicated by the following sample values:
Percentage becoming disabled during the year
Age Male Female
20 0.060% 0.090%
30 0.060% 0.090%
40 0.074% 0.110%
50 0.178% 0.267%
60 0.690% 1.035%
CAD E-32 Attachment 1
Page 40 of 77
American Electric Power System Retirement Plan 37
Retirement Rates varying by age; average retirement age 61:
Percentage retiring during the year
Age Rate
55-57 7.00%
58-60 10.00%
61-63 25.00%
64-65 50.00%
66-69 25.00%
70+ 100.00%
Benefit commencement date:
Preretirement death benefit
The later of the death of the active participant or the date the participant would have attained age 55.
Deferred vested benefit
The later of age 55 or termination of employment.
Disability benefit Upon disablement.
Retirement benefit Upon termination of employment.
Form of payment 40% lump sum; 60% annuity for retirement eligible East grandfathered participants and 75% lump sum; 25% annuity for all other participants. Married participants are assumed to elect the 50% joint and survivor annuity and unmarried participants are assumed to elect the single life annuity. No other optional form of payment election is assumed.
Percent married 80% of male participants; 70% of female participants.
Spouse ages Wives are assumed to be three years younger than husbands.
Valuation pay 2013 base salary pay (Grandfathered) – not estimated due to freeze of final average pay accruals at December 31, 2010.
2013 expanded pay (Cash Balance) – sum of the following updated one year according to the salary increase assumption:
(i) 2012 base salary (ii) a 15% increase for overtime eligible employees and a target bonus percent increase for incentive-eligible employees
Administrative expenses Discount rate is net of expenses paid by the trust.
Timing of benefit payments
Annuity payments are payable monthly at the beginning of the month and lump sum payments are payable on date of decrement.
CAD E-32 Attachment 1
Page 41 of 77
38 American Electric Power System Retirement Plan
Towers Watson Confidential
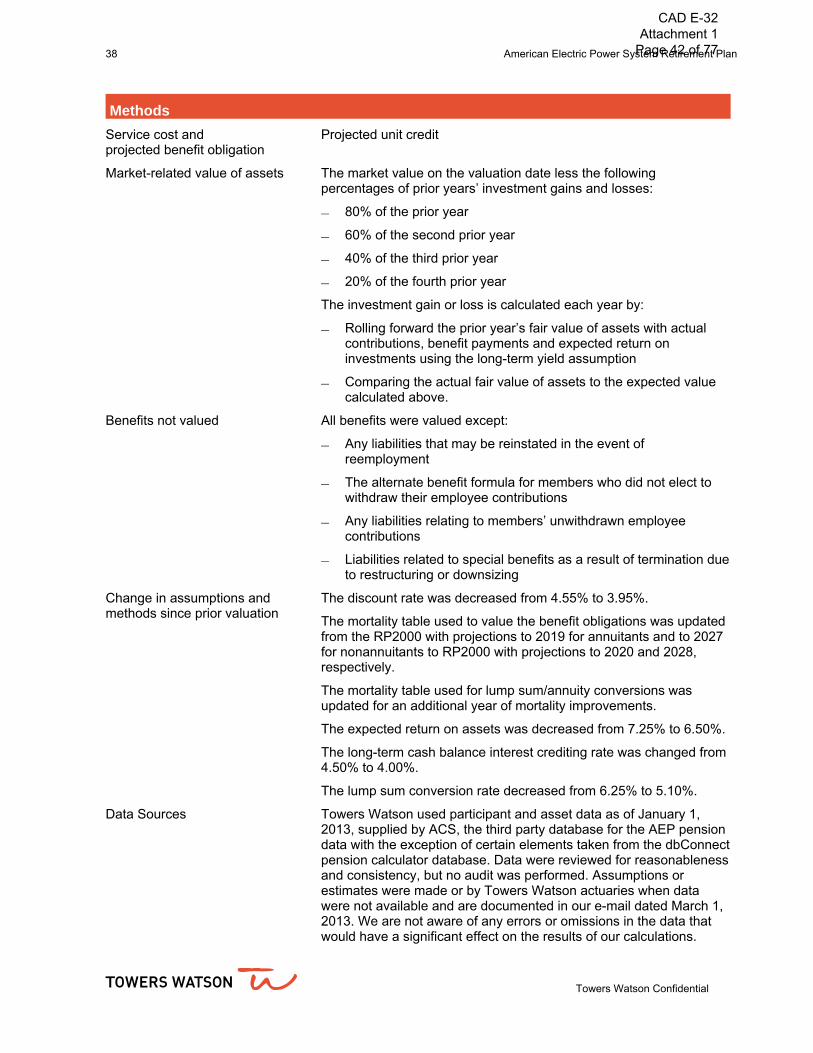
Methods
Service cost and projected benefit obligation
Projected unit credit
Market-related value of assets The market value on the valuation date less the following percentages of prior years’ investment gains and losses:
— 80% of the prior year
— 60% of the second prior year
— 40% of the third prior year
— 20% of the fourth prior year
The investment gain or loss is calculated each year by:
— Rolling forward the prior year’s fair value of assets with actual contributions, benefit payments and expected return on investments using the long-term yield assumption
— Comparing the actual fair value of assets to the expected value calculated above.
Benefits not valued All benefits were valued except:
— Any liabilities that may be reinstated in the event of reemployment
— The alternate benefit formula for members who did not elect to withdraw their employee contributions
— Any liabilities relating to members’ unwithdrawn employee contributions
— Liabilities related to special benefits as a result of termination due to restructuring or downsizing
Change in assumptions and methods since prior valuation
The discount rate was decreased from 4.55% to 3.95%.
The mortality table used to value the benefit obligations was updated from the RP2000 with projections to 2019 for annuitants and to 2027 for nonannuitants to RP2000 with projections to 2020 and 2028, respectively.
The mortality table used for lump sum/annuity conversions was updated for an additional year of mortality improvements.
The expected return on assets was decreased from 7.25% to 6.50%.
The long-term cash balance interest crediting rate was changed from 4.50% to 4.00%.
The lump sum conversion rate decreased from 6.25% to 5.10%.
Data Sources Towers Watson used participant and asset data as of January 1, 2013, supplied by ACS, the third party database for the AEP pension data with the exception of certain elements taken from the dbConnect pension calculator database. Data were reviewed for reasonableness and consistency, but no audit was performed. Assumptions or estimates were made or by Towers Watson actuaries when data were not available and are documented in our e-mail dated March 1, 2013. We are not aware of any errors or omissions in the data that would have a significant effect on the results of our calculations.
CAD E-32 Attachment 1
Page 42 of 77
American Electric Power System Retirement Plan 39
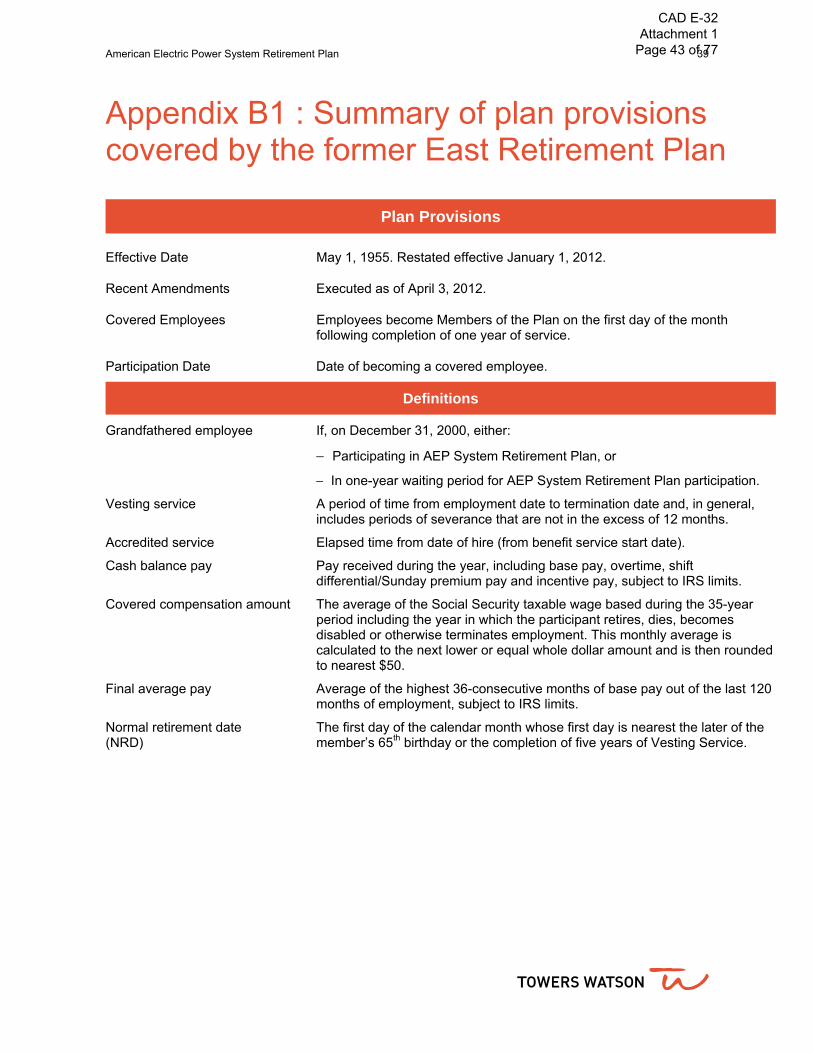
Appendix B1 : Summary of plan provisions covered by the former East Retirement Plan
Plan Provisions
Effective Date May 1, 1955. Restated effective January 1, 2012.
Recent Amendments Executed as of April 3, 2012.
Covered Employees Employees become Members of the Plan on the first day of the month following completion of one year of service.
Participation Date Date of becoming a covered employee.
Definitions
Grandfathered employee If, on December 31, 2000, either:
Participating in AEP System Retirement Plan, or
In one-year waiting period for AEP System Retirement Plan participation.
Vesting service A period of time from employment date to termination date and, in general, includes periods of severance that are not in the excess of 12 months.
Accredited service Elapsed time from date of hire (from benefit service start date).
Cash balance pay Pay received during the year, including base pay, overtime, shift differential/Sunday premium pay and incentive pay, subject to IRS limits.
Covered compensation amount The average of the Social Security taxable wage based during the 35-year period including the year in which the participant retires, dies, becomes disabled or otherwise terminates employment. This monthly average is calculated to the next lower or equal whole dollar amount and is then rounded to nearest $50.
Final average pay Average of the highest 36-consecutive months of base pay out of the last 120 months of employment, subject to IRS limits.
Normal retirement date (NRD)
The first day of the calendar month whose first day is nearest the later of the member’s 65th birthday or the completion of five years of Vesting Service.
CAD E-32 Attachment 1
Page 43 of 77
40 American Electric Power System Retirement Plan
Towers Watson Confidential
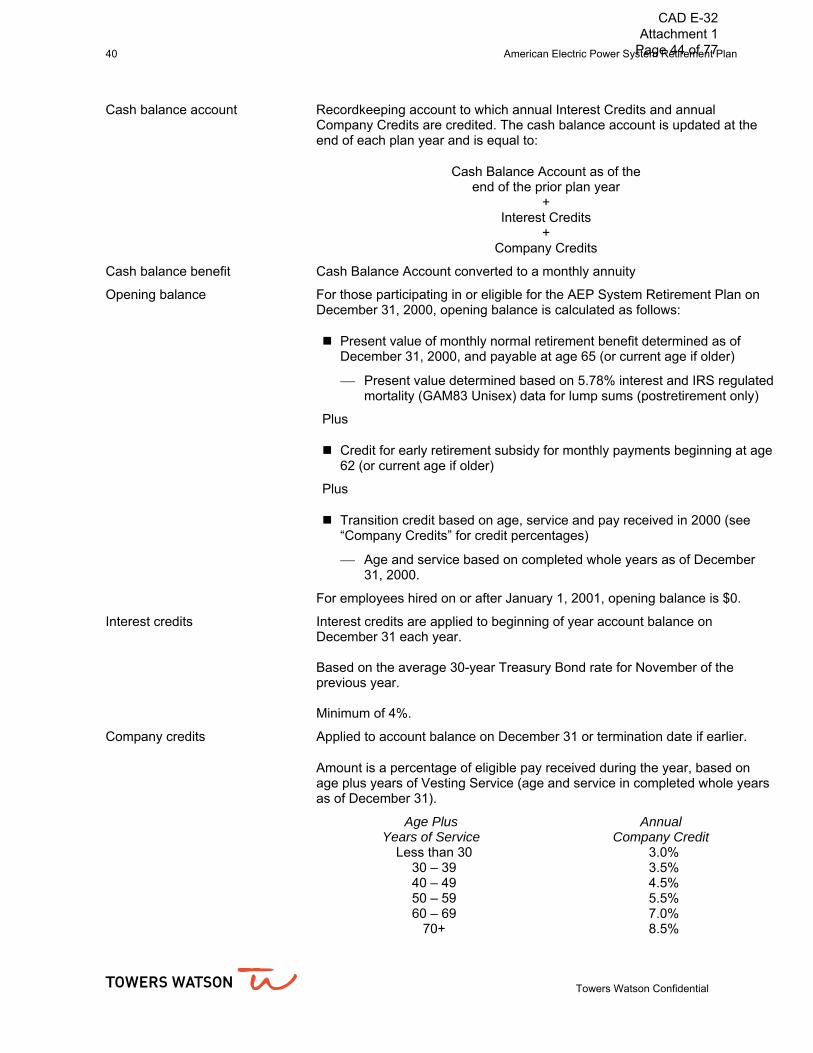
Cash balance account Recordkeeping account to which annual Interest Credits and annual Company Credits are credited. The cash balance account is updated at the end of each plan year and is equal to:
Cash Balance Account as of the end of the prior plan year
+ Interest Credits
+ Company Credits
Cash balance benefit Cash Balance Account converted to a monthly annuity
Opening balance For those participating in or eligible for the AEP System Retirement Plan on December 31, 2000, opening balance is calculated as follows:
Present value of monthly normal retirement benefit determined as of December 31, 2000, and payable at age 65 (or current age if older)
Present value determined based on 5.78% interest and IRS regulated mortality (GAM83 Unisex) data for lump sums (postretirement only)
Plus
Credit for early retirement subsidy for monthly payments beginning at age 62 (or current age if older)
Plus
Transition credit based on age, service and pay received in 2000 (see “Company Credits” for credit percentages)
Age and service based on completed whole years as of December 31, 2000.
For employees hired on or after January 1, 2001, opening balance is $0.
Interest credits Interest credits are applied to beginning of year account balance on December 31 each year. Based on the average 30-year Treasury Bond rate for November of the previous year. Minimum of 4%.
Company credits Applied to account balance on December 31 or termination date if earlier.
Amount is a percentage of eligible pay received during the year, based on age plus years of Vesting Service (age and service in completed whole years as of December 31).
Age Plus Years of Service
Less than 30 30 – 39 40 – 49 50 – 59 60 – 69
70+
Annual Company Credit
3.0% 3.5% 4.5% 5.5% 7.0% 8.5%
CAD E-32 Attachment 1
Page 44 of 77

American Electric Power System Retirement Plan 41
Monthly Grandfathered Benefit Sum of (1), (2) and (3):
(1) 1.10% of Final Average Pay x Accredited Service up to 35 years
(2) 0.50% of Final Average Pay Less Covered Compensation x Accredited Service up to 35 years
(3) 1.33% of Final Average Pay x Accredited Service between 35 and 45 years
Accruals for the grandfathered benefit ceased on December 31, 2010.
Long-term disability and paid leaves
Compensation equal to base rate of pay as of disability date. Vesting service continues.
Unpaid leave No compensation for annual Company Credit. Vesting service continues.
Eligibility for Benefits
Normal retirement All members at or after their Normal Retirement Date.
Early retirement Any time after attainment of age 55 and completion of five years of vesting. Applicable only to grandfathered benefits.
Postponed retirement Retirement after Normal Retirement Date.
Vested termination All members who terminate employment after completion of three years of Vesting Service, or upon death.
Disability All members who are unable to work at own occupation solely because of sickness or injury for the first 24 months of disability. After 24 months of disability, the participant is eligible if unable to work at any gainful occupation for which the participant may be able, or may reasonably become qualified by education, training or experience, to perform.
Surviving spouse The surviving spouse of a Grandfathered Member who retired or is eligible to retire on Normal or Early Retirement and who was married to that spouse for the year preceding commencement and whose grandfathered benefit exceeds his or her Cash Balance Benefit.
Preretirement death Beneficiary of deceased member.
Benefits Paid Upon the Following Events
Normal retirement For Grandfathered Employees, the better of the monthly grandfathered benefit or the Cash Balance Benefit determined as of Normal Retirement Date. For all other employees, the Cash Balance Benefit determined as of Normal Retirement Date.
Early retirement For Grandfathered Employees, the better of:
(1) The monthly grandfathered retirement benefit reduced by 3% per year for each year commencement precedes age 62, and
(2) The Cash Balance Benefit determined as of the Early Retirement Date.
For all other employees, the Cash Balance Benefit determined as of the Early Retirement Date.
CAD E-32 Attachment 1
Page 45 of 77
42 American Electric Power System Retirement Plan
Towers Watson Confidential
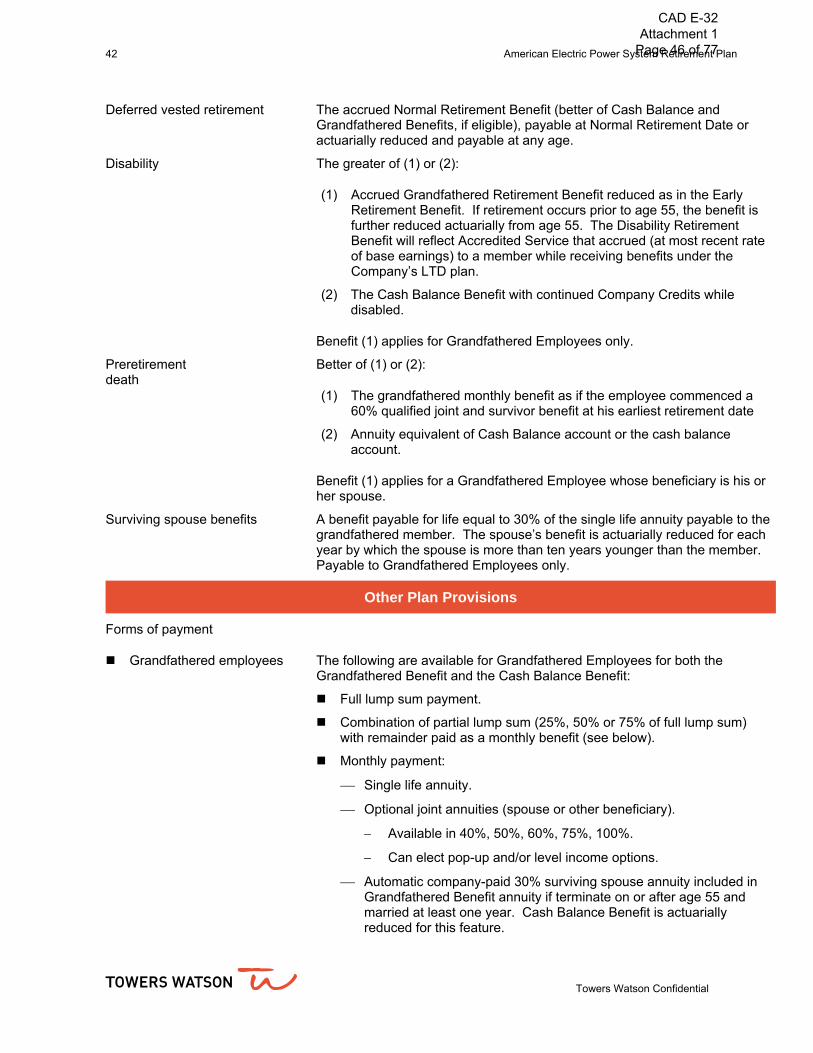
Deferred vested retirement The accrued Normal Retirement Benefit (better of Cash Balance and Grandfathered Benefits, if eligible), payable at Normal Retirement Date or actuarially reduced and payable at any age.
Disability The greater of (1) or (2):
(1) Accrued Grandfathered Retirement Benefit reduced as in the Early Retirement Benefit. If retirement occurs prior to age 55, the benefit is further reduced actuarially from age 55. The Disability Retirement Benefit will reflect Accredited Service that accrued (at most recent rate of base earnings) to a member while receiving benefits under the Company’s LTD plan.
(2) The Cash Balance Benefit with continued Company Credits while disabled.
Benefit (1) applies for Grandfathered Employees only.
Preretirement death
Better of (1) or (2):
(1) The grandfathered monthly benefit as if the employee commenced a 60% qualified joint and survivor benefit at his earliest retirement date
(2) Annuity equivalent of Cash Balance account or the cash balance account.
Benefit (1) applies for a Grandfathered Employee whose beneficiary is his or her spouse.
Surviving spouse benefits A benefit payable for life equal to 30% of the single life annuity payable to the grandfathered member. The spouse’s benefit is actuarially reduced for each year by which the spouse is more than ten years younger than the member. Payable to Grandfathered Employees only.
Other Plan Provisions
Forms of payment
Grandfathered employees
The following are available for Grandfathered Employees for both the Grandfathered Benefit and the Cash Balance Benefit:
Full lump sum payment.
Combination of partial lump sum (25%, 50% or 75% of full lump sum) with remainder paid as a monthly benefit (see below).
Monthly payment:
Single life annuity.
Optional joint annuities (spouse or other beneficiary).
Available in 40%, 50%, 60%, 75%, 100%.
Can elect pop-up and/or level income options.
Automatic company-paid 30% surviving spouse annuity included in Grandfathered Benefit annuity if terminate on or after age 55 and married at least one year. Cash Balance Benefit is actuarially reduced for this feature.
CAD E-32 Attachment 1
Page 46 of 77

American Electric Power System Retirement Plan 43
A one-time option to elect a lump sum of the accrued benefit for terminated vested participants whose benefit was determined in no way by reference to either the AEP or CSW cash balance formulas was offered during the period from May 1, 2012 through June 30, 2012. Participants eligible for the window were also permitted to elect any of the other optional forms of payment generally applicable to such a participant under the normal terms of the plan document. Any participant who elected to commence benefits under this window, regardless of lump sum or annuity election, had a benefit commencement date of August 1, 2012.
Employees hired on or after January 1, 2001
The following are available for those hired on or after January 1, 2001:
Full lump sum payment.
Combination of partial lump sum (25%, 50% or 75% of full lump sum) with remainder paid as a monthly benefit (see below).
Monthly payment:
Single life annuity.
Joint annuities (spouse or other beneficiary).
Available in 50%, 75%, 100%.
Form of payment conversion for non-417(e) covered conversions
Cash balance 7.50% interest and the applicable 417(e) Mortality Table.
Grandfathered benefit 7.50% interest and the 1974 George B. Buck Mortality Table.
Pension Increases
None.
Plan Participants’ Contributions
Prior to January 1, 1978, employee contributions were required as a condition of Membership. In May and June of 1981, Members were permitted an election to withdraw those contributions. Those who did not elect to withdraw have retirement benefits based on a formula that differs from the formulas previously described in this section. However, the number of nonelecting Members is so small that special plan provisions for that group have not been included in this summary.
CAD E-32 Attachment 1
Page 47 of 77

44 American Electric Power System Retirement Plan
Towers Watson Confidential
Maximum on benefits and pay
All benefits and pay for any calendar year may not exceed the maximum limitations for that year as defined in the Internal Revenue Code. The plan provides for increasing the dollar limits automatically as such changes become effective. Increases in the dollar limits are assumed for determining pension cost but not for determining contributions.
Benefits not valued A small portion of the population made employee contributions to the plan. Because the amount of these contributions is not material to the plan, they are not part of the valuation.
Participants who were employees of Columbus Southern Power (CSP) at the time AEP acquired that company have a frozen benefit under the CSP benefit formula at December 31, 1986. Benefits for these participants are the greater of an all-service AEP benefit and a two-part benefit consisting of the frozen CSP benefit plus an AEP benefit accrued from January 1, 1987. Because this applies to a small portion of the population and the CSP frozen benefit is not often the greater benefit for these participants, this benefit is not valued.
Plan status Ongoing.
Future Plan Changes
Towers Watson is not aware of any future plan changes that are required to be reflected.
Changes in Benefits Valued Since Prior Year
None.
CAD E-32 Attachment 1
Page 48 of 77

The American Electric Power System Retirement Plan 45
This page is intentionally blank.
CAD E-32 Attachment 1
Page 49 of 77
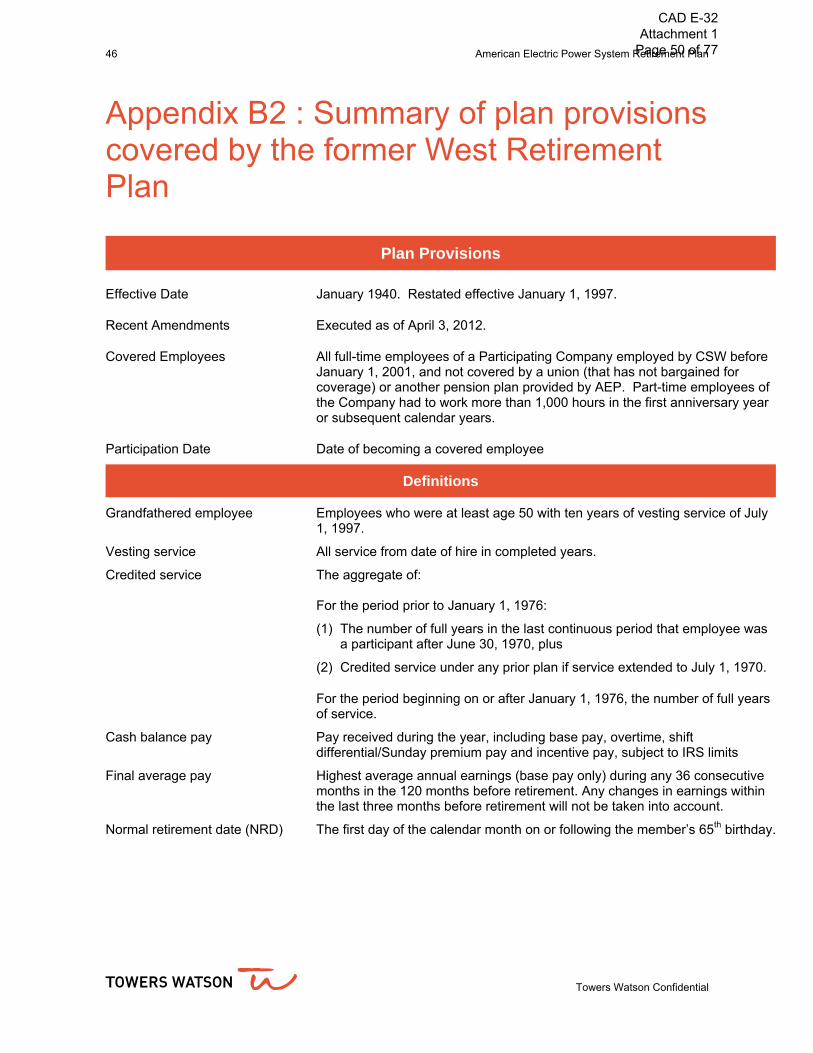
46 American Electric Power System Retirement Plan
Towers Watson Confidential
Appendix B2 : Summary of plan provisions covered by the former West Retirement Plan
Plan Provisions
Effective Date January 1940. Restated effective January 1, 1997.
Recent Amendments Executed as of April 3, 2012.
Covered Employees All full-time employees of a Participating Company employed by CSW before January 1, 2001, and not covered by a union (that has not bargained for coverage) or another pension plan provided by AEP. Part-time employees of the Company had to work more than 1,000 hours in the first anniversary year or subsequent calendar years.
Participation Date Date of becoming a covered employee
Definitions
Grandfathered employee Employees who were at least age 50 with ten years of vesting service of July 1, 1997.
Vesting service All service from date of hire in completed years.
Credited service The aggregate of: For the period prior to January 1, 1976:
(1) The number of full years in the last continuous period that employee was a participant after June 30, 1970, plus
(2) Credited service under any prior plan if service extended to July 1, 1970.
For the period beginning on or after January 1, 1976, the number of full years of service.
Cash balance pay Pay received during the year, including base pay, overtime, shift differential/Sunday premium pay and incentive pay, subject to IRS limits
Final average pay Highest average annual earnings (base pay only) during any 36 consecutive months in the 120 months before retirement. Any changes in earnings within the last three months before retirement will not be taken into account.
Normal retirement date (NRD) The first day of the calendar month on or following the member’s 65th birthday.
CAD E-32 Attachment 1
Page 50 of 77
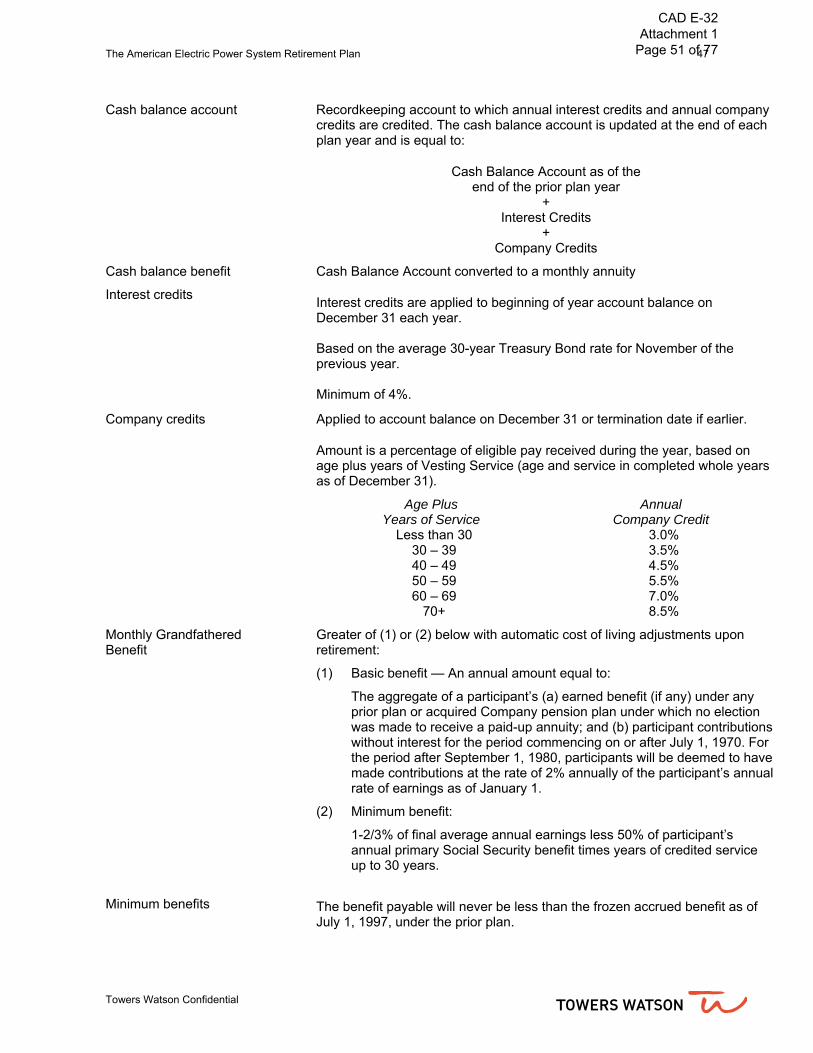
The American Electric Power System Retirement Plan 47
Towers Watson Confidential
Cash balance account Recordkeeping account to which annual interest credits and annual company credits are credited. The cash balance account is updated at the end of each plan year and is equal to:
Cash Balance Account as of the end of the prior plan year
+ Interest Credits
+ Company Credits
Cash balance benefit Cash Balance Account converted to a monthly annuity
Interest credits Interest credits are applied to beginning of year account balance on December 31 each year. Based on the average 30-year Treasury Bond rate for November of the previous year. Minimum of 4%.
Company credits Applied to account balance on December 31 or termination date if earlier.
Amount is a percentage of eligible pay received during the year, based on age plus years of Vesting Service (age and service in completed whole years as of December 31).
Age Plus Years of Service
Less than 30 30 – 39 40 – 49 50 – 59 60 – 69
70+
Annual Company Credit
3.0% 3.5% 4.5% 5.5% 7.0% 8.5%
Monthly Grandfathered Benefit
Greater of (1) or (2) below with automatic cost of living adjustments upon retirement:
(1) Basic benefit — An annual amount equal to:
The aggregate of a participant’s (a) earned benefit (if any) under any prior plan or acquired Company pension plan under which no election was made to receive a paid-up annuity; and (b) participant contributions without interest for the period commencing on or after July 1, 1970. For the period after September 1, 1980, participants will be deemed to have made contributions at the rate of 2% annually of the participant’s annual rate of earnings as of January 1.
(2) Minimum benefit:
1-2/3% of final average annual earnings less 50% of participant’s annual primary Social Security benefit times years of credited service up to 30 years.
Minimum benefits The benefit payable will never be less than the frozen accrued benefit as of July 1, 1997, under the prior plan.
CAD E-32 Attachment 1
Page 51 of 77

48 American Electric Power System Retirement Plan
Towers Watson Confidential
Primary Social Security benefit The annual amount payable under the Social Security Act as amended in effect at the employee’s date of retirement. The date as of which the amount is to be determined is:
(1) In the case of an employee (including deferred vested employees) retiring on or after normal retirement date, normal retirement date.
(2) In the case of an employee retiring prior to normal retirement date, the later of employee’s 62nd birthday or actual retirement date.
Early retirees and deferred vested employees are assumed to have no earnings after termination in determining the amount of this benefit.
Long-term disability and paid leaves
Compensation equal to the base rate of pay as of disability date. If a participant became disabled prior to January 1, 2003, compensation for the cash balance formula is equal to the greater of the compensation for the calendar year before the disability and the year in which the disability benefits began. For the grandfathered formula, the final average pay will be determined as of the date on which the participant became disabled. Vesting service continues.
Unpaid leave No compensation for annual compensation credit. Vesting service continues.
Eligibility for Benefits
Normal retirement All members at or after their Normal Retirement Date
Early retirement Any time after attainment of age 55 and completion of five years of vesting
Postponed retirement Retirement after NRD.
Vested The participant’s cash balance account is 100% vested when any one of the following applies:
(1) Three years of vesting service
(2) Attainment of age 55 while an employee
(3) Death prior to termination
(4) Upon disability.
Disability All participants who become permanently and totally disabled. Permanent and total disability is determined by reference to the LTD plan covering that participant.
Surviving spouse The surviving spouse of a participant who retired or is eligible to retire on normal or early retirement.
Preretirement death Beneficiary of participant who dies after becoming vested.
CAD E-32 Attachment 1
Page 52 of 77
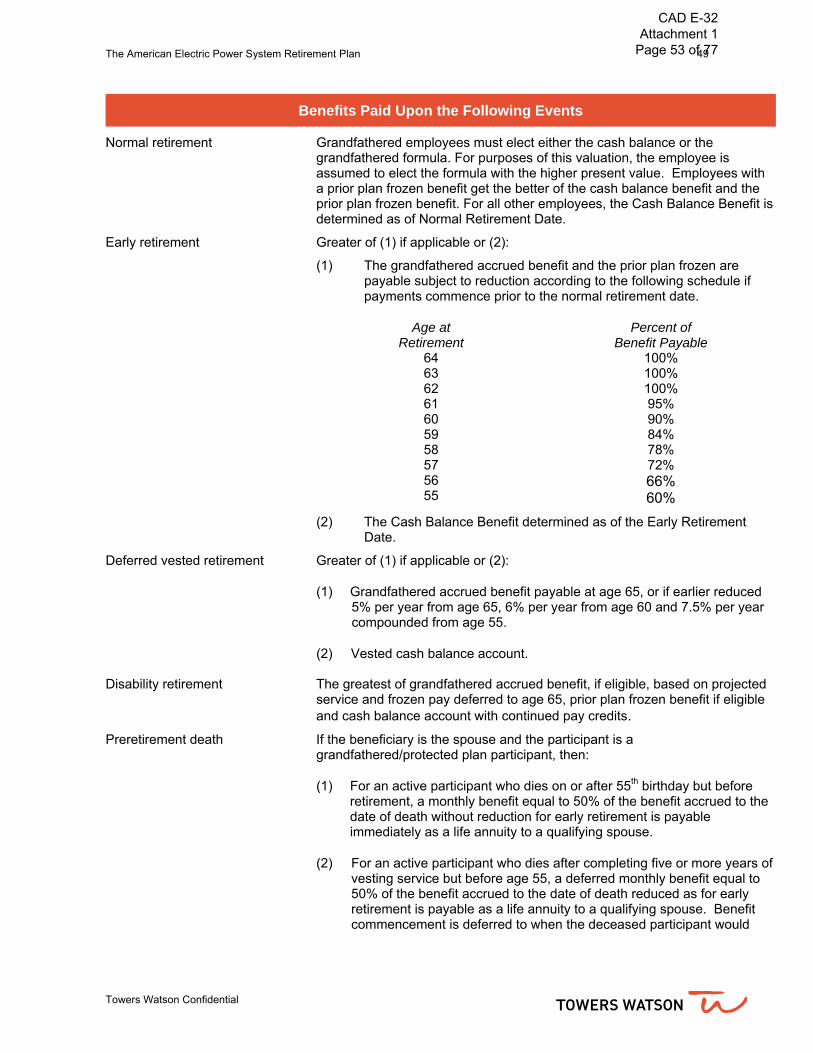
The American Electric Power System Retirement Plan 49
Towers Watson Confidential
Benefits Paid Upon the Following Events
Normal retirement Grandfathered employees must elect either the cash balance or the grandfathered formula. For purposes of this valuation, the employee is assumed to elect the formula with the higher present value. Employees with a prior plan frozen benefit get the better of the cash balance benefit and the prior plan frozen benefit. For all other employees, the Cash Balance Benefit is determined as of Normal Retirement Date.
Early retirement Greater of (1) if applicable or (2):
(1) The grandfathered accrued benefit and the prior plan frozen are payable subject to reduction according to the following schedule if payments commence prior to the normal retirement date.
Age at
Retirement 64 63 62 61 60 59 58 57 56 55
Percent of Benefit Payable
100% 100% 100% 95% 90% 84% 78% 72% 66% 60%
(2) The Cash Balance Benefit determined as of the Early Retirement Date.
Deferred vested retirement Greater of (1) if applicable or (2):
(1) Grandfathered accrued benefit payable at age 65, or if earlier reduced 5% per year from age 65, 6% per year from age 60 and 7.5% per year compounded from age 55.
(2) Vested cash balance account.
Disability retirement The greatest of grandfathered accrued benefit, if eligible, based on projected service and frozen pay deferred to age 65, prior plan frozen benefit if eligible and cash balance account with continued pay credits.
Preretirement death If the beneficiary is the spouse and the participant is a grandfathered/protected plan participant, then:
(1) For an active participant who dies on or after 55th birthday but before retirement, a monthly benefit equal to 50% of the benefit accrued to the date of death without reduction for early retirement is payable immediately as a life annuity to a qualifying spouse.
(2) For an active participant who dies after completing five or more years of vesting service but before age 55, a deferred monthly benefit equal to 50% of the benefit accrued to the date of death reduced as for early retirement is payable as a life annuity to a qualifying spouse. Benefit commencement is deferred to when the deceased participant would
CAD E-32 Attachment 1
Page 53 of 77
50 American Electric Power System Retirement Plan
Towers Watson Confidential
have attained age 55.
(3) For a deferred vested participant who dies before benefits commence, a monthly benefit equal to 50% of the deferred vested benefit reduced for early commencement (as for deferred vesteds) is payable as a life annuity to a qualifying spouse. If death occurs before age 55, the benefit to the spouse is deferred to when the deceased participant would have attained age 55.
The spouse’s benefit is actuarially reduced for each year by which the spouse is more than five years younger than the participant.
For all employees, the minimum benefit is the cash balance account immediate annuity, which is also payable if the beneficiary is not the participant’s spouse.
Other Plan Provisions
Form of payment The following are available for those participants who did not work an hour of service on or after January 1, 2003:
Full lump sum payment.
Monthly payment:
Single life annuity.
50% joint annuity (spouse or other beneficiary).
A one-time option to elect a lump sum of the accrued benefit for terminated vested participants whose benefit was determined in no way by reference to either the AEP or CSW cash balance formulas was offered during the period from May 1, 2012 through June 30, 2012. Participants eligible for the window were also permitted to elect any of the other optional forms of payment generally applicable to such a participant under the normal terms of the plan document. Any participant who elected to commence benefits under this window, regardless of lump sum or annuity election, had a benefit commencement date of August 1, 2012. The following are available for those participants who work an hour of service on or after January 1, 2003:
Full lump sum payment.
Combination of partial lump sum (25%, 50% or 75% of full lump sum) with remainder paid as a monthly benefit (see below).
Monthly payment:
Single life annuity.
Joint annuities (spouse or other beneficiary).
Available in 50%, 75%, 100%.
CAD E-32 Attachment 1
Page 54 of 77
The American Electric Power System Retirement Plan 51
Towers Watson Confidential
Form of payment conversion for non-417(e) covered conversions
Cash balance 7.50% interest and the applicable 417(e) Mortality Table
Grandfathered benefit Factors as specified in Tables I, II, III and IV of Exhibit A to the American Electric Power System Retirement Plan document. 7.50% interest and the 1951 Group Annuity male mortality table to the extent not covered by Tables I, II, III and IV.
Pension Increases None.
Member Contributions None.
Maximum on benefits and pay All benefits and pay for any calendar year may not exceed the maximum limitations for that year as defined in the Internal Revenue Code. The plan provides for increasing the dollar limits automatically as such changes become effective. Increases in the dollar limits are assumed for determining pension cost but not for determining contributions.
Plan status Continuing accruals. All new entrants to plan are covered under former East plan provision.
Future Plan Changes
Towers Watson is not aware of any future plan changes that are required to be reflected.
Changes in Benefits Valued Since Prior Year
None.
CAD E-32 Attachment 1
Page 55 of 77

52 American Electric Power System Retirement Plan
Towers Watson Confidential
Appendix C : Adjusted Funding Target Attainment Percentage (AFTAP)
This section is a reproduction of selections of the AFTAP that was originally provided on March 29, 2013, and is provided here for reference.
American Electric Power (“AEP”) retained Towers Watson Pennsylvania Inc. (“Towers Watson”) to perform a valuation of its pension plan for the purpose of measuring the plan’s AFTAP for the plan year beginning January 1, 2013, in accordance with ERISA and the Internal Revenue Code. This valuation has been conducted in accordance with generally accepted actuarial principles and practices. The enrolled actuary making this certification is a member of the Society of Actuaries and other professional actuarial organizations and meets their “Qualification Standards for Actuaries Issuing Statements of Actuarial Opinion in the United States.” We previously certified that the plan’s AFTAP for the plan year beginning January 1, 2013, is 116.77%. This percentage is based on the assumptions, participant data and plan provisions we relied upon to prepare the results shown in the original certification, reflects the valuation limitations discussed therein and is also based on the following additional information:
Annuity Purchases
AEP’s representation is that there were no annuity purchases made on behalf of non-highly compensated employees participating in the plan during the plan years beginning January 1, 2011, and January 1, 2012.
Funding Balances
Our understanding is that AEP has not elected to reduce the plan’s funding balance as of the first day of the 2013 plan year.
Our understanding is that the plan is not subject to a deemed election to reduce the funding balance in 2013.
AEP has elected to increase the funding balance by $103,699,368 as of the first day of the 2013 plan year, as confirmed in the letter dated March 22, 2013.
Contributions
Our understanding is that AEP has not made any employer contributions after December 31, 2012, and before March 31, 2013, for the 2012 plan year.
CAD E-32 Attachment 1
Page 56 of 77
American Electric Power System Retirement Plan 53
Towers Watson Confidential
Events
There were no plan amendments that went into effect in the current plan year that were taken into account for the current plan year’s AFTAP certification.
There were no unpredictable contingent event benefits (UCEBs) that went into effect in the current plan year that were taken into account for the current plan year’s AFTAP certification.
There were no previously suspended accruals restored during the current plan year that were taken into account for the current plan year’s AFTAP certification.
Elections
The AFTAP certification incorporates our understanding of sponsor elections required under the Pension Protection Act of 2006 (PPA) with respect to interest rates, Actuarial Value of Assets and other methods and/or assumptions, as confirmed in AEP’s letter dated March 26, 2013.
CAD E-32 Attachment 1
Page 57 of 77

54 American Electric Power System Retirement Plan
Towers Watson Confidential
The development of AFTAP is show below:
All monetary amounts shown in US Dollars
Plan Year Beginning January 1, 2013
Actuarial value of assets as of January 1, 2013 1 4,699,409,537
Funding standard carryover balance as of January 1, 2013 2 189,814,041
Prefunding balance as of January 1, 2013 2 478,656,586
Funding target as of January 1, 2013 (disregarding at-risk assumptions) 4,024,284,946
AVA/funding target (disregarding at-risk assumptions) 116,77%
Assets for AFTAP calculation 3 4,699,409,537
Annuity purchases for NHCEs during 2011 and 2012 0
Reflection of post valuation date events not previously reflected
Increase in funding target (disregarding at-risk assumptions) for 2012 amendments/UCEBs/restored accruals 4 0
IRC §436 contributions made to enable plan amendments/UCEBs/restored accruals to take effect 5 0
Adjusted funding target, disregarding at-risk assumptions, (includes NHCE annuity purchases and amendments) 0
Adjusted assets (includes NHCE annuity purchases and IRC §436 contributions) 0
Specific AFTAP
Adjusted Funding Target Attainment Percentage (AFTAP) 116.77%
Notes
1. Reflects discounted contributions made for the 2012 plan year only if paid on or before the certification date. Includes
security posted by the beginning of the plan year in the form of a bond or cash held in escrow.
2. Reflects elections made to-date (other than elections to apply the funding balances to 2012 MRC).
3. AVA if AVA/Funding Target (disregarding at-risk assumptions) >=100%; otherwise (AVA-funding balance).
4. If went into effect before this specific certification, not reflected in funding valuation and require AFTAP recertification,
or which the plan sponsor otherwise decides to reflect in the specific AFTAP certification.
5. Discounted to January 1, 2013, using 2013 effective interest rate.
CAD E-32 Attachment 1
Page 58 of 77

American Electric Power System Retirement Plan 55
Towers Watson Confidential
Immediate Implications of AFTAP Certification
We believe that the certified AFTAP of 116.77% for the 2013 plan year has the following implications for benefit limitations described in IRC §436. AEP should review these conclusions with ERISA counsel: Benefit accruals called for under the plan without regard to IRC §436 must continue. Accelerated distributions called for under the plan without regard to IRC §436 must continue in full. Amendments that increase benefits must be evaluated at the time they would become effective to
determine if they are permissible. Plant shutdown and other unpredictable UCEBs must be evaluated at the time they would become
effective to determine if they are permissible.
Implications of 2013 AFTAP for Presumptions in 2014 Plan Year
Because the AFTAP for the 2013 plan year is at least 90%, the presumed AFTAP for 2014 will remain equal to the 2013 certified AFTAP and changes in benefit restrictions will not occur before the 2014 AFTAP is certified, provided that the 2014 AFTAPs are certified before the first day of the tenth month of the plan year.
CAD E-32 Attachment 1
Page 59 of 77

56 American Electric Power System Retirement Plan
Towers Watson Confidential
This page is intentionally blank.
CAD E-32 Attachment 1
Page 60 of 77
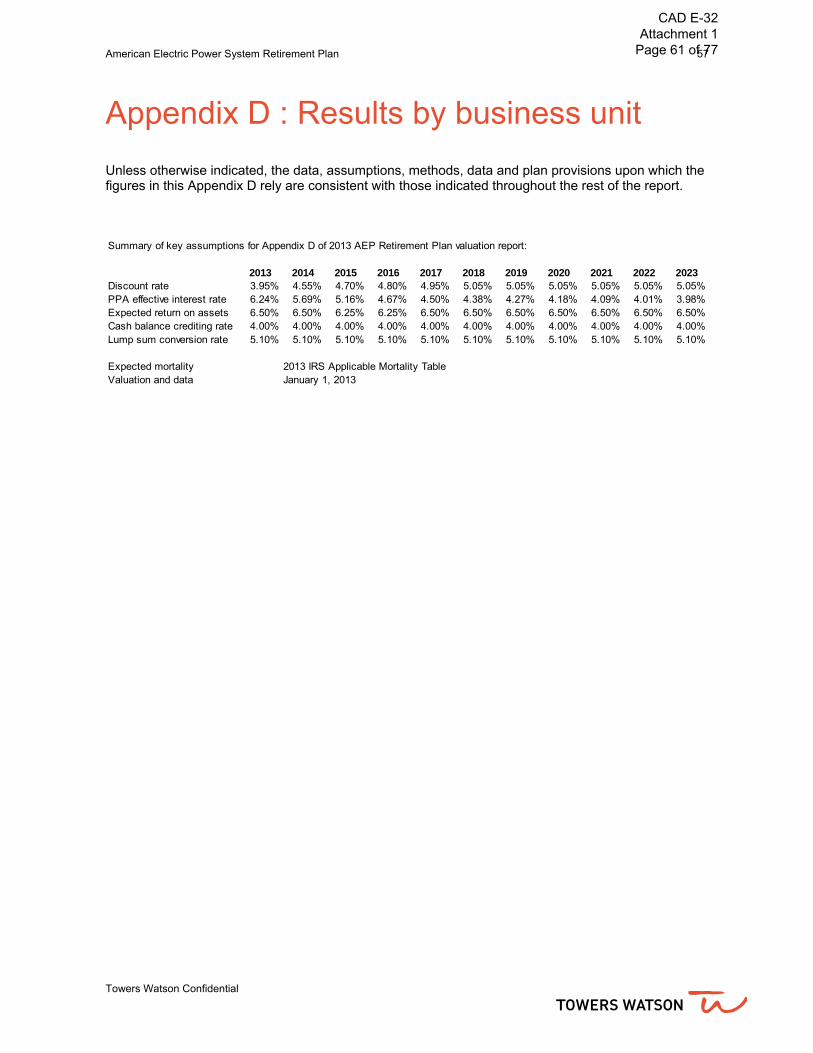
American Electric Power System Retirement Plan 57
Towers Watson Confidential
Appendix D : Results by business unit
Unless otherwise indicated, the data, assumptions, methods, data and plan provisions upon which the figures in this Appendix D rely are consistent with those indicated throughout the rest of the report. Summary of key assumptions for Appendix D of 2013 AEP Retirement Plan valuation report:
2013 2014 2015 2016 2017 2018 2019 2020 2021 2022 2023Discount rate 3.95% 4.55% 4.70% 4.80% 4.95% 5.05% 5.05% 5.05% 5.05% 5.05% 5.05%PPA effective interest rate 6.24% 5.69% 5.16% 4.67% 4.50% 4.38% 4.27% 4.18% 4.09% 4.01% 3.98%Expected return on assets 6.50% 6.50% 6.25% 6.25% 6.50% 6.50% 6.50% 6.50% 6.50% 6.50% 6.50%Cash balance crediting rate 4.00% 4.00% 4.00% 4.00% 4.00% 4.00% 4.00% 4.00% 4.00% 4.00% 4.00%Lump sum conversion rate 5.10% 5.10% 5.10% 5.10% 5.10% 5.10% 5.10% 5.10% 5.10% 5.10% 5.10%
Expected mortality 2013 IRS Applicable Mortality TableValuation and data January 1, 2013
CAD E-32 Attachment 1
Page 61 of 77

58 American Electric Power System Retirement Plan
Towers Watson Confidential
AMERICAN ELECTRIC POWERQUALIFIED RETIREMENT PLANSUMMARY OF PLAN PARTICIPANTS FOR THE 2013 VALUATION
RetireesVested Non-Vested Total Receiving Deferred Total Total
Location Actives Actives Actives Benefits Beneficiaries Vesteds Inactives Participants
140 Appalachian Power Co - Distribution 985 20 1,005 1,142 407 241 1,790 2,795 215 Appalachian Power Co - Generation 910 30 940 775 227 132 1,134 2,074 150 Appalachian Power Co - Transmission 143 5 148 114 18 30 162 310
Appalachian Power Co. - FERC 2,038 55 2,093 2,031 652 403 3,086 5,179 225 Cedar Coal Co 0 0 0 97 33 19 149 149
Appalachian Power Co. - SEC 2,038 55 2,093 2,128 685 422 3,235 5,328
211 AEP Texas Central Company - Distribution 829 20 849 888 249 354 1,491 2,340 147 AEP Texas Central Company - Generation 0 0 0 21 51 27 99 99 169 AEP Texas Central Company - Transmission 102 5 107 71 32 37 140 247
AEP Texas Central Co. 931 25 956 980 332 418 1,730 2,686
170 Indiana Michigan Power Co - Distribution 582 17 599 687 256 103 1,046 1,645 132 Indiana Michigan Power Co - Generation 375 18 393 288 89 96 473 866 190 Indiana Michigan Power Co - Nuclear 1,018 85 1,103 356 60 299 715 1,818 120 Indiana Michigan Power Co - Transmission 125 5 130 102 15 13 130 260 280 Ind Mich River Transp Lakin 266 51 317 109 42 58 209 526
Indiana Michigan Power Co. - FERC 2,366 176 2,542 1,542 462 569 2,573 5,115 202 Price River Coal 0 0 0 0 0 0 0 0
Indiana Michigan Power Co. - SEC 2,366 176 2,542 1,542 462 569 2,573 5,115
110 Kentucky Power Co - Distribution 229 11 240 194 70 57 321 561 117 Kentucky Power Co - Generation 100 0 100 93 23 35 151 251 180 Kentucky Power Co - Transmission 38 2 40 10 0 5 15 55
Kentucky Power Co. 367 13 380 297 93 97 487 867
104 Cardinal Operating Company 283 28 311 188 51 22 261 572 270 Cook Coal Terminal 14 0 14 12 2 3 17 31 250 Ohio Power Co - Distribution 1,411 65 1,476 1,801 472 279 2,552 4,028 181 Ohio Power Co - Generation 983 27 1,010 1,354 376 315 2,045 3,055 160 Ohio Power Co - Transmission 226 6 232 205 64 27 296 528
Ohio Power Co. - FERC 2,917 126 3,043 3,560 965 646 5,171 8,214 290 Conesville Coal Preparation Company 0 0 0 11 0 2 13 13
Ohio Power Co. - SEC 2,917 126 3,043 3,571 965 648 5,184 8,227
167 Public Service Co of Oklahoma - Distribution 617 32 649 453 197 161 811 1,460 198 Public Service Co of Oklahoma - Generation 325 29 354 176 73 68 317 671 114 Public Service Co of Oklahoma - Transmission 72 5 77 52 18 21 91 168
Public Service Co. of Oklahoma 1,014 66 1,080 681 288 250 1,219 2,299
159 Southwestern Electric Power Co - Distribution 493 38 531 182 101 70 353 884 168 Southwestern Electric Power Co - Generation 477 85 562 196 82 56 334 896 161 Southwestern Electric Power Co - Texas - Distribution 214 12 226 96 42 44 182 408 111 Southwestern Electric Power Co - Texas - Transmission 0 0 0 0 3 0 3 3 194 Southwestern Electric Power Co - Transmission 70 11 81 35 11 15 61 142
Southwestern Electric Power Co. 1,254 146 1,400 509 239 185 933 2,333
119 AEP Texas North Company - Distribution 245 6 251 169 81 97 347 598 166 AEP Texas North Company - Generation 0 0 0 106 50 32 188 188 192 AEP Texas North Company - Transmission 54 5 59 25 10 4 39 98
AEP Texas North Co. 299 11 310 300 141 133 574 884
230 Kingsport Power Co - Distribution 39 1 40 47 18 7 72 112 260 Kingsport Power Co - Transmission 12 0 12 8 1 2 11 23
Kingsport Power Co. 51 1 52 55 19 9 83 135
210 Wheeling Power Co - Distribution 49 0 49 56 30 7 93 142 200 Wheeling Power Co - Transmission 0 0 0 3 8 0 11 11
Wheeling Power Co. 49 0 49 59 38 7 104 153
103 American Electric Power Service Corporation 4,434 205 4,639 2,431 459 1,322 4,212 8,851 American Electric Power Service Corp 4,434 205 4,639 2,431 459 1,322 4,212 8,851
143 AEP Pro Serv, Inc. 0 0 0 1 0 2 3 3 171 CSW Energy, Inc. 28 2 30 3 1 22 26 56 293 Elmwood 98 3 101 5 0 17 22 123 292 AEP River Operations LLC 698 239 937 8 0 117 125 1,062 189 Central Coal Company 0 0 0 0 0 0 0 0 400 AEP Energy, Inc. 10 9 19 0 0 0 0 19
Miscellaneous 834 253 1,087 17 1 158 176 1,263
Total 16,554 1,077 17,631 12,570 3,722 4,218 20,510 38,141
CAD E-32 Attachment 1
Page 62 of 77
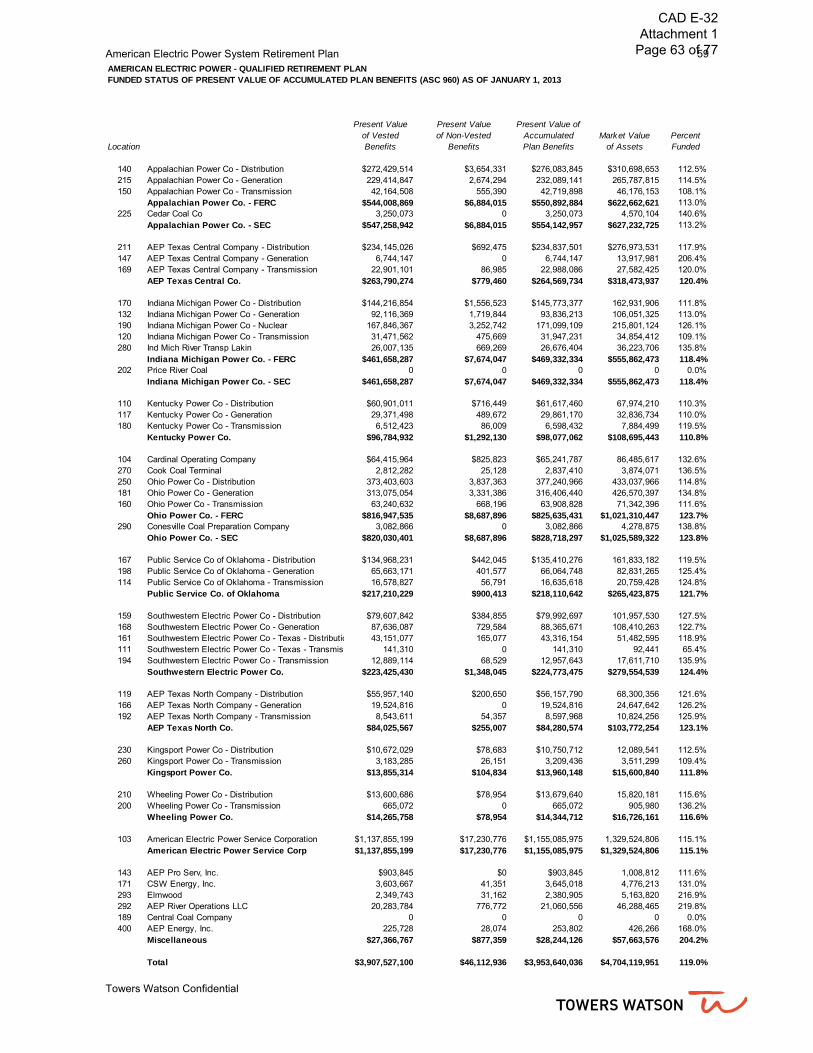
American Electric Power System Retirement Plan 59
Towers Watson Confidential
AMERICAN ELECTRIC POWER - QUALIFIED RETIREMENT PLANFUNDED STATUS OF PRESENT VALUE OF ACCUMULATED PLAN BENEFITS (ASC 960) AS OF JANUARY 1, 2013
Present Value Present Value Present Value ofof Vested of Non-Vested Accumulated Market Value Percent
Location Benefits Benefits Plan Benefits of Assets Funded
140 Appalachian Power Co - Distribution $272,429,514 $3,654,331 $276,083,845 $310,698,653 112.5%215 Appalachian Power Co - Generation 229,414,847 2,674,294 232,089,141 265,787,815 114.5%150 Appalachian Power Co - Transmission 42,164,508 555,390 42,719,898 46,176,153 108.1%
Appalachian Power Co. - FERC $544,008,869 $6,884,015 $550,892,884 $622,662,621 113.0%225 Cedar Coal Co 3,250,073 0 3,250,073 4,570,104 140.6%
Appalachian Power Co. - SEC $547,258,942 $6,884,015 $554,142,957 $627,232,725 113.2%
211 AEP Texas Central Company - Distribution $234,145,026 $692,475 $234,837,501 $276,973,531 117.9%147 AEP Texas Central Company - Generation 6,744,147 0 6,744,147 13,917,981 206.4%169 AEP Texas Central Company - Transmission 22,901,101 86,985 22,988,086 27,582,425 120.0%
AEP Texas Central Co. $263,790,274 $779,460 $264,569,734 $318,473,937 120.4%
170 Indiana Michigan Power Co - Distribution $144,216,854 $1,556,523 $145,773,377 162,931,906 111.8%132 Indiana Michigan Power Co - Generation 92,116,369 1,719,844 93,836,213 106,051,325 113.0%190 Indiana Michigan Power Co - Nuclear 167,846,367 3,252,742 171,099,109 215,801,124 126.1%120 Indiana Michigan Power Co - Transmission 31,471,562 475,669 31,947,231 34,854,412 109.1%280 Ind Mich River Transp Lakin 26,007,135 669,269 26,676,404 36,223,706 135.8%
Indiana Michigan Power Co. - FERC $461,658,287 $7,674,047 $469,332,334 $555,862,473 118.4%202 Price River Coal 0 0 0 0 0.0%
Indiana Michigan Power Co. - SEC $461,658,287 $7,674,047 $469,332,334 $555,862,473 118.4%
110 Kentucky Power Co - Distribution $60,901,011 $716,449 $61,617,460 67,974,210 110.3%117 Kentucky Power Co - Generation 29,371,498 489,672 29,861,170 32,836,734 110.0%180 Kentucky Power Co - Transmission 6,512,423 86,009 6,598,432 7,884,499 119.5%
Kentucky Power Co. $96,784,932 $1,292,130 $98,077,062 $108,695,443 110.8%
104 Cardinal Operating Company $64,415,964 $825,823 $65,241,787 86,485,617 132.6%270 Cook Coal Terminal 2,812,282 25,128 2,837,410 3,874,071 136.5%250 Ohio Power Co - Distribution 373,403,603 3,837,363 377,240,966 433,037,966 114.8%181 Ohio Power Co - Generation 313,075,054 3,331,386 316,406,440 426,570,397 134.8%160 Ohio Power Co - Transmission 63,240,632 668,196 63,908,828 71,342,396 111.6%
Ohio Power Co. - FERC $816,947,535 $8,687,896 $825,635,431 $1,021,310,447 123.7%290 Conesville Coal Preparation Company 3,082,866 0 3,082,866 4,278,875 138.8%
Ohio Power Co. - SEC $820,030,401 $8,687,896 $828,718,297 $1,025,589,322 123.8%
167 Public Service Co of Oklahoma - Distribution $134,968,231 $442,045 $135,410,276 161,833,182 119.5%198 Public Service Co of Oklahoma - Generation 65,663,171 401,577 66,064,748 82,831,265 125.4%114 Public Service Co of Oklahoma - Transmission 16,578,827 56,791 16,635,618 20,759,428 124.8%
Public Service Co. of Oklahoma $217,210,229 $900,413 $218,110,642 $265,423,875 121.7%
159 Southwestern Electric Power Co - Distribution $79,607,842 $384,855 $79,992,697 101,957,530 127.5%168 Southwestern Electric Power Co - Generation 87,636,087 729,584 88,365,671 108,410,263 122.7%161 Southwestern Electric Power Co - Texas - Distributio 43,151,077 165,077 43,316,154 51,482,595 118.9%111 Southwestern Electric Power Co - Texas - Transmiss 141,310 0 141,310 92,441 65.4%194 Southwestern Electric Power Co - Transmission 12,889,114 68,529 12,957,643 17,611,710 135.9%
Southwestern Electric Power Co. $223,425,430 $1,348,045 $224,773,475 $279,554,539 124.4%
119 AEP Texas North Company - Distribution $55,957,140 $200,650 $56,157,790 68,300,356 121.6%166 AEP Texas North Company - Generation 19,524,816 0 19,524,816 24,647,642 126.2%192 AEP Texas North Company - Transmission 8,543,611 54,357 8,597,968 10,824,256 125.9%
AEP Texas North Co. $84,025,567 $255,007 $84,280,574 $103,772,254 123.1%
230 Kingsport Power Co - Distribution $10,672,029 $78,683 $10,750,712 12,089,541 112.5%260 Kingsport Power Co - Transmission 3,183,285 26,151 3,209,436 3,511,299 109.4%
Kingsport Power Co. $13,855,314 $104,834 $13,960,148 $15,600,840 111.8%
210 Wheeling Power Co - Distribution $13,600,686 $78,954 $13,679,640 15,820,181 115.6%200 Wheeling Power Co - Transmission 665,072 0 665,072 905,980 136.2%
Wheeling Power Co. $14,265,758 $78,954 $14,344,712 $16,726,161 116.6%
103 American Electric Power Service Corporation $1,137,855,199 $17,230,776 $1,155,085,975 1,329,524,806 115.1%American Electric Power Service Corp $1,137,855,199 $17,230,776 $1,155,085,975 $1,329,524,806 115.1%
143 AEP Pro Serv, Inc. $903,845 $0 $903,845 1,008,812 111.6%171 CSW Energy, Inc. 3,603,667 41,351 3,645,018 4,776,213 131.0%293 Elmwood 2,349,743 31,162 2,380,905 5,163,820 216.9%292 AEP River Operations LLC 20,283,784 776,772 21,060,556 46,288,465 219.8%189 Central Coal Company 0 0 0 0 0.0%400 AEP Energy, Inc. 225,728 28,074 253,802 426,266 168.0%
Miscellaneous $27,366,767 $877,359 $28,244,126 $57,663,576 204.2%
Total $3,907,527,100 $46,112,936 $3,953,640,036 $4,704,119,951 119.0%
CAD E-32 Attachment 1
Page 63 of 77

60 American Electric Power System Retirement Plan
Towers Watson Confidential
AMERICAN ELECTRIC POWER - QUALIFIED RETIREMENT PLANSUMMARY OF ASC 715-30 VALUATION RESULTS AS OF JANUARY 1, 2013
Accumulated Projected January 1, 2013Valuation Market-Related Fair Value Benefit Benefit Pre-Tax
Location Earnings Value of Assets of Assets Obligation Obligation AOCI
140 Appalachian Power Co - Distribution $83,453,196 $290,426,971 $310,698,653 $352,224,499 $356,015,564 $157,850,367215 Appalachian Power Co - Generation 80,650,270 248,446,362 265,787,815 297,703,498 302,154,519 116,457,824150 Appalachian Power Co - Transmission 12,829,096 43,163,368 46,176,153 55,255,666 55,899,993 20,867,312
Appalachian Power Co. - FERC $176,932,562 $582,036,701 $622,662,621 $705,183,663 $714,070,076 $295,175,503225 Cedar Coal Co 0 4,271,925 4,570,103 3,977,605 3,977,605 3,150,433
Appalachian Power Co. - SEC $176,932,562 $586,308,626 $627,232,724 $709,161,268 $718,047,681 $298,325,936
211 AEP Texas Central Company - Distribution $69,268,299 $258,902,261 $276,973,531 $292,074,607 $301,201,723 $161,305,248147 AEP Texas Central Company - Generation 0 13,009,896 13,917,981 8,058,001 8,058,001 (5,859,980)169 AEP Texas Central Company - Transmission 9,171,479 25,782,797 27,582,425 28,634,747 29,784,458 19,195,783
AEP Texas Central Co. 78,439,778$ 297,694,954$ 318,473,937$ 328,767,355$ 339,044,182$ 174,641,051$
170 Indiana Michigan Power Co - Distribution $49,009,699 $152,301,336 $162,931,905 $184,377,661 $187,660,109 $81,918,746132 Indiana Michigan Power Co - Generation 34,911,015 99,131,956 106,051,325 121,402,199 122,521,768 43,672,545190 Indiana Michigan Power Co - Nuclear 110,303,278 201,721,077 215,801,124 226,068,435 232,804,570 59,522,596120 Indiana Michigan Power Co - Transmission 11,239,439 32,580,319 34,854,412 41,042,199 41,849,984 16,471,108280 Ind Mich River Transp Lakin 21,853,362 33,860,273 36,223,706 34,893,430 37,117,633 9,192,809
Indiana Michigan Power Co. - FERC $227,316,793 $519,594,961 $555,862,472 $607,783,924 $621,954,064 $210,777,804202 Price River Coal 0 0 0 0 0 389,867
Indiana Michigan Power Co. - SEC $227,316,793 $519,594,961 $555,862,472 $607,783,924 $621,954,064 $211,167,671
110 Kentucky Power Co - Distribution $20,126,560 $63,539,200 $67,974,209 $79,309,161 $80,098,595 $30,073,749117 Kentucky Power Co - Generation 8,848,893 30,694,286 32,836,735 38,931,754 39,238,018 14,393,321180 Kentucky Power Co - Transmission 3,410,204 7,370,071 7,884,499 8,824,275 8,984,302 2,480,937
Kentucky Power Co. $32,385,657 $101,603,557 $108,695,443 $127,065,190 $128,320,915 $46,948,007
104 Cardinal Operating Company $25,894,050 $80,842,822 $86,485,617 $83,814,768 $85,290,814 ($1,194,803)270 Cook Coal Terminal 1,382,467 3,621,305 3,874,071 3,574,755 3,714,387 690,512250 Ohio Power Co - Distribution 115,843,655 404,784,198 433,037,967 474,849,852 484,325,650 245,577,968181 Ohio Power Co - Generation 86,348,919 398,738,608 426,570,396 403,020,385 407,782,109 204,147,661160 Ohio Power Co - Transmission 19,751,139 66,687,627 71,342,396 81,226,779 82,744,820 40,561,542
Ohio Power Co. - FERC $249,220,230 $954,674,560 $1,021,310,447 $1,046,486,539 $1,063,857,780 $489,782,880290 Conesville Coal Preparation Company 0 3,999,698 4,278,875 3,889,724 3,889,724 1,126,494
Ohio Power Co. - SEC $249,220,230 $958,674,258 $1,025,589,322 $1,050,376,263 $1,067,747,504 $490,909,374
167 Public Service Co of Oklahoma - Distribution $53,379,152 $151,274,299 $161,833,182 $167,523,293 $174,659,697 $84,115,079198 Public Service Co of Oklahoma - Generation 31,421,674 77,426,900 82,831,266 81,316,133 84,793,069 33,102,484114 Public Service Co of Oklahoma - Transmission 6,843,510 19,404,969 20,759,427 20,603,164 21,403,268 8,797,113
Public Service Co. of Oklahoma $91,644,336 $248,106,168 $265,423,875 $269,442,590 $280,856,034 $126,014,676
159 Southwestern Electric Power Co - Distribution $43,489,066 $95,305,262 $101,957,529 $99,012,502 $105,366,897 $50,524,695168 Southwestern Electric Power Co - Generation 48,500,651 101,336,984 108,410,263 108,965,343 113,704,753 45,934,388161 Southwestern Electric Power Co - Texas - Distribution 18,251,398 48,123,589 51,482,596 53,372,485 55,539,665 26,920,044111 Southwestern Electric Power Co - Texas - Transmission 0 86,410 92,441 160,412 160,412 926,648194 Southwestern Electric Power Co - Transmission 7,026,635 16,462,626 17,611,710 16,173,027 17,012,007 6,062,957
Southwestern Electric Power Co. $117,267,750 $261,314,871 $279,554,539 $277,683,769 $291,783,734 $130,368,732
119 AEP Texas North Company - Distribution $20,728,284 $63,844,067 $68,300,356 $68,878,696 $71,222,835 $35,588,674166 AEP Texas North Company - Generation 0 23,039,495 24,647,642 23,915,680 23,915,680 19,630,313192 AEP Texas North Company - Transmission 5,044,668 10,118,022 10,824,255 10,604,290 11,303,319 5,229,839
AEP Texas North Co. $25,772,952 $97,001,584 $103,772,253 $103,398,666 $106,441,834 $60,448,826
230 Kingsport Power Co - Distribution $3,108,202 $11,300,753 $12,089,541 $13,730,047 $13,877,519 $6,557,221260 Kingsport Power Co - Transmission 987,763 3,282,203 3,511,299 4,060,752 4,136,355 1,623,726
Kingsport Power Co. $4,095,965 $14,582,956 $15,600,840 $17,790,799 $18,013,874 $8,180,947
210 Wheeling Power Co - Distribution $3,873,319 $14,787,986 $15,820,181 $17,329,189 $17,544,397 $8,919,033200 Wheeling Power Co - Transmission 0 846,869 905,980 766,115 766,115 712,793
Wheeling Power Co. $3,873,319 $15,634,855 $16,726,161 $18,095,304 $18,310,512 $9,631,826
103 American Electric Power Service Corporation 484,542,281 $1,242,779,324 $1,329,524,809 $1,482,506,270 $1,522,509,761 $552,788,499American Electric Power Service Corp $484,542,281 $1,242,779,324 $1,329,524,809 $1,482,506,270 $1,522,509,761 $552,788,499
143 AEP Pro Serv, Inc. $0 $942,992 $1,008,812 $1,201,854 $1,201,854 $171,877171 CSW Energy, Inc. 4,463,421 4,464,587 4,776,213 5,106,971 5,880,340 4,757,353293 Elmwood 4,967,138 4,826,904 5,163,820 3,127,499 3,467,643 (1,719,198)292 AEP River Operations LLC 71,197,827 43,268,352 46,288,465 27,868,357 34,955,602 (3,364,866)189 Central Coal Company 0 0 0 0 0 3,979400 AEP Energy, Inc. 1,546,346 398,454 426,266 382,748 382,748 0
Miscellaneous 82,174,732$ 53,901,289$ 57,663,576$ 37,687,429$ 45,888,187$ (150,855)$
Total 1,573,666,355$ 4,397,197,403$ 4,704,119,951$ 5,029,758,827$ 5,158,918,282$ 2,109,274,690$
CAD E-32 Attachment 1
Page 64 of 77

American Electric Power System Retirement Plan 61
Towers Watson Confidential
ASC 715-30Cost2013 2014 2015 2016 2017 2018 2019 2020 2021 2022 2023
Location
140 Appalachian Power Co - Distribution $10,710,667 $7,273,901 $5,840,051 $2,001,947 ($601,334) ($1,660,588) ($2,341,866) ($3,118,760) ($3,895,278) ($4,622,617) ($5,373,403)215 Appalachian Power Co - Generation 9,522,597 6,444,187 5,136,077 4,101,195 2,064,840 1,282,174 789,881 272,628 (233,748) (694,980) (1,141,660)150 Appalachian Power Co - Transmission 1,744,624 1,180,190 930,913 388,578 (21,348) (192,288) (309,092) (401,832) (501,583) (570,720) (658,873)
Appalachian Power Co. - FERC 21,977,888 14,898,278 11,907,041 6,491,720 1,442,158 (570,702) (1,861,077) (3,247,964) (4,630,609) (5,888,317) (7,173,936)225 Cedar Coal Co 20,836 (14,903) (25,807) (41,069) (68,496) (76,366) (81,953) (87,528) (93,226) (99,364) (105,730)
Appalachian Power Co. - SEC 21,998,724 14,883,375 11,881,234 6,450,651 1,373,662 (647,068) (1,943,030) (3,335,492) (4,723,835) (5,987,681) (7,279,666)
211 AEP Texas Central Company - Distribution 10,362,286 7,317,488 6,683,000 5,867,507 3,745,101 3,119,708 2,744,801 2,287,809 1,889,028 1,564,634 1,193,321147 AEP Texas Central Company - Generation (233,482) (347,516) (394,133) (461,720) (542,802) (540,030) (555,611) (593,280) (614,705) (636,385) (677,877)169 AEP Texas Central Company - Transmission 1,169,784 862,177 819,287 751,480 543,510 480,399 428,396 369,397 307,948 251,960 192,530
AEP Texas Central Co. 11,298,588 7,832,149 7,108,154 6,157,267 3,745,809 3,060,077 2,617,586 2,063,926 1,582,271 1,180,209 707,974
170 Indiana Michigan Power Co - Distribution 5,944,834 4,202,003 3,496,186 1,520,218 191,506 (315,464) (637,488) (1,015,082) (1,383,025) (1,742,886) (2,131,692)132 Indiana Michigan Power Co - Generation 3,874,281 2,602,388 2,000,138 1,551,774 675,408 313,315 67,543 (173,522) (411,089) (617,961) (829,281)190 Indiana Michigan Power Co - Nuclear 9,060,520 6,265,215 5,572,069 4,644,802 2,657,269 1,706,717 931,012 163,217 (583,948) (1,269,151) (1,881,969)120 Indiana Michigan Power Co - Transmission 1,386,445 979,692 804,940 367,962 66,539 (51,791) (132,320) (217,288) (300,828) (379,352) (457,820)280 Ind Mich River Transp Lakin 1,560,378 1,110,499 1,010,841 864,743 548,977 393,946 291,323 171,158 61,047 (55,547) (171,998)
Indiana Michigan Power Co. - FERC 21,826,458 15,159,797 12,884,174 8,949,499 4,139,699 2,046,723 520,070 (1,071,517) (2,617,843) (4,064,897) (5,472,760)202 Price River Coal 32 32 5 0 0 0 0 0 0 0 0
Indiana Michigan Power Co. - SEC 21,826,490 15,159,829 12,884,179 8,949,499 4,139,699 2,046,723 520,070 (1,071,517) (2,617,843) (4,064,897) (5,472,760)
110 Kentucky Power Co - Distribution 2,532,324 1,741,791 1,374,030 431,274 (189,511) (457,270) (641,253) (828,870) (1,014,174) (1,188,134) (1,329,779)117 Kentucky Power Co - Generation 1,212,219 801,637 613,862 175,595 (131,690) (261,708) (351,702) (442,774) (532,032) (610,147) (691,638)180 Kentucky Power Co - Transmission 313,374 207,542 151,958 112,468 35,184 (3,175) (29,723) (57,923) (87,251) (113,914) (140,318)
Kentucky Power Co. 4,057,917 2,750,970 2,139,850 719,337 (286,017) (722,153) (1,022,678) (1,329,567) (1,633,457) (1,912,195) (2,161,735)
104 Cardinal Operating Company 2,198,975 1,350,481 1,101,939 771,871 123,384 (130,518) (319,895) (524,919) (725,799) (908,274) (1,081,500)270 Cook Coal Terminal 106,821 67,407 55,547 39,256 5,182 (11,990) 1,918 (9,958) (10,788) (23,900) (37,491)250 Ohio Power Co - Distribution 14,644,677 10,067,739 8,264,695 6,853,439 3,879,583 2,860,528 2,242,481 1,607,506 1,047,429 436,563 (132,548)181 Ohio Power Co - Generation 7,970,913 3,959,145 2,731,254 1,108,599 (1,938,725) (3,151,438) (3,979,899) (4,908,020) (5,839,133) (6,685,066) (7,587,319)160 Ohio Power Co - Transmission 2,580,193 1,775,842 1,467,688 654,427 71,704 (145,578) (295,189) (414,896) (565,735) (713,097) (858,020)
Ohio Power Co. - FERC 27,501,579 17,220,614 13,621,123 9,427,592 2,141,128 (578,996) (2,350,584) (4,250,287) (6,094,026) (7,893,774) (9,696,878)290 Conesville Coal Preparation Company 32,065 (3,967) (14,566) (28,854) (55,682) (65,970) (73,420) (80,721) (88,486) (97,815) (108,018)
Ohio Power Co. - SEC 27,533,644 17,216,647 13,606,557 9,398,738 2,085,446 (644,966) (2,424,004) (4,331,008) (6,182,512) (7,991,589) (9,804,896)
167 Public Service Co of Oklahoma - Distribution 6,741,417 4,919,999 4,629,396 4,219,083 3,009,579 2,612,697 2,394,413 2,113,933 1,794,207 1,554,988 1,248,098198 Public Service Co of Oklahoma - Generation 3,373,819 2,403,010 2,283,352 2,074,257 1,388,555 1,170,935 1,050,971 878,814 709,061 529,496 352,028114 Public Service Co of Oklahoma - Transmission 779,499 539,536 496,065 441,119 291,759 231,352 189,841 164,563 119,156 76,228 38,275
Public Service Co. of Oklahoma 10,894,735 7,862,545 7,408,813 6,734,459 4,689,893 4,014,984 3,635,225 3,157,310 2,622,424 2,160,712 1,638,401
159 Southwestern Electric Power Co - Distribution 4,456,592 3,231,776 3,057,142 2,797,821 1,934,306 1,595,509 1,394,185 1,114,440 829,272 576,519 325,637168 Southwestern Electric Power Co - Generation 5,043,423 3,716,033 3,599,443 3,341,664 2,453,756 2,143,694 1,951,171 1,692,869 1,411,808 1,183,589 940,408161 Southwestern Electric Power Co - Texas - Distribution 2,264,160 1,698,029 1,618,836 1,524,199 1,115,166 1,005,301 915,915 822,956 717,564 606,218 500,941111 Southwestern Electric Power Co - Texas - Transmission 6,359 5,995 (6,667) (7,285) (8,689) (9,128) (9,577) (10,117) (10,756) (11,512) (12,374)194 Southwestern Electric Power Co - Transmission 651,893 491,339 464,733 425,658 290,651 237,805 201,577 152,209 98,317 46,712 (5,606)
Southwestern Electric Power Co. 12,422,427 9,143,172 8,733,487 8,082,057 5,785,190 4,973,181 4,453,271 3,772,357 3,046,205 2,401,526 1,749,006
119 AEP Texas North Company - Distribution 2,614,843 1,854,027 1,783,180 1,607,244 1,070,165 889,534 765,755 685,434 544,976 412,419 276,776166 AEP Texas North Company - Generation 298,424 87,213 21,928 (57,631) (188,240) (219,546) (236,673) (252,702) (268,747) (282,893) (296,476)192 AEP Texas North Company - Transmission 504,085 360,513 335,214 300,878 200,923 198,091 173,756 145,395 118,797 94,325 67,438
AEP Texas North Co. 3,417,352 2,301,753 2,140,322 1,850,491 1,082,848 868,079 702,838 578,127 395,026 223,851 47,738
230 Kingsport Power Co - Distribution 428,154 294,501 241,201 110,460 12,275 (24,303) (47,170) (71,840) (96,585) (120,360) (144,089)260 Kingsport Power Co - Transmission 132,795 93,047 79,032 43,162 16,705 7,958 2,516 (3,122) (9,138) (15,970) (21,493)
Kingsport Power Co. 560,949 387,548 320,233 153,622 28,980 (16,345) (44,654) (74,962) (105,723) (136,330) (165,582)
210 Wheeling Power Co - Distribution 523,525 346,711 271,127 213,583 104,711 58,095 31,002 3,935 (24,889) (52,060) (76,911)200 Wheeling Power Co - Transmission 2,496 (2,943) (3,383) (4,689) (8,182) (8,217) (7,976) (7,899) (8,028) (8,428) (9,065)
Wheeling Power Co. 526,021 343,768 267,744 208,894 96,529 49,878 23,026 (3,964) (32,917) (60,488) (85,976)
103 American Electric Power Service Corporation 53,220,412 37,769,958 30,585,866 25,489,388 14,766,856 10,612,679 7,845,810 4,850,269 1,876,201 (801,276) (3,506,153)American Electric Power Service Corp 53,220,412 37,769,958 30,585,866 25,489,388 14,766,856 10,612,679 7,845,810 4,850,269 1,876,201 (801,276) (3,506,153)
143 AEP Pro Serv, Inc. 28,233 17,616 13,935 7,051 (314) (4,183) (7,368) (10,515) (13,659) (16,875) (19,443)171 CSW Energy, Inc. 392,813 317,462 275,771 250,503 192,164 178,709 149,096 115,100 82,740 49,561 15,270293 Elmwood 289,916 246,201 248,607 238,914 185,818 150,828 120,004 85,875 49,213 11,562 (26,514)292 AEP River Operations LLC 4,278,406 3,868,272 3,947,502 3,910,035 3,407,313 3,081,952 2,785,259 2,405,056 2,001,650 1,661,078 1,283,041189 Central Coal Company 0 0 0 0 0 0 0 0 0 0 0400 AEP Energy, Inc. 27,950 (2,119) (4,450) (7,283) (11,538) (13,794) (15,814) (17,847) (19,769) (21,737) (23,638)
Miscellaneous 5,017,318 4,447,432 4,481,365 4,399,220 3,773,443 3,393,512 3,031,177 2,577,669 2,100,175 1,683,589 1,228,716
Total $172,774,577 $120,099,146 $101,557,804 $78,593,623 $41,282,338 $26,988,581 $17,394,637 $6,853,148 ($3,673,985) ($13,304,569) ($23,104,933)
Estimated Net Periodic Pension Cost
CAD E-32 Attachment 1
Page 65 of 77
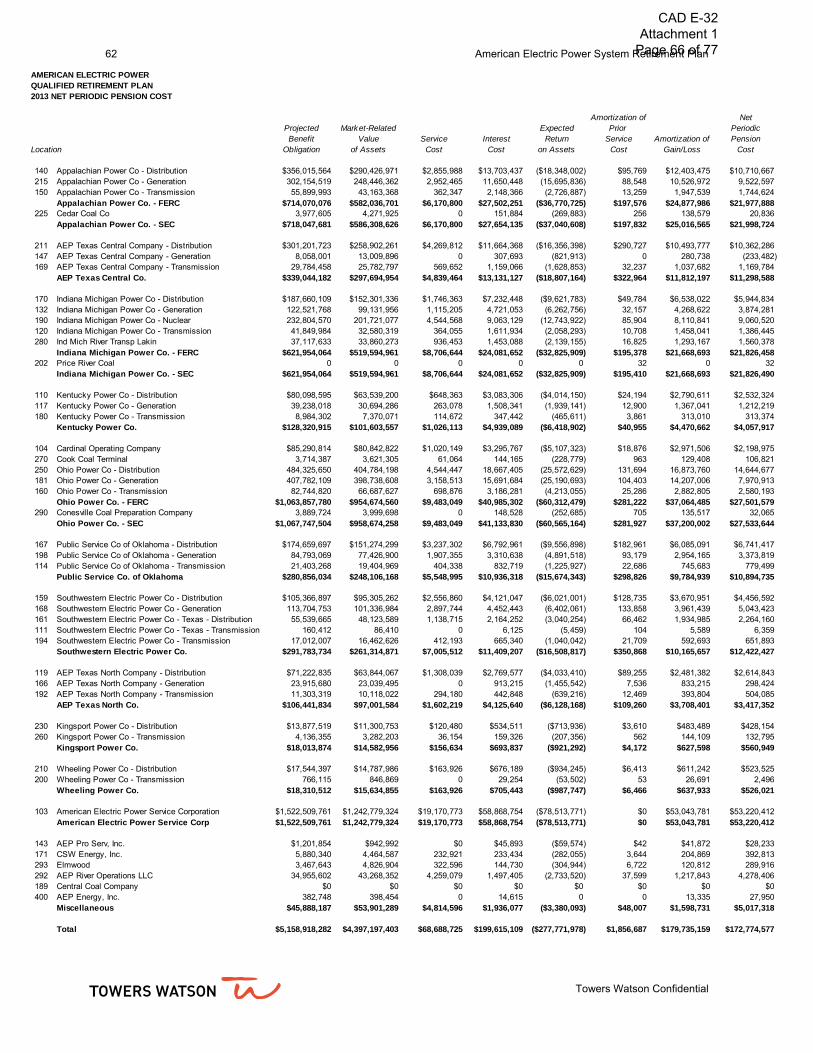
62 American Electric Power System Retirement Plan
Towers Watson Confidential
AMERICAN ELECTRIC POWER QUALIFIED RETIREMENT PLAN2013 NET PERIODIC PENSION COST
Amortization of NetProjected Market-Related Expected Prior PeriodicBenefit Value Service Interest Return Service Amortization of Pension
Location Obligation of Assets Cost Cost on Assets Cost Gain/Loss Cost
140 Appalachian Power Co - Distribution $356,015,564 $290,426,971 $2,855,988 $13,703,437 ($18,348,002) $95,769 $12,403,475 $10,710,667215 Appalachian Power Co - Generation 302,154,519 248,446,362 2,952,465 11,650,448 (15,695,836) 88,548 10,526,972 9,522,597150 Appalachian Power Co - Transmission 55,899,993 43,163,368 362,347 2,148,366 (2,726,887) 13,259 1,947,539 1,744,624
Appalachian Power Co. - FERC $714,070,076 $582,036,701 $6,170,800 $27,502,251 ($36,770,725) $197,576 $24,877,986 $21,977,888225 Cedar Coal Co 3,977,605 4,271,925 0 151,884 (269,883) 256 138,579 20,836
Appalachian Power Co. - SEC $718,047,681 $586,308,626 $6,170,800 $27,654,135 ($37,040,608) $197,832 $25,016,565 $21,998,724
211 AEP Texas Central Company - Distribution $301,201,723 $258,902,261 $4,269,812 $11,664,368 ($16,356,398) $290,727 $10,493,777 $10,362,286147 AEP Texas Central Company - Generation 8,058,001 13,009,896 0 307,693 (821,913) 0 280,738 (233,482)169 AEP Texas Central Company - Transmission 29,784,458 25,782,797 569,652 1,159,066 (1,628,853) 32,237 1,037,682 1,169,784
AEP Texas Central Co. $339,044,182 $297,694,954 $4,839,464 $13,131,127 ($18,807,164) $322,964 $11,812,197 $11,298,588
170 Indiana Michigan Power Co - Distribution $187,660,109 $152,301,336 $1,746,363 $7,232,448 ($9,621,783) $49,784 $6,538,022 $5,944,834132 Indiana Michigan Power Co - Generation 122,521,768 99,131,956 1,115,205 4,721,053 (6,262,756) 32,157 4,268,622 3,874,281190 Indiana Michigan Power Co - Nuclear 232,804,570 201,721,077 4,544,568 9,063,129 (12,743,922) 85,904 8,110,841 9,060,520120 Indiana Michigan Power Co - Transmission 41,849,984 32,580,319 364,055 1,611,934 (2,058,293) 10,708 1,458,041 1,386,445280 Ind Mich River Transp Lakin 37,117,633 33,860,273 936,453 1,453,088 (2,139,155) 16,825 1,293,167 1,560,378
Indiana Michigan Power Co. - FERC $621,954,064 $519,594,961 $8,706,644 $24,081,652 ($32,825,909) $195,378 $21,668,693 $21,826,458202 Price River Coal 0 0 0 0 0 32 0 32
Indiana Michigan Power Co. - SEC $621,954,064 $519,594,961 $8,706,644 $24,081,652 ($32,825,909) $195,410 $21,668,693 $21,826,490
110 Kentucky Power Co - Distribution $80,098,595 $63,539,200 $648,363 $3,083,306 ($4,014,150) $24,194 $2,790,611 $2,532,324117 Kentucky Power Co - Generation 39,238,018 30,694,286 263,078 1,508,341 (1,939,141) 12,900 1,367,041 1,212,219180 Kentucky Power Co - Transmission 8,984,302 7,370,071 114,672 347,442 (465,611) 3,861 313,010 313,374
Kentucky Power Co. $128,320,915 $101,603,557 $1,026,113 $4,939,089 ($6,418,902) $40,955 $4,470,662 $4,057,917
104 Cardinal Operating Company $85,290,814 $80,842,822 $1,020,149 $3,295,767 ($5,107,323) $18,876 $2,971,506 $2,198,975270 Cook Coal Terminal 3,714,387 3,621,305 61,064 144,165 (228,779) 963 129,408 106,821250 Ohio Power Co - Distribution 484,325,650 404,784,198 4,544,447 18,667,405 (25,572,629) 131,694 16,873,760 14,644,677181 Ohio Power Co - Generation 407,782,109 398,738,608 3,158,513 15,691,684 (25,190,693) 104,403 14,207,006 7,970,913160 Ohio Power Co - Transmission 82,744,820 66,687,627 698,876 3,186,281 (4,213,055) 25,286 2,882,805 2,580,193
Ohio Power Co. - FERC $1,063,857,780 $954,674,560 $9,483,049 $40,985,302 ($60,312,479) $281,222 $37,064,485 $27,501,579290 Conesville Coal Preparation Company 3,889,724 3,999,698 0 148,528 (252,685) 705 135,517 32,065
Ohio Power Co. - SEC $1,067,747,504 $958,674,258 $9,483,049 $41,133,830 ($60,565,164) $281,927 $37,200,002 $27,533,644
167 Public Service Co of Oklahoma - Distribution $174,659,697 $151,274,299 $3,237,302 $6,792,961 ($9,556,898) $182,961 $6,085,091 $6,741,417198 Public Service Co of Oklahoma - Generation 84,793,069 77,426,900 1,907,355 3,310,638 (4,891,518) 93,179 2,954,165 3,373,819114 Public Service Co of Oklahoma - Transmission 21,403,268 19,404,969 404,338 832,719 (1,225,927) 22,686 745,683 779,499
Public Service Co. of Oklahoma $280,856,034 $248,106,168 $5,548,995 $10,936,318 ($15,674,343) $298,826 $9,784,939 $10,894,735
159 Southwestern Electric Power Co - Distribution $105,366,897 $95,305,262 $2,556,860 $4,121,047 ($6,021,001) $128,735 $3,670,951 $4,456,592168 Southwestern Electric Power Co - Generation 113,704,753 101,336,984 2,897,744 4,452,443 (6,402,061) 133,858 3,961,439 5,043,423161 Southwestern Electric Power Co - Texas - Distribution 55,539,665 48,123,589 1,138,715 2,164,252 (3,040,254) 66,462 1,934,985 2,264,160111 Southwestern Electric Power Co - Texas - Transmission 160,412 86,410 0 6,125 (5,459) 104 5,589 6,359194 Southwestern Electric Power Co - Transmission 17,012,007 16,462,626 412,193 665,340 (1,040,042) 21,709 592,693 651,893
Southwestern Electric Power Co. $291,783,734 $261,314,871 $7,005,512 $11,409,207 ($16,508,817) $350,868 $10,165,657 $12,422,427
119 AEP Texas North Company - Distribution $71,222,835 $63,844,067 $1,308,039 $2,769,577 ($4,033,410) $89,255 $2,481,382 $2,614,843166 AEP Texas North Company - Generation 23,915,680 23,039,495 0 913,215 (1,455,542) 7,536 833,215 298,424192 AEP Texas North Company - Transmission 11,303,319 10,118,022 294,180 442,848 (639,216) 12,469 393,804 504,085
AEP Texas North Co. $106,441,834 $97,001,584 $1,602,219 $4,125,640 ($6,128,168) $109,260 $3,708,401 $3,417,352
230 Kingsport Power Co - Distribution $13,877,519 $11,300,753 $120,480 $534,511 ($713,936) $3,610 $483,489 $428,154260 Kingsport Power Co - Transmission 4,136,355 3,282,203 36,154 159,326 (207,356) 562 144,109 132,795
Kingsport Power Co. $18,013,874 $14,582,956 $156,634 $693,837 ($921,292) $4,172 $627,598 $560,949
210 Wheeling Power Co - Distribution $17,544,397 $14,787,986 $163,926 $676,189 ($934,245) $6,413 $611,242 $523,525200 Wheeling Power Co - Transmission 766,115 846,869 0 29,254 (53,502) 53 26,691 2,496
Wheeling Power Co. $18,310,512 $15,634,855 $163,926 $705,443 ($987,747) $6,466 $637,933 $526,021
103 American Electric Power Service Corporation $1,522,509,761 $1,242,779,324 $19,170,773 $58,868,754 ($78,513,771) $0 $53,043,781 $53,220,412American Electric Power Service Corp $1,522,509,761 $1,242,779,324 $19,170,773 $58,868,754 ($78,513,771) $0 $53,043,781 $53,220,412
143 AEP Pro Serv, Inc. $1,201,854 $942,992 $0 $45,893 ($59,574) $42 $41,872 $28,233171 CSW Energy, Inc. 5,880,340 4,464,587 232,921 233,434 (282,055) 3,644 204,869 392,813293 Elmwood 3,467,643 4,826,904 322,596 144,730 (304,944) 6,722 120,812 289,916292 AEP River Operations LLC 34,955,602 43,268,352 4,259,079 1,497,405 (2,733,520) 37,599 1,217,843 4,278,406189 Central Coal Company $0 $0 $0 $0 $0 $0 $0 $0400 AEP Energy, Inc. 382,748 398,454 0 14,615 0 0 13,335 27,950
Miscellaneous $45,888,187 $53,901,289 $4,814,596 $1,936,077 ($3,380,093) $48,007 $1,598,731 $5,017,318
Total $5,158,918,282 $4,397,197,403 $68,688,725 $199,615,109 ($277,771,978) $1,856,687 $179,735,159 $172,774,577
CAD E-32 Attachment 1
Page 66 of 77

American Electric Power System Retirement Plan 63
Towers Watson Confidential
AMERICAN ELECTRIC POWER QUALIFIED RETIREMENT PLANESTIMATED 2014 NET PERIODIC PENSION COST
Amortization of NetProjected Market-Related Expected Prior PeriodicBenefit Value Service Interest Return Service Amortization of Pension
Location Obligation of Assets Cost Cost on Assets Cost Gain/Loss Cost
140 Appalachian Power Co - Distribution $329,362,267 $299,352,628 $2,840,971 $14,582,729 ($18,927,712) $95,769 $8,682,144 $7,273,901215 Appalachian Power Co - Generation 279,533,558 258,577,477 2,936,941 12,399,610 (16,349,548) 88,548 7,368,636 6,444,187150 Appalachian Power Co - Transmission 51,715,010 44,958,928 360,442 2,285,957 (2,842,700) 13,259 1,363,232 1,180,190
Appalachian Power Co. - FERC $660,610,835 $602,889,033 $6,138,354 $29,268,296 ($38,119,960) $197,576 $17,414,012 $14,898,278225 Cedar Coal Co 3,679,819 4,328,634 0 161,533 (273,694) 256 97,002 (14,903)
Appalachian Power Co. - SEC $664,290,654 $607,217,667 $6,138,354 $29,429,829 ($38,393,654) $197,832 $17,511,014 $14,883,375
211 AEP Texas Central Company - Distribution $278,652,094 $268,610,282 $4,247,361 $12,418,440 ($16,983,910) $290,197 $7,345,400 $7,317,488147 AEP Texas Central Company - Generation 7,454,734 13,779,590 0 327,241 (871,267) 0 196,510 (347,516)169 AEP Texas Central Company - Transmission 27,554,629 26,846,265 566,657 1,234,440 (1,697,458) 32,185 726,353 862,177
AEP Texas Central Co. $313,661,457 $309,236,137 $4,814,018 $13,980,121 ($19,552,635) $322,382 $8,268,263 $7,832,149
170 Indiana Michigan Power Co - Distribution $173,610,834 $155,920,634 $1,737,180 $7,697,253 ($9,858,677) $49,784 $4,576,463 $4,202,003132 Indiana Michigan Power Co - Generation 113,349,110 103,614,620 1,109,341 5,024,384 (6,551,430) 32,157 2,987,936 2,602,388190 Indiana Michigan Power Co - Nuclear 215,375,531 216,223,369 4,520,672 9,652,786 (13,671,547) 85,904 5,677,400 6,265,215120 Indiana Michigan Power Co - Transmission 38,716,862 33,674,570 362,141 1,715,451 (2,129,203) 10,708 1,020,595 979,692280 Ind Mich River Transp Lakin 34,338,801 36,238,291 931,529 1,548,262 (2,291,304) 16,825 905,187 1,110,499
Indiana Michigan Power Co. - FERC $575,391,138 $545,671,484 $8,660,863 $25,638,136 ($34,502,161) $195,378 $15,167,581 $15,159,797202 Price River Coal 0 0 0 0 0 32 0 32
Indiana Michigan Power Co. - SEC $575,391,138 $545,671,484 $8,660,863 $25,638,136 ($34,502,161) $195,410 $15,167,581 $15,159,829
110 Kentucky Power Co - Distribution $74,101,971 $65,822,609 $644,954 $3,281,166 ($4,161,886) $24,194 $1,953,363 $1,741,791117 Kentucky Power Co - Generation 36,300,443 32,181,904 261,695 1,604,969 (2,034,824) 12,900 956,897 801,637180 Kentucky Power Co - Transmission 8,311,687 7,897,550 114,069 369,865 (499,353) 3,861 219,100 207,542
Kentucky Power Co. $118,714,101 $105,902,063 $1,020,718 $5,256,000 ($6,696,063) $40,955 $3,129,360 $2,750,970
104 Cardinal Operating Company $78,905,471 $83,370,619 $1,014,785 $3,508,260 ($5,271,425) $18,876 $2,079,985 $1,350,481270 Cook Coal Terminal 3,436,307 3,770,302 60,743 153,510 (238,392) 963 90,583 67,407250 Ohio Power Co - Distribution 448,066,350 415,363,732 4,520,552 19,867,211 (26,262,957) 131,694 11,811,239 10,067,739181 Ohio Power Co - Generation 377,253,282 410,096,995 3,141,905 16,698,211 (25,929,947) 104,403 9,944,573 3,959,145160 Ohio Power Co - Transmission 76,550,085 68,851,178 695,201 3,390,837 (4,353,378) 25,286 2,017,896 1,775,842
Ohio Power Co. - FERC $984,211,495 $981,452,826 $9,433,186 $43,618,029 ($62,056,099) $281,222 $25,944,276 $17,220,614290 Conesville Coal Preparation Company 3,598,518 4,072,426 0 157,964 (257,495) 705 94,859 (3,967)
Ohio Power Co. - SEC $987,810,013 $985,525,252 $9,433,186 $43,775,993 ($62,313,594) $281,927 $26,039,135 $17,216,647
167 Public Service Co of Oklahoma - Distribution $161,583,705 $157,788,246 $3,220,280 $7,234,402 ($9,976,764) $182,659 $4,259,422 $4,919,999198 Public Service Co of Oklahoma - Generation 78,444,990 81,956,390 1,897,326 3,526,787 (5,182,005) 93,055 2,067,847 2,403,010114 Public Service Co of Oklahoma - Transmission 19,800,901 20,467,667 402,212 886,856 (1,294,146) 22,653 521,961 539,536
Public Service Co. of Oklahoma $259,829,596 $260,212,303 $5,519,818 $11,648,045 ($16,452,915) $298,367 $6,849,230 $7,862,545
159 Southwestern Electric Power Co - Distribution $97,478,548 $101,226,920 $2,543,416 $4,390,665 ($6,400,458) $128,573 $2,569,580 $3,231,776168 Southwestern Electric Power Co - Generation 105,192,186 107,818,724 2,882,507 4,744,156 (6,817,250) 133,705 2,772,915 3,716,033161 Southwestern Electric Power Co - Texas - Distribution 51,381,658 49,989,046 1,132,727 2,305,224 (3,160,748) 66,381 1,354,445 1,698,029111 Southwestern Electric Power Co - Texas - Transmission 148,403 71,702 0 6,514 (4,534) 103 3,912 5,995194 Southwestern Electric Power Co - Transmission 15,738,394 16,829,520 410,026 708,867 (1,064,111) 21,686 414,871 491,339
Southwestern Electric Power Co. $269,939,189 $275,935,912 $6,968,676 $12,155,426 ($17,447,101) $350,448 $7,115,723 $9,143,172
119 AEP Texas North Company - Distribution $65,890,699 $66,784,525 $1,301,161 $2,949,522 ($4,222,706) $89,140 $1,736,910 $1,854,027166 AEP Texas North Company - Generation 22,125,220 23,323,603 0 971,231 (1,474,724) 7,475 583,231 87,213192 AEP Texas North Company - Transmission 10,457,090 10,946,085 292,633 471,881 (692,108) 12,453 275,654 360,513
AEP Texas North Co. $98,473,009 $101,054,213 $1,593,794 $4,392,634 ($6,389,538) $109,068 $2,595,795 $2,301,753
230 Kingsport Power Co - Distribution $12,838,571 $11,643,774 $119,846 $568,836 ($736,222) $3,610 $338,431 $294,501260 Kingsport Power Co - Transmission 3,826,685 3,383,118 35,964 169,559 (213,911) 562 100,873 93,047
Kingsport Power Co. $16,665,256 $15,026,892 $155,810 $738,395 ($950,133) $4,172 $439,304 $387,548
210 Wheeling Power Co - Distribution $16,230,926 $15,345,346 $163,064 $719,647 ($970,268) $6,413 $427,855 $346,711200 Wheeling Power Co - Transmission 708,759 834,921 0 31,112 (52,791) 53 18,683 (2,943)
Wheeling Power Co. $16,939,685 $16,180,267 $163,064 $750,759 ($1,023,059) $6,466 $446,538 $343,768
103 American Electric Power Service Corporation $1,408,526,249 $1,292,878,200 $19,069,968 $62,667,205 ($81,747,157) $0 $37,129,408 $37,769,957American Electric Power Service Corp $1,408,526,249 $1,292,878,200 $19,069,968 $62,667,205 ($81,747,157) $0 $37,129,408 $37,769,957
143 AEP Pro Serv, Inc. $1,111,877 $957,546 $0 $48,808 ($60,544) $42 $29,310 $17,616171 CSW Energy, Inc. 5,440,105 4,906,817 231,696 248,975 (310,252) 3,639 143,404 317,462293 Elmwood 3,208,036 5,075,149 320,900 154,910 (320,896) 6,722 84,565 246,201292 AEP River Operations LLC 32,338,632 45,296,106 4,236,684 1,605,547 (2,864,019) 37,599 852,461 3,868,272189 Central Coal Company $0 $0 $0 $0 $0 $0 $0 $0400 AEP Energy, Inc. 354,093 426,979 0 15,544 (26,997) 0 9,334 (2,119)
Miscellaneous $42,452,743 $56,662,597 $4,789,280 $2,073,784 ($3,582,708) $48,002 $1,119,074 $4,447,432
Total $4,772,693,090 $4,571,502,987 $68,327,549 $212,506,327 ($289,050,718) $1,855,029 $125,810,425 $120,099,145
CAD E-32 Attachment 1
Page 67 of 77
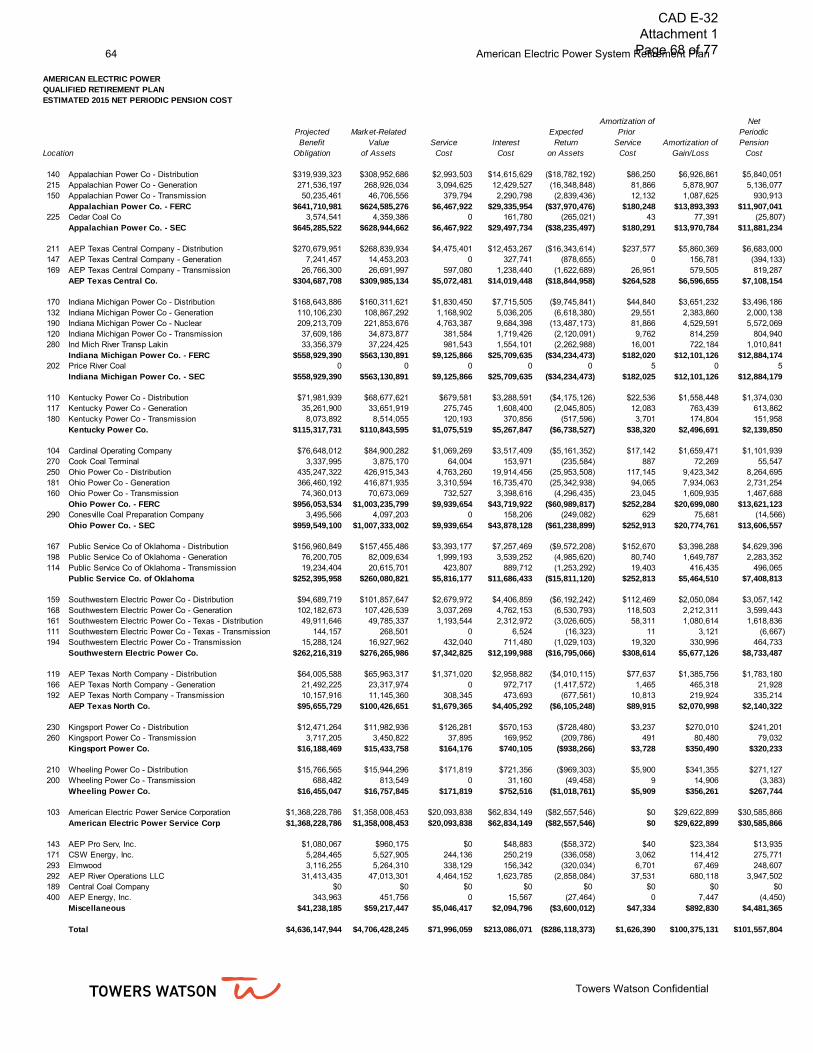
64 American Electric Power System Retirement Plan
Towers Watson Confidential
AMERICAN ELECTRIC POWER QUALIFIED RETIREMENT PLANESTIMATED 2015 NET PERIODIC PENSION COST
Amortization of NetProjected Market-Related Expected Prior PeriodicBenefit Value Service Interest Return Service Amortization of Pension
Location Obligation of Assets Cost Cost on Assets Cost Gain/Loss Cost
140 Appalachian Power Co - Distribution $319,939,323 $308,952,686 $2,993,503 $14,615,629 ($18,782,192) $86,250 $6,926,861 $5,840,051215 Appalachian Power Co - Generation 271,536,197 268,926,034 3,094,625 12,429,527 (16,348,848) 81,866 5,878,907 5,136,077150 Appalachian Power Co - Transmission 50,235,461 46,706,556 379,794 2,290,798 (2,839,436) 12,132 1,087,625 930,913
Appalachian Power Co. - FERC $641,710,981 $624,585,276 $6,467,922 $29,335,954 ($37,970,476) $180,248 $13,893,393 $11,907,041225 Cedar Coal Co 3,574,541 4,359,386 0 161,780 (265,021) 43 77,391 (25,807)
Appalachian Power Co. - SEC $645,285,522 $628,944,662 $6,467,922 $29,497,734 ($38,235,497) $180,291 $13,970,784 $11,881,234
211 AEP Texas Central Company - Distribution $270,679,951 $268,839,934 $4,475,401 $12,453,267 ($16,343,614) $237,577 $5,860,369 $6,683,000147 AEP Texas Central Company - Generation 7,241,457 14,453,203 0 327,741 (878,655) 0 156,781 (394,133)169 AEP Texas Central Company - Transmission 26,766,300 26,691,997 597,080 1,238,440 (1,622,689) 26,951 579,505 819,287
AEP Texas Central Co. $304,687,708 $309,985,134 $5,072,481 $14,019,448 ($18,844,958) $264,528 $6,596,655 $7,108,154
170 Indiana Michigan Power Co - Distribution $168,643,886 $160,311,621 $1,830,450 $7,715,505 ($9,745,841) $44,840 $3,651,232 $3,496,186132 Indiana Michigan Power Co - Generation 110,106,230 108,867,292 1,168,902 5,036,205 (6,618,380) 29,551 2,383,860 2,000,138190 Indiana Michigan Power Co - Nuclear 209,213,709 221,853,676 4,763,387 9,684,398 (13,487,173) 81,866 4,529,591 5,572,069120 Indiana Michigan Power Co - Transmission 37,609,186 34,873,877 381,584 1,719,426 (2,120,091) 9,762 814,259 804,940280 Ind Mich River Transp Lakin 33,356,379 37,224,425 981,543 1,554,101 (2,262,988) 16,001 722,184 1,010,841
Indiana Michigan Power Co. - FERC $558,929,390 $563,130,891 $9,125,866 $25,709,635 ($34,234,473) $182,020 $12,101,126 $12,884,174202 Price River Coal 0 0 0 0 0 5 0 5
Indiana Michigan Power Co. - SEC $558,929,390 $563,130,891 $9,125,866 $25,709,635 ($34,234,473) $182,025 $12,101,126 $12,884,179
110 Kentucky Power Co - Distribution $71,981,939 $68,677,621 $679,581 $3,288,591 ($4,175,126) $22,536 $1,558,448 $1,374,030117 Kentucky Power Co - Generation 35,261,900 33,651,919 275,745 1,608,400 (2,045,805) 12,083 763,439 613,862180 Kentucky Power Co - Transmission 8,073,892 8,514,055 120,193 370,856 (517,596) 3,701 174,804 151,958
Kentucky Power Co. $115,317,731 $110,843,595 $1,075,519 $5,267,847 ($6,738,527) $38,320 $2,496,691 $2,139,850
104 Cardinal Operating Company $76,648,012 $84,900,282 $1,069,269 $3,517,409 ($5,161,352) $17,142 $1,659,471 $1,101,939270 Cook Coal Terminal 3,337,995 3,875,170 64,004 153,971 (235,584) 887 72,269 55,547250 Ohio Power Co - Distribution 435,247,322 426,915,343 4,763,260 19,914,456 (25,953,508) 117,145 9,423,342 8,264,695181 Ohio Power Co - Generation 366,460,192 416,871,935 3,310,594 16,735,470 (25,342,938) 94,065 7,934,063 2,731,254160 Ohio Power Co - Transmission 74,360,013 70,673,069 732,527 3,398,616 (4,296,435) 23,045 1,609,935 1,467,688
Ohio Power Co. - FERC $956,053,534 $1,003,235,799 $9,939,654 $43,719,922 ($60,989,817) $252,284 $20,699,080 $13,621,123290 Conesville Coal Preparation Company 3,495,566 4,097,203 0 158,206 (249,082) 629 75,681 (14,566)
Ohio Power Co. - SEC $959,549,100 $1,007,333,002 $9,939,654 $43,878,128 ($61,238,899) $252,913 $20,774,761 $13,606,557
167 Public Service Co of Oklahoma - Distribution $156,960,849 $157,455,486 $3,393,177 $7,257,469 ($9,572,208) $152,670 $3,398,288 $4,629,396198 Public Service Co of Oklahoma - Generation 76,200,705 82,009,634 1,999,193 3,539,252 (4,985,620) 80,740 1,649,787 2,283,352114 Public Service Co of Oklahoma - Transmission 19,234,404 20,615,701 423,807 889,712 (1,253,292) 19,403 416,435 496,065
Public Service Co. of Oklahoma $252,395,958 $260,080,821 $5,816,177 $11,686,433 ($15,811,120) $252,813 $5,464,510 $7,408,813
159 Southwestern Electric Power Co - Distribution $94,689,719 $101,857,647 $2,679,972 $4,406,859 ($6,192,242) $112,469 $2,050,084 $3,057,142168 Southwestern Electric Power Co - Generation 102,182,673 107,426,539 3,037,269 4,762,153 (6,530,793) 118,503 2,212,311 3,599,443161 Southwestern Electric Power Co - Texas - Distribution 49,911,646 49,785,337 1,193,544 2,312,972 (3,026,605) 58,311 1,080,614 1,618,836111 Southwestern Electric Power Co - Texas - Transmission 144,157 268,501 0 6,524 (16,323) 11 3,121 (6,667)194 Southwestern Electric Power Co - Transmission 15,288,124 16,927,962 432,040 711,480 (1,029,103) 19,320 330,996 464,733
Southwestern Electric Power Co. $262,216,319 $276,265,986 $7,342,825 $12,199,988 ($16,795,066) $308,614 $5,677,126 $8,733,487
119 AEP Texas North Company - Distribution $64,005,588 $65,963,317 $1,371,020 $2,958,882 ($4,010,115) $77,637 $1,385,756 $1,783,180166 AEP Texas North Company - Generation 21,492,225 23,317,974 0 972,717 (1,417,572) 1,465 465,318 21,928192 AEP Texas North Company - Transmission 10,157,916 11,145,360 308,345 473,693 (677,561) 10,813 219,924 335,214
AEP Texas North Co. $95,655,729 $100,426,651 $1,679,365 $4,405,292 ($6,105,248) $89,915 $2,070,998 $2,140,322
230 Kingsport Power Co - Distribution $12,471,264 $11,982,936 $126,281 $570,153 ($728,480) $3,237 $270,010 $241,201260 Kingsport Power Co - Transmission 3,717,205 3,450,822 37,895 169,952 (209,786) 491 80,480 79,032
Kingsport Power Co. $16,188,469 $15,433,758 $164,176 $740,105 ($938,266) $3,728 $350,490 $320,233
210 Wheeling Power Co - Distribution $15,766,565 $15,944,296 $171,819 $721,356 ($969,303) $5,900 $341,355 $271,127200 Wheeling Power Co - Transmission 688,482 813,549 0 31,160 (49,458) 9 14,906 (3,383)
Wheeling Power Co. $16,455,047 $16,757,845 $171,819 $752,516 ($1,018,761) $5,909 $356,261 $267,744
103 American Electric Power Service Corporation $1,368,228,786 $1,358,008,453 $20,093,838 $62,834,149 ($82,557,546) $0 $29,622,899 $30,585,866American Electric Power Service Corp $1,368,228,786 $1,358,008,453 $20,093,838 $62,834,149 ($82,557,546) $0 $29,622,899 $30,585,866
143 AEP Pro Serv, Inc. $1,080,067 $960,175 $0 $48,883 ($58,372) $40 $23,384 $13,935171 CSW Energy, Inc. 5,284,465 5,527,905 244,136 250,219 (336,058) 3,062 114,412 275,771293 Elmwood 3,116,255 5,264,310 338,129 156,342 (320,034) 6,701 67,469 248,607292 AEP River Operations LLC 31,413,435 47,013,301 4,464,152 1,623,785 (2,858,084) 37,531 680,118 3,947,502189 Central Coal Company $0 $0 $0 $0 $0 $0 $0 $0400 AEP Energy, Inc. 343,963 451,756 0 15,567 (27,464) 0 7,447 (4,450)
Miscellaneous $41,238,185 $59,217,447 $5,046,417 $2,094,796 ($3,600,012) $47,334 $892,830 $4,481,365
Total $4,636,147,944 $4,706,428,245 $71,996,059 $213,086,071 ($286,118,373) $1,626,390 $100,375,131 $101,557,804
CAD E-32 Attachment 1
Page 68 of 77
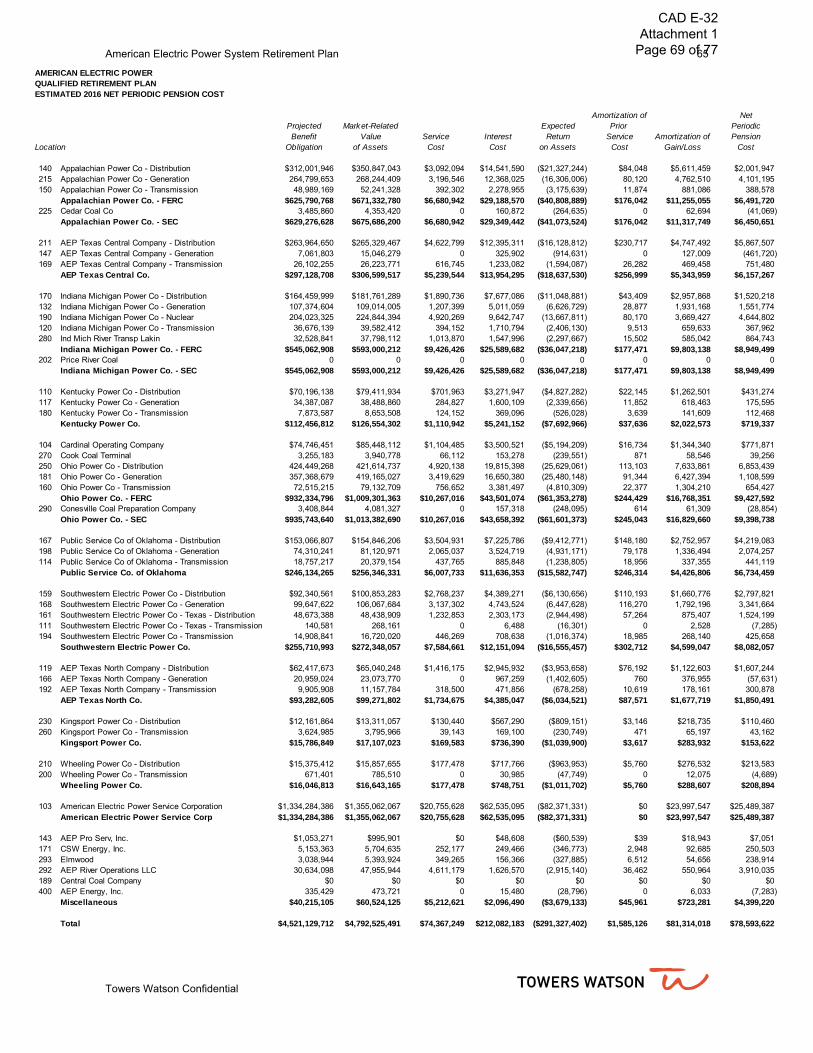
American Electric Power System Retirement Plan 65
Towers Watson Confidential
AMERICAN ELECTRIC POWER QUALIFIED RETIREMENT PLANESTIMATED 2016 NET PERIODIC PENSION COST
Amortization of NetProjected Market-Related Expected Prior PeriodicBenefit Value Service Interest Return Service Amortization of Pension
Location Obligation of Assets Cost Cost on Assets Cost Gain/Loss Cost
140 Appalachian Power Co - Distribution $312,001,946 $350,847,043 $3,092,094 $14,541,590 ($21,327,244) $84,048 $5,611,459 $2,001,947215 Appalachian Power Co - Generation 264,799,653 268,244,409 3,196,546 12,368,025 (16,306,006) 80,120 4,762,510 4,101,195150 Appalachian Power Co - Transmission 48,989,169 52,241,328 392,302 2,278,955 (3,175,639) 11,874 881,086 388,578
Appalachian Power Co. - FERC $625,790,768 $671,332,780 $6,680,942 $29,188,570 ($40,808,889) $176,042 $11,255,055 $6,491,720225 Cedar Coal Co 3,485,860 4,353,420 0 160,872 (264,635) 0 62,694 (41,069)
Appalachian Power Co. - SEC $629,276,628 $675,686,200 $6,680,942 $29,349,442 ($41,073,524) $176,042 $11,317,749 $6,450,651
211 AEP Texas Central Company - Distribution $263,964,650 $265,329,467 $4,622,799 $12,395,311 ($16,128,812) $230,717 $4,747,492 $5,867,507147 AEP Texas Central Company - Generation 7,061,803 15,046,279 0 325,902 (914,631) 0 127,009 (461,720)169 AEP Texas Central Company - Transmission 26,102,255 26,223,771 616,745 1,233,082 (1,594,087) 26,282 469,458 751,480
AEP Texas Central Co. $297,128,708 $306,599,517 $5,239,544 $13,954,295 ($18,637,530) $256,999 $5,343,959 $6,157,267
170 Indiana Michigan Power Co - Distribution $164,459,999 $181,761,289 $1,890,736 $7,677,086 ($11,048,881) $43,409 $2,957,868 $1,520,218132 Indiana Michigan Power Co - Generation 107,374,604 109,014,005 1,207,399 5,011,059 (6,626,729) 28,877 1,931,168 1,551,774190 Indiana Michigan Power Co - Nuclear 204,023,325 224,844,394 4,920,269 9,642,747 (13,667,811) 80,170 3,669,427 4,644,802120 Indiana Michigan Power Co - Transmission 36,676,139 39,582,412 394,152 1,710,794 (2,406,130) 9,513 659,633 367,962280 Ind Mich River Transp Lakin 32,528,841 37,798,112 1,013,870 1,547,996 (2,297,667) 15,502 585,042 864,743
Indiana Michigan Power Co. - FERC $545,062,908 $593,000,212 $9,426,426 $25,589,682 ($36,047,218) $177,471 $9,803,138 $8,949,499202 Price River Coal 0 0 0 0 0 0 0 0
Indiana Michigan Power Co. - SEC $545,062,908 $593,000,212 $9,426,426 $25,589,682 ($36,047,218) $177,471 $9,803,138 $8,949,499
110 Kentucky Power Co - Distribution $70,196,138 $79,411,934 $701,963 $3,271,947 ($4,827,282) $22,145 $1,262,501 $431,274117 Kentucky Power Co - Generation 34,387,087 38,488,860 284,827 1,600,109 (2,339,656) 11,852 618,463 175,595180 Kentucky Power Co - Transmission 7,873,587 8,653,508 124,152 369,096 (526,028) 3,639 141,609 112,468
Kentucky Power Co. $112,456,812 $126,554,302 $1,110,942 $5,241,152 ($7,692,966) $37,636 $2,022,573 $719,337
104 Cardinal Operating Company $74,746,451 $85,448,112 $1,104,485 $3,500,521 ($5,194,209) $16,734 $1,344,340 $771,871270 Cook Coal Terminal 3,255,183 3,940,778 66,112 153,278 (239,551) 871 58,546 39,256250 Ohio Power Co - Distribution 424,449,268 421,614,737 4,920,138 19,815,398 (25,629,061) 113,103 7,633,861 6,853,439181 Ohio Power Co - Generation 357,368,679 419,165,027 3,419,629 16,650,380 (25,480,148) 91,344 6,427,394 1,108,599160 Ohio Power Co - Transmission 72,515,215 79,132,709 756,652 3,381,497 (4,810,309) 22,377 1,304,210 654,427
Ohio Power Co. - FERC $932,334,796 $1,009,301,363 $10,267,016 $43,501,074 ($61,353,278) $244,429 $16,768,351 $9,427,592290 Conesville Coal Preparation Company 3,408,844 4,081,327 0 157,318 (248,095) 614 61,309 (28,854)
Ohio Power Co. - SEC $935,743,640 $1,013,382,690 $10,267,016 $43,658,392 ($61,601,373) $245,043 $16,829,660 $9,398,738
167 Public Service Co of Oklahoma - Distribution $153,066,807 $154,846,206 $3,504,931 $7,225,786 ($9,412,771) $148,180 $2,752,957 $4,219,083198 Public Service Co of Oklahoma - Generation 74,310,241 81,120,971 2,065,037 3,524,719 (4,931,171) 79,178 1,336,494 2,074,257114 Public Service Co of Oklahoma - Transmission 18,757,217 20,379,154 437,765 885,848 (1,238,805) 18,956 337,355 441,119
Public Service Co. of Oklahoma $246,134,265 $256,346,331 $6,007,733 $11,636,353 ($15,582,747) $246,314 $4,426,806 $6,734,459
159 Southwestern Electric Power Co - Distribution $92,340,561 $100,853,283 $2,768,237 $4,389,271 ($6,130,656) $110,193 $1,660,776 $2,797,821168 Southwestern Electric Power Co - Generation 99,647,622 106,067,684 3,137,302 4,743,524 (6,447,628) 116,270 1,792,196 3,341,664161 Southwestern Electric Power Co - Texas - Distribution 48,673,388 48,438,909 1,232,853 2,303,173 (2,944,498) 57,264 875,407 1,524,199111 Southwestern Electric Power Co - Texas - Transmission 140,581 268,161 0 6,488 (16,301) 0 2,528 (7,285)194 Southwestern Electric Power Co - Transmission 14,908,841 16,720,020 446,269 708,638 (1,016,374) 18,985 268,140 425,658
Southwestern Electric Power Co. $255,710,993 $272,348,057 $7,584,661 $12,151,094 ($16,555,457) $302,712 $4,599,047 $8,082,057
119 AEP Texas North Company - Distribution $62,417,673 $65,040,248 $1,416,175 $2,945,932 ($3,953,658) $76,192 $1,122,603 $1,607,244166 AEP Texas North Company - Generation 20,959,024 23,073,770 0 967,259 (1,402,605) 760 376,955 (57,631)192 AEP Texas North Company - Transmission 9,905,908 11,157,784 318,500 471,856 (678,258) 10,619 178,161 300,878
AEP Texas North Co. $93,282,605 $99,271,802 $1,734,675 $4,385,047 ($6,034,521) $87,571 $1,677,719 $1,850,491
230 Kingsport Power Co - Distribution $12,161,864 $13,311,057 $130,440 $567,290 ($809,151) $3,146 $218,735 $110,460260 Kingsport Power Co - Transmission 3,624,985 3,795,966 39,143 169,100 (230,749) 471 65,197 43,162
Kingsport Power Co. $15,786,849 $17,107,023 $169,583 $736,390 ($1,039,900) $3,617 $283,932 $153,622
210 Wheeling Power Co - Distribution $15,375,412 $15,857,655 $177,478 $717,766 ($963,953) $5,760 $276,532 $213,583200 Wheeling Power Co - Transmission 671,401 785,510 0 30,985 (47,749) 0 12,075 (4,689)
Wheeling Power Co. $16,046,813 $16,643,165 $177,478 $748,751 ($1,011,702) $5,760 $288,607 $208,894
103 American Electric Power Service Corporation $1,334,284,386 $1,355,062,067 $20,755,628 $62,535,095 ($82,371,331) $0 $23,997,547 $25,489,387American Electric Power Service Corp $1,334,284,386 $1,355,062,067 $20,755,628 $62,535,095 ($82,371,331) $0 $23,997,547 $25,489,387
143 AEP Pro Serv, Inc. $1,053,271 $995,901 $0 $48,608 ($60,539) $39 $18,943 $7,051171 CSW Energy, Inc. 5,153,363 5,704,635 252,177 249,466 (346,773) 2,948 92,685 250,503293 Elmwood 3,038,944 5,393,924 349,265 156,366 (327,885) 6,512 54,656 238,914292 AEP River Operations LLC 30,634,098 47,955,944 4,611,179 1,626,570 (2,915,140) 36,462 550,964 3,910,035189 Central Coal Company $0 $0 $0 $0 $0 $0 $0 $0400 AEP Energy, Inc. 335,429 473,721 0 15,480 (28,796) 0 6,033 (7,283)
Miscellaneous $40,215,105 $60,524,125 $5,212,621 $2,096,490 ($3,679,133) $45,961 $723,281 $4,399,220
Total $4,521,129,712 $4,792,525,491 $74,367,249 $212,082,183 ($291,327,402) $1,585,126 $81,314,018 $78,593,622
CAD E-32 Attachment 1
Page 69 of 77
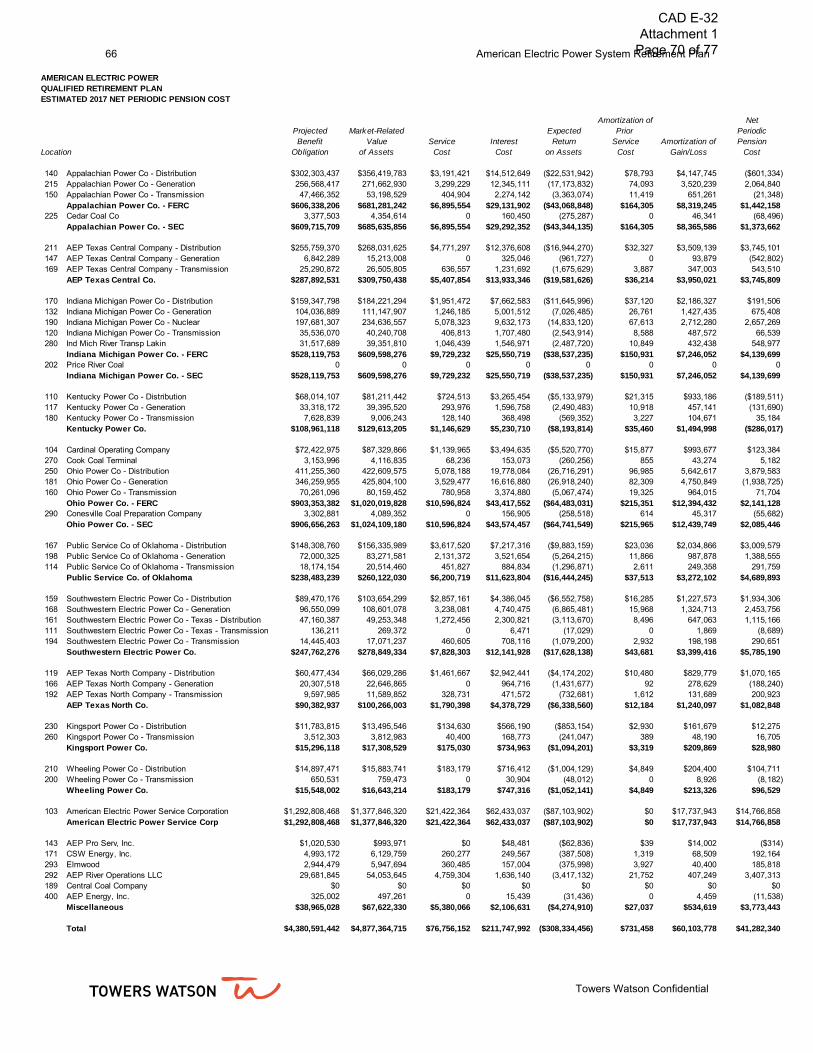
66 American Electric Power System Retirement Plan
Towers Watson Confidential
AMERICAN ELECTRIC POWER QUALIFIED RETIREMENT PLANESTIMATED 2017 NET PERIODIC PENSION COST
Amortization of NetProjected Market-Related Expected Prior PeriodicBenefit Value Service Interest Return Service Amortization of Pension
Location Obligation of Assets Cost Cost on Assets Cost Gain/Loss Cost
140 Appalachian Power Co - Distribution $302,303,437 $356,419,783 $3,191,421 $14,512,649 ($22,531,942) $78,793 $4,147,745 ($601,334)215 Appalachian Power Co - Generation 256,568,417 271,662,930 3,299,229 12,345,111 (17,173,832) 74,093 3,520,239 2,064,840150 Appalachian Power Co - Transmission 47,466,352 53,198,529 404,904 2,274,142 (3,363,074) 11,419 651,261 (21,348)
Appalachian Power Co. - FERC $606,338,206 $681,281,242 $6,895,554 $29,131,902 ($43,068,848) $164,305 $8,319,245 $1,442,158225 Cedar Coal Co 3,377,503 4,354,614 0 160,450 (275,287) 0 46,341 (68,496)
Appalachian Power Co. - SEC $609,715,709 $685,635,856 $6,895,554 $29,292,352 ($43,344,135) $164,305 $8,365,586 $1,373,662
211 AEP Texas Central Company - Distribution $255,759,370 $268,031,625 $4,771,297 $12,376,608 ($16,944,270) $32,327 $3,509,139 $3,745,101147 AEP Texas Central Company - Generation 6,842,289 15,213,008 0 325,046 (961,727) 0 93,879 (542,802)169 AEP Texas Central Company - Transmission 25,290,872 26,505,805 636,557 1,231,692 (1,675,629) 3,887 347,003 543,510
AEP Texas Central Co. $287,892,531 $309,750,438 $5,407,854 $13,933,346 ($19,581,626) $36,214 $3,950,021 $3,745,809
170 Indiana Michigan Power Co - Distribution $159,347,798 $184,221,294 $1,951,472 $7,662,583 ($11,645,996) $37,120 $2,186,327 $191,506132 Indiana Michigan Power Co - Generation 104,036,889 111,147,907 1,246,185 5,001,512 (7,026,485) 26,761 1,427,435 675,408190 Indiana Michigan Power Co - Nuclear 197,681,307 234,636,557 5,078,323 9,632,173 (14,833,120) 67,613 2,712,280 2,657,269120 Indiana Michigan Power Co - Transmission 35,536,070 40,240,708 406,813 1,707,480 (2,543,914) 8,588 487,572 66,539280 Ind Mich River Transp Lakin 31,517,689 39,351,810 1,046,439 1,546,971 (2,487,720) 10,849 432,438 548,977
Indiana Michigan Power Co. - FERC $528,119,753 $609,598,276 $9,729,232 $25,550,719 ($38,537,235) $150,931 $7,246,052 $4,139,699202 Price River Coal 0 0 0 0 0 0 0 0
Indiana Michigan Power Co. - SEC $528,119,753 $609,598,276 $9,729,232 $25,550,719 ($38,537,235) $150,931 $7,246,052 $4,139,699
110 Kentucky Power Co - Distribution $68,014,107 $81,211,442 $724,513 $3,265,454 ($5,133,979) $21,315 $933,186 ($189,511)117 Kentucky Power Co - Generation 33,318,172 39,395,520 293,976 1,596,758 (2,490,483) 10,918 457,141 (131,690)180 Kentucky Power Co - Transmission 7,628,839 9,006,243 128,140 368,498 (569,352) 3,227 104,671 35,184
Kentucky Power Co. $108,961,118 $129,613,205 $1,146,629 $5,230,710 ($8,193,814) $35,460 $1,494,998 ($286,017)
104 Cardinal Operating Company $72,422,975 $87,329,866 $1,139,965 $3,494,635 ($5,520,770) $15,877 $993,677 $123,384270 Cook Coal Terminal 3,153,996 4,116,835 68,236 153,073 (260,256) 855 43,274 5,182250 Ohio Power Co - Distribution 411,255,360 422,609,575 5,078,188 19,778,084 (26,716,291) 96,985 5,642,617 3,879,583181 Ohio Power Co - Generation 346,259,955 425,804,100 3,529,477 16,616,880 (26,918,240) 82,309 4,750,849 (1,938,725)160 Ohio Power Co - Transmission 70,261,096 80,159,452 780,958 3,374,880 (5,067,474) 19,325 964,015 71,704
Ohio Power Co. - FERC $903,353,382 $1,020,019,828 $10,596,824 $43,417,552 ($64,483,031) $215,351 $12,394,432 $2,141,128290 Conesville Coal Preparation Company 3,302,881 4,089,352 0 156,905 (258,518) 614 45,317 (55,682)
Ohio Power Co. - SEC $906,656,263 $1,024,109,180 $10,596,824 $43,574,457 ($64,741,549) $215,965 $12,439,749 $2,085,446
167 Public Service Co of Oklahoma - Distribution $148,308,760 $156,335,989 $3,617,520 $7,217,316 ($9,883,159) $23,036 $2,034,866 $3,009,579198 Public Service Co of Oklahoma - Generation 72,000,325 83,271,581 2,131,372 3,521,654 (5,264,215) 11,866 987,878 1,388,555114 Public Service Co of Oklahoma - Transmission 18,174,154 20,514,460 451,827 884,834 (1,296,871) 2,611 249,358 291,759
Public Service Co. of Oklahoma $238,483,239 $260,122,030 $6,200,719 $11,623,804 ($16,444,245) $37,513 $3,272,102 $4,689,893
159 Southwestern Electric Power Co - Distribution $89,470,176 $103,654,299 $2,857,161 $4,386,045 ($6,552,758) $16,285 $1,227,573 $1,934,306168 Southwestern Electric Power Co - Generation 96,550,099 108,601,078 3,238,081 4,740,475 (6,865,481) 15,968 1,324,713 2,453,756161 Southwestern Electric Power Co - Texas - Distribution 47,160,387 49,253,348 1,272,456 2,300,821 (3,113,670) 8,496 647,063 1,115,166111 Southwestern Electric Power Co - Texas - Transmission 136,211 269,372 0 6,471 (17,029) 0 1,869 (8,689)194 Southwestern Electric Power Co - Transmission 14,445,403 17,071,237 460,605 708,116 (1,079,200) 2,932 198,198 290,651
Southwestern Electric Power Co. $247,762,276 $278,849,334 $7,828,303 $12,141,928 ($17,628,138) $43,681 $3,399,416 $5,785,190
119 AEP Texas North Company - Distribution $60,477,434 $66,029,286 $1,461,667 $2,942,441 ($4,174,202) $10,480 $829,779 $1,070,165166 AEP Texas North Company - Generation 20,307,518 22,646,865 0 964,716 (1,431,677) 92 278,629 (188,240)192 AEP Texas North Company - Transmission 9,597,985 11,589,852 328,731 471,572 (732,681) 1,612 131,689 200,923
AEP Texas North Co. $90,382,937 $100,266,003 $1,790,398 $4,378,729 ($6,338,560) $12,184 $1,240,097 $1,082,848
230 Kingsport Power Co - Distribution $11,783,815 $13,495,546 $134,630 $566,190 ($853,154) $2,930 $161,679 $12,275260 Kingsport Power Co - Transmission 3,512,303 3,812,983 40,400 168,773 (241,047) 389 48,190 16,705
Kingsport Power Co. $15,296,118 $17,308,529 $175,030 $734,963 ($1,094,201) $3,319 $209,869 $28,980
210 Wheeling Power Co - Distribution $14,897,471 $15,883,741 $183,179 $716,412 ($1,004,129) $4,849 $204,400 $104,711200 Wheeling Power Co - Transmission 650,531 759,473 0 30,904 (48,012) 0 8,926 (8,182)
Wheeling Power Co. $15,548,002 $16,643,214 $183,179 $747,316 ($1,052,141) $4,849 $213,326 $96,529
103 American Electric Power Service Corporation $1,292,808,468 $1,377,846,320 $21,422,364 $62,433,037 ($87,103,902) $0 $17,737,943 $14,766,858American Electric Power Service Corp $1,292,808,468 $1,377,846,320 $21,422,364 $62,433,037 ($87,103,902) $0 $17,737,943 $14,766,858
143 AEP Pro Serv, Inc. $1,020,530 $993,971 $0 $48,481 ($62,836) $39 $14,002 ($314)171 CSW Energy, Inc. 4,993,172 6,129,759 260,277 249,567 (387,508) 1,319 68,509 192,164293 Elmwood 2,944,479 5,947,694 360,485 157,004 (375,998) 3,927 40,400 185,818292 AEP River Operations LLC 29,681,845 54,053,645 4,759,304 1,636,140 (3,417,132) 21,752 407,249 3,407,313189 Central Coal Company $0 $0 $0 $0 $0 $0 $0 $0400 AEP Energy, Inc. 325,002 497,261 0 15,439 (31,436) 0 4,459 (11,538)
Miscellaneous $38,965,028 $67,622,330 $5,380,066 $2,106,631 ($4,274,910) $27,037 $534,619 $3,773,443
Total $4,380,591,442 $4,877,364,715 $76,756,152 $211,747,992 ($308,334,456) $731,458 $60,103,778 $41,282,340
CAD E-32 Attachment 1
Page 70 of 77
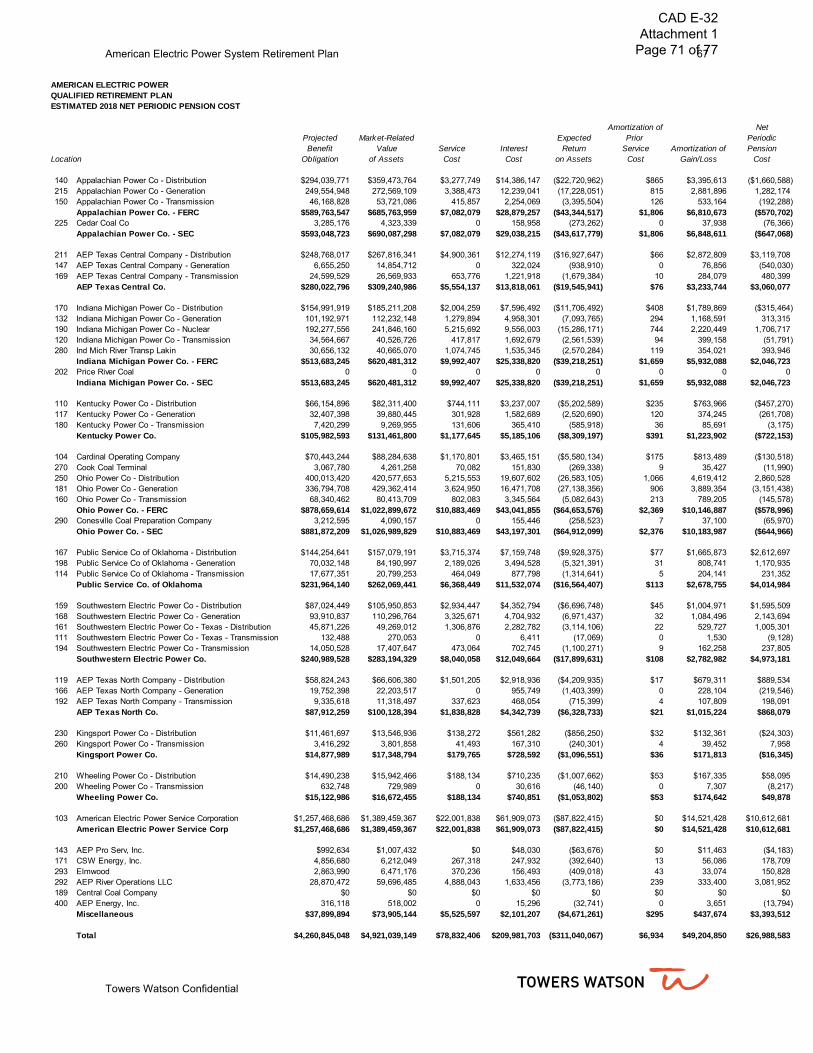
American Electric Power System Retirement Plan 67
Towers Watson Confidential
AMERICAN ELECTRIC POWER QUALIFIED RETIREMENT PLANESTIMATED 2018 NET PERIODIC PENSION COST
Amortization of NetProjected Market-Related Expected Prior PeriodicBenefit Value Service Interest Return Service Amortization of Pension
Location Obligation of Assets Cost Cost on Assets Cost Gain/Loss Cost
140 Appalachian Power Co - Distribution $294,039,771 $359,473,764 $3,277,749 $14,386,147 ($22,720,962) $865 $3,395,613 ($1,660,588)215 Appalachian Power Co - Generation 249,554,948 272,569,109 3,388,473 12,239,041 (17,228,051) 815 2,881,896 1,282,174150 Appalachian Power Co - Transmission 46,168,828 53,721,086 415,857 2,254,069 (3,395,504) 126 533,164 (192,288)
Appalachian Power Co. - FERC $589,763,547 $685,763,959 $7,082,079 $28,879,257 ($43,344,517) $1,806 $6,810,673 ($570,702)225 Cedar Coal Co 3,285,176 4,323,339 0 158,958 (273,262) 0 37,938 (76,366)
Appalachian Power Co. - SEC $593,048,723 $690,087,298 $7,082,079 $29,038,215 ($43,617,779) $1,806 $6,848,611 ($647,068)
211 AEP Texas Central Company - Distribution $248,768,017 $267,816,341 $4,900,361 $12,274,119 ($16,927,647) $66 $2,872,809 $3,119,708147 AEP Texas Central Company - Generation 6,655,250 14,854,712 0 322,024 (938,910) 0 76,856 (540,030)169 AEP Texas Central Company - Transmission 24,599,529 26,569,933 653,776 1,221,918 (1,679,384) 10 284,079 480,399
AEP Texas Central Co. $280,022,796 $309,240,986 $5,554,137 $13,818,061 ($19,545,941) $76 $3,233,744 $3,060,077
170 Indiana Michigan Power Co - Distribution $154,991,919 $185,211,208 $2,004,259 $7,596,492 ($11,706,492) $408 $1,789,869 ($315,464)132 Indiana Michigan Power Co - Generation 101,192,971 112,232,148 1,279,894 4,958,301 (7,093,765) 294 1,168,591 313,315190 Indiana Michigan Power Co - Nuclear 192,277,556 241,846,160 5,215,692 9,556,003 (15,286,171) 744 2,220,449 1,706,717120 Indiana Michigan Power Co - Transmission 34,564,667 40,526,726 417,817 1,692,679 (2,561,539) 94 399,158 (51,791)280 Ind Mich River Transp Lakin 30,656,132 40,665,070 1,074,745 1,535,345 (2,570,284) 119 354,021 393,946
Indiana Michigan Power Co. - FERC $513,683,245 $620,481,312 $9,992,407 $25,338,820 ($39,218,251) $1,659 $5,932,088 $2,046,723202 Price River Coal 0 0 0 0 0 0 0 0
Indiana Michigan Power Co. - SEC $513,683,245 $620,481,312 $9,992,407 $25,338,820 ($39,218,251) $1,659 $5,932,088 $2,046,723
110 Kentucky Power Co - Distribution $66,154,896 $82,311,400 $744,111 $3,237,007 ($5,202,589) $235 $763,966 ($457,270)117 Kentucky Power Co - Generation 32,407,398 39,880,445 301,928 1,582,689 (2,520,690) 120 374,245 (261,708)180 Kentucky Power Co - Transmission 7,420,299 9,269,955 131,606 365,410 (585,918) 36 85,691 (3,175)
Kentucky Power Co. $105,982,593 $131,461,800 $1,177,645 $5,185,106 ($8,309,197) $391 $1,223,902 ($722,153)
104 Cardinal Operating Company $70,443,244 $88,284,638 $1,170,801 $3,465,151 ($5,580,134) $175 $813,489 ($130,518)270 Cook Coal Terminal 3,067,780 4,261,258 70,082 151,830 (269,338) 9 35,427 (11,990)250 Ohio Power Co - Distribution 400,013,420 420,577,653 5,215,553 19,607,602 (26,583,105) 1,066 4,619,412 2,860,528181 Ohio Power Co - Generation 336,794,708 429,362,414 3,624,950 16,471,708 (27,138,356) 906 3,889,354 (3,151,438)160 Ohio Power Co - Transmission 68,340,462 80,413,709 802,083 3,345,564 (5,082,643) 213 789,205 (145,578)
Ohio Power Co. - FERC $878,659,614 $1,022,899,672 $10,883,469 $43,041,855 ($64,653,576) $2,369 $10,146,887 ($578,996)290 Conesville Coal Preparation Company 3,212,595 4,090,157 0 155,446 (258,523) 7 37,100 (65,970)
Ohio Power Co. - SEC $881,872,209 $1,026,989,829 $10,883,469 $43,197,301 ($64,912,099) $2,376 $10,183,987 ($644,966)
167 Public Service Co of Oklahoma - Distribution $144,254,641 $157,079,191 $3,715,374 $7,159,748 ($9,928,375) $77 $1,665,873 $2,612,697198 Public Service Co of Oklahoma - Generation 70,032,148 84,190,997 2,189,026 3,494,528 (5,321,391) 31 808,741 1,170,935114 Public Service Co of Oklahoma - Transmission 17,677,351 20,799,253 464,049 877,798 (1,314,641) 5 204,141 231,352
Public Service Co. of Oklahoma $231,964,140 $262,069,441 $6,368,449 $11,532,074 ($16,564,407) $113 $2,678,755 $4,014,984
159 Southwestern Electric Power Co - Distribution $87,024,449 $105,950,853 $2,934,447 $4,352,794 ($6,696,748) $45 $1,004,971 $1,595,509168 Southwestern Electric Power Co - Generation 93,910,837 110,296,764 3,325,671 4,704,932 (6,971,437) 32 1,084,496 2,143,694161 Southwestern Electric Power Co - Texas - Distribution 45,871,226 49,269,012 1,306,876 2,282,782 (3,114,106) 22 529,727 1,005,301111 Southwestern Electric Power Co - Texas - Transmission 132,488 270,053 0 6,411 (17,069) 0 1,530 (9,128)194 Southwestern Electric Power Co - Transmission 14,050,528 17,407,647 473,064 702,745 (1,100,271) 9 162,258 237,805
Southwestern Electric Power Co. $240,989,528 $283,194,329 $8,040,058 $12,049,664 ($17,899,631) $108 $2,782,982 $4,973,181
119 AEP Texas North Company - Distribution $58,824,243 $66,606,380 $1,501,205 $2,918,936 ($4,209,935) $17 $679,311 $889,534166 AEP Texas North Company - Generation 19,752,398 22,203,517 0 955,749 (1,403,399) 0 228,104 (219,546)192 AEP Texas North Company - Transmission 9,335,618 11,318,497 337,623 468,054 (715,399) 4 107,809 198,091
AEP Texas North Co. $87,912,259 $100,128,394 $1,838,828 $4,342,739 ($6,328,733) $21 $1,015,224 $868,079
230 Kingsport Power Co - Distribution $11,461,697 $13,546,936 $138,272 $561,282 ($856,250) $32 $132,361 ($24,303)260 Kingsport Power Co - Transmission 3,416,292 3,801,858 41,493 167,310 (240,301) 4 39,452 7,958
Kingsport Power Co. $14,877,989 $17,348,794 $179,765 $728,592 ($1,096,551) $36 $171,813 ($16,345)
210 Wheeling Power Co - Distribution $14,490,238 $15,942,466 $188,134 $710,235 ($1,007,662) $53 $167,335 $58,095200 Wheeling Power Co - Transmission 632,748 729,989 0 30,616 (46,140) 0 7,307 (8,217)
Wheeling Power Co. $15,122,986 $16,672,455 $188,134 $740,851 ($1,053,802) $53 $174,642 $49,878
103 American Electric Power Service Corporation $1,257,468,686 $1,389,459,367 $22,001,838 $61,909,073 ($87,822,415) $0 $14,521,428 $10,612,681American Electric Power Service Corp $1,257,468,686 $1,389,459,367 $22,001,838 $61,909,073 ($87,822,415) $0 $14,521,428 $10,612,681
143 AEP Pro Serv, Inc. $992,634 $1,007,432 $0 $48,030 ($63,676) $0 $11,463 ($4,183)171 CSW Energy, Inc. 4,856,680 6,212,049 267,318 247,932 (392,640) 13 56,086 178,709293 Elmwood 2,863,990 6,471,176 370,236 156,493 (409,018) 43 33,074 150,828292 AEP River Operations LLC 28,870,472 59,696,485 4,888,043 1,633,456 (3,773,186) 239 333,400 3,081,952189 Central Coal Company $0 $0 $0 $0 $0 $0 $0 $0400 AEP Energy, Inc. 316,118 518,002 0 15,296 (32,741) 0 3,651 (13,794)
Miscellaneous $37,899,894 $73,905,144 $5,525,597 $2,101,207 ($4,671,261) $295 $437,674 $3,393,512
Total $4,260,845,048 $4,921,039,149 $78,832,406 $209,981,703 ($311,040,067) $6,934 $49,204,850 $26,988,583
CAD E-32 Attachment 1
Page 71 of 77

68 American Electric Power System Retirement Plan
Towers Watson Confidential
AMERICAN ELECTRIC POWER QUALIFIED RETIREMENT PLANESTIMATED 2019 NET PERIODIC PENSION COST
Amortization of NetProjected Market-Related Expected Prior PeriodicBenefit Value Service Interest Return Service Amortization of Pension
Location Obligation of Assets Cost Cost on Assets Cost Gain/Loss Cost
140 Appalachian Power Co - Distribution $288,534,468 $361,567,449 $3,379,325 $14,117,192 ($22,863,867) $0 $3,025,484 ($2,341,866)215 Appalachian Power Co - Generation 244,882,533 273,312,558 3,493,481 12,011,669 (17,283,032) 0 2,567,763 789,881150 Appalachian Power Co - Transmission 45,304,409 54,155,992 428,744 2,211,693 (3,424,577) 0 475,048 (309,092)
Appalachian Power Co. - FERC $578,721,410 $689,035,999 $7,301,550 $28,340,554 ($43,571,476) $0 $6,068,295 ($1,861,077)225 Cedar Coal Co 3,223,668 4,295,920 0 155,899 (271,654) 0 33,802 (81,953)
Appalachian Power Co. - SEC $581,945,078 $693,331,919 $7,301,550 $28,496,453 ($43,843,130) $0 $6,102,097 ($1,943,030)
211 AEP Texas Central Company - Distribution $244,110,336 $267,520,879 $5,052,221 $12,049,707 ($16,916,793) $0 $2,559,666 $2,744,801147 AEP Texas Central Company - Generation 6,530,644 14,863,758 0 315,827 (939,916) 0 68,478 (555,611)169 AEP Texas Central Company - Transmission 24,138,953 26,863,597 674,036 1,199,977 (1,698,731) 0 253,114 428,396
AEP Texas Central Co. $274,779,933 $309,248,234 $5,726,257 $13,565,511 ($19,555,440) $0 $2,881,258 $2,617,586
170 Indiana Michigan Power Co - Distribution $152,090,007 $185,873,023 $2,066,370 $7,455,130 ($11,753,757) $0 $1,594,769 ($637,488)132 Indiana Michigan Power Co - Generation 99,298,336 113,214,892 1,319,557 4,865,964 (7,159,190) 0 1,041,212 67,543190 Indiana Michigan Power Co - Nuclear 188,677,546 250,008,351 5,377,324 9,384,654 (15,809,381) 0 1,978,415 931,012120 Indiana Michigan Power Co - Transmission 33,917,514 40,797,478 430,765 1,661,111 (2,579,845) 0 355,649 (132,320)280 Ind Mich River Transp Lakin 30,082,158 41,757,361 1,108,051 1,508,384 (2,640,544) 0 315,432 291,323
Indiana Michigan Power Co. - FERC $504,065,561 $631,651,105 $10,302,067 $24,875,243 ($39,942,717) $0 $5,285,477 $520,070202 Price River Coal 0 0 0 0 0 0 0 0
Indiana Michigan Power Co. - SEC $504,065,561 $631,651,105 $10,302,067 $24,875,243 ($39,942,717) $0 $5,285,477 $520,070
110 Kentucky Power Co - Distribution $64,916,279 $83,270,122 $767,170 $3,176,506 ($5,265,621) $0 $680,692 ($641,253)117 Kentucky Power Co - Generation 31,800,634 40,315,991 311,285 1,552,959 (2,549,398) 0 333,452 (351,702)180 Kentucky Power Co - Transmission 7,281,369 9,495,521 135,685 358,695 (600,453) 0 76,350 (29,723)
Kentucky Power Co. $103,998,282 $133,081,634 $1,214,140 $5,088,160 ($8,415,472) $0 $1,090,494 ($1,022,678)
104 Cardinal Operating Company $69,124,336 $89,397,374 $1,207,083 $3,401,286 ($5,653,080) $0 $724,816 ($319,895)270 Cook Coal Terminal 3,010,342 3,968,950 72,253 149,077 (250,978) 0 31,566 1,918250 Ohio Power Co - Distribution 392,523,973 418,964,838 5,377,181 19,242,829 (26,493,414) 0 4,115,885 2,242,481181 Ohio Power Co - Generation 330,488,905 432,448,253 3,737,285 16,163,455 (27,346,044) 0 3,465,405 (3,979,899)160 Ohio Power Co - Transmission 67,060,924 80,784,182 826,939 3,283,113 (5,108,421) 0 703,180 (295,189)
Ohio Power Co. - FERC $862,208,480 $1,025,563,597 $11,220,741 $42,239,760 ($64,851,937) $0 $9,040,852 ($2,350,584)290 Conesville Coal Preparation Company 3,152,445 4,094,719 0 152,455 (258,931) 0 33,056 (73,420)
Ohio Power Co. - SEC $865,360,925 $1,029,658,316 $11,220,741 $42,392,215 ($65,110,868) $0 $9,073,908 ($2,424,004)
167 Public Service Co of Oklahoma - Distribution $141,553,763 $157,368,972 $3,830,512 $7,030,904 ($9,951,292) $0 $1,484,289 $2,394,413198 Public Service Co of Oklahoma - Generation 68,720,936 84,747,197 2,256,863 3,432,545 (5,359,024) 0 720,587 1,050,971114 Public Service Co of Oklahoma - Transmission 17,346,378 21,072,055 478,430 862,022 (1,332,500) 0 181,889 189,841
Public Service Co. of Oklahoma $227,621,077 $263,188,224 $6,565,805 $11,325,471 ($16,642,816) $0 $2,386,765 $3,635,225
159 Southwestern Electric Power Co - Distribution $85,395,092 $107,577,579 $3,025,384 $4,276,087 ($6,802,713) $0 $895,427 $1,394,185168 Southwestern Electric Power Co - Generation 92,152,546 111,744,897 3,428,733 4,622,390 (7,066,235) 0 966,283 1,951,171161 Southwestern Electric Power Co - Texas - Distribution 45,012,379 49,741,779 1,347,375 2,241,996 (3,145,442) 0 471,986 915,915111 Southwestern Electric Power Co - Texas - Transmission 130,007 272,429 0 6,287 (17,227) 0 1,363 (9,577)194 Southwestern Electric Power Co - Transmission 13,787,460 17,728,636 487,724 690,360 (1,121,078) 0 144,571 201,577
Southwestern Electric Power Co. $236,477,484 $287,065,320 $8,289,216 $11,837,120 ($18,152,695) $0 $2,479,630 $4,453,271
119 AEP Texas North Company - Distribution $57,722,877 $67,266,274 $1,547,727 $2,866,375 ($4,253,611) $0 $605,264 $765,755166 AEP Texas North Company - Generation 19,382,574 21,780,050 0 937,357 (1,377,270) 0 203,240 (236,673)192 AEP Texas North Company - Transmission 9,160,827 11,548,064 348,086 459,859 (730,247) 0 96,058 173,756
AEP Texas North Co. $86,266,278 $100,594,388 $1,895,813 $4,263,591 ($6,361,128) $0 $904,562 $702,838
230 Kingsport Power Co - Distribution $11,247,100 $13,575,840 $142,557 $550,813 ($858,474) $0 $117,934 ($47,170)260 Kingsport Power Co - Transmission 3,352,329 3,789,082 42,779 164,190 (239,604) 0 35,151 2,516
Kingsport Power Co. $14,599,429 $17,364,922 $185,336 $715,003 ($1,098,078) $0 $153,085 ($44,654)
210 Wheeling Power Co - Distribution $14,218,938 $15,957,469 $193,964 $697,020 ($1,009,077) $0 $149,095 $31,002200 Wheeling Power Co - Transmission 620,901 703,938 0 30,027 (44,514) 0 6,511 (7,976)
Wheeling Power Co. $14,839,839 $16,661,407 $193,964 $727,047 ($1,053,591) $0 $155,606 $23,026
103 American Electric Power Service Corporation $1,233,925,109 $1,400,276,407 $22,683,665 $60,770,640 ($88,547,054) $0 $12,938,559 $7,845,810American Electric Power Service Corp $1,233,925,109 $1,400,276,407 $22,683,665 $60,770,640 ($88,547,054) $0 $12,938,559 $7,845,810
143 AEP Pro Serv, Inc. $974,049 $1,022,966 $0 $47,106 ($64,688) $0 $10,214 ($7,368)171 CSW Energy, Inc. 4,765,749 6,646,315 275,602 243,804 (420,282) 0 49,972 149,096293 Elmwood 2,810,367 7,045,810 381,709 154,371 (445,545) 0 29,469 120,004292 AEP River Operations LLC 28,329,930 65,866,488 5,039,521 1,613,774 (4,165,095) 0 297,059 2,785,259189 Central Coal Company $0 $0 $0 $0 $0 $0 $0 $0400 AEP Energy, Inc. 310,200 538,759 0 15,002 (34,069) 0 3,253 (15,814)
Miscellaneous $37,190,295 $81,120,338 $5,696,832 $2,074,057 ($5,129,679) $0 $389,967 $3,031,177
Total $4,181,069,290 $4,963,242,214 $81,275,386 $206,130,511 ($313,852,668) $0 $43,841,408 $17,394,637
CAD E-32 Attachment 1
Page 72 of 77

American Electric Power System Retirement Plan 69
Towers Watson Confidential
AMERICAN ELECTRIC POWER QUALIFIED RETIREMENT PLANESTIMATED 2020 NET PERIODIC PENSION COST
Amortization of NetProjected Market-Related Expected Prior PeriodicBenefit Value Service Interest Return Service Amortization of Pension
Location Obligation of Assets Cost Cost on Assets Cost Gain/Loss Cost
140 Appalachian Power Co - Distribution $283,082,053 $364,992,820 $3,434,731 $13,847,464 ($23,090,157) $0 $2,689,202 ($3,118,760)215 Appalachian Power Co - Generation 240,255,007 274,157,077 3,550,758 11,783,224 (17,343,711) 0 2,282,357 272,628150 Appalachian Power Co - Transmission 44,448,295 54,205,053 435,774 2,169,264 (3,429,117) 0 422,247 (401,832)
Appalachian Power Co. - FERC $567,785,355 $693,354,950 $7,421,263 $27,799,952 ($43,862,985) $0 $5,393,806 ($3,247,964)225 Cedar Coal Co 3,162,751 4,274,771 0 152,857 (270,430) 0 30,045 (87,528)
Appalachian Power Co. - SEC $570,948,106 $697,629,721 $7,421,263 $27,952,809 ($44,133,415) $0 $5,423,851 ($3,335,492)
211 AEP Texas Central Company - Distribution $239,497,401 $267,863,773 $5,135,055 $11,823,178 ($16,945,584) $0 $2,275,160 $2,287,809147 AEP Texas Central Company - Generation 6,407,235 15,235,233 0 309,664 (963,811) 0 60,867 (593,280)169 AEP Texas Central Company - Transmission 23,682,800 27,162,916 685,087 1,177,709 (1,718,379) 0 224,980 369,397
AEP Texas Central Co. $269,587,436 $310,261,922 $5,820,142 $13,310,551 ($19,627,774) $0 $2,561,007 $2,063,926
170 Indiana Michigan Power Co - Distribution $149,215,974 $187,253,368 $2,100,250 $7,313,170 ($11,846,013) $0 $1,417,511 ($1,015,082)132 Indiana Michigan Power Co - Generation 97,421,903 114,025,134 1,341,192 4,773,257 (7,213,452) 0 925,481 (173,522)190 Indiana Michigan Power Co - Nuclear 185,112,120 257,207,888 5,465,488 9,210,687 (16,271,472) 0 1,758,514 163,217120 Indiana Michigan Power Co - Transmission 33,276,577 41,109,444 437,828 1,629,430 (2,600,664) 0 316,118 (217,288)280 Ind Mich River Transp Lakin 29,513,698 42,936,886 1,126,218 1,480,839 (2,716,271) 0 280,372 171,158
Indiana Michigan Power Co. - FERC $494,540,272 $642,532,720 $10,470,976 $24,407,383 ($40,647,872) $0 $4,697,996 ($1,071,517)202 Price River Coal 0 0 0 0 0 0 0 0
Indiana Michigan Power Co. - SEC $494,540,272 $642,532,720 $10,470,976 $24,407,383 ($40,647,872) $0 $4,697,996 ($1,071,517)
110 Kentucky Power Co - Distribution $63,689,560 $84,244,612 $779,749 $3,115,826 ($5,329,478) $0 $605,033 ($828,870)117 Kentucky Power Co - Generation 31,199,700 40,762,824 316,389 1,523,184 (2,578,736) 0 296,389 (442,774)180 Kentucky Power Co - Transmission 7,143,774 9,731,319 137,909 351,926 (615,622) 0 67,864 (57,923)
Kentucky Power Co. $102,033,034 $134,738,755 $1,234,047 $4,990,936 ($8,523,836) $0 $969,286 ($1,329,567)
104 Cardinal Operating Company $67,818,099 $90,623,439 $1,226,874 $3,336,969 ($5,733,015) $0 $644,253 ($524,919)270 Cook Coal Terminal 2,953,456 4,074,234 73,438 146,291 (257,744) 0 28,057 (9,958)250 Ohio Power Co - Distribution 385,106,477 417,197,478 5,465,343 18,876,482 (26,392,725) 0 3,658,406 1,607,506181 Ohio Power Co - Generation 324,243,680 436,932,636 3,798,560 15,854,404 (27,641,210) 0 3,080,226 (4,908,020)160 Ohio Power Co - Transmission 65,793,678 80,630,951 840,498 3,220,455 (5,100,871) 0 625,022 (414,896)
Ohio Power Co. - FERC $845,915,390 $1,029,458,738 $11,404,713 $41,434,601 ($65,125,565) $0 $8,035,964 ($4,250,287)290 Conesville Coal Preparation Company 3,092,873 4,103,293 0 149,480 (259,582) 0 29,381 (80,721)
Ohio Power Co. - SEC $849,008,263 $1,033,562,031 $11,404,713 $41,584,081 ($65,385,147) $0 $8,065,345 ($4,331,008)
167 Public Service Co of Oklahoma - Distribution $138,878,832 $158,055,896 $3,893,315 $6,900,231 ($9,998,924) $0 $1,319,311 $2,113,933198 Public Service Co of Oklahoma - Generation 67,422,322 85,753,825 2,293,865 3,369,409 (5,424,954) 0 640,494 878,814114 Public Service Co of Oklahoma - Transmission 17,018,585 21,014,197 486,274 846,016 (1,329,399) 0 161,672 164,563
Public Service Co. of Oklahoma $223,319,739 $264,823,918 $6,673,454 $11,115,656 ($16,753,277) $0 $2,121,477 $3,157,310
159 Southwestern Electric Power Co - Distribution $83,781,386 $109,927,818 $3,074,987 $4,197,801 ($6,954,248) $0 $795,900 $1,114,440168 Southwestern Electric Power Co - Generation 90,411,145 113,638,516 3,484,949 4,538,033 (7,188,994) 0 858,881 1,692,869161 Southwestern Electric Power Co - Texas - Distribution 44,161,784 50,055,019 1,369,467 2,200,542 (3,166,578) 0 419,525 822,956111 Southwestern Electric Power Co - Texas - Transmission 127,550 276,537 0 6,165 (17,494) 0 1,212 (10,117)194 Southwestern Electric Power Co - Transmission 13,526,919 18,174,158 495,721 677,719 (1,149,733) 0 128,502 152,209
Southwestern Electric Power Co. $232,008,784 $292,072,048 $8,425,124 $11,620,260 ($18,477,047) $0 $2,204,020 $3,772,357
119 AEP Texas North Company - Distribution $56,632,093 $67,002,954 $1,573,103 $2,813,079 ($4,238,737) $0 $537,989 $685,434166 AEP Texas North Company - Generation 19,016,303 21,378,044 0 919,065 (1,352,417) 0 180,650 (252,702)192 AEP Texas North Company - Transmission 8,987,716 11,780,509 353,793 451,479 (745,258) 0 85,381 145,395
AEP Texas North Co. $84,636,112 $100,161,507 $1,926,896 $4,183,623 ($6,336,412) $0 $804,020 $578,127
230 Kingsport Power Co - Distribution $11,034,564 $13,623,765 $144,894 $540,307 ($861,866) $0 $104,825 ($71,840)260 Kingsport Power Co - Transmission 3,288,979 3,776,438 43,480 161,059 (238,905) 0 31,244 (3,122)
Kingsport Power Co. $14,323,543 $17,400,203 $188,374 $701,366 ($1,100,771) $0 $136,069 ($74,962)
210 Wheeling Power Co - Distribution $13,950,244 $15,957,162 $197,144 $683,749 ($1,009,481) $0 $132,523 $3,935200 Wheeling Power Co - Transmission 609,168 681,718 0 29,441 (43,127) 0 5,787 (7,899)
Wheeling Power Co. $14,559,412 $16,638,880 $197,144 $713,190 ($1,052,608) $0 $138,310 ($3,964)
103 American Electric Power Service Corporation $1,210,607,719 $1,412,052,080 $23,055,579 $59,623,406 ($89,329,167) $0 $11,500,444 $4,850,266American Electric Power Service Corp $1,210,607,719 $1,412,052,080 $23,055,579 $59,623,406 ($89,329,167) $0 $11,500,444 $4,850,266
143 AEP Pro Serv, Inc. $955,642 $1,039,810 $0 $46,187 ($65,780) $0 $9,078 ($10,515)171 CSW Energy, Inc. 4,675,691 7,096,764 280,121 239,516 (448,955) 0 44,418 115,100293 Elmwood 2,757,260 7,592,174 387,968 152,010 (480,296) 0 26,193 85,875292 AEP River Operations LLC 27,794,581 72,271,097 5,122,147 1,590,878 (4,572,010) 0 264,041 2,405,056189 Central Coal Company $0 $0 $0 $0 $0 $0 $0 $0400 AEP Energy, Inc. 304,338 560,321 0 14,709 (35,447) 0 2,891 (17,847)
Miscellaneous $36,487,512 $88,560,166 $5,790,236 $2,043,300 ($5,602,488) $0 $346,621 $2,577,669
Total $4,102,059,932 $5,010,433,951 $82,607,948 $202,246,561 ($316,969,814) $0 $38,968,446 $6,853,145
CAD E-32 Attachment 1
Page 73 of 77

70 American Electric Power System Retirement Plan
Towers Watson Confidential
AMERICAN ELECTRIC POWER QUALIFIED RETIREMENT PLANESTIMATED 2021 NET PERIODIC PENSION COST
Amortization of NetProjected Market-Related Expected Prior PeriodicBenefit Value Service Interest Return Service Amortization of Pension
Location Obligation of Assets Cost Cost on Assets Cost Gain/Loss Cost
140 Appalachian Power Co - Distribution $277,560,984 $368,805,480 $3,485,930 $13,566,661 ($23,331,445) $0 $2,383,576 ($3,895,278)215 Appalachian Power Co - Generation 235,569,212 275,136,312 3,603,687 11,545,324 (17,405,728) 0 2,022,969 (233,748)150 Appalachian Power Co - Transmission 43,581,401 54,427,701 442,269 2,125,105 (3,443,216) 0 374,259 (501,583)
Appalachian Power Co. - FERC $556,711,597 $698,369,493 $7,531,886 $27,237,090 ($44,180,389) $0 $4,780,804 ($4,630,609)225 Cedar Coal Co 3,101,067 4,260,847 0 149,694 (269,551) 0 26,631 (93,226)
Appalachian Power Co. - SEC $559,812,664 $702,630,340 $7,531,886 $27,386,784 ($44,449,940) $0 $4,807,435 ($4,723,835)
211 AEP Texas Central Company - Distribution $234,826,382 $267,556,999 $5,211,599 $11,587,083 ($16,926,244) $0 $2,016,590 $1,889,028147 AEP Texas Central Company - Generation 6,282,272 15,363,213 0 303,257 (971,911) 0 53,949 (614,705)169 AEP Texas Central Company - Transmission 23,220,905 27,524,216 695,299 1,154,480 (1,741,242) 0 199,411 307,948
AEP Texas Central Co. $264,329,559 $310,444,428 $5,906,898 $13,044,820 ($19,639,397) $0 $2,269,950 $1,582,271
170 Indiana Michigan Power Co - Distribution $146,305,751 $188,680,451 $2,131,556 $7,165,347 ($11,936,340) $0 $1,256,412 ($1,383,025)132 Indiana Michigan Power Co - Generation 95,521,842 114,907,472 1,361,184 4,676,725 (7,269,299) 0 820,301 (411,089)190 Indiana Michigan Power Co - Nuclear 181,501,800 264,277,266 5,546,958 9,029,194 (16,718,761) 0 1,558,661 (583,948)120 Indiana Michigan Power Co - Transmission 32,627,570 41,443,670 444,354 1,596,444 (2,621,818) 0 280,192 (300,828)280 Ind Mich River Transp Lakin 28,938,080 43,984,184 1,143,005 1,452,070 (2,782,536) 0 248,508 61,047
Indiana Michigan Power Co. - FERC $484,895,043 $653,293,043 $10,627,057 $23,919,780 ($41,328,754) $0 $4,164,074 ($2,617,843)202 Price River Coal 0 0 0 0 0 0 0 0
Indiana Michigan Power Co. - SEC $484,895,043 $653,293,043 $10,627,057 $23,919,780 ($41,328,754) $0 $4,164,074 ($2,617,843)
110 Kentucky Power Co - Distribution $62,447,396 $85,271,653 $791,372 $3,052,654 ($5,394,472) $0 $536,272 ($1,014,174)117 Kentucky Power Co - Generation 30,591,199 41,225,825 321,105 1,492,195 (2,608,036) 0 262,704 (532,032)180 Kentucky Power Co - Transmission 7,004,446 9,993,984 139,965 344,874 (632,241) 0 60,151 (87,251)
Kentucky Power Co. $100,043,041 $136,491,462 $1,252,442 $4,889,723 ($8,634,749) $0 $859,127 ($1,633,457)
104 Cardinal Operating Company $66,495,414 $91,870,968 $1,245,162 $3,269,964 ($5,811,959) $0 $571,034 ($725,799)270 Cook Coal Terminal 2,895,853 4,008,316 74,533 143,386 (253,575) 0 24,868 (10,788)250 Ohio Power Co - Distribution 377,595,582 414,734,442 5,546,810 18,495,000 (26,237,012) 0 3,242,631 1,047,429181 Ohio Power Co - Generation 317,919,819 441,925,175 3,855,182 15,532,682 (27,957,158) 0 2,730,161 (5,839,133)160 Ohio Power Co - Transmission 64,510,477 81,058,971 853,026 3,155,219 (5,127,969) 0 553,989 (565,735)
Ohio Power Co. - FERC $829,417,145 $1,033,597,872 $11,574,713 $40,596,251 ($65,387,673) $0 $7,122,683 ($6,094,026)290 Conesville Coal Preparation Company 3,032,552 4,124,338 0 146,387 (260,915) 0 26,042 (88,486)
Ohio Power Co. - SEC $832,449,697 $1,037,722,210 $11,574,713 $40,742,638 ($65,648,588) $0 $7,148,725 ($6,182,512)
167 Public Service Co of Oklahoma - Distribution $136,170,219 $159,501,973 $3,951,350 $6,763,930 ($10,090,445) $0 $1,169,372 $1,794,207198 Public Service Co of Oklahoma - Generation 66,107,356 86,784,923 2,328,058 3,303,506 (5,490,205) 0 567,702 709,061114 Public Service Co of Oklahoma - Transmission 16,686,664 21,292,082 493,522 829,320 (1,346,984) 0 143,298 119,156
Public Service Co. of Oklahoma $218,964,239 $267,578,978 $6,772,930 $10,896,756 ($16,927,634) $0 $1,880,372 $2,622,424
159 Southwestern Electric Power Co - Distribution $82,147,363 $112,437,660 $3,120,823 $4,116,055 ($7,113,053) $0 $705,447 $829,272168 Southwestern Electric Power Co - Generation 88,647,819 115,966,362 3,536,896 4,449,929 (7,336,287) 0 761,270 1,411,808161 Southwestern Electric Power Co - Texas - Distribution 43,300,478 50,606,031 1,389,880 2,157,287 (3,201,449) 0 371,846 717,564111 Southwestern Electric Power Co - Texas - Transmission 125,062 282,424 0 6,037 (17,867) 0 1,074 (10,756)194 Southwestern Electric Power Co - Transmission 13,263,098 18,703,297 503,110 664,521 (1,183,212) 0 113,898 98,317
Southwestern Electric Power Co. $227,483,820 $297,995,774 $8,550,709 $11,393,829 ($18,851,868) $0 $1,953,535 $3,046,205
119 AEP Texas North Company - Distribution $55,527,573 $67,748,374 $1,596,552 $2,757,488 ($4,285,911) $0 $476,847 $544,976166 AEP Texas North Company - Generation 18,645,420 21,006,457 0 900,049 (1,328,915) 0 160,119 (268,747)192 AEP Texas North Company - Transmission 8,812,425 11,992,497 359,067 442,725 (758,672) 0 75,677 118,797
AEP Texas North Co. $82,985,418 $100,747,328 $1,955,619 $4,100,262 ($6,373,498) $0 $712,643 $395,026
230 Kingsport Power Co - Distribution $10,819,352 $13,687,790 $147,054 $529,369 ($865,920) $0 $92,912 ($96,585)260 Kingsport Power Co - Transmission 3,224,833 3,774,111 44,128 157,799 (238,759) 0 27,694 (9,138)
Kingsport Power Co. $14,044,185 $17,461,901 $191,182 $687,168 ($1,104,679) $0 $120,606 ($105,723)
210 Wheeling Power Co - Distribution $13,678,166 $16,002,660 $200,083 $669,929 ($1,012,363) $0 $117,462 ($24,889)200 Wheeling Power Co - Transmission 597,287 663,730 0 28,832 (41,989) 0 5,129 (8,028)
Wheeling Power Co. $14,275,453 $16,666,390 $200,083 $698,761 ($1,054,352) $0 $122,591 ($32,917)
103 American Electric Power Service Corporation $1,186,996,726 $1,424,935,513 $23,399,248 $58,428,079 ($90,144,552) $0 $10,193,423 $1,876,199American Electric Power Service Corp $1,186,996,726 $1,424,935,513 $23,399,248 $58,428,079 ($90,144,552) $0 $10,193,423 $1,876,199
143 AEP Pro Serv, Inc. $937,003 $1,058,089 $0 $45,231 ($66,937) $0 $8,047 ($13,659)171 CSW Energy, Inc. 4,584,499 7,523,487 284,296 235,026 (475,952) 0 39,370 82,740293 Elmwood 2,703,484 8,176,489 393,751 149,509 (517,263) 0 23,216 49,213292 AEP River Operations LLC 27,252,492 78,994,284 5,198,499 1,566,470 (4,997,352) 0 234,033 2,001,650189 Central Coal Company $0 $0 $0 $0 $0 $0 $0 $0400 AEP Energy, Inc. 298,402 580,695 0 14,404 (36,736) 0 2,563 (19,769)
Miscellaneous $35,775,880 $96,333,044 $5,876,546 $2,010,640 ($6,094,240) $0 $307,229 $2,100,175
Total $4,022,055,725 $5,062,300,411 $83,839,313 $198,199,240 ($320,252,251) $0 $34,539,710 ($3,673,987)
CAD E-32 Attachment 1
Page 74 of 77
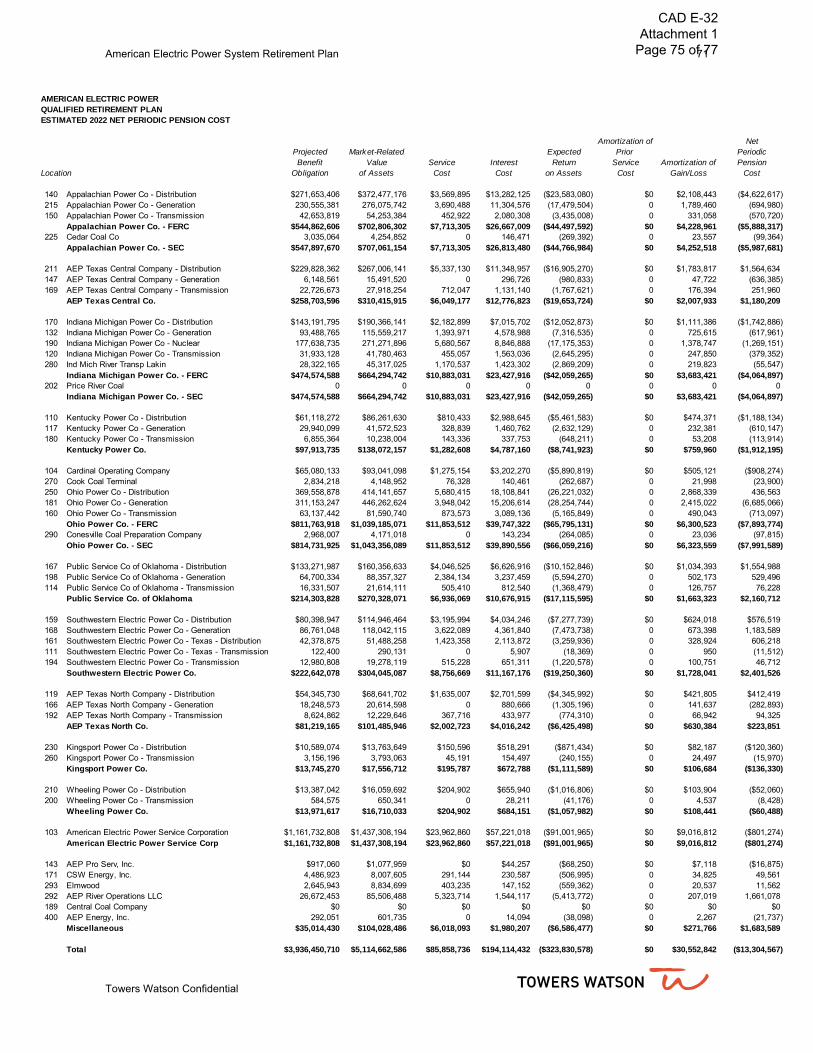
American Electric Power System Retirement Plan 71
Towers Watson Confidential
AMERICAN ELECTRIC POWER QUALIFIED RETIREMENT PLANESTIMATED 2022 NET PERIODIC PENSION COST
Amortization of NetProjected Market-Related Expected Prior PeriodicBenefit Value Service Interest Return Service Amortization of Pension
Location Obligation of Assets Cost Cost on Assets Cost Gain/Loss Cost
140 Appalachian Power Co - Distribution $271,653,406 $372,477,176 $3,569,895 $13,282,125 ($23,583,080) $0 $2,108,443 ($4,622,617)215 Appalachian Power Co - Generation 230,555,381 276,075,742 3,690,488 11,304,576 (17,479,504) 0 1,789,460 (694,980)150 Appalachian Power Co - Transmission 42,653,819 54,253,384 452,922 2,080,308 (3,435,008) 0 331,058 (570,720)
Appalachian Power Co. - FERC $544,862,606 $702,806,302 $7,713,305 $26,667,009 ($44,497,592) $0 $4,228,961 ($5,888,317)225 Cedar Coal Co 3,035,064 4,254,852 0 146,471 (269,392) 0 23,557 (99,364)
Appalachian Power Co. - SEC $547,897,670 $707,061,154 $7,713,305 $26,813,480 ($44,766,984) $0 $4,252,518 ($5,987,681)
211 AEP Texas Central Company - Distribution $229,828,362 $267,006,141 $5,337,130 $11,348,957 ($16,905,270) $0 $1,783,817 $1,564,634147 AEP Texas Central Company - Generation 6,148,561 15,491,520 0 296,726 (980,833) 0 47,722 (636,385)169 AEP Texas Central Company - Transmission 22,726,673 27,918,254 712,047 1,131,140 (1,767,621) 0 176,394 251,960
AEP Texas Central Co. $258,703,596 $310,415,915 $6,049,177 $12,776,823 ($19,653,724) $0 $2,007,933 $1,180,209
170 Indiana Michigan Power Co - Distribution $143,191,795 $190,366,141 $2,182,899 $7,015,702 ($12,052,873) $0 $1,111,386 ($1,742,886)132 Indiana Michigan Power Co - Generation 93,488,765 115,559,217 1,393,971 4,578,988 (7,316,535) 0 725,615 (617,961)190 Indiana Michigan Power Co - Nuclear 177,638,735 271,271,896 5,680,567 8,846,888 (17,175,353) 0 1,378,747 (1,269,151)120 Indiana Michigan Power Co - Transmission 31,933,128 41,780,463 455,057 1,563,036 (2,645,295) 0 247,850 (379,352)280 Ind Mich River Transp Lakin 28,322,165 45,317,025 1,170,537 1,423,302 (2,869,209) 0 219,823 (55,547)
Indiana Michigan Power Co. - FERC $474,574,588 $664,294,742 $10,883,031 $23,427,916 ($42,059,265) $0 $3,683,421 ($4,064,897)202 Price River Coal 0 0 0 0 0 0 0 0
Indiana Michigan Power Co. - SEC $474,574,588 $664,294,742 $10,883,031 $23,427,916 ($42,059,265) $0 $3,683,421 ($4,064,897)
110 Kentucky Power Co - Distribution $61,118,272 $86,261,630 $810,433 $2,988,645 ($5,461,583) $0 $474,371 ($1,188,134)117 Kentucky Power Co - Generation 29,940,099 41,572,523 328,839 1,460,762 (2,632,129) 0 232,381 (610,147)180 Kentucky Power Co - Transmission 6,855,364 10,238,004 143,336 337,753 (648,211) 0 53,208 (113,914)
Kentucky Power Co. $97,913,735 $138,072,157 $1,282,608 $4,787,160 ($8,741,923) $0 $759,960 ($1,912,195)
104 Cardinal Operating Company $65,080,133 $93,041,098 $1,275,154 $3,202,270 ($5,890,819) $0 $505,121 ($908,274)270 Cook Coal Terminal 2,834,218 4,148,952 76,328 140,461 (262,687) 0 21,998 (23,900)250 Ohio Power Co - Distribution 369,558,878 414,141,657 5,680,415 18,108,841 (26,221,032) 0 2,868,339 436,563181 Ohio Power Co - Generation 311,153,247 446,262,624 3,948,042 15,206,614 (28,254,744) 0 2,415,022 (6,685,066)160 Ohio Power Co - Transmission 63,137,442 81,590,740 873,573 3,089,136 (5,165,849) 0 490,043 (713,097)
Ohio Power Co. - FERC $811,763,918 $1,039,185,071 $11,853,512 $39,747,322 ($65,795,131) $0 $6,300,523 ($7,893,774)290 Conesville Coal Preparation Company 2,968,007 4,171,018 0 143,234 (264,085) 0 23,036 (97,815)
Ohio Power Co. - SEC $814,731,925 $1,043,356,089 $11,853,512 $39,890,556 ($66,059,216) $0 $6,323,559 ($7,991,589)
167 Public Service Co of Oklahoma - Distribution $133,271,987 $160,356,633 $4,046,525 $6,626,916 ($10,152,846) $0 $1,034,393 $1,554,988198 Public Service Co of Oklahoma - Generation 64,700,334 88,357,327 2,384,134 3,237,459 (5,594,270) 0 502,173 529,496114 Public Service Co of Oklahoma - Transmission 16,331,507 21,614,111 505,410 812,540 (1,368,479) 0 126,757 76,228
Public Service Co. of Oklahoma $214,303,828 $270,328,071 $6,936,069 $10,676,915 ($17,115,595) $0 $1,663,323 $2,160,712
159 Southwestern Electric Power Co - Distribution $80,398,947 $114,946,464 $3,195,994 $4,034,246 ($7,277,739) $0 $624,018 $576,519168 Southwestern Electric Power Co - Generation 86,761,048 118,042,115 3,622,089 4,361,840 (7,473,738) 0 673,398 1,183,589161 Southwestern Electric Power Co - Texas - Distribution 42,378,875 51,488,258 1,423,358 2,113,872 (3,259,936) 0 328,924 606,218111 Southwestern Electric Power Co - Texas - Transmission 122,400 290,131 0 5,907 (18,369) 0 950 (11,512)194 Southwestern Electric Power Co - Transmission 12,980,808 19,278,119 515,228 651,311 (1,220,578) 0 100,751 46,712
Southwestern Electric Power Co. $222,642,078 $304,045,087 $8,756,669 $11,167,176 ($19,250,360) $0 $1,728,041 $2,401,526
119 AEP Texas North Company - Distribution $54,345,730 $68,641,702 $1,635,007 $2,701,599 ($4,345,992) $0 $421,805 $412,419166 AEP Texas North Company - Generation 18,248,573 20,614,598 0 880,666 (1,305,196) 0 141,637 (282,893)192 AEP Texas North Company - Transmission 8,624,862 12,229,646 367,716 433,977 (774,310) 0 66,942 94,325
AEP Texas North Co. $81,219,165 $101,485,946 $2,002,723 $4,016,242 ($6,425,498) $0 $630,384 $223,851
230 Kingsport Power Co - Distribution $10,589,074 $13,763,649 $150,596 $518,291 ($871,434) $0 $82,187 ($120,360)260 Kingsport Power Co - Transmission 3,156,196 3,793,063 45,191 154,497 (240,155) 0 24,497 (15,970)
Kingsport Power Co. $13,745,270 $17,556,712 $195,787 $672,788 ($1,111,589) $0 $106,684 ($136,330)
210 Wheeling Power Co - Distribution $13,387,042 $16,059,692 $204,902 $655,940 ($1,016,806) $0 $103,904 ($52,060)200 Wheeling Power Co - Transmission 584,575 650,341 0 28,211 (41,176) 0 4,537 (8,428)
Wheeling Power Co. $13,971,617 $16,710,033 $204,902 $684,151 ($1,057,982) $0 $108,441 ($60,488)
103 American Electric Power Service Corporation $1,161,732,808 $1,437,308,194 $23,962,860 $57,221,018 ($91,001,965) $0 $9,016,812 ($801,274)American Electric Power Service Corp $1,161,732,808 $1,437,308,194 $23,962,860 $57,221,018 ($91,001,965) $0 $9,016,812 ($801,274)
143 AEP Pro Serv, Inc. $917,060 $1,077,959 $0 $44,257 ($68,250) $0 $7,118 ($16,875)171 CSW Energy, Inc. 4,486,923 8,007,605 291,144 230,587 (506,995) 0 34,825 49,561293 Elmwood 2,645,943 8,834,699 403,235 147,152 (559,362) 0 20,537 11,562292 AEP River Operations LLC 26,672,453 85,506,488 5,323,714 1,544,117 (5,413,772) 0 207,019 1,661,078189 Central Coal Company $0 $0 $0 $0 $0 $0 $0 $0400 AEP Energy, Inc. 292,051 601,735 0 14,094 (38,098) 0 2,267 (21,737)
Miscellaneous $35,014,430 $104,028,486 $6,018,093 $1,980,207 ($6,586,477) $0 $271,766 $1,683,589
Total $3,936,450,710 $5,114,662,586 $85,858,736 $194,114,432 ($323,830,578) $0 $30,552,842 ($13,304,567)
CAD E-32 Attachment 1
Page 75 of 77
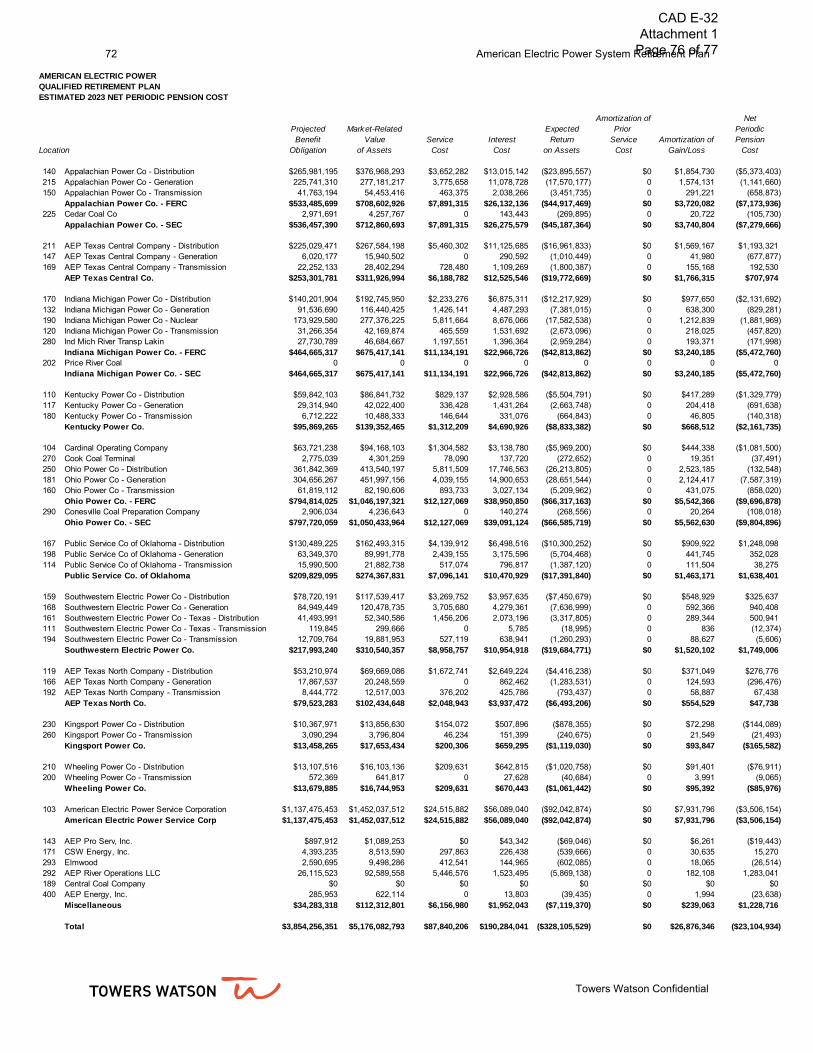
72 American Electric Power System Retirement Plan
Towers Watson Confidential
AMERICAN ELECTRIC POWER QUALIFIED RETIREMENT PLANESTIMATED 2023 NET PERIODIC PENSION COST
Amortization of NetProjected Market-Related Expected Prior PeriodicBenefit Value Service Interest Return Service Amortization of Pension
Location Obligation of Assets Cost Cost on Assets Cost Gain/Loss Cost
140 Appalachian Power Co - Distribution $265,981,195 $376,968,293 $3,652,282 $13,015,142 ($23,895,557) $0 $1,854,730 ($5,373,403)215 Appalachian Power Co - Generation 225,741,310 277,181,217 3,775,658 11,078,728 (17,570,177) 0 1,574,131 (1,141,660)150 Appalachian Power Co - Transmission 41,763,194 54,453,416 463,375 2,038,266 (3,451,735) 0 291,221 (658,873)
Appalachian Power Co. - FERC $533,485,699 $708,602,926 $7,891,315 $26,132,136 ($44,917,469) $0 $3,720,082 ($7,173,936)225 Cedar Coal Co 2,971,691 4,257,767 0 143,443 (269,895) 0 20,722 (105,730)
Appalachian Power Co. - SEC $536,457,390 $712,860,693 $7,891,315 $26,275,579 ($45,187,364) $0 $3,740,804 ($7,279,666)
211 AEP Texas Central Company - Distribution $225,029,471 $267,584,198 $5,460,302 $11,125,685 ($16,961,833) $0 $1,569,167 $1,193,321147 AEP Texas Central Company - Generation 6,020,177 15,940,502 0 290,592 (1,010,449) 0 41,980 (677,877)169 AEP Texas Central Company - Transmission 22,252,133 28,402,294 728,480 1,109,269 (1,800,387) 0 155,168 192,530
AEP Texas Central Co. $253,301,781 $311,926,994 $6,188,782 $12,525,546 ($19,772,669) $0 $1,766,315 $707,974
170 Indiana Michigan Power Co - Distribution $140,201,904 $192,745,950 $2,233,276 $6,875,311 ($12,217,929) $0 $977,650 ($2,131,692)132 Indiana Michigan Power Co - Generation 91,536,690 116,440,425 1,426,141 4,487,293 (7,381,015) 0 638,300 (829,281)190 Indiana Michigan Power Co - Nuclear 173,929,580 277,376,225 5,811,664 8,676,066 (17,582,538) 0 1,212,839 (1,881,969)120 Indiana Michigan Power Co - Transmission 31,266,354 42,169,874 465,559 1,531,692 (2,673,096) 0 218,025 (457,820)280 Ind Mich River Transp Lakin 27,730,789 46,684,667 1,197,551 1,396,364 (2,959,284) 0 193,371 (171,998)
Indiana Michigan Power Co. - FERC $464,665,317 $675,417,141 $11,134,191 $22,966,726 ($42,813,862) $0 $3,240,185 ($5,472,760)202 Price River Coal 0 0 0 0 0 0 0 0
Indiana Michigan Power Co. - SEC $464,665,317 $675,417,141 $11,134,191 $22,966,726 ($42,813,862) $0 $3,240,185 ($5,472,760)
110 Kentucky Power Co - Distribution $59,842,103 $86,841,732 $829,137 $2,928,586 ($5,504,791) $0 $417,289 ($1,329,779)117 Kentucky Power Co - Generation 29,314,940 42,022,400 336,428 1,431,264 (2,663,748) 0 204,418 (691,638)180 Kentucky Power Co - Transmission 6,712,222 10,488,333 146,644 331,076 (664,843) 0 46,805 (140,318)
Kentucky Power Co. $95,869,265 $139,352,465 $1,312,209 $4,690,926 ($8,833,382) $0 $668,512 ($2,161,735)
104 Cardinal Operating Company $63,721,238 $94,168,103 $1,304,582 $3,138,780 ($5,969,200) $0 $444,338 ($1,081,500)270 Cook Coal Terminal 2,775,039 4,301,259 78,090 137,720 (272,652) 0 19,351 (37,491)250 Ohio Power Co - Distribution 361,842,369 413,540,197 5,811,509 17,746,563 (26,213,805) 0 2,523,185 (132,548)181 Ohio Power Co - Generation 304,656,267 451,997,156 4,039,155 14,900,653 (28,651,544) 0 2,124,417 (7,587,319)160 Ohio Power Co - Transmission 61,819,112 82,190,606 893,733 3,027,134 (5,209,962) 0 431,075 (858,020)
Ohio Power Co. - FERC $794,814,025 $1,046,197,321 $12,127,069 $38,950,850 ($66,317,163) $0 $5,542,366 ($9,696,878)290 Conesville Coal Preparation Company 2,906,034 4,236,643 0 140,274 (268,556) 0 20,264 (108,018)
Ohio Power Co. - SEC $797,720,059 $1,050,433,964 $12,127,069 $39,091,124 ($66,585,719) $0 $5,562,630 ($9,804,896)
167 Public Service Co of Oklahoma - Distribution $130,489,225 $162,493,315 $4,139,912 $6,498,516 ($10,300,252) $0 $909,922 $1,248,098198 Public Service Co of Oklahoma - Generation 63,349,370 89,991,778 2,439,155 3,175,596 (5,704,468) 0 441,745 352,028114 Public Service Co of Oklahoma - Transmission 15,990,500 21,882,738 517,074 796,817 (1,387,120) 0 111,504 38,275
Public Service Co. of Oklahoma $209,829,095 $274,367,831 $7,096,141 $10,470,929 ($17,391,840) $0 $1,463,171 $1,638,401
159 Southwestern Electric Power Co - Distribution $78,720,191 $117,539,417 $3,269,752 $3,957,635 ($7,450,679) $0 $548,929 $325,637168 Southwestern Electric Power Co - Generation 84,949,449 120,478,735 3,705,680 4,279,361 (7,636,999) 0 592,366 940,408161 Southwestern Electric Power Co - Texas - Distribution 41,493,991 52,340,586 1,456,206 2,073,196 (3,317,805) 0 289,344 500,941111 Southwestern Electric Power Co - Texas - Transmission 119,845 299,666 0 5,785 (18,995) 0 836 (12,374)194 Southwestern Electric Power Co - Transmission 12,709,764 19,881,953 527,119 638,941 (1,260,293) 0 88,627 (5,606)
Southwestern Electric Power Co. $217,993,240 $310,540,357 $8,958,757 $10,954,918 ($19,684,771) $0 $1,520,102 $1,749,006
119 AEP Texas North Company - Distribution $53,210,974 $69,669,086 $1,672,741 $2,649,224 ($4,416,238) $0 $371,049 $276,776166 AEP Texas North Company - Generation 17,867,537 20,248,559 0 862,462 (1,283,531) 0 124,593 (296,476)192 AEP Texas North Company - Transmission 8,444,772 12,517,003 376,202 425,786 (793,437) 0 58,887 67,438
AEP Texas North Co. $79,523,283 $102,434,648 $2,048,943 $3,937,472 ($6,493,206) $0 $554,529 $47,738
230 Kingsport Power Co - Distribution $10,367,971 $13,856,630 $154,072 $507,896 ($878,355) $0 $72,298 ($144,089)260 Kingsport Power Co - Transmission 3,090,294 3,796,804 46,234 151,399 (240,675) 0 21,549 (21,493)
Kingsport Power Co. $13,458,265 $17,653,434 $200,306 $659,295 ($1,119,030) $0 $93,847 ($165,582)
210 Wheeling Power Co - Distribution $13,107,516 $16,103,136 $209,631 $642,815 ($1,020,758) $0 $91,401 ($76,911)200 Wheeling Power Co - Transmission 572,369 641,817 0 27,628 (40,684) 0 3,991 (9,065)
Wheeling Power Co. $13,679,885 $16,744,953 $209,631 $670,443 ($1,061,442) $0 $95,392 ($85,976)
103 American Electric Power Service Corporation $1,137,475,453 $1,452,037,512 $24,515,882 $56,089,040 ($92,042,874) $0 $7,931,796 ($3,506,154)American Electric Power Service Corp $1,137,475,453 $1,452,037,512 $24,515,882 $56,089,040 ($92,042,874) $0 $7,931,796 ($3,506,154)
143 AEP Pro Serv, Inc. $897,912 $1,089,253 $0 $43,342 ($69,046) $0 $6,261 ($19,443)171 CSW Energy, Inc. 4,393,235 8,513,590 297,863 226,438 (539,666) 0 30,635 15,270293 Elmwood 2,590,695 9,498,286 412,541 144,965 (602,085) 0 18,065 (26,514)292 AEP River Operations LLC 26,115,523 92,589,558 5,446,576 1,523,495 (5,869,138) 0 182,108 1,283,041189 Central Coal Company $0 $0 $0 $0 $0 $0 $0 $0400 AEP Energy, Inc. 285,953 622,114 0 13,803 (39,435) 0 1,994 (23,638)
Miscellaneous $34,283,318 $112,312,801 $6,156,980 $1,952,043 ($7,119,370) $0 $239,063 $1,228,716
Total $3,854,256,351 $5,176,082,793 $87,840,206 $190,284,041 ($328,105,529) $0 $26,876,346 ($23,104,934)
CAD E-32 Attachment 1
Page 76 of 77
American Electric Power System Retirement Plan 73
Towers Watson Confidential
Non-Reliance Notice for Attachment to Reports Distributed to Third Parties
NOTICE
By accepting a copy of this report, the Recipient agrees that it has read and understands the following:
1. Towers Watson Pennsylvania Inc. (“Towers Watson”) represents and is responsible exclusively to its client, AEP with respect to all matters relating to this report. There are no third-party beneficiaries of this report or the work underlying it.
2. Recipient is responsible for its own due diligence with respect to all matters relating to this report.
Recipient is DEEMED TO HAVE AGREED to the following conditions by receiving, downloading, printing or otherwise having possession of this report:
Recipient recognizes that Towers Watson’s consulting staff is available, with AEP prior consent and at AEP expense, to answer any questions concerning this report; and
Recipient agrees that by accepting this report (including any information related to the report that may be subsequently provided to Recipient by or on behalf of Towers Watson), Recipient will place no reliance on this report or information contained herein, or related hereto, that would result in the creation of any duty or liability by Towers Watson to Recipient.
CAD E-32 Attachment 1
Page 77 of 77