american finance association - higher school of … 16 the modern industrial... · presidential...
TRANSCRIPT

American Finance Association
The Modern Industrial Revolution, Exit, and the Failure of Internal Control SystemsAuthor(s): Michael C. JensenSource: The Journal of Finance, Vol. 48, No. 3, Papers and Proceedings of the Fifty-ThirdAnnual Meeting of the American Finance Association: Anaheim, California January 5-7, 1993(Jul., 1993), pp. 831-880Published by: Blackwell Publishing for the American Finance AssociationStable URL: http://www.jstor.org/stable/2329018Accessed: 14/09/2009 04:49
Your use of the JSTOR archive indicates your acceptance of JSTOR's Terms and Conditions of Use, available athttp://www.jstor.org/page/info/about/policies/terms.jsp. JSTOR's Terms and Conditions of Use provides, in part, that unlessyou have obtained prior permission, you may not download an entire issue of a journal or multiple copies of articles, and youmay use content in the JSTOR archive only for your personal, non-commercial use.
Please contact the publisher regarding any further use of this work. Publisher contact information may be obtained athttp://www.jstor.org/action/showPublisher?publisherCode=black.
Each copy of any part of a JSTOR transmission must contain the same copyright notice that appears on the screen or printedpage of such transmission.
JSTOR is a not-for-profit organization founded in 1995 to build trusted digital archives for scholarship. We work with thescholarly community to preserve their work and the materials they rely upon, and to build a common research platform thatpromotes the discovery and use of these resources. For more information about JSTOR, please contact [email protected].
Blackwell Publishing and American Finance Association are collaborating with JSTOR to digitize, preserveand extend access to The Journal of Finance.
http://www.jstor.org

Owl l
. :. .........WE
MI,~
. ...ic a l C. J .. .... .... l-
.. ...... .
s!~~~ ._ _ I m *~~~~~~~~~~~~~~~~~~~~~~~~~~~~~~~~~~~~~~. . i... ... .........
*'~~Mche C,. '''nsen
President of the American Finance Association
1992
THE JOURNAL OF FINANCE * VOL. XLVIII, NO. 3 * JULY 1993
The Modern Industrial Revolution, Exit, and the Failure of Internal
Control Systems
MICHAEL C. JENSEN*
ABSTRACT
Since 1973 technological, political, regulatory, and economic forces have been changing the worldwide economy in a fashion comparable to the changes experi- enced during the nineteenth century Industrial Revolution. As in the nineteenth century, we are experiencing declining costs, increasing average (but decreasing marginal) productivity of labor, reduced growth rates of labor income, excess capacity, and the requirement for downsizing and exit. The last two decades indicate corporate internal control systems have failed to deal effectively with these changes, especially slow growth and the requirement for exit. The next several decades pose a major challenge for Western firms and political systems as these forces continue to work their way through the worldwide economy.
I. Introduction
Parallels between the Modern and Historical Industrial Revolutions
Fundamental technological, political, regulatory, and economic forces are radically changing the worldwide competitive environment. We have not seen such a metamorphosis of the economic landscape since the Industrial Revolu- tion of the nineteenth century. The scope and pace of the changes over the past two decades qualify this period as a modern industrial revolution, and I predict it will take decades for these forces to be fully worked out in the worldwide economy.
Although the current and historical economic transformations occurred a century apart, the parallels between the two are strikingly similar: most notably, the widespread technological and organizational change leading to declining costs, increasing average but decreasing marginal productivity of labor, reduced growth rates in labor income, excess capacity, and-ultimately -downsizing and exit.
*Harvard Business School. Presidential Address to the American Finance Association, January 1993, Anaheim, California. I appreciate the research assistance of Chris Allen, Brian Barry, Susan Brumfield, Karin Monsler, and particularly Donna Feinberg, the support of the Division of Research of the Harvard Business School, and the comments of and discussions with George Baker, Carliss Baldwin, Joe Bower, Alfred Chandler, Harry and Linda DeAngelo, Ben Esty, Takashi Hikino, Steve Kaplan, Nancy Koehn, Claudio Loderer, George Lodge, John Long, Kevin Murphy, Malcolm Salter, Rene Stulz, Richard Tedlow, and especially Richad Hackman, Richard Hall, and Karen Wruck on many of these ideas.
831
832 The Journal of Finance
The capital markets played a major role in eliminating excess capacity both in the nineteenth century and in the 1980s. The merger boom of the 1890s brought about a massive consolidation of independent firms and the closure of marginal facilities. In the 1980s the capital markets helped eliminate excess capacity through leveraged acquisitions, stock buybacks, hostile takeovers, leveraged buyouts, and divisional sales. Just as the takeover specialists of the 1980s were disparaged by managers, policymakers, and the press, the so-called Robber Barons were criticized in the nineteenth century. In both cases the criticism was followed by public policy changes that restricted the capital markets: in the nineteenth century the passage of antitrust laws restricting combinations, and in the late 1980s the reregula- tion of the credit markets, antitakeover legislation, and court decisions that restricted the market for corporate control.
Although the vast increases in productivity associated with the nineteenth century industrial revolution increased aggregate welfare, the large costs associated with the obsolescence of human and physical capital generated substantial hardship, misunderstanding, and bitterness. As noted in 1873 by Henry Ward Beecher, a well-known commentator and influential clergyman of the time,
The present period will always be memorable in the dark days of commerce in America. We have had commercial darkness at other times. There have been these depressions, but none so obstinate and none so universal ... Great Britain has felt it; France has felt it; all Austria and her neighborhood has experienced it. It is cosmopolitan. It is distin- guished by its obstinacy from former like periods of commercial depression. Remedies have no effect. Party confidence, all stimulating persuasion, have not lifted the pall, and practical men have waited, feeling that if they could tide over a year they could get along; but they could not tide over the year. If only one or two years could elapse they could save themselves. The years have lapsed, and they were worse off than they were before. What is the matter? What has happened? Why, from the very height of prosperity without any visible warning, without even a cloud the size of a man's hand visible on the horizon, has the cloud gathered, as it were, from the center first, spreading all over the sky? (Price (1933), p. 6).
On July 4, 1892, the Populist Party platform adopted at the party's first convention in Omaha reflected similar discontent and conflict:
We meet in the midst of a nation brought to the verge of moral, political, and material ruin.... The fruits of the toil of millions are boldly stolen to build up colossal fortunes for the few, unprecedented in the history of mankind; and the possessors of these in turn despise the republic and endanger liberty. From the same prolific womb of government injustice are bred two great classes of tramps and millionaires. (McMurray (1929), p. 7).

The Modern Industrial Revolution, Exit, and Control Systems 833
Technological and other developments that began in the mid-twentieth century have culminated in the past two decades in a similar situation: rapidly improving productivity, the creation of overcapacity and, conse- quently, the requirement for exit. Although efficient exit-because of the ramifications it has on productivity and human welfare-remains an issue of great importance, research on the topic has been relatively sparse since the 1942 publication of Schumpeter's insights on creative destruction.' These insights will almost certainly receive renewed attention in the coming decade:
Every piece of business strategy acquires its true significance only against the background of that process and within the situation created by it. It must be seen in its role in the perennial gale of creative destruction; it cannot be understood irrespective of it or, in fact, on the hypothesis that there is a perennial lull ... The usual theorist's paper and the usual government commission's report practically never try to see that behavior, on the one hand, as a result of a piece of past history and, on the other hand, as an attempt to deal with a situation that is sure to change presently-as an attempt by those firms to keep on their feet, on ground that is slipping away from under them. In other words, the problem that is usually being visualized is how capitalism adminis- ters existing structures, whereas the relevant problem is how it creates and destroys them. (Schumpeter (1976), p. 83).
Current technological and political changes are bringing this issue to the forefront. It is important for managers, policymakers, and researchers to understand the magnitude and generality of the implications of these forces.
Outline of the Paper
In this paper, I review the industrial revolutions of the nineteenth century and draw on these experiences to enlighten our understanding of current economic trends. Drawing parallels to the 1800s, I discuss in some detail the changes that mandate exit in today's economy. I address those factors that hinder efficient exit, and outline the control forces acting on the corporation to eventually overcome these barriers. Specifically, I describe the role of the market for corporate control in affecting efficient exit, and how the shutdown of the capital markets has, to a great extent, transferred this challenge to corporate internal control mechanisms. I summarize evidence, however, indi- cating that internal control systems have largely failed in bringing about timely exit and downsizing, leaving only the product market or legal/
lIn a rare finance study of exit, DeAngelo and DeAngelo (1991) analyze the retrenchment of the U.S. steel industry in the 1980s. Ghemawat and Nalebuff (1985) have an interesting paper entitled "Exit," and Anderson (1986) provides a detailed comparison of U.S. and Japanese retrenchment in the 1970s and early 1980s and their respective political and regulatory policies toward the issues. Bower (1984, 1986) analyzes the private and political responses to decline in the petrochemical industry. Harrigan (1988, 1980) conducts detailed firm and industry studies. See also Hirschman's (1970) work on exit.
834 The Journal of Finance
political/regulatory system to resolve excess capacity. Although overcapacity will in the end be eliminated by product market forces, this solution gener- ates large, unnecessary costs. I discuss the forces that render internal control mechanisms ineffective and offer suggestions for their reform. Lastly, I address the challenge this modern industrial revolution poses for finance professionals; that is, the changes that we too must undergo to aid in the learning and adjustments that must occur over the next several decades.
II. The Second Industrial Revolution
The Industrial Revolution was distinguished by a shift to capital-intensive production, rapid growth in productivity and living standards, the formation of large corporate hierarchies, overcapacity, and, eventually, closure of facili- ties. (See the excellent discussions of the period by Chandler (1977, 1990, 1992), McCraw (1981, 1992), and Lamoreaux (1985).) Originating in Britain in the late eighteenth century, the First Industrial Revolution-as Chandler (1990, p. 250) labels it-witnessed the application of new energy sources to methods of production. The mid-nineteenth century witnessed another wave of massive change with the birth of modern transportation and communica- tion facilities, including the railroad, telegraph, steamship, and cable sys- tems. Coupled with the invention of high-speed consumer packaging technol- ogy, these innovations gave rise to the mass production and distribution systems of the late nineteenth and early twentieth centuries-the Second Industrial Revolution (Chandler (1990), p. 62),
The dramatic changes that occurred from the middle to the end of the century clearly warranted the term "revolution." The invention of the McCormick reaper (1830s), the sewing machine (1844), and high-volume canning and packaging devices (mid-1880s) exemplified a worldwide surge in productivity that "substituted machine tools for human craftsmen, inter- changeable parts for hand-tooled components, and the energy of coal for that of wood, water, and animals" (McCraw (1981), p. 3). New technology in the paper industry allowed wood pulp to replace rags as the primary input material (Lamoreaux (1985), p. 41). Continuous rod rolling transformed the wire industry: within a decade, wire nails replaced cut nails as the main source of supply (Lamoreaux (1985), p. 64). Worsted textiles resulting from advances in combining technology changed the woolen textile industry (Lamoreaux (1985), p. 98). Between 1869 and 1899, the capital invested per American manufacturer grew from about $700 to $2,000; in the period 1889 to 1919, the annual growth of total factor productivity was almost six times higher than that which had occurred for most of the nineteenth century (McCraw (1981), p. 3).
As productivity climbed steadily, production costs and prices fell dramati- cally. The 1882 formation of the Standard Oil Trust, which concentrated nearly 25 percent of the world's kerosene production into three refineries, reduced the average cost of a gallon of kerosene by 70 percent between 1882 and 1885. In tobacco, the invention of the Bonsack machine in the early 1880s
The Modern Industrial Revolution, Exit, and Control Systems 835
reduced the labor costs of cigarette production 98.5 percent (Chandler (1992), p. 5). The Bessemer process reduced the cost of steel rails by 88 percent from the early 1870s to the late 1890s, and the electrolytic refining process invented in the 1880s reduced the price of a kilo of aluminum by 96 percent between 1888 and 1895 (Chandler (1992), pp. 4-6). In chemicals, the mass production of synthetic dyes, alkalis, nitrates, fibers, plastics, and film oc- curred rapidly after 1880. Production costs of synthetic blue dye, for example, fell by 95 percent from the 1870s to 1886 (Chandler (1992), p. 5). New lost-cost sources of superphosphate rock and the manufacture of superphos- phates changed the fertilizer industry. In sugar refining, technological changes dramatically lowered the costs of sugar production and changed the industry (Lamoreaux (1985), p. 99).
Lamoreaux (1985) discusses other cases where various stimuli led to major increases in demand and, in turn, expansion that led to excess capacity (the page numbers in parentheses reference her discussions). This growth oc- curred in cereals (when "Schumacher broke down the American prejudice against eating oats" (p. 98)), whisky (when crop failures in Europe created a sudden large demand for U.S. producers (p. 99)), and tin plate (when the McKinley tariff raised domestic demand and prices (p. 97)).
The surplus capacity developed during the period was exacerbated by the fall in demand brought about by the recession and panic of 1893. Although attempts were made to eliminate overcapacity through pools, associations, and cartels (p. 100), not until the capital markets motivated exit in the 1890s' mergers and acquisitions (M&A) boom was the problem substantially re- solved. Capacity was reduced through the consolidation and closure of marginal facilities in the merged entities. Between 1895 and 1904, over 1,800 firms were bought or combined by merger into 157 firms (Lamoreaux (1985), p. i.).
III. The Modern Industrial Revolution
The major restructuring of the American business community that began in the 1970s and is continuing in the 1990s is being brought about by a variety of factors, including changes in physical and management technology, global competition, regulation, taxes, and the conversion of formerly closed, centrally planned socialist and communist economies to capitalism, along with open participation in international trade. These changes are significant in scope and effect; indeed, they are bringing about the Third Industrial Revolution. To understand fully the challenges that current control systems face in light of this change, we must understand more about these general forces sweeping the world economy, and why they are generating excess capacity and thus the requirement for exit.
What has generally been referred to as the "decade of the 80s" in the United States actually began in the early 1970s with the ten-fold increase in energy prices from 1973 to 1979, and the emergence of the modern market for
836 The Journal of Finance
corporate control, and high-yield nonrated bonds in the mid-1970s. These events, among others, were associated with the beginnings of the Third Industrial Revolution which-if I were to pick a particular date-would be the time of the oil price increases beginning in 1973.
The Decade of the 80s: Capital Markets Provided an Early Response to the Modern Industrial Revolution
The macroeconomic data available for the 1980s shows major productivity gains (Jensen (1991)). 1981 was in fact a watershed year: Total factor productivity growth in the manufacturing sector more than doubled after 1981 from 1.4 percent per year in the period 1950 to 1981 to 3.3 percent in the period 1981 to 1990.2 Nominal unit labor costs stopped their 17-year rise, and real unit labor costs declined by 25 percent. These lower labor costs came not from reduced wages or employment, but from increased productivity: Nominal and real hourly compensation increased by a total of 4.2 and 0.3 percent per year respectively over the 1981 to 1989 period.3 Manufacturing employment reached a low in 1983, but by 1989 had experienced a small cumulative increase of 5.5 percent.4 Meanwhile, the annual growth in labor productivity increased from 2.3 percent between 1950 and 1981 to 3.8 percent between 1981 and 1990, while a 30-year decline in capital productivity was reversed when the annual change in the productivity of capital increased
2Measured by multifactor productivity, U.S. Department of Labor (USDL) (1990, Table 3). See Jensen (1991) for a summary. Multifactor productivity showed no growth between 1973 and 1980 and grew at the rate of 1.9 percent per year between 1950 and 1973. Manufacturing labor productivity grew at an annual rate of 2.3 percent in the period 1950 to 1981 and at 3.8 percent in 1981 to 1990 (USDL, 1990, Table 3). Using data recently revised by the Bureau of Economic Analysis from 1977 to 1990, the growth rate in the earlier period was 2.2 and 3.0 percent in the 1981 to 1990 period (USDL, 1991, Table 1). Productivity growth in the nonfarm business sector fell from 1.9 percent in the 1950 to 1981 period to 1.1 percent in the 1981 to 1990 period (USDL, 1990, Table 2). The reason for the fall apparently lies in the relatively large growth in the service sector relative to the manufacturing sector and the low measured productivity growth in services.
There is considerable controversy over the adequacy of the measurement of productivity in the service sector. The USDL has no productivity measures for services employing nearly 70 percent of service workers, including, among others, health care, real estate, and securities brokerage. In addition, many believe that service sector productivity growth measures are downward biased. Service sector price measurements, for example, take no account of the improved productivity and lower prices of discount outlet clubs such as Sam's Club. The Commerce Department measures output of financial services as the value of labor used to produce it. Since labor productivity is defined as the value of total output divided by total labor inputs it is impossible for measured productivity to grow. Between 1973 and 1987 total equity shares traded daily grew from 5.7 million to 63.8 million, while employment only doubled-implying considerably more productivity growth than that reflected in the statistics. Other factors, however, contribute to potential overestimates of productivity growth in the manufacturing sector. See Malabre and Clark (1992) and Richman (1993).
3Nominal and real hourly compensation, Economic Report of the President, Table B42 (1993). 4USDL (1991).

The Modern Industrial Revolution, Exit, and Control Systems 837
from -1.03 percent between 1950 and 1981 to 2.03 percent between 1981 and 1990.5
During the 1980s, the real value of public firms' equity more than doubled from $1.4 to $3 trillion.6 In addition, real median income increased at the rate of 1.8 percent per year between 1982 and 1989, reversing the 1.0 percent per year decrease that occurred from 1973 to 1982.7 Contrary to generally held beliefs, real research and development (R&D) expenditures set record levels every year from 1975 to 1990, growing at an average annual rate of 5.8 percent.8 The Economist (1990), in one of the media's few accurate portrayals of this period, noted that from 1980 to 1985 "American industry went on an R&D spending spree, with few big successes to show for it."
Regardless of the gains in productivity, efficiency, and welfare, the 1980s are generally portrayed by politicians, the media, and others as a "decade of greed and excess." In particular, criticism was centered on M&A transac- tions, 35,000 of which occurred from 1976 to 1990, with a total value of $2.6 trillion (1992 dollars). Contrary to common beliefs, only 364 of these offers were contested, and of those only 172 resulted in successful hostile takeovers (Mergerstat Review (1991)). Indeed, Marty Lipton, prominent defender of American CEOs, expresses a common view of the 1980s when he states that "the takeover activity in the United States has imposed short-term profit maximization strategies on American Business at the expense of research, development and capital investment. This is minimizing our ability to com- pete in world markets and still maintain a growing standard of living at home" (Lipton (1989), p. 2).
On average, selling-firm shareholders in all M&A transactions in the period 1976 to 1990 were paid premiums over market value of 41 percent,9 and total M&A transactions generated $750 billion in gains to target firms' shareholders (measured in 1992 dollars).10 This value change represents the
5USDL (1990). Trends in U.S. producivity have been controversial issues in academic and policy circles in the last decade. One reason, I believe, is that it takes time for these complicated changes to show up in the aggregate statistics. In their recent book Baumol, Blackman, and Wolff (1989, pp. ix-x) changed their formerly pessimistic position. In their words: "This book is perhaps most easily summed up as a compendium of evidence demonstrating the error of our previous ways.... The main change that was forced upon our views by careful examination of the long-run data was abandonment of our earlier gloomy assessment of American productivity performance. It has been replaced by the guarded optimism that pervades this book. This does not mean that we believe retention of American leadership will be automatic or easy. Yet the statistical evidence did drive us to conclude that the many writers who have suggested that the demise of America's traditional position has already occurred or was close at hand were, like the author of Mark Twain's obituary, a bit premature.... It should, incidentially, be acknowledged that a number of distinguished economists have also been driven to a similar evaluation..."
6As measured by the Wilshire 5,000 index of all publicly held equities. 7Bureau of the Census (1991). 8Business Week Annual R&D Scoreboard. 9Annual premiums reported by Mergerstat Review (1991, fig. 5) weighted by value of transac-
tion in the year for this estimate. 10I assume that all transactions without publicly disclosed prices have a value equal to 20
percent of the value of the average publicly disclosed transaction in the same year, and that they have average premiums equal to those for publicly disclosed transactions.

838 The Journal of Finance
minimum forecast value change by the buyer (the amount the buyer is willing to pay the seller), and does not include further gains (or losses) reaped by the buyer after execution of the transaction.11 It includes synergy gains from combining the assets of two or more organizations and the gains from replacing inefficient governance systems, as well as possible wealth transfers from employees, communities, and bondholders.12 As Shleifer and Summers (1988) point out, if the value gains are merely transfers of wealth from creditors, employees, suppliers, or communities, they do not represent effi- ciency improvements. Thus far, however, little evidence has been found to support substantial wealth transfers from any group,13 and it appears that most of these gains represent increases in efficiency.
Part of the attack on M&A transactions was centered on the high-yield (or so-called "junk") bond market, which eliminated mere size as an effective deterrent against takeover. This opened the management of America's largest corporations to monitoring and discipline from the capital markets. It also helped provide capital for newcomers to compete with existing firms in the product markets.
High-yield bonds opened the public capital markets to small, risky, and unrated firms across the country, and made it possible for some of the country's largest firms to be taken over. The sentiment of J. Richard Munro (1989, p. 472), Chairman and CEO of Time Inc., exemplifies the critical appraisal of their role:
Notwithstanding television ads to the contrary, junk bonds are designed as the currency of "casino economics" ... they've been used not to create new plants or jobs or products but to do the opposite: to dismantle existing companies so the players can make their profit.... This isn't the Seventh Cavalry coming to the rescue. It's a scalping party.
The high leverage incurred in the eighties contributed to an increase in the bankruptcy rate of large firms in the early 1990s. That increase was also encouraged by the recession (which in turn was at least partly caused by the restriction in the credit markets implemented in late 1989 and 1990 to offset the trend toward higher leverage), and the revisions in bankruptcy proce- dures and the tax code (which made it much more difficult to restructure financially distressed firms outside the courts, see Wruck (1990)). The unwise public policy and court decisions that contributed significantly to hampering private adjustment to this financial distress seemed to be at least partially motivated by the general antagonism towards the control market at the time.
1"In some cases buyers overpay, perhaps because of mistakes or because of agency problems with their own shareholders. Such overpayment represents only a wealth transfer from the buying firm's claimants to those of the selling firm and not an efficiency gain.
12Healy, Palepu, and Ruback (1992) estimate the total gains to buying- and selling-firm shareholders in the 50 largest mergers in the period 1979 to 1984 at 9.1 percent. They also find a strong positive cross-sectional relation between the value change and the cash flow changes resulting from the merger.
13See Kaplan (1989), Jensen, Kaplan, and Stiglin (1989), Pontiff, Shleifer, and Weisbach (1990), Asquith and Wizman (1990), and Rosett (1990).

The Modern Industrial Revolution, Exit, and Control Systems 839
Even given the difficulties, the general effects of financial distress in the high-yield markets were greatly overemphasized, and the high-yield bond market has recently experienced near-record levels of new issues. While precise numbers are difficult to come by, I estimate the total bankruptcy losses to junk bond and bank HLT (highly levered transaction) loans from inception of the market in the mid-1970s through 1990 amounted to less than $50 billion (Jensen (1991), footnote 9). In comparison, IBM alone lost $51 billion (almost 65 percent of the total market value of its equity) from its 1991 high to its 1992 close.14
Mistakes were made in the takeover activity of the 1980s; indeed, given the far reaching nature of the restructuring, it would be surprising if none occurred. However, the negative assessment characteristic of general opinion is inconsistent with both the empirical evidence and the almost universal opinion of finance scholars who have studied the phenomenon. In fact, takeover activities were addressing an important set of problems in corporate America, and doing it before the companies faced serious trouble in the product markets. They were, in effect, providing an early warning system that motivated healthy adjustments to the excess capacity that began to proliferate in the worldwide economy.
Causes of Excess Capacity
Excess capacity can arise in at least four ways, the most obvious of which occurs when market demand falls below the level required to yield returns that will support the currently installed production capacity. This demand- reduction scenario is most familiarly associated with recession episodes in the business cycle.
Excess capacity can also arise from two types of technological change. The first type, capacity-expanding technological change, increases the output of a given capital stock and organization. An example of the capacity-expanding type of change is,the Reduced Instruction Set CPU (RISC) processor innova- tion in the computer workstation market. RISC processors bring about a ten-fold increase in power, but can be produced by adapting the current production technology. With no increase in the quantity demanded, this change implies that production capacity must fall by 90 percent. Price declines increase the quantity demanded in these situations, and therefore reduce the capacity adjustment that would otherwise be required. If demand is elastic, output of the higher-powered units will grow as it did for much of the computing industry's history; now, however, the new workstation technol- ogy is reducing the demand for mainframe computers.
The second type is obsolescence-creating change-that is, one that obso- letes the current capital stock and organization. Wal-Mart and the wholesale clubs that are revolutionizing retailing are examples of such change. These new, focused, large scale, low-cost retailers are dominating old-line depart- ment stores which can no longer compete. Building these new low-cost stores means much current retail capacity becomes obsolete-when Wal-Mart en-
14Its high of $139.50 occurred on 2/19/91 and it closed at $50.38 at the end of 1992.

840 The Journal of Finance
ters a new market total retail capacity expands, and it is common for some of the existing high-cost retail capacity to go out of business.15 More intensive use of information and other technologies, direct dealing with manufacturers, and the replacement of high-cost, restrictive work-rule union labor are sev- eral sources of the competitive advantage of these new organizations.
Finally, excess capacity also results when many competitors simultane- ously rush to implement new, highly productive technologies without consid- ering whether the aggregate effects of all such investment will be greater capacity than can be supported by demand in the final product market. Sahlman and Stevenson's (1985) analysis of the winchester disk drive indus- try provides an example of this phenomenon. Between 1977 and 1984, venture capitalists invested over $400 million in 43 different manufacturers of winchester disk drives; initial public offerings of common stock infused additional capital in excess of $800 million. In mid-1983, the capital markets assigned a value of $5.4 billion to 12 publicly traded, venture-capital-backed hard disk drive manufacturers-yet by the end of 1984, the value assigned to those companies had plummeted to $1.4 billion. In his study of the industry, Christensen (1993) finds that over 138 firms entered the industry in the period from its invention in 1956 to 1990, and of these 103 subsequently failed and six were acquired. Sahlman and Stevenson (p. 7) emphasize the lack of foresight in the industry: "The investment mania visited on the hard disk industry contained inherent assumptions about the long-run industry size and profitability and about future growth, profitability and access to capital for each individual company. These assumptions, had they been stated explicitly, would not have been acceptable to the rational investor." There are clues in the history of the nineteenth century that similar over- shooting occurred then as well. In Jensen (1991), I analyze the incentive, information, and contracting problems that cause this overshooting and argue that these problems of boom-bust cycles are general in venture markets -but that they can be corrected by reforming contracts that currently pay promoters for doing deals, rather than for doing successful deals.
Current Forces Leading to Excess Capacity and Exit
The ten-fold increase in crude oil prices between 1973 and 1979 had ubiquitous effects, forcing contraction in oil, chemicals, steel, aluminum, and international shipping, among other industries. In addition, the sharp crude oil price increases that motivated major changes to economize on energy had other, perhaps even larger, implications. I believe the reevaluation of organi- zational processes and procedures stimulated by the oil shock also generated dramatic increases in efficiency beyond the original pure energy-saving proj- ects. The original energy-motivated reexamination of corporate processes helped initiate a major reengineering of company practices and procedures that still continues to accelerate throughout the world.
15Zellner (1992) discusses the difficulties traditional retailers have in meeting Wal-Mart's prices.

The Modern Industrial Revolution, Exit, and Control Systems 841
Since the oil price increases of the 1970s, we again have seen systematic overcapacity problems in many industries similar to those of the nineteenth century. While the reasons for this overcapacity nominally differ among industries, I doubt they are independent phenomena. We do not yet fully understand all the causes propelling the rise in excess capacity in the 1980s, yet I believe there were a few basic forces in operation.
Macro Policies
Major deregulation of the American economy (including trucking, rail, airlines, telecommunications, banking and financial services industries) un- der President Carter contributed to the requirements for exit in these indus- tries,16 as did important changes in the U.S. tax laws that reduced tax advantages to real estate development, construction, and other activities. The end of the cold war has had obvious ramifications for the defense industry, as well as less direct effects on the industry's suppliers. In addition, two genera- tions of managerial focus on growth as a recipe for success caused many firms, I believe, to overshoot their optimal capacity, setting the stage for cutbacks, especially in white collar corporate bureaucracies. Specifically, in the decade from 1979 to 1989 the Fortune 100 firms lost 1.5 million employ- ees, or 14 percent of their workforce.17
Technology
Massive changes in technology are clearly part of the cause of the current industrial revolution and its associated excess capacity. Both within and across industries, technological developments have had far-reaching impact. To give some examples, the widespread acceptance of radial tires (lasting three to five times longer than the older bias ply technology and providing better gas mileage) caused excess capacity in the tire industry; the personal computer revolution forced contraction of the market for mainframes; the advent of aluminum and plastic alternatives reduced demand for steel and glass containers; and fiberoptic, satellite, digital (ISDN), and new compres- sion technologies dramatically increased capacity in telecommunication. Wireless personal communication such as cellular phones and their replace- ments promise to further extend this dramatic change.
The changes in computer technology, including miniaturization, have not only revamped the computer industry, but also redefined the capabilities of countless other industries. Some estimates indicate the price of computing capacity fell by a factor of 1,000 over the last decade.18 This means that computer production lines now produce boxes with 1,000 times the capacity
16Vietor, Forthcoming. 17Source: COMPUSTAT. 18"JIn 1980 IBM's top-of-the-line computers provided 4.5 MIPS (millions of instructions per
second) for $4.5 million. By 1990, the cost of a MIP on a personal computer had dropped to $1,000 ..." (Keene (1991)), p. 110). By 1993 the price had dropped to under $100. The technological
progress in personal computers has itself been stunning. Intel's Pentium (586) chip, introduced in 1993, has a capacity of 100 MIPS-100 times the capacity of its 286 chip introduced in 1982 (Brandt (1993)). In addition, the progress of storage, printing, and other related technology has also been rapid (Christensen (1993)).

842 The Journal of Finance
for a given price. Consequently, computers are becoming commonplace-in cars, toasters, cameras, stereos, ovens, and so on. Nevertheless, the increase in quantity demanded has not been sufficient to avoid overcapacity, and we are therefore witnessing a dramatic shutdown of production lines in the industry-a force that has wracked IBM as a high-cost producer. A change of similar magnitude in auto production technology would have reduced the price of a $20,000 auto in 1980 to under $20 today. Such increases in capacity and productivity in a basic technology have unavoidably massive implications for the organization of work and society.
Fiberoptic and other telecommunications technologies such as compression algorithms are bringing about similarly vast increases in worldwide capacity and functionality. A Bell Laboratories study of excess capacity indicates, for example, that given three years and an additional expenditure of $3.1 billion, three of AT&T's new competitors (MCI, Sprint, and National Telecommuni- cations Network) would be able to absorb the entire long distance switched service that was supplied by AT&T in 1990 (Federal Communications Com- mission (1991), p. 1140).
Organizational Innovation
Overcapacity can be caused not only by changes in the physical technology, but also by changes in organizational practices and management technology. The vast improvements in telecommunications, including computer networks, electronic mail, teleconferencing, and facsimile transmission are changing the workplace in major ways that affect the manner in which people work and interact. It is far less valuable for people to be in the same geographical location to work together effectively, and this is encouraging smaller, more efficient, entrepreneurial organizing units that cooperate through tech- nology."9 This encourages even more fundamental changes. Through competi- tion "virtual organizations"-networked or transitory organizations where people come together temporarily to complete a task, then separate to pursue their individual specialties-are changing the structure of the standard large bureaucratic organization and contributing to its shrinkage. Virtual organiza- tions tap talented specialists, avoid many of the regulatory costs imposed on permanent structures, and bypass the inefficient work rules and high wages imposed by unions. In doing so, they increase efficiency and thereby further contribute to excess capacity.
In addition, Japanese management techniques such as total quality man- agement, just-in-time production, and flexible manufacturing have signifi- cantly increased the efficiency of organizations where they have been success-
19The Journal of Financial Economics which I have been editing with several others since 1973 is an example. The JFE is now edited by seven faculty members with offices at three universities in different states and the main editorial administrative office is located in yet another state. North Holland, the publisher, is located in Amsterdam, the printing is done in India, and mailing and billing is executed in Switzerland. This "networked organization" would have been extremely inefficient two decades ago without fax machines, high-speed modems, electronic mail, and overnight delivery services.

The Modern Industrial Revolution, Exit, and Control Systems 843
fully implemented throughout the world. Some experts argue that, properly implemented, these new management techniques can reduce defects and spoilage by an order of magnitude. These changes in managing and organiz- ing principles have contributed significantly to the-productivity of the world's capital stock and economized on the use of labor and raw materials, thus also contributing to the excess capacity problems.20
Globalization of Trade
With the globalization of markets, excess capacity tends to occur world- wide. Japan, for example, is currently in the midst of substantial excess capacity caused, at least partially, by the breakdown in its own corporate control system;21 it is now in the process of a massive restructuring of its economy.22 Yet even if the requirement for exit were isolated in the United States, the interdependency of today's world economy would ensure that such overcapacity would have reverberating, global implications. For example, the rise of efficient high-quality producers of steel and autos in Japan and Korea has contributed to excess capacity in those industries worldwide. Between 1973 and 1990 total capacity in the U.S. steel industry fell by 38 percent from 156.7 million tons to 97 million tons, and total employment fell over 50 percent from 509,000 to 252,000.23 From 1985 to 1989 multifactor productiv- ity in the industry increased at an annual rate of 5.3 percent compared to 1.3 percent for the period 1958 to 1989 (Burnham (1993), Table 1 and p. 15).
The entry of Japan and other Pacific Rim countries such as Hong Kong, Taiwan, Singapore, Thailand, Korea, Malaysia, and China into worldwide product markets has contributed to the required adjustments in Western economies over the last several decades. Moreover, competition from new entrants to the world product markets promises to get considerably more intense.
Revolution in Political Economy
The movement of formerly closed communist and socialist centrally planned economies to more market-oriented open capitalist economies is likely to generate huge changes in the world economy over the next several decades. These changes promise to cause much conflict, pain, and suffering as world markets adjust, but also large profit opportunities.
More specifically, the rapid pace of development of capitalism, the opening of closed economies, and the dismantlement of central control in communist and socialist states is occurring to various degrees in China, India, Indonesia, Pakistan, other Asian economies, and Africa. This evolution will place a
20Wruck and Jensen (1993) provide an analysis of the critical organizational innovations that total quality management is bringing to the technology of management.
21A collapse I predicted in Jensen (1989a). 22See Neff, Holyoke, Gross, and Miller (1993). 23Steel industry employment is now down to 160,000 from its peak of 600,000 in 1953 (Fader
(1993)).

844 The Journal of Finance
potential labor force of almost a billion people-whose current average income is less than $2 per day-on world markets.24'25 Table I summarizes some of the population and labor force estimates relevant to this issue. The opening of Mexico and other Latin American countries and the transition of communist and socialist central and eastern European economies to open capitalist systems (at least some of which will make the transition in some form) could add almost 200 million laborers with average incomes of less than $10 per day to the world market.
For perspective, Table I shows that the average daily U.S. income per worker is slightly over $90, and the total labor force numbers about 117 million, and the European Economic Community average wage is about $80 per day with a total labor force of about 130 million. The labor forces that have affected world trade extensively in the last several decades total only about 90 million (Hong Kong, Japan, Korea, Malaysia, Singapore, and Taiwan).26
While the changes associated with bringing a potential 1.2 billion low-cost laborers onto world markets will significantly increase average living stan- dards throughout the world, they will also bring massive obsolescence of capital (manifested in the form of excess capacity) in Western economies as the adjustments sweep through the system. Western managers cannot count on the backward nature of these economies to limit competition from these new human resources. Experience in China and elsewhere indicates the problems associated with bringing relatively current technology on line with labor forces in these areas is possible with fewer difficulties than one might anticipate. 27
24 1 am indebted to Steven Cheung for discussions on these issues. 25Although migration will play a role it will be relatively small compared to the export of the
labor in products and services. Swissair's 1987 transfer of part of its reservation system to Bombay and its 1991 announcement of plans to transfer 150 accounting jobs to the same city are small examples (Economist Intelligence Unit (1991)).
26Thailand and China have played a role in the world markets in the last decade, but since it has been such a small part of their potential I have left them in the potential entrant category.
27In a recent article focusing on the prospects for textile manufacturer investment in Central European countries, van Delden (1993, p. 43) reports: "VWhen major French group Rhone Poulenc's fibres division started a discussion for a formal joint venture in 1991, they discovered an example of astonishing competitiveness. Worklers-whose qualifications matched those nor- mal in the West-cost only 8% of their West European counterparts, and yet achieved productiv- ity rates of between 60% and 75% compared to EC level. Moreover, energy costs of the integrated power station are 50% below West German costs, and all of this is complemented by extremely competitive raw material prices."
The textile industry illustrates the problems with chronic excess capacity brought on by a situation where the worldwide demand for textiles grows fairly constantly, but growth in the productivity of textile machinery through technological improvements is greater. Moreover, additional capacity is being created because new entrants to the global textile market must upgrade outdated (and less productive) weaving machinery with new technology to meet mini- mum global quality standards. This means excess capacity is likely to be a continuing problem in the industry and that adjustment will have to occur through exit of capacity in high-cost Western textile mills.

The Modern Industrial Revolution, Exit, and Control Systems 845
One can confidently forecast that the transition to open capitalist economies will generate great conflict over international trade as special interests in individual countries try to insulate themselves from competition and the required exit. The transition of these economies will require large redirection of Western labor and capital to activities where it has a comparative advan- tage. While the opposition to global competition will be strong, the forces are likely to be irresistible in this day of rapid and inexpensive communication, transportation, miniaturization, and migration.
The bottom line, of course, is that with even more excess capacity and the requirement for additional exit, the strains put on the internal control mechanisms of Western corporations are likely to worsen for decades to come.
In the 1980s managers and employees demanded protection from the capital markets. Many are now demanding protection from international competition in the product markets (often under the guise of protecting jobs). The current dispute over the NAFTA (North American Free Trade Act, which will remove trade barriers between Canada, the United States, and Mexico) is but one general example of conflicts that are also occurring in the steel, automobile, computer chip, computer screen, and textile industries. In addi- tion it would not be surprising to see a return to demands for protection from even domestic competition. This is currently underway in the deregulated airline industry, an industry that is faced with significant excess capacity.
We should not underestimate the strains this continuing change will place on worldwide social and political systems. In both the First and Second Industrial Revolutions, the demands for protection from competition and for redistribution of income became intense. It is conceivable that Western nations could face the modern equivalent of the English Luddites who destroyed industrial machinery (primarily knitting frames) in the period 1811 to 1816, and were eventually subdued by the militia (Watson (1993)). In the United States during the early 1890s, large groups of unemployed men (along with some vagrants and criminals), banding together under different leaders in the West, Midwest, and East, wandered cross-country in a march on Congress. These "industrial armies" formed to demand relief from "the evils of murderous competition; the supplanting of manual labor by machin- ery; the excessive Mongolian and pauper immigration; the curse of alien landlordism... " (McMurray (1929), p. 128). Although the armies received widespread attention and enthusiasm at the onset, the groups were soon seen as implicit threats as they roamed from town to town, often stealing trains and provisions as they went. Of the 100,000 men anticipated by Coxey, only 1,000 actually arrived in Washington to protest on May 1, 1893. At the request of the local authorities, these protesters disbanded and dispersed after submitting a petition to Congress (McMurray (1929), pp. 253-262).
We need look no further than central and eastern Europe or Asia to see the effects of policies that protect organizations from foreign and domestic compe- tition. Hundreds of millions of people have been condemned to poverty as a result of governmental policies that protect firms from competition in the product markets (both domestic and foreign) and attempt to ensure prosper-

846 The Journal of Finance
Table I
Labor Force and Manufacturing Wage Estimates of Various Countries and Areas Playing an Actual or Potential Role
in International Trade in the Past and in the Future
Total Potential Average Daily Populationa Labor Forceb Earningsc
Country/Area (Millions) (Millions) (U.S.$)
Major potential entrants from Asia China 1,155.8 464.4 $1.53 India 849.6 341.4 $2.46 Indonesia 187.8 75.4 NAd Pakistan 115.5 46.4 $3.12 Sri Lanka 17.2 6.9 $1.25 Thailand 56.9 23.0 $1.49 Vietnam 68.2 27.4 NA Total/Average: Total pop./labor force
&average earnings 2,451.0 984.9 $1.97e
Potential entrant under NAFTA Mexico 87.8 35.5 $10.29
Major potential entrants from central and eastern Europe Czechoslovakia 15.6 6.3 $6.45 Hungary 10.3 4.2 $9.25 Poland 38.2 15.4 $6.14 Romania 23.2 9.4 $8.98 Yugoslavia 23.8 9.6 NA Former U.S.S.R. 286.7 115.8 $6.69 Total/Average: Mexico, central &
eastern Europe 485.6 196.2 $7.49
Previous world market entrants from Asia Hong Kong 5.8 2.3 $25.79 Japan 123.9 50.1 $146.97 Korea 43.3 17.5 $45.37 Malaysia 17.9 7.4 NA Singapore 2.8 1.1 $27.86 Taiwan 20.7 8.4 NA Total/Average 214.4 86.8 $116.16
U.S. and E.E.C. for comparison United States 252.7 117.3 $92.24 European Economic Community 658.4 129.7 $78.34 Total/Average 911.1 246.7 $84.93
aPopulation statistics from Monthly Bulletin of Statistics (United Nations, 1993), 1991 data. bPotential labor force estimated by applying the 40.4 percent labor force participation rate in
the European Economic Community to the 1991 population estimates, using the most recent employment estimates (Statistical Yearbook, United Nations, 1992) for each member country.
cUnless otherwise noted, refers to 1991 earnings from the Monthly Bulletin of Statistics (United Nations, 1993) or earnings from Statistical Yearbook (United Nations, 1992) adjusted to 1991 levels using the Consumer Price Index. Earnings for Poland were calculated using 1986 earnings and 1986 year-end exchange rate, while earnings for Romania were calculated using 1985 earnings and 1985 exchange rate. An approximation for the former U.S.S.R. was made using 1987 data for daily earnings in the U.S.S.R. and the estimated 1991 exchange rate for the former U.S.S.R. from the Monthly Bulletin of Statistics.
dNA = Not available. In the case of Yugoslavia, inflation and currency changes made esti- mates unreliable. For Indonesia, Vietnam, Malaysia, and Taiwan data on earnings in manufac- turing are unavailable.
eAverage daily wage weighted according to projected labor force in each grouping.

The Modern Industrial Revolution, Exit, and Control Systems 847
ity and jobs by protecting organizations against decline and exit. Such policies are self-defeating, as employees of state-owned factories in these areas are now finding. Indeed, Porter (1990) finds that the most successful economies are those blessed with intense internal competition that forces efficiency through survival of the fittest.
Our own experience in the 1980s demonstrated that the capital markets can also play an important role-that capital market pressures, while not perfect, can significantly increase efficiency by bringing about earlier adjust- ments. Earlier adjustments avoid much of the waste generated when failure in the product markets forces exit.
IV. The Difficulty of Exit
The Asymmetry between Growth and Decline
Exit problems appear to be particularly severe in companies that for long periods enjoyed rapid growth, commanding market positions, and high cash flow and profits. In these situations, the culture of the organization and the mindset of managers seem to make it extremely difficult for adjustment to take place until long after the problems have become severe, and in some cases even unsolvable. In a fundamental sense, there is an asymmetry between the growth stage and the contraction stage over the life of a firm. We have spent little time thinking about how to manage the contracting stage efficiently, or more importantly how to manage the growth stage to avoid sowing the seeds of decline.
In industry after industry with excess capacity, managers fail to recognize that they themselves must downsize; instead they leave the exit to others while they continue to invest. When all managers behave this way, exit is significantly delayed at substantial cost of real resources to society. The tire industry is an example. Widespread consumer acceptance of radial tires meant that worldwide tire capacity had to shrink by two-thirds (because radials last three to five times longer than bias ply tires). Nonetheless, the response by the managers of individual companies was often equivalent to: "This business is going through some rough times. We have to make major investments so that we will have a chair when the music stops." A. William Reynolds (1988), Chairman and CEO of GenCorp (maker of General Tires), illustrates this reaction in his testimony before the Subcommittee on Over- sight and Investigations (February 18, 1988), U.S. House Committee on Energy and Commerce:
The tire business was the largest piece of GenCorp, both in terms of annual revenues and its asset base. Yet General Tire was not GenCorp's strongest performer. Its relatively poor earnings performance was due in part to conditions affecting all of the tire industry.... In 1985 worldwide tire manufacturing capacity substantially exceeded demand. At the same time, due to a series of technological improvements in the design of tires and the materials used to make them, the product life of tires

848 The Journal of Finance
had lengthened significantly. General Tire, and its competitors, faced an increasing imbalance between supply and demand. The economic pres- sure on our tire business was substantial. Because our unit volume was far below others in the industry, we had less competitive flexibility.... We made several moves to improve our competitive position: We in- creased our investment in research and development. We increased our involvement in the high performance and light truck tire categories, two market segments which offered faster growth opportunities. We devel- oped new tire products for those segments and invested heavily in an aggressive marketing program designed to enhance our presence in both markets. We made the difficult decision to reduce our overall manufac- turing capacity by closing one of our older, less modern plants in Waco, TX ... I believe that the General Tire example illustrates that we were taking a rational, long-term approach to improving GenCorp's overall performance and shareholder value.... As a result of the takeover attempt,...[and] to meet the principal and interest payments on our vastly increased corporate debt, GenCorp had to quickly sell off valuable assets and abruptly lay-off approximately 550 important emloyees.
GenCorp sold its General Tire subsidiary to Continental AG of Hannover, West Germany for approximately $625 million. Despite Reynolds's good intentions and efforts, Gen Corp's increased investment seems not to be a socially optimal response for managers in a declining industry with excess capacity.
Information Problems
Information problems hinder exit because the high-cost capacity in the industry must be eliminated if resources are to be used efficiently. Firms often do not have good information on their own costs, much less the costs of their competitors; it is therefore sometimes unclear to managers that they are the high-cost firm which should exit the industry.28 Even when managers do acknowledge the requirement for exit, it is often difficult for them to accept and initiate the shutdown decision. For the managers who must implement these decisions, shutting plants or liquidating the firm causes personal pain, creates uncertainty, and interrupts or sidetracks careers. Rather than confronting this pain, managers generally resist such actions as long as they have the cash flow to subsidize the losing operations. Indeed, firms with large positive cash flow will often invest in even more money- losing capacity-situations that illustrate vividly what I call the agency costs of free cash flow (Jensen (1986)).
28Total quality management programs strongly encourage managers to benchmark their firm's operations against the most successful worldwide competitors, and good cost systems and competitive benchmarking are becoming more common in well-managed firms.

The Modern Industrial Revolution, Exit, and Control Systems 849
Contracting Problems
Explicit and implicit contracts in the organization can become major obsta- cles to efficient exit. Unionization, restrictive work rules, and lucrative employee compensation and benefits are other ways in which the agency costs of free cash flow can manifest themselves in a growing, cash-rich organization. Formerly dominant firms became unionized in their heyday (or effectively unionized in organizations like IBM and Kodak) when managers spent some of the organization's free cash flow to buy labor peace. Faced with technical innovation and worldwide competition (often from new, more flexi- ble, and nonunion organizations), these dominant firms cannot adjust fast enough to maintain their market dominance (see DeAngelo and DeAngelo (1991) and Burnham (1993)). Part of the problem is managerial and organiza- tional defensiveness that inhibits learning and prevents managers from changing their model of the business (see Argyris (1990)).
Implicit contracts with unions, other employees, suppliers, and communi- ties add to formal union barriers to change by reinforcing organizational defensiveness and inhibiting change long beyond the optimal time-even beyond the survival point for the organization. In an environment like this a shock must occur to bring about effective change. We must ask why we cannot design systems that can adjust more continuously, and therefore more efficiently.
The security of property rights and the enforceability of contracts are extremely important to the growth of real output, efficiency, and wealth. Much press coverage and official policy seems to be based on the notion that all implicit contracts should be unchangeable and rigidly enforced. Yet is is clear that, given the occurrence of unexpected events, not all contracts, whether explicit or implicit can (or even should) be fulfilled. Implicit con- tracts, in addition to avoiding the costs incurred in the writing process, provide opportunity to revise the obligation if circumstances change; presum- ably, this is a major reason for their existence.
Indeed the gradual abrogation of the legal notion of "at will" employment is coming close to granting property rights in jobs to all employees.29 While casual breach of implicit contracts will destroy trust in an organization and seriously reduce efficiency, all organizations must evolve a way to change contracts that are no longer optimal. For example, bankruptcy is essentially a state-supervised system for breaking (or more politely, rewriting) contracts that are mutually inconsistent and therefore, unenforceable. All developed economies evolve such a system. Yet, the problem is a very general one, given that the optimality of changing contracts must be one of the major reasons for leaving many of them implicit. Research into the optimal breach of contracts, and the bonding against opportunistic behavior thait must accompany it, is an important topic that has received considerable attention in the law and
29Shleifer and Summers (1988) seem to take the position that all implicit contracts should be enforced rigidly and never be breached.
850 The Journal of Finance
economics literature (see Polinsky (1989)) but is deserving of more attention by organization theorists.
V. The Role of the Market for Corporate Control
The Four Control Forces Operating on the Corporation
There are only four control forces operating on the corporation to resolve the problems caused by a divergence between managers' decisions and those that are optimal from society's standpoint. They are the
. capital markets,
. legal/political/regulatory system,
. product and factor markets, and
. internal control system headed by the board of directors.
As explained elsewhere (Jensen (1989a, 1989b, 1991), Roe (1990, 1991)), the capital markets were relatively constrained by law and regulatory practice from about 1940 until their resurrection through hostile tender offers in the 1970s. Prior to the 1970s capital market discipline took place primarily through the proxy process. (Pound (1993) analyzes the history of the political model of corporate control.)
The legal/political/regulatory system is far too blunt an instrument to handle the problems of wasteful managerial behavior effectively. (The breakup and deregulation of AT&T, however, is one of the court system's outstanding successes. As we shall see below, it helped create over $125 billion of increased value between AT&T and the Baby Bells.)
While the product and factor markets are slow to act as a control force, their discipline is inevitable-firms that do not supply the product that customers desire at a competitive price cannot survive. Unfortunately, when product and factor market disciplines take effect it can often be too late to save much of the enterprise. To avoid this waste of resources, it is important for us to learn how to make the other three organizational control forces more expedient and efficient.
Substantial data support the proposition that the internal control systems of publicly held corporations have generally failed to cause managers to maximize efficiency and value.30 More persuasive than the formal statistical evidence is the fact that few firms ever restructure themselves or engage in a major strategic redirection without a crisis either in the capital markets, the
30A partial list of references is: Dann and DeAngelo (1988), Mann and Sicherman (1991), Baker and Wruck (1989), Berger and Ofek (1993), Bhide (1993), Brickley, Jarrell, and Netter (1988), Denis (1992), Donaldson (1990), DeAngelo and DeAngelo (1991), DeAngelo, DeAngelo, and Rice (1984), Esty (1992, 1993), Grundfest (1990), Holderness and Sheehan (1991), Jensen (1986a, 1986b, 1988, 1989a, 1989b, 1991), Kaplan (1989a, 1989b, 1992), Lang, Poulsen, and Stulz (1992), Lang, Stulz, and Walkling (1991), Lewellen, Loderer, and Martin (1987), Lichtenberg (1992), Lichtenberg and Siegel (1990), Ofek (1993), Palepu (1990), Pound (1988, 1991, 1992), Roe (1990, 1991), Smith (1990), Tedlow (1991), Tiemann (1990), Wruck and Stephens (1992a, 1992b), Wruck (1990, 1991, 1992), Wruck and Palepu (1992).

The Modern Industrial Revolution, Exit, and Control Systems 851
legal/political/regulatory system, or the product/factor markets. But there are firms that have proved to be flexible in their responses to changing market conditions in an evolutionary way. For example, investment banking firms and consulting firms seem to be better at responding to changing market conditions.
Capital Markets and the Market for Corporate Control
The capital markets provided one mechanism for accomplishing change before losses in the product markets generate a crisis. While the corporate control activity of the 1980s has been widely criticized as counterproductive to American industry, few have recognized that many of these transactions were necessary to accomplish exit over the objections of current managers and other constituencies of the firm such as employees and communities. For example, the solution to excess capacity in the tire industry came about through the market for corporate control. Every major U.S. tire firm was either taken over or restructured in the 1980s.31 In total, 37 tire plants were shut down in the period 1977 to 1987 and total employment in the industry fell by over 40 percent. (U.S. Bureau of the Census (1987), Table la-1.) The pattern in the U.S. tire industry is repeated elsewhere among the crown jewels of American business.
Capital market and corporate control transactions such as the repurchase of stock (or the purchase of another company) for cash or debt creates exit of resources in a very direct way. When Chevron acquired Gulf for $13.2 billion in cash and debt in 1984, the net assets devoted to the oil industry fell by $13.2 billion as soon as the checks were mailed out. In the 1980s the oil industry had to shrink to accommodate the reduction in the quantity of oil demanded and the reduced rate of growth of demand. This meant paying out to shareholders its huge cash inflows, reducing exploration and development expenditures to bring reserves in line with reduced demands, and closing refining and distribution facilities. The leveraged acquisitions and equity repurchases helped accomplish this end for virtually all major U.S. oil firms (see Jensen (1986b, 1988)).
31In May 1985, Uniroyal approved an LBO proposal to block hostile advances by Carl Icahn. About the same time, BF Goodrich began diversifying out of the tire business. In January 1986, Goodrich and Uniroyal independently spun off their tire divisions and together, in a 50-50 joint venture, formed the Uniroyal-Goodrich Tire Company. By December 1987, Goodrich had sold its interest in the venture to Clayton and Dubilier; Uniroyal followed soon after. Similarly, General tire moved away from tires: the company, renamed GenCorp in 1984, sold its tire division to Continental in 1987. Other takeovers in the industry during this period include the sale of Firestone to Bridgestone and Pirelli's purchase of the Armstrong Tire Company. By 1991, Goodyear was the only remaining major American tire manufacturer. Yet it too faced challenges in the control market: in 1986, following three years of unprofitable diversifying investments, Goodyear initiated a major leveraged stock repurchase and restructuring to defend itself from a hostile takeover from Sir James Goldsmith. Uniroyal-Goodrich was purchased by Michelin in 1990. See Tedlow (1991).

852 The Journal of Finance
Exit also resulted when Kohlberg, Kravis, and Roberts (KKR) acquired MJR-Nabisco for $25 billion in cash and debt in its 1986 leveraged buyout (LBO). Given the change in smoking habits in response to consumer aware- ness of cancer threats, the tobacco industry must shrink, and the payout of RJR's cash accomplished this to some extent. Furthermore, the LBO debt prohibits RJR from continuing to squander its cash flows on the wasteful projects it had undertaken prior to the buyout. Thus, the buyout laid the groundwork for the efficient reduction of capacity by one of the major firms in the industry. Also, by eliminating some of the cash resources from the oil and tobacco industries, these capital market transactions promote an environ- ment that reduces the rate of growth of human resources in the industries or even promotes outright reduction when that is the optimal policy.
The era of the control market came to an end, however, in late 1989 and 1990. Intense controversy and opposition from corporate managers, assisted by charges of fraud, the increase in default and bankruptcy rates, and insider trading prosecutions, caused the shutdown of the control market through court decisions, state antitakeover amendments, and regulatory restric- tions on the availability of financing (see Swartz (1992), and Comment and Schwert (1993)). In 1991, the total value of transactions fell to $96 billion from $340 billion in 1988.32 LBOs and management buyouts fell to slightly over $1 billion in 1991 from $80 billion in 1988.33 The demise of the control market as an effective influence on American corporations has not ended the restructuring, but it has meant that organizations have typically postponed addressing the problems they face until forced to by financial difficulties generated by the product markets. Unfortunately the delay means that some of these organizations will not survive-or will survive as mere shadows of their former selves.
VI. The Failure of Corporate Internal Control Systems
With the shutdown of the capital markets as an effective mechanism for motivating change, renewal, and exit, we are left to depend on the internal control system to act to preserve organizational assets, both human and nonhuman. Throughout corporate America, the problems that motivated much of the control activity of the 1980s are now reflected in lackluster performance, financial distress, and pressures for restructuring. Kodak, IBM, Xerox, ITT, and many others have faced or are now facing severe challenges in the product markets. We therefore must understand why these internal control systems have failed and learn how to make them work.
By nature, organizations abhor control systems, and ineffective governance is a major part of the problem with internal control mechanisms. They seldom respond in the absence of a crisis. The recent GM board revolt (as the press has called it) which resulted in the firing of CEO Robert Stempel exemplifies
32 In 1992 dollars, calculated from Mergerstat Review, 1991, p. lOOf. 33In 1992 dollars, Mergerstat Review, 1991, figs. 29 and 38.

The Modern Industrial Revolution, Exit, and Control Systems 853
the failure, not the success, of GM's governance system. General Motors, one of the world's high-cost producers in a market with substantial excess capac- ity, avoided making major changes in its strategy for over a decade. The revolt came too late: the board acted to remove the CEO only in 1992, after the company had reported losses of $6.5 billion in 1990 and 1991 and (as we shall see in the next section) an opportunity loss of over $100 billion in its R&D and capital expenditure program over the eleven-year period 1980 to 1990. Moreover, the changes to date are still too small to resolve the com- pany's problems.
Unfortunately, GM is not an isolated example. IBM is another testimony to the failure of internal control systems: it failed to adjust to the substitution away from its mainframe business following the revolution in the workstation and personal computer market-ironically enough a revolution that it helped launch with the invention of the RISC technology in 1974 (Loomis (1993)). Like GM, IBM is a high-cost producer in a market with substantial excess capacity. It too began to change its strategy significantly and removed its CEO only after reporting losses of $2.8 billion in 1991 and further losses in 1992 while losing almost 65 percent of its equity value.
Eastman Kodak, another major U.S. company formerly dominant in its market, also failed to adjust to competition and has performed poorly. Its $37 share price in 1992 was roughly unchanged from 1981. After several reorga- nizations, it only recently began to seriously change its incentives and strategy, and it appointed a chief financial officer well-known for turning around troubled companies. (Unfortunately he resigned only several months later-after, according to press reports, running into resistance from the current management and board about the necessity for dramatic change.)
General Electric (GE) under Jack Welch, who has been CEO since 1981, is a counterexample to my proposition about the failure of corporate internal control systems. GE has accomplished a major strategic redirection, eliminat- ing 104,000 of its 402,000 person workforce (through layoffs or sales of divisions) in the period 1980 to 1990 without the motivation of a threat from capital or product markets.34 But there is little evidence to indicate this is due to anything more than the vision and persuasive powers of Jack Welch rather than the influence of GE's governance system.
General Dynamics (GD) provides another counterexample. The appoint- ment of William Anders as CEO in September 1991 (coupled with large changes in its management compensation system which tied bonuses to increases in stock value) resulted in its rapid adjustment to excess capacity in the defense industry-again with no apparent threat from any outside force. GD generated $3.4 billion of increased value on a $1 billion company in just over two years (see Murphy and Dial (1992)). Sealed Air (Wruck (1992)) is another particularly interesting example of a company that restructured itself without the threat of an immediate crisis. CEO Dermot Dumphy recognized the necessity for redirection, and after several attempts to rejuve-
34Source: GE annual reports.

854 The Journal of Finance
nate the company to avoid future competitive problems in the product markets, created a crisis by voluntarily using the capital markets in a leveraged restructuring. Its value more than tripled over a three-year period. I hold these companies up as examples of successes of the internal control systems, because each redirection was initiated without immediate crises in the product or factor markets, the capital markets, or in the legal/political/regulatory system. The problem is that they are far too rare.
Although the strategic redirection of General Mills provides another coun- terexample (Donaldson (1990)), the fact that it took more than ten years to accomplish the change leaves serious questions about the social costs of continuing the waste caused by ineffective control. It appears that internal control systems have two faults. They react too late, and they take too long to effect major change. Changes motivated by the capital market are generally accomplished quickly-within one and a half to three years. As yet no one has demonstrated the social benefit from relying on purely internally moti- vated change that offsets the costs of the decade-long delay exhibited by General Mills.
In summary, it appears that the infrequency with which large corporate organizations restructure or redirect themselves solely on the basis of the internal control mechanisms in the absence of crises in the product, factor, or capital markets or the regulatory sector is strong testimony to the inade- quacy of these control mechanisms.
VII. Direct Evidence of the Failure of Internal Control Systems
The Productivity of R&D and Capital Expenditures
The control market, corporate restructurings, and financial distress provide substantial evidence on the failings of corporate internal control systems. My purpose in this section is to provide another and more direct estimate of the effectiveness of internal control systems by measuring the productivity of corporate R&D and capital expenditures. The results reaffirm that many corporate control systems are not functioning well. While it is impossible to get an unambiguous measure of the productivity of R&D and capital expendi- tures, by using a period as long as a decade we can get some approximations. We cannot simply measure the performance of a corporation by the change in its market value over time (more precisely the returns to its shareholders) because this measure does not take account of the efficiency with which the management team manages internally generated cash flows. For example, consider a firm that provides dividends plus capital gains to its shareholders over a ten-year period that equal the cost of capital on the beginning of period share value. Suppose, however, that management spent $30 billion of inter- nally generated cash flow on R&D and capital expenditures that generated no returns. In this case the firm's shareholders suffered an opportunity loss equal to the value that could have been created if the firm had paid the funds out to them and they had invested it in equivalently risky projects.

The Modern Industrial Revolution, Exit, and Control Systems 855
The opportunity cost of R&D and capital expenditures thus can be thought of as the returns that would have been earned by an investment in equiva- lent-risk assets over the same time period. We don't know exactly what the risk is, nor what the expected returns would be, but we can make a range of assumptions. A simple measure of performance would be the difference between the total value of the R&D plus capital and acquisition expenditures invested in a benchmark strategy and the total value the firm actually created with its investment strategy. The benchmark strategy can be thought of as the ending value of a comparable-risk bank account (with an expected return of 10 percent) into which the R&D and capital expenditures in excess of depreciation (hereafter referred to as net capital expenditures) had been deposited instead of invested in real projects. For simplicity I call this the benchmark strategy. The technical details of the model are given in the Appendix. The calculation of the performance measure takes account of all stock splits, stock dividends, equity issues and repurchases, dividends, debt issues and payments, and interest.
Three Measures of the Productivity of R&D and Net Capital Expenditures
Measure 1
Consider an alternative strategy which pays the same dividends and stock repurchases as the firm actually paid (and raises the same outside capital) and puts the R&D and capital and acquisition expenditures (in excess of depreciation) in marketable securities of the same risk as the R&D and capital expenditures, yielding expected returns equal to their cost of capital, i. Under the assumption that the zero investment and R&D strategy yields a terminal value of the firm equal to the ending debt plus the beginning value of equity (that is, investment equal to depreciation is sufficient to maintain the original equity value of the firm), Measure 1 is the difference between the actual ending total value of the firm and the value of the benchmark. The exact equation is given in the Appendix for this measure as well as the next two measures of performance.
Unless capital and R&D expenditures are completely unproductive, this first crude measure of the productivity of R&D and capital expenditures will be biased downward. I define two additional measures that use different assumptions about the effect of the reduced R&D and capital expenditures on the ending value of the firm's equity and on the ability of the firm to make the intermediate cash dividend and stock repurchase payouts to sharehold- ers. If R&D is required to maintain a competitive position in the industry, the ending value of the equity in the benchmark strategy is likely to be less than the initial value of equity even though nominal depreciation of the capital stock is being replaced. Moreover, with no R&D and maintenance only of the nominal value of the capital stock, the annual cash flows from operations are also likely to be lower than those actually realized (because organizational efficiency and product improvement will lag competitors, and new product introduction will be lower). Therefore I use two more conserva-
856 The Journal of Finance
tive measures that will yield higher estimates of the productivity of these expenditures.
Measure 2
The second measure assumes that replacement of depreciation and zero expenditures on R&D are sufficient to maintain the intermediate cash flows but, like a one-horse shay, the firm arrives at the end of the period still generating cash returns, but then collapses with no additional cash payments to equityholders, and equity value of zero as of the horizon date.
Measure 3
To allow for the effects of the reduced investment and R&D on inter- mediate cash flows my third measure assumes that all intermediate cash flows are reduced in the benchmark investment strategy by the amount paid out to shareholders in the form of dividends and net share repurchases and that the original value of the equity is maintained. This measure is likely to yield an upward biased estimate of the productivity of R&D and capital expenditures.
The Data and Results
The data for this analysis consist of all 432 firms on COMPUSTAT with 1989 sales of $250 rnillion or more for which complete data on R&D, capital expenditures, depreciation, dividends, and market value were available for the period December 31, 1979 through December 31, 1990. The estimates of the productivity of R&D are likely to be upward biased because the selection criteria use only firms that managed to survive through the period and eliminate those that failed. I have calculated results for various rates of interest but report only those using a 10 percent rate of return. This rate is probably lower than the cost of capital for R&D expenditures at the begin- ning of the period when interest rates were in the high teens, and probably about right or on the high side at the end of the period when the cost of capital was probably on the order of 8 to 10 percent. A low approximation of the cost of capital appropriate to R&D and capital expenditures will bias the performance measures up, so I am reasonably comfortable with these conser- vative assumptions.
Because they are interesting in their own right, Table II presents the data on annual R&D and capital expenditures of nine selected Fortune 500 corporations and the total venture capital industry from January 1, 1980 through December 31, 1990. Table III contains calculations that provide some benchmarks for evaluating the productivity of these expenditures.
Total R&D expenditures over the eleven-year period range from $42.7 billion for General Motors to $5.4 billion for Merck. The individual R&D expenditures of GM and IBM were significantly greater than the $27.8 billion spent by the entire U.S. venture capital industry over the eleven-year period. Because venture capital data include both the R&D component and capital expenditures, we must add in corporate capital expenditures to get a proper

The Modern Industrial Revolution, Exit, and Control Systems 857
Table II
Total R&D and Capital Expenditures for Selected Companies and the Venture Capital Industry, 1980-1990 ($ Billions)
Venture Capital
Year GM IBM Xerox Kodak Intel GE Industry Merck AT&T
Total R&D Expenditures
1980 2.2 1.5 0.4 0.5 0.1 0.8 0.6 0.2 0.4 1981 2.2 1.6 0.5 0.6 0.1 0.8 1.2 0.3 0.5 1982 2.2 2.1 0.6 0.7 0.1 0.8 1.5 0.3 0.6 1983 2.6 2.5 0.6 0.7 0.1 0.9 2.6 0.4 0.9 1984 3.1 3.1 0.6 0.8 0.2 1.0 2.8 0.4 2.4 1985 4.0 3.5 0.6 1.0 0.2 1.1 2.7 0.4 2.2 1986 4.6 4.0 0.7 1.1 0.2 1.3 3.2 0.5 2.3 1987 4.8 4.0 0.7 1.0 0.3 1.2 4.0 0.6 2.5 1988 5.3 4.4 0.8 1.1 0.3 1.2 3.9 0.7 2.6 1989 5.8 5.2 0.8 1.3 0.4 1.3 3.4 0.8 2.7 1990 5.9 4.9 0.9 1.3 0.5 1.5 1.9 0.9 2.4 Total 42.7 36.8 7.1 10.1 2.5 11.9 27.8 5.4 19.3
Total Capital Expenditures
1980 7.8 6.6 1.3 0.9 0.2 2.0 NA 0.3 17.0 1981 9.7 6.8 1.4 1.2 0.2 2.0 NA 0.3 17.8 1982 6.2 6.7 1.2 1.5 0.1 1.6 NA 0.3 16.5 1983 4.0 4.9 1.1 0.9 0.1 1.7 NA 0.3 13.8 1984 6.0 5.5 1.3 1.0 0.4 2.5 NA 0.3 3.5 1985 9.2 6.4 1.0 1.5 0.2 2.0 NA 0.2 4.2 1986 11.7 4.7 1.0 1.4 0.2 2.0 NA 0.2 3.6 1987 7.1 4.3 0.3 1.7 0.3 1.8 NA 0.3 3.7 1988 6.6 5.4 0.5 1.9 0.5 3.7 NA 0.4 4.0 1989 9.1 6.4 0.4 2.1 0.4 5.5 NA 0.4 3.5 1990 10.1 6.5 0.4 2.0 0.7 2.1 NA 0.7 3.7 Total 87.5 64.2 9.9 16.1 3.3 27.0 NA 3.7 91.2
Net Capital Expenditures (Capital Expenditures less Depreciation)
1980 3.6 3.8 0.5 0.5 0.1 1.2 NA 0.2 9.9 1981 5.3 3.5 0.6 0.7 0.1 1.1 NA 0.2 9.9 1982 1.7 3.1 0.4 0.9 0.1 0.6 NA 0.2 7.7 1983 - 1.1 1.3 0.3 0.2 0.1 0.6 NA 0.1 3.9 1984 1.1 2.3 0.5 0.2 0.3 1.3 NA 0.1 0.7 1985 3.5 3.4 1.2 0.6 0.1 0.8 NA 0.07 0.9 1986 5.6 1.3 0.2 0.5 0.0 0.6 NA 0.04 -3.2 1987 0.8 0.7 -0.3 0.6 0.1 0.2 NA 0.07 -0.6 1988 -0.7 1.5 -0.2 0.7 0.3 0.3 NA 0.2 -5.9 1989 2.0 2.2 -0.2 0.8 0.2 0.7 NA 0.2 1.1 1990 2.7 2.3 -0.3 0.7 0.4 0.6 NA 0.4 0.3 Total 24.5 25.4 2.7 6.4 1.8 8.0 NA 1.8 24.7
Total Value of R&D plus Net Capital Expenditures
67.2 62.2 9.8 16.7 4.3 19.9 27.8 7.2 44.0
Ending Equity Value of the Company, 12/90
26.2 64.6 3.2 13.5 13.5 50.0 > 60 34.8 32.9
NA = Not available. Source: Annual reports, COMPUSTAT, Business Week R&D Scoreboard, William Sahlman. Venture Economics for total disbursements by industry. Capital expenditures for the venture capital industry are included in the R & D expenditures which are the total actual disbursements by the industry.

858 The Journal of Finance
Table III
Benefit-Cost Analysis of Corporate R&D and Investment Programs: Actual Total Value of Company at 12/31/90 Less Total
Value of the Benchmark Strategy r = 10 percent (billions of dollars)
Venture Capital
GM IBM Xerox Kodak Intel GE Industry Merck AT&T
Measure 1: Gain (Loss) [Assumes beginning value of equity is maintained]
($115.2) ($49.4) ($13.6) ($12.4) $1.8 $18.4 > $17 $22.6 ($34.5)
Measure 2: [Assumes ending equity value is zero]
($100.7) ($11.8) ($8.4) ($4.6) $3.2 $29.9 > $17 $28.0 $2.1
Measure 3: [Assumes ending equity value equals beginning value and intermediate cash flows are smaller by the amount
paid to equity under company's strategy]
($90.0) ($5.4) ($8.0) ($1.8) $1.8 $36.4 > $17 $28.1 $21.3
comparison to the venture industry figures. Total capital expenditures range from $91.2 billion for AT&T and $87.5 billion for GM to $3.7 billion for Merck. Capital expenditures net of depreciation range from $25.4 billion for IBM to $1.8 billion for Merck.
It is clear that GM's R&D and investment program produced massive losses. The company spent a total of $67.2 billion in excess of depreciation in the period and produced a firm with total ending value of equity (including the E and H shares) of $26.2 billion. Ironically, its expenditures were more than enough to pay for the entire equity value of Toyota and Honda, which in 1985 totaled $21.5 billion. If it had done this (and not changed the companies in any way), GM would have owned two of the world's low-cost, high-quality automobile producers.
As Table III shows, the difference between the value of GM's actual strategy and the value of the equivalent-risk bank account strategy amounts to $ - 100.7 billion by Measure 2 (which assumes the ending value of the company given no R&D or net capital expenditures is zero in the benchmark strategy), $ - 115.2 billion for Measure 1 (which assumes the original value of the equity is maintained), and $ -90 billion by Measure 3 (which assumes cash flows fall by the amount of all intermediate cash outflows to sharehold- ers and debtholders). I concentrate on Measure 2 which I believe is the best measure of the three. By this measure, IBM lost over $11 billion relative to the benchmark strategy (and this is prior to the $50 billion decline in its equity value in 1991 and 1992), while Xerox and Kodak were down $8.4 billion and $4.6 billion respectively. GE and Merck were major success stories, with value creation in excess of the benchmark strategy of $29.9 billion and $28 billion respectively. AT&T gained $2.1 billion over the bench-

The Modern Industrial Revolution, Exit, and Control Systems 859
mark strategy, after having gone through the court-ordered breakup and deregulation of the Bell system in 1984. The value gains of the seven Baby Bells totaled $125 billion by Measure 2 (not shown in the table), making the breakup and deregulation a nontrivial success given that prices to consumers have generally fallen in the interim.
The value created by the venture capital industry is difficult to estimate. We would like to have estimates of the 1990 total end-of-year value of all companies funded during the eleven-year period. This value is not available so I have relied on the $60 billion estimate of the total value of all IPOs during the period. This overcounts those firms that were funded prior to 1980 and counts as zero all those firms that had not yet come public as of 1990. Because of the pattern of increasing investment over the period from the mid-1970s, the overcounting problem is not likely to be as severe as the undercounting problem. Thus, the value added by the industry over the bank account strategy is most probably greater than $17 billion as shown in Table III. Since the venture capital industry is in Table III as another potential source of comparison, and since virtually its entire value creation is reflected in its ending equity value, I have recorded its value creation under each measure as the actual estimate of greater than $17 billion.
Because the extreme observations in the distribution are the most interest- ing, Table IV gives the three performance measures for the 35 companies at the bottom of the list of 432 firms ranked in reverse order on Measure 2 (Panel A), and on the 35 companies at the top of the ranked list (Panel B), also in reverse order. As the tables show, GM ranked at the bottom of the performance list, preceded by Ford, British Petroleum, Chevron, Du Pont, IBM, Unisys, United Technologies, and Xerox. Obviously many of the United States' largest and best-known companies appear on this list (including GD prior to its recent turnaround), along with Japan's Honda Motor company. Panel B shows that Philip Morris created the most value in excess of the benchmark strategy, followed by Wal-Mart, Bristol Myers, GE, Loews, Merck, Bellsouth, Bell Atlantic, Procter & Gamble, Ameritech, and Southwestern Bell.35
Table V provides summary statistics (including the minimum, mean, five fractiles of the distribution, maximum, and standard deviation) on R&D expenditures, net capital expenditures, and the three performance measures. The mean ten-year R&D and net capital expenditures are $1.296 billion and $1.367 billion respectively; the medians are $146 million and $233 million. The average of Measure 2 over all 432 firms is slightly over $1 billion with a t-value of 3.0, indicating that on average this sample of firms created value above that of the benchmark strategy. The average for Measures 1 and 2 are $ -221 million and $1.086 billion respectively. All productivity measures are upward biased because failed firms are omitted from the sample, and because the decade of the eighties was an historical outlier in stock market perfor-
35Because of the sharp decline in Japanese stock prices, the Japanese firms ranked in the top 35 firms would have performed less well if the period since 1990 had been included.
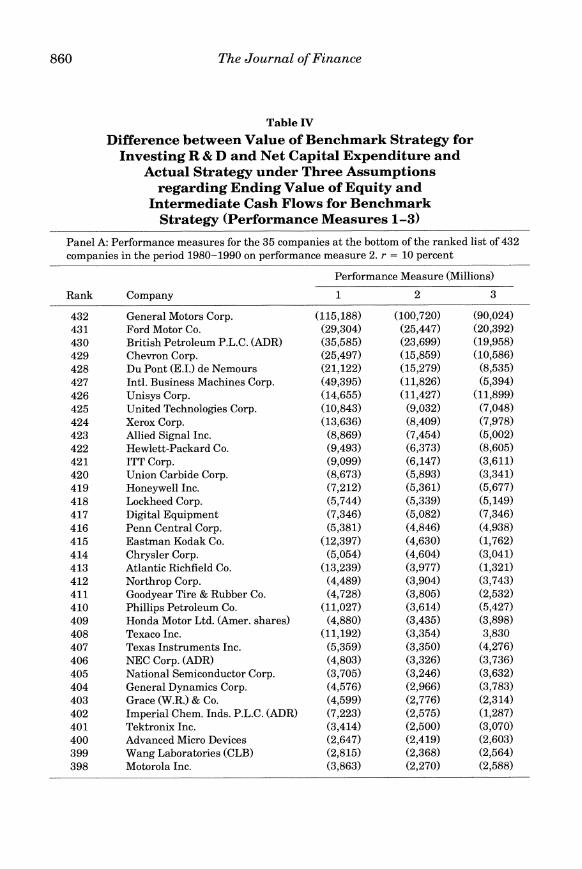
860 The Journal of Finance
Table IV
Difference between Value of Benchmark Strategy for Investing R & D and Net Capital Expenditure and
Actual Strategy under Three Assumptions regarding Ending Value of Equity and
Intermediate Cash Flows for Benchmark Strategy (Performance Measures 1-3)
Panel A: Performance measures for the 35 companies at the bottom of the ranked list of 432 companies in the period 1980-1990 on performance measure 2. r = 10 percent
Performance Measure (Millions)
Rank Company 1 2 3
432 General Motors Corp. (115,188) (100,720) (90,024) 431 Ford Motor Co. (29,304) (25,447) (20,392) 430 British Petroleum P.L.C. (ADR) (35,585) (23,699) (19,958) 429 Chevron Corp. (25,497) (15,859) (10,586) 428 Du Pont (E.I.) de Nemours (21,122) (15,279) (8,535) 427 Intl. Business Machines Corp. (49,395) (11,826) (5,394) 426 Unisys Corp. (14,655) (11,427) (11,899) 425 United Technologies Corp. (10,843) (9,032) (7,048) 424 Xerox Corp. (13,636) (8,409) (7,978) 423 Allied Signal Inc. (8,869) (7,454) (5,002) 422 Hewlett-Packard Co. (9,493) (6,373) (8,605) 421 ITT Corp. (9,099) (6,147) (3,611) 420 Union Carbide Corp. (8,673) (5,893) (3,341) 419 Honeywell Inc. (7,212) (5,361) (5,677) 418 Lockheed Corp. (5,744) (5,339) (5,149) 417 Digital Equipment (7,346) (5,082) (7,346) 416 Penn Central Corp. (5,381) (4,846) (4,938) 415 Eastman Kodak Co. (12,397) (4,630) (1,762) 414 Chrysler Corp. (5,054) (4,604) (3,041) 413 Atlantic Richfield Co. (13,239) (3,977) (1,321) 412 Northrop Corp. (4,489) (3,904) (3,743) 411 Goodyear Tire & Rubber Co. (4,728) (3,805) (2,532) 410 Phillips Petroleum Co. (11,027) (3,614) (5,427) 409 Honda Motor Ltd. (Amer. shares) (4,880) (3,435) (3,898) 408 Texaco Inc. (11,192) (3,354) 3,830 407 Texas Instruments Inc. (5,359) (3,350) (4,276) 406 NEC Corp. (ADR) (4,803) (3,326) (3,736) 405 National Semiconductor Corp. (3,705) (3,246) (3,632) 404 General Dynamics Corp. (4,576) (2,966) (3,783) 403 Grace (W.R.) & Co. (4,599) (2,776) (2,314) 402 Imperial Chem. Inds. P.L.C. (ADR) (7,223) (2,575) (1,287) 401 Tektronix Inc. (3,414) (2,500) (3,070) 400 Advanced Micro Devices (2,647) (2,419) (2,603) 399 Wang Laboratories (CLB) (2,815) (2,368) (2,564) 398 Motorola Inc. (3,863) (2,270) (2,588)

The Modern Industrial Revolution, Exit, and Control Systems 861
Table IV-Continued
Panel B: Performance measures for the 35 companies ranked at the top of the list of 432 companies in the period 1980-1990 on performance measure 2. r = 10 percent.
Performance Measure (Millions)
Rank Company 1 2 3
35 Kellogg Co. 5,747 7,190 8,245 34 Pfizer Inc. 4,607 7,477 8,650 33 General Mills Inc. 6,205 7,605 8,256 32 Kyocera Corp. (ADR) 7,194 7,959 7,709 31 Minnesota Mining & Mfg. Co. 2,375 8,270 10,008 30 Canon Inc. (ADR) 7,717 8,326 8,285 29 Matsushita Electric (ADR) 5,356 8,694 6,999 28 Tele-Communications (CLA) 8,692 8,998 8,698 27 Kubota Corp. (ADR) 7,383 9,246 8,280 26 Marion Merrell Dow Inc. 9,489 9,606 9,865 25 Unilever N.V. (N.Y. shares) 8,642 10,574 12,510 24 Fuji Photo Film (ADR) 10,102 10,858 10,518 23 Hitachi Ltd. (ADR) 8,412 10,863 10,800 22 Amoco Corp. (331) 11,437 14,838 21 Sony Corp. (Amer. shares) 10,001 11,591 11,019 20 Lilly (Eli) & Co. 7,462 11,818 12,001 19 Ito Yokado Co. Ltd. (ADR) 12,415 13,178 12,982 18 Abbot Laboratories 11,076 13,555 14,043 17 Johnson & Johnson 8,945 13,796 13,199 16 Nynex Corp. 7,971 13,975 14,856 15 U.S. West Inc. 8,696 14,398 14,430 14 Exxon Corp. (9,213) 14,976 40,096 13 Pacific Telesis Group 11,530 16,846 17,648 12 Glaxo Holdings P.L.C. (ADR) 16,215 17,007 18,348 11 Southwestern Bell Corp. 11,807 17,702 17,880 10 Ameritech Corp. 11,883 18,453 18,516 9 Procter & Gamble Co. 12,900 19,247 20,293 8 Bell Atlantic Corp. 13,146 19,921 20,235 7 Bellsouth Corp. 15,205 23,921 24,644 6 Merck & Co. 22,606 28,045 28,092 5 Loews Corp. 28,540 29,265 29,579 4 General Electric Co. 18,411 29,945 36,363 3 Bristol Myers Squibb 27,899 30,321 33,296 2 Wal-Mart Stores 37,701 38,239 38,486 1 Philip Morris Cos. Inc. 37,548 42,032 47,029
mance. The median performance measures are $24 million, $200 million, and $206 million respectively. The maximum performance measures range from $37.7 billion to $47 billion.
Although the average performance measures are positive, well-functioning internal control systems would substantially truncate the lower tail of the

862 The Journal of Finance
Table V
Summary Statistics on R&D, Capital Expenditures, and Performance Measures for 432 Firms with Sales Greater than $250 Million
in the Period 1980-1990 r = 10 percent (millions of dollars)
R&D Net Capital Performance Performance Performance Statistic Expenditures Expenditures Measure 1 Measure 2 Measure 3
Mean 1,296 1,367 -221 1,086 1,480 Minimum 0 -377 -115,188 -100,720 -90,023 0.1 fractile 0 23 -3,015 -1,388 1,283 0.25 fractile 19 66 -693 -109 103 0.5 fractile 146 233 24 200 206 0.75 fractile 771 1012 577 1,220 1,386 0.9 fractile 3,295 3,267 3,817 5,610 6,385 Maximum 42,742 34,456 37,701 42,032 47,029 Standard Deviation 3,838 3,613 8,471 7,618 7,676
distribution. And given that the sample is subject to survivorship bias,36 and that the period was one in which stock prices performed historically above average, the results demonstrate major inefficiencies in the capital expendi- ture and R&D spending decisions of a substantial number of firms.37 I believe we can improve these control systems substantially, but to do so we must attain a detailed understanding of how they work and the factors that lead to their success or failure.
VIII. Reviving Internal Corporate Control Systems
Remaking the Board as an Effective Control Mechanism
The problems with corporate internal control systems start with the board of directors. The board, at the apex of the internal control system, has the final responsibility for the functioning of the firm. Most importantly, it sets the rules of the game for the CEO. The job of the board is to hire, fire, and compensate the CEO, and to provide high-level counsel. Few boards in the past decades have done this job well in the absence of external crises. This is particularly unfortunate given that the very purpose of the internal control
361 am in the process of creating a database that avoids the survivorship bias. Hall (1993a, 1993b) in a large sample free of survivorship bias finds lower market valuation of R & D in the 1980s and hypothesizes that this is due to a higher depreciation rate for R & D capital. The Stern Stewart Performance 1000 (1992) ranks companies by a measure of the economic value added by management decisions that is an alternative to performance measures 1-3 summarized in Table IV. GM also ranks at the bottom of this list.
37Changes in market expectations about the prospects for a firm (and therefore changes in its market value) obviously can affect the interpretation of the performance measures. Other than using a long period of time there is no simple way to handle this problem. The large increase in stock prices in the 1980s would indicate that expectations were generally being revised upward.

The Modern Industrial Revolution, Exit, and Control Systems 863
mechanism is to provide an early warning system to put the organization back on track before difficulties reach a crisis stage. The reasons for the failure of the board are not completely understood, but we are making progress toward understanding these complex issues. The available evidence does suggest that CEOs are removed after poor performance,38 but the effect, while statistically significant, seems too late and too small to meet the obligations of the board. I believe bad systems or rules, not bad people, underlie the general failings of boards of directors.
Some caution is advisable here because while resolving problems with boards can cure the difficulties associated with a nonfunctioning court of last resort, this alone cannot solve all the problems with defective internal control systems. I resist the temptation in an already lengthy paper to launch into a discussion of other organizational and strategic issues that must be attacked. A well-functioning board, however, is capable of providing the organizational culture and supporting environment for a continuing attack on these issues.
Board Culture
Board culture is an important component of board failure. The great emphasis on politeness and courtesy at the expense of truth and frankness in boardrooms is both a symptom and cause of failure in the control system. CEOs have the same insecurities and defense mechanisms as other human beings; few will accept, much less seek, the monitoring and criticism of an active and attentive board. Magnet (1992, p. 86) gives an example of this environment. John Hanley, retired Monsanto CEO, accepted an invitation from a CEO
to join his board-subject, Hanley wrote, to meeting with the company's general counsel and outside accountants as a kind of directorial due diligence. Says Hanley: "At the first board dinner the CEO got up and said, 'I think Jack was a little bit confused whether we wanted him to be a director or the chief executive officer.' I should have known right there that he wasn't going to pay a goddamn bit of attention to anything I said." So it turned out, and after a year Hanley quit the board in disgust.
The result is a continuing cycle of ineffectiveness: by rewarding consent and discouraging conflicts, CEOs have the power to control the board, which in turn ultimately reduces the CEO's and the company's performance. This downward spiral makes the resulting difficulties likely to be a crisis rather than a series of small problems met by a continuous self-correcting mecha- nism. The culture of boards will not change simply in response to calls for
38 CEO turnover approximately doubles from 3 to 6 percent after two years of poor performance (stock returns less than 50 percent below equivalent-risk market returns, Weisbach (1988)), or increases from 8.3 to 13.9 percent from the highest to the lowest performing decile of firms (Warner, Watts, and Wruck (1988)). See also DeAngelo (1888) and DeAngelo and DeAngelo (1989).

864 The Journal of Finance
change from policy makers, the press, or academics. It only will follow, or be associated with, general recognition that past practices have resulted in major failures and substantive changes in the rules and practices governing the system.
Information Problems
Serious information problems limit the effectiveness of board members in the typical large corporation. For example, the CEO almost always deter- mines the agenda and the information given to the board. This limitation on information severely hinders the ability of even highly talented board mem- bers to contribute effectively to the monitoring and evaluation of the CEO and the company's strategy.
Moreover, the board requires expertise to provide input into the financial aspects of planning-especially in forming the corporate objective and deter- mining the factors which affect corporate value. Yet such financial expertise is generally lacking on today's boards. Consequently, boards (and manage- ment) often fail to understand why long-run market value maximization is generally the privately and socially optimal corporate objective, and they often fail to understand how to translate this objective into a feasible founda- tion for corporate strategy and operating policy.
Legal Liability
The factors that motivate modern boards are generally inadequate. Boards are often motivated by substantial legal liabilities through class action suits initiated by shareholders, the plaintiffs bar, and others-lawsuits which are often triggered by unexpected declines in stock price. These legal incentives are more often consistent with minimizing downside risk rather than maxi- mizing value. Boards are also motivated by threats of adverse publicity from the media or from the political/regulatory authorities. Again, while these incentives often provide motivation for board members to cover their own interests, they do not necessarily provide proper incentives to take actions that create efficiency and value for the company.
Lack of Management and Board Member Equity Holdings
Many problems arise from the fact that neither managers nor nonmanager board members typically own substantial fractions of their firm's equity. While the average CEO of the 1,000 largest firms (measured by market value of equity) holds 2.7 percent of his or her firm's equity in 1991, the median holding is only 0.2 percent and 75 percent of CEOs own less than 1.2 percent (Murphy (1992)).39 Encouraging outside board members to hold substantial equity interests would provide better incentives. Stewart (1990) outlines a useful approach using levered equity purchase plans or the sale of in-the- money options to executives to resolve this problem in large firms, where achieving significant ownership would require huge dollar outlays by man-
39See also Jensen and Murphy (1990a, 1990b) for similar estimates based on earlier data.

The Modern Industrial Revolution, Exit, and Control Systems 865
agers or board members. By requiring significant outlays by managers for the purchase of these quasi equity interests, Stewart's approach reduces the incentive problems created by the asymmetry of payoffs in the typical option plan.
Boards should have an implicit understanding or explicit requirement that new members must invest in the stock of the company. While the initial investment could vary, it should seldom be less than $100,000 from the new board member's personal funds; this investment would force new board members to recognize from the outset that their decisions affect their own wealth as well as that of remote shareholders. Over the long term the investment can be made much larger by options or other stock-based compen- sation. The recent trend to pay some board member fees in stock or options is a move in the right direction. Discouraging board members from selling this equity is important so that holdings will accumulate to a significant size over time.
Oversized Boards
Keeping boards small can help improve their performance. When boards get beyond seven or eight people they are less likely to function effectively and are easier for the CEO to control.40 Since the possibility for animosity and retribution from the CEO is too great, it is almost impossible for those who report directly to the CEO to participate openly and critically in effective evaluation and monitoring of the CEO. Therefore, the only inside board member should be the CEO. Insiders other than the CEO can be regularly invited to attend board meetings in an ex officio capacity. Indeed, board members should be given regular opportunities to meet with and observe executives below the CEO-both to expand their knowledge of the company and CEO succession candidates, and to increase other top-level executives' understanding of the thinking of the board and the board process.
Attempts to Model the Process after Political Democracy
Suggestions to model the board process after a democratic political model in which various constituencies are represented are likely to make the process even weaker. To see this we need look no farther than the inefflciency of representative political democracies (whether at the local, state, or federal level), or at their management of quasi-business organizations such as the Post Office, schools, or power generation entities such as the TVA. This does not mean, however, that the current corporate system is satisfactory as it stands; indeed there is significant room for rethinking and revision.
40 In their excellent analysis of boards, Lipton and Lorsch (1992) also criticize the functioning of traditionally configured boards, recommend limiting membership to seven or eight people, and encourage equity ownership by board members. Research supports the proposition that as groups increase in size they become less effective because the coordination and process problems overwhelm the advantages gained from having more people to draw on (see Steiner (1972) and Hackman (1990)).

866 The Journal of Finance
For example, proxy regulations by the SEC make the current process far less efficient than it otherwise could be. Specifically, it has been illegal for any shareholder to discuss company matters with more than ten other shareholders without prior filing with, and approval of, the SEC. The Novem- ber 1992 relaxation of this restriction allows an investor to communicate with an unlimited number of other stockholders provided the investor owns less than 5 percent of the shares, has no special interest in the issue being discussed, and is not seeking proxy authority. These restrictions still have obvious shortcomings that limit effective institutional action by those share- holders most likely to pursue an issue.
As equity holdings become concentrated in institutional hands, it is easier to resolve some of the free-rider problems that limit the ability of thousands of individual shareholders to engage in effective collective action. In principle such institutions can therefore begin to exercise corporate control rights more effectively. Legal and regulatory restrictions, however, have prevented finan- cial institutions from playing a major corporate monitoring role. (Roe (1990, 1991), Black (1990), and Pound (1991) provide an excellent historical review of these restrictions.) Therefore, if institutions are to aid in effective gover- nance, we must continue to dismantle the rules and regulations that have prevented them and other large investors from accomplishing this coordina- tion.
The CEO as Chairman of the Board
It is common in U.S. corporations for the CEO to also hold the position of chairman of the board. The function of the chairman is to run board meetings and oversee the process of hiring, firing, evaluating, and compensating the CEO. Clearly, the CEO cannot perform this function apart from his or her personal interest. Without the direction of an independent leader, it is much more difficult for the board to perform its critical function. Therefore, for the board to be effective, it is important to separate the CEO and chairman positions.41 The independent chairman should, at a minimum, be given the rights to initiate board appointments, board committee assignments, and (Jointly with the CEO) the setting of the board's agenda. All these recommen- dations, of course, will be made conditional on the ratification of the board.
An effective board will often evidence tension among its members as well as with the CEO. But I hasten to add that I am not advocating continuous war in the boardroom. In fact, in well-functioning organizations the board will generally be relatively inactive and will exhibit little conflict. It becomes important primarily when the rest of the internal control system is failing, and this should be a relatively rare event. The challenge is to create a system that will not fall into complacency and inactivity during periods of prosperity and high-quality management, and therefore be unable to rise early to the
41Lipton and Lorsch (1992) stop short of recommending appointment of an independent chairman, recommending instead the appointment of a "lead director" whose functions would be to coordinate board activities.

The Modern Industrial Revolution, Exit, and Control Systems 867
challenge of correcting a failing management system. This is a difficult task because there are strong tendencies for boards to evolve a culture and social norms that reflect optimal behavior under prosperity, and these norms make it extremely difficult for the board to respond early to failure in its top management team.42
Resurrecting Active Investors
A major set of problems with internal control systems are associated with the curbing of what I call active investors (Jensen (1989a, 1989b)). Active investors are individuals or institutions that simultaneously hold large debt and/or equity positions in a company and actively participate in its strategic direction. Active investors are important to a well-functioning governance system because they have the financial interest and independence to view firm management and policies in an unbiased way. They have the incentives to buck the system to correct problems early rather than late when the problems are obvious but difficult to correct. Financial institutions such as banks, pensions funds, insurance companies, mutual funds, and money man- agers are natural active investors, but they have been shut out of board rooms and firm strategy by the legal structure, by custom, and by their own practices.43
Active investors are important to a well-functioning governance system, and there is much we can do to dismantle the web of legal, tax, and regulatory apparatus that severely limits the scope of active investors in this country.44 But even absent these regulatory changes, CEOs and boards can take actions to encourage investors to hold large positions in their debt and equity and to play an active role in the strategic direction of the firm and in monitoring the CEO.
Wise CEOs can recruit large block investors to serve on the board, even selling new equity or debt to them to induce their commitment to the firm. Lazard Freres Corporate Partners Fund is an example of an institution set up specifically to perform this function, making new funds available to the firm and taking a board seat to advise and monitor management perfor- mance. Warren Buffet's activity through Berkshire Hathaway provides an- other example of a well-known active investor. He played an important role in helping Salomon Brothers through its recent legal and organizational difficulties following the government bond bidding scandal. Dobrzynski (1993) discusses many varieties of this phenomenon (which she calls relationship investing) that are currently arising both in the United States and abroad.
42Gersick and Hackman (1990) and Hackman (1993) study a similar problem: the issues associated with habitual behavior routines in groups to understand how to create more produc- tive environments. They apply the analysis to airline cockpit crews.
43See Roe (1990, 1991), Black (1990), and Pound (1991). 44See Porter (1992a, 1992b, 1992c). Hall and Hall provide excellent empirical tests of the
myopic capital market hypothesis on which much of debate on the functioning of U.S. capital markets rests.

868 The Journal of Finance
Using LBOs and Venture Capital Firms as Models of Successful Organization, Governance, and Control
Organizational Experimentation in the 1980s
Founded on the assumption that firm cash flows are independent of financial policy, the Modigliani-Miller (M&M) theorems on the independence of firm value, leverage, and payout policy have been extremely productive in helping the finance profession structure the logic of many valuation issues. The 1980s control activities, however, have demonstrated that the M&M theorems (while logically sound) are empirically incorrect. The evidence from LBOs, leveraged restructurings, takeovers, and venture capital firms has demonstrated dramatically that leverage, payout policy, and ownership struc- ture (that is, who owns the firm's securities) do in fact affect organizational efficiency, cash flow, and, therefore, value.45 Such organizational changes show these effects are especially important in low-growth or declining firms where the agency costs of free cash flow are large.46
Evidence from LBOs
LBOs provide a good source of estimates of value gain from changing leverage, payout policies, and the control and governance system because, to a first approximation, the company has the same managers and the same assets, but a different financial policy and control system after the transac- tion.47 Leverage increases from about 18 percent of value to 90 percent, large payouts to prior shareholders occur, equity becomes concentrated in the hands of managers (over 20 percent on average) and the board (about 20 and 60 percent on average, respectively), boards shrink to about seven or eight people, the sensitivity of managerial pay to performance rises, and the companies' equity usually become nonpublicly traded (although debt is often publicly traded).
The evidence of DeAngelo, DeAngelo, and Rice (1984), Kaplan (1989), Smith (1990), and others indicates that premiums to selling-firm sharehold- ers are roughly 40 to 50 percent of the prebuyout market value, cash flows increase by 96 percent from the year before the buyout to three years after the buyout, and value increases by 235 percent (96 percent market adjusted) from two months prior to the buyout offer to the time of going public, sale, or
45See Kaplan (1989a, 1989b, 1989c, 1992), Smith (1990), Wruck (1990), Lichtenberg (1992), Lichtenberg and Siegel (1990), Healy, Palepu, and Ruback (1992), and Ofek (1993).
There have now been a number of detailed clinical and case studies of these transactions that document the effects of the changes on incentives and organizational effectiveness as well as the risks of bankruptcy from overleveraging. See Baker and Wruck (1989), Wruck (1991, 1992a), Holderness and Sheehan (1988, 1991), Wruck and Keating (1992a, 1992b), Wruck and Stephens (1992a, 1992b), Jensen and Barry (1992), Jensen, Burkhardt, and Barry (1992), Jensen, Dial, and Barry (1992), Lang and Stultz (1992), Denis (1992).
46See Jensen (1986), and the references in the previous footnote. 47Assets do change somewhat after an LBO because such firms often engage in asset sales after
the transaction to pay down debt and to get rid of assets that are peripheral to the organization's core focus.
The Modern Industrial Revolution, Exit, and Control Systems 869
recapitalization about three years later on average.48 Palepu and Wruck (1992) show that large value increases also occur in voluntary recapitaliza- tions where the company stays public but buys back a significant fraction of its equity or pays out a significant dividend. Clinical studies of individual cases demonstrate that these changes in financial and governance policies generate value-creating changes in behavior of managers and employees.49
A Proven Model of Governance Structure
LBO associations and venture capital funds provide a blueprint for man- agers and boards who wish to revamp their top-level control systems to make them more efficient. LBOs and venture capital funds are, of course, the preeminent examples of active investors in recent U.S. history, and they serve as excellent models that can be emulated in part or in total by virtually any corporation. The two have similar governance structures, and have been successful in resolving the governance problems of both slow growth or declining firms (LBO associations) and high growth entrepreneurial firms (venture capital funds).50
Both LBO associations and venture capital funds, of which KKR and Kleiner Perkins are prominent examples, tend to be organized as limited partnerships. In effect, the institutions which contribute the funds to these organizations are delegating the task of being active investors to the general partners of the organizations. Both governance systems are characterized by:
a. limited partnership agreements at the top level that prohibit headquar- ters from cross-subsidizing one division with the cash from another,
b. high equity ownership on the part of managers and board members, c. board members (who are mostly the LBO association partners or the
venture capitalists) who in their funds directly represent a large fraction of the equity owners of each subsidiary company,
d. small boards of directors (of the operating companies) typically consist- ing of no more than eight people,
e. CEOs who are typically the only insider on the board, and finally f. CEOs who are seldom the chairman of the board.
LBO associations and venture funds also solve many of the information problems facing typical boards of directors. First, as a result of the due diligence process at the time the deal is done, both the managers and the LBO and venture partners have extensive and detailed knowledge of virtu- ally all aspects of the business. In addition, these boards have frequent
48See Palepu (1990) for a review of research on LBOs, their governance changes, and their productivity effects. Kaplan and Stein (1993) show similar results in more recent data.
49See references in footnote 45 above. In a counterexample, Healy and Palepu argue in their study of CUC that the value increase following its recapitalization occurred not because of incentive effects of the deal, but because of the information the recapitalization provided to the capital markets about the nature of the company's business and profitability.
50Jensen (1989a, 1989b) and Sahlman (1990) analyze the LBO association and venture capital funds respectively.
870 The Journal of Finance
contact with management, often weekly or even daily during times of difficult challenges. This contact and information flow is facilitated by the fact that LBO associations and venture funds both have their own staff. They also often perform the corporate finance function for the operating companies, providing the major interface with the capital markets and investment banking communities.
Finally, the close relationship between the LBO partners or venture fund partners and the operating companies facilitates the infusion of expertise from the board during times of crisis. It is not unusual for a partner to join the management team, even as CEO, to help an organization through such emergencies. Very importantly, there are market forces that operate to limit the human tendency to micromanage and thereby overcentralize manage- ment in the headquarters staff. If headquarters develops a reputation for abusing the relationship with the CEO, the LBO or venture organization will find it more difficult to complete new deals (which frequently depend on the CEO being willing to sell the company to the LBO fund or on the new entrepreneur being willing to sell an equity interest in the new venture to the venture capital organization).
IX. Implications for the Finance Profession
One implication of the foregoing discussion is that finance has failed to provide firms with an effective mechanism to achieve efficient corporate investment. While modern capital-budgeting procedures are implemented by virtually all large corporations, it appears that the net present value (or more generally, value-maximizing) rule imbedded in these procedures is far from universally followed by operating managers. In particular, the acceptance of negative-value projects tends to be common in organizations with substantial amounts of free cash flow (cash flow in excess of that required to fund all value-increasing investment projects) and in particular in firms and indus- tries where downsizing and exit are required. The finance profession has concentrated on how capital investment decisions should be made, with little systematic study of how they actually are made in practice.51 This narrowly normative view of investment decisions has led the profession to ignore what has become a major worldwide efficiency problem that will be with us for several decades to come.
Agency theory (the study of the inevitable conflicts of interest that occur when individuals engage in cooperative behavior) has fundamentally changed corporate finance and organization theory, but it has yet to affect substan- tially research on capital-budgeting procedures. No longer can we assume managers automatically act (in opposition to their own best interests) to maximize firm value.
51Counterexamples are Bower (1970), Baldwin and Clark (1992), Baldwin (1982, 1988, 1991), Baldwin and Trigeorgis (1992), and Shleifer and Vishny (1989).
The Modern Industrial Revolution, Exit, and Control Systems 871
Conflicts between managers and the firm's financial claimants were brought to center stage by the market for corporate control in the last two decades. This market brought widespread experimentation, teaching us not only about corporate finance, but also about the effects of leverage, governance arrange- ments, and active investors on incentives and organizational efficiency. These events have taught us much about the interdependencies among the implicit and explicit contracts specifying the following three elements of organiza- tions:
1. Finance-I use this term narrowly here to refer to the definition and structure of financial claims on the firm's cash flows (e.g., equity, bond, preferred stock, and warrant claims).52
2. Governance-the top-level control structure, consisting of the decision rights possessed by the board of directors and the CEO, the procedures for changing them, the size and membership of the board, and the compensation and equity holdings of managers and the board.53
3. Organization-the nexus of contracts defining the internal "rules of the game" (the performance measurement and evaluation system, the re- ward and punishment system, and the system for allocating decision rights to agents in the organization).54
The close interrelationships between these factors have dragged finance scholars into the analysis of governance and organization theory.55 In addi- tion, the perceived "excesses of the 1980s" have generated major reregulation of financial markets in the United States affecting the control market, credit markets (especially the banking, thrift, and insurance industries), and mar- ket microstructure.56 These changes have highlighted the importance of the
52See Harris and Raviv (1988, 1991), and Stulz (1990). 53Jensen (1989a, 1989b), Kester (1991), Sahlman (1990), Pound (1988, 1991, 1992). 54Jensen (1983), Jensen and Meckling (1992). 55Examples of this work include Gilson, Lang, and John (1990), Wruck (1990, 1991), Lang and
Stulz (1992), Lang, and Poulsen, and Stulz (1992) on bankruptcy and financial distress, Warner, Watts, and Wruck (1989), Weisbach (1988), Jensen and Murphy (1990a, 1990b) and Gibbons and Murphy (1990) on executive turnover, compensation, and organizational performance, Esty (1992, 1993) on the effects of organizational form on thrift losses, Gilson and Kraakman (1991) on governance, Brickley and Dark (1987) on franchising, Boycko, Shleifer, and Vishny (1993), Kaplan (1989a, 1989b, 1989c, 1992), Smith (1990), Kaplan and Stein (1993), Palepu (1990), and Sahlman (1990) on leverage buyouts and venture capital organizations.
56The 1989 Financial Institutions Reform, Recovery, and Enforcement Act increased federal authority and sanctions by shifting regulation of the S&L industry from the FDIC to the Treasury, and insurance of the industry from FSLIC to the Federal Home Loan Bank Board. The act banned thrift investment in high-yield bonds, raised capital ratios and insurance premiums. The 1990 Comprehensive Thrift and Bank Fraud Prosecution and Tax Payer Recovery Act increased criminal penalties for financial institution-related crimes. The 1991 FDIC Improve- ment Act tightened examination and auditing standards, recapitalized the Bank Insurance Fund and limited foreign bank powers. The Truth in Banking Act of 1992 required stricter disclosure of interest rates and fees on deposit accounts and tightened advertising guidelines. The National Association of Insurance Commissioners (NAIC) substantially restricted the ability of insurance companies to invest in high-yield debt in 1990 to 1991.

872 The Journal of Finance
political and regulatory environment to financial, organizational, and gover- nance policies, and generated a new interest in what I call the "politics of finance."57
The dramatic growth of these new research areas has fragmented the finance profession, which can no longer be divided simply into the study of capital markets and corporate finance. Finance is now much less an exercise in valuing a given stream of cash flows (although this is still important) and much more the study of how to increase those cash flows-an effort that goes far beyond the capital asset-pricing model, Modigliani and Miller irrelevance propositions, and capital budgeting. This fragmentation is evidence of progress, not failure; but the inability to understand this maturation causes conflict in those quarters where research is judged and certified, including the academic journals and university departments. Specialists in different subfields have tended to react by labeling research in areas other than their own as "low-quality" and "illegitimate." Acknowledging this separation and nurturing communication among the subfields will help avoid this intellec- tual warfare with substantial benefit to the progress of the profession.
My review of macro and organizational trends in the previous pages has highlighted many areas for future research for finance scholars. They include understanding:
. the implications of the modern (or Third) Industrial Revolution, and how it will affect financial, product, and labor markets, as well as the level and distribution of worldwide income and wealth. -how industry-wide excess capacity arises, how markets and firms
respond to such market pressures, and why exit is so difficult for organizations to deal with.
-the implications of new technology for organizational downsizing. -the financial policies appropriate for the new virtual or network orga-
nizations that are arising. . the weaknesses that cause internal corporate control systems to fail and
how to correct them. -the reasons for the asymmetry between corporate growth and decline,
and how to limit the organizational and strategic inefficiencies that seem to creep into highly successful rapidly growing organizations.
-how capital budgeting decisions are actually made and how organiza- tional practices can be implemented that will reduce the tendency to accept negative value projects.
-the nature of implicit contracts, the optimal degree to which private contracts should be left open to abrogation or change, and how to bond or monitor to limit opportunistic behavior regarding those implicit contracts.
. how politics, the press, and public opinion affect the types of governance, financial, and organizational policies that firms adopt.
57See Jensen (1989b, 1991), Roe (1990, 1991), Grundfest (1990), Bhide (1993), Black (1990), Pound (1988, 1991, 1992), and DeAngleo, DeAngelo, and Gilson (1993).
The Modern Industrial Revolution, Exit, and Control Systems 873
-how capital market forces can be made a politically and economically efficient part of corporate control mechanisms.
-how active investors can be resurrected and reconciled with a legal structure that currently favors liquid and anonymous markets over the intimate illiquid market relations that seem to be required for efficient governance.
X. Conclusion
For those with a normative bent, making the internal control systems of corporations work is the major challenge facing economists and management scholars in the 1990s. For those who choose to take a purely positive approach, the major challenge is understanding how these systems work, and how they interact with the other control forces (in particular the product and factor markets, legal, political, and regulatory systems, and the capital markets) impinging on the corporation. I believe the reason we have an interest in developing positive theories of the world is so that we can understand how to make things work more efficiently. Without accurate positive theories of cause and effect relationships, normative propositions and decisions based on them will be wrong. Therefore, the two objectives are completely consistent.
Financial economists have a unique advantage in working on these control and organizational problems because we understand what determines value, and we know how to think about uncertainty and objective functions. To do this we have to understand even better than we do now the factors leading to organizational past failures (and successes): we have to break open the black box called the firm, and this means understanding how organizations and the people in them work. In short, we're facing the problem of developing a viable theory of organizations. To be successful we must continue to broaden our thinking to new topics and to learn and develop new analytical tools.
This research effort is a very profitable venture. I commend it to you.
Appendix: Direct Estimates of the Productivity of R&D-The Model
Consider a firm in period t with cash flow from operations, Ct, available for:
Rt= R&D expenditures, Kt= capital investment, dt payments to shareholders in the form of dividends and net share
repurchases, bt= interest and net debt payments, at = acquisitions net of asset sales. d < O, b < 0, a < 0 mean respectively that a new equity is raised in the
form of capital contributions from equityholders, net bond issues exceed interest and debt repayments, and asset sales exceed acquisi- tions.

874 The Journal of Fi-nance
By definition Ct = Rt + Kt + dt + bt + at. The initial value of the firm equals the sum of the market values of equity and debt, VO = SO + Bo and the final value at the end of period n, is Vn. Assume for simplicity that taxes are zero, and debt is riskless. If r is the riskless interest rate and p is the cost of equity capital, the total value, VT, created by the firm's investment, R&D, and payout policy measured at the future horizon date n, is the final value of the firm plus the ending value of the dividend payments plus stock repurchases plus the ending value of the interest payments plus debt pay- ments
VT = Vn + idt(1 + p)nft + bt(1 + r)nft,
where the investor is assumed to reinvest all intermediate payouts from the firm at the cost of equity and debt, p and r respectively.
Consider an alternative strategy which pays the same dividends and stock repurchases, dt, (and raises the same outside capital) and puts the R&D and capital and acquisition expenditures (in excess of depreciation) in marketable securities of the same risk as the R&D and capital expenditures, yielding expected returns equal to their cost of capital, i. Under the assumption that the zero investment and R&D strategy yields a terminal value, Vn, equal to the ending debt, Bn, plus the beginning value of equity, SO, (that is, invest- ment equal to depreciation is sufficient to maintain the original equity value of the firm), the value created by this strategy is
VT = SO + Bn + l(Kt + Rt + at)(1 + i)n-t + idt(1 + p)n-t + b(1 +)n-t
The difference between the terminal values of the two strategies is
VT- V = Vn -Vn - (Kt + Rt + at)( +i
= Sn - s - (Kt + Rt + at)(1 + i)nft (1)
This is my first crude measure of the productivity of R&D and capital expenditures. Unless capital and R &D expenditures are completely unpro- ductive, this measure will be biased downward. Therefore I define two more conservative measures that will yield higher estimates of the productivity of these expenditures. The second assumes that replacement of depreciation and zero expenditures on R&D are sufficient to maintain the intermediate cash flows but at the end of the period the firm has equity value of zero. This second measure is:
VT-VT = Vn -Bn - l(Kt + Rt + at)(1 + i)nft (2)
Alternatively, to allow for the effects of the reduced investment and R&D on intermediate cash flows my third measure assumes that all intermediate cash flows are reduced in the benchmark investment strategy by the amount paid out to shareholders in the form of dividends and net share repurchases and that the original value of the equity is maintained. This measure is likely

The Modern Industrial Revolution, Exit, and Control Systems 875
to yield an upward biased estimate of the productivity of R&D and capital expenditures. The measure is:58
VT- VT = Vn + Idt(l + r )nt_ -So -Bn - l(Kt + Rt + at)(1 + i)n-t (3)
58Most conservatively, we could assume that the cutback in R&D and capital expenditures under the alternative strategy results in a reduction in intermediate cash flows by the amount of the net cash paid to shareholders in the form of dividends and share repurchases and a final equity value of zero.
VT-VT = Vn + dt(l + r)n -t-_ Bn - (Kt + Rt)(1 + i)n? t (4)
I expect this measure provides an unreasonably high estimate of the productivity of R&D and investment expenditures and therefore do not report it.
REFERENCES
Anderson, Douglas, 1986, Managing retreat: Disinvestment policy, in Thomas K. McCraw, ed.: America versus Japan (Harvard Business School Press, Boston ), pp. 337-372.
Argyris, Chris, 1990, Overcoming Organizational Defenses (Allyn and Bacon, Needham, Mass.). Asquith, Paul, and Thierry A. Wizman, 1990, Event risk, convenants, and bondholder returns in
leveraged buyouts, Journal of Financial Economics 27, 195-213 Baker, George, and Karen Wruck, 1989, Organizational changes and value creation in leveraged
buyouts: The case of 0. M. Scott and Sons Company, Journal of Financial Economics 25, 163-190.
Baldwin, Carliss Y., 1982, Optimal sequential investment when capital is not readily reversible, Journal of Finance 37, 763-782.
, 1988, Time inconsistency in capital budgeting, Working paper, Harvard Business School.
, 1991, How capital budgeting deters innovation-and what companies can do about it, Research-Technology Management, November-December, 39-45.
and Kim B. Clark, 1992. Capabilities and capital investment: New perspectives on capital budgeting, Journal of Applied Corporate Finance 5, 67-82.
and Lenos Trigeorgis, 1992, Toward remedying the underinvestment problem: Competi- tiveness, real options, capabilities, and TQM, Working paper, Harvard Business School.
Baumol, William, Sue Anne Beattey Blackman, and Edward Wolff, 1989, Productivity and American Leadership (MIT Press, Boston).
Berger, Philip, and Eli Ofek, 1993, Leverage and value: The role of agency costs and taxes, Unpublished manuscript, The Wharton School.
Bhide, Amar, 1993, The hidden costs of stock market liquidity, Journal of Financial Economics 34, 31-55.
Black, Bernard S., 1990, Shareholder passivity reexamined, Michigan Law Review 89, 520-608. Bower, Joseph L., 1970, Managing the Resource Allocation Process: A Study of Corporate
Planning and Investment (Division of Research, Graduate School of Business Administra- tion, Harvard University, Boston).
, 1984, Restructuring petrochemicals: A comparative study of business and government to deal with a declining sector of the economy, in Bruce R. Scott and George C. Lodge, eds.: U.S. Competitiveness in the World Economy (Harvard Business School Press, Boston).
, 1986, When Markets Quake (Harvard Business School Press, Boston). Boycko, Maxim, Andrei Shleifer, and Robert W. Vishny, 1993, Voucher privatization, Unpub-
lished manuscript, Harvard University. Brandt, Richard, 1993, Tiny transistors and gold pizza, Business Week, March 29. Brickley, James A., and Frederick H. Dark, 1987, The choice of organizational form: The case of
franchising, Journal of Financial Economics 18, 401-420.
876 The Journal of Finance
Gregg A. Jarrell, and Jeffrey M. Netter, 1988, The market for corporate control: The empirical evidence since 1980, Journal of Economic Perspectives 2, 49-68.
, Ronald C. Lease, and Clifford W. Smith, Jr., 1988, Ownership structure and voting on antitakeover amendments, Journal of Financial Economics 20, 267-291.
Burnham, James D., 1993, Changes and Challenges: The Transformation of the U.S. Steel Industry, Policy Study No. 115 (Center for the Study of American Business, Washington University, St. Louis, Mo.).
Chandler, Alfred D., Jr., 1977, The Visible Hand: The Managerial Revolution in American Business (Harvard University Press, Cambridge, Mass.).
, 1990, Scale and Scope, The Dynamics of Industrial Capitalism (The Belknapp Press of Harvard University Press, Cambridge, Mass.).
, 1992, The emergence of managerial capitalism, Harvard Business School Case No. 9-384-081, revised by Thomas J. McCraw.
Christensen, Clayton, 1993, The rigid disk drive industry, 1956-1990: A history of commercial and technological turbulence, Working paper, Harvard Business School.
Comment, Robert, and G. William Schwert, 1993, Poison or placebo? Evidence on the deterrent and wealth effects of modern antitakeover measures. Unpublished manuscript, Simon School of Business, University of Rochester.
Dann, Larry Y., and Harry DeAngelo, 1988, Corporate financial policy and corporate control: A study of defensive adjustments in asset and ownership structure, Journal of Financial Economics 20, 87-127.
DeAngelo, Harry, and Linda DeAngelo, 1989, Proxy contests and the governance of publicly held corporations, Journal of Financial Economics 23, 29-59.
, 1991, Union negotiations and corporate policy: A study of labor concessions in the domestic steel industry during the 1980s, Journal of Financial Economics 30, 3-43.
and Edward Rice, 1984, Going private: Minority freezeouts and stockholder wealth, Journal of Law and Economics 27, 367-401.
and Stuart C. Gilson, 1993, The collapse of First Executive Corporation: Junk bonds, adverse publicity, and the "run on the bank" phenomenon, Unpublished manuscript, Univer- sity of Southern California.
DeAngelo, Linda, 1988, Managerial competition, information costs, and corporate governance: The use of accounting performance measures in proxy contests, Journal of Accounting and Economics 10, January, 3-36.
Denis, David J., 1992, Organizational form and the consequences of highly leveraged transac- tions: Kroger's recapitalization and Safeway's LBO, Unpublished manuscript, Virginia Poly- technic Institute.
Dobrzynski, Judith, 1993, Relationship investing, Business Week, March 15. Donaldson, Gordon, 1990, Voluntary restructuring: The case of General Mills, Journal of
Financial Economics 27, 117-141. Economic Report of the President, 1993 (U.S. Government Printing Office, Washington, D.C.). Economist Intelligence Unit, 1991, Switzerland Country Report, No. 3. Economist, 1990, Out of the ivory tower, February 3. Esty, Benjamin C., 1992, Organizational form, leverage and incentives: A study of risk-taking in
the S&L industry, Unpublished manuscript, Harvard Business School. , 1993, A tale of two thrifts, Unpublished manuscript, Harvard Business School.
Fader, Barnaby J., 1993, Struggle to survive in the town that steel forgot, New York Times, April 27.
Federal Communications Commission, 1991, Competition in the Interstate Interexchange Market- place, FCC 91-251, Sept. 16.
Gersick, Connie J., and J. Richard Hackman, 1990, Habitual routines in task-performing teams, Organizational Behavior and Human Decision Processes 47, 65-97.
Ghemawat, Pankaj, and Barry Nalebuff, 1985, Exit, Rand Journal of Economics 16, 184-194. Gibbons, Robert, and Kevin J. Murphy, 1990, Relative performance evaluation for chief executive
officers, Industrial and Labor Relations Review 43, 30S-51S (Special issue, Cornell Univer- sity).

The Modern Industrial Revolution, Exit, and Control Systems 877
Gilson, Ronald, and Reinier Kraakman, 1991, Reinventing the outside director: An agenda for institutional investors, Stanford Law Review 43, 863-900.
Gilson, Stuart C., Kose John, and Larry H. P. Lang, 1990, Trouble debt restructurings: An empirical study of private reorganization of firms in default, Journal of Financial Economics 27, 315-353.
Grossman, Sanford J., and Oliver D. Hart, 1988, One share/one vote and the market for corporate control, Journal of Financial Economics 20, 175-202.
Grundfest, Joseph, 1990, Subordination of American capital, Journal of Financial Economics 27, 89-117.
Hackman, J. Richard, ed., 1990, Groups That Work (Jossey-Bass, San Francisco). , 1993, Teams, leaders, and organizations: New directions for crew-oriented flight train-
ing, in E. L. Weiner, B. G. Kanki, and R. L. Helmreich, eds.: Cockpit Resource Management (Academic Press, Orlando, Fla.).
Hall, Bronwyn H., 1993a, The stock market's valuation of R & D investment during the 1980's, American Economic Review, 83, 259-264.
, 1993b, New evidence on the impacts of research and development, Unpublished manuscript, Stanford University.
and Robert E. Hall, 1993, The value and performance of U.S. corporations, Unpublished manuscript, Stanford University.
Harrigan, Kathryn R., 1980, Strategies for Declining Businesses (Lexington Books, Lexington, Mass.).
, 1988, Managing Maturing Businesses: Restructuring Declining Industries and Revital- izing Troubled Operations (Lexington Books, Lexington, Mass.).
Harris, Milton, and Artur Raviv, 1988, Corporate governance: Voting rights and majority rules, Journal of Financial Economics 20, 203-235.
, 1991, The theory of capital structure, Journal of Finance 46, 297-355. Healy, Paul M., Krishna G. Palepu, and Richard S. Ruback, 1992, Does corporate performance
improve after mergers?, Journal of Financial Economics 31, 135-175. Hirschman, Albert, 1970, Exit, Voice and Loyalty: Responses to Decline in Firms, Organizations
and States (Harvard University Press, Cambridge, Mass.). Holderness, Clifford G., and Dennis P. Sheehan, 1988, The role of majority shareholders in
publicly held corporations: An exploratory analysis, Journal of Financial Economics 20, 317-346.
, 1991, Monitoring an owner: The case of Turner Broadcasting, Journal of Financial Economics 30, 325-346.
Jensen, Michael C., 1983, Organization theory and methodology, Accounting Review 58, 319-339. 1986a, The agency costs of free cash flow: Corporate finance and takeovers, American
Economic Review 76, 323-329. , 1986b, The takeover controversy: Analysis and evidence, Midland Corporate Finance
Journal 4(2), 6-32. , 1988, Takeovers: Their causes and consequences, Journal of Economic Perspectives 2,
21-48. 1989a, Eclipse of the public corporation, Harvard Business Review 67(5), 61-74.
,1989b, Active investors, LBOs, and the privatization of bankruptcy, Journal of Applied Corporate Finance 2, 35-44.
, 1991, Corporate control and the politics of finance, Journal of Applied Corporate Finance 4, 13-33.
and Brian Barry, 1992, Gordon Cain and the Sterling Group (A) and (B), Harvard Business School Case Nos. 9-942-021 and 9-942-022.
Jensen, Michael C., Willy Burkhardt, and Brian K. Barry, 1992, Wisconsin Central Ltd. Railroad and Berkshire Partners (A): Leverage buyouts and financial distress, Harvard Business School Case No. 9-190-062.
Jensen, Michael C., Jay Dial, and Brian K. Barry, 1992, Wisconsin Central Ltd. Railroad and Berkshire Partners (B): LBO associations and corporate governance, Harvard Business School Case No. 9-190-070.

878 The Journal of Finance
Jensen, Michael C., Steven Kaplan, and Laura Stiglin, 1989, Effects of LBOs on tax revenues of the U.S. Treasury, Tax Notes 42, 727-733.
Jensen, Michael C., and William H. Meckling, 1992, Knowledge, control and organizational structure, in Lars Werin and Hans Wijkander, eds.: Current Economics (Blackwell, Oxford), pp. 251-274.
Jensen, Michael C., and Kevin J. Murphy, 1990a, Performance pay and top-management incentives, Journal of Political Economy 98, 225-264.
, 1990b, CEO incentives-It's not how much you pay, but how, Harvard Business Review, 68(3), 138-153.
Jensen, Michael C., and Jerold B. Warner, 1988, The distribution of power among corporate managers, shareholders, and directors. Journal of Financial Economics 20, 3-24.
Kaplan, Steven N., 1989a, The effects of management buyouts on operating performance and value, Journal of Financial Economics 24, 581-618.
, 1989b, Campeau's acquisition of Federated: Value added or destroyed, Journal of Financial Economics 25, 191-212.
, 1989c, Management buyouts: Evidence on taxes as a source of value, Journal of Finance 44, 611-632.
, 1992, Campeau's acquisition of Federated: A post-petition post-mortem, working paper, University of Chicago.
and Jeremy Stein, 1990, How risky is the debt in highly leveraged transactions?, Journal of Financial Economics 27, 215-245.
, 1993, The evolution of buyout pricing and financial structure in the 1980s, Quarterly Journal of Economics 108, 313-358.
Keene, Peter G., 1991, Every Manager's Guide to Information Technology (Harvard University Press, Boston).
Kester, Carl, 1991, Japanese Takeovers: The Global Contest for Corporate Control (Harvard Business School Press, Cambridge, Mass.).
Lamoreaux, Naomi, R., 1985, The Great Merger Movement in American Business, 1895-1904 (Cambridge University Press, Cambridge).
Lang, Larry H. P., Annette Poulsen, and Rene M. Stulz, 1992, Asset sales, leverage, and the agency costs of managerial discretion, Unpublished manuscript, Ohio State University.
Lang, Larry H. P., and Rene M. Stulz, 1992, Contagion and competitive intra-industry effects of bankruptcy announcements: An empirical analysis, Journal of Financial Economics 32, 45-60.
and Ralph A. Walkling, 1991, A test of the free cash flow hypothesis: The case of bidder returns, Journal of Financial Economics 29, 315-335.
Lewellen, Wilbur, Claudio Loderer, and Kenneth Martin, 1987, Executive compensation and executive incentive problems: An empirical analysis, Journal of Accounting and Economics 9, 287-310.
Lichtenberg, Frank R., 1992, Corporate Takeovers and Productivity (M.I.T. Press: Cambridge, Mass.).
and Donald Siegel, 1990, The effects of leveraged buyouts on productivity and related aspects of firm behavior, Journal of Financial Economics 27, 165-194.
Lipton, Martin, 1989, Corporate governance: Major issues for the 1990's, Address to the Third Annual Corporate Finance Forum at the J. Ira Harris Center for the Study of Corporate Finance, University of Michigan School of Business, April 6.
and Jay Lorsch, 1992, A modest proposal for improved corporate governance, Business Lawyer 48, 59-77.
Loomis, Carol J., 1993, Dinosaurs?, Fortune, June 15, 85-000. McCraw, Thomas K., 1981, Rethinking the trust question, in T. McCraw, ed.: Regulation in
Perspective (Division of Research, Harvard University, Graduate School of Business, dis- tributed by Harvard University Press, Boston), pp. 1-55.
, 1992, Antitrust: The perceptions and reality in coping with big business, Harvard Business School Case No. 9-391-292.
McMurray, Donald L., 1929, Coxey's Army: A Study of the Industrial Army Movement of 1894 (Little, Brown, Boston).

The Modern Industrial Revolution, Exit, and Control Systems 879
Magnet, Myron, 1992, Directors, wake up! Fortune, June 15, 85-92. Malabre, Alfred L., Jr., and Lindley H. Clark, Jr., 1992, Dubious figures: Productivity statistics
for the service sector may understate gains, Wall Street Journal, August 12. Mann, Steven V., and Neil W. Sicherman, 1991, The agency costs of free cash flow: Acquisition
activity, and equity issues, Journal of Business 64, 213-227. Mergerstat Review, 1991 (Merrill Lynch, Schaumburg, Illinois). Munro, J. Richard, 1989, Takeovers: The myths behind the mystique, Vital Speeches, May 15. Murphy, Kevin, 1992, Executive Compensation in Corporate America, 1992 (United Shareholders
Association, Washington, D.C.). and Jay Dial, 1992, Compensation and strategy at General Dynamics (A) and (B),
Harvard Business School Case Nos. N9-493-032 and N9-493-033. Neff, Robert, Larry Holyoke, Neil Gross, and Karen Lowry Miller, 1993, Fixing Japan, Business
Week, March 29. Ofek, Eli, 1993, Capital structure and firm response to poor performance: An empirical analysis,
Journal of Financial Economics 34, 3-30. Palepu, Krishna G., 1990, Consequences of leveraged buyouts, Journal of Financial Economics
27, 247-262. Polinsky, A. Mitchell, 1989, An Introduction to Law and Economics (Little, Brown & Co.,
Boston). Pontiff, Jeffrey, Andrei Shleifer, and Michael S. Weisbach, 1990, Reversions of excess pension
assets after takeovers, Rand Journal of Economics 21, 600-613. Porter, Michael E., 1990, Competitive Advantage of Nations (Free Press, New York).
, 1992a, Capital choices: Changing the way America invests in industry, Journal of Applied Corporate Finance 5, 4-16.
, 1992b. Capital choices: Changing the way America invests in industry, A Research Report presented to The Council on Competitiveness and co-sponsored by Harvard Business School.
, 1992c, Capital disadvantage: America's failing capital investment system, Harvard Business Review 70(5), 65-82.
Pound, John, 1988, Proxy contests and the efficiency of shareholder oversight, Journal of Financial Economics 20, 237-265.
, 1991, Proxy voting and the SEC: Investor protection versus market efficiency, Journal of Financial Economics 29, 241-285.
, 1992, Beyond takeovers: Politics comes to corporate control, Harvard Business Review 70(2), 83-93.
, 1993, The rise of the political model of corporate governance and corporate control, Unpublished manuscript, Harvard University, Kennedy School of Government.
Price, Walter W., 1933, We Have Recovered Before! (Harper & Brothers, New York). Reynolds, A. William, 1988, Chairman and Chief Executive Officer, GenCorp Inc., before the
Subcommittee on Oversight and Investigations, U.S. House Committee on Energy and Commerce, February 8.
Richman, Louis S., 1993, Why the economic data mislead us, Fortune, March 8. Roe, Mark J., 1990, Political and legal restraints on ownership and control of public companies,
Journal of Financial Economics 27, 7-42. , 1991, a political theory of American corporate finance, Columbia Law Review 91, 10-67.
Rosett, Joshua G., 1990, Do union wealth concessions explain takeover premiums? The evidence on contract wages, Journal of Financial Economics 27, 263-282.
Sahlman, William A., 1990, The structure and governance of venture-capital organizations. Journal of Financial Economics 27, 473-521.
Sahlman, William A., and Howard H. Stevenson, 1985, Capital market myopia, Journal of Business Venturing 1, 7-30.
Schumpeter, Joseph A., 1976, Capitalism Socialism, and Democracy (Harper & Row, New York). Shleifer, Andrei, and Larry Summers, 1988, Breach of trust in hostile takeovers, in A. Auerbach,
ed.: Corporate Takeovers: Causes and Consequences (University of Chicago Press, Chicago), pp. 33-56.
Shleifer, Andrei, and Robert W. Vishny, 1989, Management entrenchment: The case of manager-specific investments, Journal of Financial Economics 25, 123-139.

880 The Journal of Finance
Smith, Abbie J., 1990, Corporate ownership structure and performance: The case of management buyouts, Journal of Financial Economics 27, 143-164.
Steiner, I. D., 1972, Group Process and Productivity (Academic Press, New York). Stern Stewart Performance 1000, 1992, Corporate Finance, October/November, 33-45. Stewart, G. Bennett, III, 1990, Remaking the public corporation from within, Harvard Business
Review 68(4), 126-137. Stulz, Rene M., 1990, Managerial discretion and optimal financing policies, Journal of Financial
Economics 26, 3-00. Swartz, L. Mick, 1992, The impact of third generation antitakeover laws on security value,
Unpublished manuscript, University of Manitoba. Tedlow, Richard, 1991, Hitting the skids: Tires and time horizons, Unpublished manuscript,
Harvard Business School. Tiemann, Jonathan, 1990, The economics of exit and restructuring: The Pabst Brewing Com-
pany, Unpublished manuscript, Harvard Business School. United Nations, 1993, Monthly Bulletin of Statistics, February (United Nations, New York). United Nations, 1992, 1988/89 Statistical yearbook, thirty-seventh issue (United Nations, New
York). U.S. Bureau of the Census, 1987, Census of Manufacturing (U.S. Government Printing Office,
Washington, D.C.) U.S. Bureau of the Census, Housing and Household Economic Statistics Division, 1991 (U.S.
Government Printing Office, Washington, D.C.). U.S. Department of Labor, Bureau of Labor Statistics, Office of Productivity and Technology,
1990, Multifactor Productivity Measures, Report No. USDL 91-412. - 1991, International Comparisons of Manufacturing Productivity and Unit Labor Cost
Trends, Report No. USDL 92-752. van Delden, Hendrik H., 1993, Czech and Slovak Republics: Lands of opportunity, ITS Textile
Leader, Spring, 43-48. Vietor, Richard, 1994, Contrived Competition (Harvard University Press, Cambridge, Mass.)
Forthcoming. Warner, Jerold B., Ross L. Watts, and Karen H. Wruck, 1989, Stock prices and top management
changes, Journal of Financial Economics 20, 461-492. Watson, Bruce, 1993, For a while the Luddites had a smashing success, Smithsonian, April, pp.
140-154. Weisbach, Michael S., 1988, Outside directors and CEO turnovers,Journal of Financial Eco-
nomics 20, 431-460. Wruck, Karen H. 1990, Financial distress, reorganization, and organizational efficiency, Journal
of Financial Economics 27, 420-444. - 1991, What really went wrong at Revco?, Journal of Applied Corporate Finance 4,
79-92. , 1992, Changing the rules of the game: Sealed Air Corporation's leveraged recapitaliza-
tion, Working paper, Harvard Business School. and Michael C. Jensen, 1993, Science, specific knowledge, and total quality manage-
ment, Unpublished manuscript, Harvard Business School. Wruck, Karen H., and A. Scott Keating, 1992a, Sterling Chemicals, Inc., quality and productivity
improvement program, Harvard Business School Case No. 9-493-026. , 1992b, Sterling Chemicals, Inc., Harvard Business School Case No. 9-493-025.
Wruck, Karen H., and Krishna Palepu, 1992, Consequences of leveraged shareholder payouts: Defensive versus voluntary recapitalizations, Working paper, Harvard Business School.
Wruck, Karen H. and Steve-Anna Stephens, 1992a, Leveraged buyouts and restructuring: The case of Safeway, Inc., Harvard Business School Case No. 192-095.
, 1992b, Leveraged buyouts and restructuring: The case of Safeway, Inc.: Media response, Harvard Business School Case No. 192-094.
Zellner, Wendy, 1992, Not everybody loves Wal-Mart's low prices, Wall Street Journal, October 12.