american indians and alaska natives in postsecondary education · national center for education...
TRANSCRIPT
NATIONAL CENTER FOR EDUCATION STATISTICSOctober 1998
American Indians andAlaska Natives inPostsecondary Education
D. Michael PavelWashington State University
Rebecca Rak SkinnerElizabeth FarrisWestat
Margaret CahalanMathematica Policy Research, Inc.
John TippeconnicPennsylvania State University
Wayne SteinMontana State University
Bernard Greene, Project OfficerMartha Hollins, Project OfficerNational Center for Education Statistics
U.S. Department of EducationOffice of Educational Research and Improvement NCES 98-291
U.S. Department of EducationRichard W. RileySecretary
Office of Educational Research andImprovement
C. Kent McGuireAssistant Secretary
National Center for Education StatisticsPascal D. Forgione, Jr.Commissioner
The National Center for Education Statistics (NCES) is the primary federal entity for collecting,analyzing, and reporting data related to education in the United States and other nations. It fulfills acongressional mandate to collect, collate, analyze, and report full and complete statistics on the conditionof education in the United States; conduct and publish reports and specialized analyses of the meaningand significance of such statistics; assist state and local education agencies in improving their statisticalsystems; and review and report on education activities in foreign countries.
NCES activities are designed to address high priority education data needs; provide consistent, reliable,complete, and accurate indicators of education status and trends; and report timely, useful, and highquality data to the U.S. Department of Education, the Congress, the states, other educationpolicymakers, practitioners, data users, and the general public.
We strive to make our products available in a variety of formats and in language that is appropriate to avariety of audiences. You, as our customer, are the best judge of our success in communicatinginformation effectively. If you have any comments or suggestions about this or any other NCES productor report, we would like to hear from you. Please direct your comments to:
National Center for Education StatisticsOffice of Educational Research and ImprovementU.S. Department of Education555 New Jersey Avenue NWWashington, DC 20208-5574
October 1998
The NCES World Wide Web Home Page ishttp://nces.ed.gov
Suggested CitationU.S. Department of Education, National Center for Education Statistics. American Indians and AlaskaNatives in Postsecondary Education. NCES 98-291, by D. Michael Pavel, Rebecca Skinner, ElizabethFarris, Margaret Cahalan, John Tippeconnic, and Wayne Stein. Project Officers, Bernard Greene andMartha Hollins. Washington, DC: 1998.
Contact:Martha Hollins(202) 219-1462
For sale by the U.S. Government Printing Office
Superintendent of Documents, Mail Stop: SSOP, Washington, DC 20402-9328
ISBN
i
ACKNOWLEDGMENTS
he authors appreciate the indepth review of this report by the
following adjudication panel members:
David ClearyDivision of Elementary, Secondary, and Vocational AnalysisBudget ServiceOffice of the Under Secretary
Michael CohenStatistical Standards and Surveys GroupNational Center for Education Statistics
Thomas CorwinDivision of Elementary, Secondary, and Vocational AnalysisOffice of the Under Secretary
Irene HarwarthNational Institute on Postsecondary Education, Libraries, and Lifelong LearningOffice of the Assistant Secretary for Educational Research and Improvement
Charlene HoffmanData Development and Longitudinal Studies GroupNational Center for Education Statistics
Summer Whitener KingSurveys and Cooperative Systems GroupNational Center for Education Statistics
This report would not have been possible without the technical support
provided by Bernard Greene, the original Project Officer, Martha Hollins, the
current Project Officer, and Roslyn Korb, National Center for Education
Statistics. The authors also wish to acknowledge the contribution of John
Cheek, National Indian Education Association, to the financial aid chapter, and
Susan Rhode to the access chapter. At Westat, the production of this report
was made possible by the contributions of Ana Horton, cover design; Carol
Litman, editor; Sylvie Warren, word processing, layout, and graphics; Violet
Agufa, Philip Cardillo, and Grace Lo, table preparation.
T
iii
PREFACE
his report was begun to illustrate the type and amount of data that were
available to describe the status of American Indians and Alaska Natives in
postsecondary education. As part of this effort, a working group of individuals
with extensive involvement in Native American education
was convened. This group helped provide direction and
scope for the project. Several members of the group
remained actively involved in the project, either by
providing feedback as the report evolved or by actually
writing some sections of the report. Their involvement led
to what we believe is a seminal work. The report provides
meaningful information and a new awareness of the many
ways American Indians and Alaska Natives participate in
postsecondary education. It highlights the difficulties
involved in obtaining data on Native Americans, particularly through the use of
sample surveys. And, it forms the foundation for additional studies of Native
Americans in postsecondary education as new and better data become
available.
We hope you will find this report as enlightening as we did.
T
Table of ContentS
Page
v
acknowledgments ....................................................................... i
preface.............................................................................................. iii
Introduction to American Indians andAlaska Natives in Postsecondary Education
Introduction ................................................................................................................... xxixTerminology .................................................................................................................. xxixLimitations of the Data............................................................................................. xxx
Small Sample Sizes .............................................................................................. xxxiRacial/Ethnic Data................................................................................................ xxxiii
Other Data Concerns ................................................................................................. xxxvQuantitative Versus Qualitative Data................................................................. xxxviStructure of the Sourcebook................................................................................... xxxvii
Chapter 1American Indian and Alaska Native Demographicsand Historical Overview of Education
Highlights from the 1990 Decennial Census .................................................. 1-1Sources of Data............................................................................................................ 1-2Demographics............................................................................................................... 1-4Historical Overview of Higher Education.......................................................... 1-16Conclusion...................................................................................................................... 1-20
Chapter 2American indian and alaska native access topostsecondary education
Highlights........................................................................................................................ 2-2Sources of Data............................................................................................................ 2-2Access to Postsecondary Education .................................................................... 2-4
High School Graduation Rates........................................................................ 2-5College Admission Criteria ............................................................................... 2-9
Undergraduate Student Risk Factors................................................................... 2-14Conclusion...................................................................................................................... 2-15
[
Table of ContentS
Page
vi
Chapter 3american indian and alaska native enrollmentand retention in higher education
Highlights........................................................................................................................ 3-1Sources of Data............................................................................................................ 3-2Enrollment in Higher Education............................................................................ 3-4Enrollment by Location ............................................................................................ 3-14Retention in Postsecondary Education .............................................................. 3-19Conclusion...................................................................................................................... 3-24
Chapter 4degrees conferred on american indiansand alaska natives by institutions of higher education
Highlights........................................................................................................................ 4-1Sources of Data............................................................................................................ 4-3Total Number of Degrees Conferred .................................................................. 4-5Major Field of Study of Degrees Conferred ..................................................... 4-13Characteristics of Bachelor’s Degree Recipients ............................................ 4-16Characteristics of Doctoral Recipients................................................................ 4-20Institutions Awarding Degrees to American Indians and
Alaska Natives ....................................................................................................... 4-28Conclusion...................................................................................................................... 4-33
Chapter 5financial aid for american indians andalaska natives in postsecondary institutions
Highlights........................................................................................................................ 5-1Sources of Data............................................................................................................ 5-2Student Characteristics and Attendance Patterns ......................................... 5-4Costs of Attendance ................................................................................................... 5-7Financial Need, Financial Aid, and Remaining Financial Need ............... 5-11Average Costs After Financial Aid........................................................................ 5-15Doctorate Recipients and Sources of Support ................................................ 5-17Federal Funding Sources of Native American Students.............................. 5-19Other Sources of Financial Aid Information .................................................... 5-23Conclusion...................................................................................................................... 5-23
l
P
Table of ContentS
Page
vii
Chapter 6american indian and alaska native staff andfaculty in institutions of higher education
Highlights........................................................................................................................ 6-1Sources of Data............................................................................................................ 6-3American Indian and Alaska Natives Staff in Institutions of Higher
Education..................................................................................................................... 6-4American Indian and Alaska Native Faculty ................................................... 6-11
Estimates and Counts of the Number of American Indian and Alaska Native Faculty .......................................................................... 6-11Full-Time Faculty in IHEs ................................................................................... 6-12Distribution of Full-Time Faculty by Institution Control andLevel........................................................................................................................... 6-14Part-Time and Full-Time Faculty .................................................................... 6-15Full-Time Faculty Salaries.................................................................................. 6-18Full-Time Faculty Rank....................................................................................... 6-19Full-Time Faculty Tenure Status ..................................................................... 6-21Newly Hired Full-Time Faculty ........................................................................ 6-23
Location of American Indian and Alaska Native Staff and Faculty....... 6-27Tribal College Staff and Faculty ............................................................................ 6-31Conclusion...................................................................................................................... 6-34
Chapter 7tribally controlled colleges
Highlights........................................................................................................................ 7-1Founding of Navajo Community College ......................................................... 7-2Mission of Tribal Colleges ....................................................................................... 7-3American Indian Higher Education Consortium ............................................ 7-5Tribally Controlled Community College Act .................................................... 7-7Enrollment and Outcomes at Tribally Controlled Colleges....................... 7-8Tribal College Operations, Faculty, and Program Offerings ..................... 7-10Institutional Funding.................................................................................................. 7-14Expansion to 4-Year Institutions .......................................................................... 7-15Conclusion...................................................................................................................... 7-16
z
(
Table of ContentS
Page
viii
Chapter 7 (continued)
Highlights of Tribal Colleges .................................................................................. 7-17
Bay Mills Community College......................................................................... 7-19Blackfeet Community College......................................................................... 7-20Cheyenne River Community College........................................................... 7-21College of the Menominee Nation ............................................................... 7-22Crownpoint Institute of Technology ............................................................ 7-23D-Q University........................................................................................................ 7-24Dull Knife Memorial College............................................................................ 7-25Fond du Lac Tribal Community College ..................................................... 7-26Fort Belknap Community College ................................................................. 7-27Fort Berthold Community College................................................................. 7-28Fort Peck Community College......................................................................... 7-29Haskell Indian Junior College ......................................................................... 7-30The Institute of American Indian and Alaska Native Culture and Arts Development................................................................................... 7-31Lac Courte Oreilles Ojibwa Community College..................................... 7-32Leech Lake Tribal Colleges............................................................................... 7-33Little Big Horn College........................................................................................ 7-34Little Hoop Community College..................................................................... 7-35Little Priest Tribal College ................................................................................. 7-36Navajo Community College............................................................................. 7-37Nebraska Indian Community College ......................................................... 7-38Northwest Indian College ................................................................................. 7-39Oglala Lakota College ........................................................................................ 7-40Salish Kootenai College ..................................................................................... 7-41Sinte Gleska University ...................................................................................... 7-42Sisseton Wahpeton Community College.................................................... 7-43Southwestern Indian Polytechnic Institute................................................ 7-44Standing Rock College ....................................................................................... 7-45Stone Child College.............................................................................................. 7-46Turtle Mountain Community College .......................................................... 7-47United Tribes Technical College..................................................................... 7-48Endnotes for Tribal College Highlights ....................................................... 7-49
Table of ContentS
Page
ix
List of appendices
A Appendix Tables ................................................................................................... A-1B Selected Standard Error Tables....................................................................... B-1C Glossary.................................................................................................................... C-1D Works Cited ............................................................................................................ D-1E Additional Sources ............................................................................................... E-1
Table of ContentS
Page
x
List of Figures
Chapter 1
1-1 American Indian Population: Selected years, 1900-90 .......................... 1-4
1-2 Percent distribution of the American Indian and Alaska Nativepopulation and total population, by age group: 1990............................ 1-5
1-3 Percent distribution of American Indian and Alaska Nativepopulation and total population, by region: 1990.................................. 1-6
1-4 Size of American Indian and Alaska Native population,by state: 1990 ..................................................................................................... 1-7
1-5 Percent distribution of American Indian and Alaska Nativepopulation and total population, by urban/rural areas: 1990............. 1-8
1-6 American Indian and Alaska Native families and total families,by type of family: 1990................................................................................... 1-9
1-7 American Indian and Alaska Native labor force participationand total labor force participation, by sex: 1990..................................... 1-10
1-8 American Indian and Alaska Native population and totalpopulation, by occupation: 1990 ................................................................. 1-11
1-9 American Indian and Alaska Native median family income andtotal median family income, by type of family: 1990 ............................ 1-12
1-10 American Indian and Alaska Native poverty rates and totalpoverty rates, by type of family: 1989........................................................ 1-13
1-11 Educational attainment of American Indian and Alaska Nativepopulation and total population, 25 years and older:1980 and 1990................................................................................................... 1-14
1-12 Percent of American Indians and Alaska Natives with a highschool diploma or higher, 25 years and older, by reservation:1990....................................................................................................................... 1-16
Chapter 2
2-1 High school completion rates for American Indian and AlaskaNative population and total population, 25 years and older:1980 and 1990................................................................................................... 2-6
2-2 Trends in high school graduation rates for seniors, by Indianschool type: 1990-91 and 1993-94............................................................. 2-8
2-3 Trends in college application rates for seniors, by Indian schooltype: 1990-91 and 1993-94 .......................................................................... 2-9
Table of ContentS
Page
xi
List of Figures (continued)
2-4 Core curriculum course completion for high school graduates,by race/ethnicity: 1982, 1987, 1990, and 1992...................................... 2-10
2-5 Combined verbal and mathematics SAT scores, by race/ethnicity:Selected years, 1976, 1993, 1994, and 1995............................................ 2-11
2-6 ACT scores, by race/ethnicity: 1993-95...................................................... 2-12
2-7 Selected risk factors for American Indian and Alaska Nativeundergraduates and total undergraduates: 1992-93 ............................. 2-15
Chapter 3
3-1 American Indian and Alaska Native enrollment in institutions ofhigher education, by institution level: Selected years, fall 1976 tofall 1994................................................................................................................ 3-5
3-2 Percent of American Indian and Alaska Native enrollment andtotal enrollment in institutions of higher education, by institutionlevel: Fall 1976 and fall 1994........................................................................ 3-6
3-3 Percent of American Indian and Alaska Native enrollment andtotal enrollment in institutions of higher education, by institutioncontrol: Fall 1976 and fall 1994 ................................................................... 3-8
3-4 Percent of American Indian and Alaska Native enrollment andtotal enrollment in institutions of higher education, by sex:Fall 1976 and fall 1994.................................................................................... 3-9
3-5 Percent of American Indian and Alaska Native enrollment andtotal enrollment in institutions of higher education, by attendancestatus: Fall 1994 ................................................................................................ 3-10
3-6 American Indian and Alaska Native enrollment in institutions ofhigher education, by degree level: Selected years, fall 1976 tofall 1994................................................................................................................ 3-12
3-7 Percent distribution of American Indian and Alaska Nativeundergraduate enrollment and total undergraduate enrollment ininstitutions of higher education, by major fields of study: 1992-93... 3-14
3-8 American Indian and Alaska Native enrollment in institutions ofhigher education, by state: Fall 1984 and fall 1994 ............................... 3-18
3-9 American Indian and Alaska Native enrollment in institutions ofhigher education as a percent of total state enrollment, by state:Fall 1984 and fall 1994.................................................................................... 3-20
Table of ContentS
Page
xii
List of Figures (continued)
3-10 NCAA Division I 6-year graduation rates, by race/ethnicity:1995 and 1996................................................................................................... 3-21
3-11 Graduation rates for American Indian and Alaska Nativeundergraduates and all undergraduates at NCAA Division Iinstitutions, by institution control: 1995 and 1996................................. 3-22
3-12 Persistence rates for American Indian and Alaska Nativeundergraduates and all undergraduates at NCAA Division IIinstitutions, by race/ethnicity and freshman cohort: 1995 ................... 3-23
3-13 Persistence rates for American Indian and Alaska Nativeundergraduates and all undergraduates at NCAA Division IIIinstitutions, by race/ethnicity and freshman cohort: 1995 ................... 3-24
Chapter 4
4-1 Number of degrees conferred to American Indians and AlaskaNatives in institutions of higher education: 1977-94 ............................. 4-6
4-2 Percent change in degrees conferred to American Indian andAlaska Native degree recipients and total degree recipientsin institutions of higher education: 1976-77 to 1993-94 ...................... 4-7
4-3 Percent distribution of degrees awarded to American Indian andAlaska Native degree recipients and total degree recipients ininstitutions of higher education, by degree level: 1993-94 .................. 4-10
4-4 Percent change in degrees conferred to American Indian andAlaska Native degree recipients and total degree recipients ininstitutions of higher education, by sex and degree level:1976-77 to 1993-94.......................................................................................... 4-11
4-5 Percent distribution of bachelor’s degrees awarded to AmericanIndian and Alaska Native degree recipients and total degreerecipients in institutions of higher education, by selected majorfield of study: 1976-77 and 1993-94 .......................................................... 4-14
4-6 Percent distribution of bachelor’s degrees awarded to AmericanIndian and Alaska Native degree recipients and total degreerecipients in institutions of higher education, by sex and selectedmajor field of study: 1993-94........................................................................ 4-15
4-7 Selected institution-related characteristics of 1992-93 AmericanIndian and Alaska Native bachelor’s degree recipients and1992-93 total bachelor’s degree recipients: 1994................................... 4-17
Table of ContentS
Page
xiii
List of Figures (continued)
4-8 Employment status of 1992-93 American Indian and Alaska Nativebachelor’s degree recipients and 1992-93 total bachelor’s degreerecipients: 1994................................................................................................. 4-18
4-9 Employment characteristics of 1992-93 American Indian andAlaska Native bachelor’s degree recipients and 1992-93 totalbachelor’s degree recipients: 1994 .............................................................. 4-19
4-10 Post-degree enrollment of 1992-93 American Indian and AlaskaNative bachelor’s degree recipients and 1992-93 total bachelor’sdegree recipients, by attendance status: 1994 ......................................... 4-20
4-11 Status of postgraduation plans of American Indian and AlaskaNative doctor’s recipients, U.S. citizen doctor’s recipients, and totaldoctor’s recipients at time of completion of doctor’s degree: 1994 ... 4-24
4-12 Postdoctoral plans of American Indian and Alaska Native doctor’srecipients, U.S. citizen doctor’s recipients, and total doctor’srecipients: 1994................................................................................................. 4-25
4-13 Postgraduation commitments of American Indian and AlaskaNative doctor’s recipients, U.S. citizen doctor’s recipients, and totaldoctor’s recipients: Selected years, 1974-94 ............................................. 4-26
Chapter 5
5-1 Percent distribution of American Indian and Alaska Nativeundergraduates and all undergraduates, by dependency status:1992-93 ................................................................................................................ 5-6
5-2 Percent distribution of financially independent American Indianand Alaska Native undergraduates and all undergraduates, byfamily income: 1992-93.................................................................................. 5-7
5-3 Average student reported total cost of attendance for AmericanIndian and Alaska Native undergraduates and all undergraduates,by attendance status: 1992-93...................................................................... 5-8
5-4 Average expected family contribution among American Indian andAlaska Native undergraduates and all undergraduates: 1992-93...... 5-9
5-5 Average tuition and fees for American Indian and Alaska Nativeundergraduates and all undergraduates, by attendance status:1992-93 ................................................................................................................ 5-10
5-6 Percent of American Indian and Alaska Native undergraduates andall undergraduates with financial need and average amount ofneed: 1992-93 ................................................................................................... 5-12
Table of ContentS
Page
xiv
List of Figures (continued)
5-7 Percent distribution of financial aid for American Indian andAlaska Native undergraduates and all undergraduates,by combination of type of aid: 1992-93 .................................................... 5-14
5-8 Average cost of postsecondary education for American Indian andAlaska Native undergraduates and all undergraduates adjustedby attendance: 1992-93.................................................................................. 5-16
5-9 Percent distribution of primary sources of support for AmericanIndian and Alaska Native doctor’s recipients and U.S. citizendoctor’s recipients: 1994................................................................................. 5-18
Chapter 6
6-1 Total number of American Indian and Alaska Native full-time staffemployed in institutions of higher education: Fall 1983 and 1993 ... 6-5
6-2 Percent distribution of American Indian and Alaska Native full-timestaff and total full-time staff in institutions of higher education: Fall1993....................................................................................................................... 6-7
6-3 Percent change in the number of American Indian and AlaskaNative full-time staff and total full-time staff in institutions of highereducation, by primary occupation: Fall 1983-93 ..................................... 6-8
6-4 Percent change in the number of American Indian and AlaskaNative full-time staff and total full-time staff in institutions of highereducation, by sex and selected professional occupations: Fall1983-93 ................................................................................................................ 6-9
6-5 Number of American Indian and Alaska Native full-time faculty ininstitutions of higher education: Selected years, 1976 to 1993 .......... 6-13
6-6 Percent distribution of American Indian and Alaska Native facultyand total faculty in institutions of higher education, by institutionlevel and employment status: Fall 1993 .................................................... 6-16
6-7 Percent distribution of American Indian and Alaska Native facultyand total faculty in institutions of higher education, by sex andemployment status: Fall 1993 ....................................................................... 6-17
Table of ContentS
Page
xv
List of Figures (continued)
6-8 Percent distribution of American Indian and Alaska Native facultyand total faculty in institutions of higher education, by institutionlevel and sex: Fall 1993 .................................................................................. 6-18
6-9 Median salaries of American Indian and Alaska Native full-timefaculty and total full-time faculty in institutions of higher education,by institution level and control, and sex: Fall 1993 ................................ 6-19
6-10 Percent distribution of American Indian and Alaska Native full-timefaculty and total full-time faculty in institutions of higher education,by rank: Fall 1993............................................................................................. 6-20
6-11 Percent of full-time faculty with tenure in institutions of highereducation, by race/ethnicity: Fall 1993 ...................................................... 6-21
6-12 Percent distribution of new full-time hires and total full-time facultyin institutions of higher education, by race/ethnicity: Fall 1993 ......... 6-25
6-13 Percent distribution of tenure status of newly hired full-time facultyin institutions of higher education, by race/ethnicity: Fall 1993 ......... 6-26
Chapter 7
7-1 Growth of U.S. tribally controlled colleges in the United States:1968-97 ................................................................................................................ 7-4
7-2 AIHEC member institutions, by state: 1995 ............................................... 7-6
7-3 Tribally controlled college federal funding per full-time-equivalent(FTE) Indian student count (ISC): Selected FY, 1981-96........................... 7-8
7-4 American Indian and Alaska Native enrollment in institutions ofhigher education: Fall 1994 ........................................................................... 7-9
7-5 Faculty salaries at tribal colleges and 2-year public institutions ofhigher education: Fall 1995-96..................................................................... 7-11
List of Exhibits
Chapter 1
1-1 Four Centuries of American Indian and Alaska NativePostsecondary Education ................................................................................. 1-17
Chapter 7
7-1 Common mission statements of tribally controlled colleges ................. 7-4
Table of ContentS
Page
xvi
List of tables
Chapter 2
2-1 American Indian and Alaska Native public school enrollment andtotal public school enrollment, by school type: 1993-94 ...................... 2-7
2-2 Percent of college-bound high school graduates classified asmeeting each of five specified criteria identified as being importantto college admissions officers, by race/ethnicity: 1992 ......................... 2-13
2-3 Percent distribution of undergraduates, by race/ethnicity andnumber of risk factors: 1992-93 ................................................................... 2-14
Chapter 3
3-1 Enrollment in institutions of higher education, by race/ethnicity:Selected years, fall 1976 to fall 1994 ........................................................... 3-4
3-2 Institutions of higher education with largest American Indian andAlaska Native enrollment: Fall 1994 ........................................................... 3-16
3-3 American Indian and Alaska Native enrollment and totalenrollment, by tribal college: Fall 1994 ...................................................... 3-17
Chapter 4
4-1 Total degrees awarded to American Indian and Alaska Nativedegree recipients and total degree recipients in institutions ofhigher education, by degree level: 1976-77 and 1993-94................... 4-8
4-2 American Indian and Alaska Native population and total U.S.resident population: 1980, 1990, and 1994............................................. 4-9
4-3 Percent distribution of degrees awarded to American Indian andAlaska Native degree recipients and total degree recipients ininstitutions of higher education, by sex and degree level:1976-77, 1986-87, and 1993-94................................................................... 4-12
4-4 Number of years to doctor’s degree from bachelor’s degree awardfor U.S. citizen doctor’s recipients, by broad field and race/ethnicity: 1994................................................................................................... 4-21
4-5 Percent of American Indian and Alaska Native doctor’s recipients,U.S. citizen doctor’s recipients, and all doctor’s recipients whoreceived graduate school support, by source of support: 1994........... 4-27
4-6 Institutions awarding the largest number of degrees to AmericanIndians and Alaska Natives: 1993-94 ......................................................... 4-29
Table of ContentS
Page
xvii
List of tables (continued)
4-7 Institutions awarding the largest number of bachelor’s degrees toAmerican Indians and Alaska Natives: 1993-94...................................... 4-30
4-8 Degrees awarded to American Indians and Alaska Natives,by degree level and tribal college: 1993-94.............................................. 4-32
Chapter 5
5-1 Percent distribution of American Indian and Alaska Native studentsand total students enrolled in institutions of higher education, byinstitution level and control and attendancestatus: Fall 1992 ................................................................................................ 5-5
5-2 Percent of American Indian and Alaska Native undergraduates andall undergraduates receiving federal, state, or institutionalaid and amount of aid: 1992-93 .................................................................. 5-13
5-3 Percent of American Indian and Alaska Native undergraduates andall undergraduates receiving financial aid for postsecondaryeducation and the average amount awarded to aid recipients,by dependency status: 1992-93 ................................................................... 5-15
5-4 Cumulative debt related to the education of American Indian andAlaska Native doctor’s recipients, all doctor’s recipients, and U.S.citizen doctor’s recipients, by level of debt: 1994.................................... 5-19
Chapter 6
6-1 Percent distribution of full-time staff in institutions of highereducation, by race/ethnicity and primary occupation: Fall 1993........ 6-6
6-2 Median salaries for full-time staff in institutions of highereducation, by primary occupation and race/ethnicity: Fall 1993........ 6-10
6-3 Percent distribution of full-time faculty and total undergraduate fallenrollment and bachelor’s degree completions in institutions ofhigher education, by race/ethnicity: Fall 1975, 1976, and 1993........ 6-14
6-4 Percent distribution of American Indian and Alaska Native andtotal faculty in institutions of higher education, by institution leveland control: Fall 1993...................................................................................... 6-15
6-5 Percent distribution of tenure status of American Indian and AlaskaNative full-time faculty and total full-time faculty in institutions ofhigher education, by institution level: Fall 1993...................................... 6-22
Table of ContentS
Page
xviii
List of tables (continued)
6-6 Percent distribution of tenure status of full-time faculty ininstitutions of higher education, by race/ethnicity: Fall 1975 and1993....................................................................................................................... 6-23
6-7 Number of new full-time faculty hires in institutions of highereducation, by race/ethnicity: Selected years, 1977 to 1993................. 6-24
6-8 Institutions of higher education with the largest number ofAmerican Indian and Alaska Native staff: Fall 1993............................... 6-28
6-9 Institutions of higher education with the largest number ofAmerican Indian and Alaska Native faculty: Fall 1993 .......................... 6-30
6-10 American Indian and Alaska Native staff and total staff, by tribalcollege: Fall 1993.............................................................................................. 6-32
6-11 American Indian and Alaska Native faculty and total faculty,by employment status and tribal college: Fall 1993............................... 6-33
Chapter 7
7-1 Degree programs offered at tribally controlled colleges: 1995 ........... 7-13
Table of ContentS
Page
xix
List of Summary Tables
Chapter 1
S1-1 Total population and American Indian population, by sex:Selected years, 1900-90 ................................................................................... 1-21
S1-2 Percent distribution of American Indian tribes with populations of10,000 or more: 1990 ..................................................................................... 1-22
S1-3 American Indian and Alaska Native population living in selectedstates, by identified areas and households types: 1990........................ 1-23
S1-4 American Indian, Eskimo, and Aleut, and total population living onselected reservations and trust lands: 1990.............................................. 1-24
S1-5 Tribal population and percent distribution of highest level ofeducational attainment for persons 25 years and over, by tribe:1990....................................................................................................................... 1-25
Chapter 3
S3-1 Enrollment in institutions of higher education, by institution leveland race/ethnicity: Selected years, fall 1976 to fall 1994 ..................... 3-26
S3-2 Enrollment in institutions of higher education, by institution controland race/ethnicity: Selected years, fall 1976 to fall 1994 ..................... 3-27
S3-3 Enrollment in institutions of higher education, by sex andrace/ethnicity: Selected years, fall 1976 to fall 1994.............................. 3-28
S3-4 Enrollment in institutions of higher education, by attendancestatus, institution level, and race/ethnicity: Fall 1990 tofall 1994................................................................................................................ 3-29
S3-5 Enrollment in institutions of higher education, by attendancestatus, institution control, and race/ethnicity: Fall 1990 tofall 1994................................................................................................................ 3-30
S3-6 Enrollment in institutions of higher education, by attendancestatus, sex, and race/ethnicity: Fall 1990 to fall 1994............................ 3-31
S3-7 Enrollment in institutions of higher education, by degree level andrace/ethnicity: Selected years, fall 1976 to fall 1994.............................. 3-32
Table of ContentS
Page
xx
List of Summary Tables (continued)
Chapter 4
S4-1 Degrees awarded to American Indian and Alaska Native degreerecipients and total degree recipients, by type of degree and sex:Selected years, 1976-77 to 1993-94............................................................. 4-34
S4-2 Percent distribution of American Indian and Alaska Nativeassociate’s degree recipients and total associate’s degreerecipients, by field of study: 1984-85 and 1993-94................................ 4-35
S4-3 Percent distribution of American Indian and Alaska Native master’sdegree recipients and total master’s degree recipients, by field ofstudy: 1976-77 and 1993-94 ........................................................................ 4-36
S4-4 Percent distribution of American Indian and Alaska Native doctor’sdegree recipients and total doctor’s degree recipients, by field ofstudy: 1976-77 and 1993-94 ........................................................................ 4-37
S4-5 Percent distribution of American Indian and Alaska Native first-professional degree recipients and total first-professional degreerecipients, by field of study: 1976-77 and 1993-94................................ 4-38
S4-6 Percent distribution of 1992-93 bachelor’s degree recipientsaccording to student outcomes, by race/ethnicity: 1994 ...................... 4-39
S4-7 Major field of study of U.S. citizen doctor’s recipients, by race/ethnicity: 1994................................................................................................... 4-40
S4-8 Institutions awarding the largest number of associate’s degrees toAmerican Indians and Alaska Natives: 1993-94...................................... 4-41
S4-9 Institutions awarding the largest number of master’s degrees toAmerican Indians and Alaska Natives: 1993-94...................................... 4-42
S4-10 Institutions awarding the largest number of first-professionaldegrees to American Indians and Alaska Natives: 1993-94................. 4-43
S4-11 Institutions awarding the largest number of doctor’s degrees toAmerican Indians and Alaska Natives: 1993-94...................................... 4-44
S4-12 Institutions awarding the largest number of doctor’s degrees toAmerican Indians and Alaska Natives over a 4-year period:1990-94 ................................................................................................................ 4-46
Table of ContentS
Page
xxi
List of Summary Tables (continued)
Chapter 5
S5-1 Average expected family contribution among undergraduates,by race/ethnicity and institution control and level: 1992-93............... 5-25
S5-2 Average tuition and fees for undergraduates, by race/ethnicity,attendance status, and institution control and level: 1992-93 ............ 5-26
S5-3 Percent of American Indian and Alaska Native undergraduates andall undergraduates with financial need and average amount ofneed, by race/ethnicity and institution control and level:1992-93 ................................................................................................................ 5-27
S5-4 Average amount of financial aid received by undergraduates,by race/ethnicity and type of aid: 1992-93............................................... 5-28
S5-5 Average cost of postsecondary education among undergraduatesadjusted for attendance, by race/ethnicity and institution controland level: 1992-93 ........................................................................................... 5-29
S5-6 Number of doctor’s recipients and percent distribution of primarysources of support, by demographic group, race/ethnicity, andbroad field: 1994............................................................................................... 5-30
S5-7 Federal funds for all postsecondary education programs andIndian education programs: Selected fiscal years, 1965-96 ................. 5-31
Chapter 6
S6-1 Number of employees in institutions of higher education,by primary occupation and race/ethnicity: Fall 1993............................. 6-35
S6-2 Number and percent change in American Indian and AlaskaNative full-time staff and total full-time staff in institutions of highereducation, by sex and primary occupation: Fall 1983 and fall1993....................................................................................................................... 6-36
S6-3 Number and percent distribution of faculty and instructional staff,by employment status and race/ethnicity: Fall 1992 ............................. 6-37
S6-4 Number and percent distribution of full-time instructional faculty ininstitutions of higher education, by race/ethnicity and academicrank: Fall 1981 and fall 1993........................................................................ 6-38
Table of ContentS
Page
xxii
List of Summary Tables (continued)
S6-5 Number of yearly new full-time faculty hires, by race/ethnicity:1981-91 ................................................................................................................ 6-39
S6-6 Number of American Indian and Alaska Native faculty ininstitutions of higher education, by state: Fall 1993 ................................ 6-40
List of Appendix Tables
Chapter 1
A1-1 American Indian and Alaska Native population and totalpopulation, by state: 1990 ............................................................................. A-3
A1-2 Educational attainment of American Indians and Alaska Natives,by age and sex: 1990 ...................................................................................... A-4
A1-3 Educational attainment of persons 25 years and over,by race/ethnicity and state: April 1990 ...................................................... A-6
A1-4 Tribal population and percent distribution of highest level ofeducational attainment for persons 18 to 24 years, by tribe: 1990... A-7
A1-5 Female tribal population and percent distribution of highest levelof educational attainment for females 25 years and over, by tribe:1990....................................................................................................................... A-10
A1-6 Male tribal population and percent distribution of highest level ofeducational attainment for males 25 years and over, by tribe:1990....................................................................................................................... A-14
Table of ContentS
Page
xxiii
List of Appendix Tables (continued)
Chapter 2
A2-1 Percent of high school graduates who earned the recommendedunits in core courses, by race/ethnicity: 1982, 1987, 1990, and1992....................................................................................................................... A-18
A2-2 Percent of high school graduates taking 4 units in English, 3 unitsin social studies, 3 units in science, 3 units in math, 0.5 units incomputer science, and 2 units in foreign language, by race/ethnicity: 1982, 1987, 1990, and 1992 ..................................................... A-19
A2-3 Percent of high school graduates taking selected mathematics andscience courses, by race/ethnicity: 1982, 1987, 1990, and 1992 ...... A-20
A2-4 Average scores on Scholastic Aptitude Test (SAT), by race/ethnicity:1975-76 to 1994-95.......................................................................................... A-22
A2-5 Average scores on the ACT assessment, by race/ethnicity: 1992,1994, and 1995.................................................................................................. A-23
Chapter 3
A3-1 American Indian and Alaska Native enrollment in institutions ofhigher education, by institution control and level: Selected years,1976 to 1994 ...................................................................................................... A-24
A3-2 Enrollment in institutions of higher education, by race/ethnicityand state: Fall 1994.......................................................................................... A-25
A3-3 American Indian and Alaska Native enrollment in institutions ofhigher education, by state: Selected years, fall 1984 to fall 1994 ...... A-26
A3-4 American Indian and Alaska Native enrollment in institutions ofhigher education, by state: Selected years, fall 1984 and fall 1994.... A-27
A3-5 Graduation rates at NCAA Division I institutions for all full-time,degree-seeking students, by race/ethnicity, freshman cohort, andinstitution control: 1995 and 1996.............................................................. A-28
A3-6 Persistence rates at NCAA Division II institutions for all full-time,degree-seeking students, by race/ethnicity and freshman cohort:1994 and 1995................................................................................................... A-29
A3-7 Persistence rates at NCAA Division II public institutions for all full-time, degree-seeking students, by race/ethnicity and freshmancohort: 1994 and 1995................................................................................... A-30
Table of ContentS
Page
xxiv
List of Appendix Tables (continued)
A3-8 Persistence rates at NCAA Division II private institutions for all full-time, degree-seeking students, by race/ethnicity and freshmancohort: 1994 and 1995................................................................................... A-31
A3-9 Persistence rates at NCAA Division III institutions for all full-time,degree-seeking students, by race/ethnicity and freshman cohort:1994 and 1995................................................................................................... A-32
A3-10 Persistence rates at NCAA Division III public institutions for all full-time, degree-seeking students, by race/ethnicity and freshmancohort: 1994 and 1995................................................................................... A-33
A3-11 Persistence rates at NCAA Division III private institutions for all full-time, degree-seeking students, by race/ethnicity and freshmancohort: 1994 and 1995................................................................................... A-34
Chapter 4
A4-1 Associate’s degrees conferred by institutions of higher education,by race/ethnicity and sex: Selected years, 1976-77 to 1993-94 ......... A-35
A4-2 Associate’s degrees awarded to American Indians and AlaskaNatives, by field of study: Selected years, 1984-85 to 1993-94 .......... A-36
A4-3 Associate’s degrees awarded to American Indians and AlaskaNatives, by field of study and sex: Selected years, 1984-85to 1993-94 ........................................................................................................... A-37
A4-4 Percent distribution of American Indian and Alaska Nativeassociate’s degree recipients and total associate’s degreerecipients, by sex and field of study: 1984-85 and 1993-94................ A-38
A4-5 Bachelor’s degrees conferred by institutions of higher education,by race/ethnicity and sex of student: Selected years, 1976-77 to1993-94 ................................................................................................................ A-39
A4-6 Bachelor’s degrees awarded to American Indians and AlaskaNatives, by field of study: Selected years, 1976-77 to 1993-94 .......... A-40
A4-7 Percent distribution of American Indian and Alaska Nativebachelor’s degree recipients and total bachelor’s degree recipients,by field of study: 1976-77 and 1993-94 .................................................... A-41
Table of ContentS
Page
xxv
List of Appendix Tables (continued)
A4-8 Bachelor’s degrees awarded to American Indians and AlaskaNatives, by sex and field of study: Selected years, 1976-77 to1993-94 ................................................................................................................ A-42
A4-9 Percent distribution of American Indian and Alaska Nativebachelor’s degree recipients and total bachelor’s degree recipients,by sex and field of study: 1976-77 and 1993-94 .................................... A-43
A4-10 Bachelor’s degrees conferred to American Indians and AlaskaNatives, by state: 1993-94.............................................................................. A-44
A4-11 Master’s degrees conferred by institutions of higher education,by race/ethnicity and sex of student: Selected years, 1976-77to 1993-94 ........................................................................................................... A-45
A4-12 Master’s degrees awarded to American Indians and Alaska Natives,by field of study: Selected years, 1976-77 to 1993-94........................... A-46
A4-13 Master’s degrees awarded to American Indians and Alaska Natives,by sex and field of study: Selected years, 1976-77 to 1993-94 .......... A-47
A4-14 Percent distribution of American Indian and Alaska Native master’sdegree recipients and total master’s degree recipients, by sex andfield of study: 1976-77 and 1993-94 .......................................................... A-48
A4-15 Master’s degrees conferred to American Indians and AlaskaNatives, by state: 1993-94.............................................................................. A-49
A4-16 Doctor’s degrees conferred by institutions of higher education,by race/ethnicity and sex of student: Selected years, 1976-77to 1993-94 ........................................................................................................... A-50
A4-17 Doctor’s degrees awarded to American Indians and Alaska Natives,by field of study: Selected years, 1976-77 to 1993-94........................... A-51
A4-18 Doctor’s degrees awarded to American Indians and Alaska Natives,by sex and field of study: Selected years, 1976-77 to 1993-94 .......... A-52
A4-19 Percent distribution of American Indian and Alaska Native doctor’sdegree recipients and total doctor’s degree recipients, by sex andfield of study: 1976-77 and 1993-94 .......................................................... A-53
A4-20 Doctor’s degrees conferred to American Indians and AlaskaNatives, by state: 1993-94.............................................................................. A-54
Table of ContentS
Page
xxvi
List of Appendix Tables (continued)
A4-21 First-professional degrees conferred by institutions of highereducation, by race/ethnicity and sex of student: Selected years,1976-77 to 1993-94.......................................................................................... A-55
A4-22 First-professional degrees awarded to American Indians andAlaska Natives, by field of study: Selected years, 1976-77 to 1993-94............................................................................................................................ A-56
A4-23 First-professional degrees awarded to American Indians andAlaska Natives, by sex and field of study: Selected years, 1976-77to 1993-94 ........................................................................................................... A-57
A4-24 Percent distribution of American Indian and Alaska Native first-professional degree recipients and total first-professional degreerecipients, by sex and field of study: 1976-77 and 1993-94................ A-58
A4-25 First-professional degrees conferred to American Indians andAlaska Natives, by state: 1993-94................................................................ A-59
A4-26 Percent distribution of highest level of educational attainment of1980 high school sophomores, by race/ethnicity: 1992....................... A-60
Chapter 5
A5-1 Percent distribution of undergraduates, by race/ethnicity andselected student characteristics: 1992-93................................................... A-61
A5-2 Average student-reported total cost of attendance forundergraduates, by race/ethnicity, attendance status, andinstitution control and level: 1992-93......................................................... A-62
A5-3 Percent of undergraduates receiving federal aid and averageamount of federal aid received, by race/ethnicity, type of federalaid, and attendance status: 1992-93........................................................... A-63
A5-4 Percent of undergraduates receiving federal aid and averageamount of federal aid received, by race/ethnicity and institutioncontrol and level: 1992-93............................................................................. A-64
A5-5 Percent of undergraduates receiving state aid and average amountof state aid received, by race/ethnicity and type of aid: 1992-93 ...... A-65
A5-6 Percent of undergraduates receiving state aid and average amountof state aid received, by race/ethnicity and institution control andlevel: 1992-93.................................................................................................... A-66
Table of ContentS
Page
xxvii
List of Appendix Tables (continued)
A5-7 Percent of undergraduates receiving institutional aid and averageamount of institutional aid received, by race/ethnicity and type ofaid: 1992-93....................................................................................................... A-67
A5-8 Percent of undergraduates receiving institutional aid and averageamount of institutional aid received, by race/ethnicity andinstitution control and level: 1992-93......................................................... A-68
A5-9 Percent distribution of aided undergraduates receiving variouscombinations of financial aid, by type of aid: 1992-93......................... A-69
A5-10 Percent of undergraduates receiving aid and average amount ofaid received, by race/ethnicity and type of aid: 1992-93...................... A-70
A5-11 Percent of undergraduates receiving financial aid forpostsecondary education and the average amount awarded to aidrecipients, by dependency status and race/ethnicity: 1992-93 ........... A-71
A5-12 Average net costs of postsecondary education less all financial aid,by race/ethnicity, dependency status, and income: 1992-93 .............. A-72
A5-13 Average net costs of postsecondary education amongundergraduates, by race/ethnicity, attendance status, andinstitution level and control: 1992-93......................................................... A-73
Chapter 6
A6-1 Number of employees in institutions of higher education,by race/ethnicity, institution control, and primary occupation:Fall 1993............................................................................................................... A-74
A6-2 Number of full-time employees in institutions of higher education,by race/ethnicity, institution control, and primary occupation:Fall 1993............................................................................................................... A-75
A6-3 Number of part-time employees in institutions of higher education,by race/ethnicity, institution control, and primary occupation:Fall 1993............................................................................................................... A-76
A6-4 Number of employees in 4-year institutions of higher education, byrace/ethnicity, institution control, and primary occupation:Fall 1993............................................................................................................... A-77
A6-5 Number of employees in 2-year institutions of higher education, byrace/ethnicity, institution control, and primary occupation:Fall 1993............................................................................................................... A-78
Table of ContentS
Page
xxviii
List of Appendix Tables (continued)
A6-6 Number, median salary, and percent distribution of full-timeemployees in 4-year institutions of higher education, byrace/ethnicity, sex, and primary occupation: Fall 1993 ......................... A-79
A6-7 Number, median salary, and percent distribution of full-timeemployees in 2-year and less-than-2-year institutions of highereducation, by race/ethnicity, sex, and primary occupation:Fall 1993............................................................................................................... A-80
A6-8 Number, median salary, and percent distribution of full-timeemployees in public institutions of higher education, by race/ethnicity and primary occupation: Fall 1993 ............................................ A-81
A6-9 Number, median salary, and percent distribution of full-timeemployees in private institutions of higher education, by primaryoccupation and race/ethnicity: Fall 1993................................................... A-82
A6-10 Number and percent distributions of full-time faculty in institutionsof higher education, by rank, tenure, sex, and race/ethnicity:Fall 1993............................................................................................................... A-83
A6-11 Number and percent distribution of full-time faculty in 4-yearinstitutions of higher education, by sex, race/ethnicity, rank, andtenure status: Fall 1993................................................................................... A-84
A6-12 Number and percent distribution of full-time faculty in 2-year andless-than-2-year institutions of higher education, by sex, race/ethnicity, rank, and tenure status: Fall 1993 ............................................. A-85
A6-13 Number and percent distribution of newly hired full-timeemployees in institutions of higher education, by sex,race/ethnicity, and primary occupation: Fall 1993.................................. A-86
List of SELECTED STANDARD ERROR Tables
B-1 Standard errors for table 2-3--Percent of college-bound high schoolgraduates classified as meeting each of the five specified criteriaidentified as being important to college admissions officers,by race/ethnicity: 1992 ................................................................................... B-3
B-2 Standard errors of appendix table A5-10--Percent ofundergraduates receiving aid by type of aid and race/ethnicity .......... B-4
Introduction toAmerican Indians andAlaska Natives inPostsecondary Education

Introduction
xxix
INTRODUCTION
his sourcebook is a comprehensive compilation of data discussing American
Indian and Alaska Native participation in postsecondary education. It provides
a portrait of Americans Indians and Alaska Natives involved in all facets of
postsecondary education—as undergraduate students, graduate students, and
faculty—as well as student outcomes following graduation. It has been
produced by the National Center for Education Statistics (NCES) in response to a
growing need for such information. Data have been collected from a multitude
of sources, including NCES and the U.S. Department of Commerce, Bureau of the
Census. The majority of these data have been previously published and were
taken directly from assorted publications.
Throughout the sourcebook, comparisons are made between Native Americans
and the total population. Comparisons were not made between Native
Americans and other minority populations. Data for other racial/ethnic groups,
however, does appear in several of the summary tables and appendix tables.
This introduction examines the terminology used throughout the sourcebook,
limitations of the data, and the sourcebook’s structure.
TERMINOLOGY
The terms “American Indian and Alaska Native” and “Native
American” are used interchangeably throughout the sourcebook.
Both include any person having origins in any of the original
peoples of North America and maintaining cultural identification
through tribal affiliation or community recognition.1 These terms are
used by the authors to report data from surveys where a similar
definition of race/ethnicity was used. Racial/ethnic definitions may
vary slightly from survey to survey.
1U.S. Department of Education, National Center for Education Statistics, Digest of Education Statistics: 1995, p. 499, 1995.
T
xxx
The postsecondary institutions discussed in this report are primarily 4-year and
2-year colleges and universities, including tribal colleges. Postsecondary
vocational education institutions have not been included. “Tribal colleges” are
the 30 postsecondary institutions recognized as U.S. tribally controlled colleges
by the American Indian Higher Education Consortium (AIHEC) and classified as
tribal colleges under the Carnegie Institution classification system. A complete
listing of these institutions appears in table 7-1. When these institutions are
listed in other tables, they appear in italics so that they can easily be identified
as tribal colleges.
It should be noted, however, that four tribal colleges recently changed their
names: Haskell Indian Junior College is now Haskell Indian Nations University,
Little Hoop Community College is now Cankdeska Cikana Community College,
Navajo Community College is now Diné Community College, and Standing
Rock College changed its name to Sitting Bull College. These name changes are
footnoted in tables and figures where they appear as the name changes
occurred after the data were collected. In addition, a new tribal college, Little
Priest Tribal College in Nebraska, was chartered in 1996. No data for this
institution appears in any figures or tables.
LIMITATIONS OF THE DATA
There are several difficulties in working with data concerning American Indians
and Alaska Natives, including limited data availability, high standard errors,
weighting problems, and reliability issues. These problems extend beyond
postsecondary data because they are often the result of small sample sizes and,
less frequently, racial/ethnic identification inconsistencies. This section
summarizes the limitations of the data, which affect every chapter in this
sourcebook, and provides examples to demonstrate how these problems affect
the discussion of specific topics.
Introduction
xxxi
SMALL SAMPLE SIZES
One of the most severe problems faced by researchers studying
American Indians and Alaska Natives is small sample sizes.
While it is possible for a sample of 1,000 individuals to
represent an entire country with fairly high accuracy, Native
Americans constitute only about 0.8 percent of the U.S.
population, so a national random sample of 1,000 would be
expected to yield about 8 Native Americans. Even in larger surveys, typically
fewer than 100 Native Americans are sampled, and these small study
populations result in survey estimates that are not very reliable. Two possible
ways to overcome this problem are to select extremely large samples or to
select Native Americans with a higher probability than other groups
(oversampling), but these strategies tend to be costly and are often difficult to
administer. The result is that data on Native Americans are both limited in
availability and subject to high standard errors.
Limited data availability. To avoid the misinterpretation of data from sample
surveys, researchers often report only those estimates that are based on a
minimum cell size (e.g., three or more cases).2 Reporting data associated with a
cell too small to meet the minimum cell size requirements can lead to a
violation of confidentiality by providing enough unique data so that an
individual participant can be identified. Furthermore, if the size of the sample
associated with the denominator of a rate or percent is too small (e.g., less than
30 cases), then there are too few data to provide a reliable statistical effort.
Difficulties associated with small sample sizes of American Indians and Alaska
Natives are a recurring problem in national studies. For example, sometimes no
data or only a small number of cases are available, which may necessitate
combining categories to report the data to avoid violating confidentiality
requirements. These difficulties are particularly acute when data are broken
down into specific categories, such as faculty by academic discipline.
2According to NCES statistical standard IV-01-92, for reports “each publication cell must have at least three (unweighted) observations.” Anysubsequent calculations (e.g., crosstabulations) must not provide any additional identifying information. U.S. Department of Education, NCES,NCES Statistical Standards, p. 41, 1992.
xxxii
Prior to the 1980s, American Indians and Alaska Natives were often included in
an “other” category or combined with other racial/ethnic groups. This practice
was replaced by the identification of Native Americans as a separate
racial/ethnic group, but often an asterisk or a dash appear indicating that
reliable estimates are not available.
For the most recent reports produced by NCES and the U.S. Bureau of the
Census, the agencies have made extensive efforts to provide usable,
quantitative data for this population. Despite these efforts, however, the Bureau
of the Census’ Current Population Survey has been unable to provide annual
data on American Indians and Alaska Natives due to small sample sizes. Data
are available only from the decennial censuses.
High standard errors. A second problem associated with small sample sizes is
high standard errors. The standard error is a measure of the variability of
survey estimates because of sampling. For example, if all possible samples
were surveyed using the same design and sample size, intervals of 1.96
standard errors below to 1.96 standard errors above a particular statistic would
include the true population parameter being estimated in about 95 percent of
the samples. When the sample size is small, the interval around an estimate is
large, and there is less likelihood that the estimate is close to the true parameter
value. When two estimates are compared (e.g., to see whether there has been
change over time), standard errors are used to measure whether the difference
in the two estimates is likely to have been caused by random variations in the
sample rather than by a real difference in the true values. Thus, seemingly
large differences between two pieces of data may not be statistically significant
because of high standard errors. American Indians and Alaska Natives
generally have the highest standard errors on survey data of any racial/ethnic
group. These standard error measures must be examined before differences
can be pronounced significant.
It should be noted that standard errors exist only for surveys based on samples,
such as the National Study of Postsecondary Faculty. Surveys based on
censuses do not have standard errors because the total population of interest
was included in the survey. For example, all data collected through the
Introduction
xxxiii
Integrated Postsecondary Education Data System (IPEDS) include the complete
universe of respondents; therefore, there are no standard errors to report.
When available, standard errors for survey data are presented in appendix B.
As the authors relied heavily on IPEDS data and previously published data,
standard errors are available only for sample-based surveys with published
standard error tables.
Oversampling. One possible, yet costly, solution to the problems associated
with small sample sizes is oversampling. Oversampling refers to the process by
which a particular group (e.g., American Indians and Alaska Natives) are
sampled at a higher rate than the rest of the population in order to obtain a
specified sample size for that particular group. This process may enable
researchers to include enough members of that specific group in the sample to
permit reliable data analysis and data reporting.
There are, however, difficulties associated with oversampling. First, it may be
difficult to oversample because the population is too small to support such an
approach. Second, the cost of oversampling is often prohibitive. Lastly, a focus
on institutions with large numbers of one specific population (i.e., Native
Americans) may produce results that are inconsistent with the result for that
population overall.
RACIAL/ETHNIC DATA
In the collection of data, allowing respondents to self-identify
their race/ethnicity can generate inaccurate results for multiple
reasons. The most prevalent cause is the instability of
racial/ethnic identification—a respondent can answer the
question one way the first time he or she is asked and a different way the
second time. This may be due, in part, to the way the question is asked and the
racial/ethnic categories presented to the respondent.3 Difficulties also arise
3There is no universal set of racial/ethnic categories used for survey purposes. For federal surveys, however, racial/ethnic categories arespecified by the U.S. Office of Management and Budget (OMB) in Directive 15 (1977).
xxxiv
for individuals who consider themselves of mixed descent (e.g., Asian/Pacific
Islander and white). In addition, some individuals may deliberately select a
certain racial/ethnic identification to gain preferential treatment, including
admission to a postsecondary institution or employment as an faculty member.
Several problems associated with racial/ethnic identification are discussed
below.
Instability of racial/ethnic data. Research into the collection of data on
race/ethnicity has indicated that American Indians and Alaska Natives make up
the least stable racial/ethnic group in terms of self-identification.4 For example,
a recent National Science Foundation survey of science and engineering
graduates—the 1995 National Survey of Recent College Graduates (NSRCG:95)—
examined racial/ethnic agreement between institutional records of students and
their self-reports on the survey. The agreement rate found for American Indians
and Alaska Natives was only about 60 percent, whereas the agreement rates
for the other racial/ethnic groups ranged from 89 percent to 97 percent.
Similarly, a recent study conducted by the Bureau of Labor Statistics to examine
alternative methods of asking race/ethnicity in reinterviews reached the
following conclusion:5
The measurement of American Indian, Eskimo, or Aleut may not
be straightforward, and information...supports the notion that
identification as an American Indian or Alaskan Native may
have a reliability problem and be sensitive to methods effects...
In contrast to the other racial categories, the agreement rate
between the CPS and the supplement for the American Indian,
Eskimo, or Aleut category never reaches more than 75 percent
in the panel. It is only 60 percent when the multiracial category
is included. These results provide another indication of the
reliability problem that may be associated with the American
Indian, Eskimo, or Aleut category. Furthermore, an analysis of
results by ancestry...indicates that respondents with both white
4U.S. Department of Labor, Bureau of Labor Statistics, A Test of Methods for Collecting Racial and Ethnic Information, 1995.
5U.S. Department of Labor, Bureau of Labor Statistics, A Test of Methods for Collecting Racial and Ethnic Information, 1995.
Introduction
xxxv
and American Indian ancestry may not consistently identify with
one or the other. Similar findings have been reported by others.
These findings lead to the conclusion that caution is needed in interpreting data
changes since they may be due in part to differences in self-identification
patterns. The instability in self-identification also may cause problems for
weighting in sample surveys in which samples and weights are based on
information that may change between the sample frame identification and the
self-report on the survey.
OTHER DATA CONCERNS
In addition to the problems associated with small survey sample
sizes and the reliability of racial/ethnic identification, other data
concerns exist. The Integrated Postsecondary Education Data
System (IPEDS) collects comprehensive data from all postsecondary
institutions. It is broken down into several component surveys including
enrollment, completions, and staff. Every person enrolled in a postsecondary
institution, receiving a degree, or working at a postsecondary institution is
included in the data collections. Using counts rather than estimates eliminates
the problems associated with small sample sizes and high standard errors, but
the relatively small size of the Native American population still creates data
analysis difficulties.
Although IPEDS data are based on counts, caution must be exercised when
doing time trend analysis or comparing related data. If the base value for one
statistic is relatively small, small increases may result in relatively large
percentage changes. Therefore, researchers should consider both percentage
changes and changes in the actual numbers in their analyses. They may also
want to consider examining changes over a 5-, 10-, or 20-year period. For
example, in percentage terms the enrollment by degree level of American
Indian and Alaska Natives grew more at the graduate and first-professional
xxxvi
degree levels than the undergraduate degree level from 1976 to 1994.6
However, a more careful examination of the data showed that while the
percentage of first-professional students, for example, increased by 100 percent,
the actual number of students only grew by 1,000. At the same time,
undergraduate enrollment only increased by 69 percent, but the number of
undergraduates grew by 48,000 students.
A second problem is the reporting difficulties experienced by some institutions.
Some postsecondary institutions do not complete IPEDS surveys, thus
necessitating data imputations. These imputations provide marginal accuracy
for overall groups (e.g., 4-year institutions) but not necessarily for individual
institutions. For example, data for some tribal colleges have been imputed.
The imputation was based on data from regional community colleges. While
these institutions share several characteristics with tribal colleges, they generally
have a different racial/ethnic student and staff composition. Thus, the data for
some tribal colleges may be less reliable than desired.
A third problem is that institutions rely on student-reported racial/ethnic
distributions. As previously mentioned, the propensity to identify with one or
another racial/ethnic group may change over time, thus making trend analyses
difficult.
QUANTITATIVE VERSUS
QUALITATIVE DATA
The quantitative data presented in this sourcebook provide a
numerical description of the status of Native Americans in higher
education. However, they cannot describe the environment
6U.S. Department of Education, National Center for Education Statistics, Higher Education General Information Survey (HEGIS), “Fall Enrollmentin Colleges and Universities” survey; and Integrated Postsecondary Education Data Systems (IPEDS), “Fall Enrollment” survey. As published inNCES, Digest of Education Statistics: 1991, table 195, p. 200, 1991; Digest of Education Statistics: 1992, table 194, pp. 204-205, 1992;and Digest of Education Statistics: 1996, table 203, pp. 208-209, 1996.
Introduction
xxxvii
experienced by American Indians and Alaska Natives in one institution or
another. Qualitative analysis, however, may be able to help explain these
differences. For example, case studies, focus groups, and site visits may help
explain why one particular institution has higher retention rates for American
Indians and Alaska Natives than other institutions. In future research,
qualitative studies should be considered to complement and enhance the
quantitative data.
STRUCTURE OF THE SOURCEBOOK
The sourcebook is divided into chapters based on various issues associated
with postsecondary education. An effort was made to limit the coverage of
each chapter to one specific topic, but overlap between
chapters does occur. The following is a brief summary
of the chapters:
# Chapter 1 examines American Indian and Alaska Native demographics toprovide a context to discuss the issue of higher education. It also contains ahistorical overview of Native American postsecondary education in theUnited States.
# Chapter 2 discusses Native American students’ access to postsecondaryinstitutions. It examines high school performance, standardized test scores,and other factors affecting students’ opportunities to pursue a post-secondary degree.
# Chapter 3 considers Native American enrollment in postsecondaryeducation from 1976 to 1994. It includes discussions of enrollment byinstitution level and control and student’s sex, attendance status, degreelevel, major field of study, institution, and state. This chapter also discussesAmerican Indian and Alaska Native student persistence and graduationrates at postsecondary institutions.
# Chapter 4 analyzes degree completions for Native American students at alldegree levels. It considers the number and percentage of degrees beingawarded at each level, trends in degree attainment, and the major fields ofstudy in which degrees are attained. This chapter also examines thecharacteristics of degree recipients and discusses the institutions of highereducation and tribal colleges awarding the largest number of degrees toNative American students.
xxxviii
# Chapter 5 examines the receipt and use of financial aid among AmericanIndian and Alaska Native students. The discussion is primarily focused onthe undergraduate and doctorate degree levels. The use of personalfunding sources, federal grants and loans, state programs, and institutionalfinancial aid is considered.
# Chapter 6 summarizes national statistics on American Indian and AlaskaNative postsecondary education faculty and presents information onnonfaculty employment of Native Americans in postsecondary institutions.Data reflecting full- and part-time staff; faculty salaries; distribution of staffby institution control, institution level, and program area; tenure status; andnew hires are discussed.
# Chapter 7 provides a historical overview of tribal colleges. It discusses theirorigins, their accomplishments, the difficulties they face, and their futuregoals.
# Appendices A to E. Appendix A provides supplemental data tables thatcorrespond to chapters 1 through 6. Appendix B includes selected standarderror tables. Appendix C provides a glossary of terms and a list of acronymsthat appear throughout the sourcebook. Appendix D provides a list ofdocuments that were cited in the sourcebook. Appendix E lists additionalsources of information about American Indian and Alaska Nativeparticipation in postsecondary education.
[1American Indian andAlaska NativeDemographics and HistoricalOverview of Education
“The most fundamental need in Indian education is achange in the point of view.”
The Meriam Report, 1928

Demographics and Historical Overview
1-1
he American Indian and Alaska Native1 population has experienced
tremendous growth during the 20th century. It is concentrated in the Western
United States and is younger than the overall population. American Indians
and Alaska Natives tend to have lower family incomes and higher poverty rates
than the nationwide averages, and their levels of educational attainment
continue to lag behind those of the general population.
This chapter discusses the basic demographic characteristics of American
Indians and Alaska Natives, including their educational attainment and labor
force outcomes. It also provides a brief examination of the history of Native
American education from early education activities through new education
measures introduced in the 1990s. The summary tables referred to in the text
appear at the end of the chapter.
HIGHLIGHTS FROM THE
1990 DECENNIAL CENSUS
# The American Indian population experienced tremendous growth in the20th century, increasing from 237,000 people in 1900 to 1.9 million peoplein 1990 (figure 1-1), including some growth attributable to increased self-identification. Despite this growth, American Indians composed only 0.8percent of the total population in 1990 (summary table S1-1).
# In 1990, Native Americans were younger than the overall population, with36 percent of Native Americans compared with 26 percent of the totalpopulation being under the age of 18 (figure 1-2).
# Nearly half of all American Indians and Alaska Natives lived in the WesternUnited States in 1990 as did 21 percent of the total population. The largestproportion of the total population (34 percent) lived in the South as did 29percent of the American Indian and Alaska Native population (figure 1-3).
# In 1990, four states had over 100,000 Native American residents, and anadditional seven states had over 50,000 Native American residents (figure1-4).
1The terms “Native American” and “American Indian and Alaska Native” are used interchangeably throughout this chapter.
T
[
1-2
# Slightly more than half of the Native American population (56 percent) and75 percent of the total population lived in urban areas in 1990 (figure 1-5).
# The majority of American Indian and Alaska Native families, like all U.S.families, were married-couple families. Among American Indians andAlaska Natives, however, 27 percent of all families were headed by a femalehouseholder with no husband present compared with 17 percent of familiesnationwide (figure 1-6).
# American Indians and Alaska Natives participated in the labor force at ratessimilar to the overall population, 62 percent and 65 percent, respectively.Among both groups, men had higher participation rates than women (figure1-7).
# The most popular occupations for American Indians and Alaska Natives andfor all workers were technical, sales, and administrative support positions(figure 1-8).
# In 1990, the median family income for all Native American families was$21,750. Nationwide, it was $35,225 (figure 1-9).
# In American Indian and Alaska Native households headed by females withno husband present, 50 percent were living below the poverty level.Among all families headed by females with no husband present, 31 percentwere in poverty (figure 1-10).
# In 1990, among those 25 years and older, 66 percent of Native Americanshad completed high school, 9 percent had attained a bachelor’s degree orhigher, and 3 percent held graduate or professional degrees. Among thetotal population 25 years and older, 75 percent had completed high school,20 percent had attained a bachelor’s degree or higher, and 7 percent heldgraduate or professional degrees (figure 1-11 and p. 1-13).
# Educational attainment varied among individual Indian tribes. The percent-age of Indian tribe members 25 years and over who had completed a highschool degree or higher ranged from 94 percent for the Coos tribe to 29percent for the Miccosukee tribe (summary table S1-5).
SOURCES OF DATA
Data collected by the U.S. Department
of Commerce, Bureau of the Census
were the basis for all the demographic statistics presented in this chapter. The
overview of Native American history from the 1500s through the 1990s relied
Demographics and Historical Overview
1-3
primarily on the work of several individual researchers interested in the
education of American Indians and Alaska Natives as well as information
provided by the American Indian and Alaska Native authors of this sourcebook.
Demographic data. All demographic data were taken from decennial censuses
conducted by the U.S. Bureau of the Census. Only the decennial census is large
enough to collect reliable data for American Indians and Alaska Natives as it
includes total population counts. In contrast, the sample sizes used in the
annual Current Population Surveys are too small to produce reliable estimates
for the Native American population. Thus, the most recent demographic data
available for Native Americans are from 1990. Several decennial censuses prior
to 1990 were also used, most notably the one conducted in 1980. Often the
data were taken directly from the Census of Population series of publications.
The Bureau of the Census also released a report in 1993, We the...First Americans,
that provided summary demographic data for Native Americans and offered
comparisons to the total U.S. population. Information from that report is used
frequently throughout this chapter.
Historical overview of education. This section was based on a number of
historical sources. Primary among them are Norman Oppelt’s The Tribally
Controlled Indian Colleges: The Beginnings of Self Determination in American Indian
Education2 and American Indian and Alaska Native Higher Education: Toward a New
Century of Academic Achievement and Cultural Integrity written by Bobby Wright.3
Oppelt provides a detailed discussion of four centuries of tribal education
culminating in the founding of the tribal colleges and the federal policies of the
1980s. Wright also provides data concerning the history of Native American
education, but his data are generally less detailed than those presented by
Oppelt. The historical overview also relies on pieces of information found in a
report written by Judith Fries entitled The American Indian in Higher Education:
1975-76 to 1984-85,4 various reports issued by the National Center for Education
Statistics, articles published by the Chronicle of Higher Education, and tribal
college catalogs.
2Norman T. Oppelt, The Tribally Controlled Indian Colleges: The Beginnings of Self Determination in American Education, Tsaile, AZ: NavajoCommunity College Press, 1990.
3Bobby Wright, American Indian and Alaska Native Higher Education: Toward a New Century of Academic Achievement and Cultural Integrity,Washington, DC: U.S. Department of Education, Indian Nations At Risk Task Force, 1991.
4Judith E. Fries, The American Indian in Higher Education: 1975-76 to 1984-85, Washington, DC: U.S. Department of Education, NationalCenter for Education Statistics, 1987.
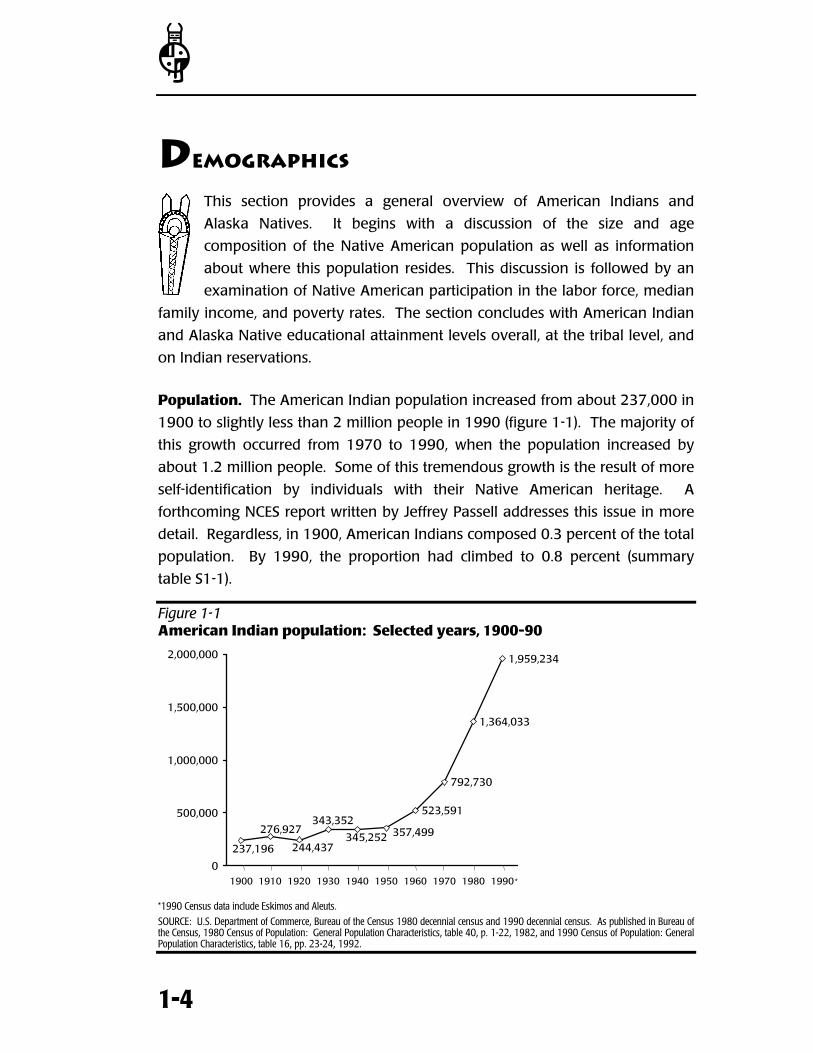
[
1-4
DEMOGRAPHICS
This section provides a general overview of American Indians and
Alaska Natives. It begins with a discussion of the size and age
composition of the Native American population as well as information
about where this population resides. This discussion is followed by an
examination of Native American participation in the labor force, median
family income, and poverty rates. The section concludes with American Indian
and Alaska Native educational attainment levels overall, at the tribal level, and
on Indian reservations.
Population. The American Indian population increased from about 237,000 in
1900 to slightly less than 2 million people in 1990 (figure 1-1). The majority of
this growth occurred from 1970 to 1990, when the population increased by
about 1.2 million people. Some of this tremendous growth is the result of more
self-identification by individuals with their Native American heritage. A
forthcoming NCES report written by Jeffrey Passell addresses this issue in more
detail. Regardless, in 1900, American Indians composed 0.3 percent of the total
population. By 1990, the proportion had climbed to 0.8 percent (summary
table S1-1).
Figure 1-1American Indian population: Selected years, 1900-90
523,591
792,730
1,364,033
1,959,234
237,196
276,927
244,437
343,352
345,252 357,499
0
500,000
1,000,000
1,500,000
2,000,000
1900 1910 1920 1930 1940 1950 1960 1970 1980 1990
*
*1990 Census data include Eskimos and Aleuts.
SOURCE: U.S. Department of Commerce, Bureau of the Census 1980 decennial census and 1990 decennial census. As published in Bureau ofthe Census, 1980 Census of Population: General Population Characteristics, table 40, p. 1-22, 1982, and 1990 Census of Population: GeneralPopulation Characteristics, table 16, pp. 23-24, 1992.
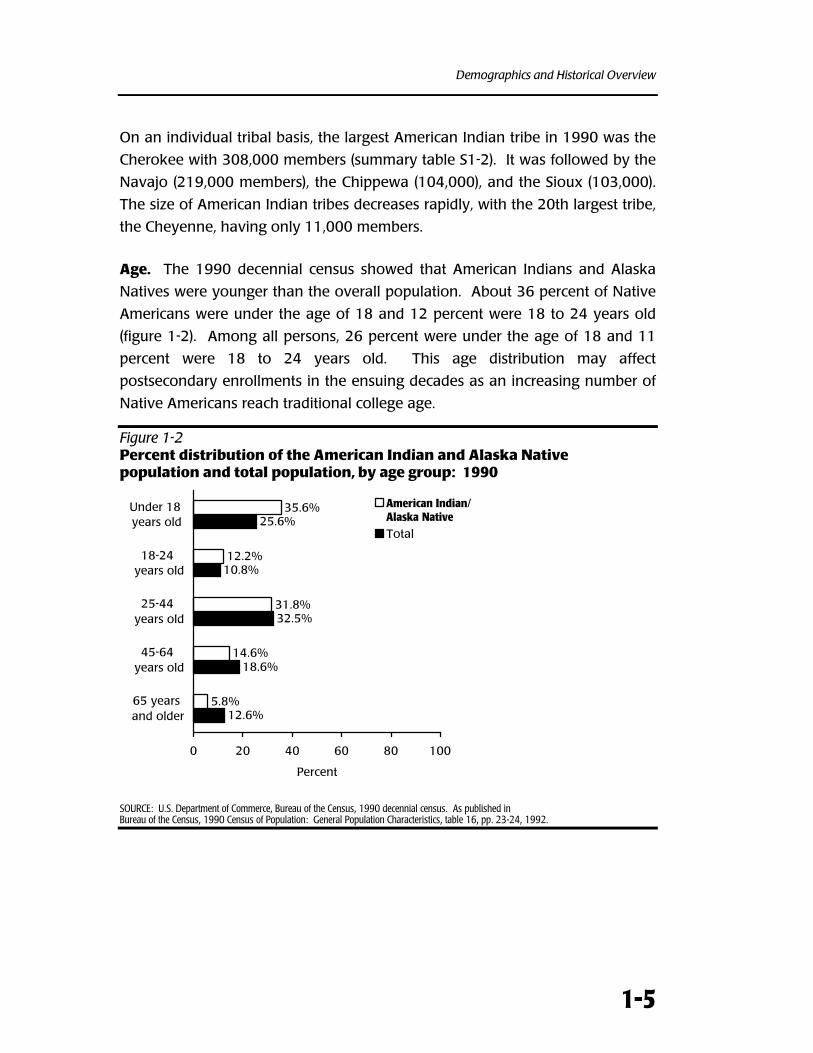
Demographics and Historical Overview
1-5
On an individual tribal basis, the largest American Indian tribe in 1990 was the
Cherokee with 308,000 members (summary table S1-2). It was followed by the
Navajo (219,000 members), the Chippewa (104,000), and the Sioux (103,000).
The size of American Indian tribes decreases rapidly, with the 20th largest tribe,
the Cheyenne, having only 11,000 members.
Age. The 1990 decennial census showed that American Indians and Alaska
Natives were younger than the overall population. About 36 percent of Native
Americans were under the age of 18 and 12 percent were 18 to 24 years old
(figure 1-2). Among all persons, 26 percent were under the age of 18 and 11
percent were 18 to 24 years old. This age distribution may affect
postsecondary enrollments in the ensuing decades as an increasing number of
Native Americans reach traditional college age.
Figure 1-2Percent distribution of the American Indian and Alaska Nativepopulation and total population, by age group: 1990
25.6%
10.8%
32.5%
18.6%
12.6%
35.6%
12.2%
31.8%
14.6%
5.8%
0 20 40 60 80 100
65 years and older
45-64 years old
25-44 years old
18-24 years old
Under 18 years old
Percent
American Indian/Alaska NativeTotal
SOURCE: U.S. Department of Commerce, Bureau of the Census, 1990 decennial census. As published inBureau of the Census, 1990 Census of Population: General Population Characteristics, table 16, pp. 23-24, 1992.
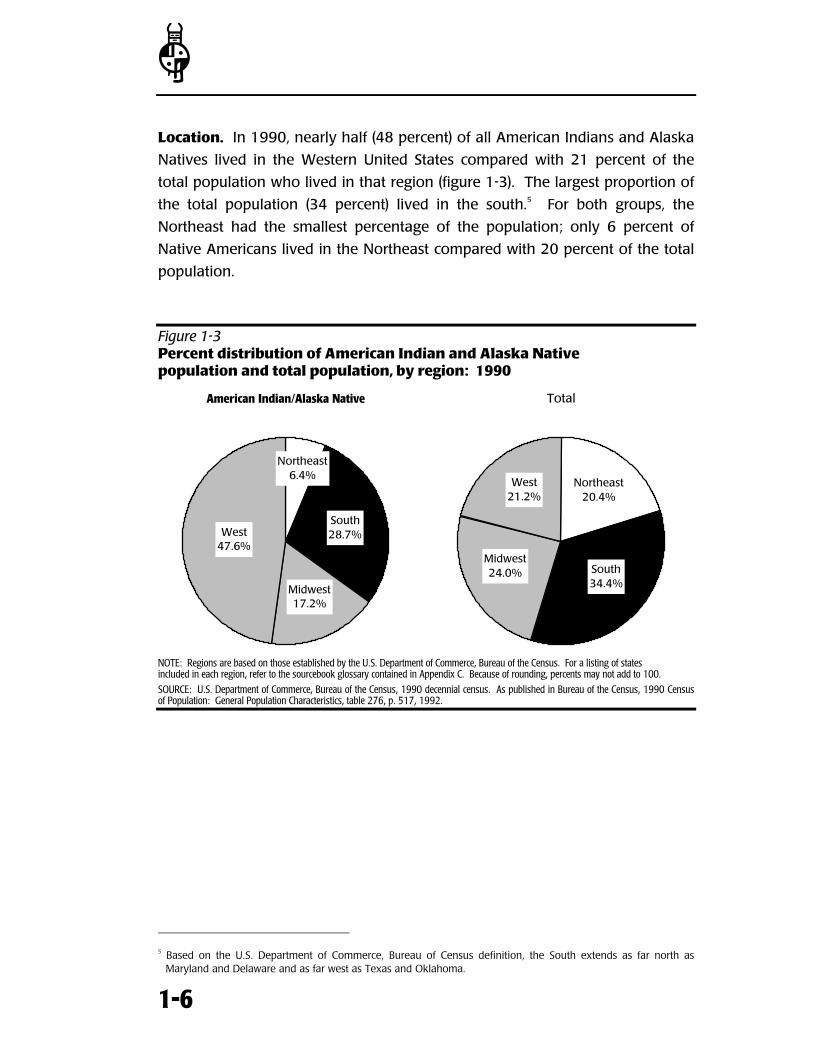
[
1-6
Location. In 1990, nearly half (48 percent) of all American Indians and Alaska
Natives lived in the Western United States compared with 21 percent of the
total population who lived in that region (figure 1-3). The largest proportion of
the total population (34 percent) lived in the south.5 For both groups, the
Northeast had the smallest percentage of the population; only 6 percent of
Native Americans lived in the Northeast compared with 20 percent of the total
population.
Figure 1-3Percent distribution of American Indian and Alaska Nativepopulation and total population, by region: 1990
American Indian/Alaska Native
Midwest 17.2%
South28.7%
Northeast6.4%
West47.6%
Total
Midwest 24.0% South
34.4%
Northeast20.4%
West21.2%
NOTE: Regions are based on those established by the U.S. Department of Commerce, Bureau of the Census. For a listing of statesincluded in each region, refer to the sourcebook glossary contained in Appendix C. Because of rounding, percents may not add to 100.
SOURCE: U.S. Department of Commerce, Bureau of the Census, 1990 decennial census. As published in Bureau of the Census, 1990 Censusof Population: General Population Characteristics, table 276, p. 517, 1992.
5 Based on the U.S. Department of Commerce, Bureau of Census definition, the South extends as far north as
Maryland and Delaware and as far west as Texas and Oklahoma.
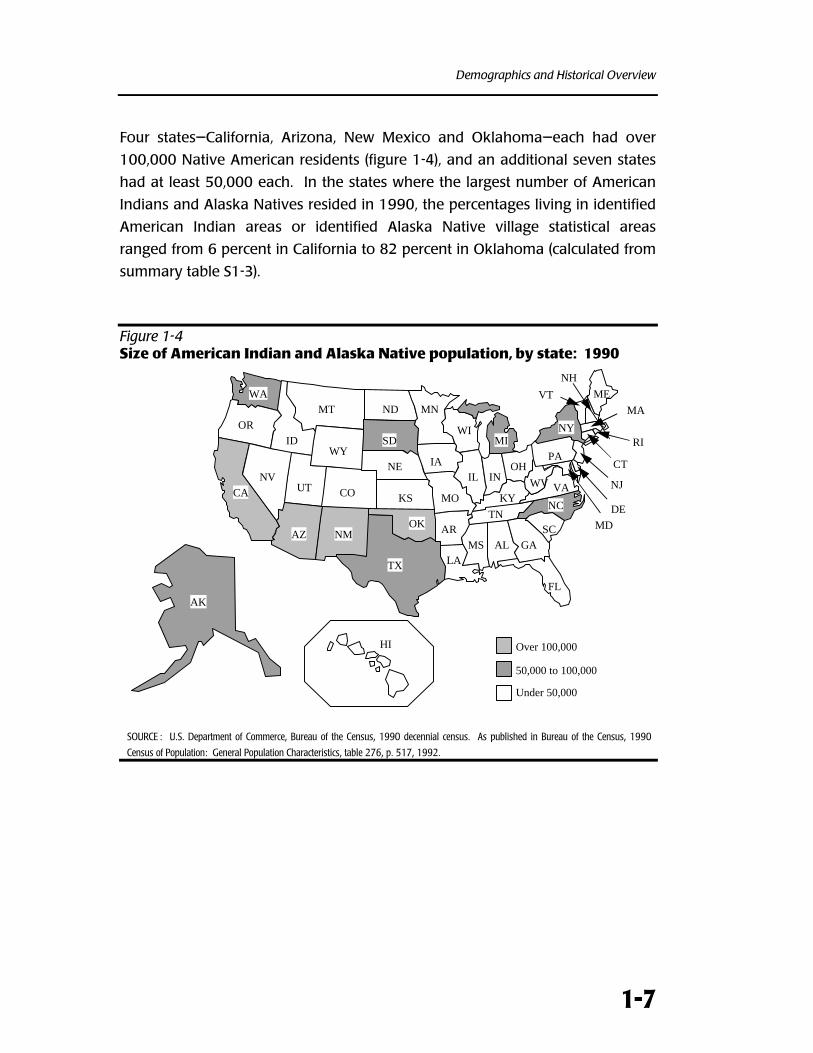
Demographics and Historical Overview
1-7
Four states—California, Arizona, New Mexico and Oklahoma—each had over
100,000 Native American residents (figure 1-4), and an additional seven states
had at least 50,000 each. In the states where the largest number of American
Indians and Alaska Natives resided in 1990, the percentages living in identified
American Indian areas or identified Alaska Native village statistical areas
ranged from 6 percent in California to 82 percent in Oklahoma (calculated from
summary table S1-3).
Figure 1-4Size of American Indian and Alaska Native population, by state: 1990
WA
OR
CA
NV
ID
AZ NM
UT CO
MT
WY
ND
SD
NE
KS
OK
TX
WIMI
IL INOH
PA
NY
KY
FL
GALA
MS AL
AR
IA
MO
TNSC
NC
VA
AK
HI
VT
NH
MA
RI
CT
NJ
DE
MD
ME
WV
MN
Over 100,000
50,000 to 100,000
Under 50,000
SOURCE : U.S. Department of Commerce, Bureau of the Census, 1990 decennial census. As published in Bureau of the Census, 1990
Census of Population: General Population Characteristics, table 276, p. 517, 1992.
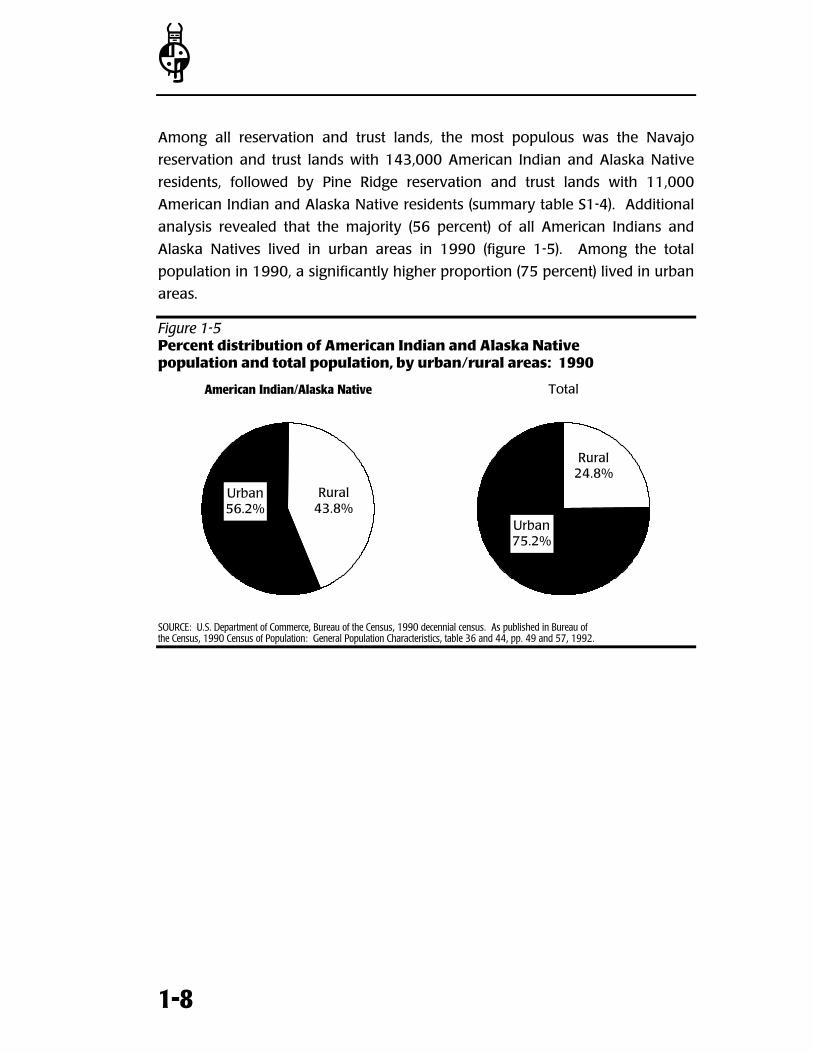
[
1-8
Among all reservation and trust lands, the most populous was the Navajo
reservation and trust lands with 143,000 American Indian and Alaska Native
residents, followed by Pine Ridge reservation and trust lands with 11,000
American Indian and Alaska Native residents (summary table S1-4). Additional
analysis revealed that the majority (56 percent) of all American Indians and
Alaska Natives lived in urban areas in 1990 (figure 1-5). Among the total
population in 1990, a significantly higher proportion (75 percent) lived in urban
areas.
Figure 1-5Percent distribution of American Indian and Alaska Nativepopulation and total population, by urban/rural areas: 1990
American Indian/Alaska Native
Urban56.2%
Rural43.8%
Total
Urban75.2%
Rural24.8%
SOURCE: U.S. Department of Commerce, Bureau of the Census, 1990 decennial census. As published in Bureau ofthe Census, 1990 Census of Population: General Population Characteristics, table 36 and 44, pp. 49 and 57, 1992.
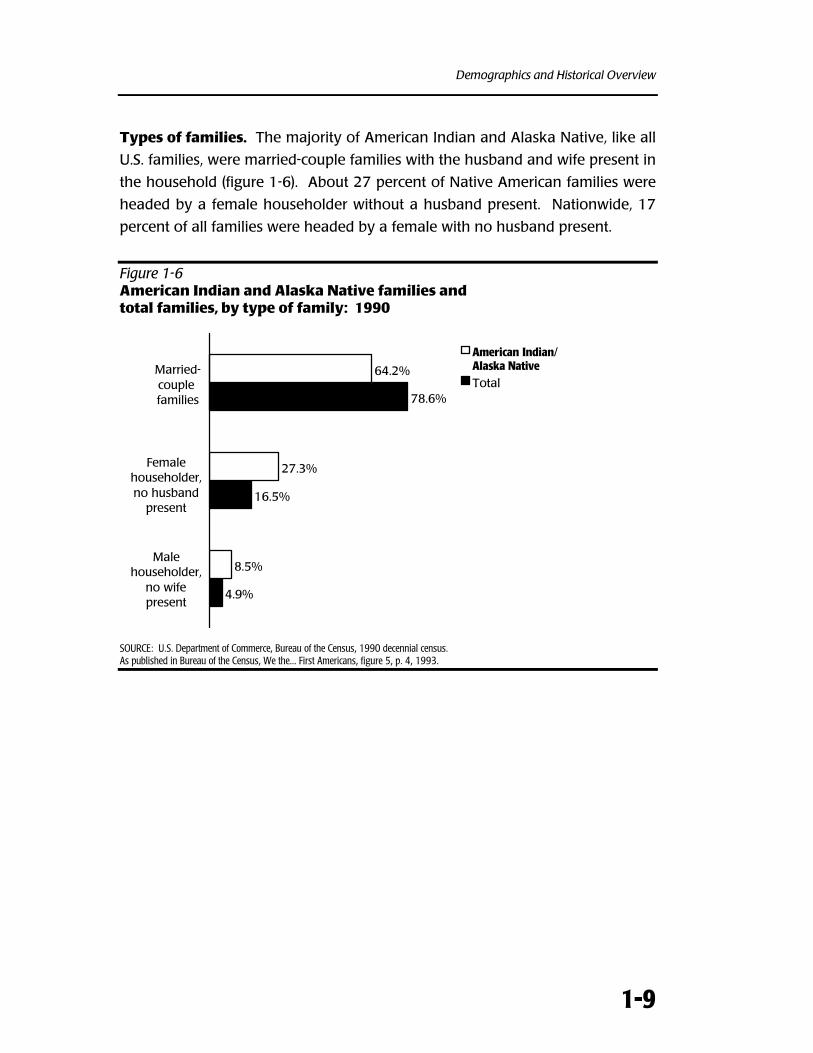
Demographics and Historical Overview
1-9
Types of families. The majority of American Indian and Alaska Native, like all
U.S. families, were married-couple families with the husband and wife present in
the household (figure 1-6). About 27 percent of Native American families were
headed by a female householder without a husband present. Nationwide, 17
percent of all families were headed by a female with no husband present.
Figure 1-6American Indian and Alaska Native families andtotal families, by type of family: 1990
4.9%
16.5%
78.6%
8.5%
27.3%
64.2%
Malehouseholder,
no wifepresent
Femalehouseholder,no husband
present
Married-couplefamilies
American Indian/Alaska NativeTotal
Femalehouseholder,no husband
present
Malehouseholder,
no wifepresent
SOURCE: U.S. Department of Commerce, Bureau of the Census, 1990 decennial census.As published in Bureau of the Census, We the... First Americans, figure 5, p. 4, 1993.
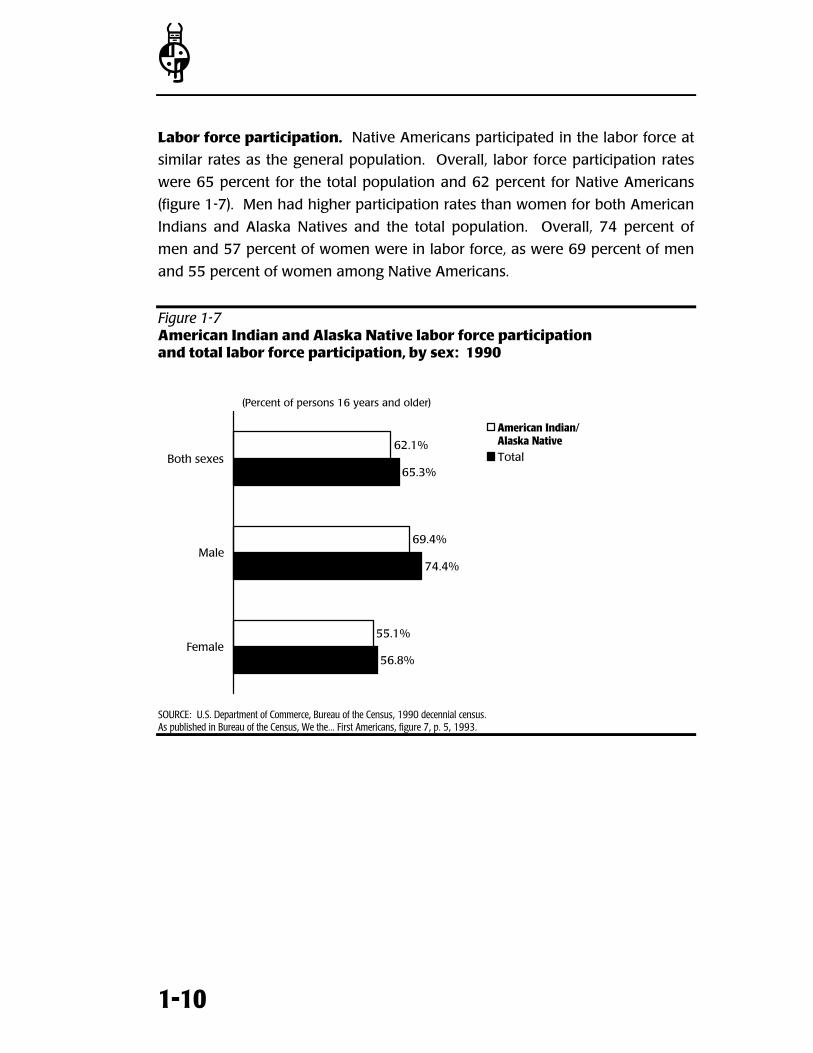
[
1-10
Labor force participation. Native Americans participated in the labor force at
similar rates as the general population. Overall, labor force participation rates
were 65 percent for the total population and 62 percent for Native Americans
(figure 1-7). Men had higher participation rates than women for both American
Indians and Alaska Natives and the total population. Overall, 74 percent of
men and 57 percent of women were in labor force, as were 69 percent of men
and 55 percent of women among Native Americans.
Figure 1-7American Indian and Alaska Native labor force participationand total labor force participation, by sex: 1990
56.8%
74.4%
65.3%
55.1%
69.4%
62.1%
Female
Male
Both sexes
American Indian/Alaska NativeTotal
SOURCE: U.S. Department of Commerce, Bureau of the Census, 1990 decennial census.As published in Bureau of the Census, We the... First Americans, figure 7, p. 5, 1993.
(Percent of persons 16 years and older)
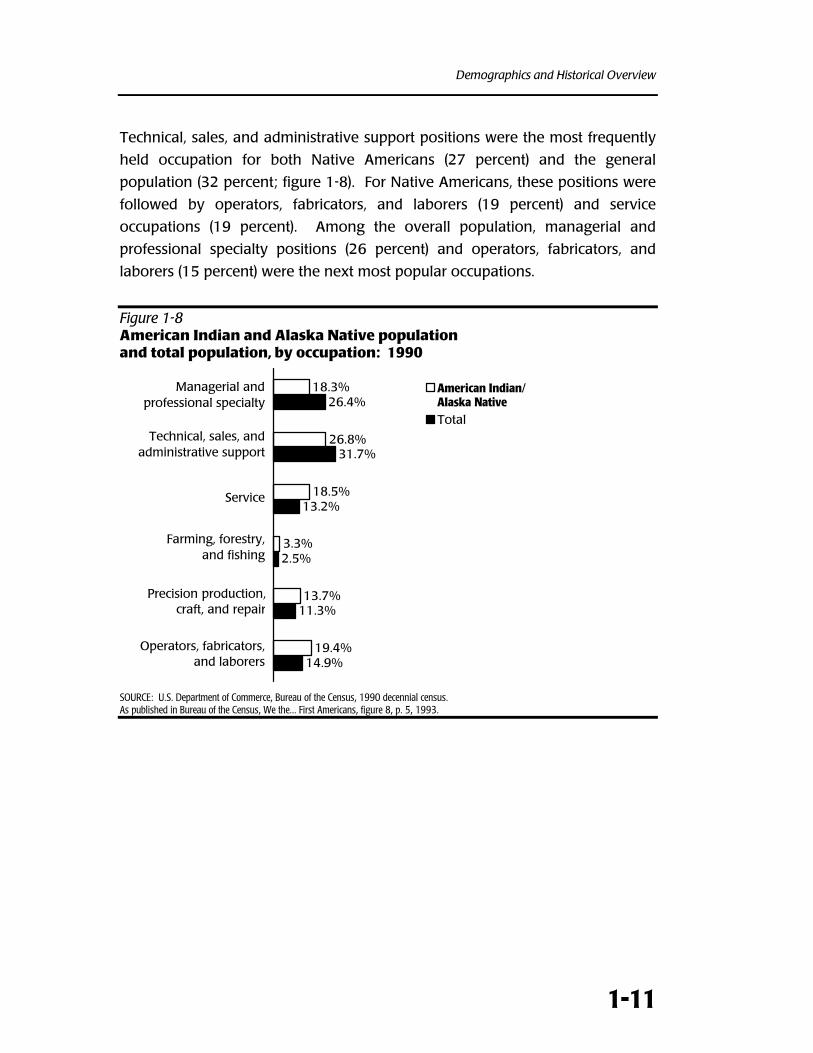
Demographics and Historical Overview
1-11
Technical, sales, and administrative support positions were the most frequently
held occupation for both Native Americans (27 percent) and the general
population (32 percent; figure 1-8). For Native Americans, these positions were
followed by operators, fabricators, and laborers (19 percent) and service
occupations (19 percent). Among the overall population, managerial and
professional specialty positions (26 percent) and operators, fabricators, and
laborers (15 percent) were the next most popular occupations.
Figure 1-8American Indian and Alaska Native populationand total population, by occupation: 1990
14.9%
11.3%
2.5%
13.2%
31.7%
26.4%
19.4%
13.7%
3.3%
18.5%
26.8%
18.3% American Indian/Alaska NativeTotal
Managerial and professional specialty
Technical, sales, and administrative support
Farming, forestry, and fishing
Precision production,craft, and repair
Operators, fabricators,and laborers
Service
SOURCE: U.S. Department of Commerce, Bureau of the Census, 1990 decennial census.As published in Bureau of the Census, We the... First Americans, figure 8, p. 5, 1993.
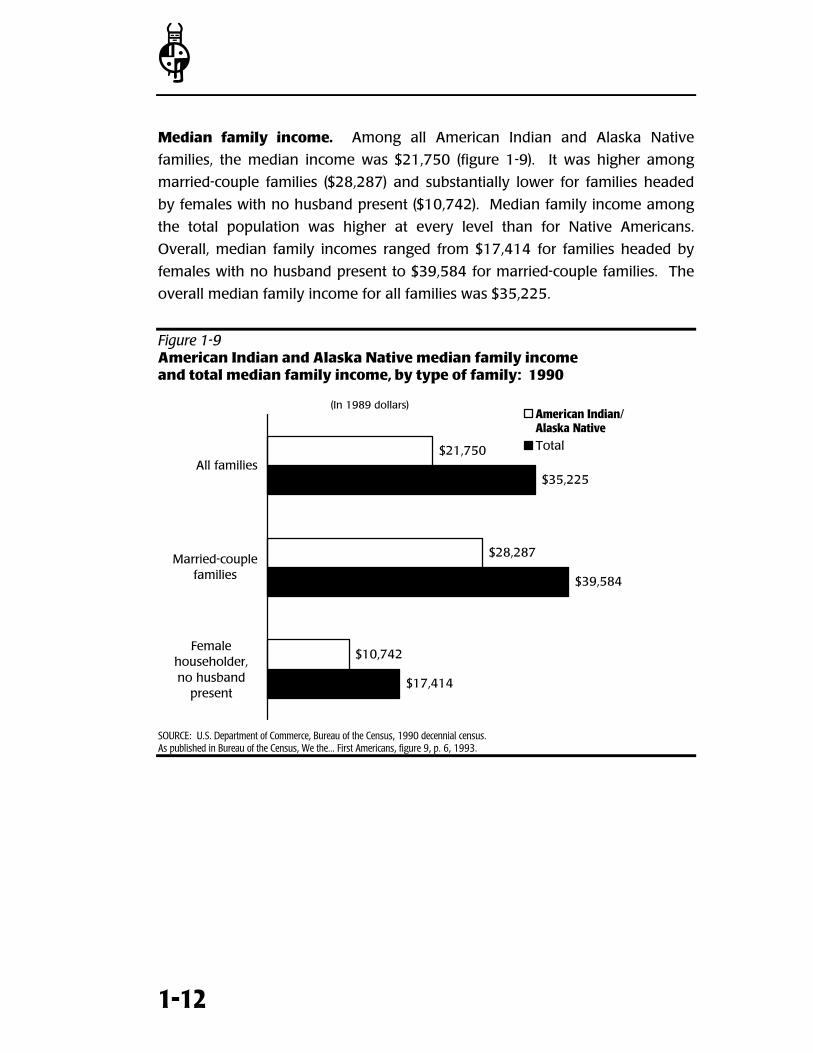
[
1-12
Median family income. Among all American Indian and Alaska Native
families, the median income was $21,750 (figure 1-9). It was higher among
married-couple families ($28,287) and substantially lower for families headed
by females with no husband present ($10,742). Median family income among
the total population was higher at every level than for Native Americans.
Overall, median family incomes ranged from $17,414 for families headed by
females with no husband present to $39,584 for married-couple families. The
overall median family income for all families was $35,225.
Figure 1-9American Indian and Alaska Native median family incomeand total median family income, by type of family: 1990
$17,414
$39,584
$35,225
$10,742
$28,287
$21,750
Femalehouseholder, nohusband present
Married-couplefamilies
All families
American Indian/Alaska NativeTotal
Female householder,no husband
present
SOURCE: U.S. Department of Commerce, Bureau of the Census, 1990 decennial census.As published in Bureau of the Census, We the... First Americans, figure 9, p. 6, 1993.
(In 1989 dollars)
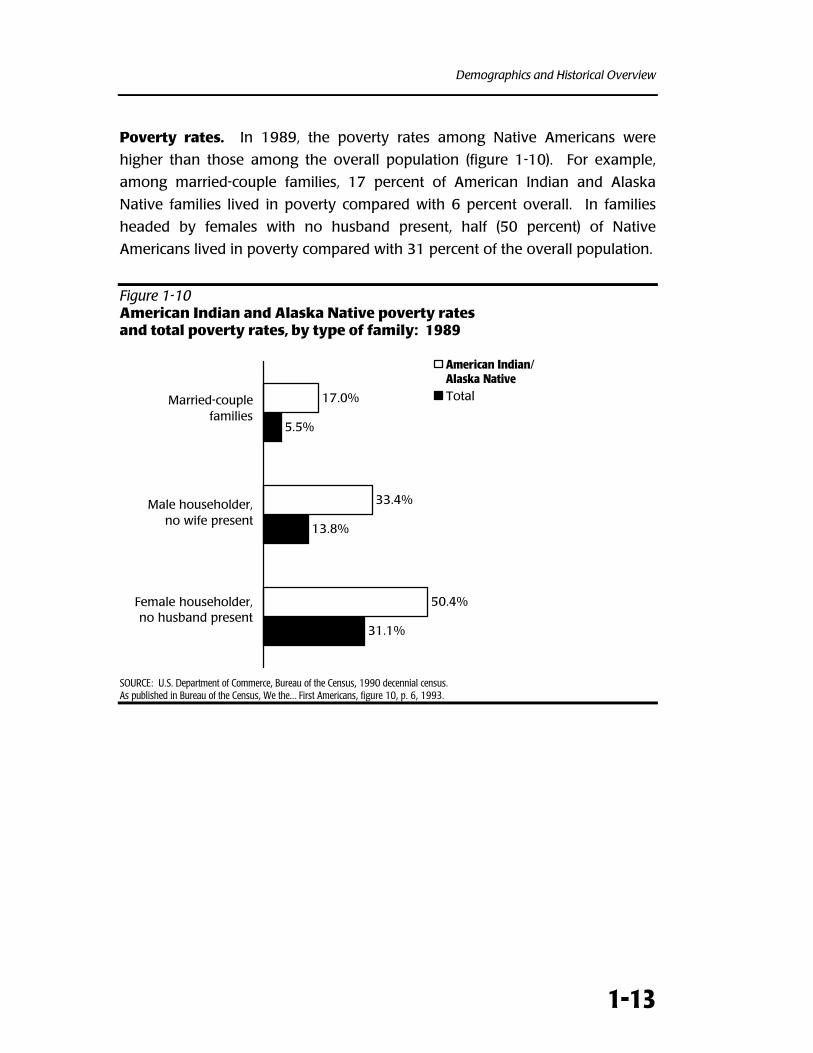
Demographics and Historical Overview
1-13
Poverty rates. In 1989, the poverty rates among Native Americans were
higher than those among the overall population (figure 1-10). For example,
among married-couple families, 17 percent of American Indian and Alaska
Native families lived in poverty compared with 6 percent overall. In families
headed by females with no husband present, half (50 percent) of Native
Americans lived in poverty compared with 31 percent of the overall population.
Figure 1-10American Indian and Alaska Native poverty ratesand total poverty rates, by type of family: 1989
31.1%
13.8%
5.5%
50.4%
33.4%
17.0%
American Indian/Alaska NativeTotal
Female householder,no husband present
Male householder,no wife present
Married-couple families
SOURCE: U.S. Department of Commerce, Bureau of the Census, 1990 decennial census.As published in Bureau of the Census, We the... First Americans, figure 10, p. 6, 1993.
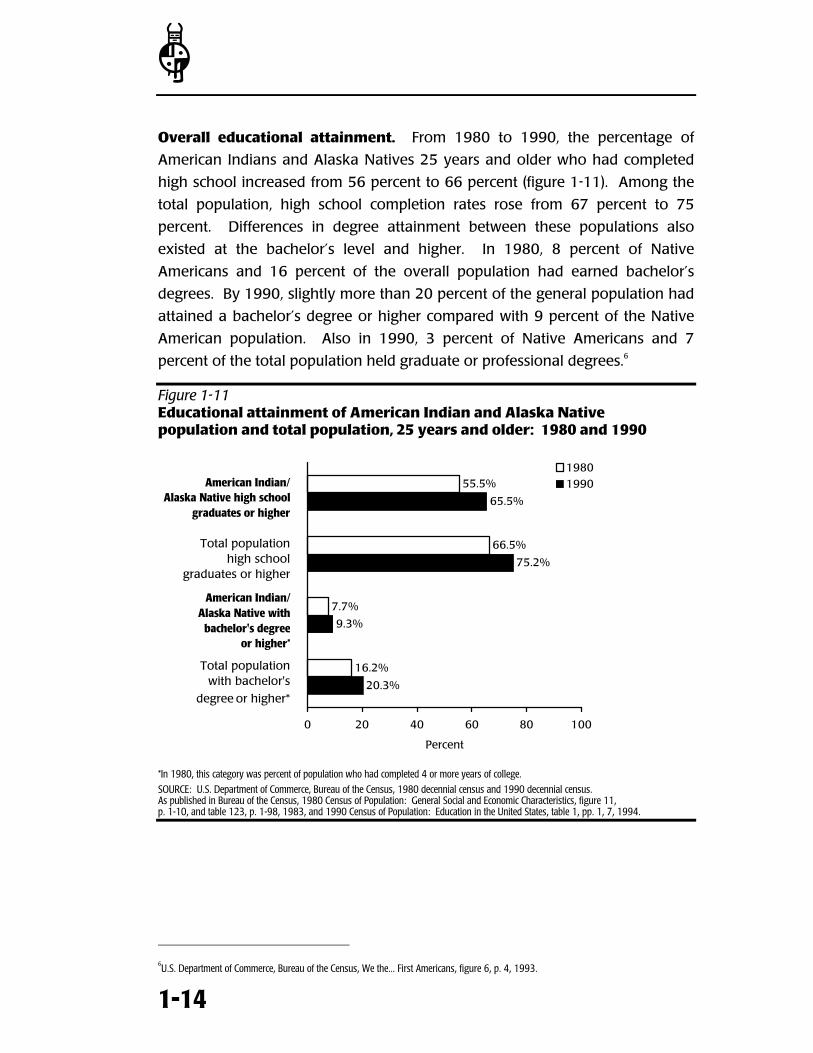
[
1-14
Overall educational attainment. From 1980 to 1990, the percentage of
American Indians and Alaska Natives 25 years and older who had completed
high school increased from 56 percent to 66 percent (figure 1-11). Among the
total population, high school completion rates rose from 67 percent to 75
percent. Differences in degree attainment between these populations also
existed at the bachelor’s level and higher. In 1980, 8 percent of Native
Americans and 16 percent of the overall population had earned bachelor’s
degrees. By 1990, slightly more than 20 percent of the general population had
attained a bachelor’s degree or higher compared with 9 percent of the Native
American population. Also in 1990, 3 percent of Native Americans and 7
percent of the total population held graduate or professional degrees.6
Figure 1-11Educational attainment of American Indian and Alaska Nativepopulation and total population, 25 years and older: 1980 and 1990
65.5%
75.2%
9.3%
20.3%
55.5%
66.5%
7.7%
16.2%
0 20 40 60 80 100
Percent
1980
1990American Indian/Alaska Native high school
graduates or higher
Total population high school
graduates or higher
American Indian/Alaska Native with
bachelor's degreeor higher*
Total population with bachelor's
degree or higher*
*In 1980, this category was percent of population who had completed 4 or more years of college.
SOURCE: U.S. Department of Commerce, Bureau of the Census, 1980 decennial census and 1990 decennial census.As published in Bureau of the Census, 1980 Census of Population: General Social and Economic Characteristics, figure 11,p. 1-10, and table 123, p. 1-98, 1983, and 1990 Census of Population: Education in the United States, table 1, pp. 1, 7, 1994.
6U.S. Department of Commerce, Bureau of the Census, We the... First Americans, figure 6, p. 4, 1993.
Demographics and Historical Overview
1-15
Tribal educational attainment. There is a wide range in the levels of
educational attainment achieved by individual tribes. For example, the
percentage of Indian tribe members who had completed a high school degree
or higher ranged from 94 percent for the Coos tribe to 29 percent for the
Miccosukee tribe (summary table S1-5). Substantially smaller percentages of
tribe members completed bachelor’s degrees or higher. The completion rates
ranged from 32 percent for members of the Chehalis tribe to less than one half
of one percent for the Cupeno, Salinan, and Serrano tribes. These differences
may be related to varying resource availability levels among the tribes as well
as different levels of emphasis placed on completing high school and attaining
a college degree. For example, some tribes are benefiting from casinos that
have been established on their reservations, while other tribes continue to
experience high rates of unemployment and poverty.
On average, 54 percent of the persons 25 years and older living on Indian
reservations had earned a high school diploma or higher by 1990 (figure 1-12).
Five reservations had above average high school completion rates with the
highest completion rate occurring at the Blackfeet reservation in Montana (66
percent). It was followed by the Hopi reservation in Arizona (63 percent) and
the Rosebud reservation in South Dakota (59 percent).
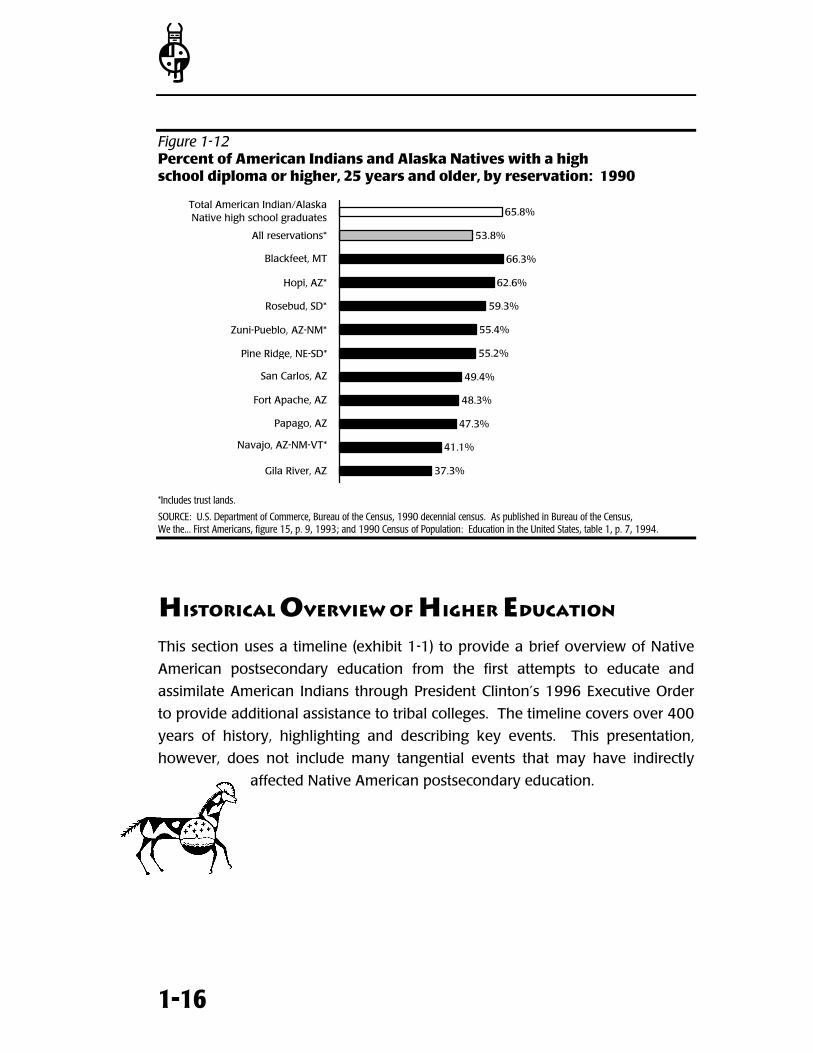
[
1-16
Figure 1-12Percent of American Indians and Alaska Natives with a highschool diploma or higher, 25 years and older, by reservation: 1990
37.3%
41.1%
47.3%
48.3%
49.4%
55.2%
55.4%
59.3%
62.6%
66.3%
53.8%
65.8%Total American Indian/Alaska Native high school graduates
All reservations*
Blackfeet, MT
Hopi, AZ*
Rosebud, SD*
Zuni-Pueblo, AZ-NM*
Pine Ridge, NE-SD*
San Carlos, AZ
Fort Apache, AZ
Papago, AZ
Navajo, AZ-NM-VT*
Gila River, AZ
*Includes trust lands.
SOURCE: U.S. Department of Commerce, Bureau of the Census, 1990 decennial census. As published in Bureau of the Census,We the... First Americans, figure 15, p. 9, 1993; and 1990 Census of Population: Education in the United States, table 1, p. 7, 1994.
HISTORICAL OVERVIEW OF HIGHER EDUCATION
This section uses a timeline (exhibit 1-1) to provide a brief overview of Native
American postsecondary education from the first attempts to educate and
assimilate American Indians through President Clinton’s 1996 Executive Order
to provide additional assistance to tribal colleges. The timeline covers over 400
years of history, highlighting and describing key events. This presentation,
however, does not include many tangential events that may have indirectly
affected Native American postsecondary education.
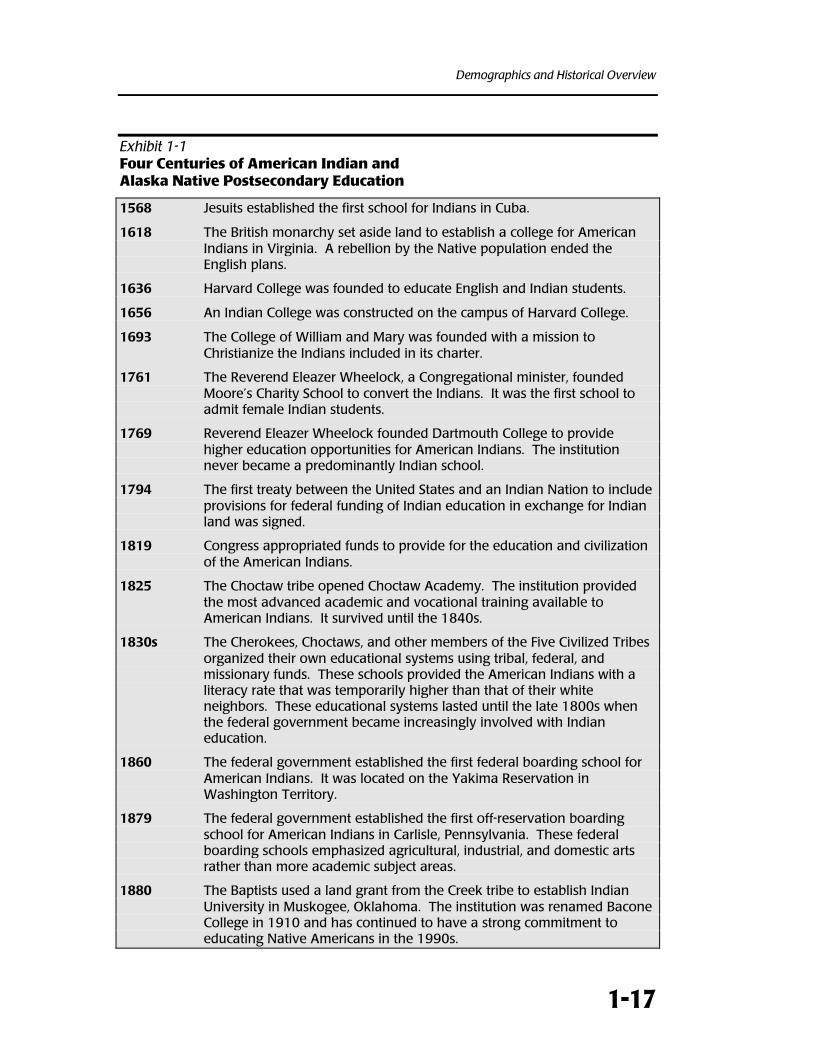
Demographics and Historical Overview
1-17
Exhibit 1-1Four Centuries of American Indian andAlaska Native Postsecondary Education
1568 Jesuits established the first school for Indians in Cuba.
1618 The British monarchy set aside land to establish a college for AmericanIndians in Virginia. A rebellion by the Native population ended theEnglish plans.
1636 Harvard College was founded to educate English and Indian students.
1656 An Indian College was constructed on the campus of Harvard College.
1693 The College of William and Mary was founded with a mission toChristianize the Indians included in its charter.
1761 The Reverend Eleazer Wheelock, a Congregational minister, foundedMoore’s Charity School to convert the Indians. It was the first school toadmit female Indian students.
1769 Reverend Eleazer Wheelock founded Dartmouth College to providehigher education opportunities for American Indians. The institutionnever became a predominantly Indian school.
1794 The first treaty between the United States and an Indian Nation to includeprovisions for federal funding of Indian education in exchange for Indianland was signed.
1819 Congress appropriated funds to provide for the education and civilizationof the American Indians.
1825 The Choctaw tribe opened Choctaw Academy. The institution providedthe most advanced academic and vocational training available toAmerican Indians. It survived until the 1840s.
1830s The Cherokees, Choctaws, and other members of the Five Civilized Tribesorganized their own educational systems using tribal, federal, andmissionary funds. These schools provided the American Indians with aliteracy rate that was temporarily higher than that of their whiteneighbors. These educational systems lasted until the late 1800s whenthe federal government became increasingly involved with Indianeducation.
1860 The federal government established the first federal boarding school forAmerican Indians. It was located on the Yakima Reservation inWashington Territory.
1879 The federal government established the first off-reservation boardingschool for American Indians in Carlisle, Pennsylvania. These federalboarding schools emphasized agricultural, industrial, and domestic artsrather than more academic subject areas.
1880 The Baptists used a land grant from the Creek tribe to establish IndianUniversity in Muskogee, Oklahoma. The institution was renamed BaconeCollege in 1910 and has continued to have a strong commitment toeducating Native Americans in the 1990s.
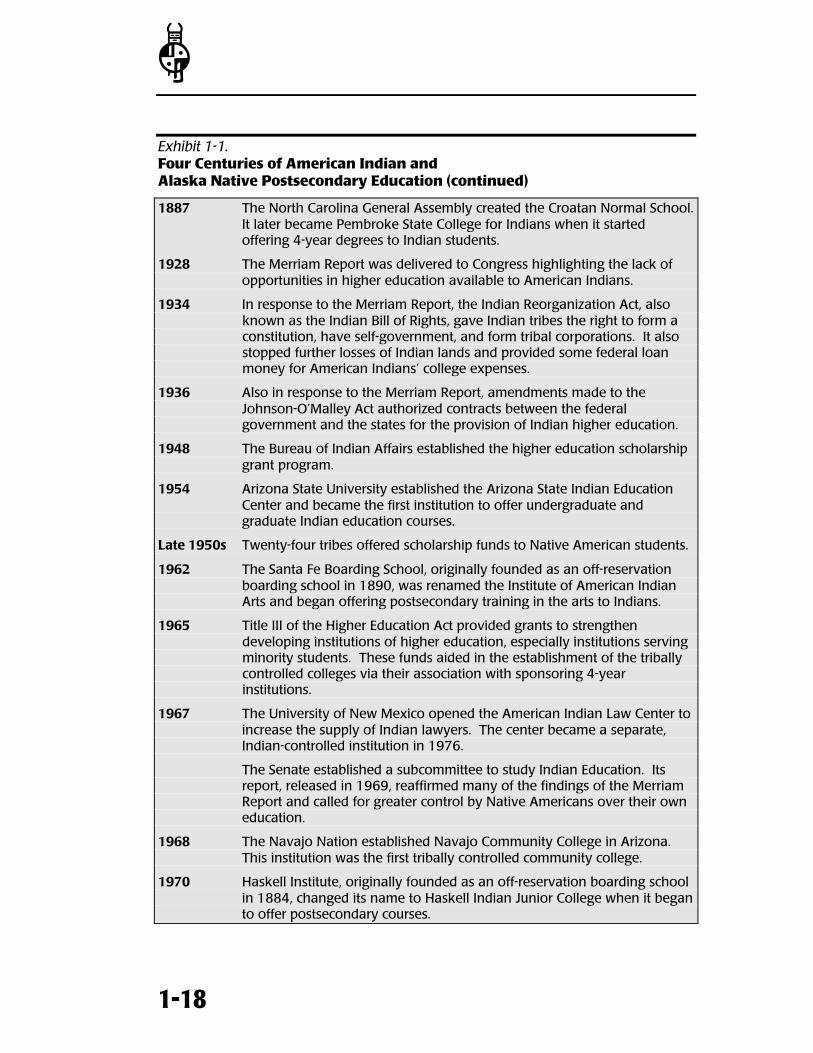
[
1-18
Exhibit 1-1.Four Centuries of American Indian andAlaska Native Postsecondary Education (continued)
1887 The North Carolina General Assembly created the Croatan Normal School.It later became Pembroke State College for Indians when it startedoffering 4-year degrees to Indian students.
1928 The Merriam Report was delivered to Congress highlighting the lack ofopportunities in higher education available to American Indians.
1934 In response to the Merriam Report, the Indian Reorganization Act, alsoknown as the Indian Bill of Rights, gave Indian tribes the right to form aconstitution, have self-government, and form tribal corporations. It alsostopped further losses of Indian lands and provided some federal loanmoney for American Indians’ college expenses.
1936 Also in response to the Merriam Report, amendments made to theJohnson-O’Malley Act authorized contracts between the federalgovernment and the states for the provision of Indian higher education.
1948 The Bureau of Indian Affairs established the higher education scholarshipgrant program.
1954 Arizona State University established the Arizona State Indian EducationCenter and became the first institution to offer undergraduate andgraduate Indian education courses.
Late 1950s Twenty-four tribes offered scholarship funds to Native American students.
1962 The Santa Fe Boarding School, originally founded as an off-reservationboarding school in 1890, was renamed the Institute of American IndianArts and began offering postsecondary training in the arts to Indians.
1965 Title III of the Higher Education Act provided grants to strengthendeveloping institutions of higher education, especially institutions servingminority students. These funds aided in the establishment of the triballycontrolled colleges via their association with sponsoring 4-yearinstitutions.
1967 The University of New Mexico opened the American Indian Law Center toincrease the supply of Indian lawyers. The center became a separate,Indian-controlled institution in 1976.
The Senate established a subcommittee to study Indian Education. Itsreport, released in 1969, reaffirmed many of the findings of the MerriamReport and called for greater control by Native Americans over their owneducation.
1968 The Navajo Nation established Navajo Community College in Arizona.This institution was the first tribally controlled community college.
1970 Haskell Institute, originally founded as an off-reservation boarding schoolin 1884, changed its name to Haskell Indian Junior College when it beganto offer postsecondary courses.
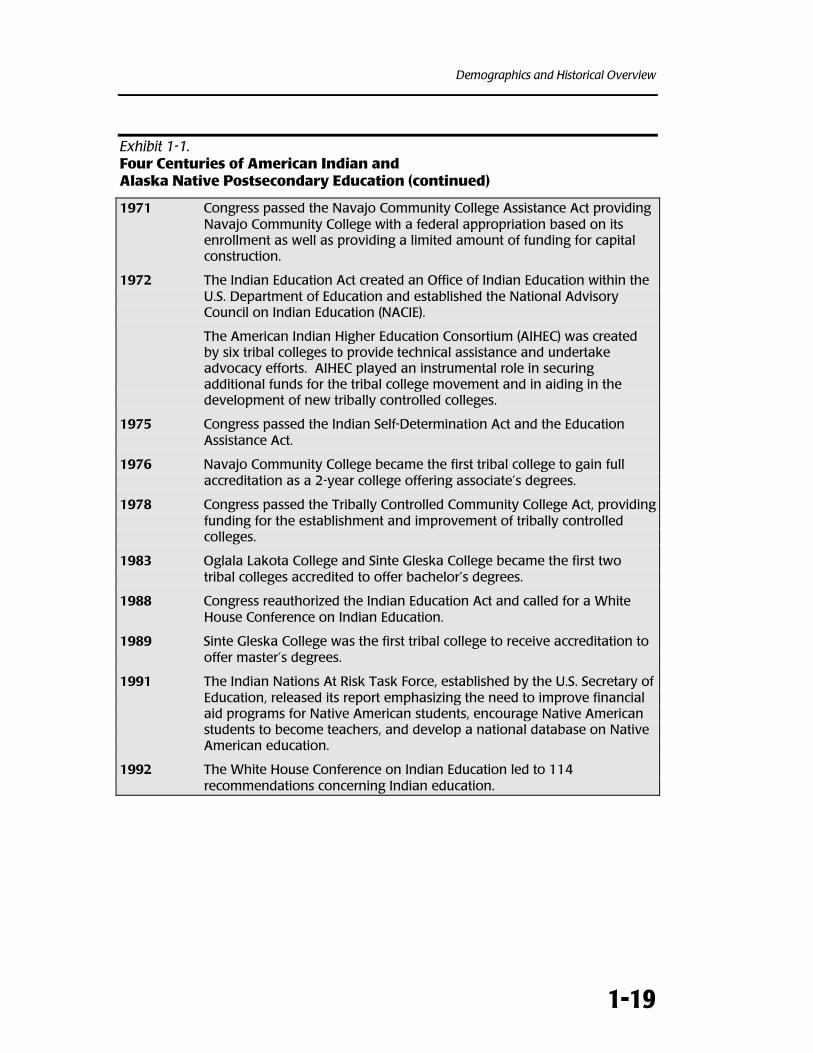
Demographics and Historical Overview
1-19
Exhibit 1-1.Four Centuries of American Indian andAlaska Native Postsecondary Education (continued)
1971 Congress passed the Navajo Community College Assistance Act providingNavajo Community College with a federal appropriation based on itsenrollment as well as providing a limited amount of funding for capitalconstruction.
1972 The Indian Education Act created an Office of Indian Education within theU.S. Department of Education and established the National AdvisoryCouncil on Indian Education (NACIE).
The American Indian Higher Education Consortium (AIHEC) was createdby six tribal colleges to provide technical assistance and undertakeadvocacy efforts. AIHEC played an instrumental role in securingadditional funds for the tribal college movement and in aiding in thedevelopment of new tribally controlled colleges.
1975 Congress passed the Indian Self-Determination Act and the EducationAssistance Act.
1976 Navajo Community College became the first tribal college to gain fullaccreditation as a 2-year college offering associate’s degrees.
1978 Congress passed the Tribally Controlled Community College Act, providingfunding for the establishment and improvement of tribally controlledcolleges.
1983 Oglala Lakota College and Sinte Gleska College became the first twotribal colleges accredited to offer bachelor’s degrees.
1988 Congress reauthorized the Indian Education Act and called for a WhiteHouse Conference on Indian Education.
1989 Sinte Gleska College was the first tribal college to receive accreditation tooffer master’s degrees.
1991 The Indian Nations At Risk Task Force, established by the U.S. Secretary ofEducation, released its report emphasizing the need to improve financialaid programs for Native American students, encourage Native Americanstudents to become teachers, and develop a national database on NativeAmerican education.
1992 The White House Conference on Indian Education led to 114recommendations concerning Indian education.
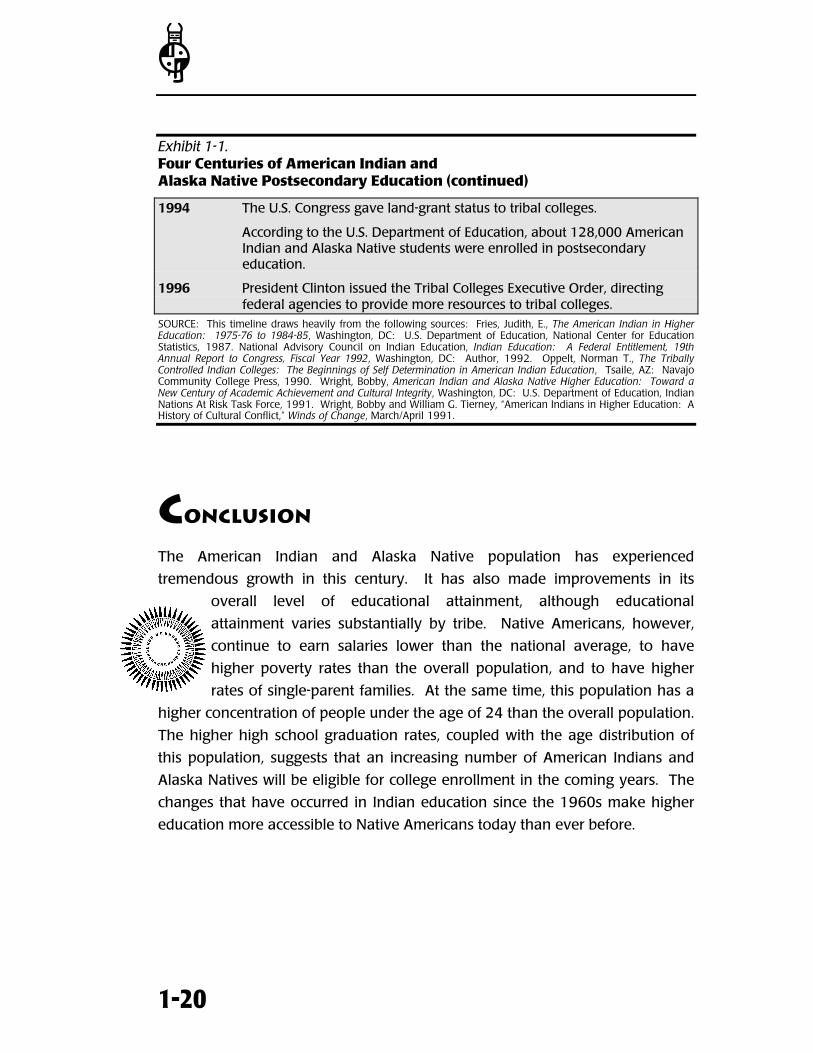
[
1-20
Exhibit 1-1.Four Centuries of American Indian andAlaska Native Postsecondary Education (continued)
1994 The U.S. Congress gave land-grant status to tribal colleges.
According to the U.S. Department of Education, about 128,000 AmericanIndian and Alaska Native students were enrolled in postsecondaryeducation.
1996 President Clinton issued the Tribal Colleges Executive Order, directingfederal agencies to provide more resources to tribal colleges.
SOURCE: This timeline draws heavily from the following sources: Fries, Judith, E., The American Indian in HigherEducation: 1975-76 to 1984-85, Washington, DC: U.S. Department of Education, National Center for EducationStatistics, 1987. National Advisory Council on Indian Education, Indian Education: A Federal Entitlement, 19thAnnual Report to Congress, Fiscal Year 1992, Washington, DC: Author, 1992. Oppelt, Norman T., The TriballyControlled Indian Colleges: The Beginnings of Self Determination in American Indian Education, Tsaile, AZ: NavajoCommunity College Press, 1990. Wright, Bobby, American Indian and Alaska Native Higher Education: Toward aNew Century of Academic Achievement and Cultural Integrity, Washington, DC: U.S. Department of Education, IndianNations At Risk Task Force, 1991. Wright, Bobby and William G. Tierney, “American Indians in Higher Education: AHistory of Cultural Conflict,” Winds of Change, March/April 1991.
CONCLUSION
The American Indian and Alaska Native population has experienced
tremendous growth in this century. It has also made improvements in its
overall level of educational attainment, although educational
attainment varies substantially by tribe. Native Americans, however,
continue to earn salaries lower than the national average, to have
higher poverty rates than the overall population, and to have higher
rates of single-parent families. At the same time, this population has a
higher concentration of people under the age of 24 than the overall population.
The higher high school graduation rates, coupled with the age distribution of
this population, suggests that an increasing number of American Indians and
Alaska Natives will be eligible for college enrollment in the coming years. The
changes that have occurred in Indian education since the 1960s make higher
education more accessible to Native Americans today than ever before.
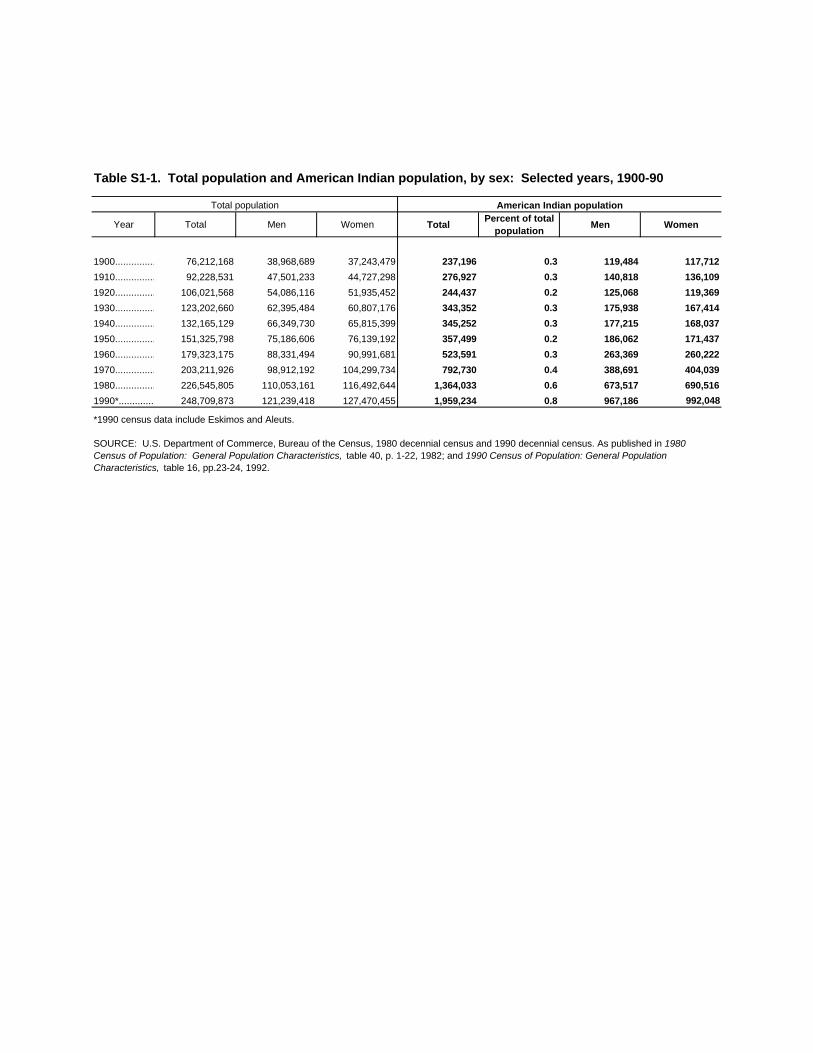
Total population American Indian population
Year Total Men Women TotalPercent of total
populationMen Women
1900.................................76,212,168 38,968,689 37,243,479 237,196 0.3 119,484 117,712
1910...........................92,228,531 47,501,233 44,727,298 276,927 0.3 140,818 136,109
1920..................................106,021,568 54,086,116 51,935,452 244,437 0.2 125,068 119,369
1930............................123,202,660 62,395,484 60,807,176 343,352 0.3 175,938 167,414
1940.................................132,165,129 66,349,730 65,815,399 345,252 0.3 177,215 168,037
1950............................151,325,798 75,186,606 76,139,192 357,499 0.2 186,062 171,437
1960..............................179,323,175 88,331,494 90,991,681 523,591 0.3 263,369 260,222
1970...............................203,211,926 98,912,192 104,299,734 792,730 0.4 388,691 404,039
1980.................................226,545,805 110,053,161 116,492,644 1,364,033 0.6 673,517 690,516
1990*............................A17248,709,873 121,239,418 127,470,455 1,959,234 0.8 967,186 992,048
Table S1-1. Total population and American Indian population, by sex: Selected years, 1900-90
*1990 census data include Eskimos and Aleuts.
SOURCE: U.S. Department of Commerce, Bureau of the Census, 1980 decennial census and 1990 decennial census. As published in 1980 Census of Population: General Population Characteristics, table 40, p. 1-22, 1982; and 1990 Census of Population: General Population Characteristics, table 16, pp.23-24, 1992.
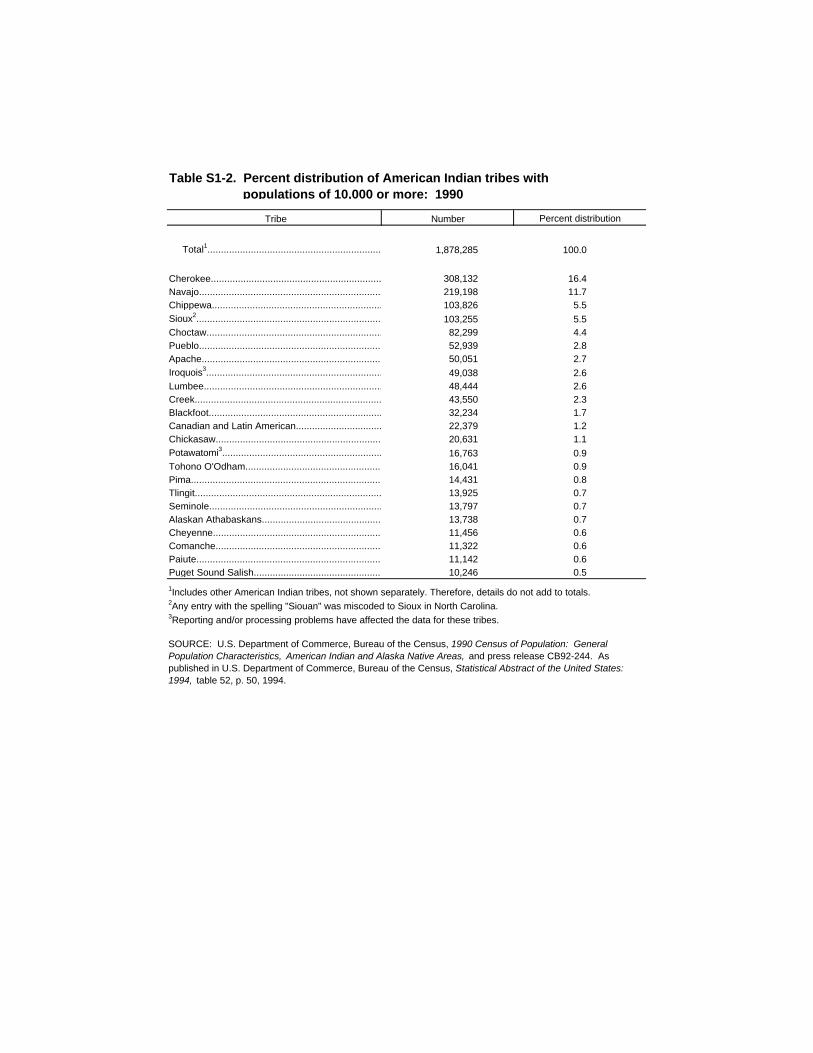
Tribe Number Percent distribution
Total1................................................................................. 1,878,285 100.0
Cherokee............................................................................................................................................308,132 16.4Navajo.................................................................................................................................................219,198 11.7Chippewa.............................................................................................................103,826 5.5Sioux2..............................................................................................................................103,255 5.5Choctaw........................................................................................................................82,299 4.4Pueblo.................................................................................................................52,939 2.8Apache...............................................................................................50,051 2.7Iroquois3................................................................................................................................................49,038 2.6Lumbee.................................................................................................................................................48,444 2.6Creek.......................................................................................................................43,550 2.3Blackfoot....................................................................................................................32,234 1.7Canadian and Latin American.............................................................................22,379 1.2Chickasaw..........................................................................................................20,631 1.1Potawatomi3.............................................................................................16,763 0.9Tohono O'Odham.........................................................................................16,041 0.9Pima........................................................................................ 14,431 0.8Tlingit......................................................................................................13,925 0.7Seminole............................................................................................13,797 0.7Alaskan Athabaskans......................................................................................................13,738 0.7Cheyenne..........................................................................................................11,456 0.6Comanche.............................................................................................11,322 0.6Paiute...................................................................................................11,142 0.6Puget Sound Salish..........................................................................10,246 0.5
1Includes other American Indian tribes, not shown separately. Therefore, details do not add to totals.2Any entry with the spelling "Siouan" was miscoded to Sioux in North Carolina. 3Reporting and/or processing problems have affected the data for these tribes.
SOURCE: U.S. Department of Commerce, Bureau of the Census, 1990 Census of Population: General Population Characteristics, American Indian and Alaska Native Areas, and press release CB92-244. As published in U.S. Department of Commerce, Bureau of the Census, Statistical Abstract of the United States: 1994, table 52, p. 50, 1994.
Table S1-2. Percent distribution of American Indian tribes with populations of 10,000 or more: 1990
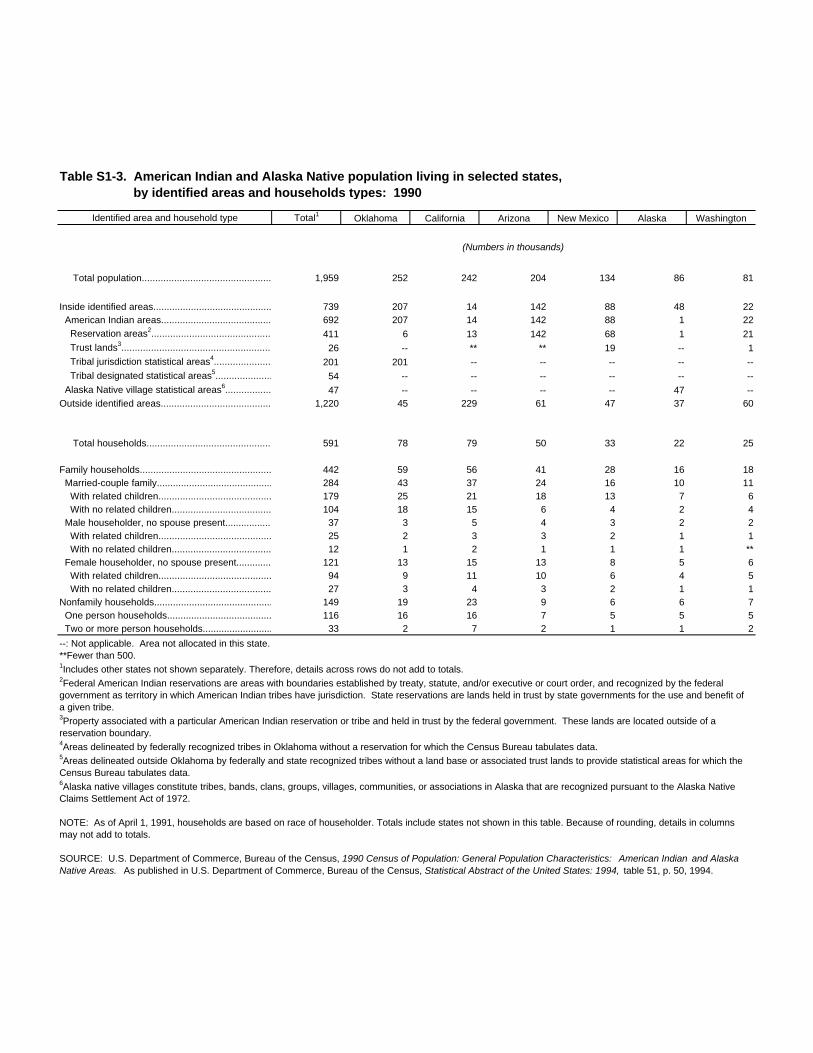
Identified area and household type Total1 Oklahoma California Arizona New Mexico Alaska Washington
(Numbers in thousands)
Total population............................................................ 1,959 252 242 204 134 86 81
Inside identified areas......................................................... 739 207 14 142 88 48 22 American Indian areas......................................... 692 207 14 142 88 1 22 Reservation areas2...................................................... 411 6 13 142 68 1 21 Trust lands3.................................................................... 26 -- ** ** 19 -- 1 Tribal jurisdiction statistical areas4....................................... 201 201 -- -- -- -- -- Tribal designated statistical areas5....................................... 54 -- -- -- -- -- -- Alaska Native village statistical areas6......................... 47 -- -- -- -- 47 --Outside identified areas................................................. 1,220 45 229 61 47 37 60
Total households......................................................... 591 78 79 50 33 22 25
Family households.......................................................... 442 59 56 41 28 16 18 Married-couple family................................................. 284 43 37 24 16 10 11 With related children......................................................... 179 25 21 18 13 7 6 With no related children....................................... 104 18 15 6 4 2 4 Male householder, no spouse present....................... 37 3 5 4 3 2 2 With related children......................................................... 25 2 3 3 2 1 1 With no related children....................................... 12 1 2 1 1 1 ** Female householder, no spouse present....................... 121 13 15 13 8 5 6 With related children......................................................... 94 9 11 10 6 4 5 With no related children....................................... 27 3 4 3 2 1 1Nonfamily households....................................................... 149 19 23 9 6 6 7 One person households.......................................... 116 16 16 7 5 5 5 Two or more person households................................ 33 2 7 2 1 1 2
--: Not applicable. Area not allocated in this state.**Fewer than 500.1Includes other states not shown separately. Therefore, details across rows do not add to totals.2Federal American Indian reservations are areas with boundaries established by treaty, statute, and/or executive or court order, and recognized by the federal government as territory in which American Indian tribes have jurisdiction. State reservations are lands held in trust by state governments for the use and benefit of a given tribe.3Property associated with a particular American Indian reservation or tribe and held in trust by the federal government. These lands are located outside of a reservation boundary.4Areas delineated by federally recognized tribes in Oklahoma without a reservation for which the Census Bureau tabulates data.5Areas delineated outside Oklahoma by federally and state recognized tribes without a land base or associated trust lands to provide statistical areas for which the Census Bureau tabulates data.6Alaska native villages constitute tribes, bands, clans, groups, villages, communities, or associations in Alaska that are recognized pursuant to the Alaska Native Claims Settlement Act of 1972.
NOTE: As of April 1, 1991, households are based on race of householder. Totals include states not shown in this table. Because of rounding, details in columns may not add to totals.
SOURCE: U.S. Department of Commerce, Bureau of the Census, 1990 Census of Population: General Population Characteristics: American Indian and Alaska Native Areas. As published in U.S. Department of Commerce, Bureau of the Census, Statistical Abstract of the United States: 1994, table 51, p. 50, 1994.
Table S1-3. American Indian and Alaska Native population living in selected states, by identified areas and households types: 1990
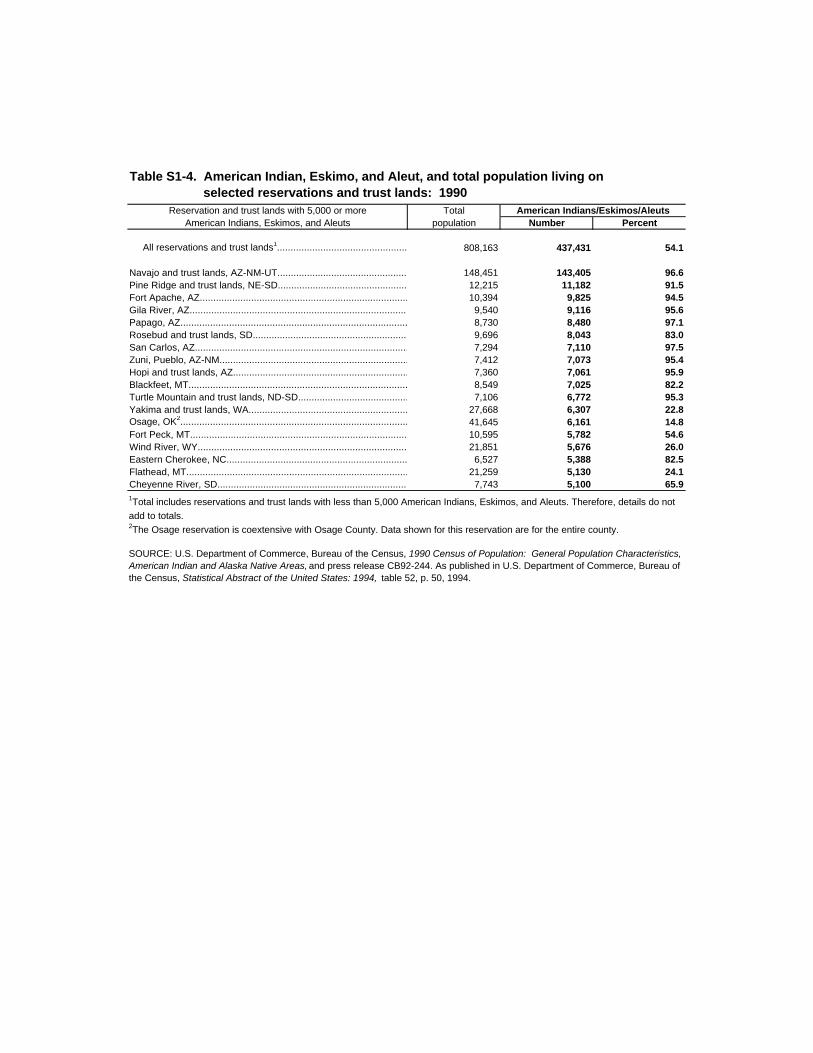
Reservation and trust lands with 5,000 or more Total American Indians/Eskimos/AleutsAmerican Indians, Eskimos, and Aleuts population Number Percent
All reservations and trust lands1............................................................... 808,163 437,431 54.1
Navajo and trust lands, AZ-NM-UT......................................................................148,451 143,405 96.6Pine Ridge and trust lands, NE-SD.................................................................. 12,215 11,182 91.5Fort Apache, AZ................................................................................................ 10,394 9,825 94.5Gila River, AZ.................................................................................................. 9,540 9,116 95.6Papago, AZ....................................................................................................... 8,730 8,480 97.1Rosebud and trust lands, SD............................................................................... 9,696 8,043 83.0San Carlos, AZ................................................................................................ 7,294 7,110 97.5Zuni, Pueblo, AZ-NM................................................................................. 7,412 7,073 95.4Hopi and trust lands, AZ................................................................................... 7,360 7,061 95.9Blackfeet, MT.................................................................................................... 8,549 7,025 82.2Turtle Mountain and trust lands, ND-SD..................................................................7,106 6,772 95.3Yakima and trust lands, WA............................................................................... 27,668 6,307 22.8Osage, OK2.................................................................................................... 41,645 6,161 14.8Fort Peck, MT.................................................................................................. 10,595 5,782 54.6Wind River, WY.............................................................................................. 21,851 5,676 26.0Eastern Cherokee, NC........................................................................................... 6,527 5,388 82.5Flathead, MT................................................................................................... 21,259 5,130 24.1Cheyenne River, SD.......................................................................................... 7,743 5,100 65.9
Table S1-4. American Indian, Eskimo, and Aleut, and total population living on selected reservations and trust lands: 1990
1Total includes reservations and trust lands with less than 5,000 American Indians, Eskimos, and Aleuts. Therefore, details do not
add to totals.2The Osage reservation is coextensive with Osage County. Data shown for this reservation are for the entire county.
SOURCE: U.S. Department of Commerce, Bureau of the Census, 1990 Census of Population: General Population Characteristics, American Indian and Alaska Native Areas, and press release CB92-244. As published in U.S. Department of Commerce, Bureau of the Census, Statistical Abstract of the United States: 1994, table 52, p. 50, 1994.
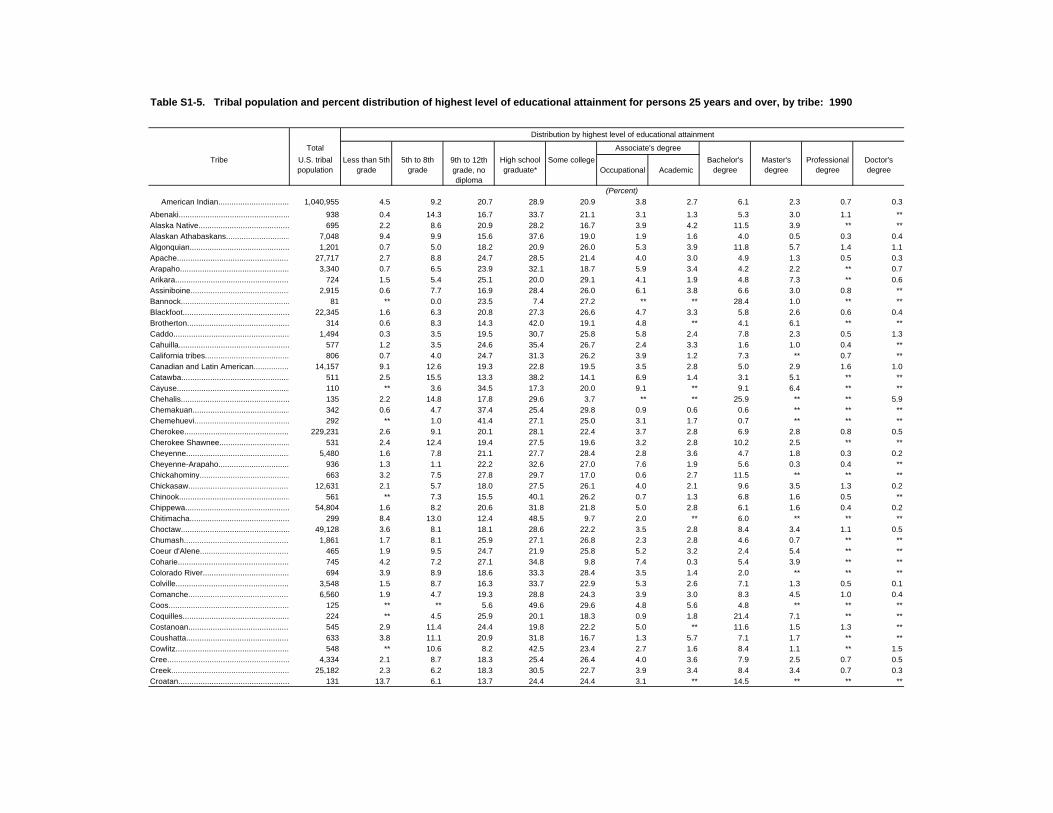
Distribution by highest level of educational attainment
Total Associate's degree
Tribe U.S. tribal population
Less than 5th grade
5th to 8th grade
9th to 12th grade, no diploma
High school graduate*
Some college Occupational Academic
Bachelor's degree
Master's degree
Professional degree
Doctor's degree
(Percent) American Indian........................................1,040,955 4.5 9.2 20.7 28.9 20.9 3.8 2.7 6.1 2.3 0.7 0.3
Abenaki......................................................................938 0.4 14.3 16.7 33.7 21.1 3.1 1.3 5.3 3.0 1.1 **Alaska Native......................................................... 695 2.2 8.6 20.9 28.2 16.7 3.9 4.2 11.5 3.9 ** **Alaskan Athabaskans...........................................7,048 9.4 9.9 15.6 37.6 19.0 1.9 1.6 4.0 0.5 0.3 0.4Algonquian.......................................................... 1,201 0.7 5.0 18.2 20.9 26.0 5.3 3.9 11.8 5.7 1.4 1.1Apache...............................................................27,717 2.7 8.8 24.7 28.5 21.4 4.0 3.0 4.9 1.3 0.5 0.3Arapaho.............................................................. 3,340 0.7 6.5 23.9 32.1 18.7 5.9 3.4 4.2 2.2 ** 0.7Arikara.................................................................. 724 1.5 5.4 25.1 20.0 29.1 4.1 1.9 4.8 7.3 ** 0.6Assiniboine..........................................................2,915 0.6 7.7 16.9 28.4 26.0 6.1 3.8 6.6 3.0 0.8 **Bannock.............................................................. 81 ** 0.0 23.5 7.4 27.2 ** ** 28.4 1.0 ** **Blackfoot..............................................................22,345 1.6 6.3 20.8 27.3 26.6 4.7 3.3 5.8 2.6 0.6 0.4Brotherton......................................................... 314 0.6 8.3 14.3 42.0 19.1 4.8 ** 4.1 6.1 ** **Caddo..................................................................1,494 0.3 3.5 19.5 30.7 25.8 5.8 2.4 7.8 2.3 0.5 1.3Cahuilla................................................................ 577 1.2 3.5 24.6 35.4 26.7 2.4 3.3 1.6 1.0 0.4 **California tribes..................................................... 806 0.7 4.0 24.7 31.3 26.2 3.9 1.2 7.3 ** 0.7 **Canadian and Latin American.................................14,157 9.1 12.6 19.3 22.8 19.5 3.5 2.8 5.0 2.9 1.6 1.0Catawba.............................................................. 511 2.5 15.5 13.3 38.2 14.1 6.9 1.4 3.1 5.1 ** **Cayuse................................................................. 110 ** 3.6 34.5 17.3 20.0 9.1 ** 9.1 6.4 ** **Chehalis.................................................................135 2.2 14.8 17.8 29.6 3.7 ** ** 25.9 ** ** 5.9Chemakuan....................................................... 342 0.6 4.7 37.4 25.4 29.8 0.9 0.6 0.6 ** ** **Chemehuevi........................................................ 292 ** 1.0 41.4 27.1 25.0 3.1 1.7 0.7 ** ** **Cherokee...........................................................229,231 2.6 9.1 20.1 28.1 22.4 3.7 2.8 6.9 2.8 0.8 0.5Cherokee Shawnee............................................... 531 2.4 12.4 19.4 27.5 19.6 3.2 2.8 10.2 2.5 ** **Cheyenne...............................................................5,480 1.6 7.8 21.1 27.7 28.4 2.8 3.6 4.7 1.8 0.3 0.2Cheyenne-Arapaho............................................ 936 1.3 1.1 22.2 32.6 27.0 7.6 1.9 5.6 0.3 0.4 **Chickahominy.................................................. 663 3.2 7.5 27.8 29.7 17.0 0.6 2.7 11.5 ** ** **Chickasaw...........................................................12,631 2.1 5.7 18.0 27.5 26.1 4.0 2.1 9.6 3.5 1.3 0.2Chinook............................................................... 561 ** 7.3 15.5 40.1 26.2 0.7 1.3 6.8 1.6 0.5 **Chippewa.......................................................... 54,804 1.6 8.2 20.6 31.8 21.8 5.0 2.8 6.1 1.6 0.4 0.2Chitimacha.......................................................... 299 8.4 13.0 12.4 48.5 9.7 2.0 ** 6.0 ** ** **Choctaw...............................................................49,128 3.6 8.1 18.1 28.6 22.2 3.5 2.8 8.4 3.4 1.1 0.5Chumash..............................................................1,861 1.7 8.1 25.9 27.1 26.8 2.3 2.8 4.6 0.7 ** **Coeur d'Alene.................................................. 465 1.9 9.5 24.7 21.9 25.8 5.2 3.2 2.4 5.4 ** **Coharie.............................................................. 745 4.2 7.2 27.1 34.8 9.8 7.4 0.3 5.4 3.9 ** **Colorado River................................................... 694 3.9 8.9 18.6 33.3 28.4 3.5 1.4 2.0 ** ** **Colville.................................................................3,548 1.5 8.7 16.3 33.7 22.9 5.3 2.6 7.1 1.3 0.5 0.1Comanche.......................................................... 6,560 1.9 4.7 19.3 28.8 24.3 3.9 3.0 8.3 4.5 1.0 0.4Coos.......................................................................125 ** ** 5.6 49.6 29.6 4.8 5.6 4.8 ** ** **Coquilles............................................................. 224 ** 4.5 25.9 20.1 18.3 0.9 1.8 21.4 7.1 ** **Costanoan.......................................................... 545 2.9 11.4 24.4 19.8 22.2 5.0 ** 11.6 1.5 1.3 **Coushatta........................................................... 633 3.8 11.1 20.9 31.8 16.7 1.3 5.7 7.1 1.7 ** **Cowlitz.................................................................. 548 ** 10.6 8.2 42.5 23.4 2.7 1.6 8.4 1.1 ** 1.5Cree...........................................................................4,334 2.1 8.7 18.3 25.4 26.4 4.0 3.6 7.9 2.5 0.7 0.5Creek......................................................................25,182 2.3 6.2 18.3 30.5 22.7 3.9 3.4 8.4 3.4 0.7 0.3Croatan............................................................... 131 13.7 6.1 13.7 24.4 24.4 3.1 ** 14.5 ** ** **
Table S1-5. Tribal population and percent distribution of highest level of educational attainment for persons 25 years and over, by tribe: 1990
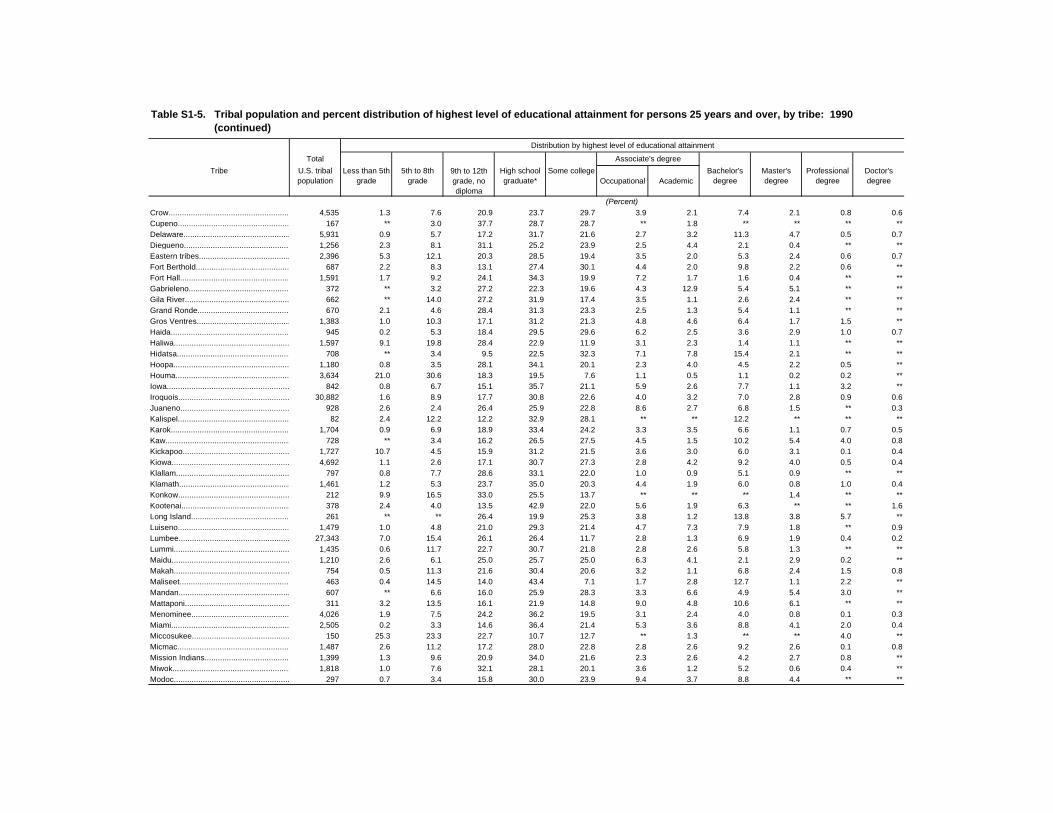
Distribution by highest level of educational attainment
Total Associate's degree
Tribe U.S. tribal population
Less than 5th grade
5th to 8th grade
9th to 12th grade, no diploma
High school graduate*
Some college Occupational Academic
Bachelor's degree
Master's degree
Professional degree
Doctor's degree
(Percent)Crow........................................................................4,535 1.3 7.6 20.9 23.7 29.7 3.9 2.1 7.4 2.1 0.8 0.6Cupeno................................................................ 167 ** 3.0 37.7 28.7 28.7 ** 1.8 ** ** ** **Delaware...............................................................5,931 0.9 5.7 17.2 31.7 21.6 2.7 3.2 11.3 4.7 0.5 0.7Diegueno........................................................... 1,256 2.3 8.1 31.1 25.2 23.9 2.5 4.4 2.1 0.4 ** **Eastern tribes.......................................................2,396 5.3 12.1 20.3 28.5 19.4 3.5 2.0 5.3 2.4 0.6 0.7Fort Berthold....................................................... 687 2.2 8.3 13.1 27.4 30.1 4.4 2.0 9.8 2.2 0.6 **Fort Hall.............................................................. 1,591 1.7 9.2 24.1 34.3 19.9 7.2 1.7 1.6 0.4 ** **Gabrieleno...............................................................372 ** 3.2 27.2 22.3 19.6 4.3 12.9 5.4 5.1 ** **Gila River.................................................................662 ** 14.0 27.2 31.9 17.4 3.5 1.1 2.6 2.4 ** **Grand Ronde....................................................... 670 2.1 4.6 28.4 31.3 23.3 2.5 1.3 5.4 1.1 ** **Gros Ventres........................................................1,383 1.0 10.3 17.1 31.2 21.3 4.8 4.6 6.4 1.7 1.5 **Haida.................................................................. 945 0.2 5.3 18.4 29.5 29.6 6.2 2.5 3.6 2.9 1.0 0.7Haliwa................................................................. 1,597 9.1 19.8 28.4 22.9 11.9 3.1 2.3 1.4 1.1 ** **Hidatsa.................................................................. 708 ** 3.4 9.5 22.5 32.3 7.1 7.8 15.4 2.1 ** **Hoopa................................................................ 1,180 0.8 3.5 28.1 34.1 20.1 2.3 4.0 4.5 2.2 0.5 **Houma..................................................................3,634 21.0 30.6 18.3 19.5 7.6 1.1 0.5 1.1 0.2 0.2 **Iowa...................................................................... 842 0.8 6.7 15.1 35.7 21.1 5.9 2.6 7.7 1.1 3.2 **Iroquois............................................................. 30,882 1.6 8.9 17.7 30.8 22.6 4.0 3.2 7.0 2.8 0.9 0.6Juaneno............................................................. 928 2.6 2.4 26.4 25.9 22.8 8.6 2.7 6.8 1.5 ** 0.3Kalispel................................................................... 82 2.4 12.2 12.2 32.9 28.1 ** ** 12.2 ** ** **Karok.....................................................................1,704 0.9 6.9 18.9 33.4 24.2 3.3 3.5 6.6 1.1 0.7 0.5Kaw..................................................................... 728 ** 3.4 16.2 26.5 27.5 4.5 1.5 10.2 5.4 4.0 0.8Kickapoo................................................................1,727 10.7 4.5 15.9 31.2 21.5 3.6 3.0 6.0 3.1 0.1 0.4Kiowa...................................................................4,692 1.1 2.6 17.1 30.7 27.3 2.8 4.2 9.2 4.0 0.5 0.4Klallam.................................................................. 797 0.8 7.7 28.6 33.1 22.0 1.0 0.9 5.1 0.9 ** **Klamath.............................................................. 1,461 1.2 5.3 23.7 35.0 20.3 4.4 1.9 6.0 0.8 1.0 0.4Konkow................................................................. 212 9.9 16.5 33.0 25.5 13.7 ** ** ** 1.4 ** **Kootenai............................................................... 378 2.4 4.0 13.5 42.9 22.0 5.6 1.9 6.3 ** ** 1.6Long Island.......................................................... 261 ** ** 26.4 19.9 25.3 3.8 1.2 13.8 3.8 5.7 **Luiseno...................................................................1,479 1.0 4.8 21.0 29.3 21.4 4.7 7.3 7.9 1.8 ** 0.9Lumbee............................................................. 27,343 7.0 15.4 26.1 26.4 11.7 2.8 1.3 6.9 1.9 0.4 0.2Lummi..................................................................1,435 0.6 11.7 22.7 30.7 21.8 2.8 2.6 5.8 1.3 ** **Maidu.................................................................. 1,210 2.6 6.1 25.0 25.7 25.0 6.3 4.1 2.1 2.9 0.2 **Makah............................................................... 754 0.5 11.3 21.6 30.4 20.6 3.2 1.1 6.8 2.4 1.5 0.8Maliseet................................................................. 463 0.4 14.5 14.0 43.4 7.1 1.7 2.8 12.7 1.1 2.2 **Mandan................................................................ 607 ** 6.6 16.0 25.9 28.3 3.3 6.6 4.9 5.4 3.0 **Mattaponi............................................................ 311 3.2 13.5 16.1 21.9 14.8 9.0 4.8 10.6 6.1 ** **Menominee.............................................................4,026 1.9 7.5 24.2 36.2 19.5 3.1 2.4 4.0 0.8 0.1 0.3Miami........................................................................2,505 0.2 3.3 14.6 36.4 21.4 5.3 3.6 8.8 4.1 2.0 0.4Miccosukee........................................................... 150 25.3 23.3 22.7 10.7 12.7 ** 1.3 ** ** 4.0 **Micmac....................................................................1,487 2.6 11.2 17.2 28.0 22.8 2.8 2.6 9.2 2.6 0.1 0.8Mission Indians................................................ 1,399 1.3 9.6 20.9 34.0 21.6 2.3 2.6 4.2 2.7 0.8 **Miwok..................................................................1,818 1.0 7.6 32.1 28.1 20.1 3.6 1.2 5.2 0.6 0.4 **Modoc....................................................................297 0.7 3.4 15.8 30.0 23.9 9.4 3.7 8.8 4.4 ** **
Table S1-5. Tribal population and percent distribution of highest level of educational attainment for persons 25 years and over, by tribe: 1990 (continued)
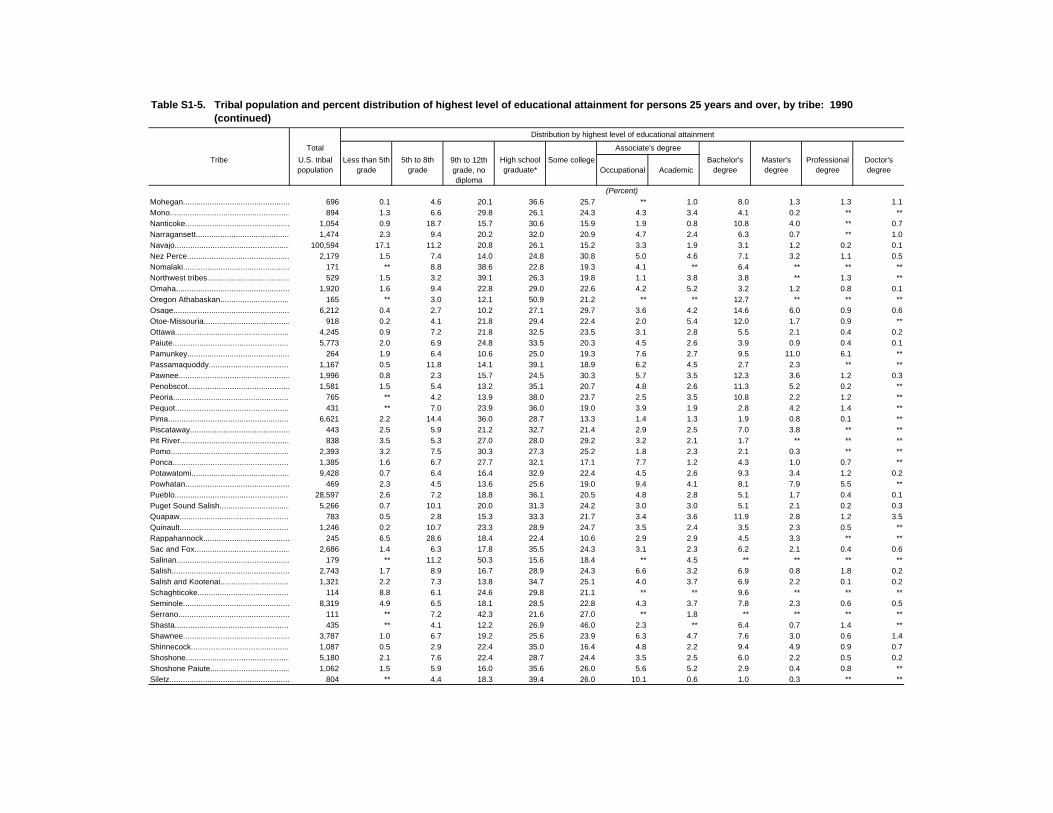
Distribution by highest level of educational attainment
Total Associate's degree
Tribe U.S. tribal population
Less than 5th grade
5th to 8th grade
9th to 12th grade, no diploma
High school graduate*
Some college Occupational Academic
Bachelor's degree
Master's degree
Professional degree
Doctor's degree
(Percent)Mohegan.............................................................. 696 0.1 4.6 20.1 36.6 25.7 ** 1.0 8.0 1.3 1.3 1.1Mono................................................................. 894 1.3 6.6 29.8 26.1 24.3 4.3 3.4 4.1 0.2 ** **Nanticoke............................................................ 1,054 0.9 18.7 15.7 30.6 15.9 1.9 0.8 10.8 4.0 ** 0.7Narragansett...................................................... 1,474 2.3 9.4 20.2 32.0 20.9 4.7 2.4 6.3 0.7 ** 1.0Navajo................................................................100,594 17.1 11.2 20.8 26.1 15.2 3.3 1.9 3.1 1.2 0.2 0.1Nez Perce..............................................................2,179 1.5 7.4 14.0 24.8 30.8 5.0 4.6 7.1 3.2 1.1 0.5Nomalaki................................................................ 171 ** 8.8 38.6 22.8 19.3 4.1 ** 6.4 ** ** **Northwest tribes.................................................. 529 1.5 3.2 39.1 26.3 19.8 1.1 3.8 3.8 ** 1.3 **Omaha.................................................................1,920 1.6 9.4 22.8 29.0 22.6 4.2 5.2 3.2 1.2 0.8 0.1Oregon Athabaskan.............................................. 165 ** 3.0 12.1 50.9 21.2 ** ** 12.7 ** ** **Osage............................................................... 6,212 0.4 2.7 10.2 27.1 29.7 3.6 4.2 14.6 6.0 0.9 0.6Otoe-Missouria.................................................. 918 0.2 4.1 21.8 29.4 22.4 2.0 5.4 12.0 1.7 0.9 **Ottawa...................................................................4,245 0.9 7.2 21.8 32.5 23.5 3.1 2.8 5.5 2.1 0.4 0.2Paiute...................................................................5,773 2.0 6.9 24.8 33.5 20.3 4.5 2.6 3.9 0.9 0.4 0.1Pamunkey......................................................... 264 1.9 6.4 10.6 25.0 19.3 7.6 2.7 9.5 11.0 6.1 **Passamaquoddy............................................. 1,167 0.5 11.8 14.1 39.1 18.9 6.2 4.5 2.7 2.3 ** **Pawnee...............................................................1,996 0.8 2.3 15.7 24.5 30.3 5.7 3.5 12.3 3.6 1.2 0.3Penobscot............................................................1,581 1.5 5.4 13.2 35.1 20.7 4.8 2.6 11.3 5.2 0.2 **Peoria................................................................ 765 ** 4.2 13.9 38.0 23.7 2.5 3.5 10.8 2.2 1.2 **Pequot............................................................... 431 ** 7.0 23.9 36.0 19.0 3.9 1.9 2.8 4.2 1.4 **Pima....................................................................6,621 2.2 14.4 36.0 28.7 13.3 1.4 1.3 1.9 0.8 0.1 **Piscataway........................................................... 443 2.5 5.9 21.2 32.7 21.4 2.9 2.5 7.0 3.8 ** **Pit River................................................................ 838 3.5 5.3 27.0 28.0 29.2 3.2 2.1 1.7 ** ** **Pomo......................................................................2,393 3.2 7.5 30.3 27.3 25.2 1.8 2.3 2.1 0.3 ** **Ponca...................................................................1,385 1.6 6.7 27.7 32.1 17.1 7.7 1.2 4.3 1.0 0.7 **Potawatomi..........................................................9,428 0.7 6.4 16.4 32.9 22.4 4.5 2.6 9.3 3.4 1.2 0.2Powhatan.......................................................... 469 2.3 4.5 13.6 25.6 19.0 9.4 4.1 8.1 7.9 5.5 **Pueblo.............................................................. 28,597 2.6 7.2 18.8 36.1 20.5 4.8 2.8 5.1 1.7 0.4 0.1Puget Sound Salish............................................ 5,266 0.7 10.1 20.0 31.3 24.2 3.0 3.0 5.1 2.1 0.2 0.3Quapaw.............................................................. 783 0.5 2.8 15.3 33.3 21.7 3.4 3.6 11.9 2.8 1.2 3.5Quinault................................................................1,246 0.2 10.7 23.3 28.9 24.7 3.5 2.4 3.5 2.3 0.5 **Rappahannock................................................... 245 6.5 28.6 18.4 22.4 10.6 2.9 2.9 4.5 3.3 ** **Sac and Fox....................................................... 2,686 1.4 6.3 17.8 35.5 24.3 3.1 2.3 6.2 2.1 0.4 0.6Salinan.................................................................. 179 ** 11.2 50.3 15.6 18.4 ** 4.5 ** ** ** **Salish................................................................. 2,743 1.7 8.9 16.7 28.9 24.3 6.6 3.2 6.9 0.8 1.8 0.2Salish and Kootenai.......................................... 1,321 2.2 7.3 13.8 34.7 25.1 4.0 3.7 6.9 2.2 0.1 0.2Schaghticoke....................................................... 114 8.8 6.1 24.6 29.8 21.1 ** ** 9.6 ** ** **Seminole............................................................. 8,319 4.9 6.5 18.1 28.5 22.8 4.3 3.7 7.8 2.3 0.6 0.5Serrano.................................................................. 111 ** 7.2 42.3 21.6 27.0 ** 1.8 ** ** ** **Shasta................................................................. 435 ** 4.1 12.2 26.9 46.0 2.3 ** 6.4 0.7 1.4 **Shawnee..............................................................3,787 1.0 6.7 19.2 25.6 23.9 6.3 4.7 7.6 3.0 0.6 1.4Shinnecock......................................................... 1,087 0.5 2.9 22.4 35.0 16.4 4.8 2.2 9.4 4.9 0.9 0.7Shoshone............................................................5,180 2.1 7.6 22.4 28.7 24.4 3.5 2.5 6.0 2.2 0.5 0.2Shoshone Paiute............................................... 1,062 1.5 5.9 16.0 35.6 26.0 5.6 5.2 2.9 0.4 0.8 **Siletz................................................................... 804 ** 4.4 18.3 39.4 26.0 10.1 0.6 1.0 0.3 ** **
Table S1-5. Tribal population and percent distribution of highest level of educational attainment for persons 25 years and over, by tribe: 1990 (continued)
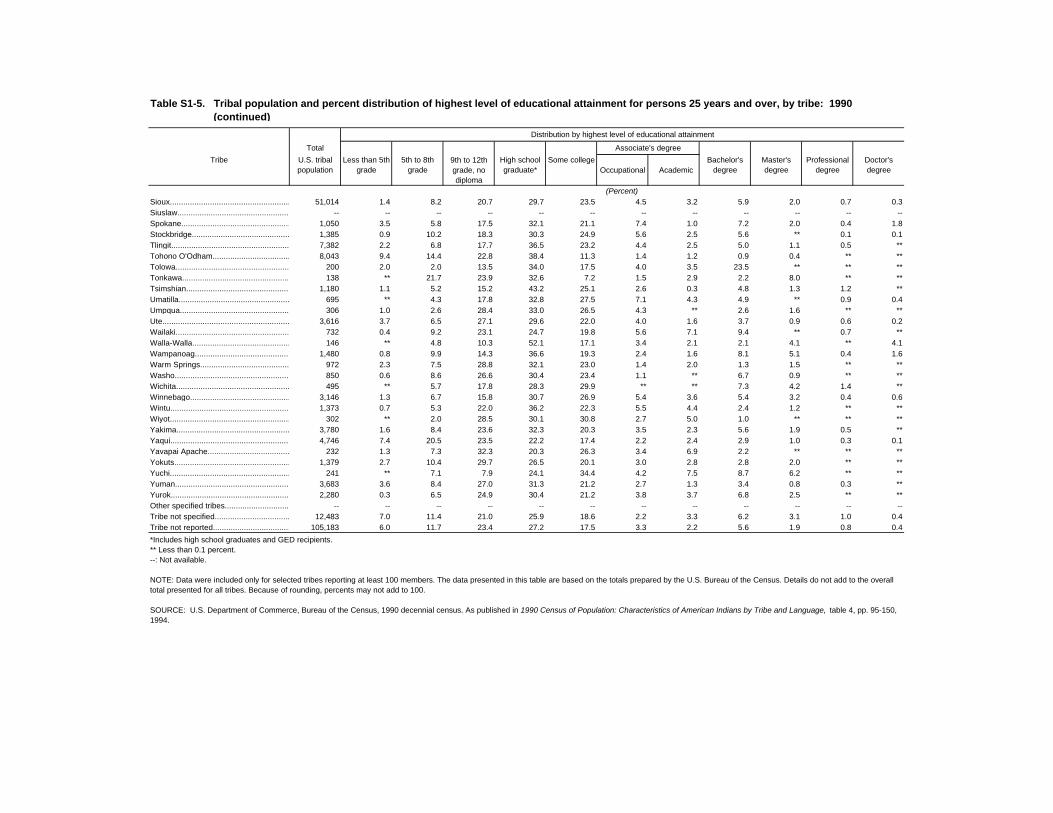
Distribution by highest level of educational attainment
Total Associate's degree
Tribe U.S. tribal population
Less than 5th grade
5th to 8th grade
9th to 12th grade, no diploma
High school graduate*
Some college Occupational Academic
Bachelor's degree
Master's degree
Professional degree
Doctor's degree
(Percent)Sioux...................................................................51,014 1.4 8.2 20.7 29.7 23.5 4.5 3.2 5.9 2.0 0.7 0.3Siuslaw............................................................. -- -- -- -- -- -- -- -- -- -- -- --Spokane.......................................................... 1,050 3.5 5.8 17.5 32.1 21.1 7.4 1.0 7.2 2.0 0.4 1.8Stockbridge........................................................ 1,385 0.9 10.2 18.3 30.3 24.9 5.6 2.5 5.6 ** 0.1 0.1Tlingit...................................................................7,382 2.2 6.8 17.7 36.5 23.2 4.4 2.5 5.0 1.1 0.5 **Tohono O'Odham.................................................8,043 9.4 14.4 22.8 38.4 11.3 1.4 1.2 0.9 0.4 ** **Tolowa................................................................ 200 2.0 2.0 13.5 34.0 17.5 4.0 3.5 23.5 ** ** **Tonkawa.......................................................... 138 ** 21.7 23.9 32.6 7.2 1.5 2.9 2.2 8.0 ** **Tsimshian............................................................1,180 1.1 5.2 15.2 43.2 25.1 2.6 0.3 4.8 1.3 1.2 **Umatilla.................................................................. 695 ** 4.3 17.8 32.8 27.5 7.1 4.3 4.9 ** 0.9 0.4Umpqua.............................................................. 306 1.0 2.6 28.4 33.0 26.5 4.3 ** 2.6 1.6 ** **Ute.......................................................................3,616 3.7 6.5 27.1 29.6 22.0 4.0 1.6 3.7 0.9 0.6 0.2Wailaki................................................................. 732 0.4 9.2 23.1 24.7 19.8 5.6 7.1 9.4 ** 0.7 **Walla-Walla........................................................... 146 ** 4.8 10.3 52.1 17.1 3.4 2.1 2.1 4.1 ** 4.1Wampanoag........................................................1,480 0.8 9.9 14.3 36.6 19.3 2.4 1.6 8.1 5.1 0.4 1.6Warm Springs................................................... 972 2.3 7.5 28.8 32.1 23.0 1.4 2.0 1.3 1.5 ** **Washo....................................................................850 0.6 8.6 26.6 30.4 23.4 1.1 ** 6.7 0.9 ** **Wichita...................................................................495 ** 5.7 17.8 28.3 29.9 ** ** 7.3 4.2 1.4 **Winnebago..........................................................3,146 1.3 6.7 15.8 30.7 26.9 5.4 3.6 5.4 3.2 0.4 0.6Wintu....................................................................1,373 0.7 5.3 22.0 36.2 22.3 5.5 4.4 2.4 1.2 ** **Wiyot.......................................................................302 ** 2.0 28.5 30.1 30.8 2.7 5.0 1.0 ** ** **Yakima.................................................................3,780 1.6 8.4 23.6 32.3 20.3 3.5 2.3 5.6 1.9 0.5 **Yaqui......................................................................4,746 7.4 20.5 23.5 22.2 17.4 2.2 2.4 2.9 1.0 0.3 0.1Yavapai Apache..................................................... 232 1.3 7.3 32.3 20.3 26.3 3.4 6.9 2.2 ** ** **Yokuts...................................................................1,379 2.7 10.4 29.7 26.5 20.1 3.0 2.8 2.8 2.0 ** **Yuchi..................................................................... 241 ** 7.1 7.9 24.1 34.4 4.2 7.5 8.7 6.2 ** **Yuman..................................................................3,683 3.6 8.4 27.0 31.3 21.2 2.7 1.3 3.4 0.8 0.3 **Yurok................................................................. 2,280 0.3 6.5 24.9 30.4 21.2 3.8 3.7 6.8 2.5 ** **Other specified tribes........................................... -- -- -- -- -- -- -- -- -- -- -- --Tribe not specified..............................................12,483 7.0 11.4 21.0 25.9 18.6 2.2 3.3 6.2 3.1 1.0 0.4Tribe not reported.................................................105,183 6.0 11.7 23.4 27.2 17.5 3.3 2.2 5.6 1.9 0.8 0.4
*Includes high school graduates and GED recipients.** Less than 0.1 percent.--: Not available.
NOTE: Data were included only for selected tribes reporting at least 100 members. The data presented in this table are based on the totals prepared by the U.S. Bureau of the Census. Details do not add to the overall total presented for all tribes. Because of rounding, percents may not add to 100.
SOURCE: U.S. Department of Commerce, Bureau of the Census, 1990 decennial census. As published in 1990 Census of Population: Characteristics of American Indians by Tribe and Language, table 4, pp. 95-150, 1994.
Table S1-5. Tribal population and percent distribution of highest level of educational attainment for persons 25 years and over, by tribe: 1990 (continued)
2American Indian andAlaska Native Access toPostsecondary Education“The history of educating American Indian and Alaska Nativeyouth dates back to a time when every child was identified asgifted and talented. All members of the community wererecognized and trained as teachers. Respected elders whounderstood the needs of the community administered theprocess to pass on vital knowledge from one generation to thenext so that the youth might prosper and lead productive adultlives. It was a time when the community conveyed the highesthopes and aspirations to all the youth. That is our vision ofeducating American Indians and Alaska Natives today.”
1997 Vision StatementCollege of Education
Washington State University
Access
2-1
ithin the last 25 to 30 years, the Indian self-determination and self-
governance movement has made measurable progress to increase the
number of Native American1 students who enter into and graduate from
postsecondary institutions.2 These improvements have come as a result
of national efforts to diversify colleges and universities,3 and specific
initiatives intended to serve the Native community.4 At the local level,
specific local educational initiatives have resulted in Native communities
exercising more influence over the mission and scope of the educational
system and, in union with the higher education community, to advance
the postsecondary recruitment and retention of American Indian and
Alaska Native students.
To evaluate these collaborations, it is important to measure the success
of American Indian and Alaska Native students in enrolling and
achieving in the postsecondary arena and to establish a benchmark for
monitoring their future progress. This chapter examines the current
status of Native American access to higher education using data on such
precollege student attributes as college admission test scores, core
curriculum course completion, college admissions criteria, and
undergraduate student risk factors. It is the first in a series of chapters
that presents an overview of Native American participation and
achievement in postsecondary education.
1The terms “Native Americans” and “American Indian and Alaska Native” are used interchangeably throughout this chapter.
2See chapters 2 and 3 for additional details.
3C.I. Bennett, Research on Racial Issues in American Higher Education, 1995; M.J. Justiz (Ed.), Minorities in Higher Education,1994; R.C. Richardson, Jr. and E.F. Skinner, Achieving Quality and Diversity: Universities in a Multicultural Society, 1990; andC.L. Shom, Minority Access to Higher Education: “The Precollegiate Response to Minority Economic and Social Enhancement,”Journal of College Admission, Volume 132, pp. 16-20, 1991.
4Indian Nations At Risk Task Force, “Indian Nations at Risk, Summary of Issues and Recommendations from Regional Hearings,”Journal of American Indian Education, 30(2), pp. 1-15, 1990; and Native Education Initiative of the Regional Educational Labs,Promising Programs in Native Education, 1995.
W
2-2
HIGHLIGHTS
# High school graduation rates for American Indian and Alaska Nativestudents increased from 56 percent in 1980 to 66 percent in 1990.Overall, rates increased from 67 percent to 75 percent (figure 2-1).
# In 1993-94, 86 percent of seniors enrolled in Bureau of Indian Affairs(BIA)/tribal schools graduated (figure 2-2).
# Among high school seniors attending BIA/tribal schools in 1993-94,47 percent applied to college (figure 2-3).
# Completion of a recommended college preparatory curriculum byNative American high school graduates increased from 6 percent to31 percent from 1982 to 1992. Among all high school graduates,completions in that same period rose from 13 percent to 47 percent(figure 2-4).
# Between 1976 and 1995, American Indian median SAT scoresincreased by 42 points. Overall, median ACT scores increased byonly 7 points (figure 2-5).
# In 1992, most Native American college-bound high school graduatesfailed to meet all five criteria used to assess student competitivenessin the college admissions process (table 2-2).
# Among Native American undergraduates, 35 percent faced four ormore risk factors that threatened their ability to enroll in apostsecondary institution and ultimately complete a degree(summary table S2-1).
SOURCES OF DATA
The following data sources are used in this chapter: (1) the
NCES “Schools and Staffing Survey” (SASS); (2) the College
Entrance Examination Board’s Standard Admission Test
(SAT) scores; (3) the American College Testing Program’s
American College Test (ACT) scores; (4) the NCES National
Education Longitudinal Study of 1988 (NELS:88): Second
Follow-up conducted in 1992; and (5) the NCES National Postsecondary
Student Aid Study (NPSAS:93). In addition, data were also taken from the
NCES’s High School and Beyond Transcript Study, 1990 NAEP High
Access
2-3
School Transcript Studies, and the U.S. Department of Commerce, Bureau
of the Census, 1990 Decennial Census.
Schools and Staffing Survey. The Schools and Staffing Survey (SASS) is
a periodic survey of school districts, schools, principals, teachers, and
students that is sponsored by NCES. Data are collected on school and
teacher characteristics, school operations, programs and policies, teacher
supply and demand, and educator attitudes and opinions about
education and their schools. The data were analyzed in terms of three
"Indian school types." BIA/tribal schools are those which are funded by
the BIA and operated by that agency or by a tribal organization under
BIA grant or contract. High Indian enrollment schools are public schools
where American Indian and Alaska Native students compose at least 25
percent of the enrollment. Low Indian enrollment schools are public
schools where American Indian and Alaska Native students compose
less than 25 percent of the enrollment.
The survey was first conducted in 1987-88. Two additional SASS cycles
were completed in 1990-91 and 1993-94. During the 1990-91 cycle, an
Indian supplement was added that sampled schools established to serve
Indian students as well as public schools enrolling high percentages of
Indian students. During the 1993-94 cycle, separate data collection
instruments were added for Indian school principals and Indian school
teachers. A student records questionnaire was also added. The 1993-94
survey cycle included a sample of 5,095 public school students and 602
BIA/tribal school students.
College standardized admission examinations. The College Entrance
Examination Board and the American College Testing Program
administer the SAT and ACT, respectively, to potential college applicants.
These test results are used by many colleges to evaluate potential
students for admission. SAT scores range from 200 to 800 on both a
verbal section and a mathematics section. Thus, total scores range from
400 to 1,600. On the ACT, students receive a score from 1 to 36. Test
results are aggregated and reported by racial/ethnic group for both
examinations.
The National Education Longitudinal Study of 1988 (NELS:88).
NELS:88 follows a cohort of eighth-grade students as they enter high
school, enroll in postsecondary education, and enter the labor market. It
2-4
examines how school policies, teacher activities, and family involvement
affect student outcomes such as academic achievement and persistence.
The second followup study was conducted in 1992. The survey included
students, dropouts, parents, teachers, and school principals. Data on
student transcripts, course offerings, and enrollment were also collected.
The National Postsecondary Student Aid Survey (NPSAS). NPSAS is a
comprehensive study of how students and their families finance
postsecondary education. These students attend institutions at all levels
including less-than-2-year schools, 2- to 3-year schools, 4-year colleges,
and major universities. As the first comprehensive financial aid
database, NPSAS includes nationally representative samples of
undergraduates, graduates, and first-professional students. Study
participants include both aided and nonaided students (and their
families). In addition to collecting data on sources of aid, NPSAS collects
detailed information on student and family characteristics.
The survey was first conducted in 1986-87. Two additional NPSAS cycles
were completed in 1989-90 and 1992-93. The 1992-93 survey included
a stratified sample of approximately 66,000 students from about 1,100
institutions. The majority of these students (52,000) were
undergraduates. The response rate for the 1992-93 survey was about
85 percent.
ACCESS TO POSTSECONDARY EDUCATION
Before enrolling in institutions of higher education
(IHEs), students usually must complete high school (or
earn a General Equivalency Diploma (GED)) and take
a standardized entrance exam such as the SAT or the ACT. Scores on
these tests, as well as students’ coursework, GPA, and extracurricular
activities, are then examined by college admissions staffs. Although
Native Americans continue to lag behind national averages in each of
these measures, they have made improvements in many areas since the
1970s.
Access
2-5
HIGH SCHOOL GRADUATION RATES
This section examines overall high school graduation rates as
well as graduation rates by the type of school the student
attended. It also looks at the college application rates of high
school seniors.
Overall graduation rates. The percentage of American Indian and
Alaska Native students completing their high school education rose from
56 percent in 1980 to 66 percent in 1990 (figure 2-1). During the same
time period, the percentage of high school graduates in the total
population increased from 67 percent to 75 percent. In 1990, 39
percent of the American Indian, Eskimo, and Aleut population was under
the age of 20 compared with 29 percent of the total U.S. population.5
This increase in high school graduation rates, coupled with current
Native American demographics, may be an indicator that more American
Indian and Alaska Native students will be candidates for postsecondary
enrollment in the ensuing decades.
5 U.S. Department of Commerce, Bureau of the Census, General Population Characteristics: 1990.
l
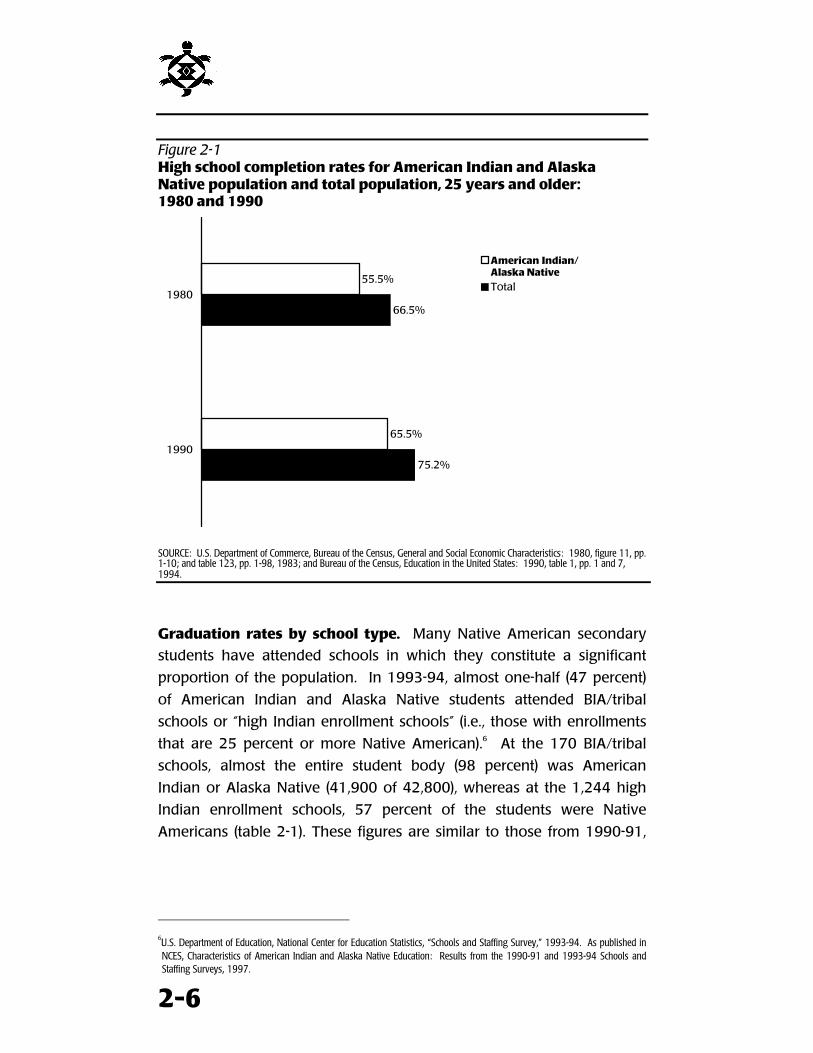
2-6
Figure 2-1High school completion rates for American Indian and AlaskaNative population and total population, 25 years and older:1980 and 1990
75.2%
66.5%
65.5%
55.5%
1990
1980
American Indian/Alaska NativeTotal
SOURCE: U.S. Department of Commerce, Bureau of the Census, General and Social Economic Characteristics: 1980, figure 11, pp.1-10; and table 123, pp. 1-98, 1983; and Bureau of the Census, Education in the United States: 1990, table 1, pp. 1 and 7,1994.
Graduation rates by school type. Many Native American secondary
students have attended schools in which they constitute a significant
proportion of the population. In 1993-94, almost one-half (47 percent)
of American Indian and Alaska Native students attended BIA/tribal
schools or “high Indian enrollment schools” (i.e., those with enrollments
that are 25 percent or more Native American).6 At the 170 BIA/tribal
schools, almost the entire student body (98 percent) was American
Indian or Alaska Native (41,900 of 42,800), whereas at the 1,244 high
Indian enrollment schools, 57 percent of the students were Native
Americans (table 2-1). These figures are similar to those from 1990-91,
6U.S. Department of Education, National Center for Education Statistics, “Schools and Staffing Survey,” 1993-94. As published inNCES, Characteristics of American Indian and Alaska Native Education: Results from the 1990-91 and 1993-94 Schools andStaffing Surveys, 1997.
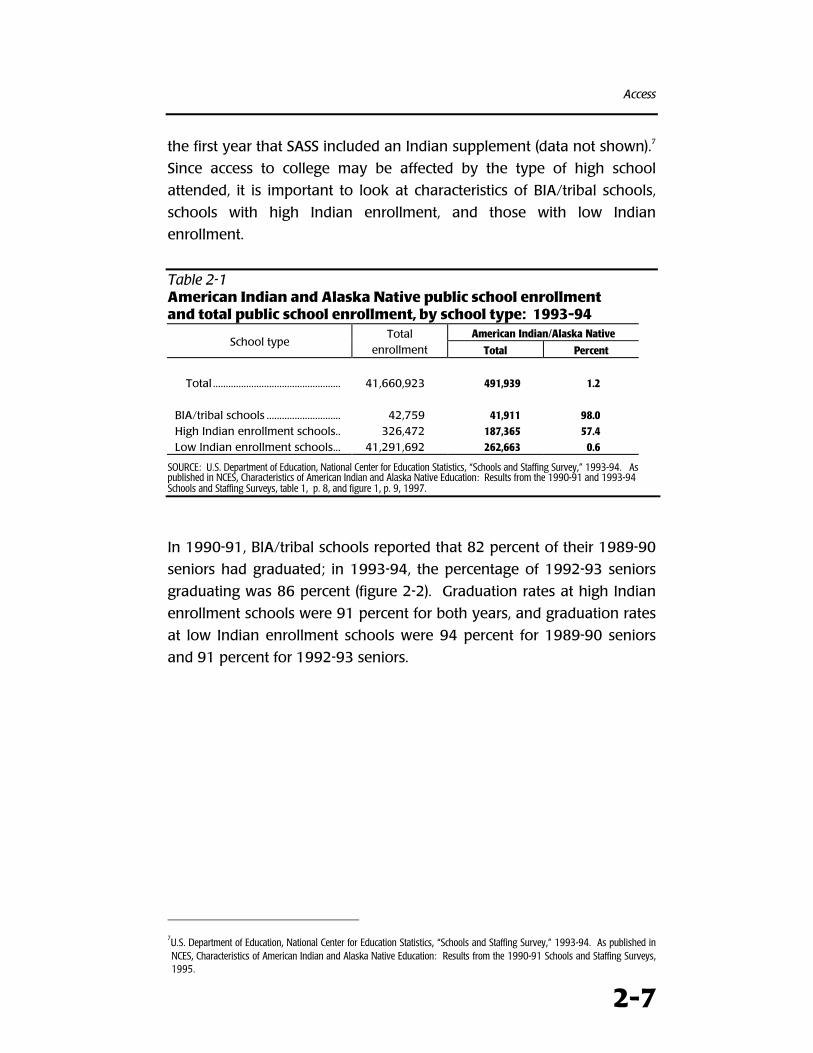
Access
2-7
the first year that SASS included an Indian supplement (data not shown).7
Since access to college may be affected by the type of high school
attended, it is important to look at characteristics of BIA/tribal schools,
schools with high Indian enrollment, and those with low Indian
enrollment.
Table 2-1American Indian and Alaska Native public school enrollmentand total public school enrollment, by school type: 1993-94
American Indian/Alaska NativeSchool type
Totalenrollment Total Percent
Total .................................................. 41,660,923 491,939 1.2
BIA/tribal schools ............................. 42,759 41,911 98.0High Indian enrollment schools.. 326,472 187,365 57.4Low Indian enrollment schools... 41,291,692 262,663 0.6
SOURCE: U.S. Department of Education, National Center for Education Statistics, “Schools and Staffing Survey,” 1993-94. Aspublished in NCES, Characteristics of American Indian and Alaska Native Education: Results from the 1990-91 and 1993-94Schools and Staffing Surveys, table 1, p. 8, and figure 1, p. 9, 1997.
In 1990-91, BIA/tribal schools reported that 82 percent of their 1989-90
seniors had graduated; in 1993-94, the percentage of 1992-93 seniors
graduating was 86 percent (figure 2-2). Graduation rates at high Indian
enrollment schools were 91 percent for both years, and graduation rates
at low Indian enrollment schools were 94 percent for 1989-90 seniors
and 91 percent for 1992-93 seniors.
7U.S. Department of Education, National Center for Education Statistics, “Schools and Staffing Survey,” 1993-94. As published inNCES, Characteristics of American Indian and Alaska Native Education: Results from the 1990-91 Schools and Staffing Surveys,1995.
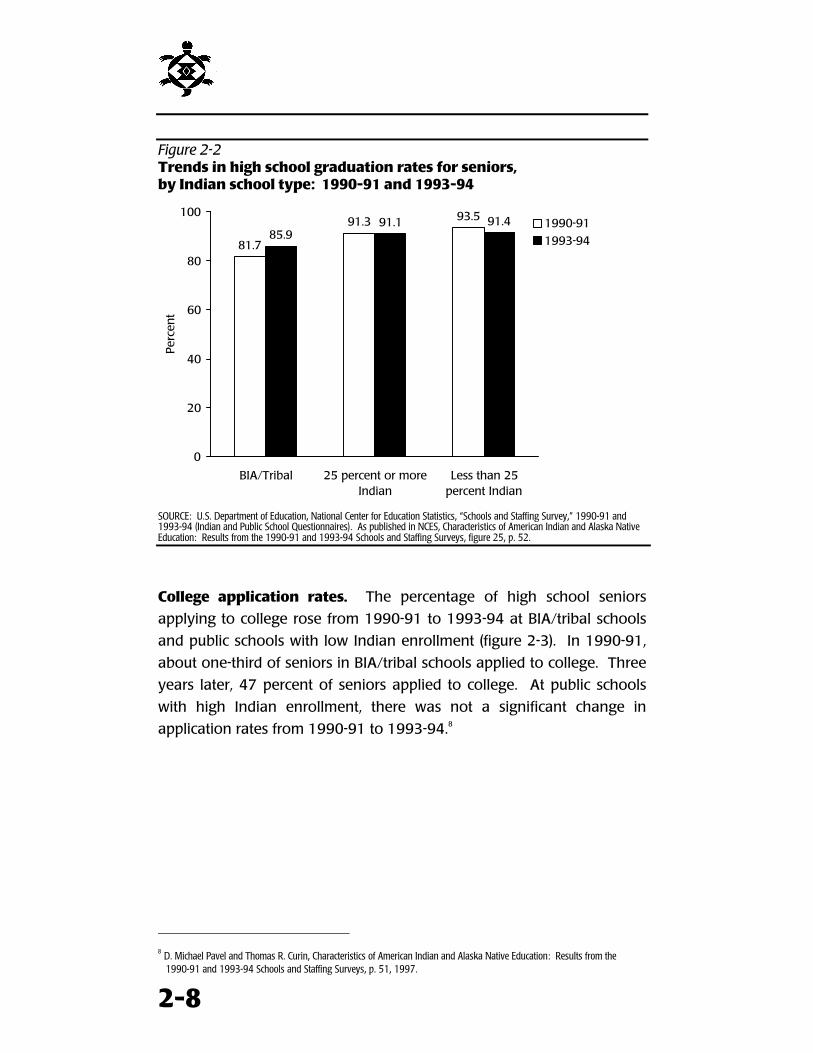
2-8
Figure 2-2Trends in high school graduation rates for seniors,by Indian school type: 1990-91 and 1993-94
81.7
91.3 93.5
85.991.1 91.4
0
20
40
60
80
100
BIA/Tribal 25 percent or moreIndian
Less than 25percent Indian
Perc
ent
1990-91
1993-94
SOURCE: U.S. Department of Education, National Center for Education Statistics, “Schools and Staffing Survey,” 1990-91 and1993-94 (Indian and Public School Questionnaires). As published in NCES, Characteristics of American Indian and Alaska NativeEducation: Results from the 1990-91 and 1993-94 Schools and Staffing Surveys, figure 25, p. 52.
College application rates. The percentage of high school seniors
applying to college rose from 1990-91 to 1993-94 at BIA/tribal schools
and public schools with low Indian enrollment (figure 2-3). In 1990-91,
about one-third of seniors in BIA/tribal schools applied to college. Three
years later, 47 percent of seniors applied to college. At public schools
with high Indian enrollment, there was not a significant change in
application rates from 1990-91 to 1993-94.8
8 D. Michael Pavel and Thomas R. Curin, Characteristics of American Indian and Alaska Native Education: Results from the
1990-91 and 1993-94 Schools and Staffing Surveys, p. 51, 1997.
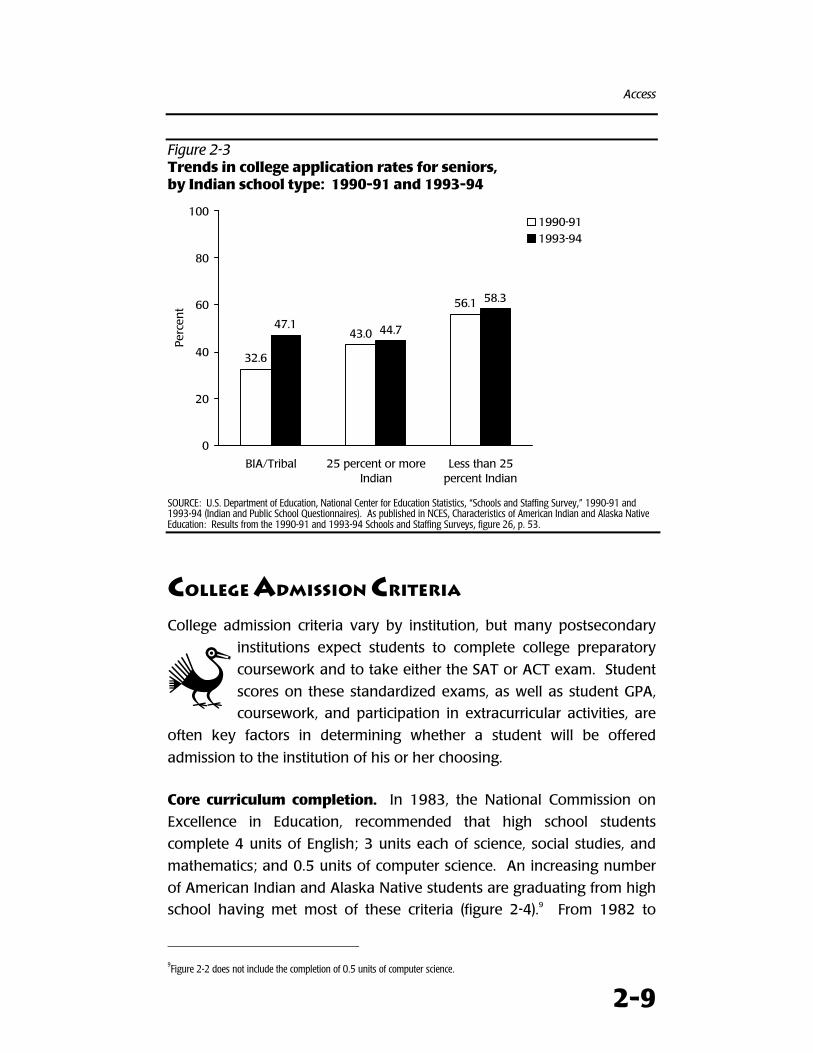
Access
2-9
Figure 2-3Trends in college application rates for seniors,by Indian school type: 1990-91 and 1993-94
32.6
43.0
56.1
47.1 44.7
58.3
0
20
40
60
80
100
BIA/Tribal 25 percent or moreIndian
Less than 25percent Indian
Perc
ent
1990-911993-94
SOURCE: U.S. Department of Education, National Center for Education Statistics, “Schools and Staffing Survey,” 1990-91 and1993-94 (Indian and Public School Questionnaires). As published in NCES, Characteristics of American Indian and Alaska NativeEducation: Results from the 1990-91 and 1993-94 Schools and Staffing Surveys, figure 26, p. 53.
COLLEGE ADMISSION CRITERIA
College admission criteria vary by institution, but many postsecondary
institutions expect students to complete college preparatory
coursework and to take either the SAT or ACT exam. Student
scores on these standardized exams, as well as student GPA,
coursework, and participation in extracurricular activities, are
often key factors in determining whether a student will be offered
admission to the institution of his or her choosing.
Core curriculum completion. In 1983, the National Commission on
Excellence in Education, recommended that high school students
complete 4 units of English; 3 units each of science, social studies, and
mathematics; and 0.5 units of computer science. An increasing number
of American Indian and Alaska Native students are graduating from high
school having met most of these criteria (figure 2-4).9 From 1982 to
9Figure 2-2 does not include the completion of 0.5 units of computer science.
W
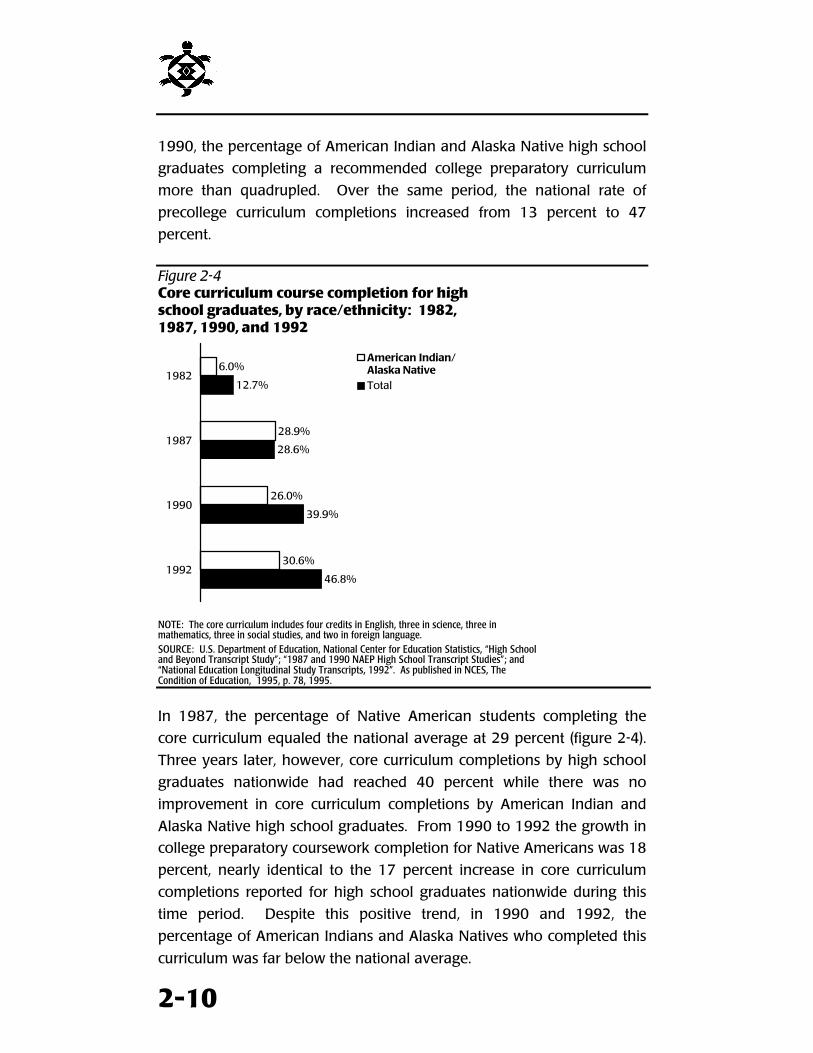
2-10
1990, the percentage of American Indian and Alaska Native high school
graduates completing a recommended college preparatory curriculum
more than quadrupled. Over the same period, the national rate of
precollege curriculum completions increased from 13 percent to 47
percent.
Figure 2-4Core curriculum course completion for highschool graduates, by race/ethnicity: 1982,1987, 1990, and 1992
46.8%
39.9%
28.6%
12.7%
30.6%
26.0%
28.9%
6.0%
1992
1990
1987
1982
American Indian/Alaska NativeTotal
NOTE: The core curriculum includes four credits in English, three in science, three inmathematics, three in social studies, and two in foreign language.SOURCE: U.S. Department of Education, National Center for Education Statistics, “High Schooland Beyond Transcript Study”; “1987 and 1990 NAEP High School Transcript Studies”; and“National Education Longitudinal Study Transcripts, 1992”. As published in NCES, TheCondition of Education, 1995, p. 78, 1995.
In 1987, the percentage of Native American students completing the
core curriculum equaled the national average at 29 percent (figure 2-4).
Three years later, however, core curriculum completions by high school
graduates nationwide had reached 40 percent while there was no
improvement in core curriculum completions by American Indian and
Alaska Native high school graduates. From 1990 to 1992 the growth in
college preparatory coursework completion for Native Americans was 18
percent, nearly identical to the 17 percent increase in core curriculum
completions reported for high school graduates nationwide during this
time period. Despite this positive trend, in 1990 and 1992, the
percentage of American Indians and Alaska Natives who completed this
curriculum was far below the national average.
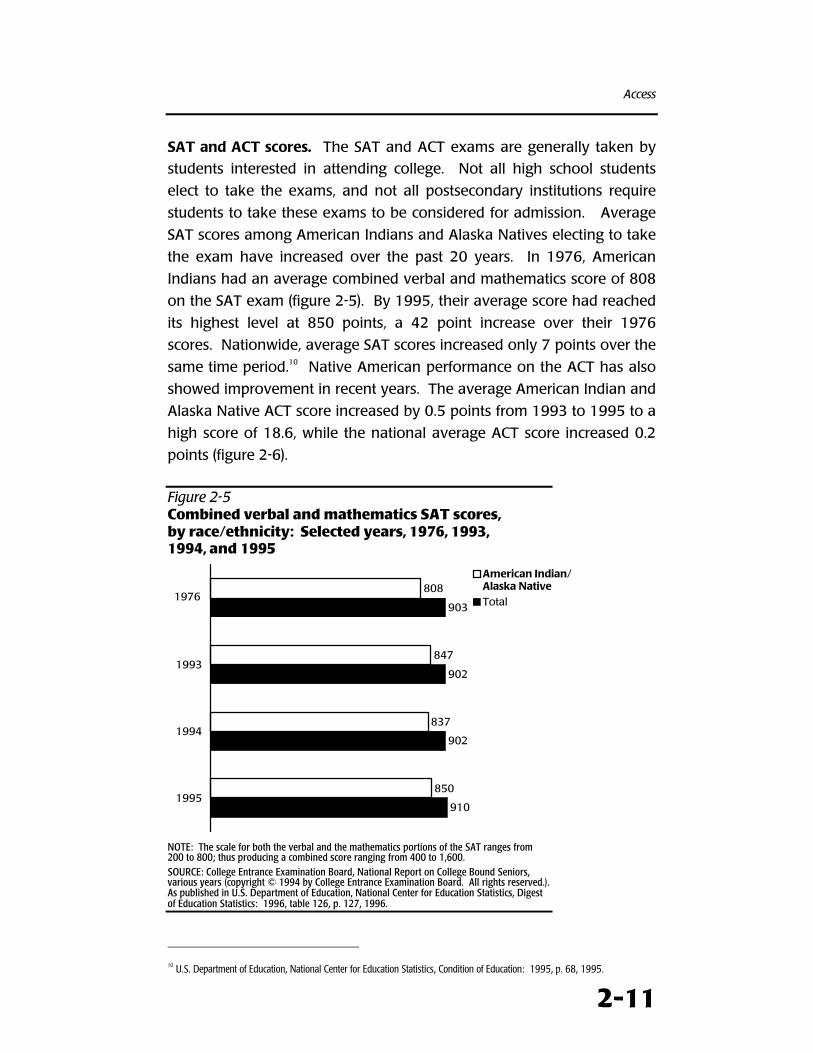
Access
2-11
SAT and ACT scores. The SAT and ACT exams are generally taken by
students interested in attending college. Not all high school students
elect to take the exams, and not all postsecondary institutions require
students to take these exams to be considered for admission. Average
SAT scores among American Indians and Alaska Natives electing to take
the exam have increased over the past 20 years. In 1976, American
Indians had an average combined verbal and mathematics score of 808
on the SAT exam (figure 2-5). By 1995, their average score had reached
its highest level at 850 points, a 42 point increase over their 1976
scores. Nationwide, average SAT scores increased only 7 points over the
same time period.10 Native American performance on the ACT has also
showed improvement in recent years. The average American Indian and
Alaska Native ACT score increased by 0.5 points from 1993 to 1995 to a
high score of 18.6, while the national average ACT score increased 0.2
points (figure 2-6).
Figure 2-5Combined verbal and mathematics SAT scores,by race/ethnicity: Selected years, 1976, 1993,1994, and 1995
910
902
902
903
850
837
847
808
1995
1994
1993
American Indian/Alaska NativeTotal1976
NOTE: The scale for both the verbal and the mathematics portions of the SAT ranges from200 to 800; thus producing a combined score ranging from 400 to 1,600.SOURCE: College Entrance Examination Board, National Report on College Bound Seniors,various years (copyright © 1994 by College Entrance Examination Board. All rights reserved.).As published in U.S. Department of Education, National Center for Education Statistics, Digestof Education Statistics: 1996, table 126, p. 127, 1996.
10 U.S. Department of Education, National Center for Education Statistics, Condition of Education: 1995, p. 68, 1995.
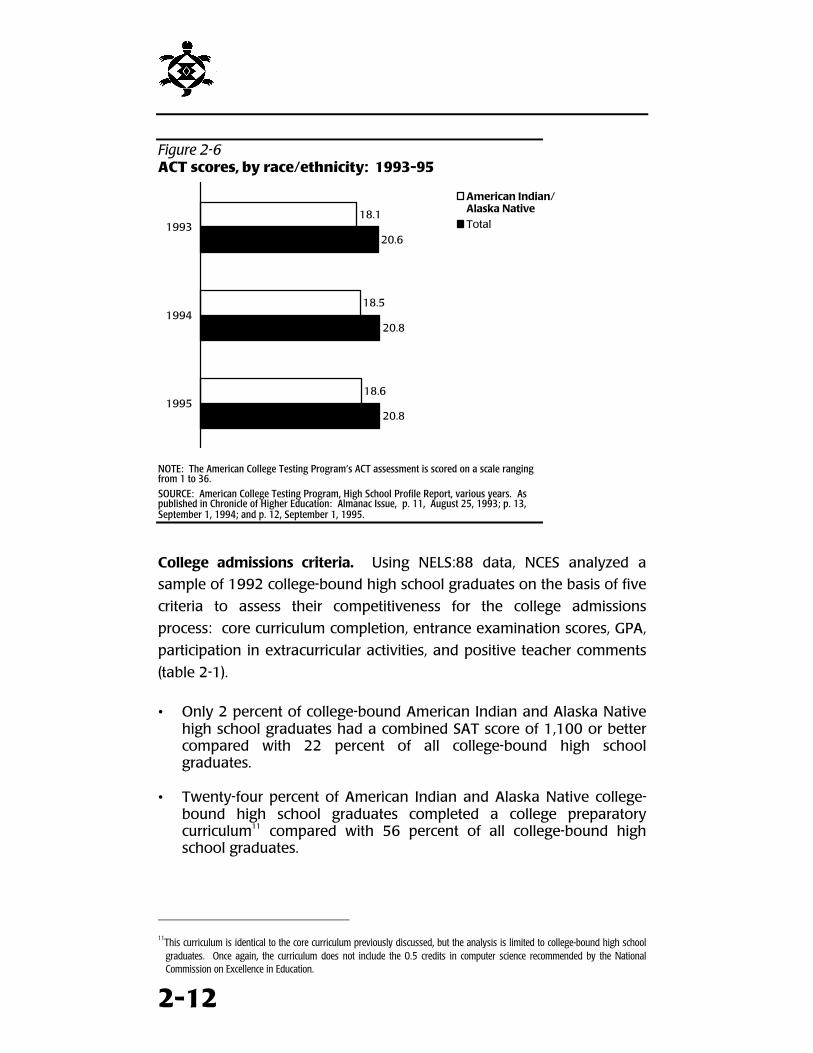
2-12
Figure 2-6ACT scores, by race/ethnicity: 1993-95
20.8
20.8
20.6
18.6
18.5
18.1
1995
1994
1993
American Indian/Alaska NativeTotal
NOTE: The American College Testing Program’s ACT assessment is scored on a scale rangingfrom 1 to 36.SOURCE: American College Testing Program, High School Profile Report, various years. Aspublished in Chronicle of Higher Education: Almanac Issue, p. 11, August 25, 1993; p. 13,September 1, 1994; and p. 12, September 1, 1995.
College admissions criteria. Using NELS:88 data, NCES analyzed a
sample of 1992 college-bound high school graduates on the basis of five
criteria to assess their competitiveness for the college admissions
process: core curriculum completion, entrance examination scores, GPA,
participation in extracurricular activities, and positive teacher comments
(table 2-1).
• Only 2 percent of college-bound American Indian and Alaska Nativehigh school graduates had a combined SAT score of 1,100 or bettercompared with 22 percent of all college-bound high schoolgraduates.
• Twenty-four percent of American Indian and Alaska Native college-bound high school graduates completed a college preparatorycurriculum11 compared with 56 percent of all college-bound highschool graduates.
11
This curriculum is identical to the core curriculum previously discussed, but the analysis is limited to college-bound high schoolgraduates. Once again, the curriculum does not include the 0.5 credits in computer science recommended by the NationalCommission on Excellence in Education.
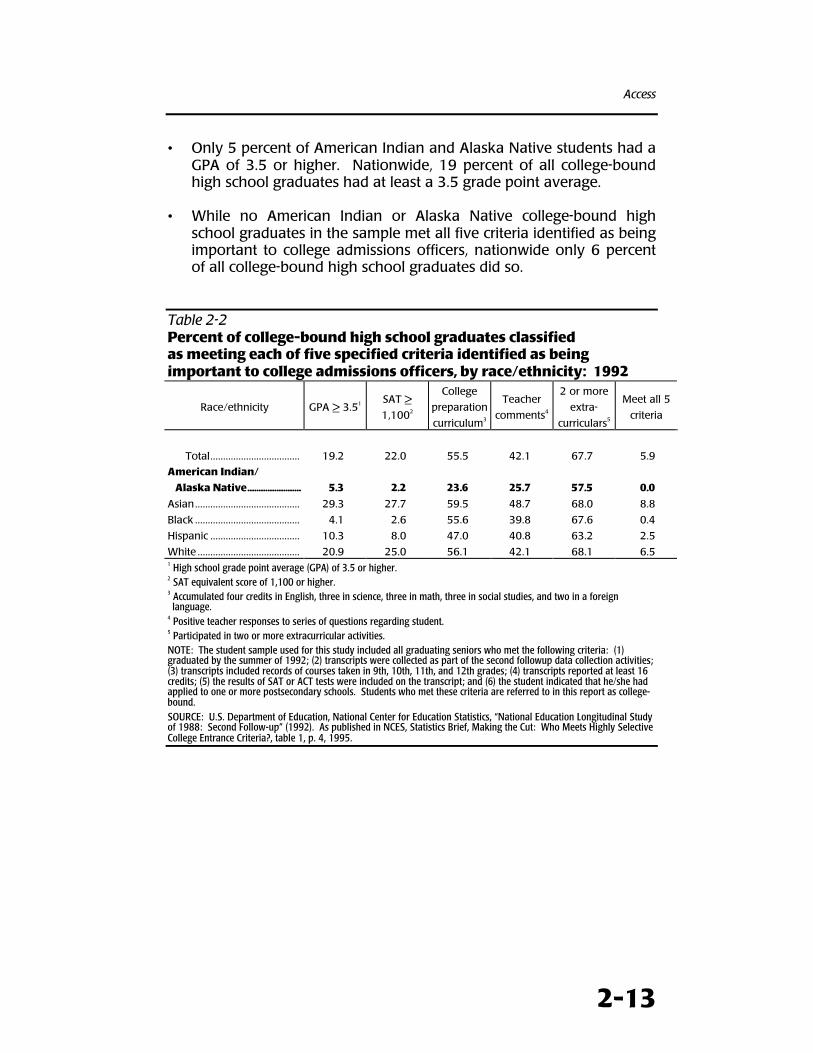
Access
2-13
• Only 5 percent of American Indian and Alaska Native students had aGPA of 3.5 or higher. Nationwide, 19 percent of all college-boundhigh school graduates had at least a 3.5 grade point average.
• While no American Indian or Alaska Native college-bound highschool graduates in the sample met all five criteria identified as beingimportant to college admissions officers, nationwide only 6 percentof all college-bound high school graduates did so.
Table 2-2Percent of college-bound high school graduates classifiedas meeting each of five specified criteria identified as beingimportant to college admissions officers, by race/ethnicity: 1992
Race/ethnicity GPA > 3.51 SAT >
1,1002
College
preparation
curriculum3
Teacher
comments4
2 or more
extra-
curriculars5
Meet all 5
criteria
Total................................... 19.2 22.0 55.5 42.1 67.7 5.9
American Indian/
Alaska Native........................ 5.3 2.2 23.6 25.7 57.5 0.0
Asian......................................... 29.3 27.7 59.5 48.7 68.0 8.8
Black ......................................... 4.1 2.6 55.6 39.8 67.6 0.4
Hispanic ................................... 10.3 8.0 47.0 40.8 63.2 2.5
White ........................................ 20.9 25.0 56.1 42.1 68.1 6.51 High school grade point average (GPA) of 3.5 or higher.2 SAT equivalent score of 1,100 or higher.3 Accumulated four credits in English, three in science, three in math, three in social studies, and two in a foreignlanguage.
4 Positive teacher responses to series of questions regarding student.5 Participated in two or more extracurricular activities.NOTE: The student sample used for this study included all graduating seniors who met the following criteria: (1)graduated by the summer of 1992; (2) transcripts were collected as part of the second followup data collection activities;(3) transcripts included records of courses taken in 9th, 10th, 11th, and 12th grades; (4) transcripts reported at least 16credits; (5) the results of SAT or ACT tests were included on the transcript; and (6) the student indicated that he/she hadapplied to one or more postsecondary schools. Students who met these criteria are referred to in this report as college-bound.SOURCE: U.S. Department of Education, National Center for Education Statistics, “National Education Longitudinal Studyof 1988: Second Follow-up” (1992). As published in NCES, Statistics Brief, Making the Cut: Who Meets Highly SelectiveCollege Entrance Criteria?, table 1, p. 4, 1995.
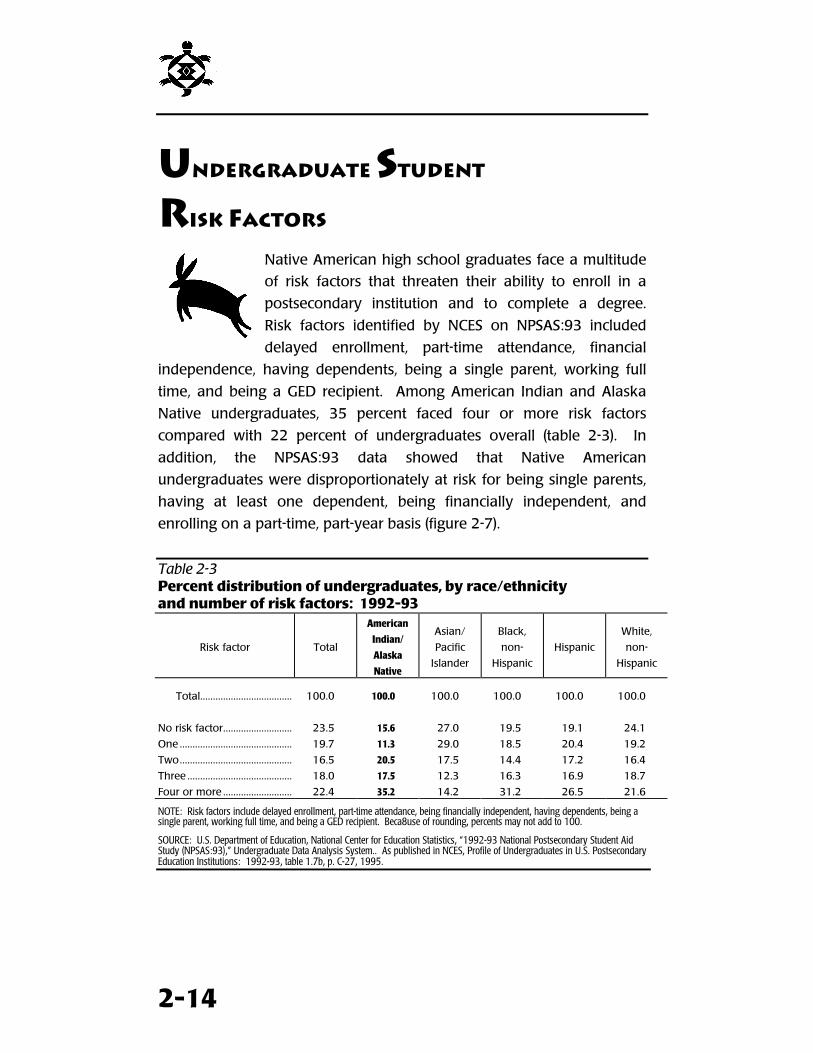
2-14
UNDERGRADUATE STUDENT
RISK FACTORS
Native American high school graduates face a multitude
of risk factors that threaten their ability to enroll in a
postsecondary institution and to complete a degree.
Risk factors identified by NCES on NPSAS:93 included
delayed enrollment, part-time attendance, financial
independence, having dependents, being a single parent, working full
time, and being a GED recipient. Among American Indian and Alaska
Native undergraduates, 35 percent faced four or more risk factors
compared with 22 percent of undergraduates overall (table 2-3). In
addition, the NPSAS:93 data showed that Native American
undergraduates were disproportionately at risk for being single parents,
having at least one dependent, being financially independent, and
enrolling on a part-time, part-year basis (figure 2-7).
Table 2-3Percent distribution of undergraduates, by race/ethnicityand number of risk factors: 1992-93
Risk factor Total
American
Indian/
Alaska
Native
Asian/
Pacific
Islander
Black,
non-
Hispanic
Hispanic
White,
non-
Hispanic
Total.................................... 100.0 100.0 100.0 100.0 100.0 100.0
No risk factor........................... 23.5 15.6 27.0 19.5 19.1 24.1
One ............................................ 19.7 11.3 29.0 18.5 20.4 19.2
Two............................................ 16.5 20.5 17.5 14.4 17.2 16.4
Three ......................................... 18.0 17.5 12.3 16.3 16.9 18.7
Four or more ........................... 22.4 35.2 14.2 31.2 26.5 21.6
NOTE: Risk factors include delayed enrollment, part-time attendance, being financially independent, having dependents, being asingle parent, working full time, and being a GED recipient. Beca8use of rounding, percents may not add to 100.
SOURCE: U.S. Department of Education, National Center for Education Statistics, “1992-93 National Postsecondary Student AidStudy (NPSAS:93),” Undergraduate Data Analysis System.. As published in NCES, Profile of Undergraduates in U.S. PostsecondaryEducation Institutions: 1992-93, table 1.7b, p. C-27, 1995.
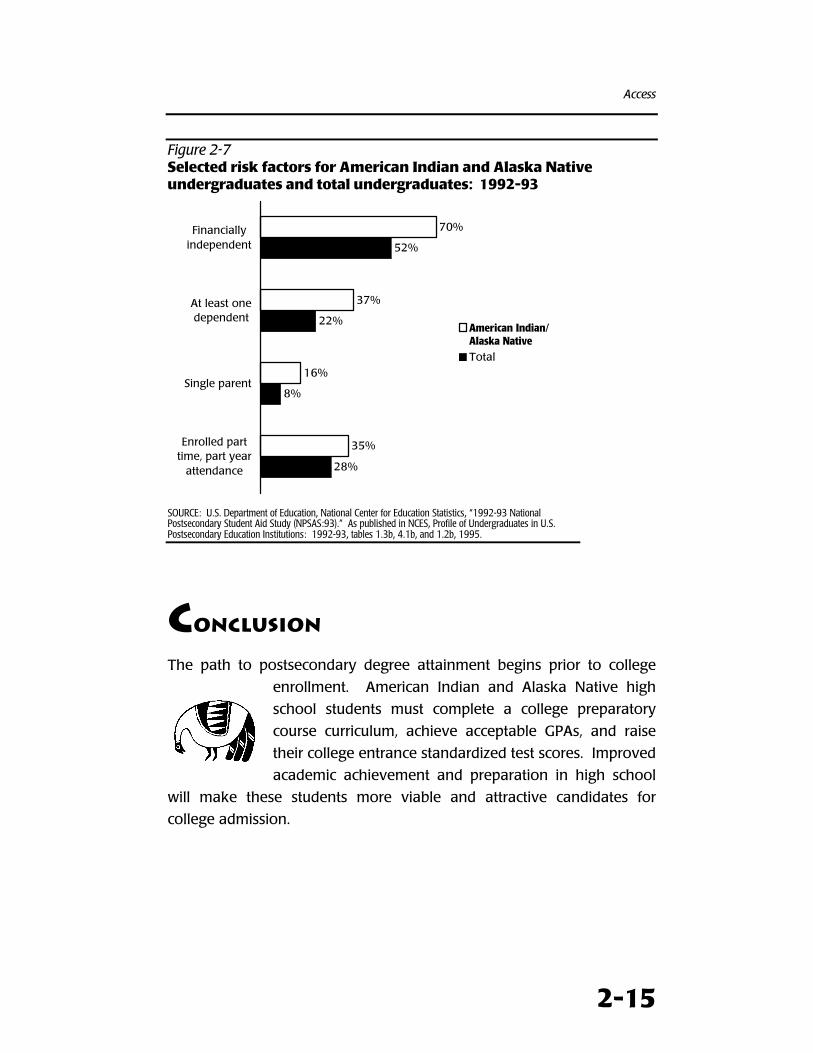
Access
2-15
Figure 2-7Selected risk factors for American Indian and Alaska Nativeundergraduates and total undergraduates: 1992-93
28%
8%
22%
52%
35%
16%
37%
70%
Enrolled parttime, part year
attendance
Single parent
At least onedependent
Financiallyindependent
American Indian/Alaska NativeTotal
SOURCE: U.S. Department of Education, National Center for Education Statistics, “1992-93 NationalPostsecondary Student Aid Study (NPSAS:93).” As published in NCES, Profile of Undergraduates in U.S.Postsecondary Education Institutions: 1992-93, tables 1.3b, 4.1b, and 1.2b, 1995.
CONCLUSION
The path to postsecondary degree attainment begins prior to college
enrollment. American Indian and Alaska Native high
school students must complete a college preparatory
course curriculum, achieve acceptable GPAs, and raise
their college entrance standardized test scores. Improved
academic achievement and preparation in high school
will make these students more viable and attractive candidates for
college admission.

2-16
American Indian andAlaska Native Enrollmentand Retentionin Higher Education
3
Enrollment in Higher Education
3-1
ver the past two decades, American Indian and Alaska Native1 higher education
enrollment has increased 67 percent, rising from 76,000 students in 1976 to
127,000 students in 1994, while overall enrollment in higher education
increased 30 percent (table 3-1). This chapter examines student enrollment in
institutions of higher education, focusing on trends in higher education
enrollment by institution and student characteristics as well as by state.
Enrollment at tribal colleges is also analyzed. The chapter concludes with a
brief examination of student persistence and retention rates. The summary
tables referred to in the text appear at the end of the chapter.
HIGHLIGHTS
# American Indian and Alaska Native enrollment in institutions of highereducation (IHEs) jumped from 76,000 in 1976 to 127,000 in 1994, anincrease of 67 percent. Overall enrollment in IHEs increased 30 percent(table 3-1).
# More American Indian and Alaska Native students attended 2-year ratherthan 4-year institutions from 1976 through 1994, while the majority of thegeneral student population was enrolled in 4-year institutions (summarytable S3-1).
# In 1976 and 1994, enrollments by Native American students and the totalstudent population were concentrated in public institutions rather thanprivate institutions. Native American students, however, attended publicinstitutions at higher rates than students overall (figure 3-3).
# Increased enrollment by women was the main reason for substantial gainsin enrollment levels for Native American students and all students. From1976 to 1994, enrollments by Native American women increased 98percent (summary table S3-3) and enrollments by women overall increased52 percent.
# The rate of full-time attendance was highest at 4-year institutions (summarytable S3-4) and private institutions (summary table S3-5) for NativeAmericans and the total student population.
# Higher education enrollment has been primarily at the undergraduate levelfor American Indian and Alaska Native students as well as for studentsoverall since 1976. Over the past two decades American Indian and Alaska
1The terms “Native American” and “American Indian and Alaska Native” are used interchangeably throughout this chapter.
O
3-2
Native undergraduate enrollment increased 68 percent compared with a 30percent increase in total undergraduate enrollment (figure 3-6 ).
# In 1994, Native American enrollment at the undergraduate level exceededrepresentation in the total population (1 percent and 0.8 percent,respectively; summary table S3-7 and appendix table 1-1).
# In 1992-93, Native American students were less likely to enroll in bachelor’sdegree programs than students overall (p. 3-12).
# In 1992-93, American Indian and Alaska Native undergraduates enrolled insimilar fields of study as the overall undergraduate student population.Business management and health were the most popular fields for bothgroups (figure 3-7).
# In 1994, American Indian and Alaska Native enrollment was concentratedin areas where Native Americans resided, primarily the western portion ofthe United States (figures 3-8, 3-9, and 1-4).
# About 8 percent of all American Indian and Alaska Native college studentsattended tribal colleges in 1994 (tables 3-1 and 3-3).
# The 1996 6-year graduation rate for American Indian and Alaska Nativefreshmen in NCAA Division I institutions was 36 percent. For all freshmen inNCAA Division I institutions, the 6-year graduation rate was 56 percent(figure 3-10).
SOURCES OF DATA
Data are taken from the following major national sources: the National Center
for Education Statistics (NCES) Integrated Postsecondary Education Data System
(IPEDS) Fall Enrollment surveys, and persistence and
graduation data from the National Collegiate Athletic
Association (NCAA). Currently, the NCAA is the only major
source of persistence and graduation data.
The Integrated Postsecondary Educational Data System Fall Enrollment
survey. The IPEDS Fall Enrollment survey is an annual census that collects data
on all students enrolled in U.S. postsecondary institutions each fall. These
postsecondary institutions include universities and colleges as well as
Enrollment in Higher Education
3-3
institutions offering technical and vocational education beyond the high school
level. In 1993, the survey response rate was 97 percent.
The IPEDS Fall Enrollment survey replaced the Higher Education General
Information Survey (HEGIS) Fall Enrollment in Colleges and Universities survey,
in 1986. Enrollment data by race/ethnicity had been collected through HEGIS
since 1976. The major difference between the two survey series is that IPEDS
collects data from all postsecondary institutions, whereas HEGIS only collected
data from institutions of higher education (IHEs). IHEs are accredited at the
college level by an agency recognized by the U.S. Department of Education.
NCES has maintained the link between the IPEDS and HEGIS surveys by
allowing data on HEGIS institutions to be calculated separately within the IPEDS
surveys. Both IPEDS and HEGIS data are included in this chapter to permit time
series analysis.
National Collegiate Athletic Association Persistence and Graduation
surveys. The National Collegiate Athletic Association (NCAA) is currently the
only organization collecting data on persistence and graduation rates. The
NCAA includes over 900 member institutions awarding at least a bachelor’s
degree. These institutions belong to one of three divisions (Division I, Division
II, and Division III) based on criteria established by the NCAA. Graduation data
are collected from all Division I institutions; persistence data are collected from
all Division II and III institutions. These data are based on student counts rather
than estimates.
NCES is currently developing a system to collect data on student persistence as
part of the IPEDS surveys. Once established, it would provide data on the
universe of postsecondary students, rather than basing persistence and
graduation rates on data from a limited number of schools or estimates from
samples.
3-4
ENROLLMENT IN HIGHER EDUCATION
In 1976, 76,100 American Indians and Alaska Natives enrolled in institutions of
higher education (table 3-1). Almost 20 years later, Native
American enrollment reached 127,400, which represented a 67
percent increase in enrollment. These gains exceeded the
enrollment predictions issued by the U.S. Department of
Education in 1991 that estimated 102,000 American Indian and
Alaska Native students would be enrolled in institutions of higher education by
1994.2 During the same time period, total higher education enrollment
increased 30 percent from about 11 million to slightly more than 14 million
(table 3-1).
Table 3-1Enrollment in institutions of higher education, by race/ethnicity: Selected years,fall 1976 to fall 1994
Race/ethnicity 1976 1978 1980 1982 1984 1986 1988 1990 1992 1994
(Number in thousands)
All institutions............... 10,985.6 11,231.2 12,086.8 12,387.9 12,233.0 12,503.5 13,043.1 13,818.6 14,487.4 14,278.8
American Indian/
Alaska Native .............. 76.1 77.9 83.9 87.7 83.6 90.1 92.5 102.8 119.3 127.4
Asian/Pacific Islander....... 197.9 235.1 286.4 351.0 389.5 447.8 496.7 572.4 697.0 774.3
Black, non-Hispanic .......... 1,003.0 1,054.4 1,106.8 1,101.5 1,075.8 1,082.3 1,129.6 1,247.0 1,392.9 1,448.6
Hispanic ............................... 383.8 417.3 471.7 519.3 534.9 618.0 680.0 782.4 955.0 1,045.6
White, non-Hispanic ......... 9,076.1 9,194.0 9,833.0 9,997.1 9,814.7 9,920.6 10,283.2 10,722.5 10,875.4 10,427.0
Nonresident alien.............. 218.7 252.6 305.0 331.3 334.6 344.7 361.2 391.5 447.7 455.9
NOTE: Because of underreporting/nonreporting of racial/ethnic data, figures are slightly lower than corresponding data in other tables, and figures prior to 1986 wereestimated when possible. Because of rounding, details may not add to totals.
SOURCE: U.S. Department of Education, National Center for Education Statistics, Higher Education General Information Survey (HEGIS), “Fall Enrollment in Colleges andUniversities” surveys, various years; and Integrated Postsecondary Education Data System (IPEDS), “Fall Enrollment” surveys, various years. As published in NCES,Digest of Education Statistics: 1991, table 194, p. 199, 1991; Digest of Education Statistics: 1992, table 193, p. 203, 1992; Digest of Education Statistics: 1996,table 202, p. 207, 1996; and Digest of Education Statistics: 1997, table 206, p. 214, 1997.
Institutional level. From 1976 to 1994, Native American enrollments at 4-year
institutions increased at a higher rate (75 percent) than did those at 2-year
institutions (61 percent), which was the opposite of the enrollment pattern for
students overall during the past two decades (figure 3-1 and summary table S3-
1). Despite increases in student enrollments, the percentage distribution of
2U.S. Department of Education, National Center for Education Statistics, Projections of Education Statistics to 2002, table 46, p.142, 1991.
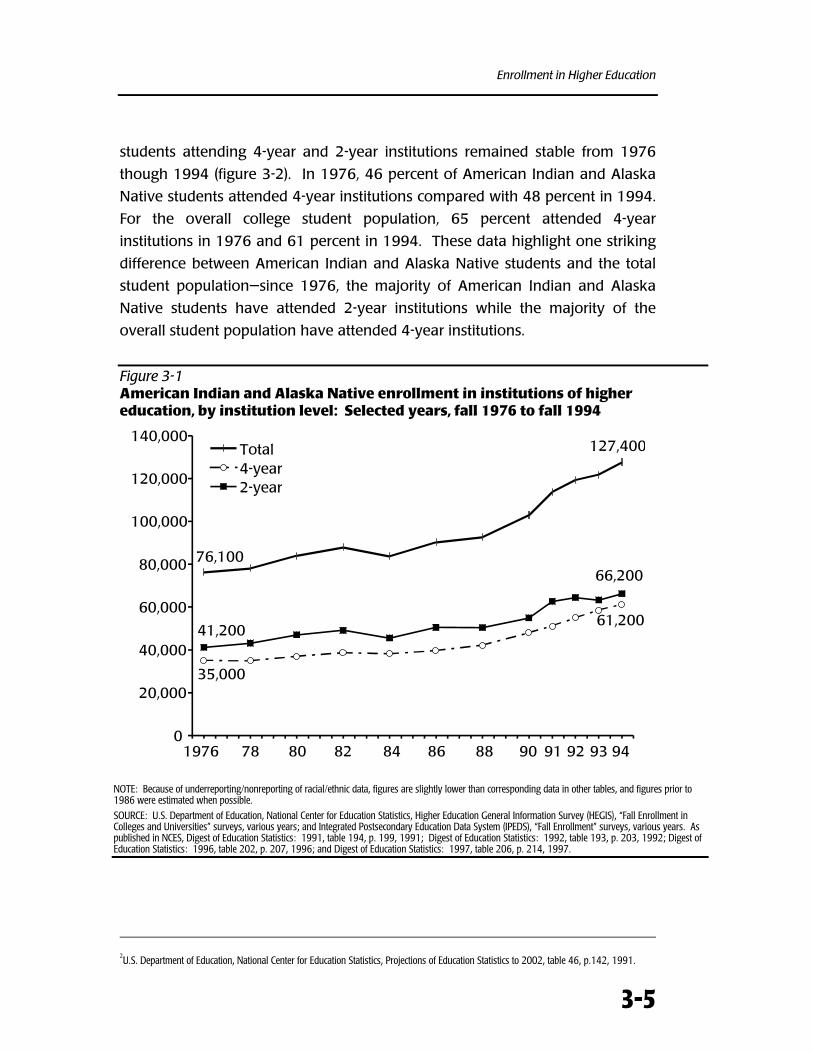
Enrollment in Higher Education
3-5
students attending 4-year and 2-year institutions remained stable from 1976
though 1994 (figure 3-2). In 1976, 46 percent of American Indian and Alaska
Native students attended 4-year institutions compared with 48 percent in 1994.
For the overall college student population, 65 percent attended 4-year
institutions in 1976 and 61 percent in 1994. These data highlight one striking
difference between American Indian and Alaska Native students and the total
student population—since 1976, the majority of American Indian and Alaska
Native students have attended 2-year institutions while the majority of the
overall student population have attended 4-year institutions.
Figure 3-1American Indian and Alaska Native enrollment in institutions of highereducation, by institution level: Selected years, fall 1976 to fall 1994
76,100
127,400
35,000
61,20041,200
66,200
0
20,000
40,000
60,000
80,000
100,000
120,000
140,000Total4-year2-year
1976 78 80 82 84 86 88 90 9291 93 94
NOTE: Because of underreporting/nonreporting of racial/ethnic data, figures are slightly lower than corresponding data in other tables, and figures prior to1986 were estimated when possible.
SOURCE: U.S. Department of Education, National Center for Education Statistics, Higher Education General Information Survey (HEGIS), “Fall Enrollment inColleges and Universities” surveys, various years; and Integrated Postsecondary Education Data System (IPEDS), “Fall Enrollment” surveys, various years. Aspublished in NCES, Digest of Education Statistics: 1991, table 194, p. 199, 1991; Digest of Education Statistics: 1992, table 193, p. 203, 1992; Digest ofEducation Statistics: 1996, table 202, p. 207, 1996; and Digest of Education Statistics: 1997, table 206, p. 214, 1997.
2U.S. Department of Education, National Center for Education Statistics, Projections of Education Statistics to 2002, table 46, p.142, 1991.
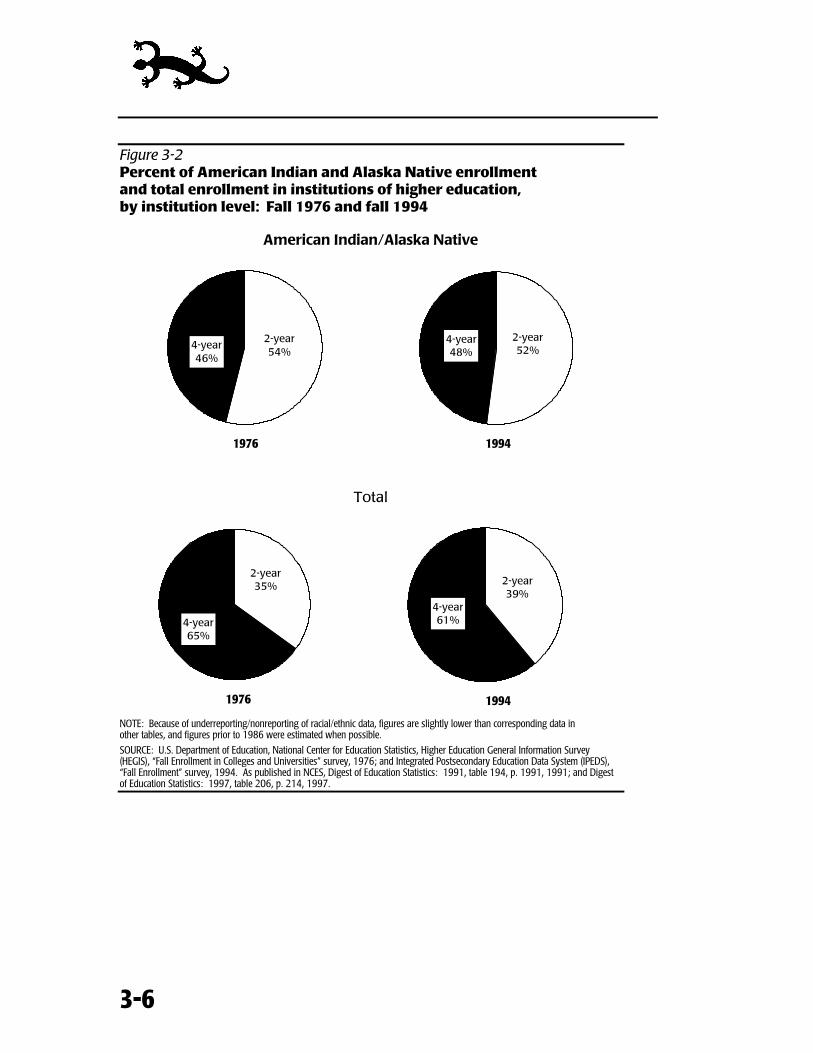
3-6
Figure 3-2Percent of American Indian and Alaska Native enrollmentand total enrollment in institutions of higher education,by institution level: Fall 1976 and fall 1994
American Indian/Alaska Native
1976
2-year54%
4-year46%
1994
2-year52%
4-year48%
Total
1976
2-year35%
4-year65%
1994
2-year39%
4-year61%
NOTE: Because of underreporting/nonreporting of racial/ethnic data, figures are slightly lower than corresponding data inother tables, and figures prior to 1986 were estimated when possible.
SOURCE: U.S. Department of Education, National Center for Education Statistics, Higher Education General Information Survey(HEGIS), “Fall Enrollment in Colleges and Universities” survey, 1976; and Integrated Postsecondary Education Data System (IPEDS),“Fall Enrollment” survey, 1994. As published in NCES, Digest of Education Statistics: 1991, table 194, p. 1991, 1991; and Digestof Education Statistics: 1997, table 206, p. 214, 1997.
Enrollment in Higher Education
3-7
Institution control. American Indian and Alaska Native enrollment in public
institutions increased 64 percent from 1976 to 1994 compared with a 29
percent increase in overall public institution enrollment (summary table S3-2).
The gains for both groups in private institution enrollments were 93 percent
and 34 percent, respectively. While the percentage increases in private school
enrollments were larger than those for public schools, the total number of
students enrolled in public institutions increased by nearly 2.5 million students
compared with an increase of 800,500 students in private institutions.
Enrollment by Native Americans increased by 43,200 in public institutions and
8,000 in private institutions.
An examination of the distribution of students attending public and private
institutions shows that the majority of American Indian and Alaska Native
students, as well as students overall, attended public institutions from 1976 to
1994 (figure 3-3). However, a greater percentage of American Indian and
Alaska Native students than of all students enrolled in public institutions. For
example, in 1994, 87 percent of American Indian and Alaska Native students
compared with 78 percent of all students attended public institutions. This
difference could be driven by the fact that the majority of Native Americans
attended 2-year institutions, which are generally public institutions.
Enrollment by sex. Increased enrollment by women was the main force
behind the climb in student enrollment from 1976 to 1994 (summary table S3-
3). Overall, in 1976, slightly more than 5 million women were enrolled in
higher education. By 1994, this number approached 8 million, representing a
52 percent increase in their enrollment. Among American Indian and Alaska
Native women, enrollment jumped from 37,600 in 1976 to 74,400 in 1994, a
98 percent increase. Higher education enrollments by men also increased over
this period, but the increases were not as large. Total male enrollment rose
only 10 percent and Native American male enrollment rose only 38 percent.
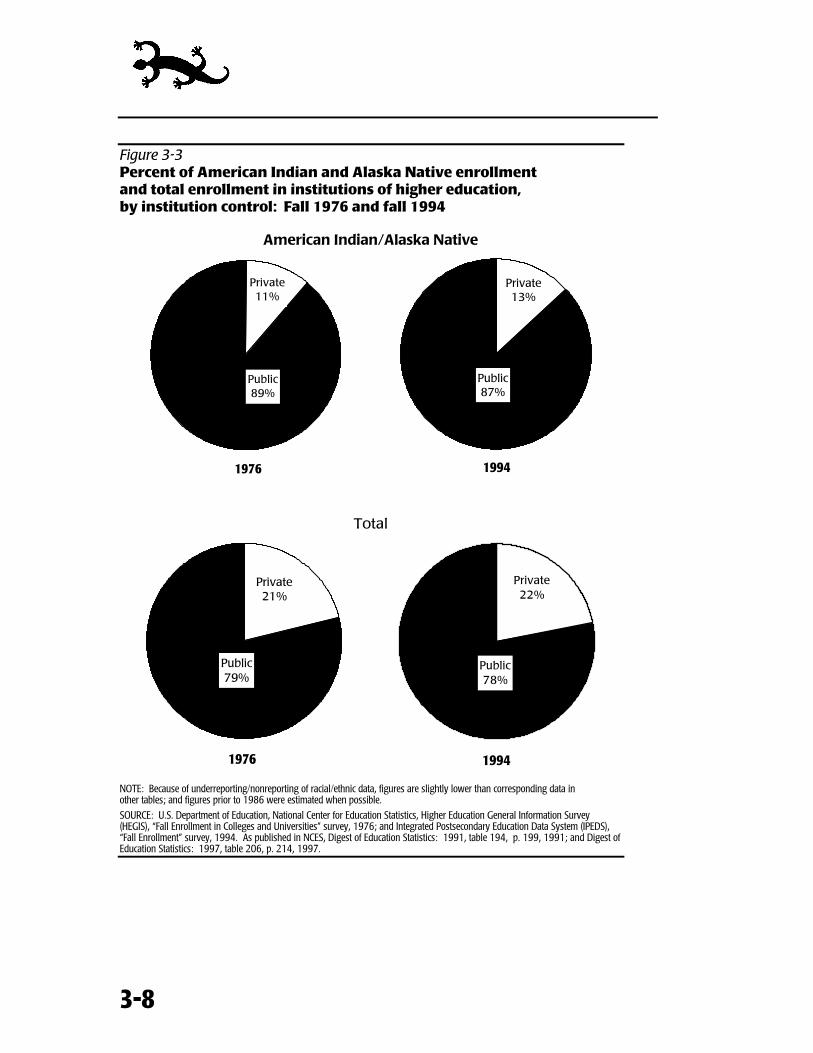
3-8
Figure 3-3Percent of American Indian and Alaska Native enrollmentand total enrollment in institutions of higher education,by institution control: Fall 1976 and fall 1994
American Indian/Alaska Native
1976
Public89%
Private11%
1994
Public87%
Private13%
Total
1976
Private21%
Public79%
1994
Private22%
Public78%
NOTE: Because of underreporting/nonreporting of racial/ethnic data, figures are slightly lower than corresponding data inother tables; and figures prior to 1986 were estimated when possible.
SOURCE: U.S. Department of Education, National Center for Education Statistics, Higher Education General Information Survey(HEGIS), “Fall Enrollment in Colleges and Universities” survey, 1976; and Integrated Postsecondary Education Data System (IPEDS),“Fall Enrollment” survey, 1994. As published in NCES, Digest of Education Statistics: 1991, table 194, p. 199, 1991; and Digest ofEducation Statistics: 1997, table 206, p. 214, 1997.
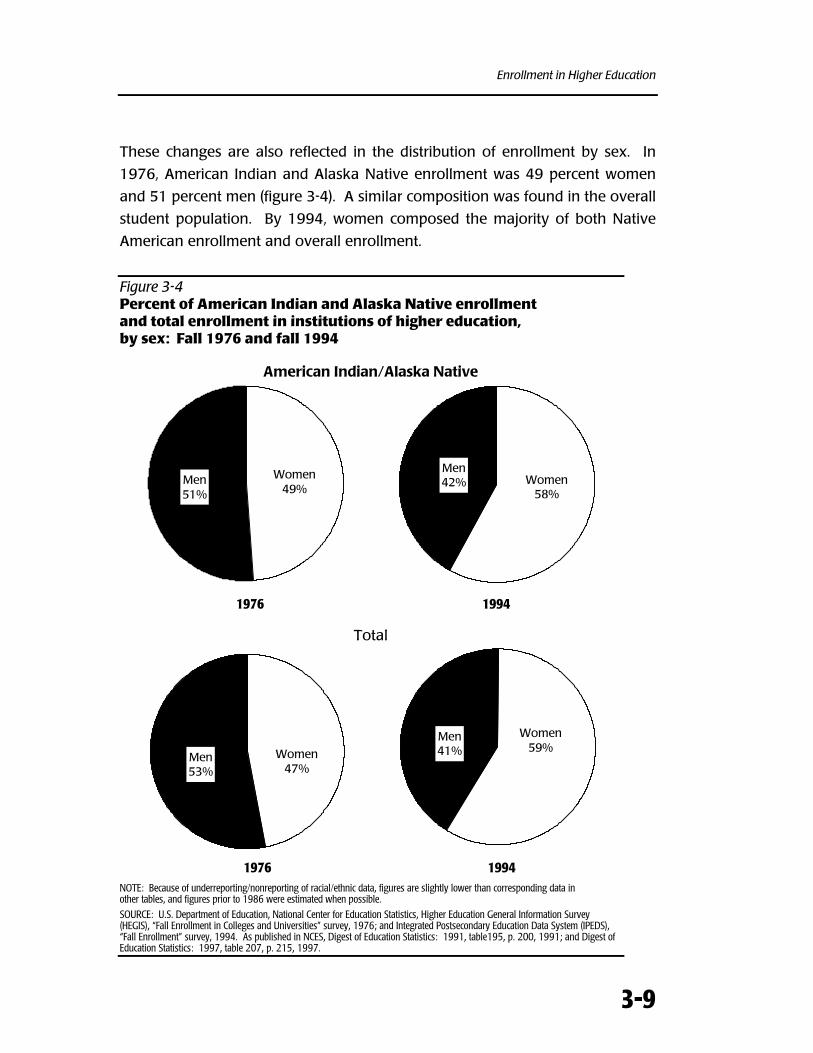
Enrollment in Higher Education
3-9
These changes are also reflected in the distribution of enrollment by sex. In
1976, American Indian and Alaska Native enrollment was 49 percent women
and 51 percent men (figure 3-4). A similar composition was found in the overall
student population. By 1994, women composed the majority of both Native
American enrollment and overall enrollment.
Figure 3-4Percent of American Indian and Alaska Native enrollmentand total enrollment in institutions of higher education,by sex: Fall 1976 and fall 1994
American Indian/Alaska Native
1976
Men51%
Women49%
1994
Women58%
Men42%
Total
1976
Women47%
Men53%
1994
Women59%
Men41%
NOTE: Because of underreporting/nonreporting of racial/ethnic data, figures are slightly lower than corresponding data inother tables, and figures prior to 1986 were estimated when possible.
SOURCE: U.S. Department of Education, National Center for Education Statistics, Higher Education General Information Survey(HEGIS), “Fall Enrollment in Colleges and Universities” survey, 1976; and Integrated Postsecondary Education Data System (IPEDS),“Fall Enrollment” survey, 1994. As published in NCES, Digest of Education Statistics: 1991, table195, p. 200, 1991; and Digest ofEducation Statistics: 1997, table 207, p. 215, 1997.
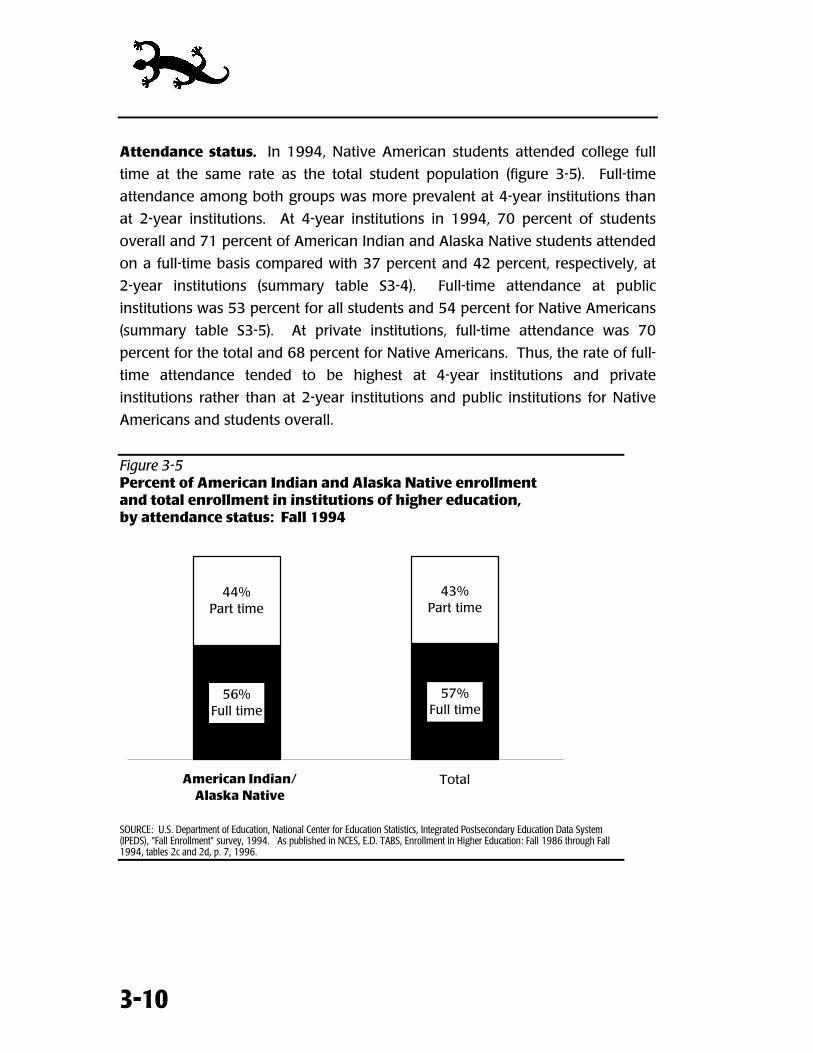
3-10
Attendance status. In 1994, Native American students attended college full
time at the same rate as the total student population (figure 3-5). Full-time
attendance among both groups was more prevalent at 4-year institutions than
at 2-year institutions. At 4-year institutions in 1994, 70 percent of students
overall and 71 percent of American Indian and Alaska Native students attended
on a full-time basis compared with 37 percent and 42 percent, respectively, at
2-year institutions (summary table S3-4). Full-time attendance at public
institutions was 53 percent for all students and 54 percent for Native Americans
(summary table S3-5). At private institutions, full-time attendance was 70
percent for the total and 68 percent for Native Americans. Thus, the rate of full-
time attendance tended to be highest at 4-year institutions and private
institutions rather than at 2-year institutions and public institutions for Native
Americans and students overall.
Figure 3-5Percent of American Indian and Alaska Native enrollmentand total enrollment in institutions of higher education,by attendance status: Fall 1994
56%Full time
57%Full time
44%Part time
43%Part time
American Indian/Alaska Native
TotalAmerican Indian/Alaska Native
SOURCE: U.S. Department of Education, National Center for Education Statistics, Integrated Postsecondary Education Data System(IPEDS), “Fall Enrollment” survey, 1994. As published in NCES, E.D. TABS, Enrollment in Higher Education: Fall 1986 through Fall1994, tables 2c and 2d, p. 7, 1996.
Enrollment in Higher Education
3-11
An examination of students attending part time revealed that the majority of
these students enrolled in 2-year institutions, attended public institutions, and
were female (summary tables S3-4, S3-5, and S3-6). This pattern held for Native
American part-time students as well as for all part-time students.
Degree level. Over the past two decades, enrollment in IHEs has been
predominantly at the undergraduate level. For Native Americans, enrollments
at this level increased almost continuously from 1976 to 1994 (figure 3-6 and
summary table S3-7), rising 68 percent. This increase was substantially greater
than the 30 percent increase in overall undergraduate enrollment. Similar
trends were also visible at the graduate and first-professional degree level for
both groups, with larger percentage increases experienced by Native Americans
than by the total student population. Due to these increases, Native American
students have moved closer to achieving the same level of representation at the
graduate and first-professional degree levels as they have in the total
population. At the undergraduate level, American Indians and Alaska Natives
have exceeded their representation in the population—1 percent of
undergraduate enrollment and 0.8 percent of the total population (summary
table S3-7 and appendix table A1-1).
3-12
Figure 3-6American Indian and Alaska Native enrollment in institutions ofhigher education, by degree level: Selected years, fall 1976 to fall 1994
69,700
117,400
5,100
8,1001,3001,800
0
20,000
40,000
60,000
80,000
100,000
120,000
1976 78 80 82 84 86 88 90 92 94
UndergraduateGraduateFirst-professional
1976
SOURCE: U.S. Department of Education, National Center for Education Statistics, “Fall Enrollment in Colleges and Universities” surveys, variousyears; and Integrated Postsecondary Education Data Systems (IPEDS), “Fall Enrollment” surveys, various years. As published in NCES, Digest ofEducation Statistics: 1991, table 195, p. 200, 1991; Digest of Education Statistics: 1992, table 194, pp. 204-205, 1992; Digest ofEducation Statistics: 1996, table 203, pp. 208-209, 1996; and Digest of Education Statistics: 1997, table 207, pp. 215-216, 1997.
Associate’s degrees versus bachelor’s degrees. Earning a postsecondary
degree can substantially increase an individual’s earning potential and,
consequently, increase his or her ability to support a family. The median
annual earnings for persons 18 and older with income increased by 45 percent
with the addition of an associate’s degree and by over 90 percent with the
addition of a bachelor’s degree in comparison with income associated with only
completing high school.3 Based on NPSAS:93 data,4 during the 1992-93
academic year Native American students were less likely to enroll in bachelor’s
degree programs than the overall student population. Among American Indian
and Alaska Native undergraduates, 31 percent were enrolled in bachelor’s
degree programs compared with 43 percent of all undergraduate students. The
3U.S. Department of Commerce, Bureau of the Census, Current Population Reports: Educational Attainment in the United States, March 1993and 1992, table 8, 1994.
4U.S. Department of Education, National Center for Education Statistics, Profile of Undergraduates in U.S. Postsecondary Education Institutions:1992-1993, table 3.1b, p. C-45, 1995.
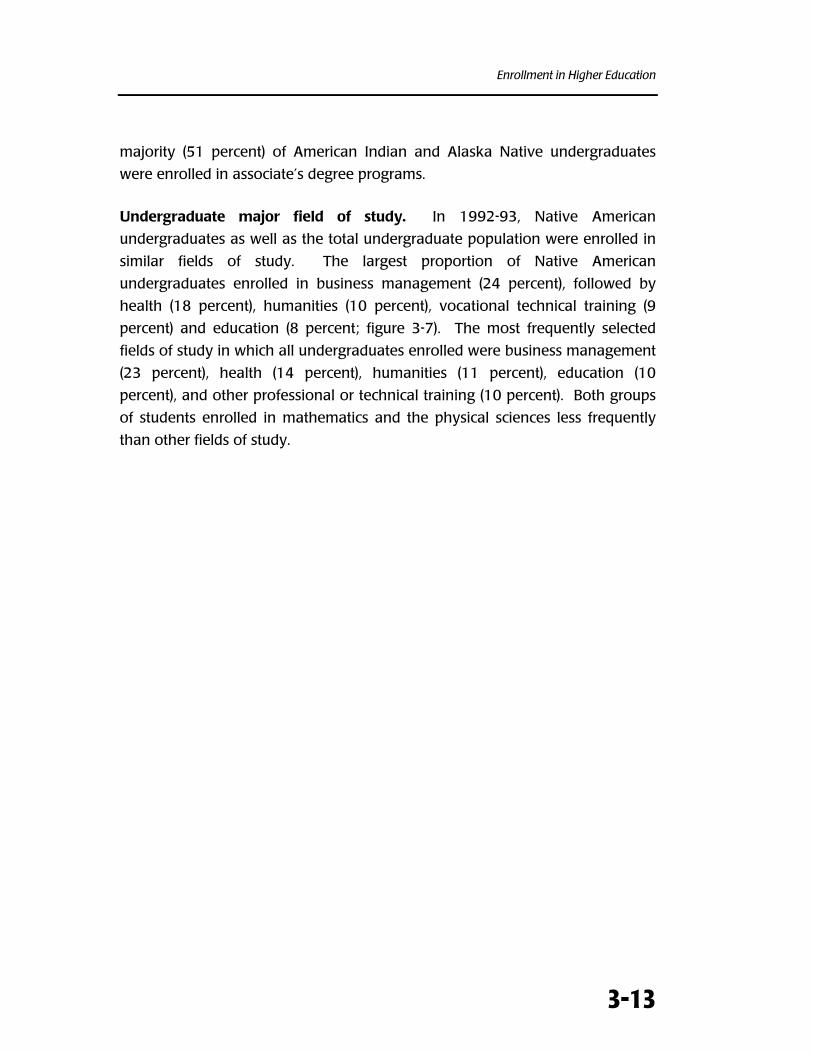
Enrollment in Higher Education
3-13
majority (51 percent) of American Indian and Alaska Native undergraduates
were enrolled in associate’s degree programs.
Undergraduate major field of study. In 1992-93, Native American
undergraduates as well as the total undergraduate population were enrolled in
similar fields of study. The largest proportion of Native American
undergraduates enrolled in business management (24 percent), followed by
health (18 percent), humanities (10 percent), vocational technical training (9
percent) and education (8 percent; figure 3-7). The most frequently selected
fields of study in which all undergraduates enrolled were business management
(23 percent), health (14 percent), humanities (11 percent), education (10
percent), and other professional or technical training (10 percent). Both groups
of students enrolled in mathematics and the physical sciences less frequently
than other fields of study.
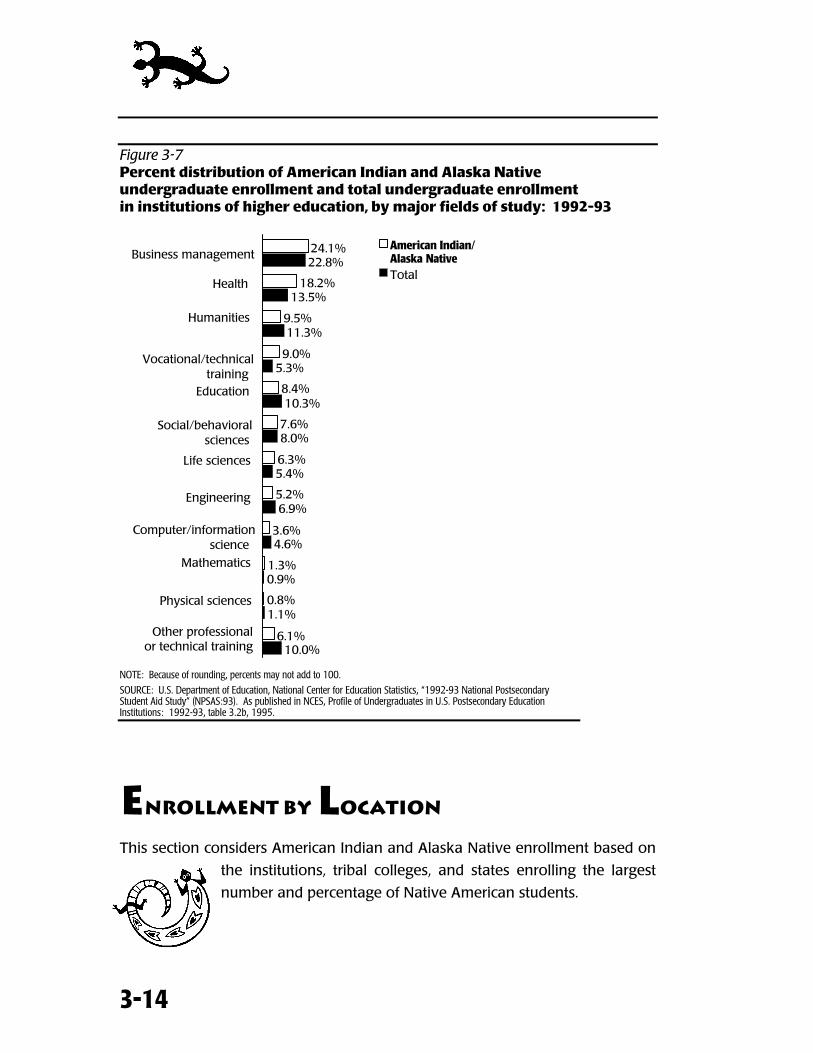
3-14
Figure 3-7Percent distribution of American Indian and Alaska Nativeundergraduate enrollment and total undergraduate enrollmentin institutions of higher education, by major fields of study: 1992-93
10.0%
1.1%
0.9%
4.6%
6.9%
5.4%
8.0%
10.3%
5.3%
11.3%
13.5%
22.8%
6.1%
0.8%
1.3%
3.6%
5.2%
6.3%
7.6%
8.4%
9.0%
9.5%
18.2%
24.1% American Indian/Alaska NativeTotal
Business management
Health
Humanities
Vocational/technicaltraining
Education
Social/behavioralsciences
Life sciences
Engineering
Computer/informationscience
Mathematics
Physical sciences
Other professionalor technical training
NOTE: Because of rounding, percents may not add to 100.
SOURCE: U.S. Department of Education, National Center for Education Statistics, “1992-93 National PostsecondaryStudent Aid Study” (NPSAS:93). As published in NCES, Profile of Undergraduates in U.S. Postsecondary EducationInstitutions: 1992-93, table 3.2b, 1995.
ENROLLMENT BY LOCATION
This section considers American Indian and Alaska Native enrollment based on
the institutions, tribal colleges, and states enrolling the largest
number and percentage of Native American students.
Enrollment in Higher Education
3-15
Enrollment by institution. In 1994, the IHEs enrolling the largest numbers of
American Indian and Alaska Native students were concentrated in areas where
American Indians and Alaska Natives most commonly resided (figure 1-4). The
University of New Mexico-Gallup Branch boasted the largest Native American
enrollment with 2,041 students. It was followed by Navajo Community College
in Arizona (1,899 Native American students), Northeastern State University in
Oklahoma (1,899), Northland Pioneer College in Arizona (1,325), and
Southeastern Oklahoma State University (1,268). As a percentage of total
student enrollment, Native American enrollment in these five institutions
ranged from 21 percent at Northeastern State University to 94 percent at
Navajo Community College (table 3-2).
Tribal college enrollment. About 8 percent of all American Indian and Alaska
Native postsecondary students attended tribal colleges in 1994 (calculated from
table 3-3 and summary table S3-1).5 Among these institutions, Navajo
Community College enrolled more than twice as many Native American
students as any other tribal college (1,899; table 3-3). The next highest Native
American student enrollments were reported at Oglala Lakota College (853
students), Haskell Indian Junior College (793), Salish Kootenai Community
College (659), and Southwestern Indian Polytechnic Institute (615).
Twenty-three of the 25 tribal colleges reporting enrollment data by
race/ethnicity to IPEDS in 1994 had the majority of their student bodies
composed of American Indians and Alaska Natives (table 3-3). Three of these
schools, Crownpoint Institute of Technology, Haskell Indian Junior College, and
Southwestern Indian Polytechnic Institute, reported that their student bodies
were composed entirely of American Indian and Alaska Native students. An
additional 8 of the 23 tribal colleges had Native American students composing
at least 90 percent of their total enrollment.
5 Based on 25 of 29 tribal colleges reporting enrollment data by race/ethnicity.
3-16
Table 3-2Institutions of higher education with largest American Indian and Alaska Nativeenrollment: Fall 1994
American Indian/ Alaska NativeInstitution name State Total enrollment
Total PercentUniversity of New Mexico-Gallup Branch............................................. NM 2,734 2,041 74.7Navajo Community College1....................................................................... AZ 2,031 1,899 93.5Northeastern State University ................................................................. OK 8,994 1,899 21.1Northland Pioneer College....................................................................... AZ 4,614 1,325 28.7Southeastern Oklahoma State University ............................................ OK 4,004 1,268 31.7University of Oklahoma-Norman Campus .......................................... OK 22,043 1,212 5.5San Juan College ........................................................................................ NM 3,771 1,132 30.0Northern Arizona University.................................................................... AZ 19,242 1,083 5.6Oklahoma State University-Main Campus........................................... OK 18,807 1,071 5.7University of Alaska-Anchorage ............................................................. AK 16,189 1,044 6.4University of Alaska-Fairbanks ............................................................... AK 7,703 1,036 13.4University of New Mexico-Main Campus ............................................. NM 24,572 1,033 4.2Oglala Lakota College.................................................................................. SD 1,038 853 82.2Albuquerque Technical Vocational Institute ........................................ NM 14,552 840 5.8Tulsa Junior College................................................................................... OK 18,604 798 4.3Haskell Indian Junior College2 .................................................................... KS 793 793 100.0Arizona State University-Main Campus ................................................ AZ 42,189 748 1.8Pima Community College......................................................................... AZ 27,960 728 2.6Pembroke State University....................................................................... NC 3,017 723 24.0Salish Kootenai Community College ......................................................... MT 874 659 75.4University of Arizona ................................................................................. AZ 35,306 654 1.9Mesa Community College ........................................................................ AZ 20,110 624 3.1East Central University .............................................................................. OK 4,501 581 12.9Sinte Gleska University................................................................................. SD 748 561 75.0Robeson Community College.................................................................. NC 1,371 522 38.1Rogers State College.................................................................................. OK 3,251 516 15.9Turtle Mountain Community College ........................................................ ND 585 511 87.4University of Central Oklahoma............................................................. OK 16,076 510 3.2American River College............................................................................. CA 19,766 508 2.6New Mexico State University-Main Campus........................................ NM 15,643 499 3.2Rose State College...................................................................................... OK 9,056 475 5.2Fort Lewis College ...................................................................................... CO 4,015 471 11.7Phoenix College.......................................................................................... AZ 11,425 465 4.1Oklahoma City Community College...................................................... OK 9,501 465 4.9Northeastern Oklahoma Agricultural and Mech College................. OK 2,464 447 18.1Connors State College ............................................................................... OK 2,355 416 17.7Scottsdale Community College ............................................................... AZ 9,822 390 4.0University of Washington......................................................................... WA 33,719 388 1.2University of Alaska Southeast ............................................................... AK 3,145 377 12.0College of The Redwoods ........................................................................ CA 6,382 377 5.9Blackfeet Community College..................................................................... MT 395 375 94.9California State University-Sacramento ................................................ CA 22,726 366 1.6Carl Albert State College ........................................................................... OK 1,698 360 21.2Eastern Oklahoma State College............................................................ OK 1,994 348 17.5University of Minnesota-Twin Cities ...................................................... MN 51,478 344 0.7Northeast Wisconsin Technical College................................................ WI 8,612 342 4.0Sierra College............................................................................................... CA 13,534 338 2.5Northwest Technical College-Bemidji .................................................... MN 6,317 336 5.3Cerritos College ........................................................................................... CA 19,571 334 1.7University of North Dakota-Main Campus........................................... ND 11,499 327 2.81Navajo Community College recently changed its name to Diné Community College.2Haskell Indian Junior College recently changed its name to Haskell Indian Nations University.
NOTE: Total enrollment includes students with unknown race/ethnicity. Institutions appearing in italics are tribal colleges. Three additional tribal colleges hadenrollments equal to or exceeding 327 American Indian and Alaska Native students, including Crownpoint Institute of Technology (N=414), Southwestern IndianPolytechnic Institute (N=615), and Lac Courtes Oreilles Ojibwa Community College (N=375). These institutions do not appear on this list because they were notaccredited as IHEs in fall 1994.
SOURCE: U.S. Department of Education, National Center for Education Statistics, Integrated Postsecondary Education Data System (IPEDS), “Fall Enrollment” survey,unpublished data, 1994.
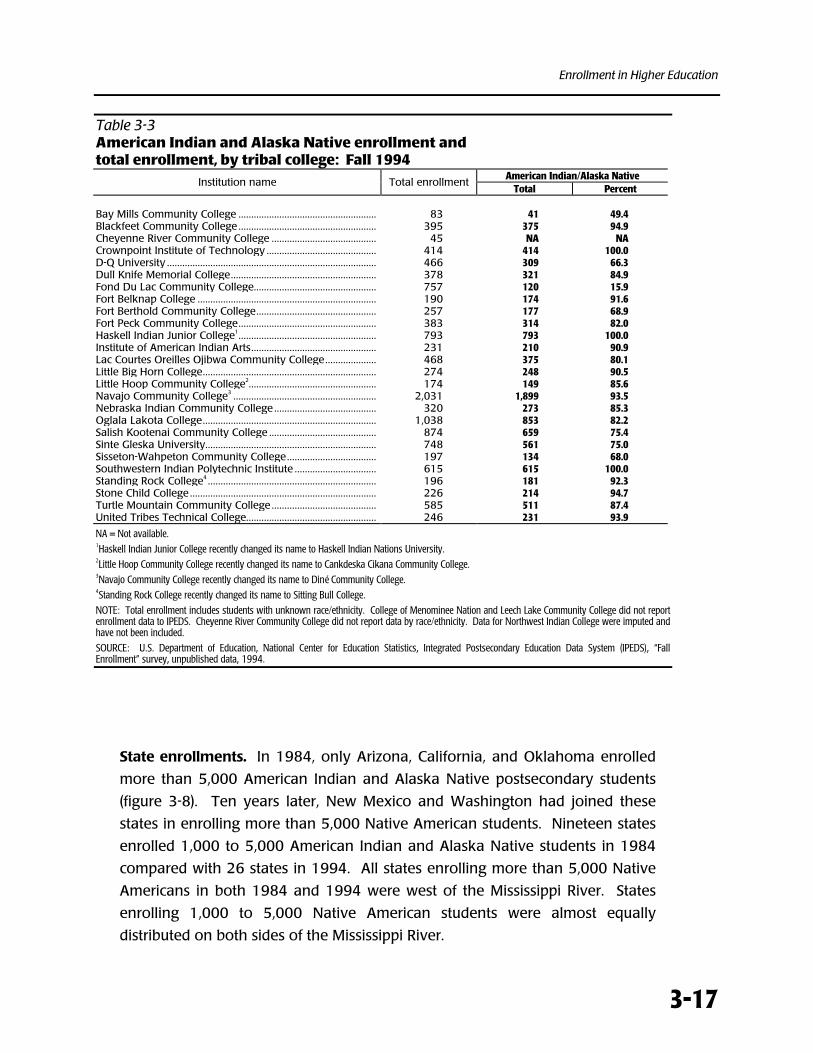
Enrollment in Higher Education
3-17
Table 3-3American Indian and Alaska Native enrollment andtotal enrollment, by tribal college: Fall 1994
American Indian/Alaska NativeInstitution name Total enrollment
Total Percent
Bay Mills Community College ...................................................... 83 41 49.4Blackfeet Community College ...................................................... 395 375 94.9Cheyenne River Community College ......................................... 45 NA NACrownpoint Institute of Technology ........................................... 414 414 100.0D-Q University .................................................................................. 466 309 66.3Dull Knife Memorial College......................................................... 378 321 84.9Fond Du Lac Community College................................................ 757 120 15.9Fort Belknap College ...................................................................... 190 174 91.6Fort Berthold Community College............................................... 257 177 68.9Fort Peck Community College...................................................... 383 314 82.0Haskell Indian Junior College1...................................................... 793 793 100.0Institute of American Indian Arts................................................. 231 210 90.9Lac Courtes Oreilles Ojibwa Community College.................... 468 375 80.1Little Big Horn College.................................................................... 274 248 90.5Little Hoop Community College2.................................................. 174 149 85.6Navajo Community College3 ........................................................ 2,031 1,899 93.5Nebraska Indian Community College ........................................ 320 273 85.3Oglala Lakota College.................................................................... 1,038 853 82.2Salish Kootenai Community College .......................................... 874 659 75.4Sinte Gleska University................................................................... 748 561 75.0Sisseton-Wahpeton Community College................................... 197 134 68.0Southwestern Indian Polytechnic Institute ................................ 615 615 100.0Standing Rock College4 .................................................................. 196 181 92.3Stone Child College ......................................................................... 226 214 94.7Turtle Mountain Community College ......................................... 585 511 87.4United Tribes Technical College................................................... 246 231 93.9
NA = Not available.1Haskell Indian Junior College recently changed its name to Haskell Indian Nations University.2Little Hoop Community College recently changed its name to Cankdeska Cikana Community College.3Navajo Community College recently changed its name to Diné Community College.4Standing Rock College recently changed its name to Sitting Bull College.
NOTE: Total enrollment includes students with unknown race/ethnicity. College of Menominee Nation and Leech Lake Community College did not reportenrollment data to IPEDS. Cheyenne River Community College did not report data by race/ethnicity. Data for Northwest Indian College were imputed andhave not been included.
SOURCE: U.S. Department of Education, National Center for Education Statistics, Integrated Postsecondary Education Data System (IPEDS), “FallEnrollment” survey, unpublished data, 1994.
State enrollments. In 1984, only Arizona, California, and Oklahoma enrolled
more than 5,000 American Indian and Alaska Native postsecondary students
(figure 3-8). Ten years later, New Mexico and Washington had joined these
states in enrolling more than 5,000 Native American students. Nineteen states
enrolled 1,000 to 5,000 American Indian and Alaska Native students in 1984
compared with 26 states in 1994. All states enrolling more than 5,000 Native
Americans in both 1984 and 1994 were west of the Mississippi River. States
enrolling 1,000 to 5,000 Native American students were almost equally
distributed on both sides of the Mississippi River.
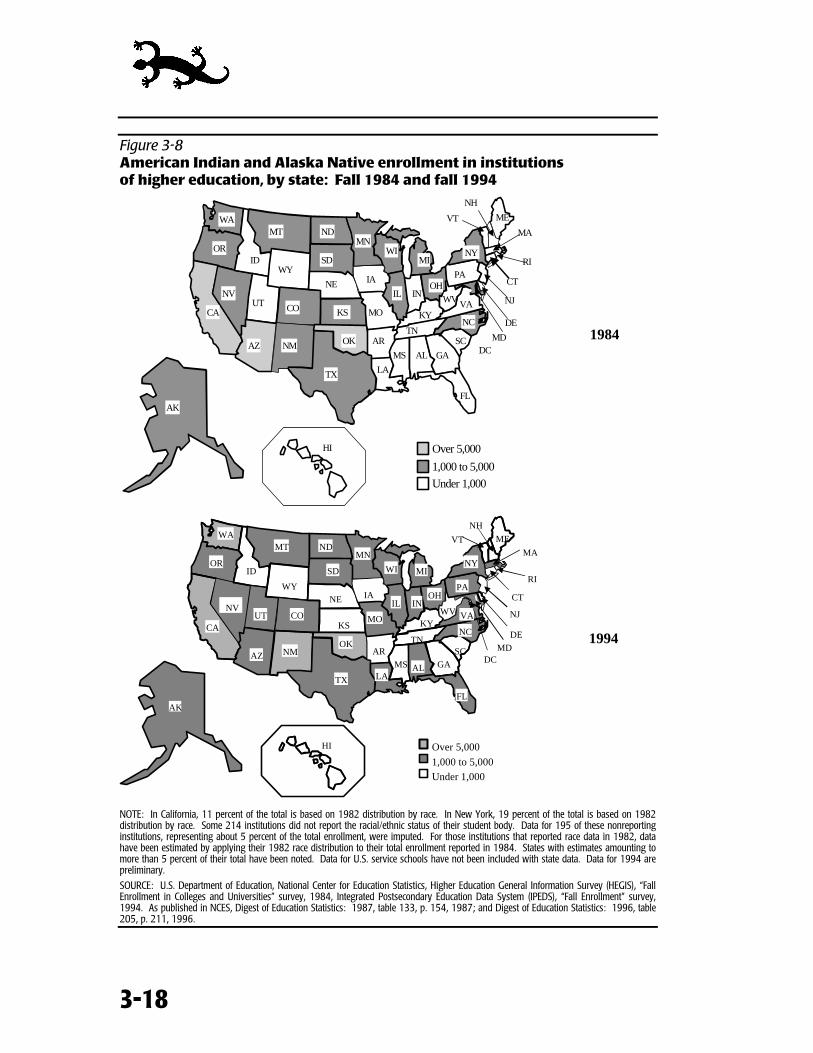
3-18
Figure 3-8American Indian and Alaska Native enrollment in institutionsof higher education, by state: Fall 1984 and fall 1994
WA
OR
CA
NV
ID
AZ NM
UT CO
MT
WY
ND
SD
NE
KS
OK
TX
WIMI
IL INOH
PA
NY
KY
FL
GA
LA
MS AL
AR
IA
MO
TNSC
NC
VA
AK
HI
VT
NH
MA
RI
CT
NJ
DE
MD
ME
WV
MN
Over 5,000
1,000 to 5,000
Under 1,000
DC
WA
OR
CA
NV
ID
AZ NM
UT CO
MT
WY
ND
SD
NE
KS
OK
TX
WI MI
IL INOH
PA
NY
KY
FL
GAMS AL
AR
IA
MO
TNSC
NC
VA
AK
HI
VT
NH
MA
RI
CT
NJ
DE
MD
ME
WV
MN
DC
Over 5,000
1,000 to 5,000Under 1,000
LA
NOTE: In California, 11 percent of the total is based on 1982 distribution by race. In New York, 19 percent of the total is based on 1982distribution by race. Some 214 institutions did not report the racial/ethnic status of their student body. Data for 195 of these nonreportinginstitutions, representing about 5 percent of the total enrollment, were imputed. For those institutions that reported race data in 1982, datahave been estimated by applying their 1982 race distribution to their total enrollment reported in 1984. States with estimates amounting tomore than 5 percent of their total have been noted. Data for U.S. service schools have not been included with state data. Data for 1994 arepreliminary.
SOURCE: U.S. Department of Education, National Center for Education Statistics, Higher Education General Information Survey (HEGIS), “FallEnrollment in Colleges and Universities” survey, 1984, Integrated Postsecondary Education Data System (IPEDS), “Fall Enrollment” survey,1994. As published in NCES, Digest of Education Statistics: 1987, table 133, p. 154, 1987; and Digest of Education Statistics: 1996, table205, p. 211, 1996.
1984
1994
Enrollment in Higher Education
3-19
An examination of American Indian and Alaska Native postsecondary
enrollment as a percentage of total state postsecondary enrollment revealed
that only Alaska had American Indian and Alaska Native students composing
over 5 percent of its total state postsecondary enrollment in 1984 (figure 3-9).
An additional 11 states had Native American enrollments of 1 percent to 5
percent of their total enrollments. Ten years later, Native Americans composed
over 5 percent of enrollments in 6 states and 1 to 5 percent of enrollment in 13
states. In 1994, with the exceptions of Maine, North Carolina, and Minnesota,
all the states where Native Americans composed at least 1 percent of the total
state enrollment were in the western half of the United States.
RETENTION IN POSTSECONDARY EDUCATION
Postsecondary retention can be measured using persistence and
graduation rates. Currently, the National Collegiate Athletic
Association (NCAA) is the only major organization that collects
persistence and graduation data. Data are collected annually
from about 900 institutions, only a fraction of all higher
education institutions. This section discusses these indicators in relation to the
postsecondary retention of American Indian and Alaska Native undergraduates.
F
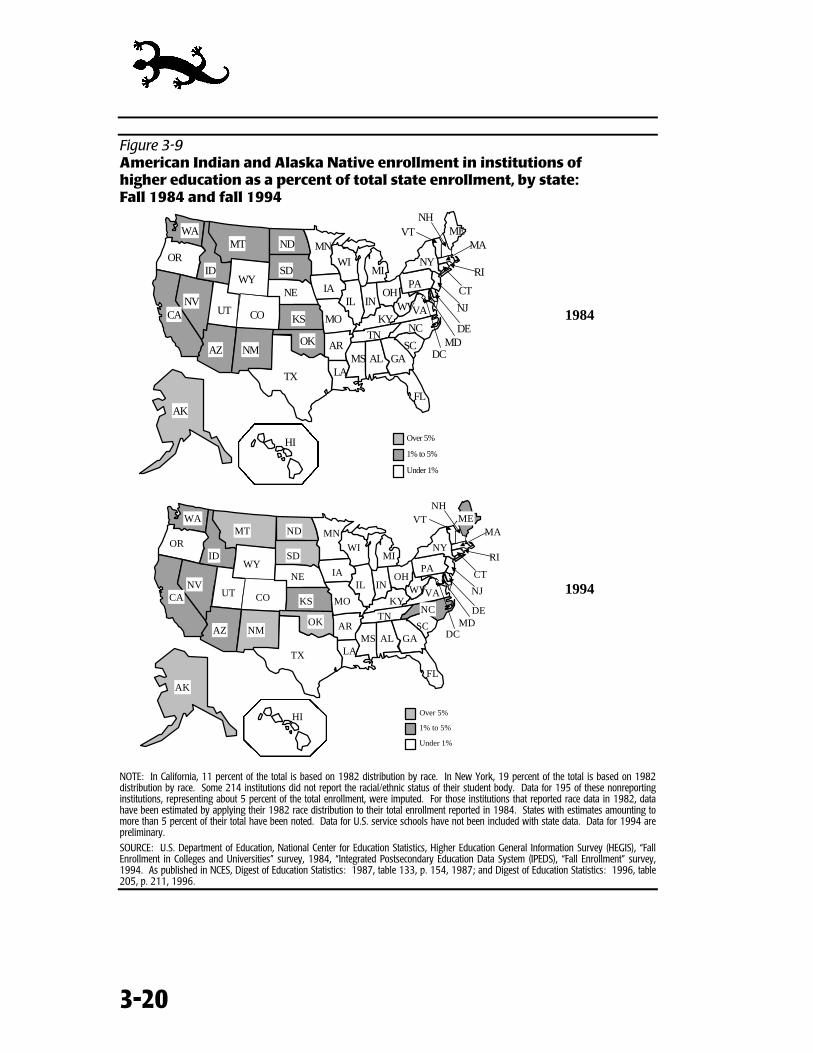
3-20
Figure 3-9American Indian and Alaska Native enrollment in institutions ofhigher education as a percent of total state enrollment, by state:Fall 1984 and fall 1994
AK
HI
WA
OR
CANV
ID
AZ NM
UT CO
MT
WY
ND
SD
NE
KS
OK
TX
WIMI
IL INOH
PA
NY
KY
FL
GALA
MS ALAR
IA
MO
TNSC
NC
VA
VTNH
MA
RI
CT
NJ
DEMD
ME
WV
MN
DC
Over 5%
1% to 5%
Under 1%
AK
HI
WA
OR
CANV
ID
AZ NM
UT CO
MT
WY
ND
SD
NE
KS
OK
TX
WIMI
IL INOH
PA
NY
KY
FL
GALA
MS ALAR
IA
MO
TNSC
NC
VA
VTNH
MA
RI
CT
NJ
DEMD
ME
WV
MN
DC
Over 5%
1% to 5%
Under 1%
NOTE: In California, 11 percent of the total is based on 1982 distribution by race. In New York, 19 percent of the total is based on 1982distribution by race. Some 214 institutions did not report the racial/ethnic status of their student body. Data for 195 of these nonreportinginstitutions, representing about 5 percent of the total enrollment, were imputed. For those institutions that reported race data in 1982, datahave been estimated by applying their 1982 race distribution to their total enrollment reported in 1984. States with estimates amounting tomore than 5 percent of their total have been noted. Data for U.S. service schools have not been included with state data. Data for 1994 arepreliminary.
SOURCE: U.S. Department of Education, National Center for Education Statistics, Higher Education General Information Survey (HEGIS), “FallEnrollment in Colleges and Universities” survey, 1984, “Integrated Postsecondary Education Data System (IPEDS), “Fall Enrollment” survey,1994. As published in NCES, Digest of Education Statistics: 1987, table 133, p. 154, 1987; and Digest of Education Statistics: 1996, table205, p. 211, 1996.
1984
1994
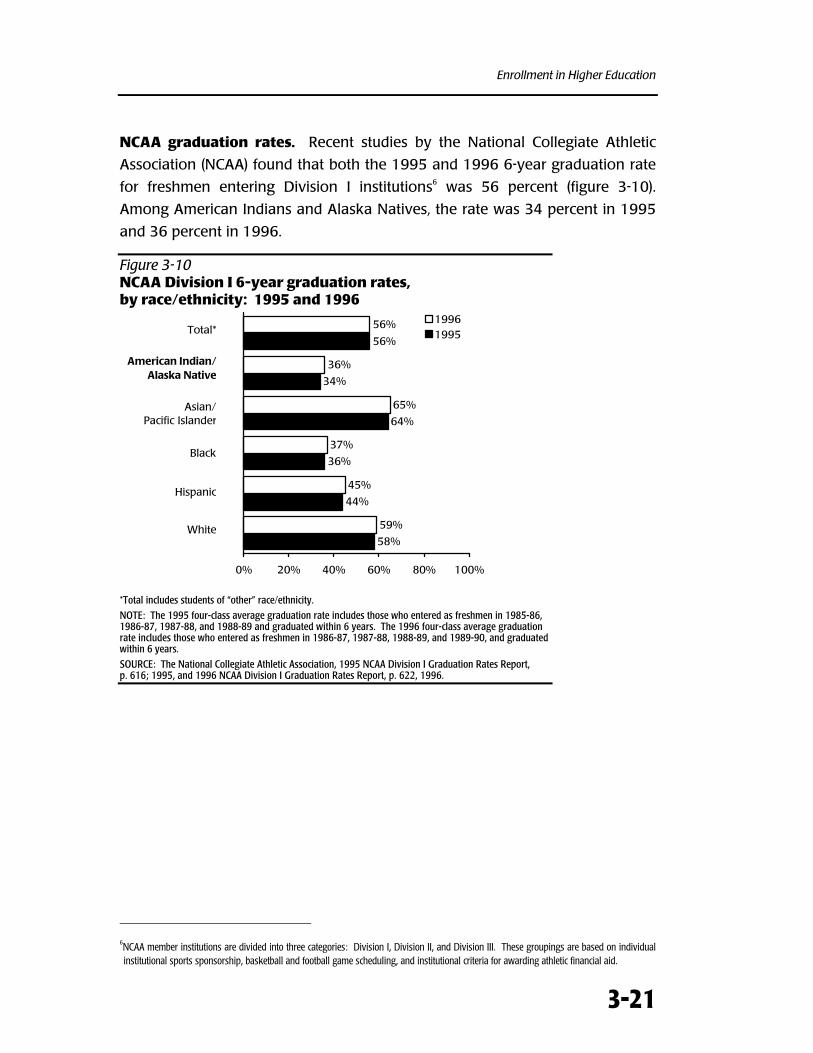
Enrollment in Higher Education
3-21
NCAA graduation rates. Recent studies by the National Collegiate Athletic
Association (NCAA) found that both the 1995 and 1996 6-year graduation rate
for freshmen entering Division I institutions6 was 56 percent (figure 3-10).
Among American Indians and Alaska Natives, the rate was 34 percent in 1995
and 36 percent in 1996.
Figure 3-10NCAA Division I 6-year graduation rates,by race/ethnicity: 1995 and 1996
58%
44%
36%
64%
34%
56%
59%
45%
37%
36%
56%
65%
0% 20% 40% 60% 80% 100%
19961995
American Indian/Alaska Native
Total*
Black
Asian/Pacific Islander
Hispanic
White
*Total includes students of “other” race/ethnicity.
NOTE: The 1995 four-class average graduation rate includes those who entered as freshmen in 1985-86,1986-87, 1987-88, and 1988-89 and graduated within 6 years. The 1996 four-class average graduationrate includes those who entered as freshmen in 1986-87, 1987-88, 1988-89, and 1989-90, and graduatedwithin 6 years.
SOURCE: The National Collegiate Athletic Association, 1995 NCAA Division I Graduation Rates Report,p. 616; 1995, and 1996 NCAA Division I Graduation Rates Report, p. 622, 1996.
6NCAA member institutions are divided into three categories: Division I, Division II, and Division III. These groupings are based on individualinstitutional sports sponsorship, basketball and football game scheduling, and institutional criteria for awarding athletic financial aid.
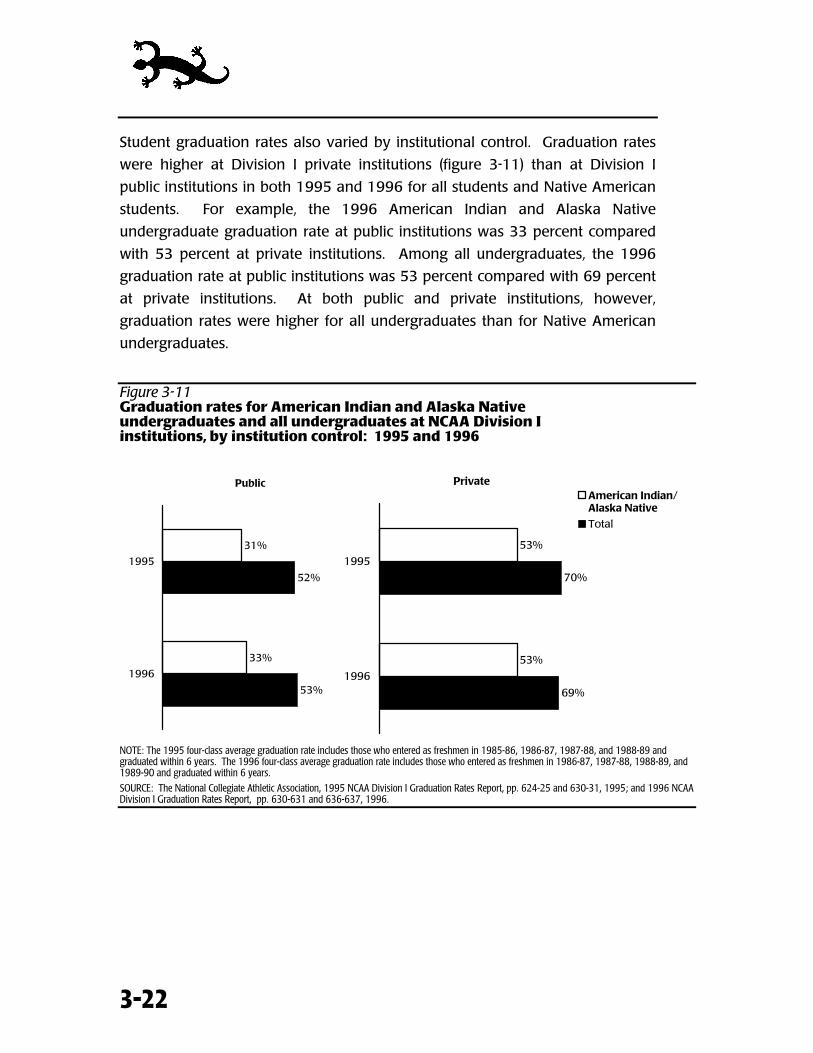
3-22
Student graduation rates also varied by institutional control. Graduation rates
were higher at Division I private institutions (figure 3-11) than at Division I
public institutions in both 1995 and 1996 for all students and Native American
students. For example, the 1996 American Indian and Alaska Native
undergraduate graduation rate at public institutions was 33 percent compared
with 53 percent at private institutions. Among all undergraduates, the 1996
graduation rate at public institutions was 53 percent compared with 69 percent
at private institutions. At both public and private institutions, however,
graduation rates were higher for all undergraduates than for Native American
undergraduates.
Figure 3-11Graduation rates for American Indian and Alaska Nativeundergraduates and all undergraduates at NCAA Division Iinstitutions, by institution control: 1995 and 1996
53%
52%
33%
31%
1996
1995
Public
69%
70%
53%
53%
1996
1995
American Indian/Alaska NativeTotal
Private
NOTE: The 1995 four-class average graduation rate includes those who entered as freshmen in 1985-86, 1986-87, 1987-88, and 1988-89 andgraduated within 6 years. The 1996 four-class average graduation rate includes those who entered as freshmen in 1986-87, 1987-88, 1988-89, and1989-90 and graduated within 6 years.
SOURCE: The National Collegiate Athletic Association, 1995 NCAA Division I Graduation Rates Report, pp. 624-25 and 630-31, 1995; and 1996 NCAADivision I Graduation Rates Report, pp. 630-631 and 636-637, 1996.
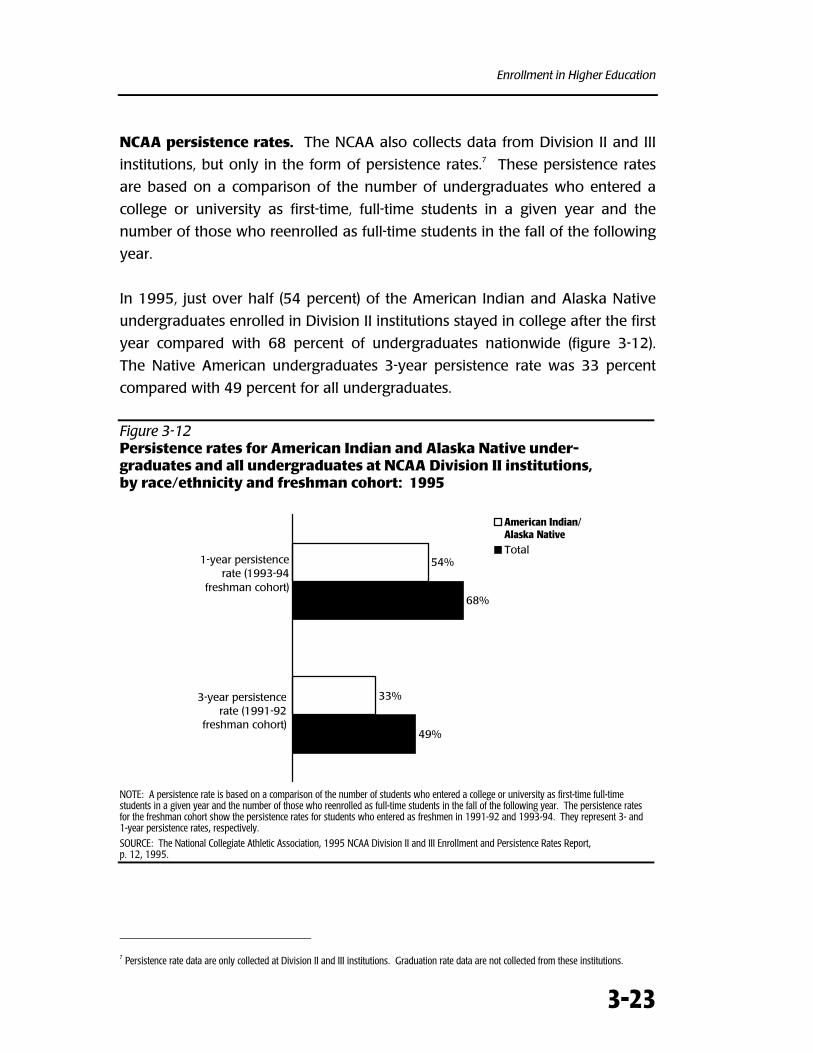
Enrollment in Higher Education
3-23
NCAA persistence rates. The NCAA also collects data from Division II and III
institutions, but only in the form of persistence rates.7 These persistence rates
are based on a comparison of the number of undergraduates who entered a
college or university as first-time, full-time students in a given year and the
number of those who reenrolled as full-time students in the fall of the following
year.
In 1995, just over half (54 percent) of the American Indian and Alaska Native
undergraduates enrolled in Division II institutions stayed in college after the first
year compared with 68 percent of undergraduates nationwide (figure 3-12).
The Native American undergraduates 3-year persistence rate was 33 percent
compared with 49 percent for all undergraduates.
Figure 3-12Persistence rates for American Indian and Alaska Native under-graduates and all undergraduates at NCAA Division II institutions,by race/ethnicity and freshman cohort: 1995
49%
68%
33%
54%
American Indian/Alaska NativeTotal
1-year persistence rate (1993-94
freshman cohort)
3-year persistence rate (1991-92
freshman cohort)
NOTE: A persistence rate is based on a comparison of the number of students who entered a college or university as first-time full-timestudents in a given year and the number of those who reenrolled as full-time students in the fall of the following year. The persistence ratesfor the freshman cohort show the persistence rates for students who entered as freshmen in 1991-92 and 1993-94. They represent 3- and1-year persistence rates, respectively.
SOURCE: The National Collegiate Athletic Association, 1995 NCAA Division II and III Enrollment and Persistence Rates Report,p. 12, 1995.
7 Persistence rate data are only collected at Division II and III institutions. Graduation rate data are not collected from these institutions.
3-24
One-year and 3-year persistence rates were higher at Division III institutions
than at Division II institutions. Division III institutions reported 1-year
persistence rates of 67 percent and 3-year persistence rates of 47 percent for
American Indians and Alaska Natives and 79 percent and 65 percent,
respectively, for all students (figure 3-13).
Figure 3-13Persistence rates for American Indian and Alaska Native under-graduates and all undergraduates at NCAA Division III institutions,by race/ethnicity and freshman cohort: 1995
65%
79%
47%
67%
American Indian/Alaska NativeTotal
1-year persistence rate (1993-94
freshman cohort)
3-year persistence rate (1991-92
freshman cohort)
NOTE: A persistence rate is based on a comparison of the number of students who entered a college or university as first-time full-timestudents in a given year and the number of those who reenrolled as full-time students in the fall of the following year. The persistencerates for the freshman cohort show the persistence rates for students who entered as freshmen in 1991-92 and 1993-94. Theyrepresent 3- and 1-year persistence rates, respectively.
SOURCE: The National Collegiate Athletic Association, 1995 NCAA Division II and III Enrollment and Persistence Rates Report,p. 15, 1995.
CONCLUSION
Over the past two decades, the percentage of American Indian and Alaska
Native students graduating from high school has substantially
increased. These increases have been reflected in the number of
American Indian and Alaska Native high school graduates enrolling
in college. In 1976, 76,000 Native Americans were enrolled in
institutions of higher education. This number rose to 127,000 by
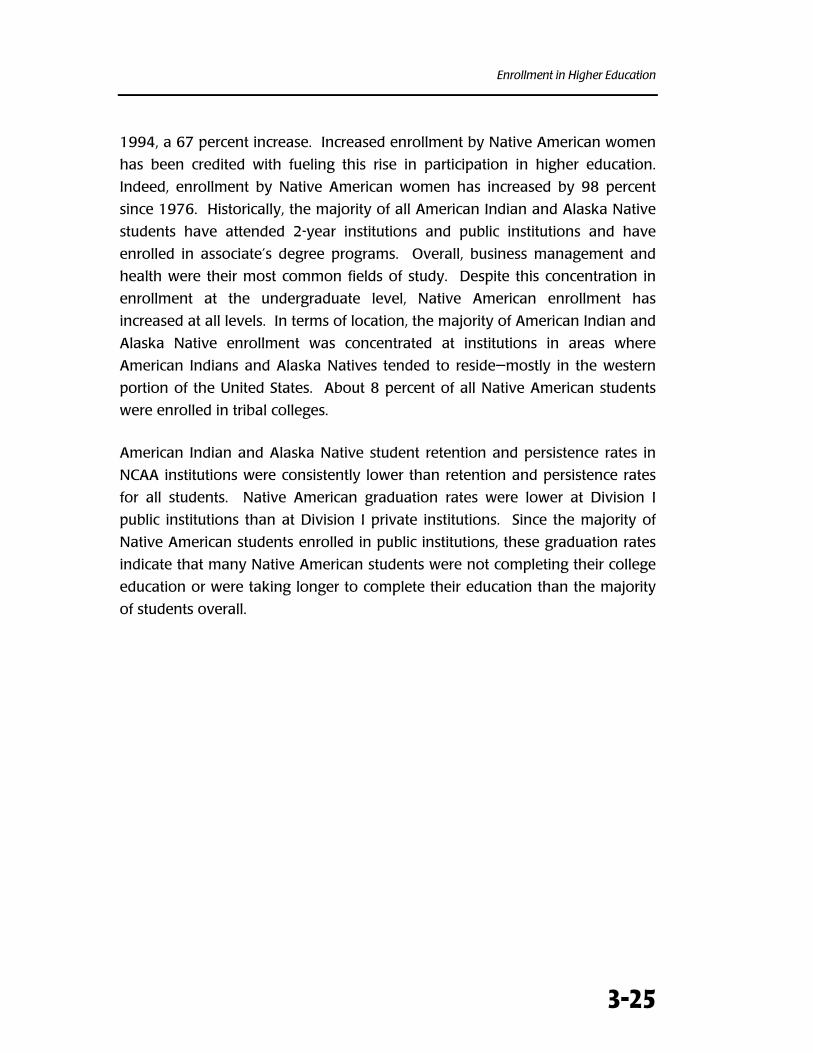
Enrollment in Higher Education
3-25
1994, a 67 percent increase. Increased enrollment by Native American women
has been credited with fueling this rise in participation in higher education.
Indeed, enrollment by Native American women has increased by 98 percent
since 1976. Historically, the majority of all American Indian and Alaska Native
students have attended 2-year institutions and public institutions and have
enrolled in associate’s degree programs. Overall, business management and
health were their most common fields of study. Despite this concentration in
enrollment at the undergraduate level, Native American enrollment has
increased at all levels. In terms of location, the majority of American Indian and
Alaska Native enrollment was concentrated at institutions in areas where
American Indians and Alaska Natives tended to reside—mostly in the western
portion of the United States. About 8 percent of all Native American students
were enrolled in tribal colleges.
American Indian and Alaska Native student retention and persistence rates in
NCAA institutions were consistently lower than retention and persistence rates
for all students. Native American graduation rates were lower at Division I
public institutions than at Division I private institutions. Since the majority of
Native American students enrolled in public institutions, these graduation rates
indicate that many Native American students were not completing their college
education or were taking longer to complete their education than the majority
of students overall.
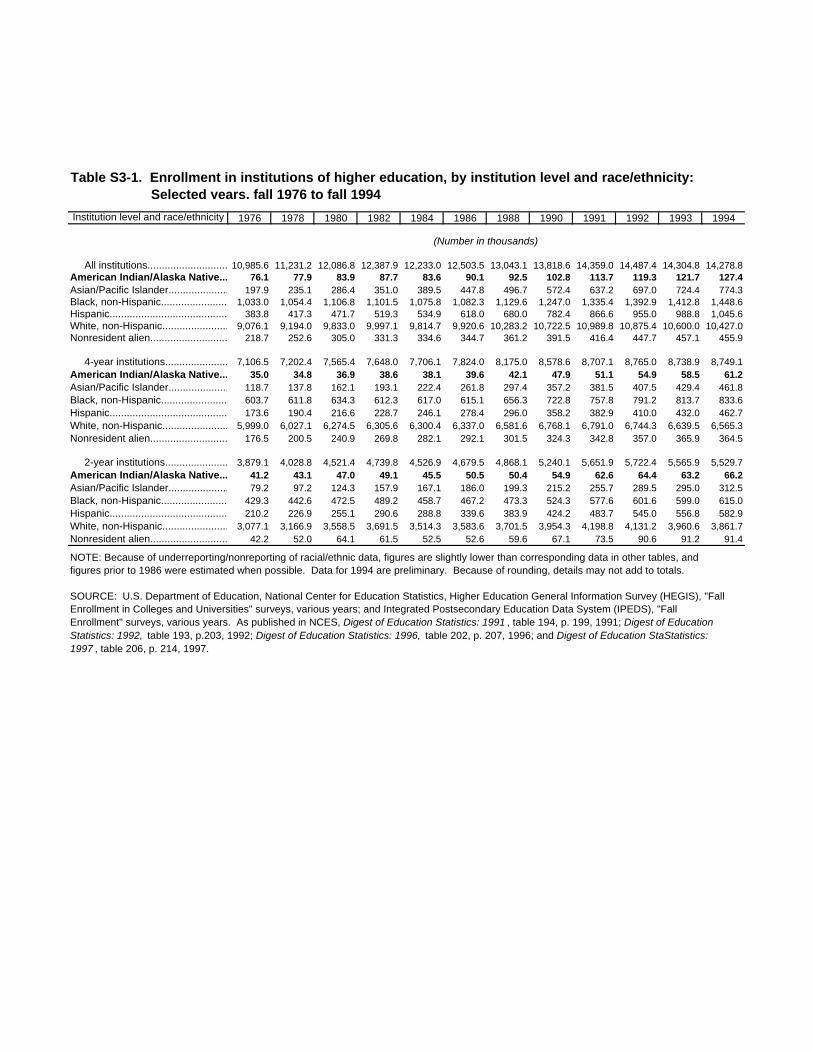
Institution level and race/ethnicity 1976 1978 1980 1982 1984 1986 1988 1990 1991 1992 1993 1994
(Number in thousands)
All institutions.......................................................10,985.6 11,231.2 12,086.8 12,387.9 12,233.0 12,503.5 13,043.1 13,818.6 14,359.0 14,487.4 14,304.8 14,278.8American Indian/Alaska Native...................76.1 77.9 83.9 87.7 83.6 90.1 92.5 102.8 113.7 119.3 121.7 127.4Asian/Pacific Islander.....................................197.9 235.1 286.4 351.0 389.5 447.8 496.7 572.4 637.2 697.0 724.4 774.3Black, non-Hispanic........................................1,033.0 1,054.4 1,106.8 1,101.5 1,075.8 1,082.3 1,129.6 1,247.0 1,335.4 1,392.9 1,412.8 1,448.6Hispanic...............................................................383.8 417.3 471.7 519.3 534.9 618.0 680.0 782.4 866.6 955.0 988.8 1,045.6White, non-Hispanic...........................................9,076.1 9,194.0 9,833.0 9,997.1 9,814.7 9,920.6 10,283.2 10,722.5 10,989.8 10,875.4 10,600.0 10,427.0Nonresident alien..............................................218.7 252.6 305.0 331.3 334.6 344.7 361.2 391.5 416.4 447.7 457.1 455.9
4-year institutions.......................................................7,106.5 7,202.4 7,565.4 7,648.0 7,706.1 7,824.0 8,175.0 8,578.6 8,707.1 8,765.0 8,738.9 8,749.1American Indian/Alaska Native...................35.0 34.8 36.9 38.6 38.1 39.6 42.1 47.9 51.1 54.9 58.5 61.2Asian/Pacific Islander.....................................118.7 137.8 162.1 193.1 222.4 261.8 297.4 357.2 381.5 407.5 429.4 461.8Black, non-Hispanic........................................603.7 611.8 634.3 612.3 617.0 615.1 656.3 722.8 757.8 791.2 813.7 833.6Hispanic...............................................................173.6 190.4 216.6 228.7 246.1 278.4 296.0 358.2 382.9 410.0 432.0 462.7White, non-Hispanic...........................................5,999.0 6,027.1 6,274.5 6,305.6 6,300.4 6,337.0 6,581.6 6,768.1 6,791.0 6,744.3 6,639.5 6,565.3Nonresident alien..............................................176.5 200.5 240.9 269.8 282.1 292.1 301.5 324.3 342.8 357.0 365.9 364.5
2-year institutions.......................................................3,879.1 4,028.8 4,521.4 4,739.8 4,526.9 4,679.5 4,868.1 5,240.1 5,651.9 5,722.4 5,565.9 5,529.7American Indian/Alaska Native...................41.2 43.1 47.0 49.1 45.5 50.5 50.4 54.9 62.6 64.4 63.2 66.2Asian/Pacific Islander.....................................79.2 97.2 124.3 157.9 167.1 186.0 199.3 215.2 255.7 289.5 295.0 312.5Black, non-Hispanic........................................429.3 442.6 472.5 489.2 458.7 467.2 473.3 524.3 577.6 601.6 599.0 615.0Hispanic...............................................................210.2 226.9 255.1 290.6 288.8 339.6 383.9 424.2 483.7 545.0 556.8 582.9White, non-Hispanic...........................................3,077.1 3,166.9 3,558.5 3,691.5 3,514.3 3,583.6 3,701.5 3,954.3 4,198.8 4,131.2 3,960.6 3,861.7Nonresident alien..............................................42.2 52.0 64.1 61.5 52.5 52.6 59.6 67.1 73.5 90.6 91.2 91.4
NOTE: Because of underreporting/nonreporting of racial/ethnic data, figures are slightly lower than corresponding data in other tables, and figures prior to 1986 were estimated when possible. Data for 1994 are preliminary. Because of rounding, details may not add to totals.
SOURCE: U.S. Department of Education, National Center for Education Statistics, Higher Education General Information Survey (HEGIS), "Fall Enrollment in Colleges and Universities" surveys, various years; and Integrated Postsecondary Education Data System (IPEDS), "Fall Enrollment" surveys, various years. As published in NCES, Digest of Education Statistics: 1991 , table 194, p. 199, 1991; Digest of Education Statistics: 1992, table 193, p.203, 1992; Digest of Education Statistics: 1996, table 202, p. 207, 1996; and Digest of Education StaStatistics: 1997 , table 206, p. 214, 1997.
Table S3-1. Enrollment in institutions of higher education, by institution level and race/ethnicity: Selected years, fall 1976 to fall 1994
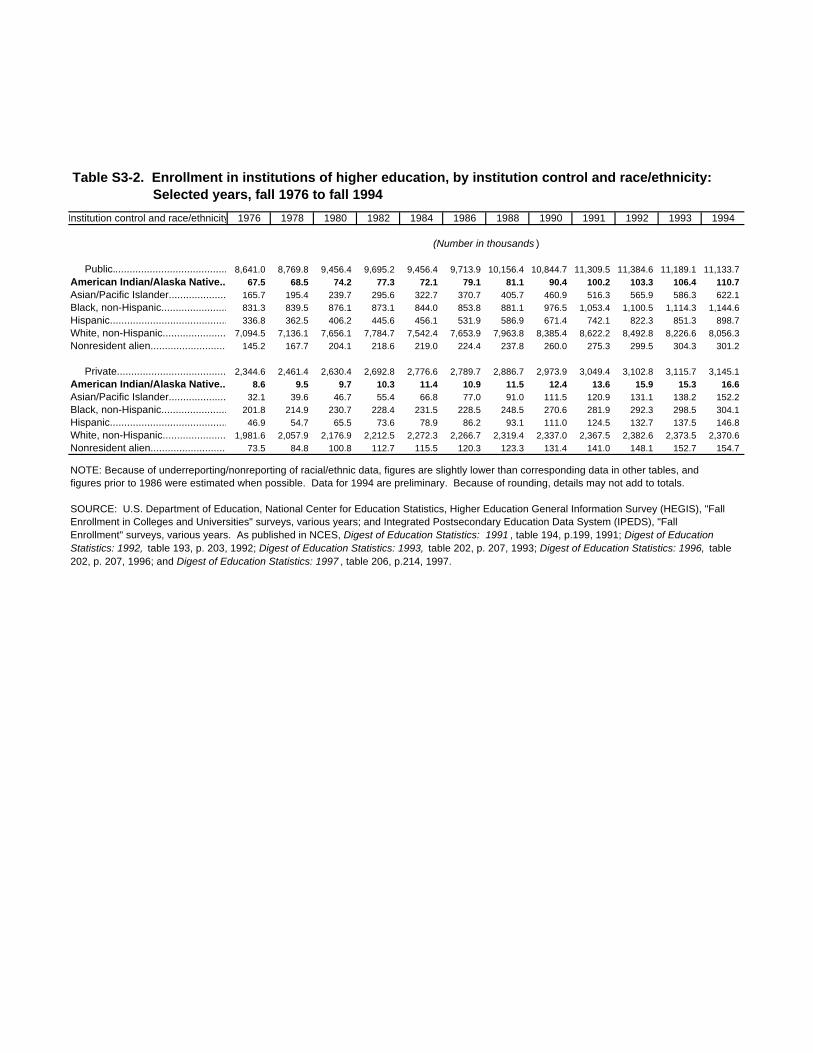
Institution control and race/ethnicity 1976 1978 1980 1982 1984 1986 1988 1990 1991 1992 1993 1994
(Number in thousands )
Public........................................................................8,641.0 8,769.8 9,456.4 9,695.2 9,456.4 9,713.9 10,156.4 10,844.7 11,309.5 11,384.6 11,189.1 11,133.7American Indian/Alaska Native....................67.5 68.5 74.2 77.3 72.1 79.1 81.1 90.4 100.2 103.3 106.4 110.7Asian/Pacific Islander.......................................165.7 195.4 239.7 295.6 322.7 370.7 405.7 460.9 516.3 565.9 586.3 622.1Black, non-Hispanic..........................................831.3 839.5 876.1 873.1 844.0 853.8 881.1 976.5 1,053.4 1,100.5 1,114.3 1,144.6Hispanic................................................................336.8 362.5 406.2 445.6 456.1 531.9 586.9 671.4 742.1 822.3 851.3 898.7White, non-Hispanic...........................................7,094.5 7,136.1 7,656.1 7,784.7 7,542.4 7,653.9 7,963.8 8,385.4 8,622.2 8,492.8 8,226.6 8,056.3Nonresident alien................................................145.2 167.7 204.1 218.6 219.0 224.4 237.8 260.0 275.3 299.5 304.3 301.2
Private.......................................................2,344.6 2,461.4 2,630.4 2,692.8 2,776.6 2,789.7 2,886.7 2,973.9 3,049.4 3,102.8 3,115.7 3,145.1American Indian/Alaska Native....................8.6 9.5 9.7 10.3 11.4 10.9 11.5 12.4 13.6 15.9 15.3 16.6Asian/Pacific Islander.......................................32.1 39.6 46.7 55.4 66.8 77.0 91.0 111.5 120.9 131.1 138.2 152.2Black, non-Hispanic..........................................201.8 214.9 230.7 228.4 231.5 228.5 248.5 270.6 281.9 292.3 298.5 304.1Hispanic................................................................46.9 54.7 65.5 73.6 78.9 86.2 93.1 111.0 124.5 132.7 137.5 146.8White, non-Hispanic...........................................1,981.6 2,057.9 2,176.9 2,212.5 2,272.3 2,266.7 2,319.4 2,337.0 2,367.5 2,382.6 2,373.5 2,370.6Nonresident alien................................................73.5 84.8 100.8 112.7 115.5 120.3 123.3 131.4 141.0 148.1 152.7 154.7
NOTE: Because of underreporting/nonreporting of racial/ethnic data, figures are slightly lower than corresponding data in other tables, and figures prior to 1986 were estimated when possible. Data for 1994 are preliminary. Because of rounding, details may not add to totals.
SOURCE: U.S. Department of Education, National Center for Education Statistics, Higher Education General Information Survey (HEGIS), "Fall Enrollment in Colleges and Universities" surveys, various years; and Integrated Postsecondary Education Data System (IPEDS), "Fall Enrollment" surveys, various years. As published in NCES, Digest of Education Statistics: 1991 , table 194, p.199, 1991; Digest of Education Statistics: 1992, table 193, p. 203, 1992; Digest of Education Statistics: 1993, table 202, p. 207, 1993; Digest of Education Statistics: 1996, table 202, p. 207, 1996; and Digest of Education Statistics: 1997 , table 206, p.214, 1997.
Table S3-2. Enrollment in institutions of higher education, by institution control and race/ethnicity: Selected years, fall 1976 to fall 1994
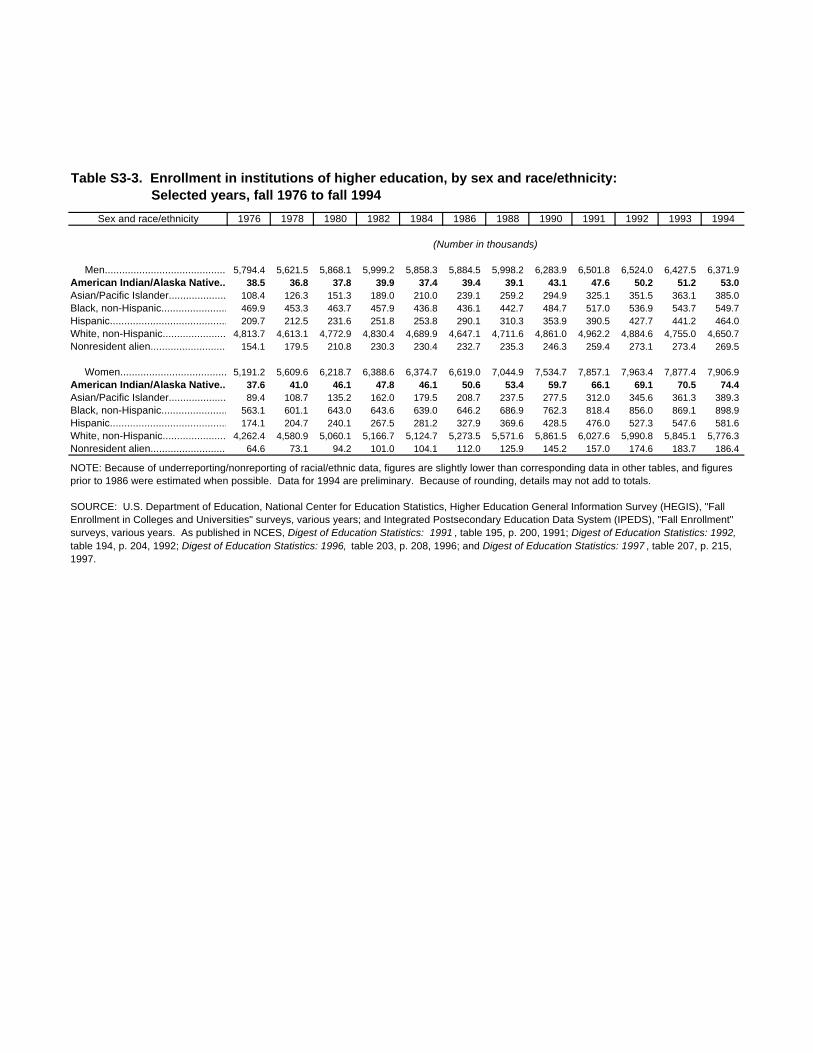
Sex and race/ethnicity 1976 1978 1980 1982 1984 1986 1988 1990 1991 1992 1993 1994
(Number in thousands)
Men...........................................................................5,794.4 5,621.5 5,868.1 5,999.2 5,858.3 5,884.5 5,998.2 6,283.9 6,501.8 6,524.0 6,427.5 6,371.9American Indian/Alaska Native....................38.5 36.8 37.8 39.9 37.4 39.4 39.1 43.1 47.6 50.2 51.2 53.0Asian/Pacific Islander......................................108.4 126.3 151.3 189.0 210.0 239.1 259.2 294.9 325.1 351.5 363.1 385.0Black, non-Hispanic.........................................469.9 453.3 463.7 457.9 436.8 436.1 442.7 484.7 517.0 536.9 543.7 549.7Hispanic...............................................................209.7 212.5 231.6 251.8 253.8 290.1 310.3 353.9 390.5 427.7 441.2 464.0White, non-Hispanic...........................................4,813.7 4,613.1 4,772.9 4,830.4 4,689.9 4,647.1 4,711.6 4,861.0 4,962.2 4,884.6 4,755.0 4,650.7Nonresident alien................................................154.1 179.5 210.8 230.3 230.4 232.7 235.3 246.3 259.4 273.1 273.4 269.5
Women...................................................................5,191.2 5,609.6 6,218.7 6,388.6 6,374.7 6,619.0 7,044.9 7,534.7 7,857.1 7,963.4 7,877.4 7,906.9American Indian/Alaska Native....................37.6 41.0 46.1 47.8 46.1 50.6 53.4 59.7 66.1 69.1 70.5 74.4Asian/Pacific Islander......................................89.4 108.7 135.2 162.0 179.5 208.7 237.5 277.5 312.0 345.6 361.3 389.3Black, non-Hispanic.........................................563.1 601.1 643.0 643.6 639.0 646.2 686.9 762.3 818.4 856.0 869.1 898.9Hispanic...............................................................174.1 204.7 240.1 267.5 281.2 327.9 369.6 428.5 476.0 527.3 547.6 581.6White, non-Hispanic...........................................4,262.4 4,580.9 5,060.1 5,166.7 5,124.7 5,273.5 5,571.6 5,861.5 6,027.6 5,990.8 5,845.1 5,776.3Nonresident alien................................................64.6 73.1 94.2 101.0 104.1 112.0 125.9 145.2 157.0 174.6 183.7 186.4
NOTE: Because of underreporting/nonreporting of racial/ethnic data, figures are slightly lower than corresponding data in other tables, and figures prior to 1986 were estimated when possible. Data for 1994 are preliminary. Because of rounding, details may not add to totals.
SOURCE: U.S. Department of Education, National Center for Education Statistics, Higher Education General Information Survey (HEGIS), "Fall Enrollment in Colleges and Universities" surveys, various years; and Integrated Postsecondary Education Data System (IPEDS), "Fall Enrollment" surveys, various years. As published in NCES, Digest of Education Statistics: 1991 , table 195, p. 200, 1991; Digest of Education Statistics: 1992, table 194, p. 204, 1992; Digest of Education Statistics: 1996, table 203, p. 208, 1996; and Digest of Education Statistics: 1997 , table 207, p. 215, 1997.
Table S3-3. Enrollment in institutions of higher education, by sex and race/ethnicity: Selected years, fall 1976 to fall 1994
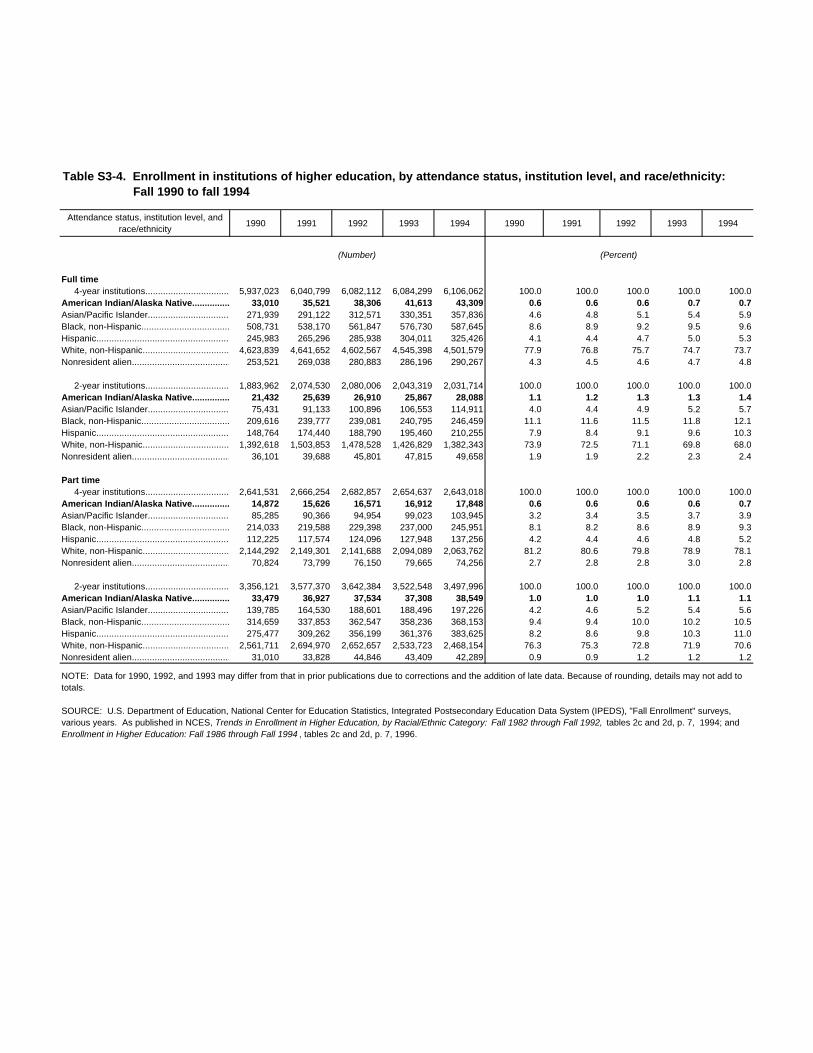
Attendance status, institution level, and race/ethnicity
1990 1991 1992 1993 1994 1990 1991 1992 1993 1994
(Number) (Percent)
Full time 4-year institutions................................... 5,937,023 6,040,799 6,082,112 6,084,299 6,106,062 100.0 100.0 100.0 100.0 100.0American Indian/Alaska Native............... 33,010 35,521 38,306 41,613 43,309 0.6 0.6 0.6 0.7 0.7Asian/Pacific Islander................................. 271,939 291,122 312,571 330,351 357,836 4.6 4.8 5.1 5.4 5.9Black, non-Hispanic........................................ 508,731 538,170 561,847 576,730 587,645 8.6 8.9 9.2 9.5 9.6Hispanic.................................................................245,983 265,296 285,938 304,011 325,426 4.1 4.4 4.7 5.0 5.3White, non-Hispanic.................................. 4,623,839 4,641,652 4,602,567 4,545,398 4,501,579 77.9 76.8 75.7 74.7 73.7Nonresident alien....................................... 253,521 269,038 280,883 286,196 290,267 4.3 4.5 4.6 4.7 4.8
2-year institutions.................................... 1,883,962 2,074,530 2,080,006 2,043,319 2,031,714 100.0 100.0 100.0 100.0 100.0American Indian/Alaska Native............... 21,432 25,639 26,910 25,867 28,088 1.1 1.2 1.3 1.3 1.4Asian/Pacific Islander................................. 75,431 91,133 100,896 106,553 114,911 4.0 4.4 4.9 5.2 5.7Black, non-Hispanic........................................ 209,616 239,777 239,081 240,795 246,459 11.1 11.6 11.5 11.8 12.1Hispanic.................................................................148,764 174,440 188,790 195,460 210,255 7.9 8.4 9.1 9.6 10.3White, non-Hispanic.................................. 1,392,618 1,503,853 1,478,528 1,426,829 1,382,343 73.9 72.5 71.1 69.8 68.0Nonresident alien....................................... 36,101 39,688 45,801 47,815 49,658 1.9 1.9 2.2 2.3 2.4
Part time 4-year institutions................................... 2,641,531 2,666,254 2,682,857 2,654,637 2,643,018 100.0 100.0 100.0 100.0 100.0American Indian/Alaska Native............... 14,872 15,626 16,571 16,912 17,848 0.6 0.6 0.6 0.6 0.7Asian/Pacific Islander................................. 85,285 90,366 94,954 99,023 103,945 3.2 3.4 3.5 3.7 3.9Black, non-Hispanic........................................ 214,033 219,588 229,398 237,000 245,951 8.1 8.2 8.6 8.9 9.3Hispanic.................................................................112,225 117,574 124,096 127,948 137,256 4.2 4.4 4.6 4.8 5.2White, non-Hispanic.................................. 2,144,292 2,149,301 2,141,688 2,094,089 2,063,762 81.2 80.6 79.8 78.9 78.1Nonresident alien....................................... 70,824 73,799 76,150 79,665 74,256 2.7 2.8 2.8 3.0 2.8
2-year institutions.................................... 3,356,121 3,577,370 3,642,384 3,522,548 3,497,996 100.0 100.0 100.0 100.0 100.0American Indian/Alaska Native............... 33,479 36,927 37,534 37,308 38,549 1.0 1.0 1.0 1.1 1.1Asian/Pacific Islander................................. 139,785 164,530 188,601 188,496 197,226 4.2 4.6 5.2 5.4 5.6Black, non-Hispanic........................................ 314,659 337,853 362,547 358,236 368,153 9.4 9.4 10.0 10.2 10.5Hispanic.................................................................275,477 309,262 356,199 361,376 383,625 8.2 8.6 9.8 10.3 11.0White, non-Hispanic.................................. 2,561,711 2,694,970 2,652,657 2,533,723 2,468,154 76.3 75.3 72.8 71.9 70.6Nonresident alien....................................... 31,010 33,828 44,846 43,409 42,289 0.9 0.9 1.2 1.2 1.2
NOTE: Data for 1990, 1992, and 1993 may differ from that in prior publications due to corrections and the addition of late data. Because of rounding, details may not add to totals.
SOURCE: U.S. Department of Education, National Center for Education Statistics, Integrated Postsecondary Education Data System (IPEDS), "Fall Enrollment" surveys, various years. As published in NCES, Trends in Enrollment in Higher Education, by Racial/Ethnic Category: Fall 1982 through Fall 1992, tables 2c and 2d, p. 7, 1994; and Enrollment in Higher Education: Fall 1986 through Fall 1994 , tables 2c and 2d, p. 7, 1996.
Table S3-4. Enrollment in institutions of higher education, by attendance status, institution level, and race/ethnicity: Fall 1990 to fall 1994
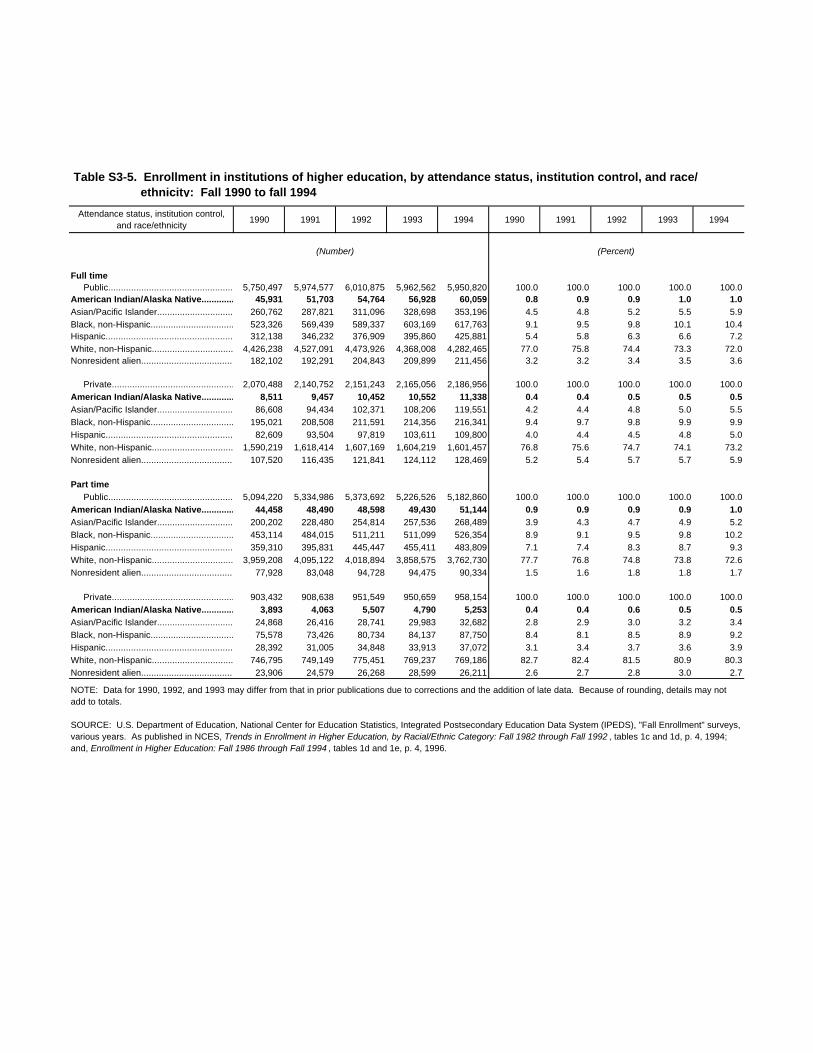
Attendance status, institution control,
and race/ethnicity1990 1991 1992 1993 1994 1990 1991 1992 1993 1994
(Number) (Percent)
Full time Public.................................................................5,750,497 5,974,577 6,010,875 5,962,562 5,950,820 100.0 100.0 100.0 100.0 100.0American Indian/Alaska Native................. 45,931 51,703 54,764 56,928 60,059 0.8 0.9 0.9 1.0 1.0Asian/Pacific Islander.................................. 260,762 287,821 311,096 328,698 353,196 4.5 4.8 5.2 5.5 5.9Black, non-Hispanic...................................... 523,326 569,439 589,337 603,169 617,763 9.1 9.5 9.8 10.1 10.4Hispanic...........................................................312,138 346,232 376,909 395,860 425,881 5.4 5.8 6.3 6.6 7.2White, non-Hispanic....................................4,426,238 4,527,091 4,473,926 4,368,008 4,282,465 77.0 75.8 74.4 73.3 72.0Nonresident alien........................................ 182,102 192,291 204,843 209,899 211,456 3.2 3.2 3.4 3.5 3.6
Private..............................................................2,070,488 2,140,752 2,151,243 2,165,056 2,186,956 100.0 100.0 100.0 100.0 100.0American Indian/Alaska Native................. 8,511 9,457 10,452 10,552 11,338 0.4 0.4 0.5 0.5 0.5Asian/Pacific Islander.................................. 86,608 94,434 102,371 108,206 119,551 4.2 4.4 4.8 5.0 5.5Black, non-Hispanic...................................... 195,021 208,508 211,591 214,356 216,341 9.4 9.7 9.8 9.9 9.9Hispanic...........................................................82,609 93,504 97,819 103,611 109,800 4.0 4.4 4.5 4.8 5.0White, non-Hispanic....................................1,590,219 1,618,414 1,607,169 1,604,219 1,601,457 76.8 75.6 74.7 74.1 73.2Nonresident alien........................................ 107,520 116,435 121,841 124,112 128,469 5.2 5.4 5.7 5.7 5.9
Part time Public.................................................................5,094,220 5,334,986 5,373,692 5,226,526 5,182,860 100.0 100.0 100.0 100.0 100.0American Indian/Alaska Native................. 44,458 48,490 48,598 49,430 51,144 0.9 0.9 0.9 0.9 1.0Asian/Pacific Islander.................................. 200,202 228,480 254,814 257,536 268,489 3.9 4.3 4.7 4.9 5.2Black, non-Hispanic...................................... 453,114 484,015 511,211 511,099 526,354 8.9 9.1 9.5 9.8 10.2Hispanic...........................................................359,310 395,831 445,447 455,411 483,809 7.1 7.4 8.3 8.7 9.3White, non-Hispanic....................................3,959,208 4,095,122 4,018,894 3,858,575 3,762,730 77.7 76.8 74.8 73.8 72.6Nonresident alien........................................ 77,928 83,048 94,728 94,475 90,334 1.5 1.6 1.8 1.8 1.7
Private..............................................................903,432 908,638 951,549 950,659 958,154 100.0 100.0 100.0 100.0 100.0American Indian/Alaska Native................. 3,893 4,063 5,507 4,790 5,253 0.4 0.4 0.6 0.5 0.5Asian/Pacific Islander.................................. 24,868 26,416 28,741 29,983 32,682 2.8 2.9 3.0 3.2 3.4Black, non-Hispanic...................................... 75,578 73,426 80,734 84,137 87,750 8.4 8.1 8.5 8.9 9.2Hispanic...........................................................28,392 31,005 34,848 33,913 37,072 3.1 3.4 3.7 3.6 3.9White, non-Hispanic.................................... 746,795 749,149 775,451 769,237 769,186 82.7 82.4 81.5 80.9 80.3Nonresident alien........................................ 23,906 24,579 26,268 28,599 26,211 2.6 2.7 2.8 3.0 2.7
NOTE: Data for 1990, 1992, and 1993 may differ from that in prior publications due to corrections and the addition of late data. Because of rounding, details may not add to totals.
SOURCE: U.S. Department of Education, National Center for Education Statistics, Integrated Postsecondary Education Data System (IPEDS), "Fall Enrollment" surveys, various years. As published in NCES, Trends in Enrollment in Higher Education, by Racial/Ethnic Category: Fall 1982 through Fall 1992 , tables 1c and 1d, p. 4, 1994; and, Enrollment in Higher Education: Fall 1986 through Fall 1994 , tables 1d and 1e, p. 4, 1996.
Table S3-5. Enrollment in institutions of higher education, by attendance status, institution control, and race/ ethnicity: Fall 1990 to fall 1994
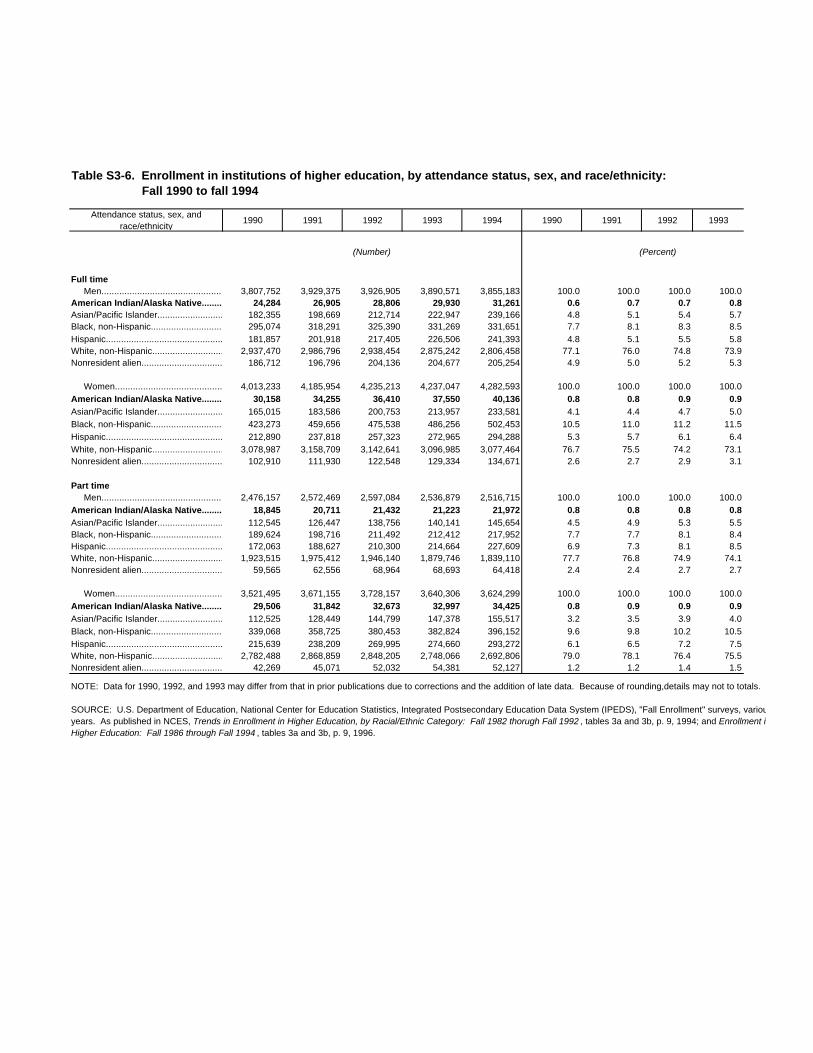
Attendance status, sex, and race/ethnicity
1990 1991 1992 1993 1994 1990 1991 1992 1993
(Number) (Percent)
Full time Men.................................................................3,807,752 3,929,375 3,926,905 3,890,571 3,855,183 100.0 100.0 100.0 100.0American Indian/Alaska Native............... 24,284 26,905 28,806 29,930 31,261 0.6 0.7 0.7 0.8Asian/Pacific Islander................................. 182,355 198,669 212,714 222,947 239,166 4.8 5.1 5.4 5.7Black, non-Hispanic.................................... 295,074 318,291 325,390 331,269 331,651 7.7 8.1 8.3 8.5Hispanic..........................................................181,857 201,918 217,405 226,506 241,393 4.8 5.1 5.5 5.8White, non-Hispanic....................................2,937,470 2,986,796 2,938,454 2,875,242 2,806,458 77.1 76.0 74.8 73.9Nonresident alien......................................... 186,712 196,796 204,136 204,677 205,254 4.9 5.0 5.2 5.3
Women............................................................4,013,233 4,185,954 4,235,213 4,237,047 4,282,593 100.0 100.0 100.0 100.0American Indian/Alaska Native............... 30,158 34,255 36,410 37,550 40,136 0.8 0.8 0.9 0.9Asian/Pacific Islander................................. 165,015 183,586 200,753 213,957 233,581 4.1 4.4 4.7 5.0Black, non-Hispanic.................................... 423,273 459,656 475,538 486,256 502,453 10.5 11.0 11.2 11.5Hispanic..........................................................212,890 237,818 257,323 272,965 294,288 5.3 5.7 6.1 6.4White, non-Hispanic....................................3,078,987 3,158,709 3,142,641 3,096,985 3,077,464 76.7 75.5 74.2 73.1Nonresident alien......................................... 102,910 111,930 122,548 129,334 134,671 2.6 2.7 2.9 3.1
Part time Men.................................................................2,476,157 2,572,469 2,597,084 2,536,879 2,516,715 100.0 100.0 100.0 100.0American Indian/Alaska Native............... 18,845 20,711 21,432 21,223 21,972 0.8 0.8 0.8 0.8Asian/Pacific Islander................................. 112,545 126,447 138,756 140,141 145,654 4.5 4.9 5.3 5.5Black, non-Hispanic.................................... 189,624 198,716 211,492 212,412 217,952 7.7 7.7 8.1 8.4Hispanic..........................................................172,063 188,627 210,300 214,664 227,609 6.9 7.3 8.1 8.5White, non-Hispanic....................................1,923,515 1,975,412 1,946,140 1,879,746 1,839,110 77.7 76.8 74.9 74.1Nonresident alien......................................... 59,565 62,556 68,964 68,693 64,418 2.4 2.4 2.7 2.7
Women............................................................3,521,495 3,671,155 3,728,157 3,640,306 3,624,299 100.0 100.0 100.0 100.0American Indian/Alaska Native............... 29,506 31,842 32,673 32,997 34,425 0.8 0.9 0.9 0.9Asian/Pacific Islander................................. 112,525 128,449 144,799 147,378 155,517 3.2 3.5 3.9 4.0Black, non-Hispanic.................................... 339,068 358,725 380,453 382,824 396,152 9.6 9.8 10.2 10.5Hispanic..........................................................215,639 238,209 269,995 274,660 293,272 6.1 6.5 7.2 7.5White, non-Hispanic....................................2,782,488 2,868,859 2,848,205 2,748,066 2,692,806 79.0 78.1 76.4 75.5Nonresident alien......................................... 42,269 45,071 52,032 54,381 52,127 1.2 1.2 1.4 1.5
NOTE: Data for 1990, 1992, and 1993 may differ from that in prior publications due to corrections and the addition of late data. Because of rounding,details may not to totals.
SOURCE: U.S. Department of Education, National Center for Education Statistics, Integrated Postsecondary Education Data System (IPEDS), "Fall Enrollment" surveys, various years. As published in NCES, Trends in Enrollment in Higher Education, by Racial/Ethnic Category: Fall 1982 thorugh Fall 1992 , tables 3a and 3b, p. 9, 1994; and Enrollment in Higher Education: Fall 1986 through Fall 1994 , tables 3a and 3b, p. 9, 1996.
Table S3-6. Enrollment in institutions of higher education, by attendance status, sex, and race/ethnicity: Fall 1990 to fall 1994
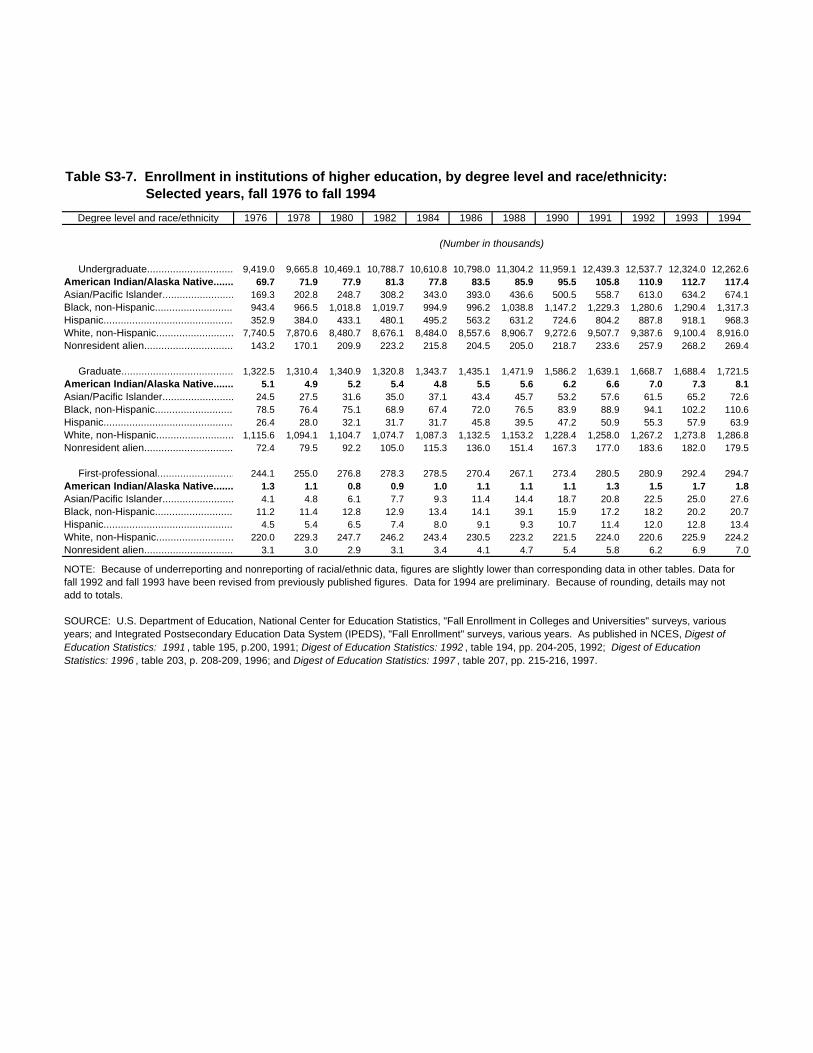
Degree level and race/ethnicity 1976 1978 1980 1982 1984 1986 1988 1990 1991 1992 1993 1994
(Number in thousands)
Undergraduate......................................................................9,419.0 9,665.8 10,469.1 10,788.7 10,610.8 10,798.0 11,304.2 11,959.1 12,439.3 12,537.7 12,324.0 12,262.6American Indian/Alaska Native.....................................69.7 71.9 77.9 81.3 77.8 83.5 85.9 95.5 105.8 110.9 112.7 117.4Asian/Pacific Islander....................................................169.3 202.8 248.7 308.2 343.0 393.0 436.6 500.5 558.7 613.0 634.2 674.1Black, non-Hispanic.........................................................943.4 966.5 1,018.8 1,019.7 994.9 996.2 1,038.8 1,147.2 1,229.3 1,280.6 1,290.4 1,317.3Hispanic..................................................................................352.9 384.0 433.1 480.1 495.2 563.2 631.2 724.6 804.2 887.8 918.1 968.3White, non-Hispanic...............................................................7,740.5 7,870.6 8,480.7 8,676.1 8,484.0 8,557.6 8,906.7 9,272.6 9,507.7 9,387.6 9,100.4 8,916.0Nonresident alien.....................................................................143.2 170.1 209.9 223.2 215.8 204.5 205.0 218.7 233.6 257.9 268.2 269.4
Graduate.................................................................1,322.5 1,310.4 1,340.9 1,320.8 1,343.7 1,435.1 1,471.9 1,586.2 1,639.1 1,668.7 1,688.4 1,721.5American Indian/Alaska Native.....................................5.1 4.9 5.2 5.4 4.8 5.5 5.6 6.2 6.6 7.0 7.3 8.1Asian/Pacific Islander....................................................24.5 27.5 31.6 35.0 37.1 43.4 45.7 53.2 57.6 61.5 65.2 72.6Black, non-Hispanic.........................................................78.5 76.4 75.1 68.9 67.4 72.0 76.5 83.9 88.9 94.1 102.2 110.6Hispanic..................................................................................26.4 28.0 32.1 31.7 31.7 45.8 39.5 47.2 50.9 55.3 57.9 63.9White, non-Hispanic...............................................................1,115.6 1,094.1 1,104.7 1,074.7 1,087.3 1,132.5 1,153.2 1,228.4 1,258.0 1,267.2 1,273.8 1,286.8Nonresident alien.....................................................................72.4 79.5 92.2 105.0 115.3 136.0 151.4 167.3 177.0 183.6 182.0 179.5
First-professional...............................................................244.1 255.0 276.8 278.3 278.5 270.4 267.1 273.4 280.5 280.9 292.4 294.7American Indian/Alaska Native.....................................1.3 1.1 0.8 0.9 1.0 1.1 1.1 1.1 1.3 1.5 1.7 1.8Asian/Pacific Islander....................................................4.1 4.8 6.1 7.7 9.3 11.4 14.4 18.7 20.8 22.5 25.0 27.6Black, non-Hispanic.........................................................11.2 11.4 12.8 12.9 13.4 14.1 39.1 15.9 17.2 18.2 20.2 20.7Hispanic..................................................................................4.5 5.4 6.5 7.4 8.0 9.1 9.3 10.7 11.4 12.0 12.8 13.4White, non-Hispanic...............................................................220.0 229.3 247.7 246.2 243.4 230.5 223.2 221.5 224.0 220.6 225.9 224.2Nonresident alien.....................................................................3.1 3.0 2.9 3.1 3.4 4.1 4.7 5.4 5.8 6.2 6.9 7.0
NOTE: Because of underreporting and nonreporting of racial/ethnic data, figures are slightly lower than corresponding data in other tables. Data for fall 1992 and fall 1993 have been revised from previously published figures. Data for 1994 are preliminary. Because of rounding, details may not add to totals.
SOURCE: U.S. Department of Education, National Center for Education Statistics, "Fall Enrollment in Colleges and Universities" surveys, various years; and Integrated Postsecondary Education Data System (IPEDS), "Fall Enrollment" surveys, various years. As published in NCES, Digest of Education Statistics: 1991 , table 195, p.200, 1991; Digest of Education Statistics: 1992 , table 194, pp. 204-205, 1992; Digest of Education Statistics: 1996 , table 203, p. 208-209, 1996; and Digest of Education Statistics: 1997 , table 207, pp. 215-216, 1997.
Table S3-7. Enrollment in institutions of higher education, by degree level and race/ethnicity: Selected years, fall 1976 to fall 1994
Degrees Conferred onAmerican Indiansand Alaska Nativesby Institutions ofHigher Education
l4
Degrees Conferred
4-1
n 1993-94, 2.2 million degrees (associate’s, bachelor’s, master’s, doctor’s, and
first professional) were awarded by institutions of higher education (IHEs). Of
these, 13,262, or about 0.6 percent of the total, were awarded to American
Indians and Alaska Natives 1 (figure 4-1 and summary table S4-1). This
represents an increase from the 0.4 percent of all degrees that were earned by
American Indians and Alaska Natives in 1976-77 (figure 4-1).
This chapter summarizes data on the number of degrees awarded to American
Indians and Alaska Natives and on the characteristics of recent degree
recipients, including their educational and employment experiences.
Information is also presented on the IHEs and tribal colleges awarding the most
degrees to American Indian and Alaska Native students. As in other chapters,
comparisons are typically made between degrees attained by Native Americans
and degrees attained by graduates at all IHEs. The summary tables referred to
in the text appear at the end of the chapter.
HIGHLIGHTS
# Between 1976-77 and 1993-94, American Indians’ and Alaska Natives’share of total degrees awarded by IHEs went from 0.4 percent to 0.6 percentof all degrees awarded (table 4-1).
# Between 1976-77 and 1993-94, the number of associate’s degreesconferred increased by 95 percent for Native Americans compared with 31percent for the total population of recipients. The number of bachelor’sdegrees conferred increased by 86 percent for Native Americans comparedwith 27 percent for degree recipients overall. The number of master’sdegrees awarded to American Indians and Alaska Natives increased by 75percent, and the number of first-professional degrees increased by 89percent compared to increases of 22 percent and 18 percent, respectively,for all degree recipients (table 4-1).
# American Indians and Alaska Natives were awarded 134 doctoral degreesin 1993-94, an increase of 41 percent from the number awarded in 1976-77. Overall, doctoral degree attainment increased by 30 percent over thesame time period (table 4-1).
1The terms “Native American” and “American Indian and Alaska Native” are used interchangeably throughout the chapter.
I
l
4-2
# Since 1976-77, American Indian and Alaska Native women as well aswomen overall increased their shares of the degrees awarded. By 1993-94American Indian and Alaska Native women earned over half of theassociate’s, bachelor’s, master’s, and doctor’s degrees awarded to NativeAmericans (table 4-3).
# In 1993-94, the three most frequent major fields of study for AmericanIndian and Alaska Natives bachelor’s degree recipients and all bachelor’sdegree recipients were business and management, social sciences, andeducation (figure 4-5).
# About one-third of master’s (36 percent) and doctoral degrees (31 percent)awarded to American Indian and Alaska Natives in 1993-94 were ineducation (summary tables S4-3 and S4-4).
# In 1992-93, about 82 percent of American Indian and Alaska Nativebachelor’s degree recipients graduated from public institutions. Among allbachelor’s degree recipients, about 65 percent graduated from publicinstitutions (figure 4-7).
# About one-third (31 percent) of American Indian and Alaska Nativebachelor’s degree recipients began at 2-year institutions, and almost three-fourths (73 percent) had attended more than one higher educationinstitution by graduation (figure 4-7).
# One year after graduation, 87 percent of both American Indian and AlaskaNative bachelor’s degree recipients and all bachelor’s degree recipients wereemployed (figure 4-8).
# The average 1994 annual salary of 1992-93 Native American bachelor’sdegree recipients was $24,400. For all graduates, the average annual salarywas $24,200 (summary table S4-6).
# One year after graduating with a bachelor’s degree, about 9 percent ofAmerican Indians and Alaska Natives were full-time students and 6 percentwere part-time students. Among all bachelor’s degree graduates, about 12percent were enrolled full time and 6 percent were enrolled part time (figure4-10).
# Among American Indians and Alaska Natives, the median registered yearsfrom baccalaureate to doctoral degree was 7.5 years. Among all doctoraldegree recipients, the median was 7.2 years (table 4-4).
# Among American Indian and Alaska Native doctoral degree recipients,about 74 percent planned on employment and 22 percent planned onpostdoctoral study. This distribution of future plans resembled those of thetotal population of U.S. citizens who were doctoral recipients (figure 4-12).
Degrees Conferred
4-3
# Similar to the total doctoral degree recipients, the percentage of AmericanIndian and Alaska Natives having commitments to do postdoctoral studyhas increased, rising from 13 percent in 1979 to 26 percent in 1994 (figure4-13).
SOURCES OF DATA
The three major sources of data on degree completions and degree recipients
used in this chapter are (1) the NCES Integrated Postsecondary Educational Data
System (IPEDS) Completions survey, (2) the NCES Baccalaureate and
Beyond Longitudinal Study (B &B ) on the characteristics of
bachelor’s degree recipients and their employment and educational
status 1 year after graduation, and (3) the Survey of Earned
Doctorates (SED) on the characteristics and plans of doctoral recipients at the
time of degree completion.
The IPEDS Completions survey. The completions data presented in this
chapter are a subset of the data collected annually from all postsecondary
institutions through the IPEDS Completions survey. The data discussed are for
those institutions accredited at the college level by an agency recognized by the
U.S. Department of Education. These accredited schools are known as
institutions of higher education (IHEs), and they numbered about 3,600
institutions in 1993-94. IPEDS data have been used in conjunction with data
from the Higher Education General Information System (HEGIS) Degrees and
Other Formal Awards Conferred survey to present historical trends. The HEGIS
survey was replaced by the IPEDS survey in 1986.
Both HEGIS and IPEDS surveys are censuses of all institutions and, hence, are
not subject to sampling error. Data have been imputed for nonresponding
institutions and for partially missing data. Response rates are high, typically
around 95 percent, thus reducing the need for data imputation. For example, in
1992, the percentage of degrees imputed ranged from 1.0 percent for male
recipients of bachelor’s degrees to 5.5 percent for male recipients of associate’s
degrees.
$
l
4-4
In the Completions survey, data are collected by type of degree, program, and
sex and race/ethnicity of the student. Data by major represent program
classifications following the 1990 version of the Classification of Instructional
Programs (CIP), the standard U.S. Department of Education classification
scheme. It should be noted that minorities reported in the data were U.S.
citizens or those with resident status. In 1993-94, nonresident aliens accounted
for about 6 percent of all degrees awarded, about 3 percent of bachelor’s
degrees awarded, about 12 percent of all master’s awarded, and about 27
percent of doctor’s degrees awarded.2
Baccalaureate and Beyond. The second source of data for this chapter is the
NCES Baccalaureate and Beyond survey, based on a sample drawn from
participants in the 1993 National Postsecondary Student Aid Study (NPSAS:93)
who received their bachelor’s degrees between July 1992 and June 1993.
Approximately 12,500 NPSAS:93 respondents were identified as eligible for the
first B &B followup survey; 1,500 were later found to be ineligible. The final
number of respondents was 10,080, and fewer than 100 of them were
American Indians or Alaska Natives. The B &B study only followed NPSAS
respondents; nonrespondents were not included in the followup B &B sample.
The unweighted response rate to NPSAS:93 for the NPSAS:93 respondents who
were also part of the B &B cohort was about 72 percent. The subsequent B &B
followup survey response rate was 92 percent.
The B &B study was conducted between July and December of 1994, about 1
year after respondents had completed their bachelor’s degrees. The data cover
employment and education outcomes as well as degree recipient and
institutional characteristics. The sample included a small number of American
Indian and Alaska Natives (75 Native Americans of which 70 responded). Thus,
the standard errors are higher for American Indians and Alaska Natives than for
any of the other racial/ethnic groups.
The Survey of Earned Doctorates. Statistics are also presented from the
Survey of Earned Doctorates (SED), a census of all recipients of doctoral degrees
conferred by U.S. institutions. The survey is jointly sponsored by the National
Science Foundation, the U.S. Department of Education, the National Endowment
2As published in NCES, Digest of Education Statistics: 1996, tables 260, 263, and 266, pp. 287, 290, and 293, 1996.
Degrees Conferred
4-5
for the Humanities, the U.S. Department of Agriculture, and the National
Institute of Health. The SED questionnaire, which solicits information on field of
study, sex, race/ethnicity, financial support, time to degree, and immediate
postgraduation plans, is distributed with cooperation from graduate school
deans and completed by graduates as they finish the requirements for their
degrees. Degrees are reported from July 1 through June 30 of the following
year. Both research and applied-research degrees, such as Ph.D., D.Sc., and
Ed.D., in all fields are included. However, professional degrees, such as M.D.,
D.D.S., J.D., and Psy.D., are not covered. Response rates for the SED average 95
percent.
TOTAL NUMBER OF DEGREES CONFERRED
The percent increase in degrees awarded was larger for American Indians and
Alaska Natives than for the total IHE degree recipients in each of the degree
categories (associate’s, bachelor’s, master’s, first professional,
and doctor’s). Between 1976-77 and 1993-94, the number of
associate’s degrees awarded to American Indians and Alaska
Natives increased from 2,498 to 4,871 (a 95 percent increase),
and the number of bachelor’s degrees increased from 3,326 to 6,189 (an 86
percent increase; figure 4-1 and figure 4-2). During the same time period, the
total number of associate’s degrees awarded increased by about 31 percent and
the total number of bachelor’s degrees awarded increased by about 27 percent
(figure 4-2).
U
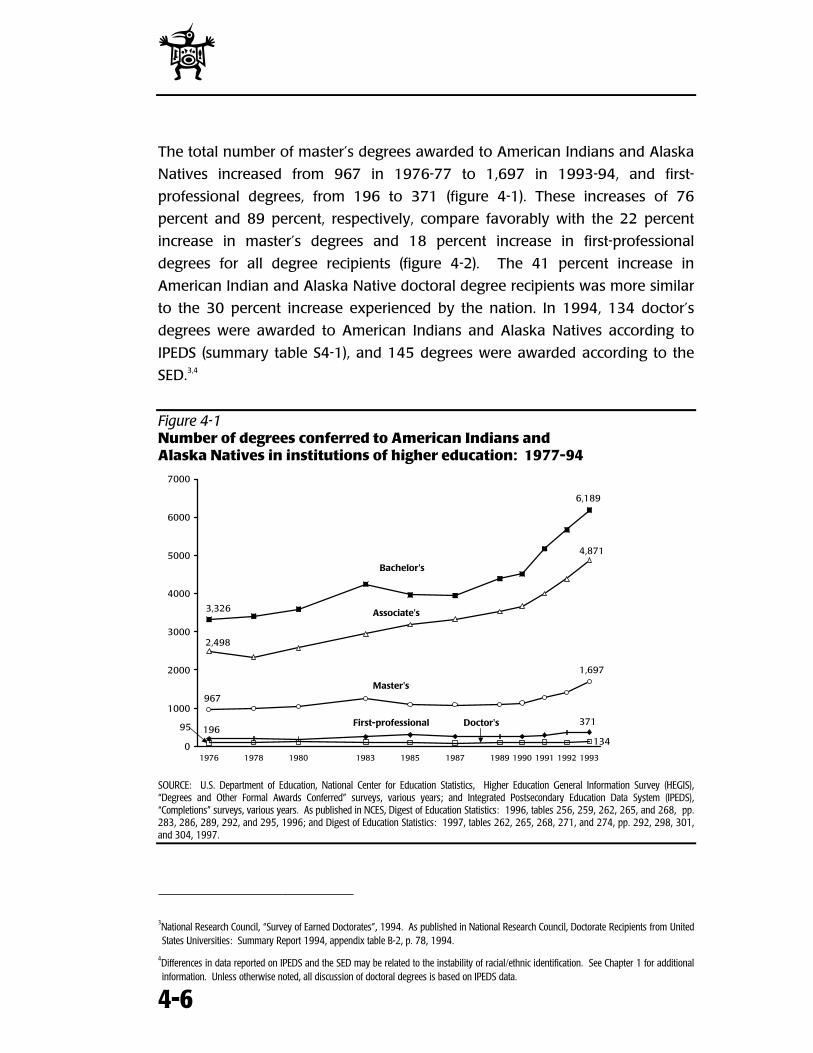
l
4-6
The total number of master’s degrees awarded to American Indians and Alaska
Natives increased from 967 in 1976-77 to 1,697 in 1993-94, and first-
professional degrees, from 196 to 371 (figure 4-1). These increases of 76
percent and 89 percent, respectively, compare favorably with the 22 percent
increase in master’s degrees and 18 percent increase in first-professional
degrees for all degree recipients (figure 4-2). The 41 percent increase in
American Indian and Alaska Native doctoral degree recipients was more similar
to the 30 percent increase experienced by the nation. In 1994, 134 doctor’s
degrees were awarded to American Indians and Alaska Natives according to
IPEDS (summary table S4-1), and 145 degrees were awarded according to the
SED.3,4
Figure 4-1Number of degrees conferred to American Indians andAlaska Natives in institutions of higher education: 1977-94
4,871
2,498
6,189
3,326
967
1,697
196371
95
1340
1000
2000
3000
4000
5000
6000
7000
1976 1978 1980 1983 1985 1987 1989 1990 1991 1992 1993
Bachelor's
Associate's
Master's
First-professional Doctor's
SOURCE: U.S. Department of Education, National Center for Education Statistics, Higher Education General Information Survey (HEGIS),“Degrees and Other Formal Awards Conferred” surveys, various years; and Integrated Postsecondary Education Data System (IPEDS),“Completions” surveys, various years. As published in NCES, Digest of Education Statistics: 1996, tables 256, 259, 262, 265, and 268, pp.283, 286, 289, 292, and 295, 1996; and Digest of Education Statistics: 1997, tables 262, 265, 268, 271, and 274, pp. 292, 298, 301,and 304, 1997.
3National Research Council, “Survey of Earned Doctorates”, 1994. As published in National Research Council, Doctorate Recipients from UnitedStates Universities: Summary Report 1994, appendix table B-2, p. 78, 1994.
4Differences in data reported on IPEDS and the SED may be related to the instability of racial/ethnic identification. See Chapter 1 for additionalinformation. Unless otherwise noted, all discussion of doctoral degrees is based on IPEDS data.
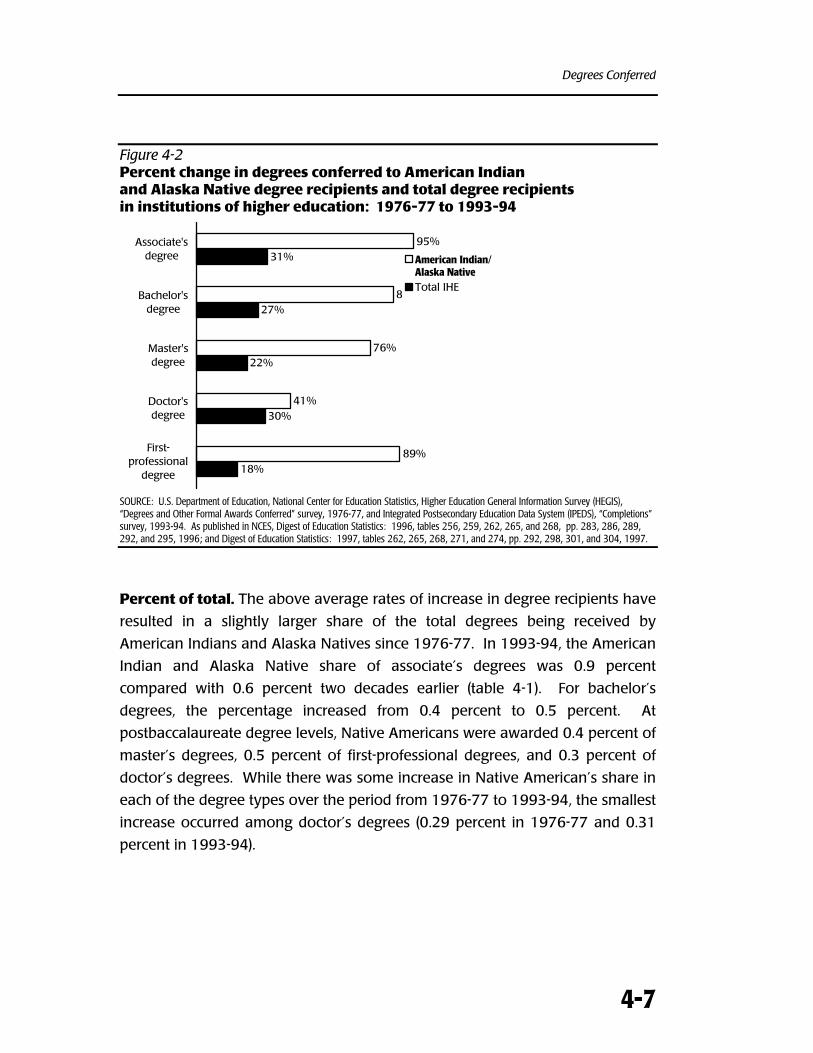
Degrees Conferred
4-7
Figure 4-2Percent change in degrees conferred to American Indianand Alaska Native degree recipients and total degree recipientsin institutions of higher education: 1976-77 to 1993-94
18%
30%
22%
27%
31%
89%
41%
76%
86%
95%
First-professional
degree
Doctor'sdegree
Master'sdegree
Bachelor'sdegree
Associate'sdegree American Indian/
Alaska NativeTotal IHE
SOURCE: U.S. Department of Education, National Center for Education Statistics, Higher Education General Information Survey (HEGIS),“Degrees and Other Formal Awards Conferred” survey, 1976-77, and Integrated Postsecondary Education Data System (IPEDS), “Completions”survey, 1993-94. As published in NCES, Digest of Education Statistics: 1996, tables 256, 259, 262, 265, and 268, pp. 283, 286, 289,292, and 295, 1996; and Digest of Education Statistics: 1997, tables 262, 265, 268, 271, and 274, pp. 292, 298, 301, and 304, 1997.
Percent of total. The above average rates of increase in degree recipients have
resulted in a slightly larger share of the total degrees being received by
American Indians and Alaska Natives since 1976-77. In 1993-94, the American
Indian and Alaska Native share of associate’s degrees was 0.9 percent
compared with 0.6 percent two decades earlier (table 4-1). For bachelor’s
degrees, the percentage increased from 0.4 percent to 0.5 percent. At
postbaccalaureate degree levels, Native Americans were awarded 0.4 percent of
master’s degrees, 0.5 percent of first-professional degrees, and 0.3 percent of
doctor’s degrees. While there was some increase in Native American’s share in
each of the degree types over the period from 1976-77 to 1993-94, the smallest
increase occurred among doctor’s degrees (0.29 percent in 1976-77 and 0.31
percent in 1993-94).
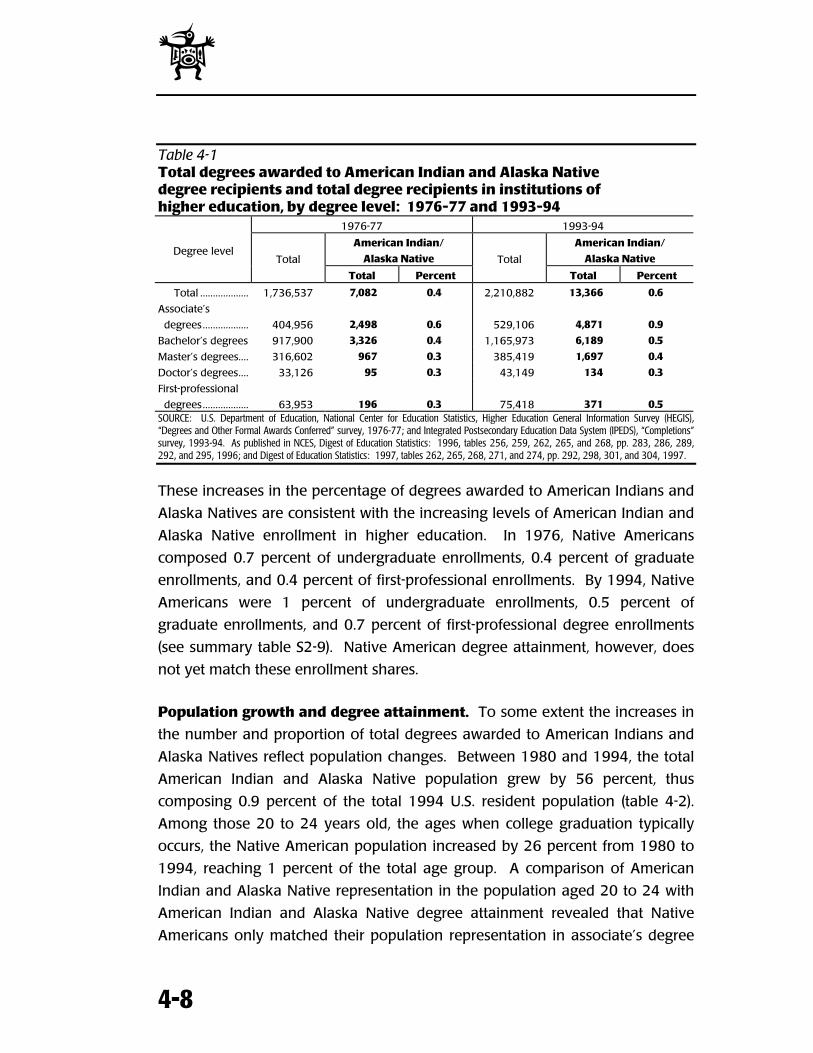
l
4-8
Table 4-1Total degrees awarded to American Indian and Alaska Nativedegree recipients and total degree recipients in institutions ofhigher education, by degree level: 1976-77 and 1993-94
1976-77 1993-94
American Indian/
Alaska Native
American Indian/
Alaska NativeDegree level
Total
Total Percent
Total
Total Percent
Total ................... 1,736,537 7,082 0.4 2,210,882 13,366 0.6
Associate’s
degrees.................. 404,956 2,498 0.6 529,106 4,871 0.9
Bachelor’s degrees 917,900 3,326 0.4 1,165,973 6,189 0.5
Master’s degrees.... 316,602 967 0.3 385,419 1,697 0.4
Doctor’s degrees.... 33,126 95 0.3 43,149 134 0.3
First-professional
degrees.................. 63,953 196 0.3 75,418 371 0.5SOURCE: U.S. Department of Education, National Center for Education Statistics, Higher Education General Information Survey (HEGIS),“Degrees and Other Formal Awards Conferred” survey, 1976-77; and Integrated Postsecondary Education Data System (IPEDS), “Completions”survey, 1993-94. As published in NCES, Digest of Education Statistics: 1996, tables 256, 259, 262, 265, and 268, pp. 283, 286, 289,292, and 295, 1996; and Digest of Education Statistics: 1997, tables 262, 265, 268, 271, and 274, pp. 292, 298, 301, and 304, 1997.
These increases in the percentage of degrees awarded to American Indians and
Alaska Natives are consistent with the increasing levels of American Indian and
Alaska Native enrollment in higher education. In 1976, Native Americans
composed 0.7 percent of undergraduate enrollments, 0.4 percent of graduate
enrollments, and 0.4 percent of first-professional enrollments. By 1994, Native
Americans were 1 percent of undergraduate enrollments, 0.5 percent of
graduate enrollments, and 0.7 percent of first-professional degree enrollments
(see summary table S2-9). Native American degree attainment, however, does
not yet match these enrollment shares.
Population growth and degree attainment. To some extent the increases in
the number and proportion of total degrees awarded to American Indians and
Alaska Natives reflect population changes. Between 1980 and 1994, the total
American Indian and Alaska Native population grew by 56 percent, thus
composing 0.9 percent of the total 1994 U.S. resident population (table 4-2).
Among those 20 to 24 years old, the ages when college graduation typically
occurs, the Native American population increased by 26 percent from 1980 to
1994, reaching 1 percent of the total age group. A comparison of American
Indian and Alaska Native representation in the population aged 20 to 24 with
American Indian and Alaska Native degree attainment revealed that Native
Americans only matched their population representation in associate’s degree
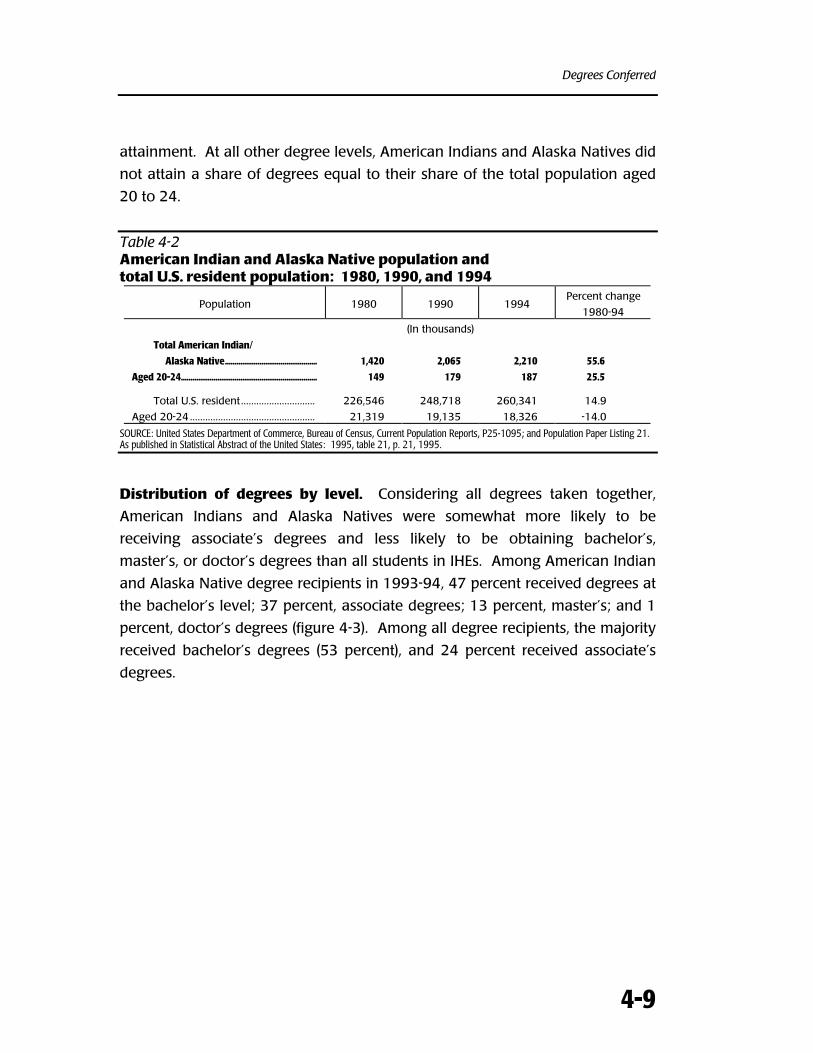
Degrees Conferred
4-9
attainment. At all other degree levels, American Indians and Alaska Natives did
not attain a share of degrees equal to their share of the total population aged
20 to 24.
Table 4-2American Indian and Alaska Native population andtotal U.S. resident population: 1980, 1990, and 1994
Population 1980 1990 1994Percent change
1980-94
(In thousands)
Total American Indian/
Alaska Native................................................ 1,420 2,065 2,210 55.6
Aged 20-24....................................................................... 149 179 187 25.5
Total U.S. resident............................. 226,546 248,718 260,341 14.9
Aged 20-24 ................................................. 21,319 19,135 18,326 -14.0
SOURCE: United States Department of Commerce, Bureau of Census, Current Population Reports, P25-1095; and Population Paper Listing 21.As published in Statistical Abstract of the United States: 1995, table 21, p. 21, 1995.
Distribution of degrees by level. Considering all degrees taken together,
American Indians and Alaska Natives were somewhat more likely to be
receiving associate’s degrees and less likely to be obtaining bachelor’s,
master’s, or doctor’s degrees than all students in IHEs. Among American Indian
and Alaska Native degree recipients in 1993-94, 47 percent received degrees at
the bachelor’s level; 37 percent, associate degrees; 13 percent, master’s; and 1
percent, doctor’s degrees (figure 4-3). Among all degree recipients, the majority
received bachelor’s degrees (53 percent), and 24 percent received associate’s
degrees.
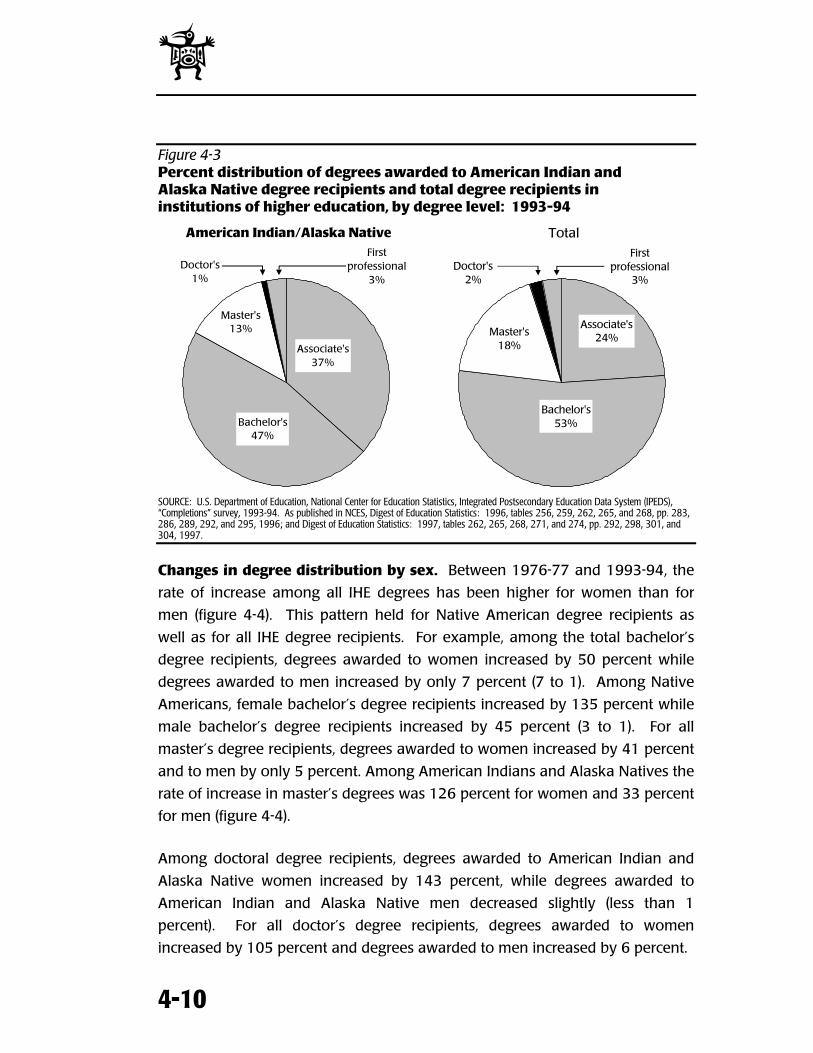
l
4-10
Figure 4-3Percent distribution of degrees awarded to American Indian andAlaska Native degree recipients and total degree recipients ininstitutions of higher education, by degree level: 1993-94
American Indian/Alaska Native TotalFirst
professional 3%
Master's 13%
Bachelor's 47%
Associate's 37%
Doctor's 1%
First professional
3%
Master's 18%
Bachelor's 53%
Associate's24%
Doctor's 2%
SOURCE: U.S. Department of Education, National Center for Education Statistics, Integrated Postsecondary Education Data System (IPEDS),“Completions” survey, 1993-94. As published in NCES, Digest of Education Statistics: 1996, tables 256, 259, 262, 265, and 268, pp. 283,286, 289, 292, and 295, 1996; and Digest of Education Statistics: 1997, tables 262, 265, 268, 271, and 274, pp. 292, 298, 301, and304, 1997.
Changes in degree distribution by sex. Between 1976-77 and 1993-94, the
rate of increase among all IHE degrees has been higher for women than for
men (figure 4-4). This pattern held for Native American degree recipients as
well as for all IHE degree recipients. For example, among the total bachelor’s
degree recipients, degrees awarded to women increased by 50 percent while
degrees awarded to men increased by only 7 percent (7 to 1). Among Native
Americans, female bachelor’s degree recipients increased by 135 percent while
male bachelor’s degree recipients increased by 45 percent (3 to 1). For all
master’s degree recipients, degrees awarded to women increased by 41 percent
and to men by only 5 percent. Among American Indians and Alaska Natives the
rate of increase in master’s degrees was 126 percent for women and 33 percent
for men (figure 4-4).
Among doctoral degree recipients, degrees awarded to American Indian and
Alaska Native women increased by 143 percent, while degrees awarded to
American Indian and Alaska Native men decreased slightly (less than 1
percent). For all doctor’s degree recipients, degrees awarded to women
increased by 105 percent and degrees awarded to men increased by 6 percent.
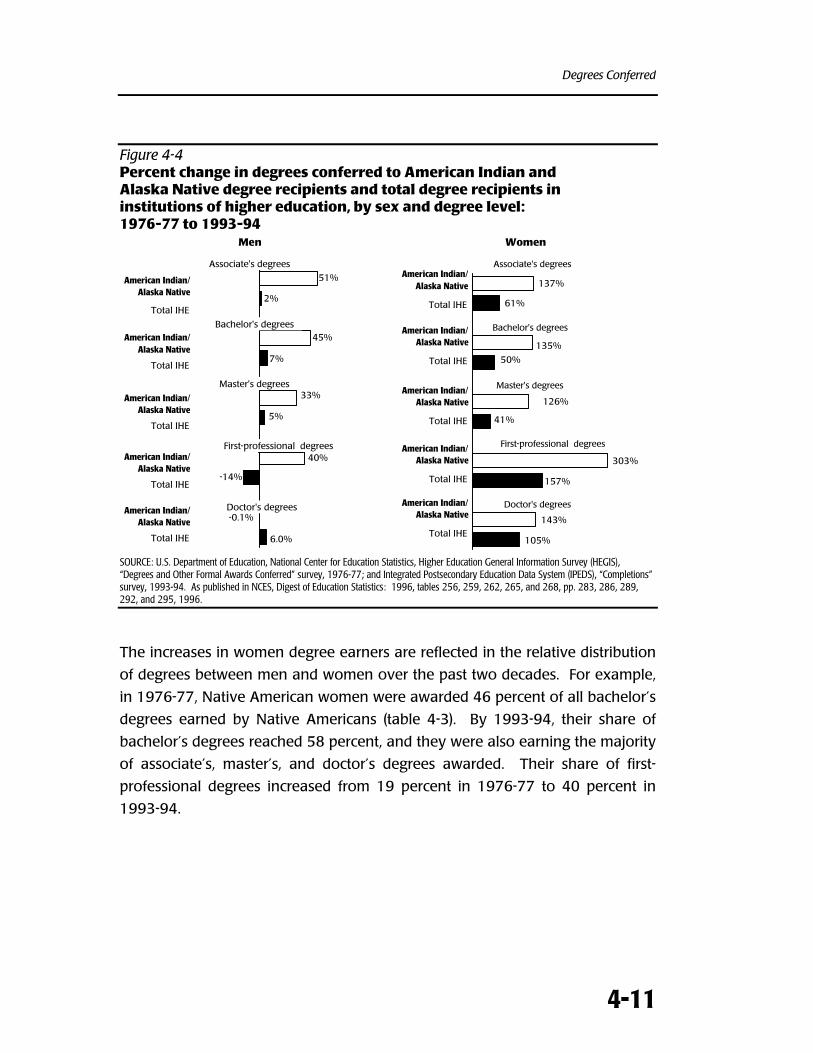
Degrees Conferred
4-11
Figure 4-4Percent change in degrees conferred to American Indian andAlaska Native degree recipients and total degree recipients ininstitutions of higher education, by sex and degree level:1976-77 to 1993-94
Men Women
33%
51%
2%
45%
7%
5%
6.0%
-0.1%
-14%
40%
Bachelor's degrees
Associate's degrees
American Indian/Alaska Native
Total IHE
Master's degrees
First-professional degrees
Doctor's degrees
American Indian/Alaska Native
Total IHE
American Indian/Alaska Native
Total IHE
American Indian/Alaska Native
Total IHE
American Indian/Alaska Native
Total IHE
303%
157%
143%
105%
41%
50%
135%
61%
137%
126%
Bachelor's degrees
Associate's degreesAmerican Indian/
Alaska Native
Total IHE
Master's degrees
First-professional degrees
Doctor's degrees
American Indian/Alaska Native
Total IHE
American Indian/Alaska Native
Total IHE
American Indian/Alaska Native
Total IHE
American Indian/Alaska Native
Total IHE
SOURCE: U.S. Department of Education, National Center for Education Statistics, Higher Education General Information Survey (HEGIS),“Degrees and Other Formal Awards Conferred” survey, 1976-77; and Integrated Postsecondary Education Data System (IPEDS), “Completions”survey, 1993-94. As published in NCES, Digest of Education Statistics: 1996, tables 256, 259, 262, 265, and 268, pp. 283, 286, 289,292, and 295, 1996.
The increases in women degree earners are reflected in the relative distribution
of degrees between men and women over the past two decades. For example,
in 1976-77, Native American women were awarded 46 percent of all bachelor’s
degrees earned by Native Americans (table 4-3). By 1993-94, their share of
bachelor’s degrees reached 58 percent, and they were also earning the majority
of associate’s, master’s, and doctor’s degrees awarded. Their share of first-
professional degrees increased from 19 percent in 1976-77 to 40 percent in
1993-94.
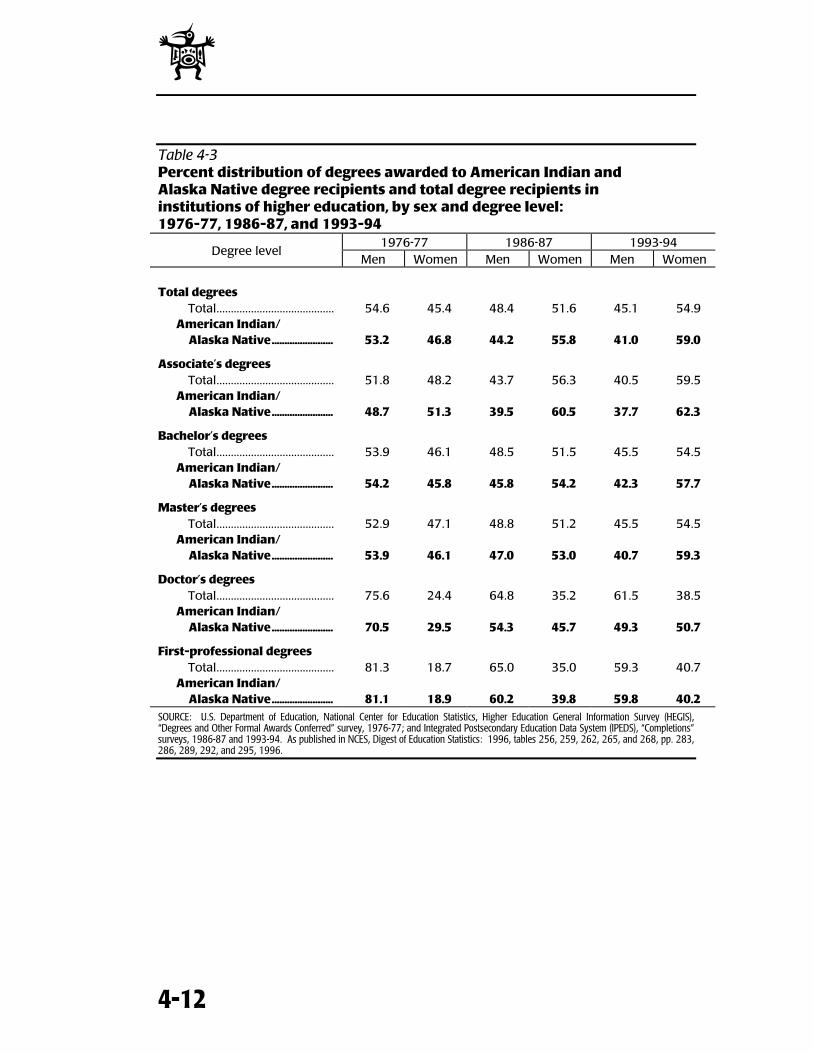
l
4-12
Table 4-3Percent distribution of degrees awarded to American Indian andAlaska Native degree recipients and total degree recipients ininstitutions of higher education, by sex and degree level:1976-77, 1986-87, and 1993-94
1976-77 1986-87 1993-94Degree level
Men Women Men Women Men Women
Total degreesTotal......................................... 54.6 45.4 48.4 51.6 45.1 54.9
American Indian/Alaska Native........................ 53.2 46.8 44.2 55.8 41.0 59.0
Associate’s degreesTotal......................................... 51.8 48.2 43.7 56.3 40.5 59.5
American Indian/Alaska Native........................ 48.7 51.3 39.5 60.5 37.7 62.3
Bachelor’s degreesTotal......................................... 53.9 46.1 48.5 51.5 45.5 54.5
American Indian/Alaska Native........................ 54.2 45.8 45.8 54.2 42.3 57.7
Master’s degreesTotal......................................... 52.9 47.1 48.8 51.2 45.5 54.5
American Indian/Alaska Native........................ 53.9 46.1 47.0 53.0 40.7 59.3
Doctor’s degreesTotal......................................... 75.6 24.4 64.8 35.2 61.5 38.5
American Indian/Alaska Native........................ 70.5 29.5 54.3 45.7 49.3 50.7
First-professional degreesTotal......................................... 81.3 18.7 65.0 35.0 59.3 40.7
American Indian/Alaska Native........................ 81.1 18.9 60.2 39.8 59.8 40.2
SOURCE: U.S. Department of Education, National Center for Education Statistics, Higher Education General Information Survey (HEGIS),“Degrees and Other Formal Awards Conferred” survey, 1976-77; and Integrated Postsecondary Education Data System (IPEDS), “Completions”surveys, 1986-87 and 1993-94. As published in NCES, Digest of Education Statistics: 1996, tables 256, 259, 262, 265, and 268, pp. 283,286, 289, 292, and 295, 1996.
Degrees Conferred
4-13
MAJOR FIELD OF STUDY
OF DEGREES CONFERRED
This section discusses degrees awarded by major field of study. In order to
facilitate trend comparisons among major fields of study, certain aggregations
have been made of the degree fields as reported in the HEGIS
“Degrees and Other Formal Awards Conferred” surveys and the
IPEDS “Completions” surveys. For example, the “Agriculture and
natural resources” field includes agribusiness and agriculture
production, agricultural sciences, and conservation and renewable natural
resources; the “Business management and administrative services” field
includes business and management, business and office, marketing and
distribution, and consumer and personal services; the “Communications” field
includes communications and communications technologies; “Engineering and
related fields” includes construction trades, engineering, engineering-related
technologies, and mechanics and repairers; the “Letters” field includes English
language and literature/letters and philosophy and religion; the “Life sciences”
field includes biological sciences/life sciences; the “military science” field
includes R.O.T.C. and military technologies; the “Public affairs and services” field
includes parks, recreation, leisure and fitness studies, protective services, public
administration and services, and transportation and material moving; the “Fine
and applied arts” includes visual and performing arts and precision production
trades; and the “Interdisciplinary studies” field includes liberal arts and sciences,
general studies, and humanities and multi/interdisciplinary studies. These
aggregations have been made on all figures contained in this section as well as
on the corresponding summary and appendix tables.
Associate’s degrees. The distribution of associate’s degrees by major field of
study for all degree recipients and for American Indians and Alaska Natives was
similar (summary table S4-2). In 1993-94, about one-third of the associate’s
degrees awarded to American Indians and Alaska Natives and all degree
recipients were in interdisciplinary studies. The next most frequent majors for
both groups were business and management and health professions (summary
table S4-2).
5
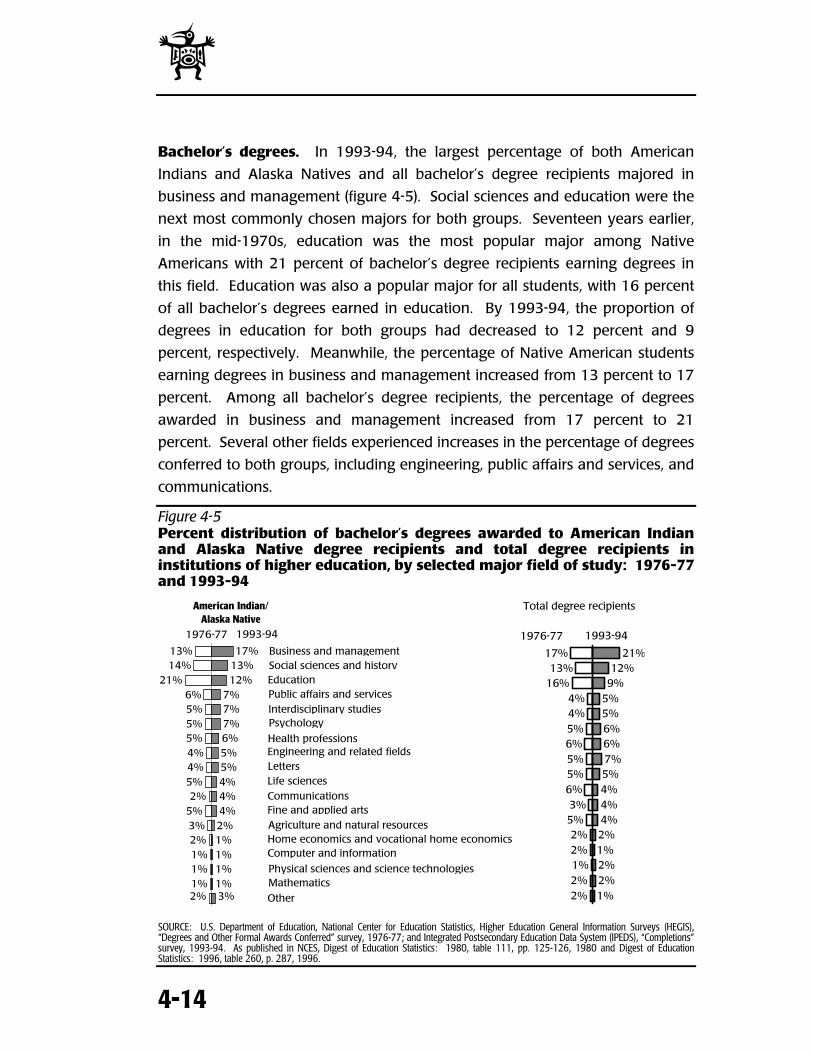
l
4-14
Bachelor’s degrees. In 1993-94, the largest percentage of both American
Indians and Alaska Natives and all bachelor’s degree recipients majored in
business and management (figure 4-5). Social sciences and education were the
next most commonly chosen majors for both groups. Seventeen years earlier,
in the mid-1970s, education was the most popular major among Native
Americans with 21 percent of bachelor’s degree recipients earning degrees in
this field. Education was also a popular major for all students, with 16 percent
of all bachelor’s degrees earned in education. By 1993-94, the proportion of
degrees in education for both groups had decreased to 12 percent and 9
percent, respectively. Meanwhile, the percentage of Native American students
earning degrees in business and management increased from 13 percent to 17
percent. Among all bachelor’s degree recipients, the percentage of degrees
awarded in business and management increased from 17 percent to 21
percent. Several other fields experienced increases in the percentage of degrees
conferred to both groups, including engineering, public affairs and services, and
communications.
Figure 4-5Percent distribution of bachelor’s degrees awarded to American Indianand Alaska Native degree recipients and total degree recipients ininstitutions of higher education, by selected major field of study: 1976-77and 1993-94
3%1%1%1%1%2%4%4%4%5%5%6%7%7%7%
12%13%17%
2%1%1%1%2%3%5%2%
5%4%4%5%5%5%6%
21%14%13% Business and management
Social sciences and historyEducationPublic affairs and servicesInterdisciplinary studiesPsychology
Health professionsEngineering and related fieldsLettersLife sciencesCommunicationsFine and applied artsAgriculture and natural resourcesHome economics and vocational home economicsComputer and information
Physical sciences and science technologiesMathematics
Other
1976-77 1993-94
American Indian/Alaska Native
1%2%2%1%2%4%4%4%5%7%6%6%5%5%9%12%
21%17%13%
16%4%4%5%6%5%5%6%3%5%2%2%1%2%2%
BSEPIPHELLCFAHC
PMO
1976-77 1993-94
Total degree recipients
SOURCE: U.S. Department of Education, National Center for Education Statistics, Higher Education General Information Surveys (HEGIS),“Degrees and Other Formal Awards Conferred” survey, 1976-77; and Integrated Postsecondary Education Data System (IPEDS), “Completions”survey, 1993-94. As published in NCES, Digest of Education Statistics: 1980, table 111, pp. 125-126, 1980 and Digest of EducationStatistics: 1996, table 260, p. 287, 1996.
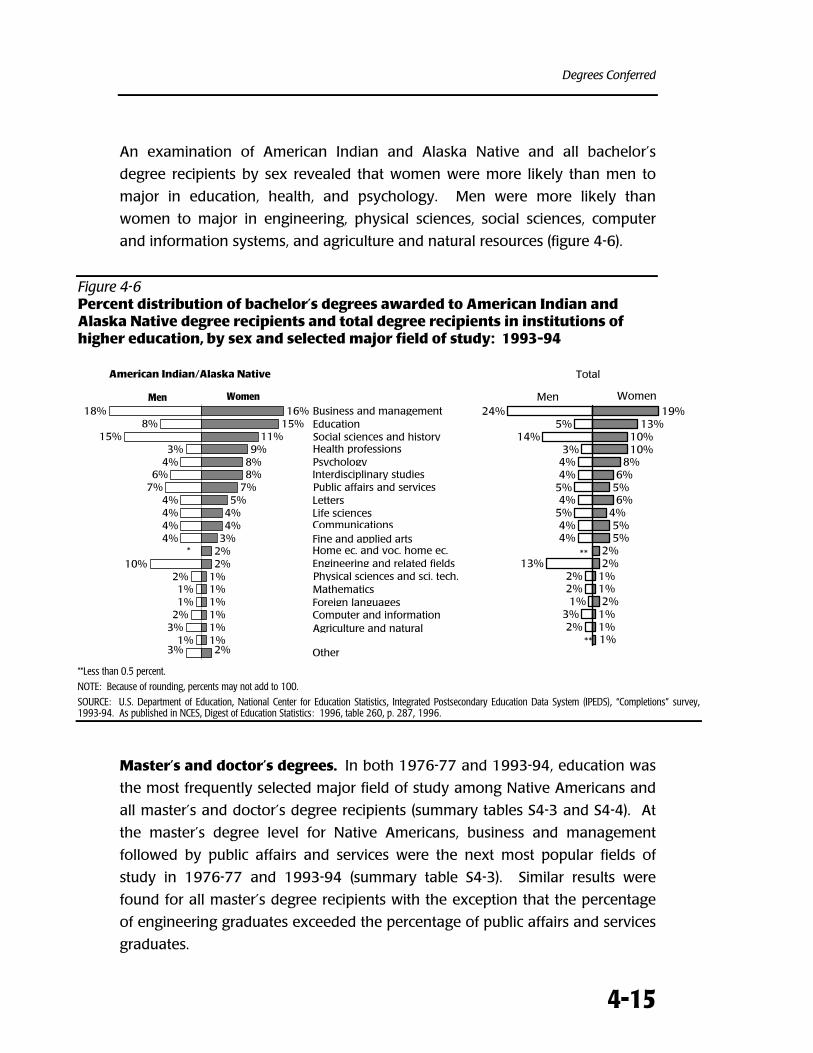
Degrees Conferred
4-15
An examination of American Indian and Alaska Native and all bachelor’s
degree recipients by sex revealed that women were more likely than men to
major in education, health, and psychology. Men were more likely than
women to major in engineering, physical sciences, social sciences, computer
and information systems, and agriculture and natural resources (figure 4-6).
Figure 4-6Percent distribution of bachelor’s degrees awarded to American Indian andAlaska Native degree recipients and total degree recipients in institutions ofhigher education, by sex and selected major field of study: 1993-94
American Indian/Alaska Native Total
2%1%1%1%1%1%1%2%2%3%4%4%5%
7%8%8%9%
11%15%16%
3%1%
3%2%1%1%
2%10%
4%4%4%4%
7%6%
4%3%
15%8%
18%
*
Men WomenBusiness and management
Social sciences and historyEducation
Public affairs and servicesInterdisciplinary studiesPsychologyHealth professions
Engineering and related fields
LettersLife sciencesCommunicationsFine and applied arts
Agriculture and natural
Home ec. and voc. home ec.
Computer and information
Physical sciences and sci. tech.MathematicsForeign languages
Other
1%1%2%
1%1%2%2%
5%5%
4%6%
5%6%
8%10%10%
13%19%
2%3%
1%2%2%
13%
4%4%
5%4%
5%4%4%3%
14%5%
24%
** 1%
Men Women
SociaEduca
PublicInterdPsychHealt
Engin
LetterLife scCommFine a
Agricu
Home
Comp
PhysiMathForeig
Area
**
**Less than 0.5 percent.
NOTE: Because of rounding, percents may not add to 100.
SOURCE: U.S. Department of Education, National Center for Education Statistics, Integrated Postsecondary Education Data System (IPEDS), “Completions” survey,1993-94. As published in NCES, Digest of Education Statistics: 1996, table 260, p. 287, 1996.
Master’s and doctor’s degrees. In both 1976-77 and 1993-94, education was
the most frequently selected major field of study among Native Americans and
all master’s and doctor’s degree recipients (summary tables S4-3 and S4-4). At
the master’s degree level for Native Americans, business and management
followed by public affairs and services were the next most popular fields of
study in 1976-77 and 1993-94 (summary table S4-3). Similar results were
found for all master’s degree recipients with the exception that the percentage
of engineering graduates exceeded the percentage of public affairs and services
graduates.
l
4-16
At the doctorate level, the distribution of degrees has also changed somewhat
over the past 20 years (summary table S4-4). In 1976-77, the three most
frequently chosen doctoral fields by American Indian and Alaska Native
students were education, life sciences, and psychology. Two decades later, the
three most frequently selected fields were education, social sciences, and
psychology. Although, psychology still ranked third as a field of study, a
smaller percentage of Native Americans were pursuing it (8 percent versus 12
percent). The three most popular fields of study for all doctorate recipients in
1976-77 were education, social sciences, and life sciences. In 1993-94, they
were replaced with education, engineering, and physical sciences.
First-professional degrees. In 1993-94, over half (60 percent) of the first-
professional degrees awarded to American Indians and Alaska Natives were in
law and 18 percent were in medicine (M.D. degrees). About 4 percent were in
theological studies and the rest were in various health-related fields, such as
dentistry or chiropractic (summary table S4-5). The distributions for total first-
professional degree recipients and American Indians and Alaska Native first-
professional degree recipients were similar.
CHARACTERISTICS OF
BACHELOR’S DEGREE RECIPIENTS
Using data primarily from the NCES Baccalaureate and Beyond Longitudinal
Study, this section presents data on the employment and educational status of
1992-93 bachelor’s degree recipients as of April 1994, about 1 year following
graduation. It begins with a brief examination of the types of institutions that
bachelor’s degree recipients attended and the ones from which they received
their degrees. This is followed by an analysis of their employment outcomes,
including levels of employment, salaries, and occupational fields. The section
concludes with a discussion of post-baccalaureate enrollment.
[
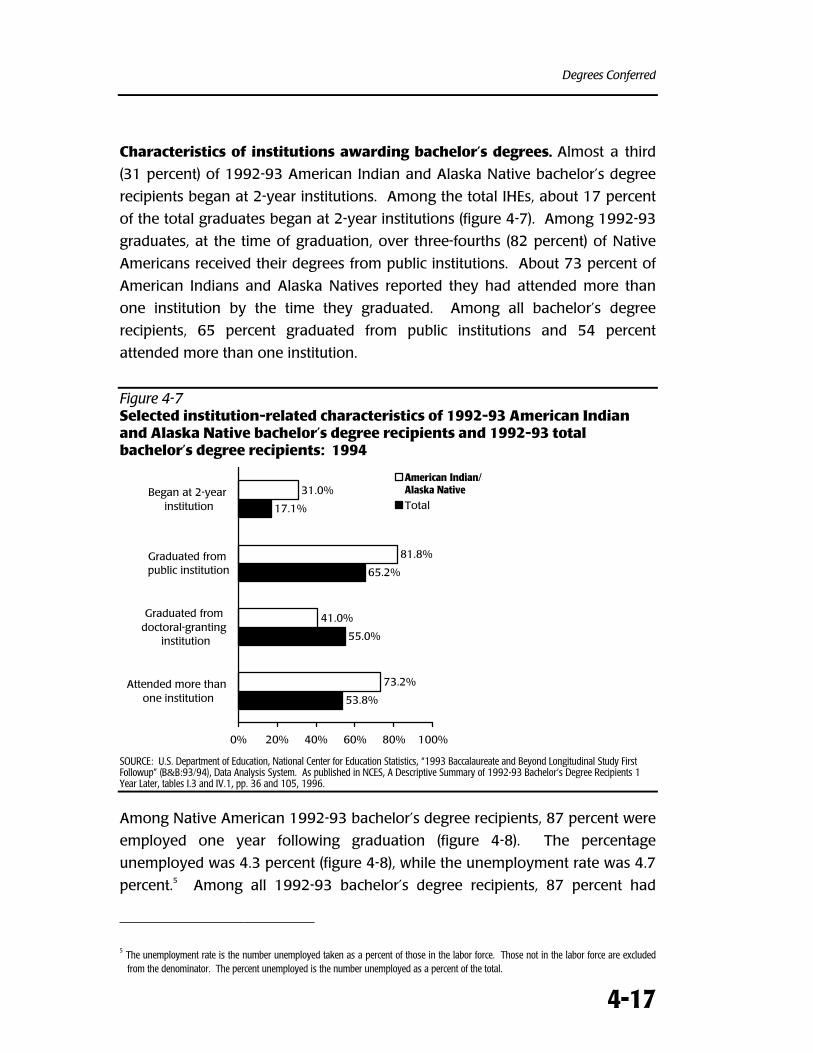
Degrees Conferred
4-17
Characteristics of institutions awarding bachelor’s degrees. Almost a third
(31 percent) of 1992-93 American Indian and Alaska Native bachelor’s degree
recipients began at 2-year institutions. Among the total IHEs, about 17 percent
of the total graduates began at 2-year institutions (figure 4-7). Among 1992-93
graduates, at the time of graduation, over three-fourths (82 percent) of Native
Americans received their degrees from public institutions. About 73 percent of
American Indians and Alaska Natives reported they had attended more than
one institution by the time they graduated. Among all bachelor’s degree
recipients, 65 percent graduated from public institutions and 54 percent
attended more than one institution.
Figure 4-7Selected institution-related characteristics of 1992-93 American Indianand Alaska Native bachelor’s degree recipients and 1992-93 totalbachelor’s degree recipients: 1994
53.8%
55.0%
65.2%
17.1%
73.2%
41.0%
81.8%
31.0%
0% 20% 40% 60% 80% 100%
Attended more than one institution
Graduated from doctoral-granting
institution
Graduated from public institution
Began at 2-year institution
American Indian/Alaska NativeTotal
SOURCE: U.S. Department of Education, National Center for Education Statistics, “1993 Baccalaureate and Beyond Longitudinal Study FirstFollowup” (B&B:93/94), Data Analysis System. As published in NCES, A Descriptive Summary of 1992-93 Bachelor’s Degree Recipients 1Year Later, tables I.3 and IV.1, pp. 36 and 105, 1996.
Among Native American 1992-93 bachelor’s degree recipients, 87 percent were
employed one year following graduation (figure 4-8). The percentage
unemployed was 4.3 percent (figure 4-8), while the unemployment rate was 4.7
percent.5 Among all 1992-93 bachelor’s degree recipients, 87 percent had
5 The unemployment rate is the number unemployed taken as a percent of those in the labor force. Those not in the labor force are excludedfrom the denominator. The percent unemployed is the number unemployed as a percent of the total.
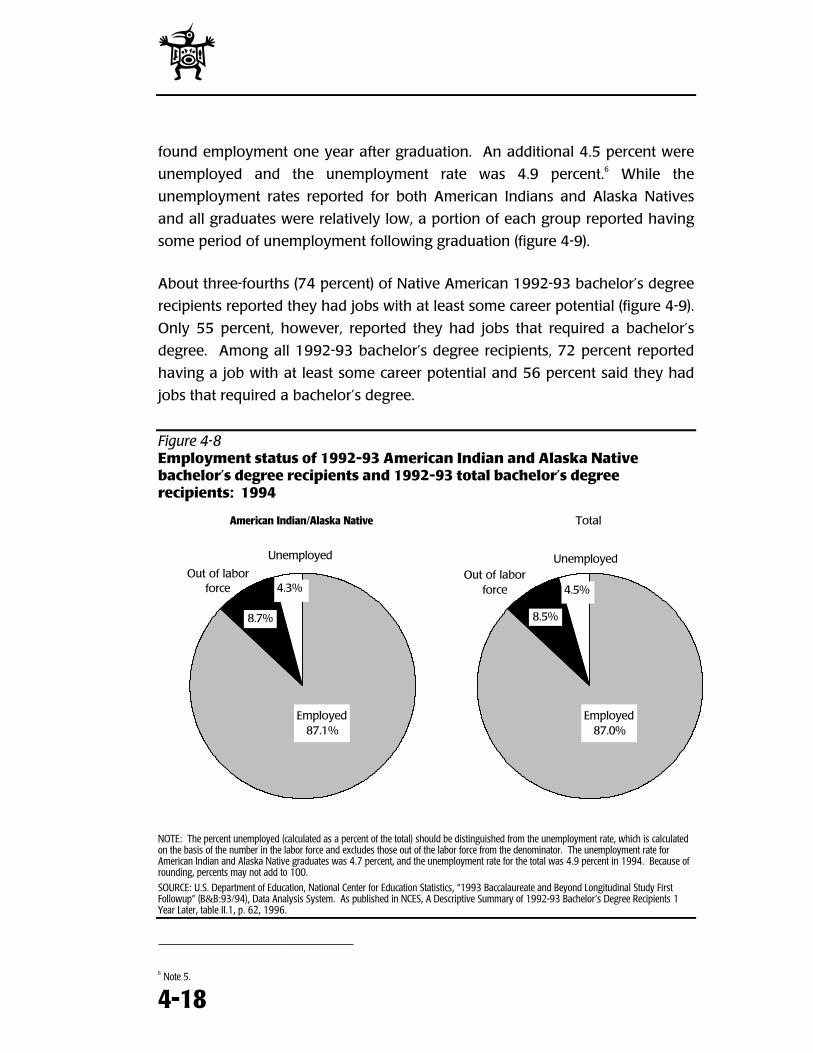
l
4-18
found employment one year after graduation. An additional 4.5 percent were
unemployed and the unemployment rate was 4.9 percent.6 While the
unemployment rates reported for both American Indians and Alaska Natives
and all graduates were relatively low, a portion of each group reported having
some period of unemployment following graduation (figure 4-9).
About three-fourths (74 percent) of Native American 1992-93 bachelor’s degree
recipients reported they had jobs with at least some career potential (figure 4-9).
Only 55 percent, however, reported they had jobs that required a bachelor’s
degree. Among all 1992-93 bachelor’s degree recipients, 72 percent reported
having a job with at least some career potential and 56 percent said they had
jobs that required a bachelor’s degree.
Figure 4-8Employment status of 1992-93 American Indian and Alaska Nativebachelor’s degree recipients and 1992-93 total bachelor’s degreerecipients: 1994
American Indian/Alaska Native
Unemployed
Employed87.1%
Out of labor force
8.7%
4.3%
Total
Unemployed
Employed87.0%
Out of labor force
8.5%
4.5%
NOTE: The percent unemployed (calculated as a percent of the total) should be distinguished from the unemployment rate, which is calculatedon the basis of the number in the labor force and excludes those out of the labor force from the denominator. The unemployment rate forAmerican Indian and Alaska Native graduates was 4.7 percent, and the unemployment rate for the total was 4.9 percent in 1994. Because ofrounding, percents may not add to 100.
SOURCE: U.S. Department of Education, National Center for Education Statistics, “1993 Baccalaureate and Beyond Longitudinal Study FirstFollowup” (B&B:93/94), Data Analysis System. As published in NCES, A Descriptive Summary of 1992-93 Bachelor’s Degree Recipients 1Year Later, table II.1, p. 62, 1996.
6 Note 5.
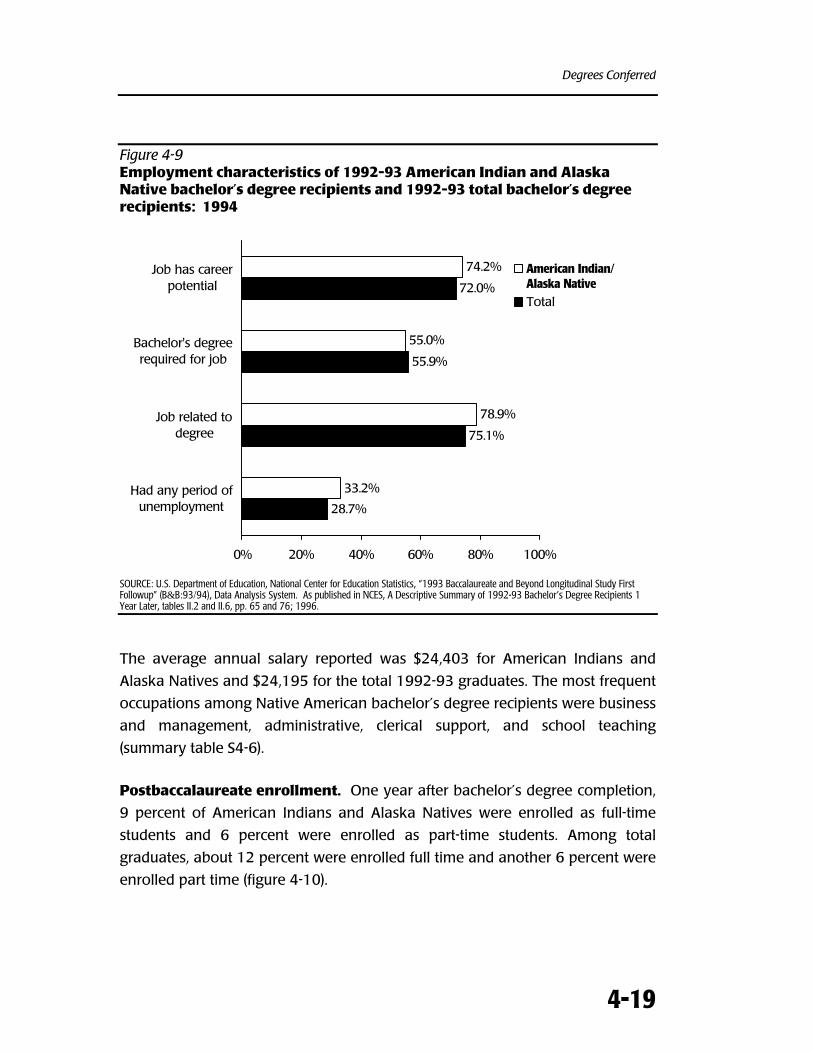
Degrees Conferred
4-19
Figure 4-9Employment characteristics of 1992-93 American Indian and AlaskaNative bachelor’s degree recipients and 1992-93 total bachelor’s degreerecipients: 1994
28.7%
75.1%
55.9%
72.0%
33.2%
78.9%
55.0%
74.2%
0% 20% 40% 60% 80% 100%
Had any period ofunemployment
Job related todegree
Bachelor's degreerequired for job
Job has careerpotential
American Indian/Alaska NativeTotal
SOURCE: U.S. Department of Education, National Center for Education Statistics, “1993 Baccalaureate and Beyond Longitudinal Study FirstFollowup” (B&B:93/94), Data Analysis System. As published in NCES, A Descriptive Summary of 1992-93 Bachelor’s Degree Recipients 1Year Later, tables II.2 and II.6, pp. 65 and 76; 1996.
The average annual salary reported was $24,403 for American Indians and
Alaska Natives and $24,195 for the total 1992-93 graduates. The most frequent
occupations among Native American bachelor’s degree recipients were business
and management, administrative, clerical support, and school teaching
(summary table S4-6).
Postbaccalaureate enrollment. One year after bachelor’s degree completion,
9 percent of American Indians and Alaska Natives were enrolled as full-time
students and 6 percent were enrolled as part-time students. Among total
graduates, about 12 percent were enrolled full time and another 6 percent were
enrolled part time (figure 4-10).
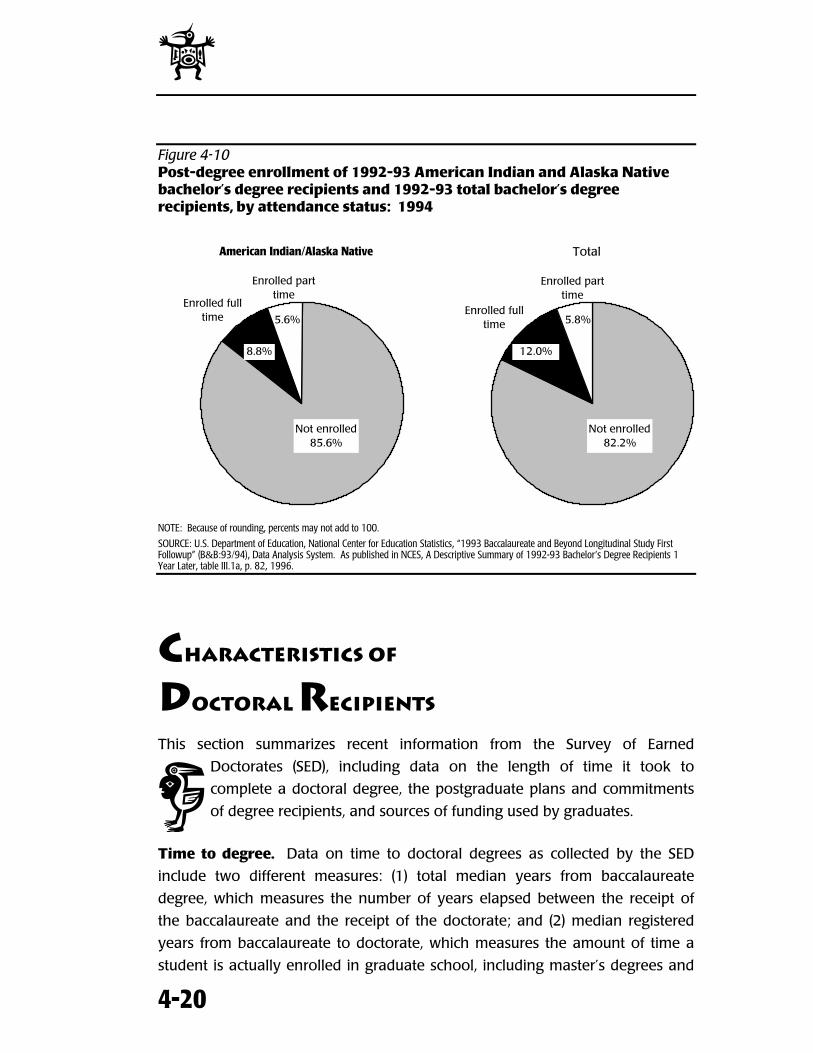
l
4-20
Figure 4-10Post-degree enrollment of 1992-93 American Indian and Alaska Nativebachelor’s degree recipients and 1992-93 total bachelor’s degreerecipients, by attendance status: 1994
American Indian/Alaska Native
Not enrolled85.6%
Enrolled full time
Enrolled part time
8.8%
5.6%
Total
Enrolled part time
Enrolled full time
Not enrolled82.2%
12.0%
5.8%
NOTE: Because of rounding, percents may not add to 100.
SOURCE: U.S. Department of Education, National Center for Education Statistics, “1993 Baccalaureate and Beyond Longitudinal Study FirstFollowup” (B&B:93/94), Data Analysis System. As published in NCES, A Descriptive Summary of 1992-93 Bachelor’s Degree Recipients 1Year Later, table III.1a, p. 82, 1996.
CHARACTERISTICS OF
DOCTORAL RECIPIENTS
This section summarizes recent information from the Survey of Earned
Doctorates (SED), including data on the length of time it took to
complete a doctoral degree, the postgraduate plans and commitments
of degree recipients, and sources of funding used by graduates.
Time to degree. Data on time to doctoral degrees as collected by the SED
include two different measures: (1) total median years from baccalaureate
degree, which measures the number of years elapsed between the receipt of
the baccalaureate and the receipt of the doctorate; and (2) median registered
years from baccalaureate to doctorate, which measures the amount of time a
student is actually enrolled in graduate school, including master’s degrees and
A
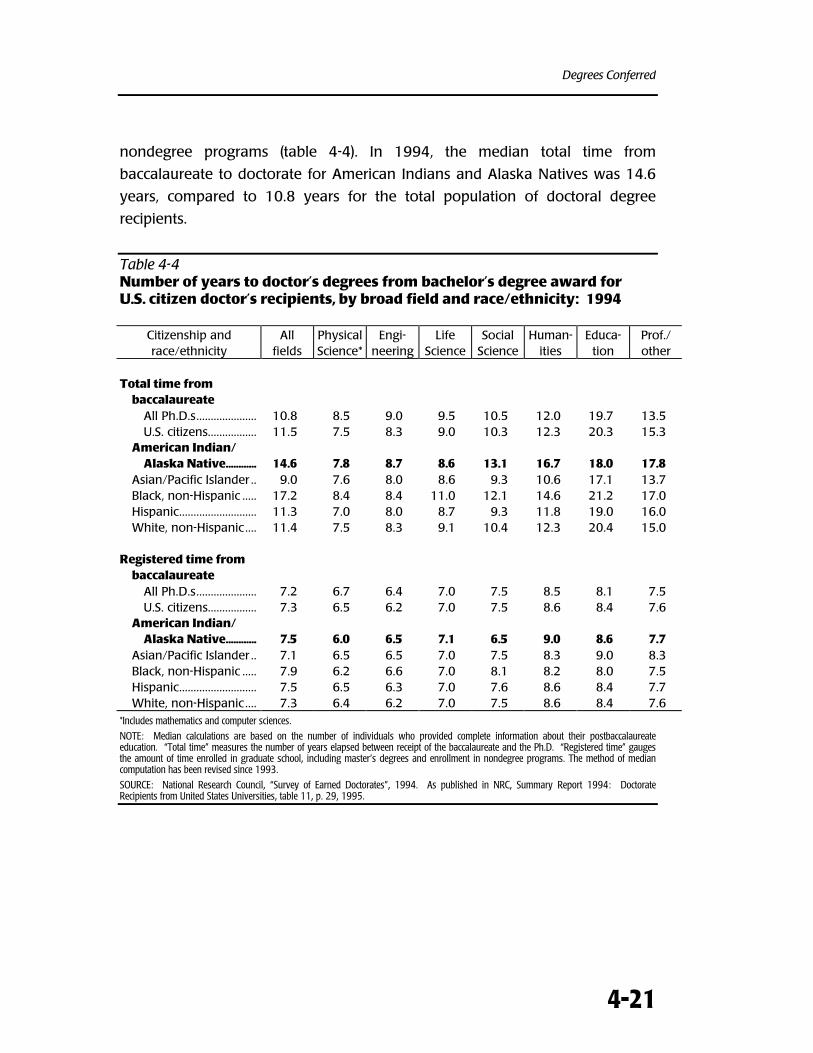
Degrees Conferred
4-21
nondegree programs (table 4-4). In 1994, the median total time from
baccalaureate to doctorate for American Indians and Alaska Natives was 14.6
years, compared to 10.8 years for the total population of doctoral degree
recipients.
Table 4-4Number of years to doctor’s degrees from bachelor’s degree award forU.S. citizen doctor’s recipients, by broad field and race/ethnicity: 1994
Citizenship andrace/ethnicity
Allfields
PhysicalScience*
Engi-neering
LifeScience
SocialScience
Human-ities
Educa-tion
Prof./other
Total time frombaccalaureate
All Ph.D.s..................... 10.8 8.5 9.0 9.5 10.5 12.0 19.7 13.5U.S. citizens................. 11.5 7.5 8.3 9.0 10.3 12.3 20.3 15.3
American Indian/Alaska Native............ 14.6 7.8 8.7 8.6 13.1 16.7 18.0 17.8
Asian/Pacific Islander .. 9.0 7.6 8.0 8.6 9.3 10.6 17.1 13.7Black, non-Hispanic ..... 17.2 8.4 8.4 11.0 12.1 14.6 21.2 17.0Hispanic........................... 11.3 7.0 8.0 8.7 9.3 11.8 19.0 16.0White, non-Hispanic .... 11.4 7.5 8.3 9.1 10.4 12.3 20.4 15.0
Registered time frombaccalaureate
All Ph.D.s..................... 7.2 6.7 6.4 7.0 7.5 8.5 8.1 7.5U.S. citizens................. 7.3 6.5 6.2 7.0 7.5 8.6 8.4 7.6
American Indian/Alaska Native............ 7.5 6.0 6.5 7.1 6.5 9.0 8.6 7.7
Asian/Pacific Islander .. 7.1 6.5 6.5 7.0 7.5 8.3 9.0 8.3Black, non-Hispanic ..... 7.9 6.2 6.6 7.0 8.1 8.2 8.0 7.5Hispanic........................... 7.5 6.5 6.3 7.0 7.6 8.6 8.4 7.7White, non-Hispanic .... 7.3 6.4 6.2 7.0 7.5 8.6 8.4 7.6
*Includes mathematics and computer sciences.
NOTE: Median calculations are based on the number of individuals who provided complete information about their postbaccalaureateeducation. “Total time” measures the number of years elapsed between receipt of the baccalaureate and the Ph.D. “Registered time” gaugesthe amount of time enrolled in graduate school, including master’s degrees and enrollment in nondegree programs. The method of mediancomputation has been revised since 1993.
SOURCE: National Research Council, “Survey of Earned Doctorates”, 1994. As published in NRC, Summary Report 1994: DoctorateRecipients from United States Universities, table 11, p. 29, 1995.
l
4-22
The distribution of total time from baccalaureate to doctorate among doctoral
recipients varied widely across disciplines, and most of the difference between
American Indians’ and Alaska Natives’ time and that of the total population was
related to differences in the distribution of major field of study. For example, a
relatively large proportion of doctoral degrees awarded to American Indians
and Alaska Natives were in education. This field traditionally has the longest
time between baccalaureate and doctorate (19.7 years overall in 1994) because
many people return to complete a doctorate in education after working in the
field. Among American Indians and Alaska Natives receiving doctorates in
education, the time from baccalaureate (18.0 years) was actually less than for
the total population of degree recipients in education. In fact, in all disciplines
but the social sciences, humanities, and professional and other disciplines, the
time to degree for American Indians and Alaska Natives was less than for the
total population (table 4-4). However, a somewhat larger percentage of
American Indian and Alaska Native doctorates than of doctoral recipients
overall were in the social sciences, humanities, and professional and other
disciplines (summary table S4-7).
Looking at registered time from baccalaureate to doctorate (table 4-4), there
were fewer differences by field and by race/ethnicity. The total registered time
among all doctorate recipients was 7.2 years, and among American Indians and
Alaska Natives, 7.5 years.
The median age of American Indian and Alaska Native doctoral degree
recipients in 1994 was 38.9 years compared to 34.1 years for the total (U.S.
citizens and non-U.S. citizens) and 35.1 years for all U.S. citizen doctorate
recipients.7
7National Research Council, Summary Report 1994: Doctorate Recipients from United States Universities, appendix table A-4, pp. 60-61,1996.
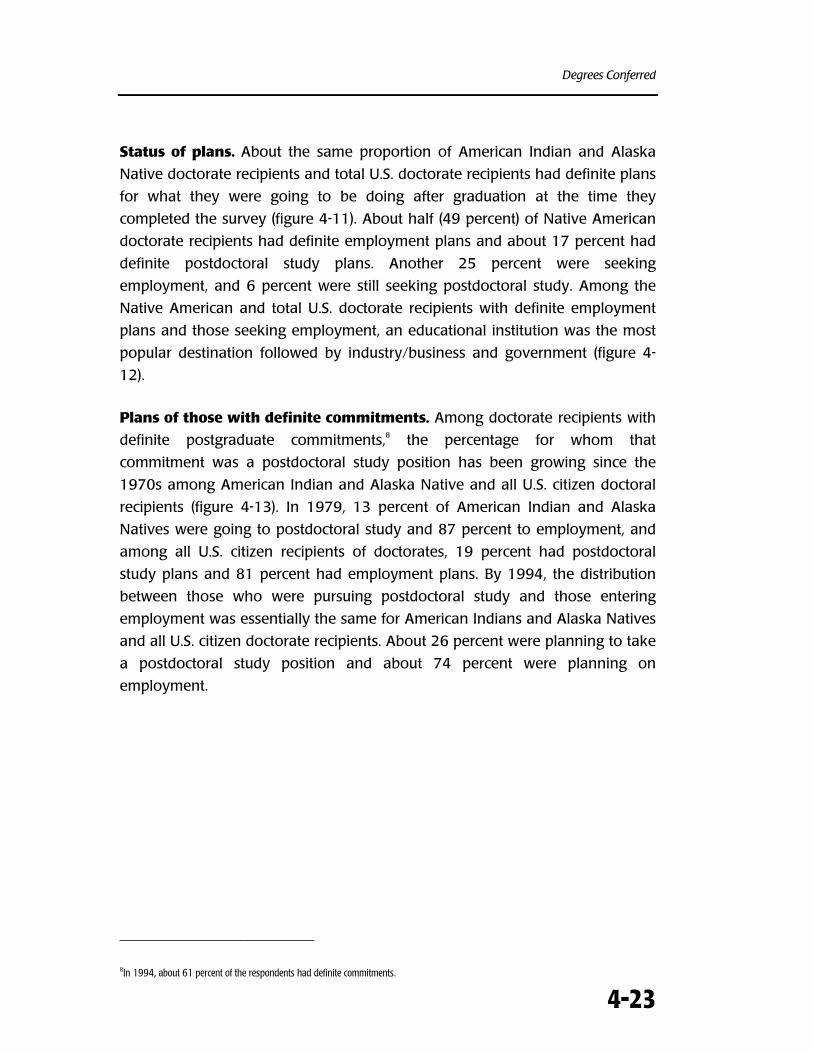
Degrees Conferred
4-23
Status of plans. About the same proportion of American Indian and Alaska
Native doctorate recipients and total U.S. doctorate recipients had definite plans
for what they were going to be doing after graduation at the time they
completed the survey (figure 4-11). About half (49 percent) of Native American
doctorate recipients had definite employment plans and about 17 percent had
definite postdoctoral study plans. Another 25 percent were seeking
employment, and 6 percent were still seeking postdoctoral study. Among the
Native American and total U.S. doctorate recipients with definite employment
plans and those seeking employment, an educational institution was the most
popular destination followed by industry/business and government (figure 4-
12).
Plans of those with definite commitments. Among doctorate recipients with
definite postgraduate commitments,8 the percentage for whom that
commitment was a postdoctoral study position has been growing since the
1970s among American Indian and Alaska Native and all U.S. citizen doctoral
recipients (figure 4-13). In 1979, 13 percent of American Indian and Alaska
Natives were going to postdoctoral study and 87 percent to employment, and
among all U.S. citizen recipients of doctorates, 19 percent had postdoctoral
study plans and 81 percent had employment plans. By 1994, the distribution
between those who were pursuing postdoctoral study and those entering
employment was essentially the same for American Indians and Alaska Natives
and all U.S. citizen doctorate recipients. About 26 percent were planning to take
a postdoctoral study position and about 74 percent were planning on
employment.
8In 1994, about 61 percent of the respondents had definite commitments.
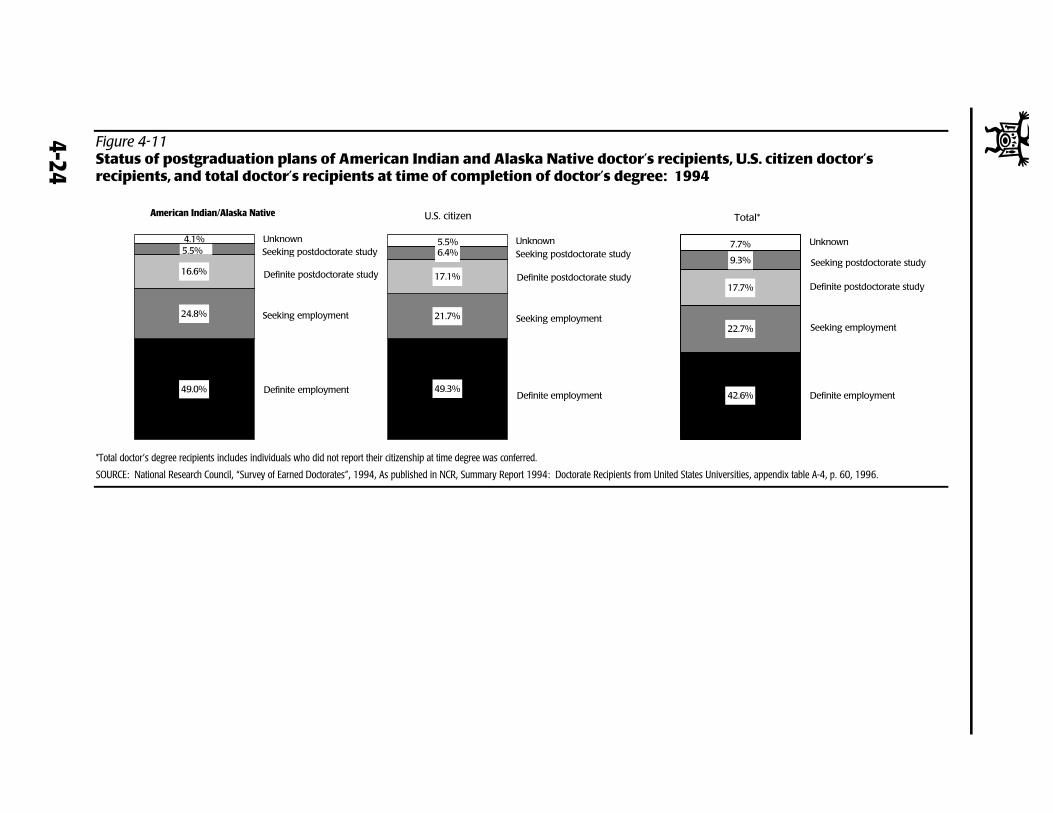
Figure 4-11Status of postgraduation plans of American Indian and Alaska Native doctor’s recipients, U.S. citizen doctor’srecipients, and total doctor’s recipients at time of completion of doctor’s degree: 1994
*Total doctor’s degree recipients includes individuals who did not report their citizenship at time degree was conferred.
SOURCE: National Research Council, “Survey of Earned Doctorates”, 1994, As published in NCR, Summary Report 1994: Doctorate Recipients from United States Universities, appendix table A-4, p. 60, 1996.
American Indian/Alaska Native
49.0%
4.1%
24.8%
16.6%
UnknownSeeking postdoctorate study
Definite postdoctorate study
Seeking employment
Definite employment
5.5%
U.S. citizen
49.3%
21.7%
17.1%
6.4%5.5% Unknown
Seeking postdoctorate study
Definite postdoctorate study
Seeking employment
Definite employment
Total*
42.6%
22.7%
17.7%
9.3%
7.7% Unknown
Seeking postdoctorate study
Definite postdoctorate study
Seeking employment
Definite employment
l
4-24
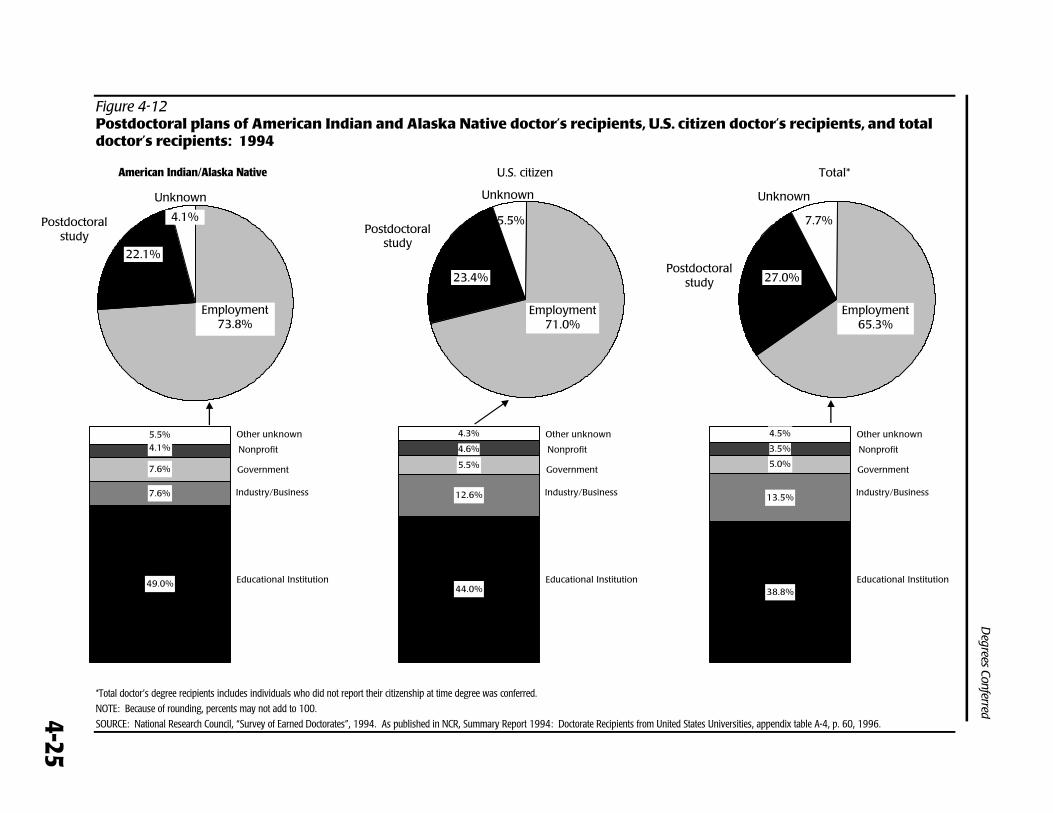
Figure 4-12Postdoctoral plans of American Indian and Alaska Native doctor’s recipients, U.S. citizen doctor’s recipients, and totaldoctor’s recipients: 1994
*Total doctor’s degree recipients includes individuals who did not report their citizenship at time degree was conferred.
NOTE: Because of rounding, percents may not add to 100.
SOURCE: National Research Council, “Survey of Earned Doctorates”, 1994. As published in NCR, Summary Report 1994: Doctorate Recipients from United States Universities, appendix table A-4, p. 60, 1996.
Degrees Conferred
American Indian/Alaska Native
Postdoctoral study
Unknown
22.1%
4.1%
Employment73.8%
U.S. citizen
Postdoctoral study
Unknown
23.4%
5.5%
Employment71.0%
Total*
Postdoctoral study
Unknown
27.0%
7.7%
Employment65.3%
49.0%
7.6%
7.6%
4.1%
5.5% Other unknown
Nonprofit
Government
Industry/Business
Educational Institution44.0%
12.6%
5.5%
4.6%
4.3% Other unknown
Nonprofit
Government
Industry/Business
Educational Institution38.8%
13.5%
5.0%
4.5%
3.5%
Other unknown
Nonprofit
Government
Industry/Business
Educational Institution
4-25
Figure 4-13Postgraduation commitments of American Indian and Alaska Native doctor’s recipients, U.S. citizen doctor’s recipients,and total doctor’s recipients: Selected years, 1974-94
American Indian/Alaska Native
87% 81% 75%
19% 26%13%
1979 1989 1994
U.S. citizen
81% 77% 74%
19% 23% 26%
1979 1989 1994
Total1
80% 74% 71%
20% 26% 29%
1979 1989 1994
StudyEmployment
2
1Total doctor’s degree recipients includes individuals who did not report their citizenship at time degree was conferred.2”Study” includes those on postdoctoral fellowship, postdoctoral research associateship, traineeship, and other study activities.
NOTE: Only doctorate recipients with definite postgraduation commitments have been included. In 1974, this includes about 67 percent of total doctorate recipients and 61 percent of total doctorate recipients in 1994. Becauseof rounding, percents may not add to 100.
SOURCE: National Research Council, “Survey of Earned Doctorates”, 1994. As published in NCR, Summary Report 1994: Doctorate Recipients from United States Universities, table 16, p. 33, 1996.
l4-26
l
4-27
Sources of graduate support. There were no large differences between the
sources of graduate support used by American Indian and Alaska Native
doctoral degree recipients and total doctoral degree recipients (table 4-5).
However, American Indians and Alaska Natives were somewhat more likely to
have federal support, including funds from the GI bill, and also somewhat more
likely to have loans.
Table 4-5Percent of American Indian and Alaska Native doctor’s recipients, U.S.citizen doctor’s recipients, and all doctor’s recipients who receivedgraduate school support, by source of support: 1994
Source of support American Indian/Alaska Native U.S. citizen Total
GI Bill................................................... 4.1 1.4 0.9Other federal*................................... 17.2 12.7 9.4State government ........................... 1.4 1.2 0.9Foreign government....................... 0.0 0.4 4.0National fellow (nonfederal)........ 9.7 5.7 5.0University teaching assistant....... 42.1 47.6 47.5University research assistant* ..... 38.6 42.8 48.2Other university............................... 27.6 26.7 23.3Business/employer......................... 6.9 7.6 5.8Self/family sources ......................... 77.9 77.3 66.8GSL (Stafford) loan .......................... 33.8 29.2 19.8Other loans ....................................... 13.1 10.0 7.3Other sources ................................... 4.8 3.6 3.5Unknown sources ........................... 3.4 4.3 6.2
*Because federal support obtained through the university cannot always be determined, no distinction is made between federal and universityresearch assistants in this table. Both types of support are grouped under “university research assistant.” Federal loans are counted in thecategory for loans.
NOTE: In this table a recipient counts once in each source category from which he or she received support. Since students indicate multiplesources of support, percents sum to more than 100.
SOURCE: National Research Council, “Survey of Earned Doctorates”, 1994. As published in NCR, Summary Report 1994: DoctorateRecipients from United States Universities, appendix table A-4, p. 60, 1996.
l
4-28
INSTITUTIONS AWARDING DEGREES TO
AMERICAN INDIANS AND ALASKA NATIVES
Considering all higher education degrees (associate’s bachelor’s, master’s, and
doctor’s), the five institutions awarding the most degrees to
American Indians and Alaska Natives in 1993-94 were located
in two states, Oklahoma and Arizona (table 4-6). These states
also ranked first and third, respectively, in total American
Indian and Alaska Native population (summary table S1-3). A
large proportion of American Indian and Alaska Native degree recipients were
also found in California, New Mexico, and Washington (table 4-6). These were
also states with large Native American populations (summary table S1-3).
Reflecting the small number of American Indian and Alaska Native degree
recipients nationwide, only 31 colleges and universities awarded more than 50
degrees to American Indians and Alaska Natives in 1993-94 (table 4-6).
Associate’s and bachelor’s degrees. The three colleges awarding the most
associate’s degrees to American Indians and Alaska Natives in 1993-94 were
Navajo Community College in Arizona (197 degrees), and Haskell Indian Junior
College in Kansas (93 degrees), and University of New Mexico-Gallup Branch
(81 degrees; summary table S4-8). The top three colleges in 1993-94 in terms of
bachelor’s degrees awarded to American Indians and Alaska Natives were all in
Oklahoma (table 4-7). They were Northeastern State University (258 degrees),
Southeastern Oklahoma State University (194 degrees), and Oklahoma State
University (134 degrees). At Southeastern Oklahoma State University, degrees
awarded to American Indians and Alaska Natives constituted about 28 percent
of the total degrees awarded. They were 17 percent of the total at Northeastern
State University and 5 percent at Oklahoma State University.
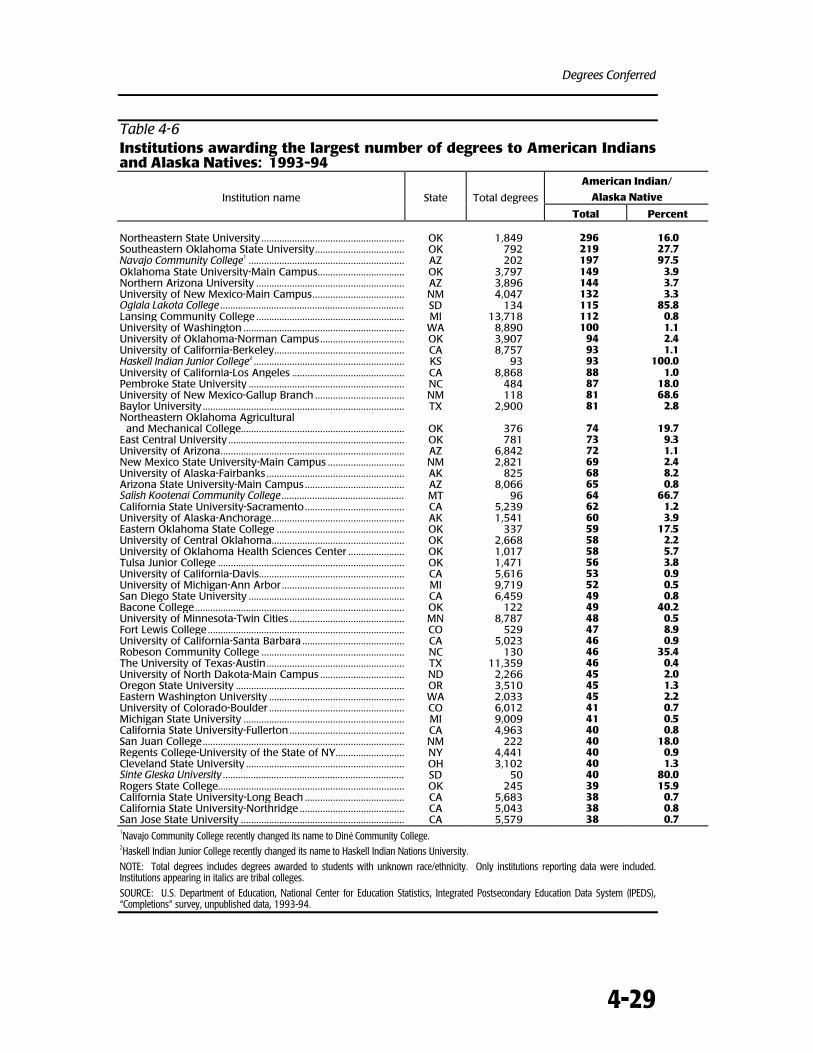
Degrees Conferred
4-29
Table 4-6Institutions awarding the largest number of degrees to American Indiansand Alaska Natives: 1993-94
American Indian/
Alaska NativeInstitution name State Total degrees
Total Percent
Northeastern State University ........................................................ OK 1,849 296 16.0Southeastern Oklahoma State University................................... OK 792 219 27.7Navajo Community College1 ............................................................. AZ 202 197 97.5Oklahoma State University-Main Campus.................................. OK 3,797 149 3.9Northern Arizona University .......................................................... AZ 3,896 144 3.7University of New Mexico-Main Campus.................................... NM 4,047 132 3.3Oglala Lakota College ........................................................................ SD 134 115 85.8Lansing Community College .......................................................... MI 13,718 112 0.8University of Washington ............................................................... WA 8,890 100 1.1University of Oklahoma-Norman Campus................................. OK 3,907 94 2.4University of California-Berkeley................................................... CA 8,757 93 1.1Haskell Indian Junior College2 ........................................................... KS 93 93 100.0University of California-Los Angeles ............................................ CA 8,868 88 1.0Pembroke State University ............................................................. NC 484 87 18.0University of New Mexico-Gallup Branch ................................... NM 118 81 68.6Baylor University ............................................................................... TX 2,900 81 2.8Northeastern Oklahoma Agricultural and Mechanical College................................................................ OK 376 74 19.7East Central University ..................................................................... OK 781 73 9.3University of Arizona........................................................................ AZ 6,842 72 1.1New Mexico State University-Main Campus .............................. NM 2,821 69 2.4University of Alaska-Fairbanks ...................................................... AK 825 68 8.2Arizona State University-Main Campus ....................................... AZ 8,066 65 0.8Salish Kootenai Community College ................................................ MT 96 64 66.7California State University-Sacramento....................................... CA 5,239 62 1.2University of Alaska-Anchorage.................................................... AK 1,541 60 3.9Eastern Oklahoma State College .................................................. OK 337 59 17.5University of Central Oklahoma.................................................... OK 2,668 58 2.2University of Oklahoma Health Sciences Center ...................... OK 1,017 58 5.7Tulsa Junior College ......................................................................... OK 1,471 56 3.8University of California-Davis......................................................... CA 5,616 53 0.9University of Michigan-Ann Arbor ................................................ MI 9,719 52 0.5San Diego State University ............................................................. CA 6,459 49 0.8Bacone College.................................................................................. OK 122 49 40.2University of Minnesota-Twin Cities ............................................. MN 8,787 48 0.5Fort Lewis College ............................................................................. CO 529 47 8.9University of California-Santa Barbara ........................................ CA 5,023 46 0.9Robeson Community College ........................................................ NC 130 46 35.4The University of Texas-Austin...................................................... TX 11,359 46 0.4University of North Dakota-Main Campus ................................. ND 2,266 45 2.0Oregon State University .................................................................. OR 3,510 45 1.3Eastern Washington University ..................................................... WA 2,033 45 2.2University of Colorado-Boulder ..................................................... CO 6,012 41 0.7Michigan State University ............................................................... MI 9,009 41 0.5California State University-Fullerton ............................................. CA 4,963 40 0.8San Juan College............................................................................... NM 222 40 18.0Regents College-University of the State of NY........................... NY 4,441 40 0.9Cleveland State University .............................................................. OH 3,102 40 1.3Sinte Gleska University ....................................................................... SD 50 40 80.0Rogers State College......................................................................... OK 245 39 15.9California State University-Long Beach ....................................... CA 5,683 38 0.7California State University-Northridge ......................................... CA 5,043 38 0.8San Jose State University ................................................................ CA 5,579 38 0.71Navajo Community College recently changed its name to Diné Community College.2Haskell Indian Junior College recently changed its name to Haskell Indian Nations University.
NOTE: Total degrees includes degrees awarded to students with unknown race/ethnicity. Only institutions reporting data were included.Institutions appearing in italics are tribal colleges.
SOURCE: U.S. Department of Education, National Center for Education Statistics, Integrated Postsecondary Education Data System (IPEDS),“Completions” survey, unpublished data, 1993-94.
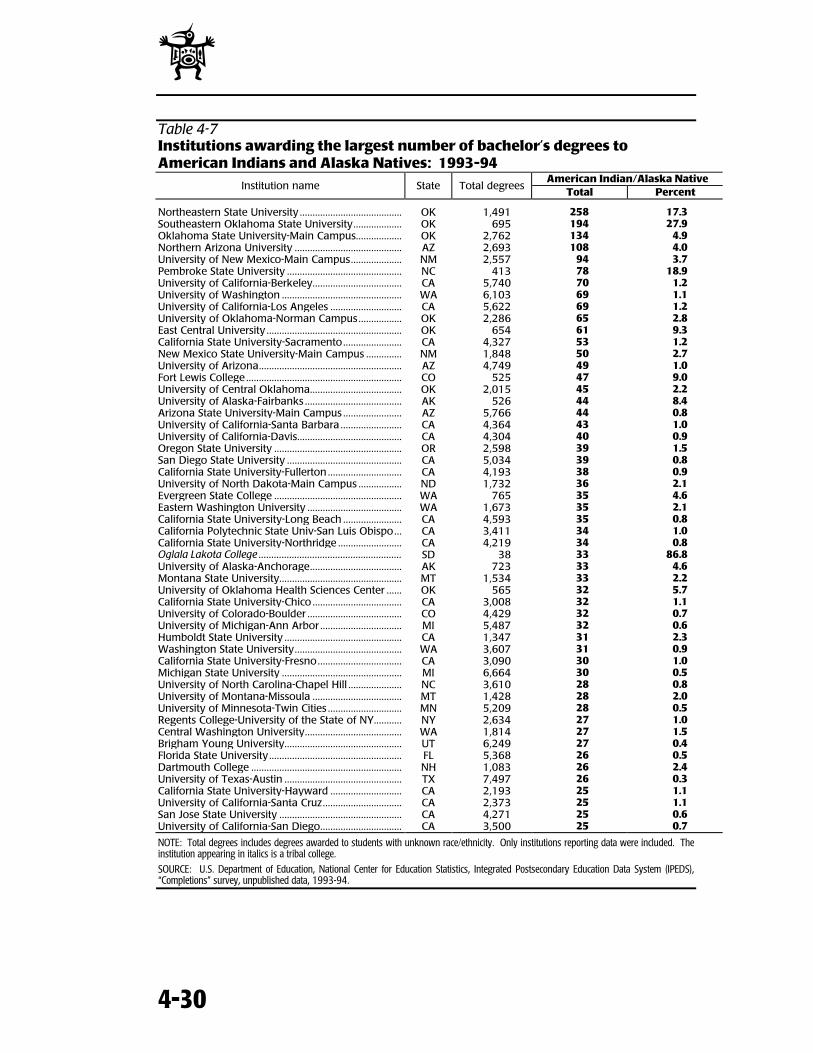
l
4-30
Table 4-7Institutions awarding the largest number of bachelor’s degrees toAmerican Indians and Alaska Natives: 1993-94
American Indian/Alaska NativeInstitution name State Total degrees
Total Percent
Northeastern State University ........................................ OK 1,491 258 17.3Southeastern Oklahoma State University................... OK 695 194 27.9Oklahoma State University-Main Campus.................. OK 2,762 134 4.9Northern Arizona University .......................................... AZ 2,693 108 4.0University of New Mexico-Main Campus.................... NM 2,557 94 3.7Pembroke State University ............................................. NC 413 78 18.9University of California-Berkeley................................... CA 5,740 70 1.2University of Washington ............................................... WA 6,103 69 1.1University of California-Los Angeles ............................ CA 5,622 69 1.2University of Oklahoma-Norman Campus................. OK 2,286 65 2.8East Central University ..................................................... OK 654 61 9.3California State University-Sacramento....................... CA 4,327 53 1.2New Mexico State University-Main Campus .............. NM 1,848 50 2.7University of Arizona........................................................ AZ 4,749 49 1.0Fort Lewis College ............................................................. CO 525 47 9.0University of Central Oklahoma.................................... OK 2,015 45 2.2University of Alaska-Fairbanks ...................................... AK 526 44 8.4Arizona State University-Main Campus ....................... AZ 5,766 44 0.8University of California-Santa Barbara ........................ CA 4,364 43 1.0University of California-Davis......................................... CA 4,304 40 0.9Oregon State University .................................................. OR 2,598 39 1.5San Diego State University ............................................. CA 5,034 39 0.8California State University-Fullerton ............................. CA 4,193 38 0.9University of North Dakota-Main Campus ................. ND 1,732 36 2.1Evergreen State College .................................................. WA 765 35 4.6Eastern Washington University ..................................... WA 1,673 35 2.1California State University-Long Beach ....................... CA 4,593 35 0.8California Polytechnic State Univ-San Luis Obispo... CA 3,411 34 1.0California State University-Northridge ......................... CA 4,219 34 0.8Oglala Lakota College ........................................................ SD 38 33 86.8University of Alaska-Anchorage.................................... AK 723 33 4.6Montana State University................................................ MT 1,534 33 2.2University of Oklahoma Health Sciences Center ...... OK 565 32 5.7California State University-Chico ................................... CA 3,008 32 1.1University of Colorado-Boulder ..................................... CO 4,429 32 0.7University of Michigan-Ann Arbor ................................ MI 5,487 32 0.6Humboldt State University .............................................. CA 1,347 31 2.3Washington State University.......................................... WA 3,607 31 0.9California State University-Fresno................................. CA 3,090 30 1.0Michigan State University ............................................... MI 6,664 30 0.5University of North Carolina-Chapel Hill ..................... NC 3,610 28 0.8University of Montana-Missoula ................................... MT 1,428 28 2.0University of Minnesota-Twin Cities ............................. MN 5,209 28 0.5Regents College-University of the State of NY........... NY 2,634 27 1.0Central Washington University...................................... WA 1,814 27 1.5Brigham Young University.............................................. UT 6,249 27 0.4Florida State University.................................................... FL 5,368 26 0.5Dartmouth College ........................................................... NH 1,083 26 2.4University of Texas-Austin .............................................. TX 7,497 26 0.3California State University-Hayward ............................ CA 2,193 25 1.1University of California-Santa Cruz............................... CA 2,373 25 1.1San Jose State University ................................................ CA 4,271 25 0.6University of California-San Diego................................ CA 3,500 25 0.7
NOTE: Total degrees includes degrees awarded to students with unknown race/ethnicity. Only institutions reporting data were included. Theinstitution appearing in italics is a tribal college.
SOURCE: U.S. Department of Education, National Center for Education Statistics, Integrated Postsecondary Education Data System (IPEDS),“Completions” survey, unpublished data, 1993-94.
Degrees Conferred
4-31
Master’s and first-professional degrees. At the master’s degree level, the top
five schools in terms of number of degrees awarded to American Indians and
Alaska Natives were Baylor University in Texas (72 degrees), Northern Arizona
University (36 degrees), Northeastern State University (35 degrees),
Southeastern Oklahoma State University (25 degrees), and the University of
New Mexico-Main Campus (25 degrees; summary table S4-9). At the first-
professional degree level, the top five institutions were University of New
Mexico-Main Campus (10 degrees), University of California-Davis (10 degrees),
University of Washington (9 degrees), University of Oklahoma Health Sciences
Center (9 degrees), and Arizona State University-Main Campus (9 degrees;
summary table S4-10).
Doctorates. The institutions awarding the most doctoral degrees in 1993-94 to
American Indian and Alaska Natives were University of Washington (5 degrees),
University of Mississippi-Main Campus (4 degrees), and University of California-
Berkeley (4 degrees; summary table S4-11). Looking at a 4-year total (1990-94)
for doctoral degrees awarded, a figure less subject to individual year
fluctuations, Oklahoma State University, University of Oklahoma, and
Pennsylvania State University awarded the most doctoral degrees to Native
Americans (summary table S4-12).
Degrees conferred by tribal colleges. In 1993-94, tribal colleges awarded
996 associate’s degrees, 68 bachelor’s degrees, and 9 master’s degrees (table 4-
8)9. Most of the tribal colleges were community colleges; only three awarded
degrees at the bachelor’s level or higher in 1993-94. The tribal colleges
awarding the most degrees were Navajo Community College in Arizona,
Haskell Indian Junior College in Kansas, and Oglala Lakota College in South
Dakota. While tribal colleges do enroll students of all racial/ethnic groups,
about 77 percent of the associate’s degrees, 81 percent of the bachelor’s
degrees, and 67 percent of the master’s degrees awarded by tribal colleges
were awarded to American Indians and Alaska Natives.
9Degrees awarded are based on data reported to IPEDS by 22 tribal colleges.
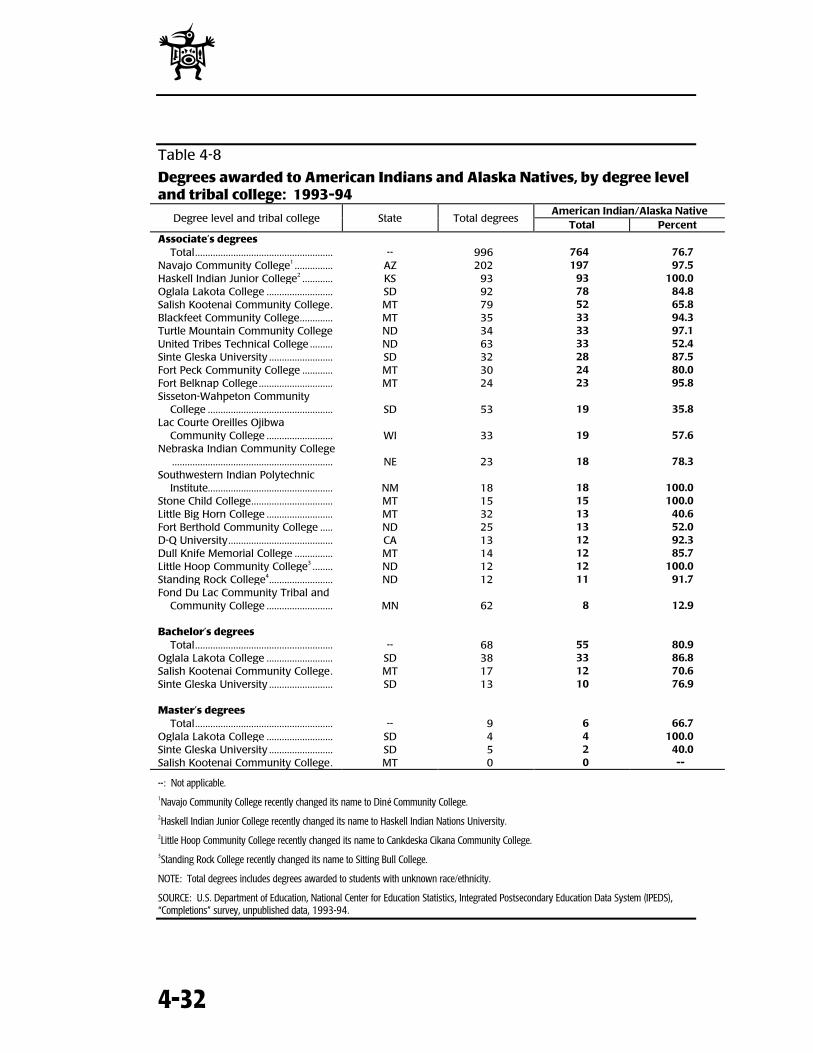
l
4-32
Table 4-8
Degrees awarded to American Indians and Alaska Natives, by degree leveland tribal college: 1993-94
American Indian/Alaska NativeDegree level and tribal college State Total degrees
Total PercentAssociate’s degrees
Total...................................................... -- 996 764 76.7Navajo Community College1 ............... AZ 202 197 97.5Haskell Indian Junior College2 ............ KS 93 93 100.0Oglala Lakota College .......................... SD 92 78 84.8Salish Kootenai Community College. MT 79 52 65.8Blackfeet Community College............. MT 35 33 94.3Turtle Mountain Community College ND 34 33 97.1United Tribes Technical College ......... ND 63 33 52.4Sinte Gleska University ......................... SD 32 28 87.5Fort Peck Community College ............ MT 30 24 80.0Fort Belknap College ............................. MT 24 23 95.8Sisseton-Wahpeton Community
College ................................................. SD 53 19 35.8Lac Courte Oreilles Ojibwa
Community College .......................... WI 33 19 57.6Nebraska Indian Community College
............................................................... NE 23 18 78.3Southwestern Indian Polytechnic
Institute................................................. NM 18 18 100.0Stone Child College................................ MT 15 15 100.0Little Big Horn College .......................... MT 32 13 40.6Fort Berthold Community College ..... ND 25 13 52.0D-Q University......................................... CA 13 12 92.3Dull Knife Memorial College ............... MT 14 12 85.7Little Hoop Community College3 ........ ND 12 12 100.0Standing Rock College4......................... ND 12 11 91.7Fond Du Lac Community Tribal and
Community College .......................... MN 62 8 12.9
Bachelor’s degreesTotal...................................................... -- 68 55 80.9
Oglala Lakota College .......................... SD 38 33 86.8Salish Kootenai Community College. MT 17 12 70.6Sinte Gleska University ......................... SD 13 10 76.9
Master’s degreesTotal...................................................... -- 9 6 66.7
Oglala Lakota College .......................... SD 4 4 100.0Sinte Gleska University ......................... SD 5 2 40.0Salish Kootenai Community College. MT 0 0 --
--: Not applicable.1Navajo Community College recently changed its name to Diné Community College.2Haskell Indian Junior College recently changed its name to Haskell Indian Nations University.2Little Hoop Community College recently changed its name to Cankdeska Cikana Community College.3Standing Rock College recently changed its name to Sitting Bull College.
NOTE: Total degrees includes degrees awarded to students with unknown race/ethnicity.
SOURCE: U.S. Department of Education, National Center for Education Statistics, Integrated Postsecondary Education Data System (IPEDS),“Completions” survey, unpublished data, 1993-94.
Degrees Conferred
4-33
CONCLUSION
In the last 20 years, percentage increases in degrees conferred have been
greater for American Indians and Alaska Natives than for the total population of
degree recipients in each of the degree categories (associate’s,
bachelor’s, master’s, first professional, and doctor’s). However, the
share of degrees awarded to Native Americans remains less than
their share of the U.S. population and less than their share of college
enrollments. Changes in the distribution of degrees by sex since the mid-1970s
are somewhat similar to those occurring in the total population, with women
increasing their share in all degree categories. The five institutions awarding
the most degrees to American Indians and Alaska Natives were located in two
states, Oklahoma and Arizona. Profiles of bachelor’s degree recipients indicate
that American Indian and Alaska Natives have employment and educational
outcomes that are quite similar to those for the total population.
I
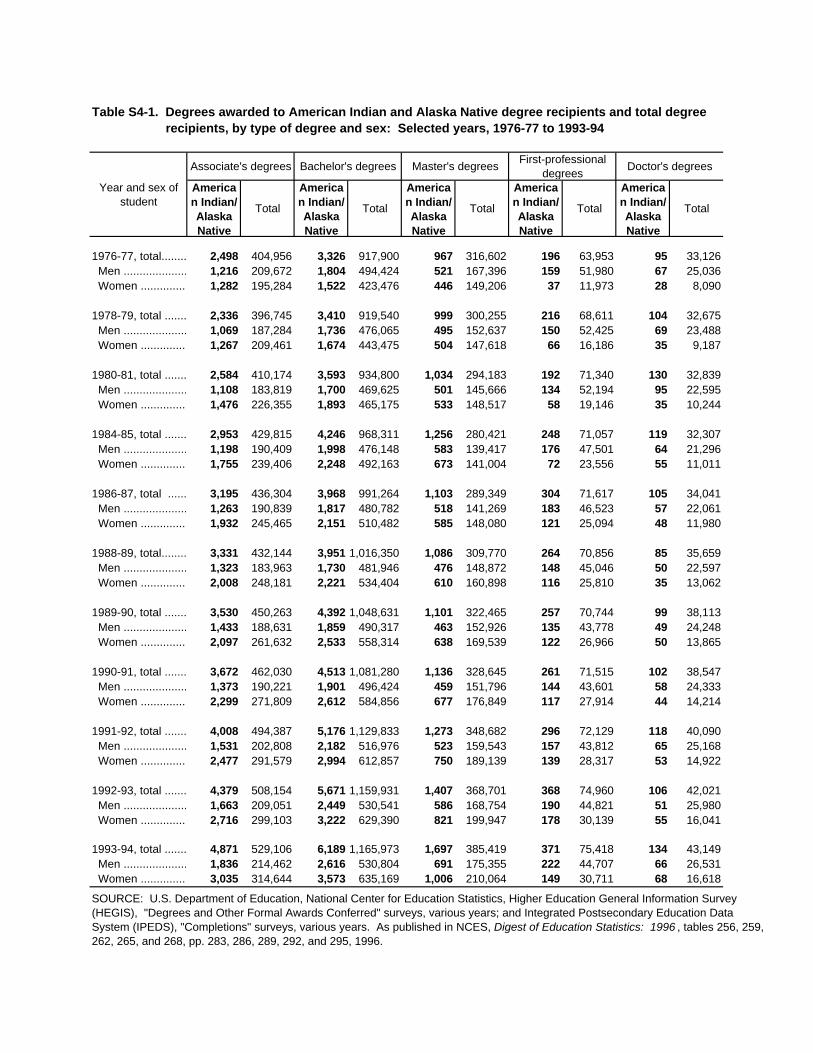
Associate's degrees Bachelor's degrees Master's degreesFirst-professional
degreesDoctor's degrees
Year and sex of student
American Indian/Alaska Native
Total
American Indian/Alaska Native
Total
American Indian/Alaska Native
Total
American Indian/Alaska Native
Total
American Indian/Alaska Native
Total
1976-77, total..............................2,498 404,956 3,326 917,900 967 316,602 196 63,953 95 33,126 Men ..............................................1,216 209,672 1,804 494,424 521 167,396 159 51,980 67 25,036 Women .....................................1,282 195,284 1,522 423,476 446 149,206 37 11,973 28 8,090 1978-79, total .............................2,336 396,745 3,410 919,540 999 300,255 216 68,611 104 32,675 Men ..............................................1,069 187,284 1,736 476,065 495 152,637 150 52,425 69 23,488 Women .....................................1,267 209,461 1,674 443,475 504 147,618 66 16,186 35 9,187 1980-81, total ..............................2,584 410,174 3,593 934,800 1,034 294,183 192 71,340 130 32,839 Men ..............................................1,108 183,819 1,700 469,625 501 145,666 134 52,194 95 22,595 Women .....................................1,476 226,355 1,893 465,175 533 148,517 58 19,146 35 10,244 1984-85, total .................................2,953 429,815 4,246 968,311 1,256 280,421 248 71,057 119 32,307 Men ..............................................1,198 190,409 1,998 476,148 583 139,417 176 47,501 64 21,296 Women .....................................1,755 239,406 2,248 492,163 673 141,004 72 23,556 55 11,011 1986-87, total ................................3,195 436,304 3,968 991,264 1,103 289,349 304 71,617 105 34,041 Men ..............................................1,263 190,839 1,817 480,782 518 141,269 183 46,523 57 22,061 Women .....................................1,932 245,465 2,151 510,482 585 148,080 121 25,094 48 11,980 1988-89, total.................................3,331 432,144 3,951 1,016,350 1,086 309,770 264 70,856 85 35,659 Men ..............................................1,323 183,963 1,730 481,946 476 148,872 148 45,046 50 22,597 Women .....................................2,008 248,181 2,221 534,404 610 160,898 116 25,810 35 13,062 1989-90, total ...............................3,530 450,263 4,392 1,048,631 1,101 322,465 257 70,744 99 38,113 Men ..............................................1,433 188,631 1,859 490,317 463 152,926 135 43,778 49 24,248 Women .....................................2,097 261,632 2,533 558,314 638 169,539 122 26,966 50 13,865 1990-91, total .............................3,672 462,030 4,513 1,081,280 1,136 328,645 261 71,515 102 38,547 Men ..............................................1,373 190,221 1,901 496,424 459 151,796 144 43,601 58 24,333 Women .....................................2,299 271,809 2,612 584,856 677 176,849 117 27,914 44 14,214 1991-92, total .............................4,008 494,387 5,176 1,129,833 1,273 348,682 296 72,129 118 40,090 Men ..............................................1,531 202,808 2,182 516,976 523 159,543 157 43,812 65 25,168 Women .....................................2,477 291,579 2,994 612,857 750 189,139 139 28,317 53 14,922 1992-93, total .............................4,379 508,154 5,671 1,159,931 1,407 368,701 368 74,960 106 42,021 Men ..............................................1,663 209,051 2,449 530,541 586 168,754 190 44,821 51 25,980 Women .....................................2,716 299,103 3,222 629,390 821 199,947 178 30,139 55 16,041
1993-94, total .............................4,871 529,106 6,189 1,165,973 1,697 385,419 371 75,418 134 43,149 Men ..............................................1,836 214,462 2,616 530,804 691 175,355 222 44,707 66 26,531 Women .....................................3,035 314,644 3,573 635,169 1,006 210,064 149 30,711 68 16,618
SOURCE: U.S. Department of Education, National Center for Education Statistics, Higher Education General Information Survey (HEGIS), "Degrees and Other Formal Awards Conferred" surveys, various years; and Integrated Postsecondary Education Data System (IPEDS), "Completions" surveys, various years. As published in NCES, Digest of Education Statistics: 1996 , tables 256, 259, 262, 265, and 268, pp. 283, 286, 289, 292, and 295, 1996.
Table S4-1. Degrees awarded to American Indian and Alaska Native degree recipients and total degree recipients, by type of degree and sex: Selected years, 1976-77 to 1993-94
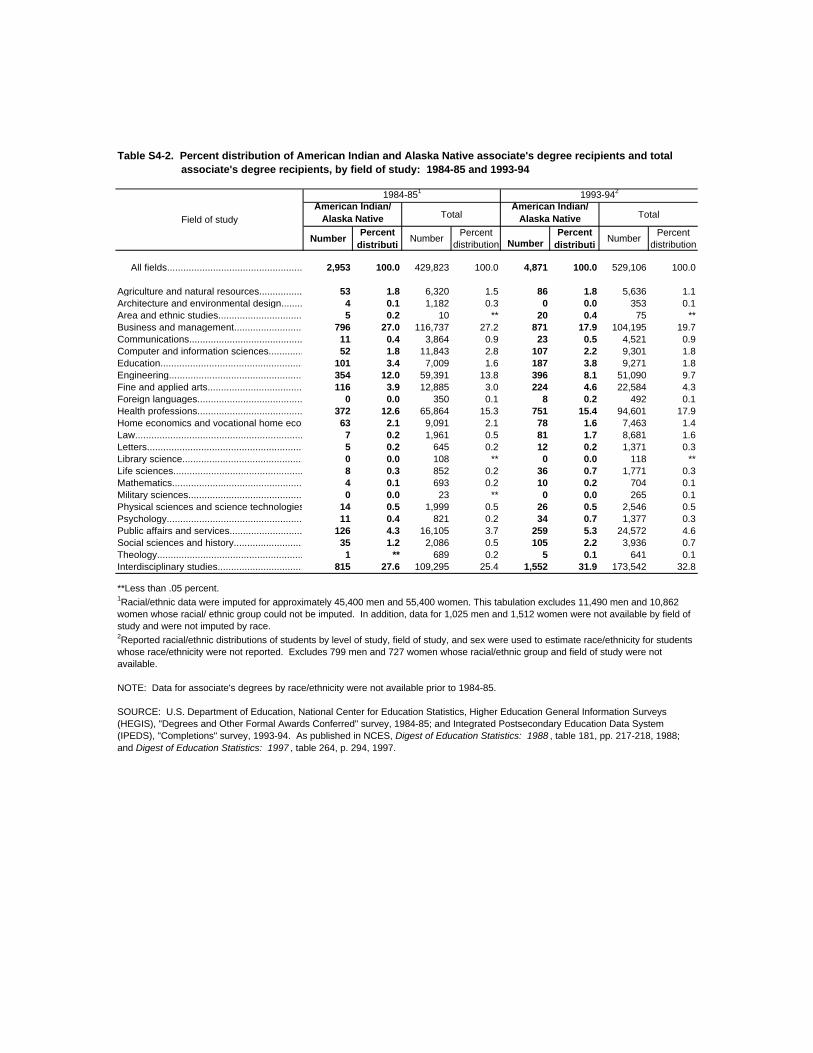
1984-851 1993-942
Field of studyAmerican Indian/
Alaska Native TotalAmerican Indian/
Alaska Native Total
NumberPercent
distributiNumber
Percent distribution Number
Percent distributi
NumberPercent
distribution
All fields................................................................................................2,953 100.0 429,823 100.0 4,871 100.0 529,106 100.0
Agriculture and natural resources.................................................53 1.8 6,320 1.5 86 1.8 5,636 1.1Architecture and environmental design...................................4 0.1 1,182 0.3 0 0.0 353 0.1Area and ethnic studies.................................................................5 0.2 10 ** 20 0.4 75 **Business and management.........................................................................796 27.0 116,737 27.2 871 17.9 104,195 19.7Communications.................................................................................11 0.4 3,864 0.9 23 0.5 4,521 0.9Computer and information sciences.................................................52 1.8 11,843 2.8 107 2.2 9,301 1.8Education.........................................................................................101 3.4 7,009 1.6 187 3.8 9,271 1.8Engineering.................................................................................................354 12.0 59,391 13.8 396 8.1 51,090 9.7Fine and applied arts.............................................................................116 3.9 12,885 3.0 224 4.6 22,584 4.3Foreign languages...................................................................................0 0.0 350 0.1 8 0.2 492 0.1Health professions..........................................................................372 12.6 65,864 15.3 751 15.4 94,601 17.9Home economics and vocational home economics...................................................................................63 2.1 9,091 2.1 78 1.6 7,463 1.4Law................................................................................................7 0.2 1,961 0.5 81 1.7 8,681 1.6Letters................................................................................................5 0.2 645 0.2 12 0.2 1,371 0.3Library science.........................................................................0 0.0 108 ** 0 0.0 118 **Life sciences.....................................................................................8 0.3 852 0.2 36 0.7 1,771 0.3Mathematics...................................................................................4 0.1 693 0.2 10 0.2 704 0.1Military sciences..........................................................................................0 0.0 23 ** 0 0.0 265 0.1Physical sciences and science technologies........................................................................................14 0.5 1,999 0.5 26 0.5 2,546 0.5Psychology..............................................................................................11 0.4 821 0.2 34 0.7 1,377 0.3Public affairs and services.....................................................................126 4.3 16,105 3.7 259 5.3 24,572 4.6Social sciences and history.....................................................................................35 1.2 2,086 0.5 105 2.2 3,936 0.7Theology............................................................................................1 ** 689 0.2 5 0.1 641 0.1Interdisciplinary studies........................................................................815 27.6 109,295 25.4 1,552 31.9 173,542 32.8
Table S4-2. Percent distribution of American Indian and Alaska Native associate's degree recipients and total associate's degree recipients, by field of study: 1984-85 and 1993-94
**Less than .05 percent.1Racial/ethnic data were imputed for approximately 45,400 men and 55,400 women. This tabulation excludes 11,490 men and 10,862 women whose racial/ ethnic group could not be imputed. In addition, data for 1,025 men and 1,512 women were not available by field of study and were not imputed by race.2Reported racial/ethnic distributions of students by level of study, field of study, and sex were used to estimate race/ethnicity for students whose race/ethnicity were not reported. Excludes 799 men and 727 women whose racial/ethnic group and field of study were not available.
NOTE: Data for associate's degrees by race/ethnicity were not available prior to 1984-85.
SOURCE: U.S. Department of Education, National Center for Education Statistics, Higher Education General Information Surveys (HEGIS), "Degrees and Other Formal Awards Conferred" survey, 1984-85; and Integrated Postsecondary Education Data System (IPEDS), "Completions" survey, 1993-94. As published in NCES, Digest of Education Statistics: 1988 , table 181, pp. 217-218, 1988; and Digest of Education Statistics: 1997 , table 264, p. 294, 1997.
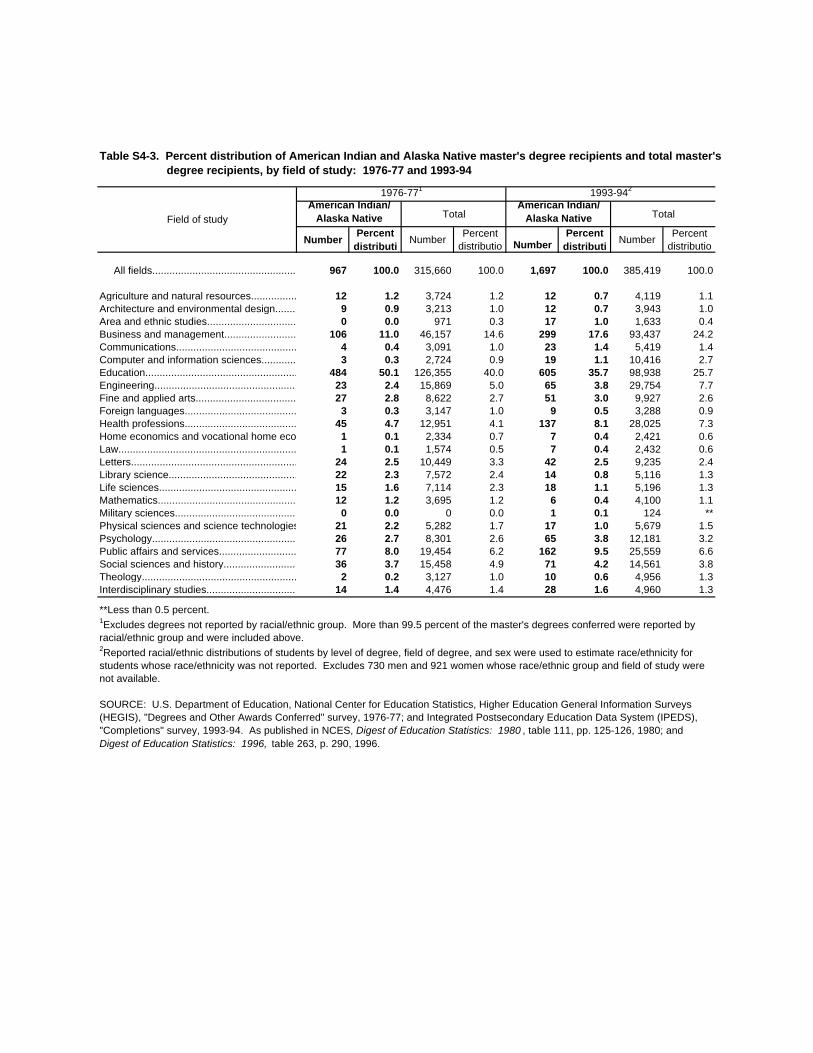
1976-771 1993-942
Field of studyAmerican Indian/
Alaska Native TotalAmerican Indian/
Alaska Native Total
NumberPercent
distributiNumber
Percent distributio Number
Percent distributi
NumberPercent
distributio
All fields....................................................................................967 100.0 315,660 100.0 1,697 100.0 385,419 100.0
Agriculture and natural resources...........................................................12 1.2 3,724 1.2 12 0.7 4,119 1.1Architecture and environmental design.............................................9 0.9 3,213 1.0 12 0.7 3,943 1.0Area and ethnic studies...........................................................................0 0.0 971 0.3 17 1.0 1,633 0.4Business and management.............................................................................106 11.0 46,157 14.6 299 17.6 93,437 24.2Communications......................................................................................4 0.4 3,091 1.0 23 1.4 5,419 1.4Computer and information sciences......................................................3 0.3 2,724 0.9 19 1.1 10,416 2.7Education...................................................................................................484 50.1 126,355 40.0 605 35.7 98,938 25.7Engineering......................................................................................................23 2.4 15,869 5.0 65 3.8 29,754 7.7Fine and applied arts..................................................................................27 2.8 8,622 2.7 51 3.0 9,927 2.6Foreign languages........................................................................................3 0.3 3,147 1.0 9 0.5 3,288 0.9Health professions...............................................................................45 4.7 12,951 4.1 137 8.1 28,025 7.3Home economics and vocational home economics.........................................................................................1 0.1 2,334 0.7 7 0.4 2,421 0.6Law..........................................................................................................1 0.1 1,574 0.5 7 0.4 2,432 0.6Letters..........................................................................................................24 2.5 10,449 3.3 42 2.5 9,235 2.4Library science..........................................................................................22 2.3 7,572 2.4 14 0.8 5,116 1.3Life sciences..............................................................................................15 1.6 7,114 2.3 18 1.1 5,196 1.3Mathematics..............................................................................................12 1.2 3,695 1.2 6 0.4 4,100 1.1Military sciences...............................................................................................0 0.0 0 0.0 1 0.1 124 **Physical sciences and science technologies..........................................................................................…21 2.2 5,282 1.7 17 1.0 5,679 1.5Psychology...................................................................................................26 2.7 8,301 2.6 65 3.8 12,181 3.2Public affairs and services..........................................................................77 8.0 19,454 6.2 162 9.5 25,559 6.6Social sciences and history..........................................................................................36 3.7 15,458 4.9 71 4.2 14,561 3.8Theology............................................................................................................................2 0.2 3,127 1.0 10 0.6 4,956 1.3Interdisciplinary studies..................................................................................................................14 1.4 4,476 1.4 28 1.6 4,960 1.3
Table S4-3. Percent distribution of American Indian and Alaska Native master's degree recipients and total master's degree recipients, by field of study: 1976-77 and 1993-94
**Less than 0.5 percent.1Excludes degrees not reported by racial/ethnic group. More than 99.5 percent of the master's degrees conferred were reported by racial/ethnic group and were included above.2Reported racial/ethnic distributions of students by level of degree, field of degree, and sex were used to estimate race/ethnicity for students whose race/ethnicity was not reported. Excludes 730 men and 921 women whose race/ethnic group and field of study were not available.
SOURCE: U.S. Department of Education, National Center for Education Statistics, Higher Education General Information Surveys (HEGIS), "Degrees and Other Awards Conferred" survey, 1976-77; and Integrated Postsecondary Education Data System (IPEDS), "Completions" survey, 1993-94. As published in NCES, Digest of Education Statistics: 1980 , table 111, pp. 125-126, 1980; and Digest of Education Statistics: 1996, table 263, p. 290, 1996.
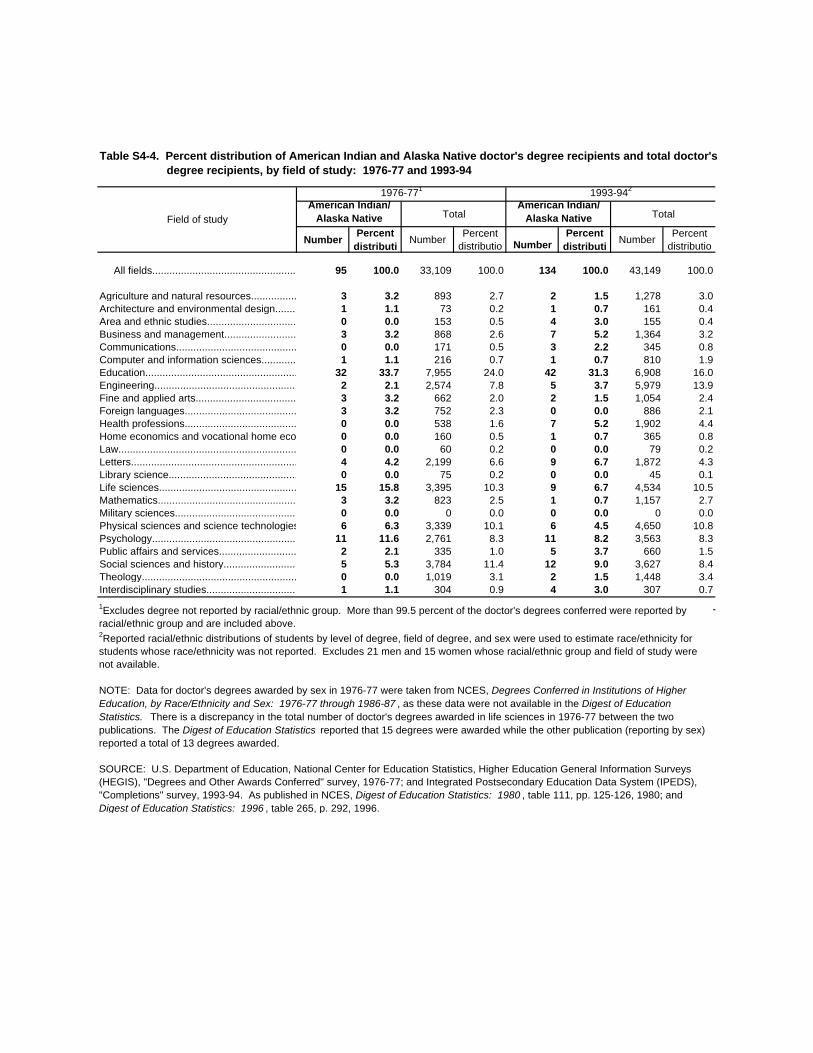
1976-771 1993-942
Field of studyAmerican Indian/
Alaska Native TotalAmerican Indian/
Alaska Native Total
NumberPercent
distributiNumber
Percent distributio Number
Percent distributi
NumberPercent
distributio
All fields................................................................................................95 100.0 33,109 100.0 134 100.0 43,149 100.0
Agriculture and natural resources..........................................................3 3.2 893 2.7 2 1.5 1,278 3.0Architecture and environmental design.................................................1 1.1 73 0.2 1 0.7 161 0.4Area and ethnic studies............................................................................0 0.0 153 0.5 4 3.0 155 0.4Business and management.....................................................................3 3.2 868 2.6 7 5.2 1,364 3.2Communications.......................................................................................0 0.0 171 0.5 3 2.2 345 0.8Computer and information sciences.....................................................1 1.1 216 0.7 1 0.7 810 1.9Education.....................................................................................................32 33.7 7,955 24.0 42 31.3 6,908 16.0Engineering....................................................................................................2 2.1 2,574 7.8 5 3.7 5,979 13.9Fine and applied arts.................................................................................3 3.2 662 2.0 2 1.5 1,054 2.4Foreign languages......................................................................................3 3.2 752 2.3 0 0.0 886 2.1Health professions...................................................................................0 0.0 538 1.6 7 5.2 1,902 4.4Home economics and vocational home economics.........................................................................................0 0.0 160 0.5 1 0.7 365 0.8Law...............................................................................................................0 0.0 60 0.2 0 0.0 79 0.2Letters..........................................................................................................4 4.2 2,199 6.6 9 6.7 1,872 4.3Library science...........................................................................................0 0.0 75 0.2 0 0.0 45 0.1Life sciences...............................................................................................15 15.8 3,395 10.3 9 6.7 4,534 10.5Mathematics.................................................................................................3 3.2 823 2.5 1 0.7 1,157 2.7Military sciences.............................................................................................0 0.0 0 0.0 0 0.0 0 0.0Physical sciences and science technologies..........................................................................................…6 6.3 3,339 10.1 6 4.5 4,650 10.8Psychology..................................................................................................11 11.6 2,761 8.3 11 8.2 3,563 8.3Public affairs and services.......................................................................2 2.1 335 1.0 5 3.7 660 1.5Social sciences and history..........................................................................................5 5.3 3,784 11.4 12 9.0 3,627 8.4Theology......................................................................................................0 0.0 1,019 3.1 2 1.5 1,448 3.4Interdisciplinary studies............................................................................1 1.1 304 0.9 4 3.0 307 0.7
Table S4-4. Percent distribution of American Indian and Alaska Native doctor's degree recipients and total doctor's degree recipients, by field of study: 1976-77 and 1993-94
1Excludes degree not reported by racial/ethnic group. More than 99.5 percent of the doctor's degrees conferred were reported by racial/ethnic group and are included above.2Reported racial/ethnic distributions of students by level of degree, field of degree, and sex were used to estimate race/ethnicity for students whose race/ethnicity was not reported. Excludes 21 men and 15 women whose racial/ethnic group and field of study were not available.
NOTE: Data for doctor's degrees awarded by sex in 1976-77 were taken from NCES, Degrees Conferred in Institutions of Higher Education, by Race/Ethnicity and Sex: 1976-77 through 1986-87 , as these data were not available in the Digest of Education Statistics. There is a discrepancy in the total number of doctor's degrees awarded in life sciences in 1976-77 between the two publications. The Digest of Education Statistics reported that 15 degrees were awarded while the other publication (reporting by sex) reported a total of 13 degrees awarded.
SOURCE: U.S. Department of Education, National Center for Education Statistics, Higher Education General Information Surveys (HEGIS), "Degrees and Other Awards Conferred" survey, 1976-77; and Integrated Postsecondary Education Data System (IPEDS), "Completions" survey, 1993-94. As published in NCES, Digest of Education Statistics: 1980 , table 111, pp. 125-126, 1980; and Digest of Education Statistics: 1996 , table 265, p. 292, 1996.
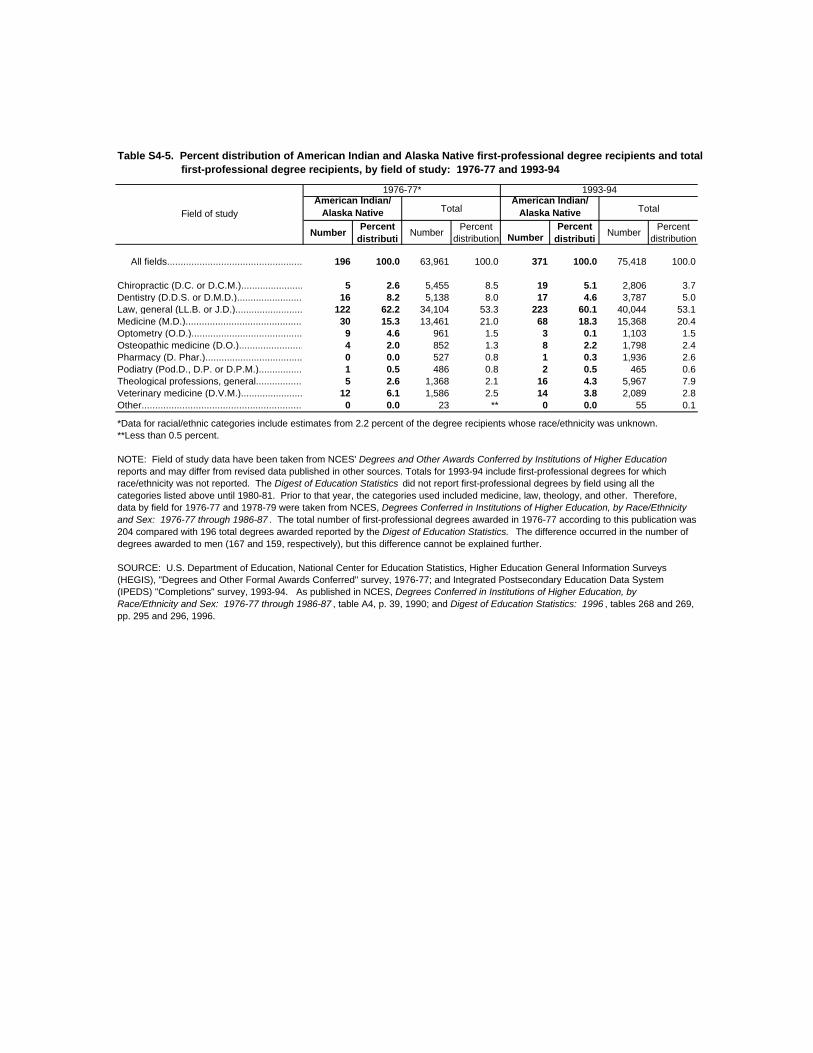
1976-77* 1993-94
Field of studyAmerican Indian/
Alaska Native TotalAmerican Indian/
Alaska Native Total
NumberPercent
distributiNumber
Percent distribution Number
Percent distributi
NumberPercent
distribution
All fields..................................................................................196 100.0 63,961 100.0 371 100.0 75,418 100.0
Chiropractic (D.C. or D.C.M.)............................................................5 2.6 5,455 8.5 19 5.1 2,806 3.7Dentistry (D.D.S. or D.M.D.)................................................................................16 8.2 5,138 8.0 17 4.6 3,787 5.0Law, general (LL.B. or J.D.).....................................................122 62.2 34,104 53.3 223 60.1 40,044 53.1Medicine (M.D.)..........................................................................30 15.3 13,461 21.0 68 18.3 15,368 20.4Optometry (O.D.)..........................................................................9 4.6 961 1.5 3 0.1 1,103 1.5Osteopathic medicine (D.O.)......................................................4 2.0 852 1.3 8 2.2 1,798 2.4Pharmacy (D. Phar.)....................................................................0 0.0 527 0.8 1 0.3 1,936 2.6Podiatry (Pod.D., D.P. or D.P.M.)..............................................1 0.5 486 0.8 2 0.5 465 0.6Theological professions, general................................................5 2.6 1,368 2.1 16 4.3 5,967 7.9Veterinary medicine (D.V.M.)....................................................12 6.1 1,586 2.5 14 3.8 2,089 2.8Other.............................................................................................0 0.0 23 ** 0 0.0 55 0.1
Table S4-5. Percent distribution of American Indian and Alaska Native first-professional degree recipients and total first-professional degree recipients, by field of study: 1976-77 and 1993-94
*Data for racial/ethnic categories include estimates from 2.2 percent of the degree recipients whose race/ethnicity was unknown.**Less than 0.5 percent.
NOTE: Field of study data have been taken from NCES' Degrees and Other Awards Conferred by Institutions of Higher Education reports and may differ from revised data published in other sources. Totals for 1993-94 include first-professional degrees for which race/ethnicity was not reported. The Digest of Education Statistics did not report first-professional degrees by field using all the categories listed above until 1980-81. Prior to that year, the categories used included medicine, law, theology, and other. Therefore, data by field for 1976-77 and 1978-79 were taken from NCES, Degrees Conferred in Institutions of Higher Education, by Race/Ethnicity and Sex: 1976-77 through 1986-87 . The total number of first-professional degrees awarded in 1976-77 according to this publication was 204 compared with 196 total degrees awarded reported by the Digest of Education Statistics. The difference occurred in the number of degrees awarded to men (167 and 159, respectively), but this difference cannot be explained further.
SOURCE: U.S. Department of Education, National Center for Education Statistics, Higher Education General Information Surveys (HEGIS), "Degrees and Other Formal Awards Conferred" survey, 1976-77; and Integrated Postsecondary Education Data System (IPEDS) "Completions" survey, 1993-94. As published in NCES, Degrees Conferred in Institutions of Higher Education, by Race/Ethnicity and Sex: 1976-77 through 1986-87 , table A4, p. 39, 1990; and Digest of Education Statistics: 1996 , tables 268 and 269, pp. 295 and 296, 1996.
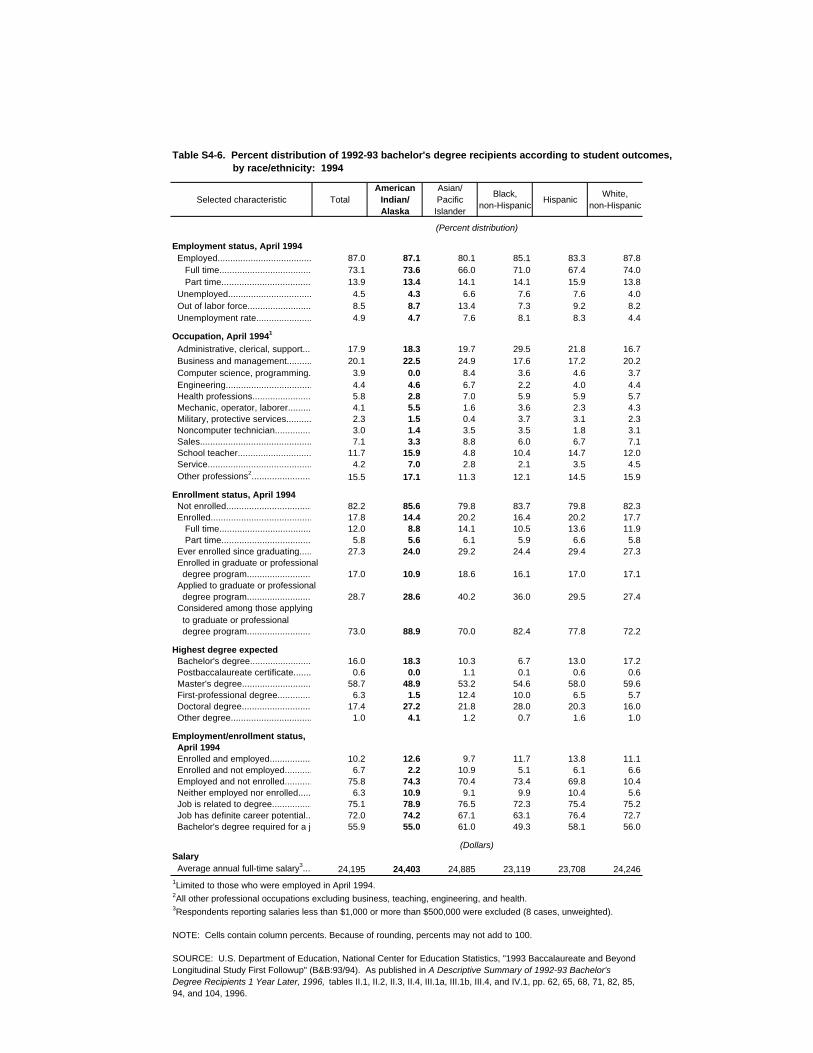
Selected characteristic TotalAmerican
Indian/Alaska
Asian/Pacific
Islander
Black, non-Hispanic
HispanicWhite,
non-Hispanic
(Percent distribution)
Employment status, April 1994 Employed....................................................................................87.0 87.1 80.1 85.1 83.3 87.8 Full time.....................................................................................73.1 73.6 66.0 71.0 67.4 74.0 Part time.....................................................................................13.9 13.4 14.1 14.1 15.9 13.8 Unemployed..................................................................................4.5 4.3 6.6 7.6 7.6 4.0 Out of labor force..........................................................................8.5 8.7 13.4 7.3 9.2 8.2 Unemployment rate....................................................................4.9 4.7 7.6 8.1 8.3 4.4
Occupation, April 19941
Administrative, clerical, support.................................................17.9 18.3 19.7 29.5 21.8 16.7 Business and management......................................................20.1 22.5 24.9 17.6 17.2 20.2 Computer science, programming..................................................3.9 0.0 8.4 3.6 4.6 3.7 Engineering....................................................................................4.4 4.6 6.7 2.2 4.0 4.4 Health professions........................................................................5.8 2.8 7.0 5.9 5.9 5.7 Mechanic, operator, laborer..........................................................4.1 5.5 1.6 3.6 2.3 4.3 Military, protective services..........................................................2.3 1.5 0.4 3.7 3.1 2.3 Noncomputer technician............................................................3.0 1.4 3.5 3.5 1.8 3.1 Sales..................................................................................................7.1 3.3 8.8 6.0 6.7 7.1 School teacher...................................................................................11.7 15.9 4.8 10.4 14.7 12.0 Service................................................................................................4.2 7.0 2.8 2.1 3.5 4.5 Other professions2............................................................................15.5 17.1 11.3 12.1 14.5 15.9
Enrollment status, April 1994 Not enrolled.........................................................................................82.2 85.6 79.8 83.7 79.8 82.3 Enrolled.............................................................................................17.8 14.4 20.2 16.4 20.2 17.7 Full time...........................................................................................12.0 8.8 14.1 10.5 13.6 11.9 Part time.......................................................................................5.8 5.6 6.1 5.9 6.6 5.8 Ever enrolled since graduating.....................................................27.3 24.0 29.2 24.4 29.4 27.3 Enrolled in graduate or professional degree program...................................................................17.0 10.9 18.6 16.1 17.0 17.1 Applied to graduate or professional degree program.............................................................................28.7 28.6 40.2 36.0 29.5 27.4 Considered among those applying to graduate or professional degree program.................................................................................73.0 88.9 70.0 82.4 77.8 72.2
Highest degree expected Bachelor's degree......................................................................16.0 18.3 10.3 6.7 13.0 17.2 Postbaccalaureate certificate....................................................0.6 0.0 1.1 0.1 0.6 0.6 Master's degree.............................................................................58.7 48.9 53.2 54.6 58.0 59.6 First-professional degree..............................................................6.3 1.5 12.4 10.0 6.5 5.7 Doctoral degree................................................................................17.4 27.2 21.8 28.0 20.3 16.0 Other degree......................................................................................1.0 4.1 1.2 0.7 1.6 1.0
Employment/enrollment status, April 1994 Enrolled and employed....................................................................10.2 12.6 9.7 11.7 13.8 11.1 Enrolled and not employed...........................................................6.7 2.2 10.9 5.1 6.1 6.6 Employed and not enrolled..........................................................75.8 74.3 70.4 73.4 69.8 10.4 Neither employed nor enrolled....................................................6.3 10.9 9.1 9.9 10.4 5.6 Job is related to degree.................................................................75.1 78.9 76.5 72.3 75.4 75.2 Job has definite career potential....................................................72.0 74.2 67.1 63.1 76.4 72.7 Bachelor's degree required for a job.............................................55.9 55.0 61.0 49.3 58.1 56.0
(Dollars)Salary Average annual full-time salary3..................................................24,195 24,403 24,885 23,119 23,708 24,246
Table S4-6. Percent distribution of 1992-93 bachelor's degree recipients according to student outcomes, by race/ethnicity: 1994
1Limited to those who were employed in April 1994.2All other professional occupations excluding business, teaching, engineering, and health.3Respondents reporting salaries less than $1,000 or more than $500,000 were excluded (8 cases, unweighted).
NOTE: Cells contain column percents. Because of rounding, percents may not add to 100.
SOURCE: U.S. Department of Education, National Center for Education Statistics, "1993 Baccalaureate and Beyond Longitudinal Study First Followup" (B&B:93/94). As published in A Descriptive Summary of 1992-93 Bachelor's Degree Recipients 1 Year Later, 1996, tables II.1, II.2, II.3, II.4, III.1a, III.1b, III.4, and IV.1, pp. 62, 65, 68, 71, 82, 85, 94, and 104, 1996.
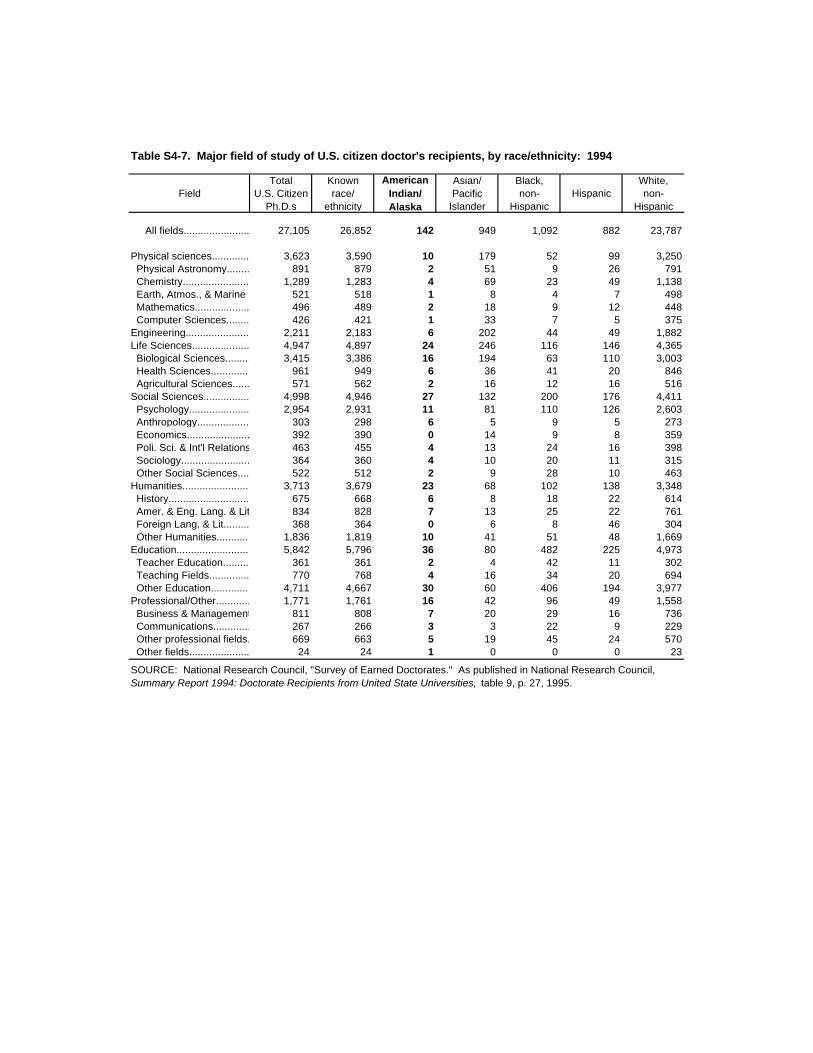
FieldTotal
U.S. CitizenPh.D.s
Known race/
ethnicity
American Indian/Alaska
Asian/Pacific
Islander
Black, non-
HispanicHispanic
White,non-
Hispanic
All fields.......................................................................27,105 26,852 142 949 1,092 882 23,787
Physical sciences.........................................................3,623 3,590 10 179 52 99 3,250 Physical Astronomy...............................................891 879 2 51 9 26 791 Chemistry................................................................1,289 1,283 4 69 23 49 1,138 Earth, Atmos., & Marine Sci................................521 518 1 8 4 7 498 Mathematics............................................................496 489 2 18 9 12 448 Computer Sciences.................................................426 421 1 33 7 5 375Engineering...............................................................2,211 2,183 6 202 44 49 1,882Life Sciences..............................................................4,947 4,897 24 246 116 146 4,365 Biological Sciences....................................................3,415 3,386 16 194 63 110 3,003 Health Sciences.........................................................961 949 6 36 41 20 846 Agricultural Sciences................................................571 562 2 16 12 16 516Social Sciences..............................................................4,998 4,946 27 132 200 176 4,411 Psychology..................................................................2,954 2,931 11 81 110 126 2,603 Anthropology................................................................303 298 6 5 9 5 273 Economics................................................................392 390 0 14 9 8 359 Poli. Sci. & Int'l Relations...........................................463 455 4 13 24 16 398 Sociology......................................................................364 360 4 10 20 11 315 Other Social Sciences.................................................522 512 2 9 28 10 463Humanities.....................................................................3,713 3,679 23 68 102 138 3,348 History..........................................................................675 668 6 8 18 22 614 Amer. & Eng. Lang. & Lit.............................................834 828 7 13 25 22 761 Foreign Lang. & Lit.................................................368 364 0 6 8 46 304 Other Humanities......................................................1,836 1,819 10 41 51 48 1,669Education......................................................................5,842 5,796 36 80 482 225 4,973 Teacher Education...................................................361 361 2 4 42 11 302 Teaching Fields...........................................................770 768 4 16 34 20 694 Other Education.........................................................4,711 4,667 30 60 406 194 3,977Professional/Other......................................................1,771 1,761 16 42 96 49 1,558 Business & Management.......................................811 808 7 20 29 16 736 Communications............................................................267 266 3 3 22 9 229 Other professional fields.............................................669 663 5 19 45 24 570 Other fields....................................................................24 24 1 0 0 0 23
Table S4-7. Major field of study of U.S. citizen doctor's recipients, by race/ethnicity: 1994
SOURCE: National Research Council, "Survey of Earned Doctorates." As published in National Research Council, Summary Report 1994: Doctorate Recipients from United State Universities, table 9, p. 27, 1995.
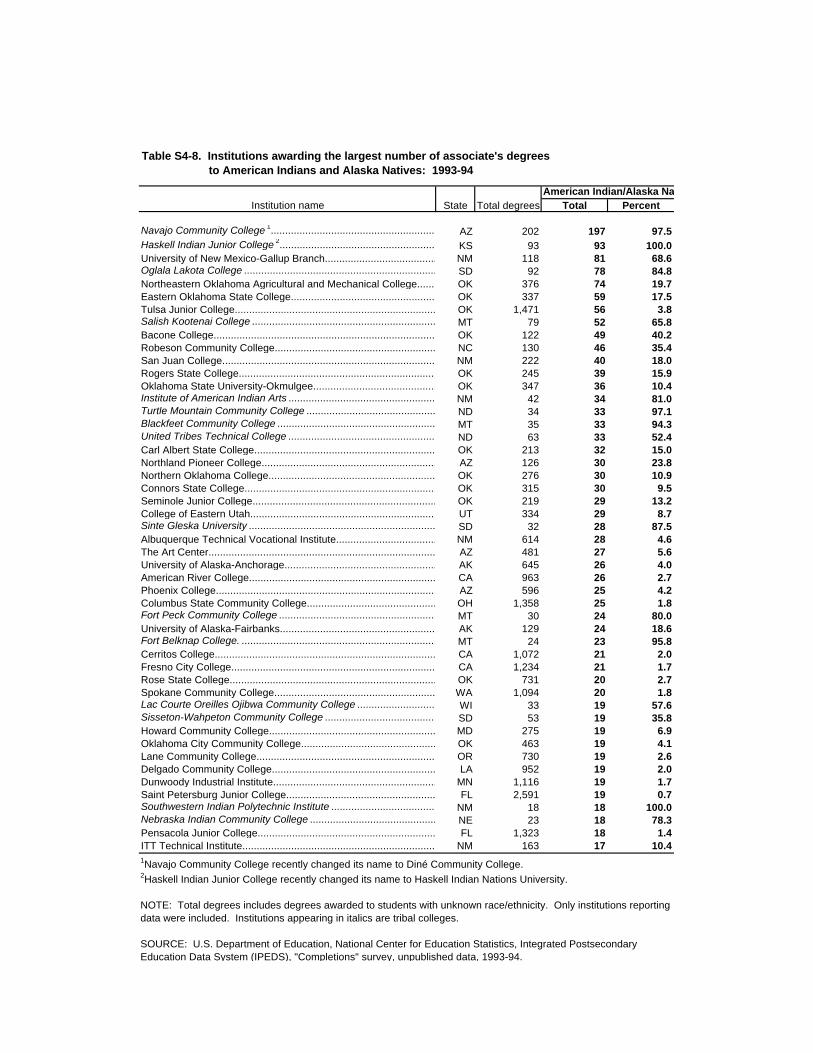
American Indian/Alaska NativeInstitution name State Total degrees Total Percent
Navajo Community College 1.....................................................................................................AZ 202 197 97.5Haskell Indian Junior College 2...............................................................................................KS 93 93 100.0University of New Mexico-Gallup Branch...............................................................................NM 118 81 68.6Oglala Lakota College ............................................................................................................SD 92 78 84.8Northeastern Oklahoma Agricultural and Mechanical College.................................................OK 376 74 19.7Eastern Oklahoma State College...............................................................................................OK 337 59 17.5Tulsa Junior College...............................................................................................................OK 1,471 56 3.8Salish Kootenai College ............................................................................................................MT 79 52 65.8Bacone College........................................................................................................................OK 122 49 40.2Robeson Community College...............................................................................................NC 130 46 35.4San Juan College.....................................................................................................................NM 222 40 18.0Rogers State College..............................................................................................................OK 245 39 15.9Oklahoma State University-Okmulgee.................................................................................OK 347 36 10.4Institute of American Indian Arts ........................................................................................NM 42 34 81.0Turtle Mountain Community College ................................................................................... ND 34 33 97.1Blackfeet Community College ................................................................................................MT 35 33 94.3United Tribes Technical College ........................................................................................ND 63 33 52.4Carl Albert State College...........................................................................................................OK 213 32 15.0Northland Pioneer College....................................................................................................AZ 126 30 23.8Northern Oklahoma College..................................................................................................OK 276 30 10.9Connors State College.............................................................................................................OK 315 30 9.5Seminole Junior College.....................................................................................................OK 219 29 13.2College of Eastern Utah................................................................................................................ UT 334 29 8.7Sinte Gleska University .............................................................................................................SD 32 28 87.5Albuquerque Technical Vocational Institute.......................................................................NM 614 28 4.6The Art Center...........................................................................................................................AZ 481 27 5.6University of Alaska-Anchorage...............................................................................................................................AK 645 26 4.0American River College..........................................................................................................CA 963 26 2.7Phoenix College........................................................................................................................AZ 596 25 4.2Columbus State Community College............................................................................OH 1,358 25 1.8Fort Peck Community College ...............................................................................................MT 30 24 80.0University of Alaska-Fairbanks..............................................................................................AK 129 24 18.6Fort Belknap College. ..............................................................................................................MT 24 23 95.8Cerritos College......................................................................................................................CA 1,072 21 2.0Fresno City College................................................................................................................CA 1,234 21 1.7Rose State College..............................................................................................................OK 731 20 2.7Spokane Community College............................................................................................WA 1,094 20 1.8Lac Courte Oreilles Ojibwa Community College ................................................................WI 33 19 57.6Sisseton-Wahpeton Community College ........................................................................SD 53 19 35.8Howard Community College...............................................................................................MD 275 19 6.9Oklahoma City Community College...................................................................................OK 463 19 4.1Lane Community College......................................................................................................OR 730 19 2.6Delgado Community College.....................................................................................................LA 952 19 2.0Dunwoody Industrial Institute................................................................................................MN 1,116 19 1.7Saint Petersburg Junior College.........................................................................................FL 2,591 19 0.7Southwestern Indian Polytechnic Institute ...........................................................................NM 18 18 100.0Nebraska Indian Community College .....................................................................................NE 23 18 78.3Pensacola Junior College......................................................................................................FL 1,323 18 1.4ITT Technical Institute..........................................................................................................NM 163 17 10.4
Table S4-8. Institutions awarding the largest number of associate's degrees to American Indians and Alaska Natives: 1993-94
1Navajo Community College recently changed its name to Diné Community College.2Haskell Indian Junior College recently changed its name to Haskell Indian Nations University.
NOTE: Total degrees includes degrees awarded to students with unknown race/ethnicity. Only institutions reporting data were included. Institutions appearing in italics are tribal colleges.
SOURCE: U.S. Department of Education, National Center for Education Statistics, Integrated Postsecondary Education Data System (IPEDS), "Completions" survey, unpublished data, 1993-94.
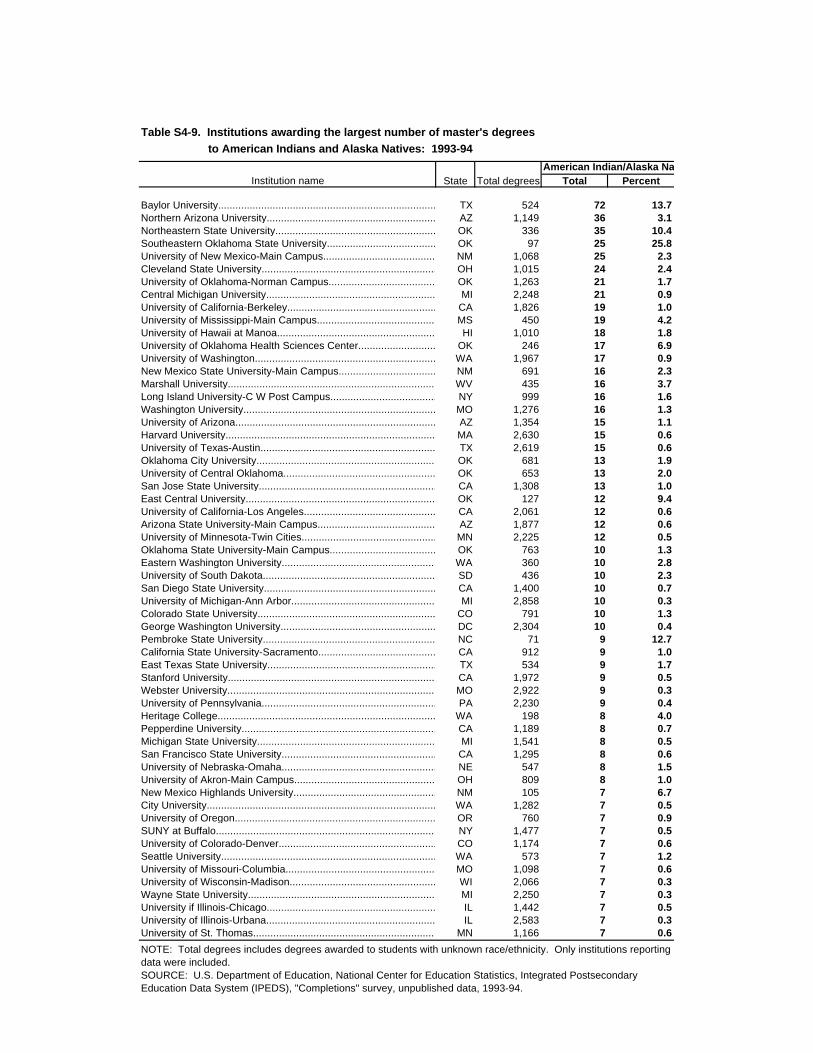
American Indian/Alaska NativeInstitution name State Total degrees Total Percent
Baylor University.....................................................................................................................TX 524 72 13.7Northern Arizona University.............................................................................................AZ 1,149 36 3.1Northeastern State University.............................................................................................OK 336 35 10.4Southeastern Oklahoma State University.....................................................................OK 97 25 25.8University of New Mexico-Main Campus...........................................................................NM 1,068 25 2.3Cleveland State University.................................................................................................OH 1,015 24 2.4University of Oklahoma-Norman Campus.......................................................................OK 1,263 21 1.7Central Michigan University....................................................................................................MI 2,248 21 0.9University of California-Berkeley......................................................................................CA 1,826 19 1.0University of Mississippi-Main Campus............................................................................MS 450 19 4.2University of Hawaii at Manoa............................................................................................. HI 1,010 18 1.8University of Oklahoma Health Sciences Center................................................................OK 246 17 6.9University of Washington.................................................................................................WA 1,967 17 0.9New Mexico State University-Main Campus....................................................................NM 691 16 2.3Marshall University.............................................................................................................WV 435 16 3.7Long Island University-C W Post Campus.......................................................................NY 999 16 1.6Washington University.........................................................................................................MO 1,276 16 1.3University of Arizona...........................................................................................................AZ 1,354 15 1.1Harvard University..................................................................................................................MA 2,630 15 0.6University of Texas-Austin...........................................................................................TX 2,619 15 0.6Oklahoma City University...................................................................................................OK 681 13 1.9University of Central Oklahoma..........................................................................................OK 653 13 2.0San Jose State University..................................................................................................CA 1,308 13 1.0East Central University.........................................................................................................OK 127 12 9.4University of California-Los Angeles..................................................................................CA 2,061 12 0.6Arizona State University-Main Campus..............................................................................AZ 1,877 12 0.6University of Minnesota-Twin Cities...................................................................................MN 2,225 12 0.5Oklahoma State University-Main Campus.......................................................................OK 763 10 1.3Eastern Washington University..........................................................................................WA 360 10 2.8University of South Dakota.................................................................................................SD 436 10 2.3San Diego State University.................................................................................................CA 1,400 10 0.7University of Michigan-Ann Arbor........................................................................................MI 2,858 10 0.3Colorado State University...................................................................................................CO 791 10 1.3George Washington University...........................................................................................DC 2,304 10 0.4Pembroke State University.................................................................................................NC 71 9 12.7California State University-Sacramento..........................................................................CA 912 9 1.0East Texas State University...............................................................................................TX 534 9 1.7Stanford University............................................................................................................CA 1,972 9 0.5Webster University.............................................................................................................MO 2,922 9 0.3University of Pennsylvania.................................................................................................PA 2,230 9 0.4Heritage College..................................................................................................................WA 198 8 4.0Pepperdine University.......................................................................................................CA 1,189 8 0.7Michigan State University...................................................................................................MI 1,541 8 0.5San Francisco State University.........................................................................................CA 1,295 8 0.6University of Nebraska-Omaha....................................................................................NE 547 8 1.5University of Akron-Main Campus.......................................................................................OH 809 8 1.0New Mexico Highlands University......................................................................................NM 105 7 6.7City University......................................................................................................................WA 1,282 7 0.5University of Oregon..............................................................................................................OR 760 7 0.9SUNY at Buffalo.........................................................................................................................NY 1,477 7 0.5University of Colorado-Denver..........................................................................................CO 1,174 7 0.6Seattle University..................................................................................................................WA 573 7 1.2University of Missouri-Columbia.......................................................................................MO 1,098 7 0.6University of Wisconsin-Madison......................................................................................WI 2,066 7 0.3Wayne State University................................................................................................................MI 2,250 7 0.3University if Illinois-Chicago...........................................................................................IL 1,442 7 0.5University of Illinois-Urbana.........................................................................................IL 2,583 7 0.3University of St. Thomas.........................................................................................................MN 1,166 7 0.6
Table S4-9. Institutions awarding the largest number of master's degrees to American Indians and Alaska Natives: 1993-94
NOTE: Total degrees includes degrees awarded to students with unknown race/ethnicity. Only institutions reporting data were included.SOURCE: U.S. Department of Education, National Center for Education Statistics, Integrated Postsecondary Education Data System (IPEDS), "Completions" survey, unpublished data, 1993-94.
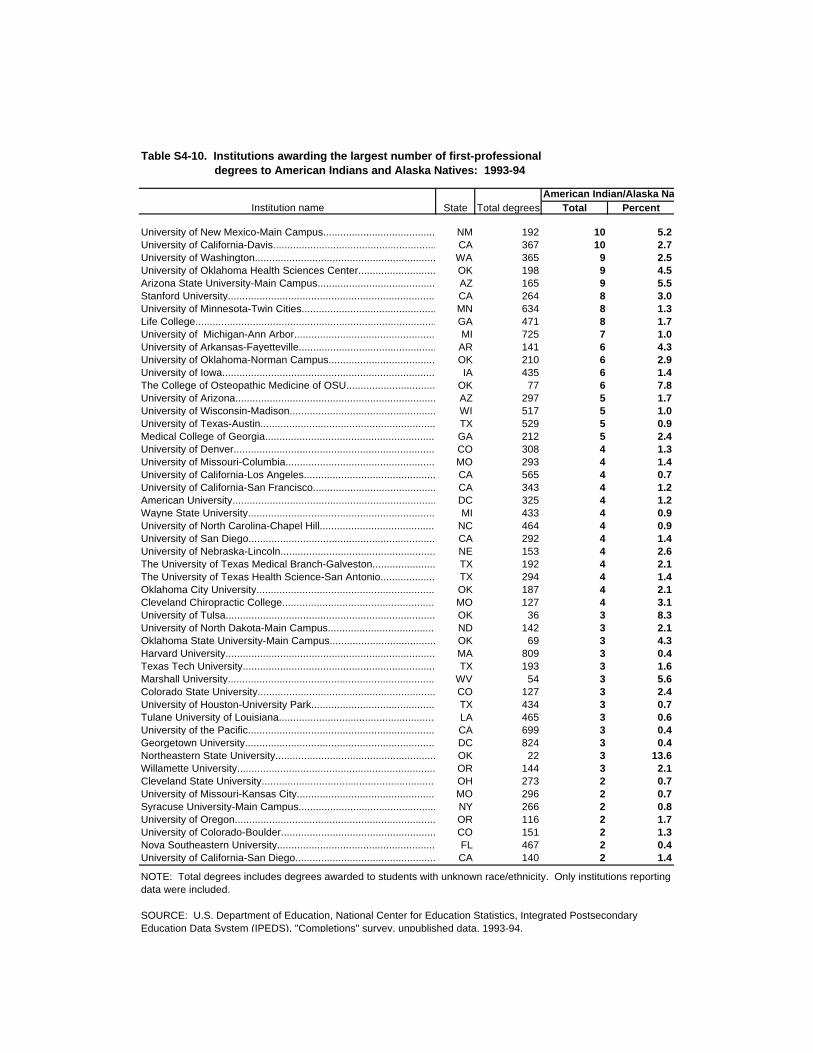
American Indian/Alaska NativeInstitution name State Total degrees Total Percent
University of New Mexico-Main Campus...............................................................................NM 192 10 5.2University of California-Davis....................................................................................................CA 367 10 2.7University of Washington..........................................................................................................WA 365 9 2.5University of Oklahoma Health Sciences Center......................................................................OK 198 9 4.5Arizona State University-Main Campus..............................................................................AZ 165 9 5.5Stanford University.................................................................................................................CA 264 8 3.0University of Minnesota-Twin Cities.....................................................................................MN 634 8 1.3Life College..............................................................................................................................GA 471 8 1.7University of Michigan-Ann Arbor.........................................................................................MI 725 7 1.0University of Arkansas-Fayetteville..................................................................................AR 141 6 4.3University of Oklahoma-Norman Campus..........................................................................OK 210 6 2.9University of Iowa.....................................................................................................................IA 435 6 1.4The College of Osteopathic Medicine of OSU..................................................................OK 77 6 7.8University of Arizona................................................................................................................AZ 297 5 1.7University of Wisconsin-Madison...........................................................................................WI 517 5 1.0University of Texas-Austin.................................................................................................TX 529 5 0.9Medical College of Georgia.......................................................................................................GA 212 5 2.4University of Denver..............................................................................................................CO 308 4 1.3University of Missouri-Columbia.........................................................................................MO 293 4 1.4University of California-Los Angeles....................................................................................CA 565 4 0.7University of California-San Francisco.............................................................................CA 343 4 1.2American University................................................................................................................DC 325 4 1.2Wayne State University............................................................................................................MI 433 4 0.9University of North Carolina-Chapel Hill.......................................................................NC 464 4 0.9University of San Diego........................................................................................................CA 292 4 1.4University of Nebraska-Lincoln...................................................................................... NE 153 4 2.6The University of Texas Medical Branch-Galveston........................................................TX 192 4 2.1The University of Texas Health Science-San Antonio......................................................TX 294 4 1.4Oklahoma City University.......................................................................................................OK 187 4 2.1Cleveland Chiropractic College.........................................................................................MO 127 4 3.1University of Tulsa...............................................................................................................OK 36 3 8.3University of North Dakota-Main Campus.........................................................................ND 142 3 2.1Oklahoma State University-Main Campus......................................................................OK 69 3 4.3Harvard University................................................................................................................MA 809 3 0.4Texas Tech University.........................................................................................................TX 193 3 1.6Marshall University................................................................................................................WV 54 3 5.6Colorado State University.....................................................................................................CO 127 3 2.4University of Houston-University Park.............................................................................TX 434 3 0.7Tulane University of Louisiana......................................................................................LA 465 3 0.6University of the Pacific.......................................................................................................CA 699 3 0.4Georgetown University..........................................................................................................DC 824 3 0.4Northeastern State University............................................................................................OK 22 3 13.6Willamette University........................................................................................................OR 144 3 2.1Cleveland State University.....................................................................................................OH 273 2 0.7University of Missouri-Kansas City....................................................................................MO 296 2 0.7Syracuse University-Main Campus.................................................................................NY 266 2 0.8University of Oregon.............................................................................................................OR 116 2 1.7University of Colorado-Boulder.......................................................................................CO 151 2 1.3Nova Southeastern University...........................................................................................FL 467 2 0.4University of California-San Diego.....................................................................................CA 140 2 1.4
Table S4-10. Institutions awarding the largest number of first-professional degrees to American Indians and Alaska Natives: 1993-94
NOTE: Total degrees includes degrees awarded to students with unknown race/ethnicity. Only institutions reporting data were included.
SOURCE: U.S. Department of Education, National Center for Education Statistics, Integrated Postsecondary Education Data System (IPEDS), "Completions" survey, unpublished data, 1993-94.
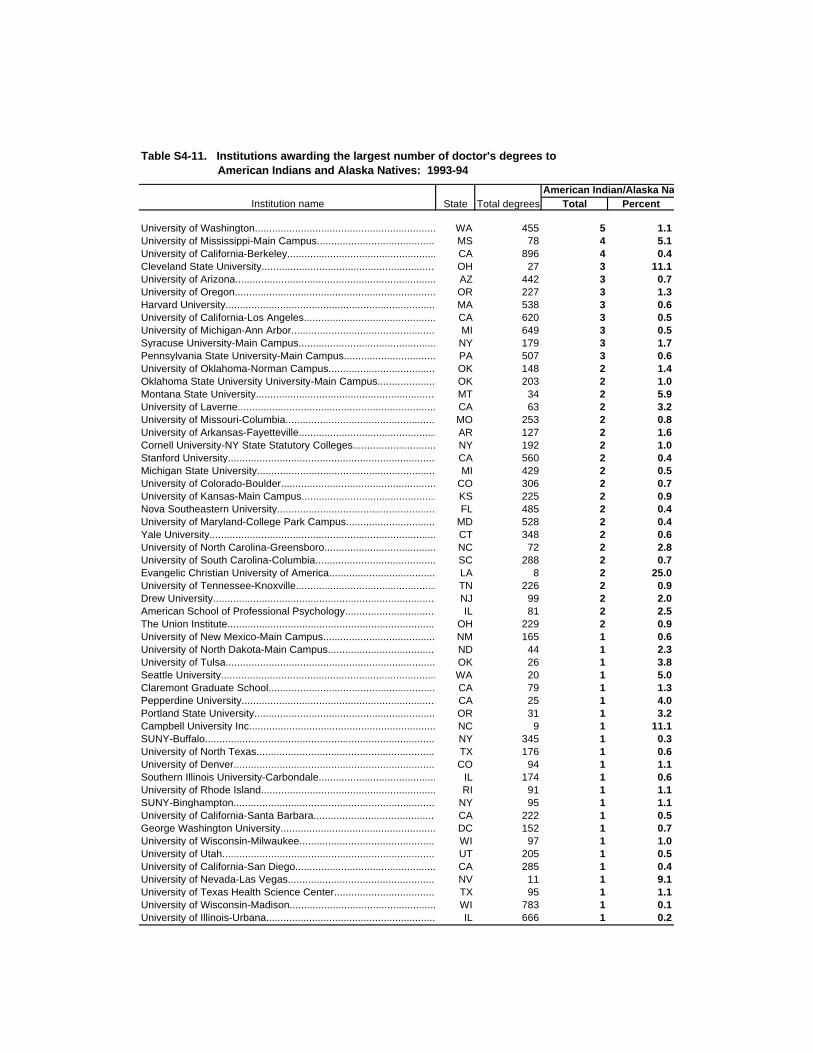
American Indian/Alaska NativeInstitution name State Total degrees Total Percent
University of Washington........................................................................................................WA 455 5 1.1University of Mississippi-Main Campus..............................................................................MS 78 4 5.1University of California-Berkeley................................................................................................CA 896 4 0.4Cleveland State University......................................................................................................OH 27 3 11.1University of Arizona...........................................................................................................AZ 442 3 0.7University of Oregon.................................................................................................................OR 227 3 1.3Harvard University..................................................................................................................MA 538 3 0.6University of California-Los Angeles.....................................................................................CA 620 3 0.5University of Michigan-Ann Arbor...............................................................................................MI 649 3 0.5Syracuse University-Main Campus..........................................................................................NY 179 3 1.7Pennsylvania State University-Main Campus....................................................................PA 507 3 0.6University of Oklahoma-Norman Campus.............................................................................OK 148 2 1.4Oklahoma State University University-Main Campus........................................................OK 203 2 1.0Montana State University........................................................................................................MT 34 2 5.9University of Laverne.................................................................................................................CA 63 2 3.2University of Missouri-Columbia...........................................................................................MO 253 2 0.8University of Arkansas-Fayetteville...................................................................................AR 127 2 1.6Cornell University-NY State Statutory Colleges......................................................................................................NY 192 2 1.0Stanford University..................................................................................................................CA 560 2 0.4Michigan State University......................................................................................................MI 429 2 0.5University of Colorado-Boulder........................................................................................CO 306 2 0.7University of Kansas-Main Campus.....................................................................................KS 225 2 0.9Nova Southeastern University..................................................................................................FL 485 2 0.4University of Maryland-College Park Campus..................................................................MD 528 2 0.4Yale University........................................................................................................................CT 348 2 0.6University of North Carolina-Greensboro.........................................................................NC 72 2 2.8University of South Carolina-Columbia..........................................................................SC 288 2 0.7Evangelic Christian University of America.............................................................................LA 8 2 25.0University of Tennessee-Knoxville.......................................................................................TN 226 2 0.9Drew University........................................................................................................................NJ 99 2 2.0American School of Professional Psychology..................................................................IL 81 2 2.5The Union Institute..............................................................................................................OH 229 2 0.9University of New Mexico-Main Campus.............................................................................NM 165 1 0.6University of North Dakota-Main Campus.........................................................................ND 44 1 2.3University of Tulsa...................................................................................................................OK 26 1 3.8Seattle University....................................................................................................................WA 20 1 5.0Claremont Graduate School...................................................................................................CA 79 1 1.3Pepperdine University............................................................................................................CA 25 1 4.0Portland State University...........................................................................................................OR 31 1 3.2Campbell University Inc...........................................................................................................NC 9 1 11.1SUNY-Buffalo.........................................................................................................................NY 345 1 0.3University of North Texas........................................................................................................TX 176 1 0.6University of Denver...............................................................................................................CO 94 1 1.1Southern Illinois University-Carbondale...............................................................................IL 174 1 0.6University of Rhode Island.....................................................................................................RI 91 1 1.1SUNY-Binghampton............................................................................................................NY 95 1 1.1University of California-Santa Barbara................................................................................CA 222 1 0.5George Washington University..............................................................................................DC 152 1 0.7University of Wisconsin-Milwaukee........................................................................................WI 97 1 1.0University of Utah...................................................................................................................UT 205 1 0.5University of California-San Diego.......................................................................................\CA 285 1 0.4University of Nevada-Las Vegas...........................................................................................NV 11 1 9.1University of Texas Health Science Center...............................................................TX 95 1 1.1University of Wisconsin-Madison..........................................................................................WI 783 1 0.1University of Illinois-Urbana...........................................................................................IL 666 1 0.2
Table S4-11. Institutions awarding the largest number of doctor's degrees to American Indians and Alaska Natives: 1993-94
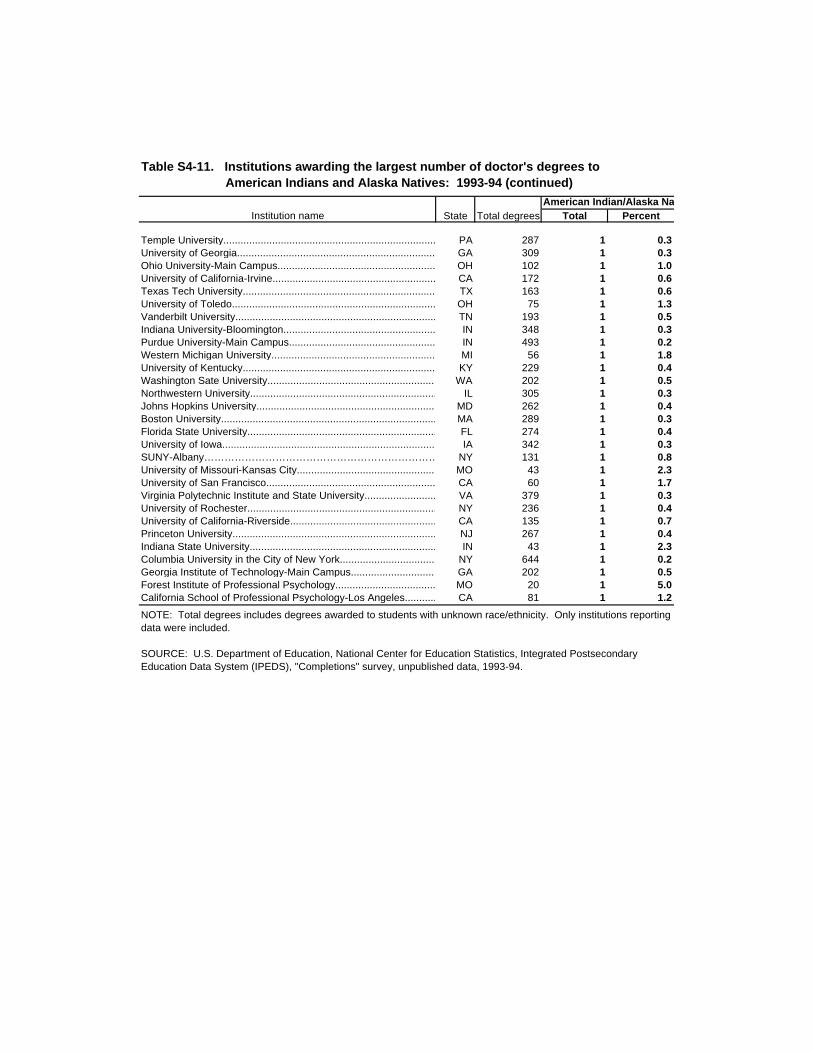
American Indian/Alaska NativeInstitution name State Total degrees Total Percent
Temple University...................................................................................................................PA 287 1 0.3University of Georgia..............................................................................................................GA 309 1 0.3Ohio University-Main Campus..............................................................................................OH 102 1 1.0University of California-Irvine.................................................................................................CA 172 1 0.6Texas Tech University............................................................................................................................TX 163 1 0.6University of Toledo................................................................................................................OH 75 1 1.3Vanderbilt University.................................................................................................................TN 193 1 0.5Indiana University-Bloomington...........................................................................................IN 348 1 0.3Purdue University-Main Campus........................................................................................IN 493 1 0.2Western Michigan University................................................................................................MI 56 1 1.8University of Kentucky..........................................................................................................\KY 229 1 0.4Washington Sate University...................................................................................................WA 202 1 0.5Northwestern University.........................................................................................................IL 305 1 0.3Johns Hopkins University......................................................................................................MD 262 1 0.4Boston University...................................................................................................................MA 289 1 0.3Florida State University.......................................................................................................FL 274 1 0.4University of Iowa....................................................................................................................IA 342 1 0.3SUNY-Albany………………………………………………………………………………..NY 131 1 0.8University of Missouri-Kansas City..............................................................................................MO 43 1 2.3University of San Francisco.................................................................................................CA 60 1 1.7Virginia Polytechnic Institute and State University.....................................................................VA 379 1 0.3University of Rochester.....................................................................................................NY 236 1 0.4University of California-Riverside............................................................................................CA 135 1 0.7Princeton University..................................................................................................................NJ 267 1 0.4Indiana State University.........................................................................................................IN 43 1 2.3Columbia University in the City of New York......................................................................NY 644 1 0.2Georgia Institute of Technology-Main Campus..................................................................GA 202 1 0.5Forest Institute of Professional Psychology............................................................................MO 20 1 5.0California School of Professional Psychology-Los Angeles............................................CA 81 1 1.2
NOTE: Total degrees includes degrees awarded to students with unknown race/ethnicity. Only institutions reporting data were included.
SOURCE: U.S. Department of Education, National Center for Education Statistics, Integrated Postsecondary Education Data System (IPEDS), "Completions" survey, unpublished data, 1993-94.
Table S4-11. Institutions awarding the largest number of doctor's degrees to American Indians and Alaska Natives: 1993-94 (continued)
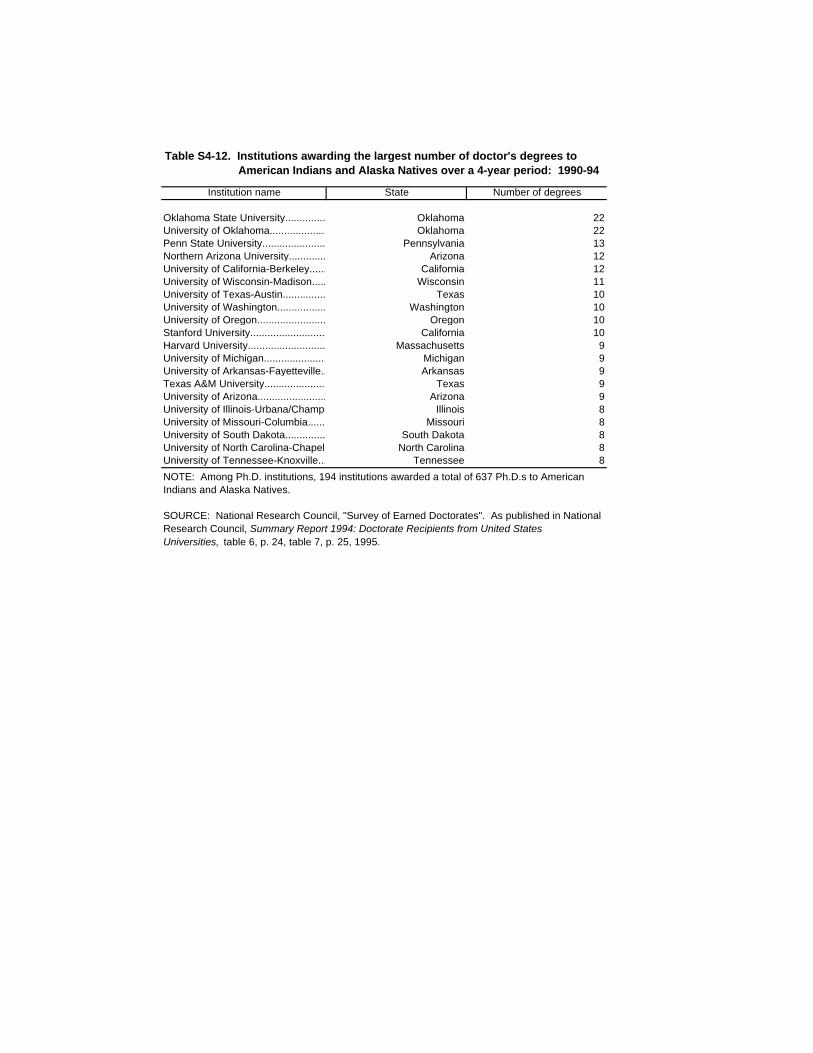
Institution name State Number of degrees
Oklahoma State University........................................... Oklahoma 22University of Oklahoma............................................... Oklahoma 22Penn State University.............................................. Pennsylvania 13Northern Arizona University.......................................... Arizona 12University of California-Berkeley.................................. California 12University of Wisconsin-Madison................................ Wisconsin 11University of Texas-Austin................................................. Texas 10University of Washington................................................Washington 10University of Oregon......................................................... Oregon 10Stanford University..................................................... California 10Harvard University........................................................Massachusetts 9University of Michigan............................................... Michigan 9University of Arkansas-Fayetteville............................... Arkansas 9Texas A&M University........................................................ Texas 9University of Arizona............................................................Arizona 9University of Illinois-Urbana/Champaign........................... Illinois 8University of Missouri-Columbia............................................Missouri 8University of South Dakota......................................................South Dakota 8University of North Carolina-Chapel Hill............................................North Carolina 8University of Tennessee-Knoxville............................................Tennessee 8
Table S4-12. Institutions awarding the largest number of doctor's degrees to American Indians and Alaska Natives over a 4-year period: 1990-94
NOTE: Among Ph.D. institutions, 194 institutions awarded a total of 637 Ph.D.s to American Indians and Alaska Natives.
SOURCE: National Research Council, "Survey of Earned Doctorates". As published in National Research Council, Summary Report 1994: Doctorate Recipients from United States Universities, table 6, p. 24, table 7, p. 25, 1995.
Financial Aid forAmerican Indians andAlaska Natives inPostsecondary Institutions
P5
Financial Aid
5-1
uring the 1992-93 academic year, about 62 percent of American Indian and
Alaska Native1 undergraduates needed financial assistance to attend
postsecondary institutions. Most of these students received some form of
financial assistance in the form of grants, loans, or work-study. However, even
after receiving this aid, 54 percent still had financial need.2 The percentage of
all undergraduates who needed and received financial aid in 1992-93 was
similar.
This chapter discusses the availability and receipt of financial aid by American
Indian and Alaska Native students attending postsecondary institutions. The
first half of the chapter focuses on financial aid to undergraduates. Beginning
with a brief introduction to student dependency status, this section continues
with a discussion of expected family contributions toward higher education,
tuition and fees, and the average cost of attending postsecondary institutions.
The next section of the chapter analyzes financial need, financial awards, and
the remaining financial need of undergraduates. It includes an examination of
undergraduate financial aid awards by source. The statistics discussed in the
first half of this chapter are used to illustrate the financial aid situation of Native
American undergraduates and all undergraduates and are not intended to
indicate statistical significance, except where noted. The second half of the
chapter looks at financial support for doctorate recipients and provides an
overview of federal funding sources specifically available to American Indian
and Alaska Native students. The summary tables referred to in the text appear
at the end of the chapter.
HIGHLIGHTS
# Sixty-two percent of American Indian and Alaska Native undergraduatesand 60 percent of all undergraduates had financial need in 1992-93. Theaverage amount of need for Native American undergraduates was $5,600.For all undergraduates, it was $6,400 (figure 5-6).
1The terms “Native American” and “American Indian and Alaska Native” are used interchangeably throughout this chapter.
2U.S. Department of Education, National Center for Education Statistics, 1992-93 National Postsecondary Student Aid Study (NPSAS:93). Aspublished in NCES, Student Financing of Undergraduate Education, 1992-93, tables 3.5a, 4.3a, and 4.4a, 1995.
D
P
5-2
# Thirty-four percent of Native American undergraduates and 31 percent of allundergraduates received some type of federal financial aid (table 5-2).
# State financial aid was received by 9 percent of Native Americanundergraduates and 10 percent of all undergraduates (table 5-2).
# Institutional financial aid was provided to 13 percent of American Indianand Alaska Native undergraduates and 12 percent of all undergraduates(table 5-2).
# The most common type of aid package for American Indian and AlaskaNative and all undergraduates was one based entirely on grants (figure 5-7).
# The largest financial aid package awarded to American Indian and AlaskaNative undergraduates was for an average of $3,200 supplied in acombination of grants, loans, and work-study (summary table S5-4).
# Among independent American Indian and Alaska Native undergraduates,50 percent received financial aid. Among all independent undergraduates,41 percent received financial aid (table 5-3).
# After receiving financial aid, 54 percent of American Indian and AlaskaNative undergraduates and 50 percent of all undergraduates had remainingfinancial need (summary table S5-5).
# The average total cost of postsecondary education minus grants for NativeAmericans was $6,700. For all undergraduates, the total cost minus grantswas $7,300 (figure 5-8).
# In 1994, more than half (55 percent) of American Indian and Alaska Nativedoctorate recipients paid for their education using personal funds. Amongall U.S. doctorate recipients, 46 percent paid for their education usingpersonal funds (figure 5-9).
# Among Native American doctorate recipients, 61 percent graduated owingmoney for their education and 28 percent owed more than $15,000.Among all U.S. citizen doctorate recipients, 55 percent graduated with debtand 20 percent owed more than $15,000 (table 5-4).
SOURCES OF DATA
Data are taken from the following major national sources: the
National Center for Education Statistics (NCES) National Postsecondary
Student Aid Study and the jointly sponsored Survey of Earned5
Financial Aid
5-3
Doctorates. Information was also taken from various federal publications
discussing financial aid opportunities for American Indian and Alaska Native
students.
The National Postsecondary Student Aid Survey (NPSAS). NPSAS is a
comprehensive study of how students and their families finance postsecondary
education. These students attend institutions at all levels including less-than-2-
year schools, 2- to 3-year schools, 4-year colleges, and major universities. As
the first comprehensive financial aid database, NPSAS includes nationally
representative samples of undergraduates, graduates students, and first-
professional students. Study participants included both aided and nonaided
students (and their families). In addition to collecting data on sources of aid,
NPSAS also collects detailed information on student and family characteristics.
The survey was first conducted in 1986-87. Two additional NPSAS cycles were
completed in 1989-90 and 1992-93. The 1992-93 survey (NPSAS:93) included
a stratified sample of approximately 66,000 students from about 1,100
institutions. The majority of these students (52,000) were undergraduates. The
response rate for the 1992-93 survey was about 85 percent.
The Survey of Earned Doctorates (SED). Statistics are also presented from the
Survey of Earned Doctorates (SED), a census of all recipients of doctoral degrees
conferred by U.S. institutions. The survey is jointly sponsored by the National
Science Foundation, the U.S. Department of Education, the National Endowment
for the Humanities, the U.S. Department of Agriculture, and the National
Institute of Health. The SED questionnaire, which solicits information on field of
study, sex, race/ethnicity, financial support, time to degree, and immediate
postgraduation plans, is distributed with cooperation from graduate school
deans and completed by graduates as they finish the requirements for their
degrees. Degrees are reported from July 1 through June 30 of the following
year. Both research and applied-research degrees, such as Ph.D., D.Sc., and
Ed.D., in all fields are included. However, professional degrees, such as M.D.,
D.D.S., J.D., and Psy.D., are not covered. Response rates for the SED average 95
percent.
P
5-4
STUDENT CHARACTERISTICS AND
ATTENDANCE PATTERNS
This section provides a brief examination of American Indian and
Alaska Native undergraduates’ enrollment, dependency status, and
attendance status. These factors affect the cost of postsecondary
education and, consequently, the amount of financial aid that may
be needed to finance a degree.
Enrollment and attendance status. In fall 1992, 46 percent of American
Indian and Alaska Native students and 61 percent of all students attended 4-
year institutions (table 5-1). Furthermore, the majority of both American Indian
and Alaska Natives and all students attended public institutions and attended
higher education institutions on a full-time basis. These factors are crucial to
understanding the need for financial aid. As the data from the 1992-93
National Postsecondary Student Aid Study showed, the
average cost of postsecondary education varied with the typeof institution the student attended. In general, institutionsthat offered longer term programs were more costly thaninstitutions that offered only shorter term programs, andprivate institutions were generally more costly than publicinstitutions that offered programs of similar length...Withineach institution type, the price of part-time enrollment wassubstantially less than the price of full-time enrollment.3
3U.S. Department of Education, National Center for Education Statistics, Student Financing of Undergraduate Education, 1992-93, pp. 3 and 6,1995.
)
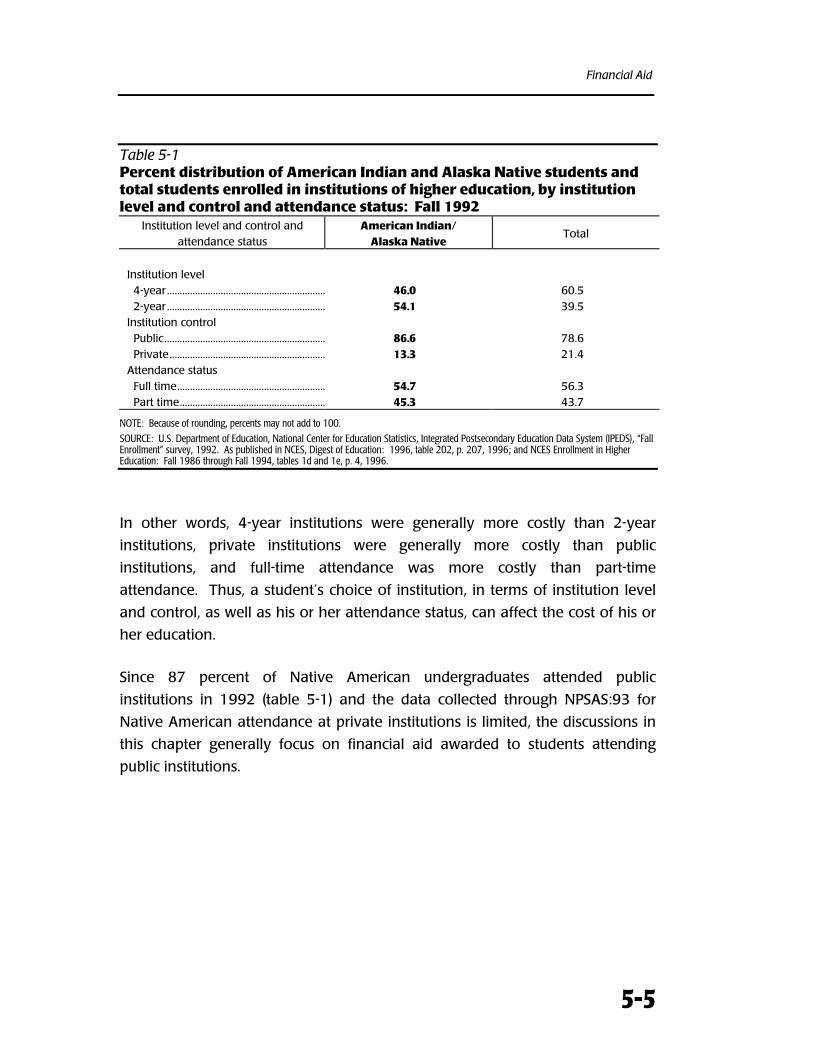
Financial Aid
5-5
Table 5-1Percent distribution of American Indian and Alaska Native students andtotal students enrolled in institutions of higher education, by institutionlevel and control and attendance status: Fall 1992
Institution level and control andattendance status
American Indian/Alaska Native
Total
Institution level 4-year .............................................................. 46.0 60.5 2-year .............................................................. 54.1 39.5Institution control Public............................................................... 86.6 78.6 Private............................................................. 13.3 21.4Attendance status Full time.......................................................... 54.7 56.3 Part time......................................................... 45.3 43.7
NOTE: Because of rounding, percents may not add to 100.
SOURCE: U.S. Department of Education, National Center for Education Statistics, Integrated Postsecondary Education Data System (IPEDS), “FallEnrollment” survey, 1992. As published in NCES, Digest of Education: 1996, table 202, p. 207, 1996; and NCES Enrollment in HigherEducation: Fall 1986 through Fall 1994, tables 1d and 1e, p. 4, 1996.
In other words, 4-year institutions were generally more costly than 2-year
institutions, private institutions were generally more costly than public
institutions, and full-time attendance was more costly than part-time
attendance. Thus, a student’s choice of institution, in terms of institution level
and control, as well as his or her attendance status, can affect the cost of his or
her education.
Since 87 percent of Native American undergraduates attended public
institutions in 1992 (table 5-1) and the data collected through NPSAS:93 for
Native American attendance at private institutions is limited, the discussions in
this chapter generally focus on financial aid awarded to students attending
public institutions.
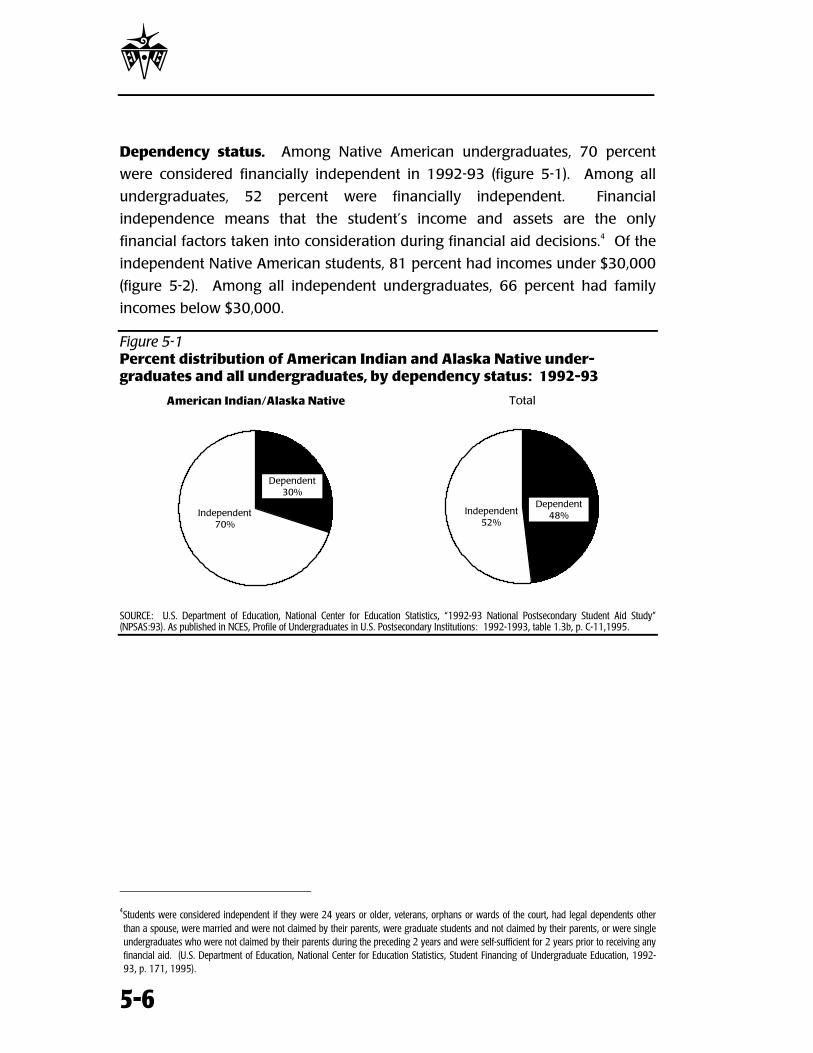
P
5-6
Dependency status. Among Native American undergraduates, 70 percent
were considered financially independent in 1992-93 (figure 5-1). Among all
undergraduates, 52 percent were financially independent. Financial
independence means that the student’s income and assets are the only
financial factors taken into consideration during financial aid decisions.4 Of the
independent Native American students, 81 percent had incomes under $30,000
(figure 5-2). Among all independent undergraduates, 66 percent had family
incomes below $30,000.
Figure 5-1Percent distribution of American Indian and Alaska Native under-graduates and all undergraduates, by dependency status: 1992-93
American Indian/Alaska Native
Independent70%
Dependent30%
Total
Independent52%
Dependent48%
SOURCE: U.S. Department of Education, National Center for Education Statistics, “1992-93 National Postsecondary Student Aid Study”(NPSAS:93). As published in NCES, Profile of Undergraduates in U.S. Postsecondary Institutions: 1992-1993, table 1.3b, p. C-11,1995.
4Students were considered independent if they were 24 years or older, veterans, orphans or wards of the court, had legal dependents otherthan a spouse, were married and were not claimed by their parents, were graduate students and not claimed by their parents, or were singleundergraduates who were not claimed by their parents during the preceding 2 years and were self-sufficient for 2 years prior to receiving anyfinancial aid. (U.S. Department of Education, National Center for Education Statistics, Student Financing of Undergraduate Education, 1992-93, p. 171, 1995).
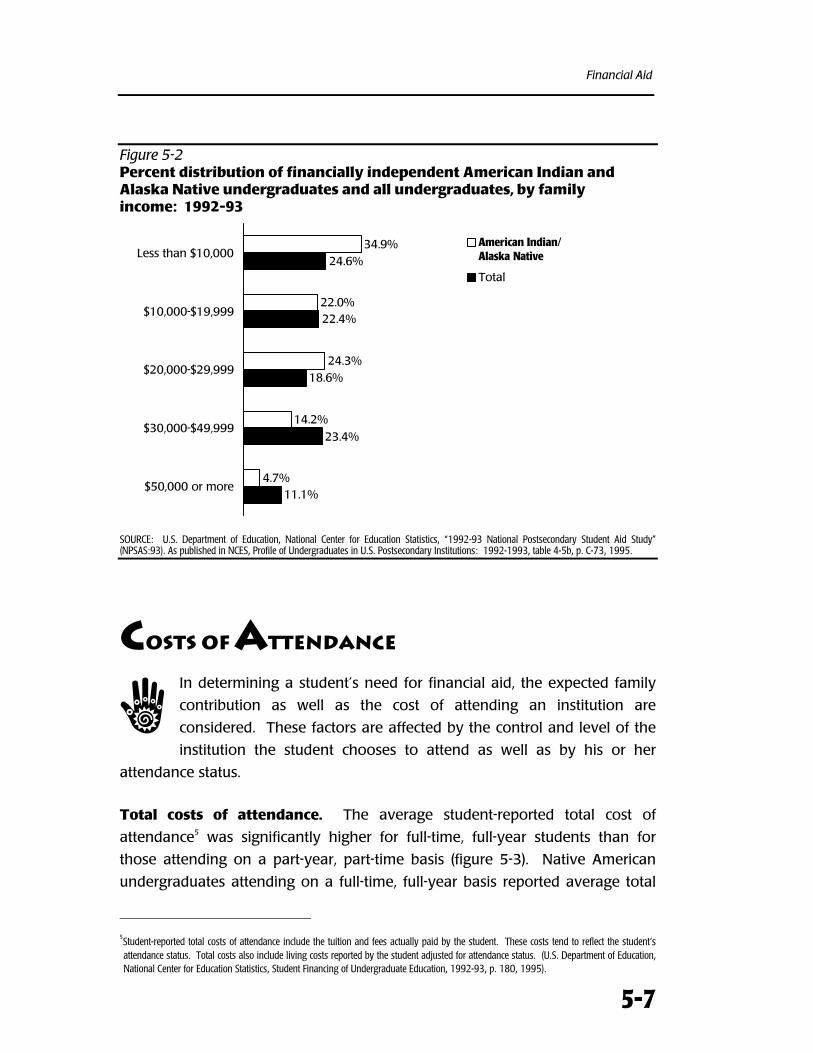
Financial Aid
5-7
Figure 5-2Percent distribution of financially independent American Indian andAlaska Native undergraduates and all undergraduates, by familyincome: 1992-93
11.1%
23.4%
18.6%
22.4%
24.6%
4.7%
14.2%
24.3%
22.0%
34.9%
$50,000 or more
$30,000-$49,999
$20,000-$29,999
$10,000-$19,999
Less than $10,000American Indian/Alaska Native
Total
SOURCE: U.S. Department of Education, National Center for Education Statistics, “1992-93 National Postsecondary Student Aid Study”(NPSAS:93). As published in NCES, Profile of Undergraduates in U.S. Postsecondary Institutions: 1992-1993, table 4-5b, p. C-73, 1995.
COSTS OF ATTENDANCE
In determining a student’s need for financial aid, the expected family
contribution as well as the cost of attending an institution are
considered. These factors are affected by the control and level of the
institution the student chooses to attend as well as by his or her
attendance status.
Total costs of attendance. The average student-reported total cost of
attendance5 was significantly higher for full-time, full-year students than for
those attending on a part-year, part-time basis (figure 5-3). Native American
undergraduates attending on a full-time, full-year basis reported average total
5Student-reported total costs of attendance include the tuition and fees actually paid by the student. These costs tend to reflect the student’sattendance status. Total costs also include living costs reported by the student adjusted for attendance status. (U.S. Department of Education,National Center for Education Statistics, Student Financing of Undergraduate Education, 1992-93, p. 180, 1995).
:
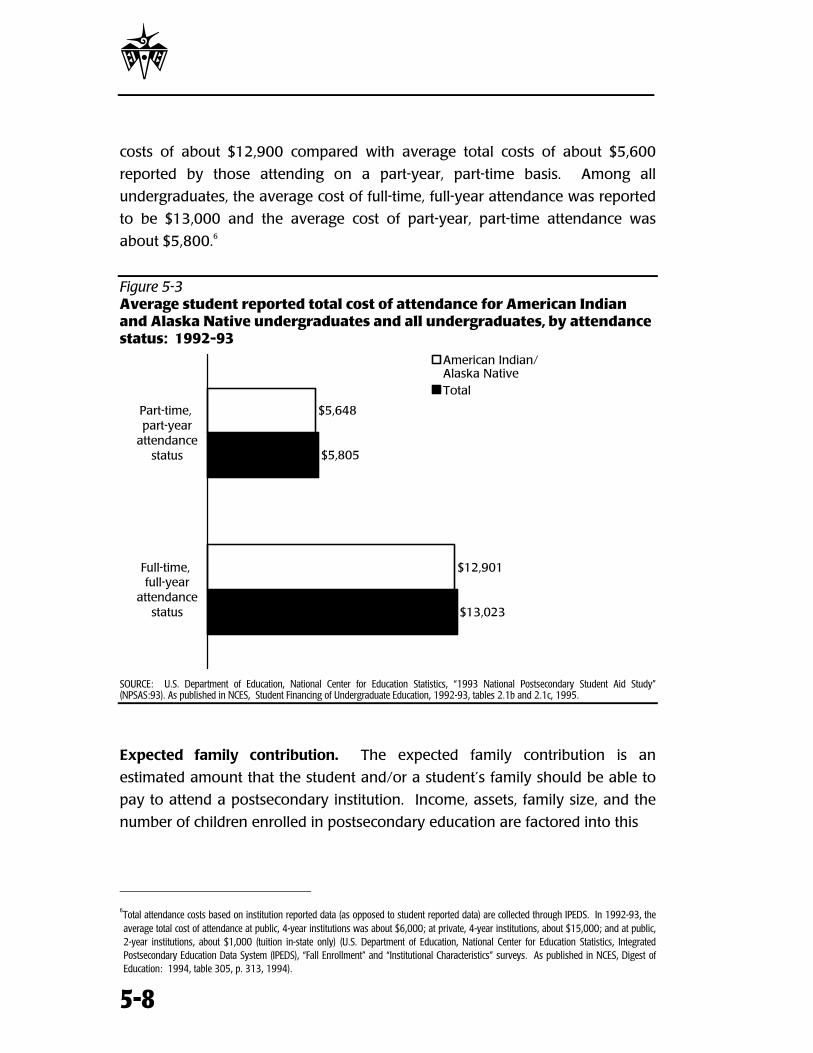
P
5-8
costs of about $12,900 compared with average total costs of about $5,600
reported by those attending on a part-year, part-time basis. Among all
undergraduates, the average cost of full-time, full-year attendance was reported
to be $13,000 and the average cost of part-year, part-time attendance was
about $5,800.6
Figure 5-3Average student reported total cost of attendance for American Indianand Alaska Native undergraduates and all undergraduates, by attendancestatus: 1992-93
$13,023
$5,805
$12,901
$5,648
Full-time, full-year
attendancestatus
Part-time, part-year
attendancestatus
American Indian/Alaska NativeTotal
SOURCE: U.S. Department of Education, National Center for Education Statistics, “1993 National Postsecondary Student Aid Study”(NPSAS:93). As published in NCES, Student Financing of Undergraduate Education, 1992-93, tables 2.1b and 2.1c, 1995.
Expected family contribution. The expected family contribution is an
estimated amount that the student and/or a student’s family should be able to
pay to attend a postsecondary institution. Income, assets, family size, and the
number of children enrolled in postsecondary education are factored into this
6Total attendance costs based on institution reported data (as opposed to student reported data) are collected through IPEDS. In 1992-93, theaverage total cost of attendance at public, 4-year institutions was about $6,000; at private, 4-year institutions, about $15,000; and at public,2-year institutions, about $1,000 (tuition in-state only) (U.S. Department of Education, National Center for Education Statistics, IntegratedPostsecondary Education Data System (IPEDS), “Fall Enrollment” and “Institutional Characteristics” surveys. As published in NCES, Digest ofEducation: 1994, table 305, p. 313, 1994).
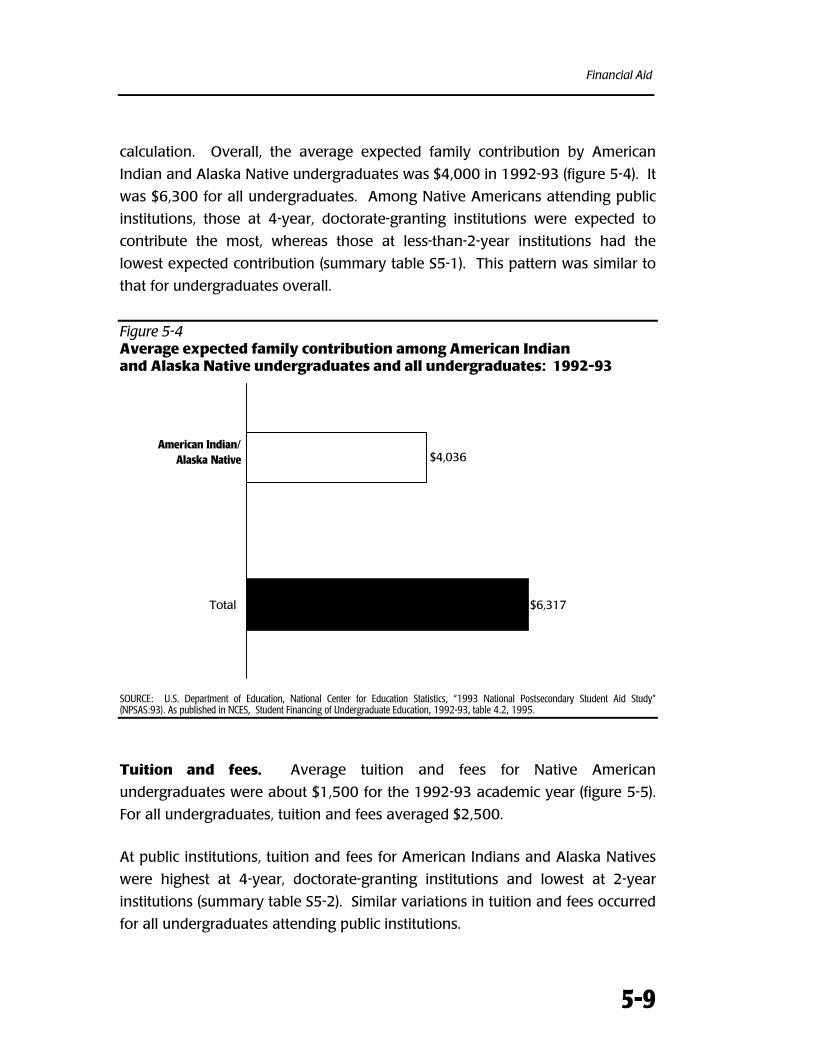
Financial Aid
5-9
calculation. Overall, the average expected family contribution by American
Indian and Alaska Native undergraduates was $4,000 in 1992-93 (figure 5-4). It
was $6,300 for all undergraduates. Among Native Americans attending public
institutions, those at 4-year, doctorate-granting institutions were expected to
contribute the most, whereas those at less-than-2-year institutions had the
lowest expected contribution (summary table S5-1). This pattern was similar to
that for undergraduates overall.
Figure 5-4Average expected family contribution among American Indianand Alaska Native undergraduates and all undergraduates: 1992-93
$6,317
$4,036
Total
AmericanIndian/Alaska
Native
American Indian/Alaska Native
SOURCE: U.S. Department of Education, National Center for Education Statistics, “1993 National Postsecondary Student Aid Study”(NPSAS:93). As published in NCES, Student Financing of Undergraduate Education, 1992-93, table 4.2, 1995.
Tuition and fees. Average tuition and fees for Native American
undergraduates were about $1,500 for the 1992-93 academic year (figure 5-5).
For all undergraduates, tuition and fees averaged $2,500.
At public institutions, tuition and fees for American Indians and Alaska Natives
were highest at 4-year, doctorate-granting institutions and lowest at 2-year
institutions (summary table S5-2). Similar variations in tuition and fees occurred
for all undergraduates attending public institutions.
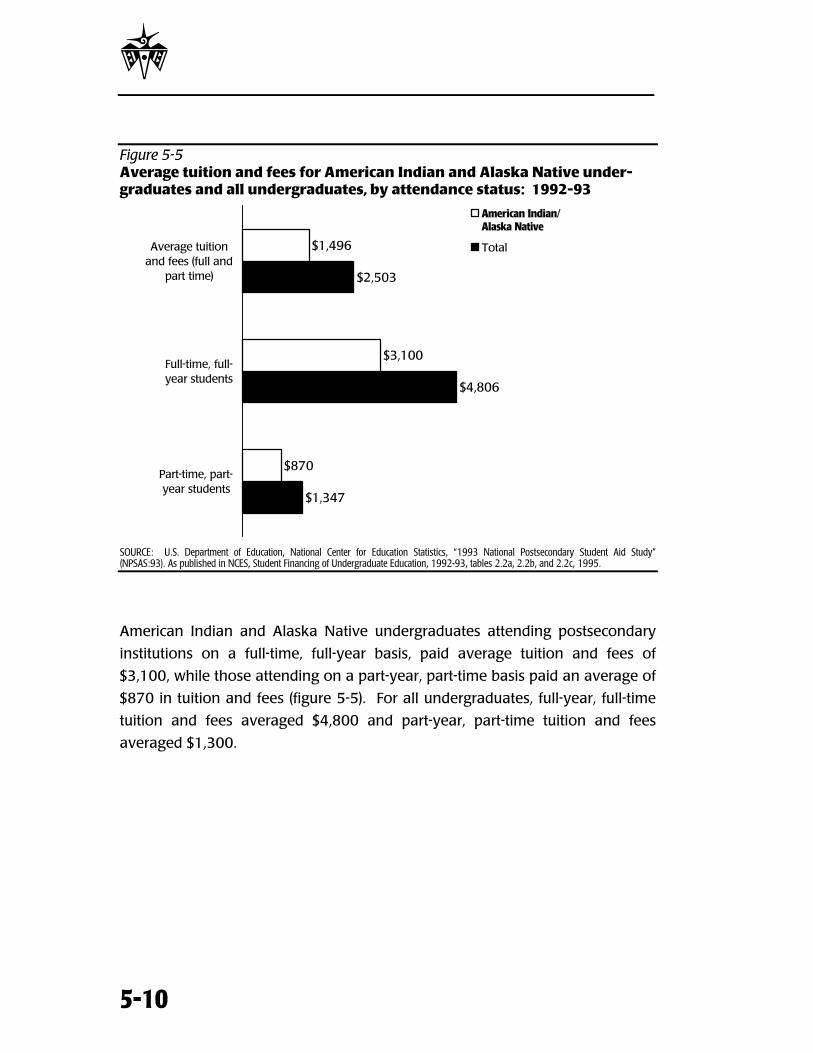
P
5-10
Figure 5-5Average tuition and fees for American Indian and Alaska Native under-graduates and all undergraduates, by attendance status: 1992-93
$1,347
$4,806
$2,503
$870
$3,100
$1,496
Part-time, part-year students
Full-time, full-year students
Average tuitionand fees (full and
part time)
American Indian/Alaska Native
Total
SOURCE: U.S. Department of Education, National Center for Education Statistics, “1993 National Postsecondary Student Aid Study”(NPSAS:93). As published in NCES, Student Financing of Undergraduate Education, 1992-93, tables 2.2a, 2.2b, and 2.2c, 1995.
American Indian and Alaska Native undergraduates attending postsecondary
institutions on a full-time, full-year basis, paid average tuition and fees of
$3,100, while those attending on a part-year, part-time basis paid an average of
$870 in tuition and fees (figure 5-5). For all undergraduates, full-year, full-time
tuition and fees averaged $4,800 and part-year, part-time tuition and fees
averaged $1,300.
Financial Aid
5-11
FINANCIAL NEED, FINANCIAL AID, AND
REMAINING FINANCIAL NEED
During the 1992-93 academic year, the majority of all
undergraduates needed financial aid in order to attend
postsecondary institutions, and American Indian and Alaska Native
undergraduates were no exception. Many students received some
type of financial assistance in the form of loans, grants, or work-study provided
by the federal government, state, or institution. Despite this assistance, the
majority of those students receiving aid continued to have unmet financial
need.
Financial need. In 1992-93, about the same proportion of American Indian
and Alaska Native undergraduates and all undergraduates had financial need
(figure 5-6). The average amount of need for Native American undergraduates
was $5,600, whereas that for all undergraduates was $6,200. Like tuition and
fees, need varied by the type of public institution attended for both Native
American undergraduates and all undergraduates. For example, financial need
for Native Americans ranged from $3,800 at less-than-2-year institutions to
$6,400 at 4-year, non-doctorate-granting institutions (summary table S5-3).
Among undergraduates overall, financial need was lowest for those attending
2-year institutions and highest for those attending 4-year, doctorate-granting
institutions.
R
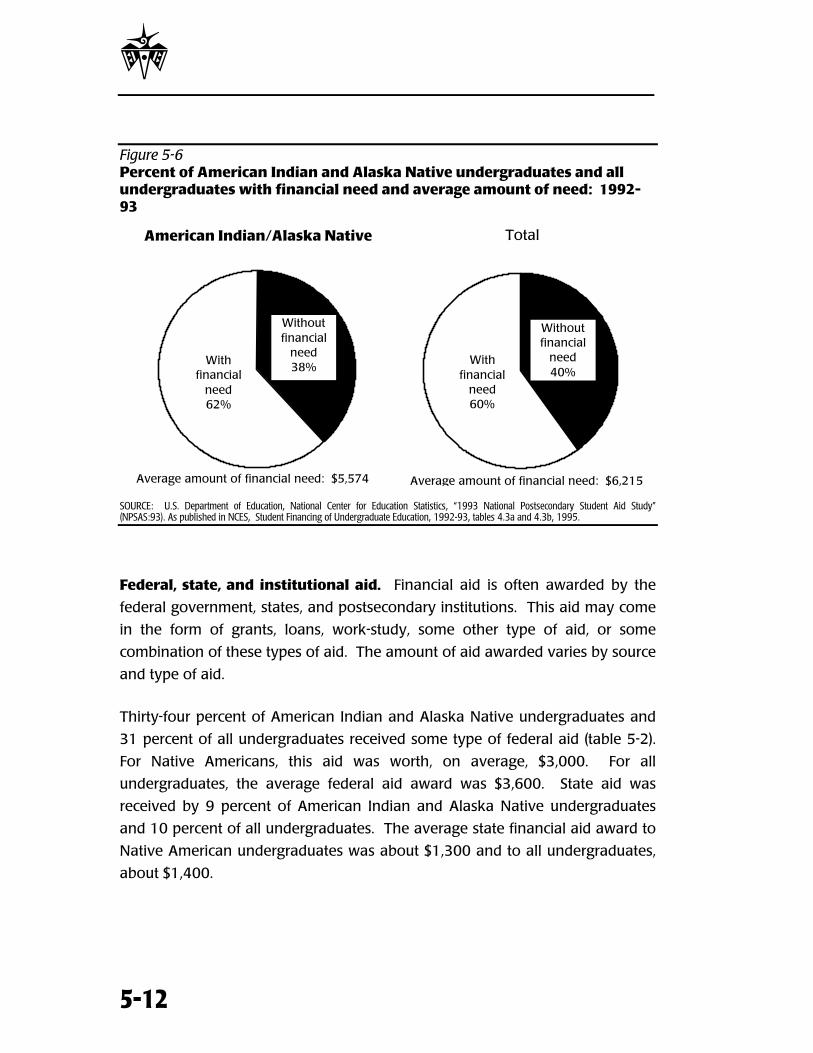
P
5-12
Figure 5-6Percent of American Indian and Alaska Native undergraduates and allundergraduates with financial need and average amount of need: 1992-93
American Indian/Alaska Native
With financial
need62%
Without financial
need38%
Average amount of financial need: $5,574
Total
With financial
need60%
Without financial
need40%
Average amount of financial need: $6,215
SOURCE: U.S. Department of Education, National Center for Education Statistics, “1993 National Postsecondary Student Aid Study”(NPSAS:93). As published in NCES, Student Financing of Undergraduate Education, 1992-93, tables 4.3a and 4.3b, 1995.
Federal, state, and institutional aid. Financial aid is often awarded by the
federal government, states, and postsecondary institutions. This aid may come
in the form of grants, loans, work-study, some other type of aid, or some
combination of these types of aid. The amount of aid awarded varies by source
and type of aid.
Thirty-four percent of American Indian and Alaska Native undergraduates and
31 percent of all undergraduates received some type of federal aid (table 5-2).
For Native Americans, this aid was worth, on average, $3,000. For all
undergraduates, the average federal aid award was $3,600. State aid was
received by 9 percent of American Indian and Alaska Native undergraduates
and 10 percent of all undergraduates. The average state financial aid award to
Native American undergraduates was about $1,300 and to all undergraduates,
about $1,400.
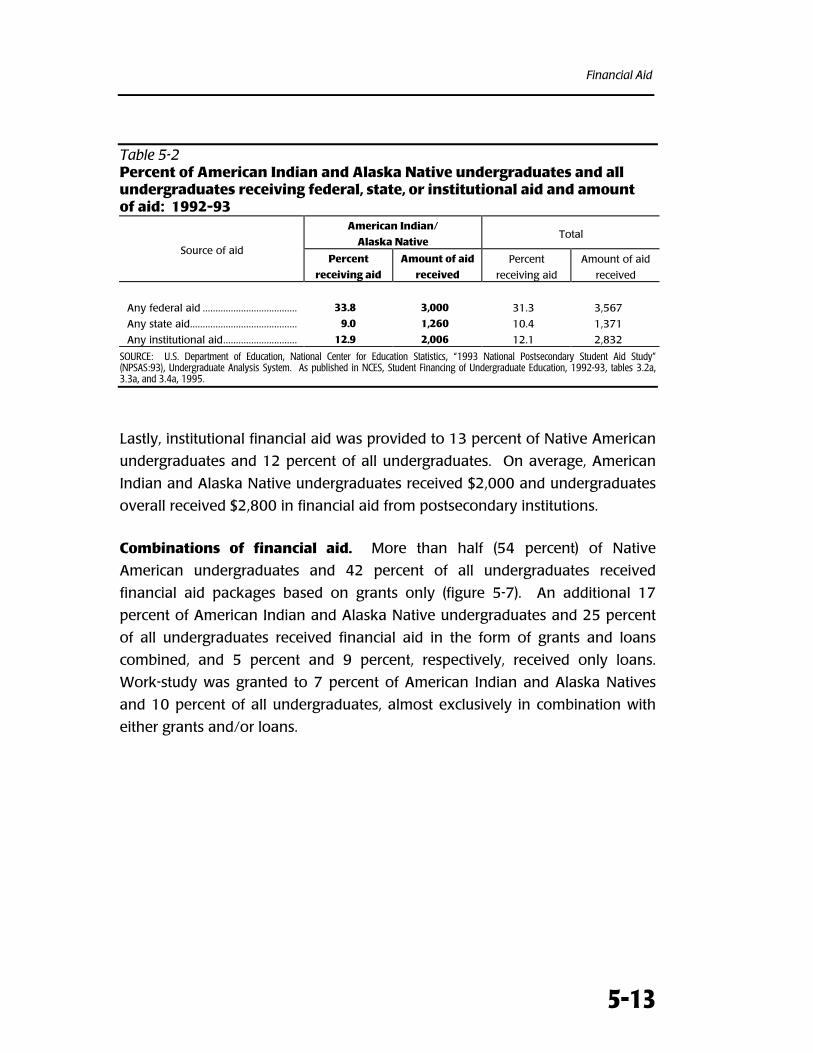
Financial Aid
5-13
Table 5-2Percent of American Indian and Alaska Native undergraduates and allundergraduates receiving federal, state, or institutional aid and amountof aid: 1992-93
American Indian/
Alaska NativeTotal
Source of aidPercent
receiving aid
Amount of aid
received
Percent
receiving aid
Amount of aid
received
Any federal aid ..................................... 33.8 3,000 31.3 3,567
Any state aid.......................................... 9.0 1,260 10.4 1,371
Any institutional aid............................. 12.9 2,006 12.1 2,832
SOURCE: U.S. Department of Education, National Center for Education Statistics, “1993 National Postsecondary Student Aid Study”(NPSAS:93), Undergraduate Analysis System. As published in NCES, Student Financing of Undergraduate Education, 1992-93, tables 3.2a,3.3a, and 3.4a, 1995.
Lastly, institutional financial aid was provided to 13 percent of Native American
undergraduates and 12 percent of all undergraduates. On average, American
Indian and Alaska Native undergraduates received $2,000 and undergraduates
overall received $2,800 in financial aid from postsecondary institutions.
Combinations of financial aid. More than half (54 percent) of Native
American undergraduates and 42 percent of all undergraduates received
financial aid packages based on grants only (figure 5-7). An additional 17
percent of American Indian and Alaska Native undergraduates and 25 percent
of all undergraduates received financial aid in the form of grants and loans
combined, and 5 percent and 9 percent, respectively, received only loans.
Work-study was granted to 7 percent of American Indian and Alaska Natives
and 10 percent of all undergraduates, almost exclusively in combination with
either grants and/or loans.
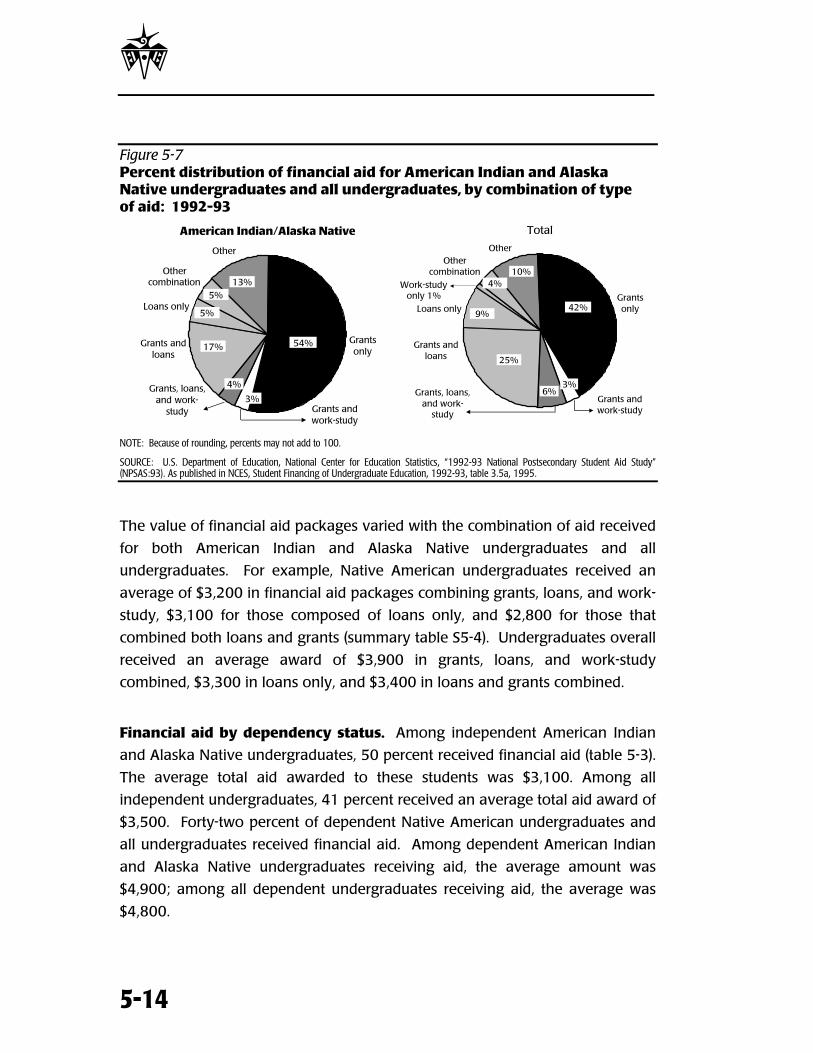
P
5-14
Figure 5-7Percent distribution of financial aid for American Indian and AlaskaNative undergraduates and all undergraduates, by combination of typeof aid: 1992-93
American Indian/Alaska Native
Other
Loans only
Other combination
Grants and work-study
Grants, loans, and work-
study
Grants and loans
Grants only
54%
3%
4%
17%
5%
5%13%
Total
Other
Loans only
Work-study only 1%
Other combination
Grants and work-study
Grants, loans, and work-
study
Grants and loans
Grants only42%
3%6%
25%
9%
4%10%
NOTE: Because of rounding, percents may not add to 100.
SOURCE: U.S. Department of Education, National Center for Education Statistics, “1992-93 National Postsecondary Student Aid Study”(NPSAS:93). As published in NCES, Student Financing of Undergraduate Education, 1992-93, table 3.5a, 1995.
The value of financial aid packages varied with the combination of aid received
for both American Indian and Alaska Native undergraduates and all
undergraduates. For example, Native American undergraduates received an
average of $3,200 in financial aid packages combining grants, loans, and work-
study, $3,100 for those composed of loans only, and $2,800 for those that
combined both loans and grants (summary table S5-4). Undergraduates overall
received an average award of $3,900 in grants, loans, and work-study
combined, $3,300 in loans only, and $3,400 in loans and grants combined.
Financial aid by dependency status. Among independent American Indian
and Alaska Native undergraduates, 50 percent received financial aid (table 5-3).
The average total aid awarded to these students was $3,100. Among all
independent undergraduates, 41 percent received an average total aid award of
$3,500. Forty-two percent of dependent Native American undergraduates and
all undergraduates received financial aid. Among dependent American Indian
and Alaska Native undergraduates receiving aid, the average amount was
$4,900; among all dependent undergraduates receiving aid, the average was
$4,800.
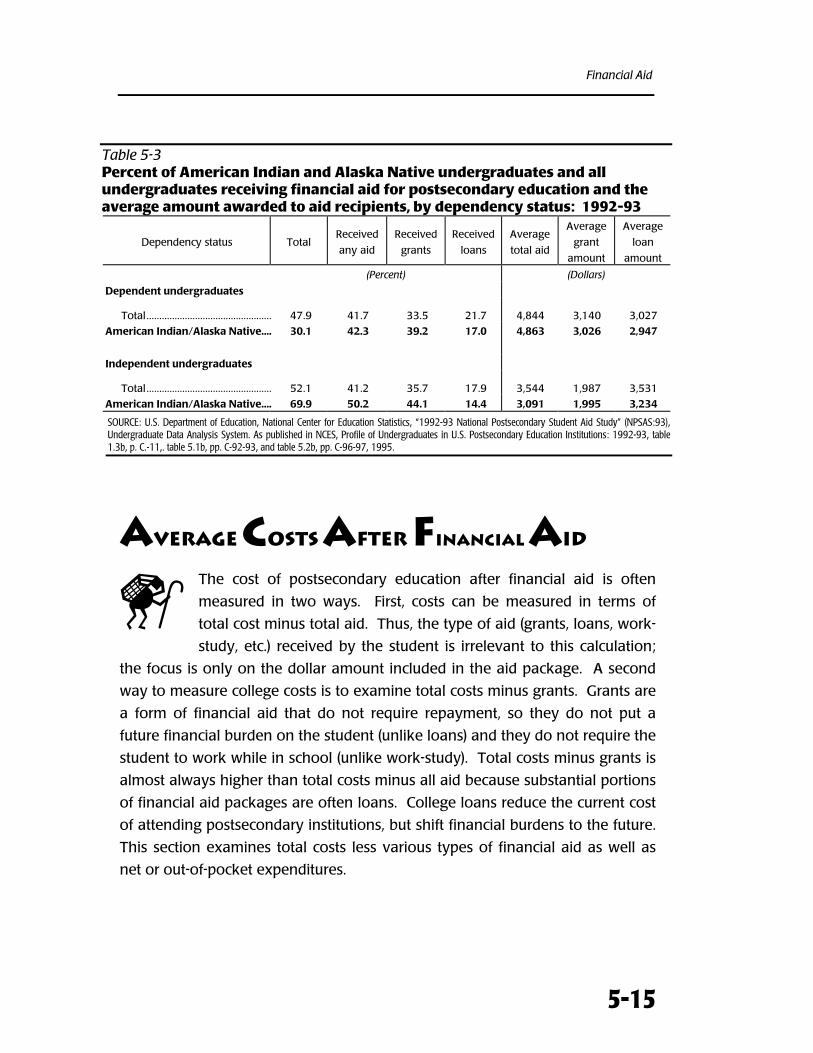
Financial Aid
5-15
Table 5-3Percent of American Indian and Alaska Native undergraduates and allundergraduates receiving financial aid for postsecondary education and theaverage amount awarded to aid recipients, by dependency status: 1992-93
Dependency status TotalReceived
any aid
Received
grants
Received
loans
Average
total aid
Average
grant
amount
Average
loan
amount
(Percent) (Dollars)
Dependent undergraduates
Total................................................. 47.9 41.7 33.5 21.7 4,844 3,140 3,027
American Indian/Alaska Native.... 30.1 42.3 39.2 17.0 4,863 3,026 2,947
Independent undergraduates
Total................................................. 52.1 41.2 35.7 17.9 3,544 1,987 3,531
American Indian/Alaska Native.... 69.9 50.2 44.1 14.4 3,091 1,995 3,234
SOURCE: U.S. Department of Education, National Center for Education Statistics, “1992-93 National Postsecondary Student Aid Study” (NPSAS:93),Undergraduate Data Analysis System. As published in NCES, Profile of Undergraduates in U.S. Postsecondary Education Institutions: 1992-93, table1.3b, p. C.-11,. table 5.1b, pp. C-92-93, and table 5.2b, pp. C-96-97, 1995.
AVERAGE COSTS AFTER FINANCIAL AID
The cost of postsecondary education after financial aid is often
measured in two ways. First, costs can be measured in terms of
total cost minus total aid. Thus, the type of aid (grants, loans, work-
study, etc.) received by the student is irrelevant to this calculation;
the focus is only on the dollar amount included in the aid package. A second
way to measure college costs is to examine total costs minus grants. Grants are
a form of financial aid that do not require repayment, so they do not put a
future financial burden on the student (unlike loans) and they do not require the
student to work while in school (unlike work-study). Total costs minus grants is
almost always higher than total costs minus all aid because substantial portions
of financial aid packages are often loans. College loans reduce the current cost
of attending postsecondary institutions, but shift financial burdens to the future.
This section examines total costs less various types of financial aid as well as
net or out-of-pocket expenditures.
X
P
5-16
Total cost minus financial aid. An examination of attendance-adjusted total
cost minus total aid7 revealed that the remaining cost of postsecondary
education for American Indians and Alaska Natives was $6,100. For all
undergraduates, the average remaining cost was $6,600 (figure 5-8). Average
remaining costs for Native Americans attending public institutions ranged from
$5,200 to $7,400 (summary table S5-5). For all undergraduates enrolled in
public institutions, average remaining costs ranged from $4,800 to $7,600.
Figure 5-8Average cost of postsecondary education for American Indian and AlaskaNative undergraduates and all undergraduates adjusted by attendance:1992-93
$7,313
$6,630
$6,740
$6,099
Series1
TotalAttendance-adjusted total cost
minus total aid
Attendance-adjusted total cost
minus grants
American Indian/Alaska Native
SOURCE: U.S. Department of Education, National Center for Education Statistics, “1992-93 National Postsecondary Student Aid Study”(NPSAS:93). As published in NCES, Student Financing of Undergraduate Education, 1992-93, tables 4.1a and 4.1b, 1995.
Calculating the average cost of postsecondary education using total costs minus
grants is another way to examine the actual costs of college attendance. For
Native American undergraduates, the average total costs minus grants were
$6,700, or $600 more than their total costs minus their total aid (figure 5-8).
7Attendance adjusted total costs (student reported). Tuition and fees actually paid by the student tend to reflect attendance status. Living costsreported by the student were also adjusted for this variable to create an approximation of the total costs incurred for education. For example,if a student was enrolled half-time, only half of the reported living costs were attributed as cost of education (U.S. Department of Education,National Center for Education Statistics, Student Financing of Undergraduate Education: 1992-93, p. 180, 1995).
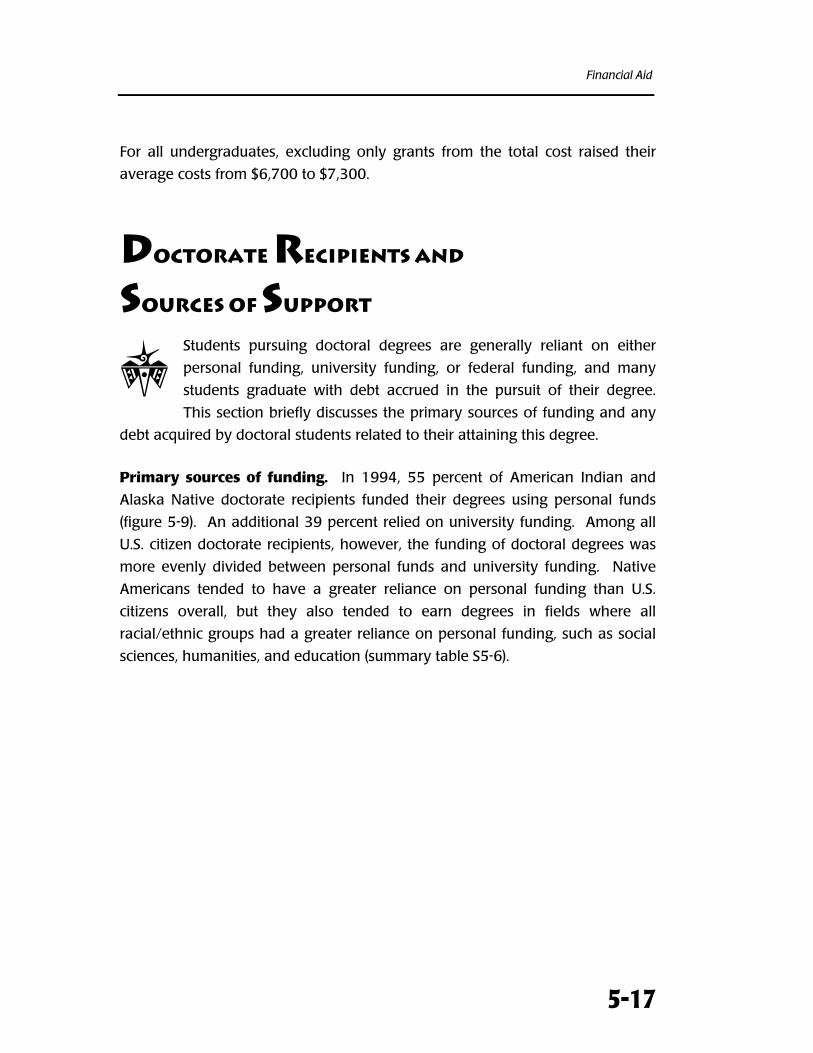
Financial Aid
5-17
For all undergraduates, excluding only grants from the total cost raised their
average costs from $6,700 to $7,300.
DOCTORATE RECIPIENTS AND
SOURCES OF SUPPORT
Students pursuing doctoral degrees are generally reliant on either
personal funding, university funding, or federal funding, and many
students graduate with debt accrued in the pursuit of their degree.
This section briefly discusses the primary sources of funding and any
debt acquired by doctoral students related to their attaining this degree.
Primary sources of funding. In 1994, 55 percent of American Indian and
Alaska Native doctorate recipients funded their degrees using personal funds
(figure 5-9). An additional 39 percent relied on university funding. Among all
U.S. citizen doctorate recipients, however, the funding of doctoral degrees was
more evenly divided between personal funds and university funding. Native
Americans tended to have a greater reliance on personal funding than U.S.
citizens overall, but they also tended to earn degrees in fields where all
racial/ethnic groups had a greater reliance on personal funding, such as social
sciences, humanities, and education (summary table S5-6).
P
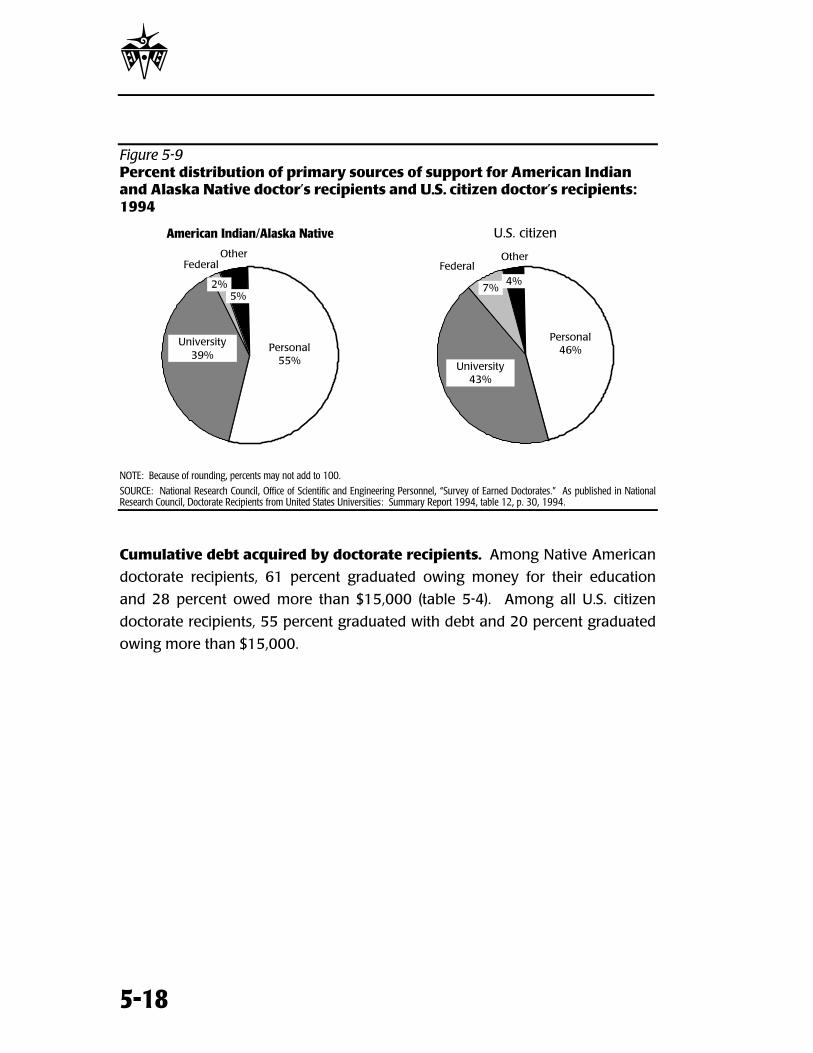
P
5-18
Figure 5-9Percent distribution of primary sources of support for American Indianand Alaska Native doctor’s recipients and U.S. citizen doctor’s recipients:1994
American Indian/Alaska Native
University39%
Personal55%
Other
5%
Federal
2%
U.S. citizen
University43%
Personal46%
Other
4%Federal
7%
NOTE: Because of rounding, percents may not add to 100.
SOURCE: National Research Council, Office of Scientific and Engineering Personnel, “Survey of Earned Doctorates.” As published in NationalResearch Council, Doctorate Recipients from United States Universities: Summary Report 1994, table 12, p. 30, 1994.
Cumulative debt acquired by doctorate recipients. Among Native American
doctorate recipients, 61 percent graduated owing money for their education
and 28 percent owed more than $15,000 (table 5-4). Among all U.S. citizen
doctorate recipients, 55 percent graduated with debt and 20 percent graduated
owing more than $15,000.
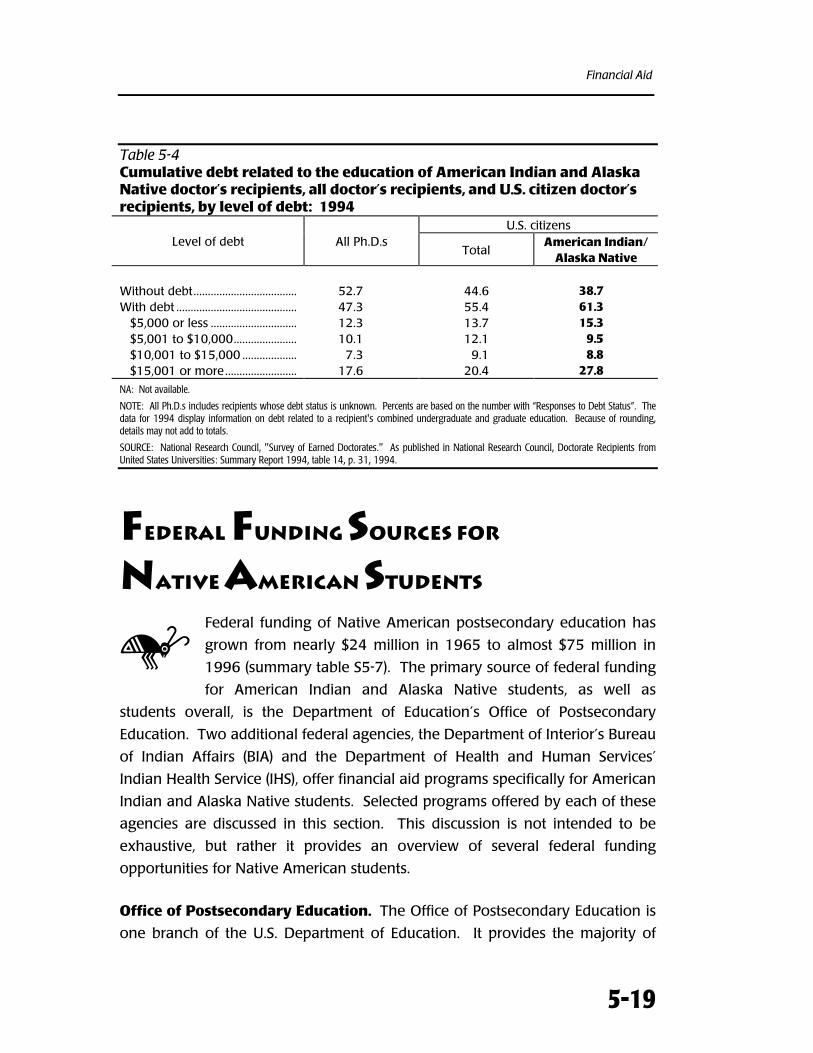
Financial Aid
5-19
Table 5-4Cumulative debt related to the education of American Indian and AlaskaNative doctor’s recipients, all doctor’s recipients, and U.S. citizen doctor’srecipients, by level of debt: 1994
U.S. citizensLevel of debt All Ph.D.s
TotalAmerican Indian/
Alaska Native
Without debt.................................... 52.7 44.6 38.7With debt .......................................... 47.3 55.4 61.3 $5,000 or less .............................. 12.3 13.7 15.3 $5,001 to $10,000...................... 10.1 12.1 9.5 $10,001 to $15,000 ................... 7.3 9.1 8.8 $15,001 or more......................... 17.6 20.4 27.8
NA: Not available.
NOTE: All Ph.D.s includes recipients whose debt status is unknown. Percents are based on the number with “Responses to Debt Status”. Thedata for 1994 display information on debt related to a recipient's combined undergraduate and graduate education. Because of rounding,details may not add to totals.
SOURCE: National Research Council, "Survey of Earned Doctorates." As published in National Research Council, Doctorate Recipients fromUnited States Universities: Summary Report 1994, table 14, p. 31, 1994.
FEDERAL FUNDING SOURCES FOR
NATIVE AMERICAN STUDENTS
Federal funding of Native American postsecondary education has
grown from nearly $24 million in 1965 to almost $75 million in
1996 (summary table S5-7). The primary source of federal funding
for American Indian and Alaska Native students, as well as
students overall, is the Department of Education’s Office of Postsecondary
Education. Two additional federal agencies, the Department of Interior’s Bureau
of Indian Affairs (BIA) and the Department of Health and Human Services’
Indian Health Service (IHS), offer financial aid programs specifically for American
Indian and Alaska Native students. Selected programs offered by each of these
agencies are discussed in this section. This discussion is not intended to be
exhaustive, but rather it provides an overview of several federal funding
opportunities for Native American students.
Office of Postsecondary Education. The Office of Postsecondary Education is
one branch of the U.S. Department of Education. It provides the majority of
H
P
5-20
federal support to students attending higher education institutions. This support
is available to all U.S. citizens.
There is a multitude of programs for which eligible students can qualify, ranging
from Pell Grants to Stafford Loans to PLUS Loans. Each of the funding programs
is discussed briefly below:
• Pell Grants: These grants are available to undergraduate students whohave not previously completed a bachelor's degree or professional degree.The amount of the award is based on the student's financial need,attendance costs, full-time or part-time attendance, and whether the studentis attending for a full academic year or less. Students may receive up to$2,700.
• Federal Perkins Loans: Perkins Loans are low-interest loans (5 percentinterest) that are available to all students demonstrating exceptional need.The student's school lends the money to the student, but the loan is madeusing government funds. The amount of support a student is eligible toreceive depends on the level of degree he/she is seeking and his/her year inthat academic program. For example, undergraduates are eligible to receiveup to $3,000 a year for a maximum loan of $15,000.
• Federal Supplemental Educational Opportunity Grant (FSEOG): Thesegrants do not need to be repaid, but they are only available toundergraduates with exceptional need. The grants are first awarded to PellGrant recipients with the lowest expected family contributions. Grants rangefrom $100 to $4,000. Undergraduates who have already received abachelor's degree or professional degree are not eligible for this program.
• Federal Work-Study: This program provides undergraduates andgraduate students having financial need with part-time jobs to earn moneyto pay education-related expenses. The federal government gives moneydirectly to postsecondary institutions. These institutions administer theprogram.
• Stafford Loans: This is the major type of loan made by the Office ofPostsecondary Education. These loans are available either directly from thefederal government (Direct Stafford Loan) or through a lending institutionthat participates in the Federal Family Education Loan (FFEL) program. Theamount of aid for which a student is eligible is calculated by subtracting thestudent's expected family contribution, Pell Grant award, and other aid fromthe total cost of attending school. A Stafford Loan may be used to cover allremaining need. If a student has no remaining need, he/she is still eligibleto borrow an amount equal to his/her expected family contribution or theannual limit set on Stafford Loans. The maximum rate of interest on allStafford Loans is 8.25 percent.
Financial Aid
5-21
• PLUS: These loans are available directly from the government or throughthe FFEL program. Parents without a bad credit history can borrow moneyto pay for the educational expenses of a child who is a dependent studentenrolled at least half time in an eligible program at an eligible school.These loans can be used to cover all expenses remaining after other sourcesof aid are subtracted from the costs of attendance. The maximum interestrate on PLUS is 9 percent.
Bureau of Indian Affairs. The Bureau of Indian Affairs is often considered a
primary source of financial aid for American Indian and Alaska Native students
considering higher education. Higher education-related financial aid programs
are administered under the BIA’s Continuing Education division. Located within
Continuing Education is the Postsecondary Education Branch, which maintains
responsibility for administering all higher education programs including the
Higher Education Grant Program, the Special Higher Education Grant Program,
the Summer Law Program, and funding to postsecondary institutions and
tribally controlled community colleges.
The Higher Education Grant Program provides financial assistance to eligible
American Indian and Alaska Native students seeking undergraduate degrees at
accredited postsecondary institutions. This program was first authorized to
administer funds for postsecondary education in 1949. During its first year of
operation, the program was authorized an appropriation of $9,390. It assisted
78 student by providing an average grant of $120.8 In fiscal year 1994, over
$30 million was available to 15,000 Native American students, with grants
averaging $2,412.9
The Special Higher Education Grant Program provides financial assistance to
American Indian and Alaska Native graduate students, with priority given to
students enrolled in business, education, engineering, law, natural resources, or
health fields. In 1994, 580 Native American students received grants through
this program.10
8 U.S. Department of the Interior, Bureau of Indian Affairs, FY 1988 Budget Justification, Higher Education Grant Program, table 1, p. 110.
9 U.S. Department of the Interior, Bureau of Indian Affairs, FY 1995 Budget Justification .
10 Information about the Special Higher Education Grant Program was taken from the U.S. Department of Interior’s website (www.doi.gov).
P
5-22
The Summer Law Program provides funding for 26 Native American students
who have been accepted into an accredited law school to attend a summer
program that prepares students for their first year of law school.11
Indian Health Service. The Health Care Improvement Act (Public Law 94-437)
established a national goal of providing the quantity and quality of health
services required to raise the health status of Native Americans to the highest
level possible and to maximize the participation of Native Americans in
planning and managing these services. In order to meet this goal, the Act
authorized the Indian Health Service (IHS), Division of Health Professions,
Recruitment, and Training, to establish three interrelated scholarship programs
to train health professionals to staff IHS programs and other health programs
serving Native Americans. The IHS also established a Loan Repayment
Program (LRP) to recruit and retain highly qualified health professionals to meet
the staffing needs of the IHS or other Indian health programs.12
The IHS offers three scholarships for both full-time and part-time Native
American students: Health Professions-Preparatory Compensatory, Health
Professions Pregraduate, and Health Professions. The first is designed to
provide financial support for Native American students to enroll in courses that
will prepare them for acceptance into health professions schools. The Health
Professions Pregraduate scholarship provides financial support for Native
American students enrolled in courses leading to a bachelor’s degree in specific
health professions areas, including premedicine, preosteopathy, and
predentistry. The third scholarship provides financial support to Native
Americans enrolled in health professions and allied health professions
programs. Each scholarship is awarded for a 1-year period, but may be
renewed annually, as long as the scholarship recipient continues to meet
eligibility requirements. Each scholarship also has a service obligation requiring
recipients to serve 1 year for every year of scholarship support with either the
IHS, a specific tribal health program, an urban health program, or a private
practice serving a substantial number of Indians. The minimum payback period
is 2 years.
11 Information about the Summer Law Program was taken from the U.S. Department of Interior’s website (www.doi.gov).
12Information about the Indian Health Services education programs was taken from the Indian Health Services website (www.ihs.gov).
Financial Aid
5-23
The Loan Repayment Program (LRP) is designed to recruit and retain highly
qualified health professionals to work in IHS health programs or other Indian
health programs. Applicants commit to 2 years of service through full-time
clinical practice at an IHS facility or approved Indian health program. In return
for this commitment, the LRP will repay the participants’ educational loans for
up to $30,000 per year for each year of service. Eligible applicants must have a
degree in a health profession or be in postgraduate training.
OTHER SOURCES OF
FINANCIAL AID INFORMATION
Financial aid specifically for American Indian and Alaska Native
students pursuing postsecondary education is also available from
states, institutions, private foundations and organizations, and tribal
organizations. Two general sources of information for scholarships
and grants are the National Advisory Council on Indian Education’s (NACIE)
guide to American Indian and Alaska Native scholarships and the scholarship
search found on the College Board’s website at www.collegeboard.org.
CONCLUSION
The majority of American Indian and Alaska Native undergraduates require
financial aid in order to attend the postsecondary institutions of their
choice. Many of these students do receive some type of aid at the
federal, state, and/or institution level. However, even after receiving
this financial assistance, the majority of Native American
undergraduates continue to have unmet financial need.
Federal financial aid is the most common source of aid for Native American
undergraduates. The Office of Postsecondary Education is the main provider of
federal support for higher education for both American Indian and Alaska
Native undergraduates and undergraduates overall. The most common type of
K
}
P
5-24
federal aid awarded to the Native American undergraduate came in the form of
grants, followed by loans.
The federal government also offers several grant and scholarship programs
designed specifically for American Indian and Alaska Native students. These
programs are administered by the Bureau of Indian Affairs, the Office of Indian
Education, and the Indian Health Service. Each of the programs encourages
Native American students to pursue postsecondary degrees, but most stipulate
specific fields in which study must occur.
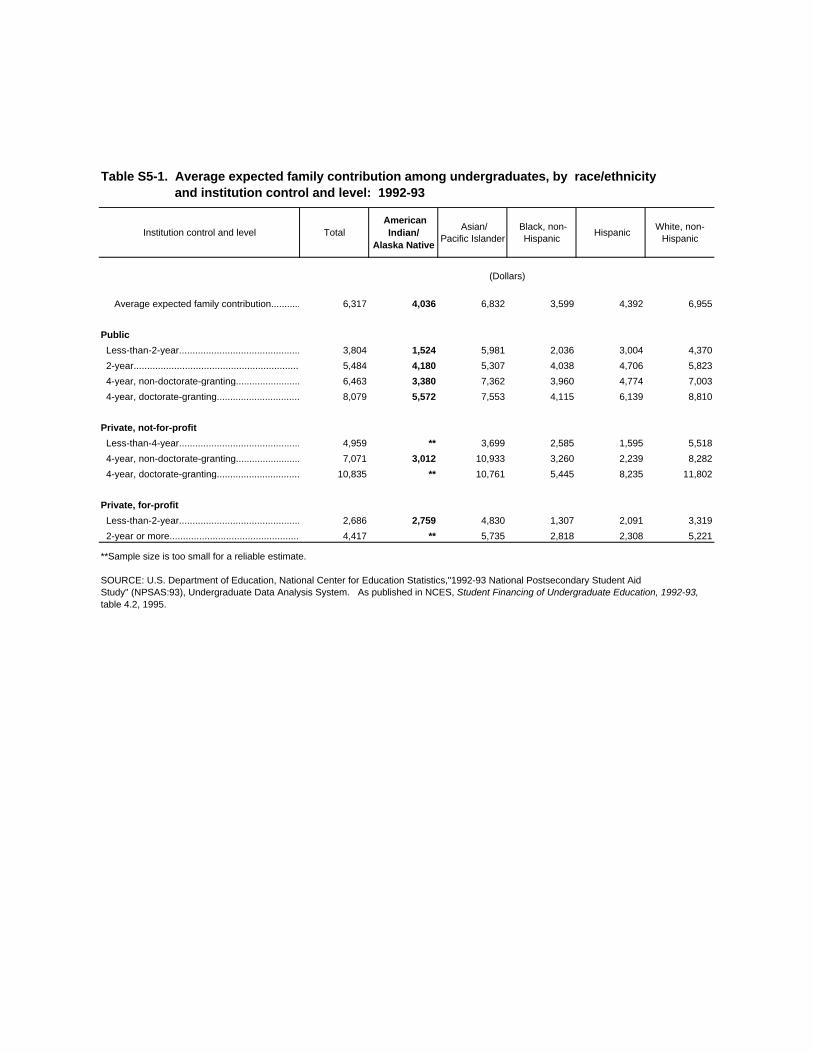
Institution control and level Total American
Indian/Alaska Native
Asian/Pacific Islander
Black, non-Hispanic
Hispanic White, non-
Hispanic
(Dollars)
Average expected family contribution........... 6,317 4,036 6,832 3,599 4,392 6,955
Public
Less-than-2-year.............................................. 3,804 1,524 5,981 2,036 3,004 4,370
2-year.............................................................. 5,484 4,180 5,307 4,038 4,706 5,823
4-year, non-doctorate-granting............................... 6,463 3,380 7,362 3,960 4,774 7,003
4-year, doctorate-granting............................... 8,079 5,572 7,553 4,115 6,139 8,810
Private, not-for-profit
Less-than-4-year............................................... 4,959 ** 3,699 2,585 1,595 5,518
4-year, non-doctorate-granting............................... 7,071 3,012 10,933 3,260 2,239 8,282
4-year, doctorate-granting............................... 10,835 ** 10,761 5,445 8,235 11,802
Private, for-profit
Less-than-2-year.............................................. 2,686 2,759 4,830 1,307 2,091 3,319
2-year or more.............................................................. 4,417 ** 5,735 2,818 2,308 5,221
**Sample size is too small for a reliable estimate.
SOURCE: U.S. Department of Education, National Center for Education Statistics,"1992-93 National Postsecondary Student AidStudy" (NPSAS:93), Undergraduate Data Analysis System. As published in NCES, Student Financing of Undergraduate Education, 1992-93, table 4.2, 1995.
Table S5-1. Average expected family contribution among undergraduates, by race/ethnicity and institution control and level: 1992-93
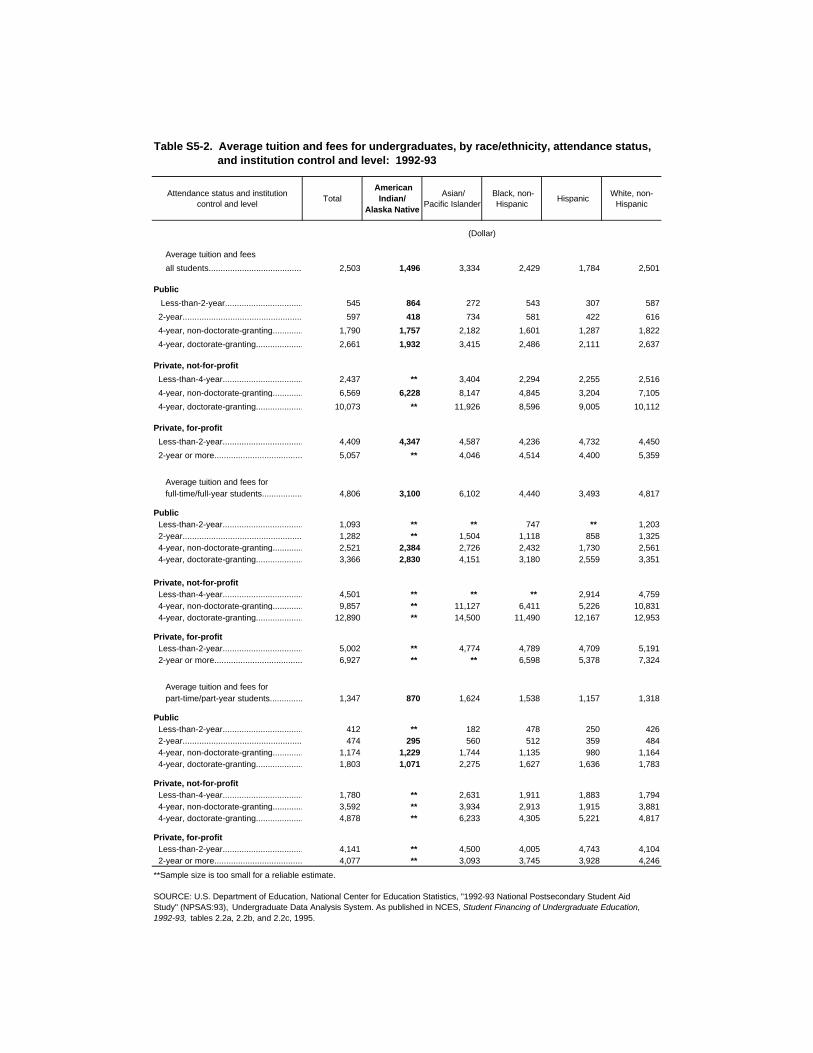
Attendance status and institution control and level
Total American
Indian/Alaska Native
Asian/Pacific Islander
Black, non-Hispanic
Hispanic White, non-
Hispanic
(Dollar)
Average tuition and fees
all students........................................................2,503 1,496 3,334 2,429 1,784 2,501
Public
Less-than-2-year.............................................. 545 864 272 543 307 587
2-year.............................................................. 597 418 734 581 422 616
4-year, non-doctorate-granting...............................1,790 1,757 2,182 1,601 1,287 1,822
4-year, doctorate-granting............................... 2,661 1,932 3,415 2,486 2,111 2,637
Private, not-for-profit
Less-than-4-year............................................... 2,437 ** 3,404 2,294 2,255 2,516
4-year, non-doctorate-granting...............................6,569 6,228 8,147 4,845 3,204 7,105
4-year, doctorate-granting............................... 10,073 ** 11,926 8,596 9,005 10,112
Private, for-profit
Less-than-2-year.............................................. 4,409 4,347 4,587 4,236 4,732 4,450
2-year or more..............................................................5,057 ** 4,046 4,514 4,400 5,359
Average tuition and fees for full-time/full-year students..................................4,806 3,100 6,102 4,440 3,493 4,817
Public Less-than-2-year.............................................. 1,093 ** ** 747 ** 1,203 2-year.............................................................. 1,282 ** 1,504 1,118 858 1,325 4-year, non-doctorate-granting...............................2,521 2,384 2,726 2,432 1,730 2,561 4-year, doctorate-granting............................... 3,366 2,830 4,151 3,180 2,559 3,351
Private, not-for-profit Less-than-4-year............................................... 4,501 ** ** ** 2,914 4,759 4-year, non-doctorate-granting...............................9,857 ** 11,127 6,411 5,226 10,831 4-year, doctorate-granting............................... 12,890 ** 14,500 11,490 12,167 12,953
Private, for-profit Less-than-2-year.............................................. 5,002 ** 4,774 4,789 4,709 5,191 2-year or more..............................................................6,927 ** ** 6,598 5,378 7,324
Average tuition and fees for part-time/part-year students..................................1,347 870 1,624 1,538 1,157 1,318
Public Less-than-2-year.............................................. 412 ** 182 478 250 426 2-year.............................................................. 474 295 560 512 359 484 4-year, non-doctorate-granting...............................1,174 1,229 1,744 1,135 980 1,164 4-year, doctorate-granting............................... 1,803 1,071 2,275 1,627 1,636 1,783
Private, not-for-profit Less-than-4-year............................................... 1,780 ** 2,631 1,911 1,883 1,794 4-year, non-doctorate-granting...............................3,592 ** 3,934 2,913 1,915 3,881 4-year, doctorate-granting............................... 4,878 ** 6,233 4,305 5,221 4,817
Private, for-profit Less-than-2-year.............................................. 4,141 ** 4,500 4,005 4,743 4,104 2-year or more..............................................................4,077 ** 3,093 3,745 3,928 4,246
**Sample size is too small for a reliable estimate.
SOURCE: U.S. Department of Education, National Center for Education Statistics, "1992-93 National Postsecondary Student Aid Study" (NPSAS:93), Undergraduate Data Analysis System. As published in NCES, Student Financing of Undergraduate Education, 1992-93, tables 2.2a, 2.2b, and 2.2c, 1995.
Table S5-2. Average tuition and fees for undergraduates, by race/ethnicity, attendance status, and institution control and level: 1992-93
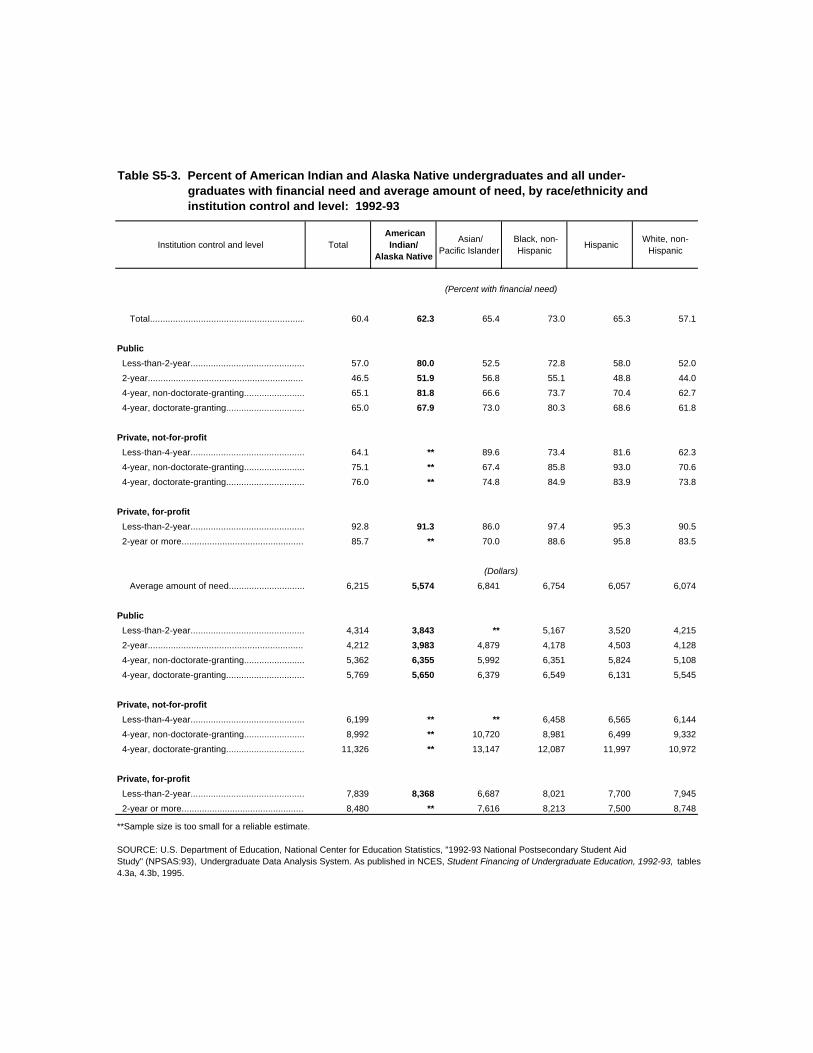
Institution control and level Total American
Indian/Alaska Native
Asian/Pacific Islander
Black, non-Hispanic
Hispanic White, non-
Hispanic
(Percent with financial need)
Total................................................................... 60.4 62.3 65.4 73.0 65.3 57.1
Public
Less-than-2-year.............................................. 57.0 80.0 52.5 72.8 58.0 52.0
2-year............................................................................ 46.5 51.9 56.8 55.1 48.8 44.0
4-year, non-doctorate-granting............................... 65.1 81.8 66.6 73.7 70.4 62.7
4-year, doctorate-granting....................................... 65.0 67.9 73.0 80.3 68.6 61.8
Private, not-for-profit
Less-than-4-year............................................... 64.1 ** 89.6 73.4 81.6 62.3
4-year, non-doctorate-granting............................... 75.1 ** 67.4 85.8 93.0 70.6
4-year, doctorate-granting.................................. 76.0 ** 74.8 84.9 83.9 73.8
Private, for-profit
Less-than-2-year.............................................. 92.8 91.3 86.0 97.4 95.3 90.5
2-year or more.............................................................. 85.7 ** 70.0 88.6 95.8 83.5
(Dollars)
Average amount of need......................................... 6,215 5,574 6,841 6,754 6,057 6,074
Public
Less-than-2-year.............................................. 4,314 3,843 ** 5,167 3,520 4,215
2-year......................................................................... 4,212 3,983 4,879 4,178 4,503 4,128
4-year, non-doctorate-granting............................... 5,362 6,355 5,992 6,351 5,824 5,108
4-year, doctorate-granting.................................... 5,769 5,650 6,379 6,549 6,131 5,545
Private, not-for-profit
Less-than-4-year............................................... 6,199 ** ** 6,458 6,565 6,144
4-year, non-doctorate-granting............................... 8,992 ** 10,720 8,981 6,499 9,332
4-year, doctorate-granting................................... 11,326 ** 13,147 12,087 11,997 10,972
Private, for-profit
Less-than-2-year.............................................. 7,839 8,368 6,687 8,021 7,700 7,945
2-year or more.............................................................. 8,480 ** 7,616 8,213 7,500 8,748
**Sample size is too small for a reliable estimate.
SOURCE: U.S. Department of Education, National Center for Education Statistics, "1992-93 National Postsecondary Student AidStudy" (NPSAS:93), Undergraduate Data Analysis System. As published in NCES, Student Financing of Undergraduate Education, 1992-93, tables 4.3a, 4.3b, 1995.
Table S5-3. Percent of American Indian and Alaska Native undergraduates and all under- graduates with financial need and average amount of need, by race/ethnicity and institution control and level: 1992-93
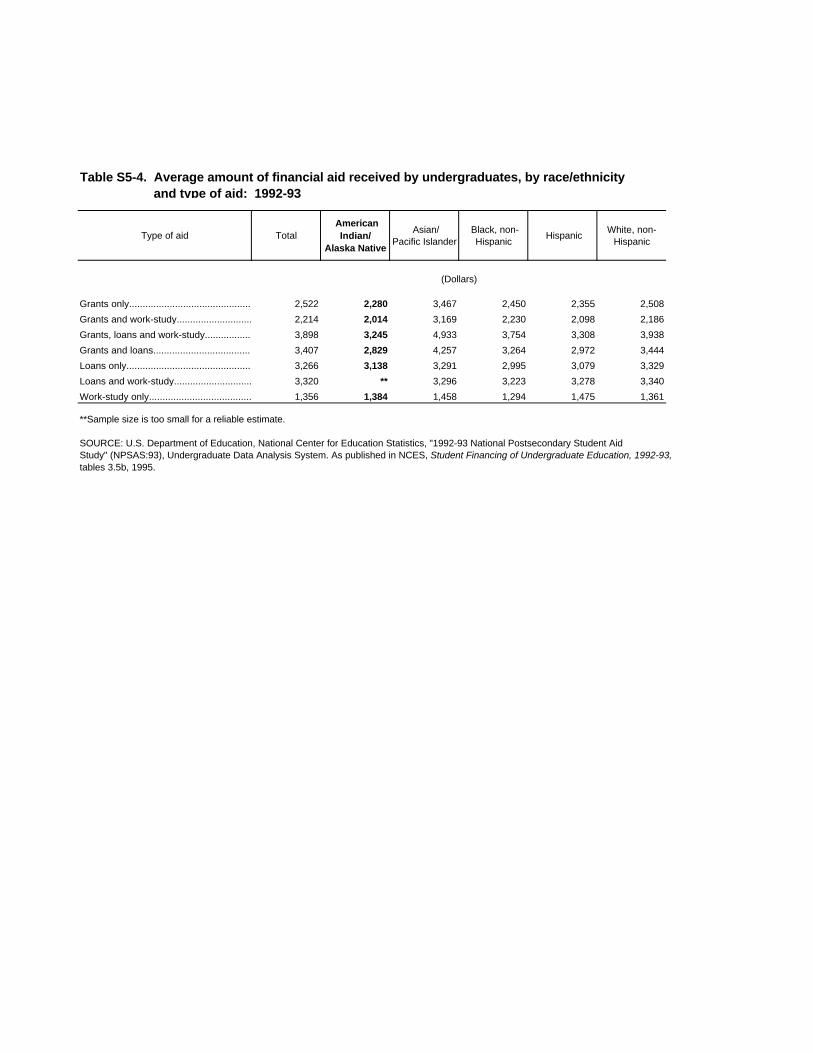
Type of aid Total American
Indian/ Alaska Native
Asian/Pacific Islander
Black, non-Hispanic
Hispanic White, non-
Hispanic
(Dollars)
Grants only.......................................................... 2,522 2,280 3,467 2,450 2,355 2,508
Grants and work-study........................................ 2,214 2,014 3,169 2,230 2,098 2,186
Grants, loans and work-study............................. 3,898 3,245 4,933 3,754 3,308 3,938
Grants and loans................................................. 3,407 2,829 4,257 3,264 2,972 3,444
Loans only........................................................... 3,266 3,138 3,291 2,995 3,079 3,329
Loans and work-study........................................... 3,320 ** 3,296 3,223 3,278 3,340
Work-study only.................................................... 1,356 1,384 1,458 1,294 1,475 1,361
**Sample size is too small for a reliable estimate.
SOURCE: U.S. Department of Education, National Center for Education Statistics, "1992-93 National Postsecondary Student AidStudy" (NPSAS:93), Undergraduate Data Analysis System. As published in NCES, Student Financing of Undergraduate Education, 1992-93, tables 3.5b, 1995.
Table S5-4. Average amount of financial aid received by undergraduates, by race/ethnicity and type of aid: 1992-93
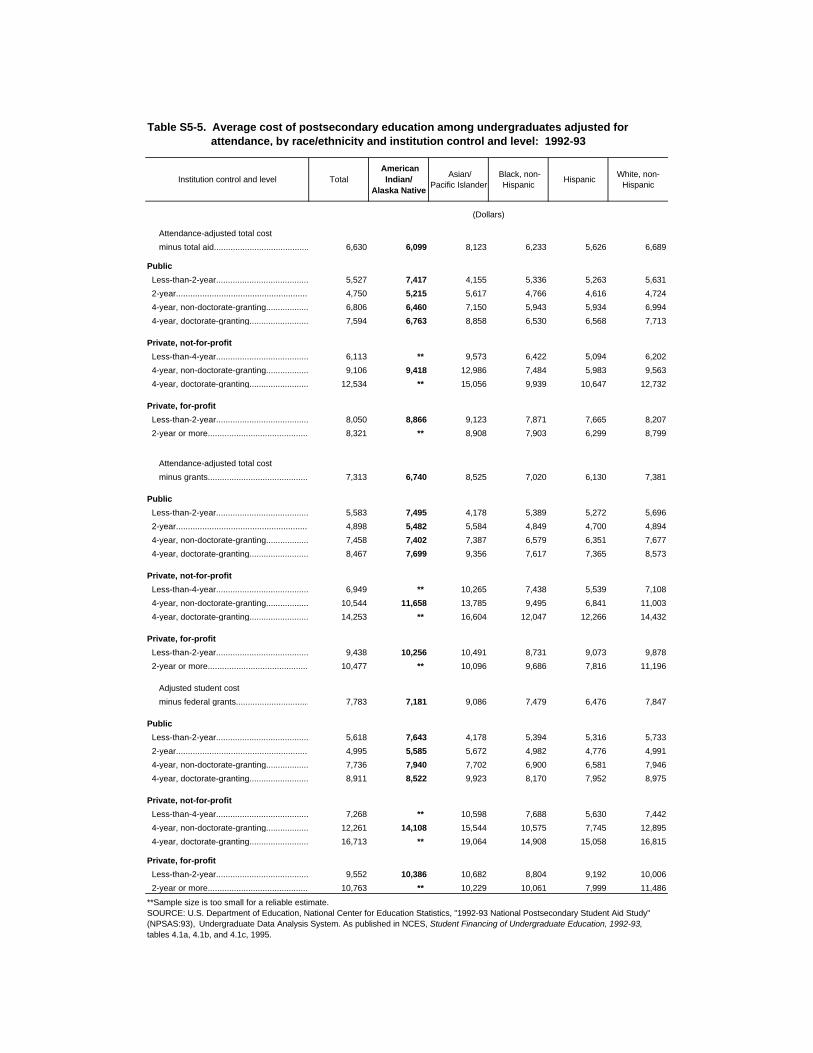
Institution control and level Total American
Indian/ Alaska Native
Asian/Pacific Islander
Black, non-Hispanic
Hispanic White, non-
Hispanic
(Dollars)
Attendance-adjusted total cost
minus total aid...............................................................6,630 6,099 8,123 6,233 5,626 6,689
Public
Less-than-2-year.............................................. 5,527 7,417 4,155 5,336 5,263 5,631
2-year.............................................................. 4,750 5,215 5,617 4,766 4,616 4,724
4-year, non-doctorate-granting............................... 6,806 6,460 7,150 5,943 5,934 6,994
4-year, doctorate-granting............................... 7,594 6,763 8,858 6,530 6,568 7,713
Private, not-for-profit
Less-than-4-year............................................... 6,113 ** 9,573 6,422 5,094 6,202
4-year, non-doctorate-granting............................... 9,106 9,418 12,986 7,484 5,983 9,563
4-year, doctorate-granting............................... 12,534 ** 15,056 9,939 10,647 12,732
Private, for-profit
Less-than-2-year.............................................. 8,050 8,866 9,123 7,871 7,665 8,207
2-year or more..............................................................8,321 ** 8,908 7,903 6,299 8,799
Attendance-adjusted total cost
minus grants...........................................................7,313 6,740 8,525 7,020 6,130 7,381
Public
Less-than-2-year.............................................. 5,583 7,495 4,178 5,389 5,272 5,696
2-year.............................................................. 4,898 5,482 5,584 4,849 4,700 4,894
4-year, non-doctorate-granting............................... 7,458 7,402 7,387 6,579 6,351 7,677
4-year, doctorate-granting............................... 8,467 7,699 9,356 7,617 7,365 8,573
Private, not-for-profit
Less-than-4-year............................................... 6,949 ** 10,265 7,438 5,539 7,108
4-year, non-doctorate-granting............................... 10,544 11,658 13,785 9,495 6,841 11,003
4-year, doctorate-granting............................... 14,253 ** 16,604 12,047 12,266 14,432
Private, for-profit
Less-than-2-year.............................................. 9,438 10,256 10,491 8,731 9,073 9,878
2-year or more..............................................................10,477 ** 10,096 9,686 7,816 11,196
Adjusted student cost
minus federal grants.................................. 7,783 7,181 9,086 7,479 6,476 7,847
Public
Less-than-2-year.............................................. 5,618 7,643 4,178 5,394 5,316 5,733
2-year.............................................................. 4,995 5,585 5,672 4,982 4,776 4,991
4-year, non-doctorate-granting............................... 7,736 7,940 7,702 6,900 6,581 7,946
4-year, doctorate-granting............................... 8,911 8,522 9,923 8,170 7,952 8,975
Private, not-for-profit
Less-than-4-year............................................... 7,268 ** 10,598 7,688 5,630 7,442
4-year, non-doctorate-granting............................... 12,261 14,108 15,544 10,575 7,745 12,895
4-year, doctorate-granting............................... 16,713 ** 19,064 14,908 15,058 16,815
Private, for-profit
Less-than-2-year.............................................. 9,552 10,386 10,682 8,804 9,192 10,006
2-year or more..............................................................10,763 ** 10,229 10,061 7,999 11,486
**Sample size is too small for a reliable estimate.SOURCE: U.S. Department of Education, National Center for Education Statistics, "1992-93 National Postsecondary Student Aid Study" (NPSAS:93), Undergraduate Data Analysis System. As published in NCES, Student Financing of Undergraduate Education, 1992-93, tables 4.1a, 4.1b, and 4.1c, 1995.
Table S5-5. Average cost of postsecondary education among undergraduates adjusted for attendance, by race/ethnicity and institution control and level: 1992-93
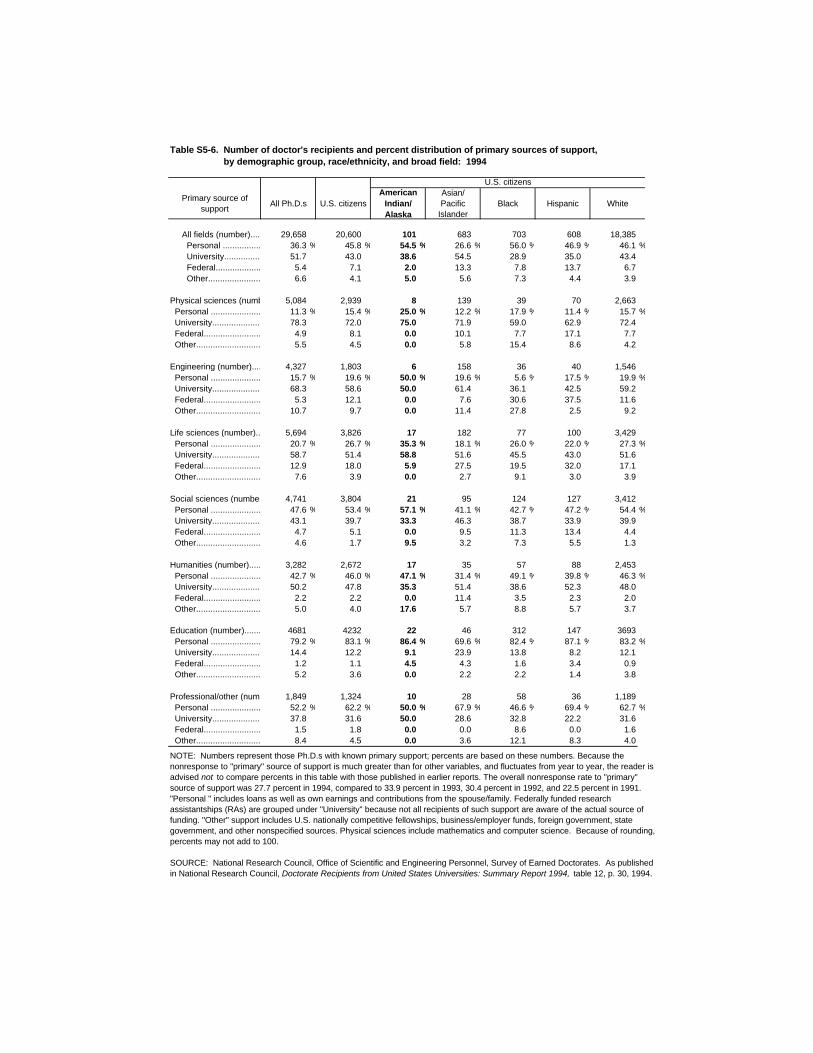
U.S. citizens
Primary source of support
All Ph.D.s U.S. citizensAmerican
Indian/Alaska
Asian/Pacific
IslanderBlack Hispanic White
All fields (number)................................29,658 20,600 101 683 703 608 18,385 Personal .......................................................36.3 % 45.8 % 54.5 % 26.6 % 56.0 % 46.9 % 46.1 % University..................................................51.7 43.0 38.6 54.5 28.9 35.0 43.4 Federal........................................................5.4 7.1 2.0 13.3 7.8 13.7 6.7 Other.........................................................6.6 4.1 5.0 5.6 7.3 4.4 3.9
Physical sciences (number)...............5,084 2,939 8 139 39 70 2,663 Personal .......................................................11.3 % 15.4 % 25.0 % 12.2 % 17.9 % 11.4 % 15.7 % University..................................................78.3 72.0 75.0 71.9 59.0 62.9 72.4 Federal........................................................4.9 8.1 0.0 10.1 7.7 17.1 7.7 Other.........................................................5.5 4.5 0.0 5.8 15.4 8.6 4.2
Engineering (number).........................4,327 1,803 6 158 36 40 1,546 Personal .......................................................15.7 % 19.6 % 50.0 % 19.6 % 5.6 % 17.5 % 19.9 % University..................................................68.3 58.6 50.0 61.4 36.1 42.5 59.2 Federal........................................................5.3 12.1 0.0 7.6 30.6 37.5 11.6 Other.........................................................10.7 9.7 0.0 11.4 27.8 2.5 9.2
Life sciences (number).......................5,694 3,826 17 182 77 100 3,429 Personal .......................................................20.7 % 26.7 % 35.3 % 18.1 % 26.0 % 22.0 % 27.3 % University..................................................58.7 51.4 58.8 51.6 45.5 43.0 51.6 Federal........................................................12.9 18.0 5.9 27.5 19.5 32.0 17.1 Other.........................................................7.6 3.9 0.0 2.7 9.1 3.0 3.9
Social sciences (number)....................4,741 3,804 21 95 124 127 3,412 Personal .......................................................47.6 % 53.4 % 57.1 % 41.1 % 42.7 % 47.2 % 54.4 % University..................................................43.1 39.7 33.3 46.3 38.7 33.9 39.9 Federal........................................................4.7 5.1 0.0 9.5 11.3 13.4 4.4 Other.........................................................4.6 1.7 9.5 3.2 7.3 5.5 1.3
Humanities (number)...........................3,282 2,672 17 35 57 88 2,453 Personal .......................................................42.7 % 46.0 % 47.1 % 31.4 % 49.1 % 39.8 % 46.3 % University..................................................50.2 47.8 35.3 51.4 38.6 52.3 48.0 Federal........................................................2.2 2.2 0.0 11.4 3.5 2.3 2.0 Other.........................................................5.0 4.0 17.6 5.7 8.8 5.7 3.7
Education (number)...............................4681 4232 22 46 312 147 3693 Personal .......................................................79.2 % 83.1 % 86.4 % 69.6 % 82.4 % 87.1 % 83.2 % University..................................................14.4 12.2 9.1 23.9 13.8 8.2 12.1 Federal........................................................1.2 1.1 4.5 4.3 1.6 3.4 0.9 Other.........................................................5.2 3.6 0.0 2.2 2.2 1.4 3.8
Professional/other (number)......................1,849 1,324 10 28 58 36 1,189 Personal .......................................................52.2 % 62.2 % 50.0 % 67.9 % 46.6 % 69.4 % 62.7 % University..................................................37.8 31.6 50.0 28.6 32.8 22.2 31.6 Federal........................................................1.5 1.8 0.0 0.0 8.6 0.0 1.6 Other.........................................................8.4 4.5 0.0 3.6 12.1 8.3 4.0
NOTE: Numbers represent those Ph.D.s with known primary support; percents are based on these numbers. Because the nonresponse to "primary" source of support is much greater than for other variables, and fluctuates from year to year, the reader is advised not to compare percents in this table with those published in earlier reports. The overall nonresponse rate to "primary" source of support was 27.7 percent in 1994, compared to 33.9 percent in 1993, 30.4 percent in 1992, and 22.5 percent in 1991. "Personal " includes loans as well as own earnings and contributions from the spouse/family. Federally funded research assistantships (RAs) are grouped under "University" because not all recipients of such support are aware of the actual source of funding. "Other" support includes U.S. nationally competitive fellowships, business/employer funds, foreign government, state government, and other nonspecified sources. Physical sciences include mathematics and computer science. Because of rounding, percents may not add to 100.
SOURCE: National Research Council, Office of Scientific and Engineering Personnel, Survey of Earned Doctorates. As published in National Research Council, Doctorate Recipients from United States Universities: Summary Report 1994, table 12, p. 30, 1994.
Table S5-6. Number of doctor's recipients and percent distribution of primary sources of support, by demographic group, race/ethnicity, and broad field: 1994
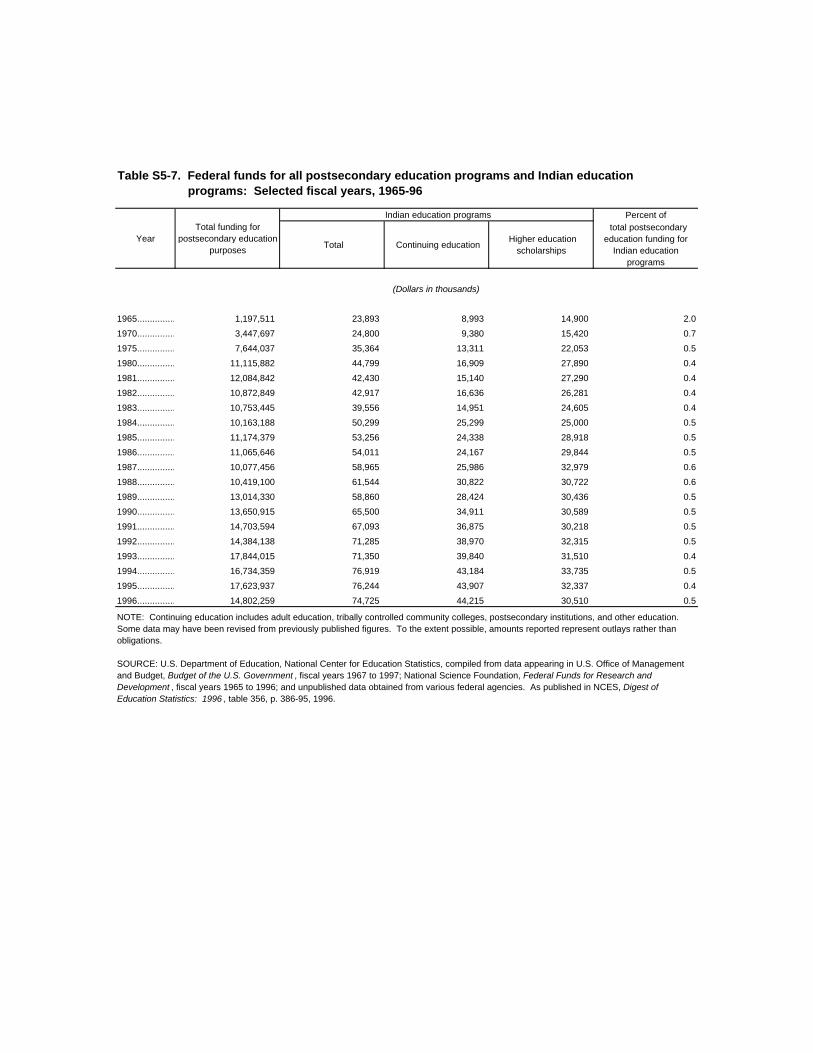
Indian education programs Percent of
YearTotal funding for
postsecondary education purposes
Total Continuing education Higher education
scholarships
total postsecondary education funding for
Indian education programs
(Dollars in thousands)
1965......................... 1,197,511 23,893 8,993 14,900 2.0
1970........................ 3,447,697 24,800 9,380 15,420 0.7
1975..................... 7,644,037 35,364 13,311 22,053 0.5
1980..................... 11,115,882 44,799 16,909 27,890 0.4
1981..................... 12,084,842 42,430 15,140 27,290 0.4
1982..................... 10,872,849 42,917 16,636 26,281 0.4
1983..................... 10,753,445 39,556 14,951 24,605 0.4
1984..................... 10,163,188 50,299 25,299 25,000 0.5
1985......................... 11,174,379 53,256 24,338 28,918 0.5
1986...................... 11,065,646 54,011 24,167 29,844 0.5
1987....................... 10,077,456 58,965 25,986 32,979 0.6
1988......................... 10,419,100 61,544 30,822 30,722 0.6
1989........................ 13,014,330 58,860 28,424 30,436 0.5
1990...................... 13,650,915 65,500 34,911 30,589 0.5
1991........................ 14,703,594 67,093 36,875 30,218 0.5
1992........................ 14,384,138 71,285 38,970 32,315 0.5
1993..................... 17,844,015 71,350 39,840 31,510 0.4
1994........................ 16,734,359 76,919 43,184 33,735 0.5
1995........................... 17,623,937 76,244 43,907 32,337 0.4
1996........................... 14,802,259 74,725 44,215 30,510 0.5
NOTE: Continuing education includes adult education, tribally controlled community colleges, postsecondary institutions, and other education. Some data may have been revised from previously published figures. To the extent possible, amounts reported represent outlays rather than obligations.
SOURCE: U.S. Department of Education, National Center for Education Statistics, compiled from data appearing in U.S. Office of Management and Budget, Budget of the U.S. Government , fiscal years 1967 to 1997; National Science Foundation, Federal Funds for Research and Development , fiscal years 1965 to 1996; and unpublished data obtained from various federal agencies. As published in NCES, Digest of Education Statistics: 1996 , table 356, p. 386-95, 1996.
Table S5-7. Federal funds for all postsecondary education programs and Indian education programs: Selected fiscal years, 1965-96

P
5-32
6American Indian andAlaska NativeStaff and Facultyin Institutions ofHigher Education
“The recruitment and retention of AI/AN administrators andteachers is difficult for mainstream schools, but role modelsfor students are desperately needed.”
Blueprints for Indian Education:Improving Mainstream Schooling
Robin Butterfield
z
Staff and Faculty
6-1
n 1993, there were 12,615 American Indians and Alaska Natives1 employed in
institutions of higher education (IHEs), representing approximately 0.5 percent
of all IHE staff (summary table S6-1). Over 70 percent of Native American staff
were employed full time, and of these employees, 22 percent were employed as
full-time faculty (figure 6-1 and summary table S6-1). Both Native American
men and women have experienced growth in their number of IHE staff
positions, especially in faculty, executive/administrative/managerial, and
professional positions since 1983, but growth in positions for American Indian
and Alaska Native women has outpaced the increase in positions for their male
counterparts (summary table S6-2). By 1993, Native American women held 53
percent of all positions held by Native Americans.
This chapter summarizes national statistics on American Indian and Alaska
Native higher education faculty and also presents information on nonfaculty
employment of American Indians in higher education positions.
The discussion is limited to those institutions that are considered
accredited at the higher education level by the U.S. Department of
Education and are known as institutions of higher education
(IHEs). Throughout this chapter comparisons are made of
American Indian and Alaska Native staff to total staff in the 50 states and the
District of Columbia. Tables in the text and the summary tables often include
distributions giving data for multiple racial/ethnic groups; however, the
discussion is limited to American Indians and Alaska Natives.
The chapter covers three major topics: (1) data sources; (2) total staff in
institutions of higher education; and (3) higher education faculty. The summary
tables referred to in the text appear at the end of the chapter.
HIGHLIGHTS
# In 1993, a total of 12,215 American Indian and Alaska Native staff wereemployed in institutions of higher education (summary table S6-1). Of these,9,229 were employed full time (figure 6-1).
1The terms “Native American” and “American Indian and Alaska Native” are used interchangeably throughout this chapter.
I
R
z
6-2
# In 1993, American Indians and Alaska Natives were 0.5 percent of all full-time staff, 0.4 percent of all full-time faculty, and 0.7 percent of the U.S.population aged 20-64 (table 6-1).
# Overall full-time staff in IHEs grew by about 12 percent from 1983 to 1993,while the increase in American Indian and Alaska Native staff over the sameperiod was about 37 percent. Full-time faculty increased by 53 percentamong Native Americans and 12 percent overall (figure 6-3).
# Over the last 20 years, women have had larger increases than men innumber of faculty among all faculty and among American Indians andAlaska Natives (figure 6-4). In 1993, women were 38 percent of AmericanIndian and Alaska Native faculty and 33 percent of the total IHE full-timefaculty (summary table S6-2).
# Fifty-nine percent of American Indian and Alaska Native faculty and 60percent of total IHE faculty had full-time status in 1993. At 2-yearinstitutions, however, a somewhat larger percentage of Native Americanfaculty were employed full time than among all faculty (47 percent and 36percent, respectively; figure 6-6).
# The median salaries for American Indian and Alaska Native full-time facultyin 1993 were 91 percent of median salaries for full-time faculty overall(figure 6-9).
# In 1993, about 29 percent of the total IHE faculty were full professorscompared with 18 percent of American Indian and Alaska Natives (figure 6-10).
# In 1993, American Indians and Alaska Native full-time faculty were the leastlikely to have tenure of any racial/ethnic group. Among American Indianand Alaska Natives about 38 percent of full-time faculty had tenurecompared with about 51 percent for all full-time faculty (figure 6-11).
# From 1981 to 1993, an estimated 2,031 American Indian and Alaska Nativefull-time faculty were newly hired (summary table S6-5). However, many ofthese represented transfers among those already in academe or thereplacement of those retiring. The net gain in Native American faculty wasabout 224.
# The institutions with the largest number of American Indian and AlaskaNative faculty were Navajo Community College (51 faculty), University ofNew Mexico-Main Campus (46 faculty), and Robeson Community College(42 faculty; table 6-9).
Staff and Faculty
6-3
# In 1993, 620 or about 8 percent of the full-time American Indian and AlaskaNative faculty were employed in tribal colleges (table 6-11 and summarytable S6-2). In 1994, an estimated 8 percent of American Indian and AlaskaNative students were enrolled in tribal colleges (figure 7-4).
SOURCES OF DATA
Data included in this chapter are taken from the following major national
sources: (1) the National Center for Education Statistics (NCES), Integrated
Postsecondary Education Data System (IPEDS), Fall Staff surveys; (2)
the U.S. Equal Employment Opportunity Commission, EEO-6 Higher
Education Reports collected between the mid-1970s and 1991; and
(3) the NCES National Study of Postsecondary Faculty (NSOPF)
conducted in 1988 and 1993. The IPEDS and EEO-6 reports are based on counts
from the universe of institutions and are combined to present historical trend
data from 1976 to 1993.
The Integrated Postsecondary Educational Data System (IPEDS) Fall Staff
survey. The Fall Staff survey is a census that collects information on all staff
employed at postsecondary institutions. The survey is part of the larger IPEDS
system, and the staff information is collected biennially in the odd years. Prior
to 1993, the fall staff data collection was shared with the Equal Employment
Opportunity Commission’s EEO-6 survey. NCES collected information on those
institutions not covered in the EEO-6 data collection and the information was
then merged. In 1993, NCES sponsored the entire data collection for the first
time. That year, the IPEDS Fall Staff survey response rate was about 92 percent
for institutions of higher education; the data were imputed for nonresponse.
Faculty numbers include all persons who customarily conduct instruction,
research, or public service and who hold academic rank titles of professor,
associate professor, assistant professor, instructor, lecturer, or the equivalent of
any of these ranks. If their principal activity is instructional, deans are also
included as faculty members. Research and teaching assistants are excluded
from the faculty category.
Q
z
6-4
z
EEO-6 Higher Education Staff Information. The EEO-6 report was conducted
on a biennial basis from its inception in 1975 until 1993 and included all public
and private institutions of higher education with 15 or more employees. Data
on institutions having fewer than 15 employees were collected by NCES from
1986 to 1993, when NCES assumed responsibility for the entire data collection.
The National Study of Postsecondary Faculty (NSOPF). NSOPF was initiated
by NCES in 1988, a second survey was completed in 1993, and a third survey is
scheduled to be conducted in 1999. In 1988, the sample consisted of about
14,000 faculty members from a stratified random sample of 480 colleges and
universities. In 1993, the sample was increased to 974 institutions and to about
31,000 faculty members; the institutional response rate was 85 percent and the
faculty response rate about 87 percent. NSOPF-88 only included faculty
involved in instruction. NSOPF-93 defined “faculty” to include instructors without
faculty status, administrators, researchers, faculty on leave, and faculty with
temporary appointments. Although black, Hispanic, and Asian faculty were
oversampled to provide sufficient cell sizes for estimation, neither of the two
NSOPF surveys oversampled Native Americans. The NSOPF-93 sample included
about 160 American Indians and Alaska Natives.
AMERICAN INDIAN AND
ALASKA NATIVE STAFF IN
INSTITUTIONS OF HIGHER EDUCATION
This section provides an overview on American Indian and Alaska
Native employment in all occupations in institutions of higher
education, with a focus on full-time employment.2 In the fall of
1993, about 2.6 million persons or about 2 percent of the total U.S.
2 Full-time employees are also known as full-time staff. This designation includes all persons on the payroll of the institution and classified by
the institution as full time. Faculty on sabbatical leave and persons who are on leave but remain on the payroll are included. It should benoted that faculty is a subgroup of staff (see figure 6-2 for a complete list of staff subgroups).
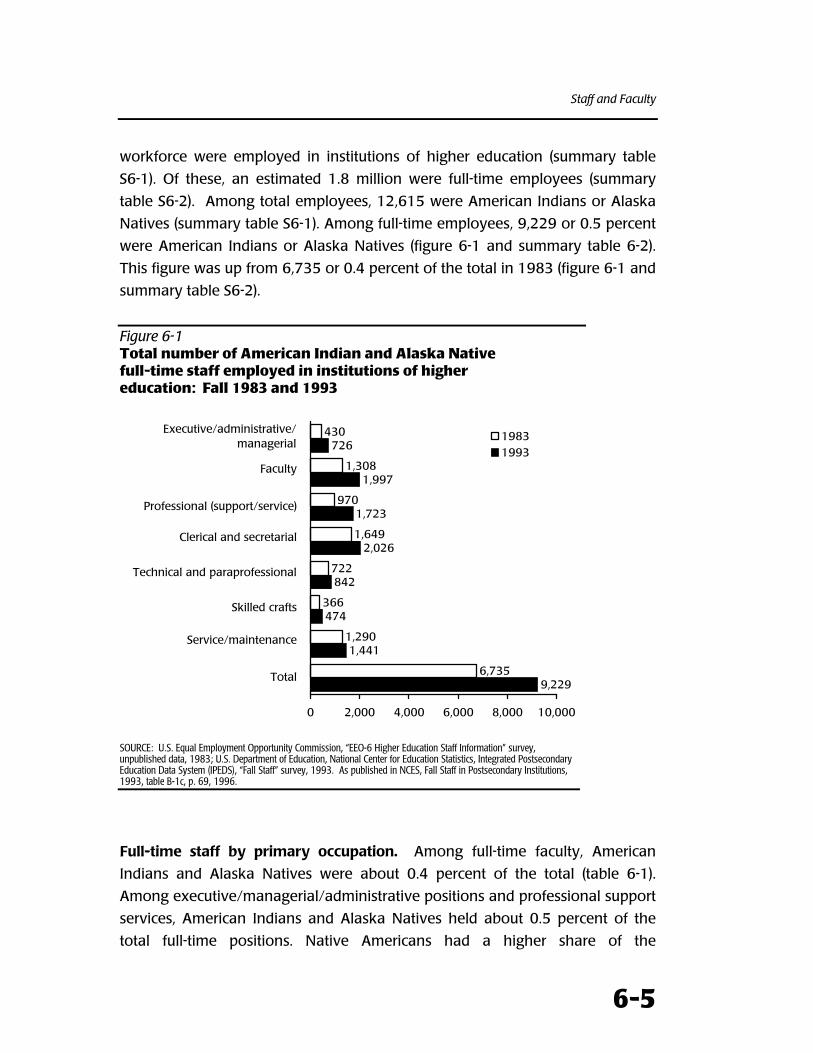
Staff and Faculty
6-5
workforce were employed in institutions of higher education (summary table
S6-1). Of these, an estimated 1.8 million were full-time employees (summary
table S6-2). Among total employees, 12,615 were American Indians or Alaska
Natives (summary table S6-1). Among full-time employees, 9,229 or 0.5 percent
were American Indians or Alaska Natives (figure 6-1 and summary table 6-2).
This figure was up from 6,735 or 0.4 percent of the total in 1983 (figure 6-1 and
summary table S6-2).
Figure 6-1Total number of American Indian and Alaska Nativefull-time staff employed in institutions of highereducation: Fall 1983 and 1993
9,229
1,441
474
842
2,026
1,723
1,997
726
6,735
1,290
366
722
1,649
970
1,308
430
0 2,000 4,000 6,000 8,000 10,000
19831993
Executive/administrative/managerial
Faculty
Professional (support/service)
Clerical and secretarial
Technical and paraprofessional
Skilled crafts
Service/maintenance
Total
SOURCE: U.S. Equal Employment Opportunity Commission, “EEO-6 Higher Education Staff Information” survey,unpublished data, 1983; U.S. Department of Education, National Center for Education Statistics, Integrated PostsecondaryEducation Data System (IPEDS), “Fall Staff” survey, 1993. As published in NCES, Fall Staff in Postsecondary Institutions,1993, table B-1c, p. 69, 1996.
Full-time staff by primary occupation. Among full-time faculty, American
Indians and Alaska Natives were about 0.4 percent of the total (table 6-1).
Among executive/managerial/administrative positions and professional support
services, American Indians and Alaska Natives held about 0.5 percent of the
total full-time positions. Native Americans had a higher share of the
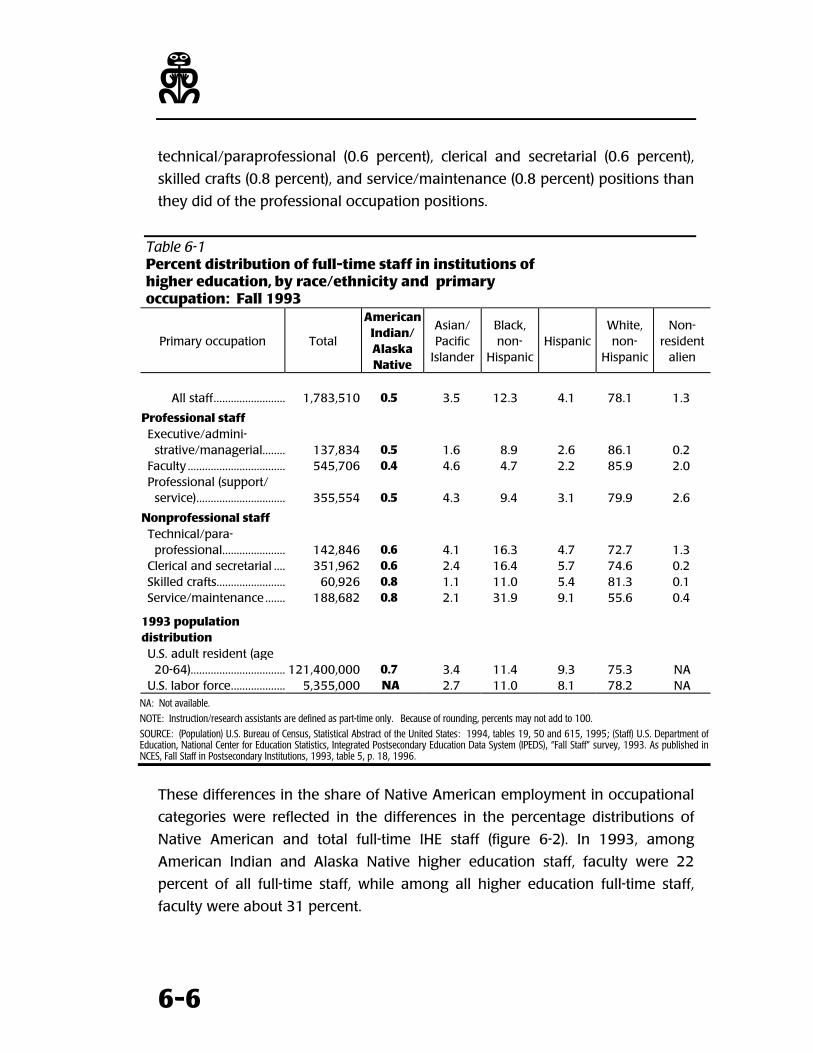
z
6-6
technical/paraprofessional (0.6 percent), clerical and secretarial (0.6 percent),
skilled crafts (0.8 percent), and service/maintenance (0.8 percent) positions than
they did of the professional occupation positions.
Table 6-1Percent distribution of full-time staff in institutions ofhigher education, by race/ethnicity and primaryoccupation: Fall 1993
Primary occupation Total
AmericanIndian/AlaskaNative
Asian/Pacific
Islander
Black,non-
HispanicHispanic
White,non-
Hispanic
Non-resident
alien
All staff......................... 1,783,510 0.5 3.5 12.3 4.1 78.1 1.3
Professional staffExecutive/admini- strative/managerial........ 137,834 0.5 1.6 8.9 2.6 86.1 0.2Faculty .................................. 545,706 0.4 4.6 4.7 2.2 85.9 2.0Professional (support/ service)............................... 355,554 0.5 4.3 9.4 3.1 79.9 2.6
Nonprofessional staffTechnical/para- professional...................... 142,846 0.6 4.1 16.3 4.7 72.7 1.3Clerical and secretarial .... 351,962 0.6 2.4 16.4 5.7 74.6 0.2Skilled crafts........................ 60,926 0.8 1.1 11.0 5.4 81.3 0.1Service/maintenance ....... 188,682 0.8 2.1 31.9 9.1 55.6 0.4
1993 populationdistributionU.S. adult resident (age 20-64)................................. 121,400,000 0.7 3.4 11.4 9.3 75.3 NAU.S. labor force................... 5,355,000 NA 2.7 11.0 8.1 78.2 NA
NA: Not available.
NOTE: Instruction/research assistants are defined as part-time only. Because of rounding, percents may not add to 100.
SOURCE: (Population) U.S. Bureau of Census, Statistical Abstract of the United States: 1994, tables 19, 50 and 615, 1995; (Staff) U.S. Department ofEducation, National Center for Education Statistics, Integrated Postsecondary Education Data System (IPEDS), “Fall Staff” survey, 1993. As published inNCES, Fall Staff in Postsecondary Institutions, 1993, table 5, p. 18, 1996.
These differences in the share of Native American employment in occupational
categories were reflected in the differences in the percentage distributions of
Native American and total full-time IHE staff (figure 6-2). In 1993, among
American Indian and Alaska Native higher education staff, faculty were 22
percent of all full-time staff, while among all higher education full-time staff,
faculty were about 31 percent.
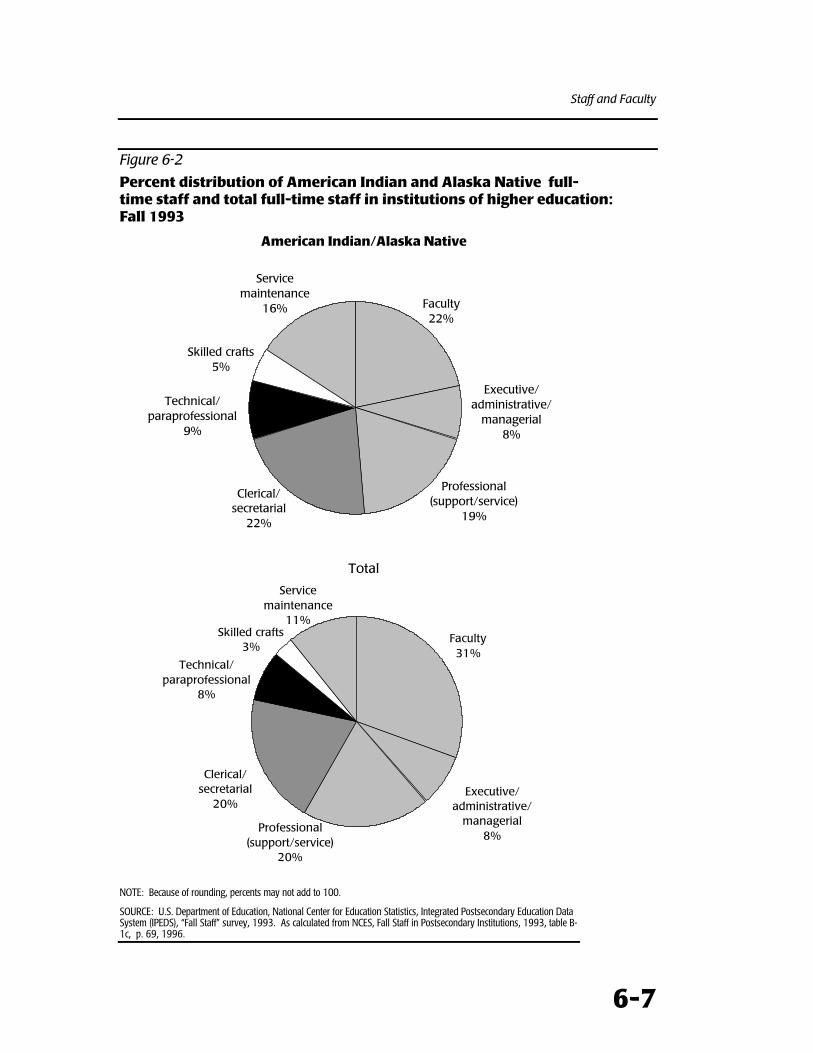
Staff and Faculty
6-7
Figure 6-2
Percent distribution of American Indian and Alaska Native full-time staff and total full-time staff in institutions of higher education:Fall 1993
American Indian/Alaska Native
Professional (support/service)
19%
Skilled crafts5%
Service maintenance
16% Faculty22%
Executive/administrative/
managerial8%
Clerical/secretarial
22%
Technical/paraprofessional
9%
Total
Technical/paraprofessional
8%
Clerical/secretarial
20%Executive/
administrative/managerial
8%
Faculty31%
Skilled crafts3%
Service maintenance
11%
Professional (support/service)
20%
NOTE: Because of rounding, percents may not add to 100.
SOURCE: U.S. Department of Education, National Center for Education Statistics, Integrated Postsecondary Education DataSystem (IPEDS), “Fall Staff” survey, 1993. As calculated from NCES, Fall Staff in Postsecondary Institutions, 1993, table B-1c, p. 69, 1996.
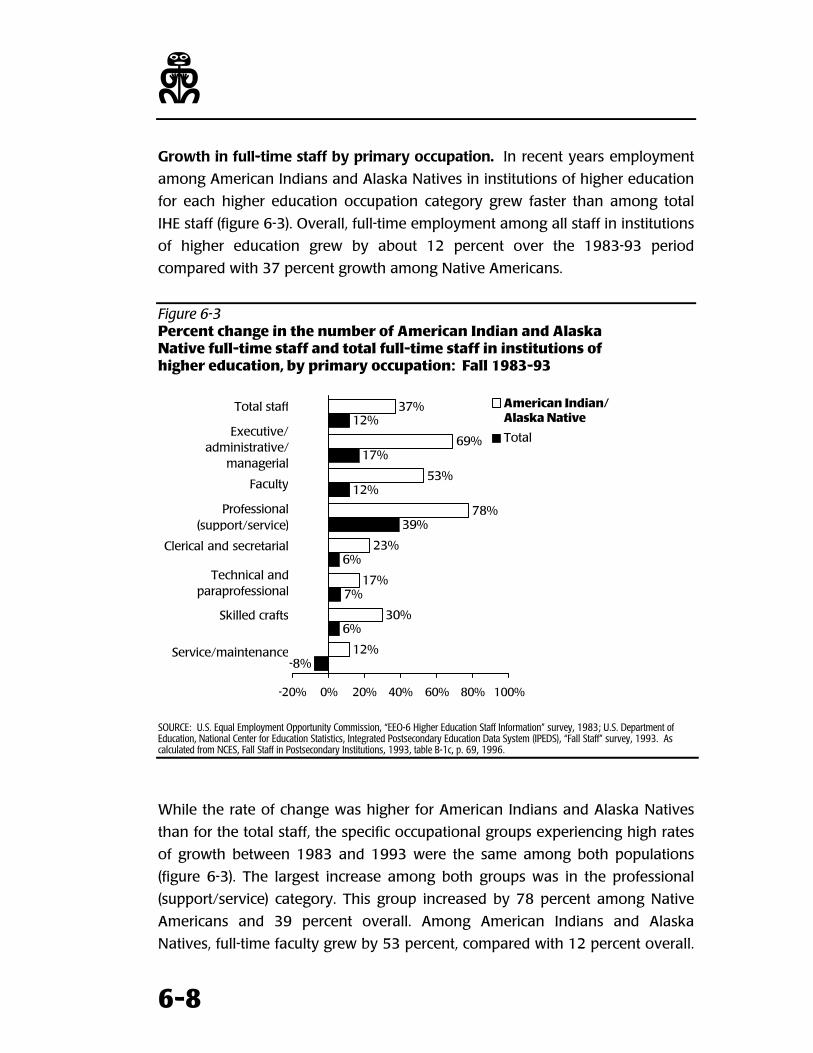
z
6-8
Growth in full-time staff by primary occupation. In recent years employment
among American Indians and Alaska Natives in institutions of higher education
for each higher education occupation category grew faster than among total
IHE staff (figure 6-3). Overall, full-time employment among all staff in institutions
of higher education grew by about 12 percent over the 1983-93 period
compared with 37 percent growth among Native Americans.
Figure 6-3Percent change in the number of American Indian and AlaskaNative full-time staff and total full-time staff in institutions ofhigher education, by primary occupation: Fall 1983-93
-8%
6%
7%
6%
39%
12%
17%
12%
12%
30%
17%
23%
78%
53%
69%
37%
-20% 0% 20% 40% 60% 80% 100%
American Indian/Alaska Native
TotalExecutive/administrative/
managerial
Faculty
Professional (support/service)
Clerical and secretarial
Technical andparaprofessional
Skilled crafts
Service/maintenance
Total staff
SOURCE: U.S. Equal Employment Opportunity Commission, “EEO-6 Higher Education Staff Information” survey, 1983; U.S. Department ofEducation, National Center for Education Statistics, Integrated Postsecondary Education Data System (IPEDS), “Fall Staff” survey, 1993. Ascalculated from NCES, Fall Staff in Postsecondary Institutions, 1993, table B-1c, p. 69, 1996.
While the rate of change was higher for American Indians and Alaska Natives
than for the total staff, the specific occupational groups experiencing high rates
of growth between 1983 and 1993 were the same among both populations
(figure 6-3). The largest increase among both groups was in the professional
(support/service) category. This group increased by 78 percent among Native
Americans and 39 percent overall. Among American Indians and Alaska
Natives, full-time faculty grew by 53 percent, compared with 12 percent overall.
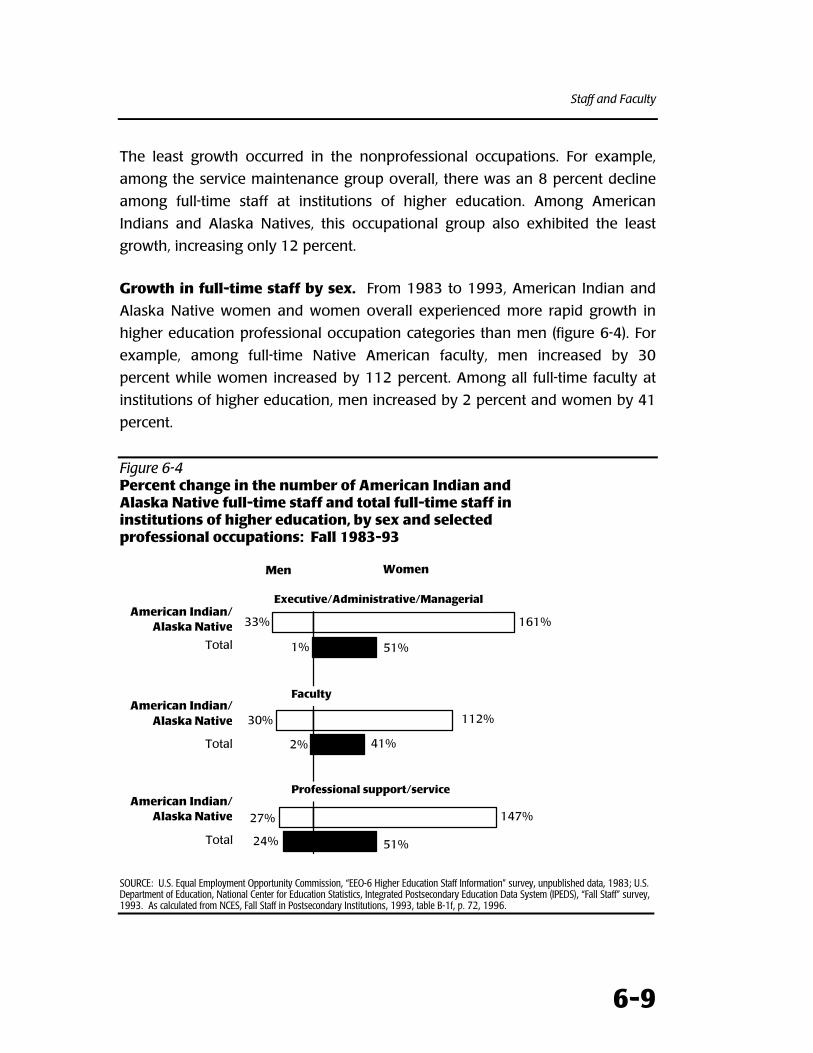
Staff and Faculty
6-9
The least growth occurred in the nonprofessional occupations. For example,
among the service maintenance group overall, there was an 8 percent decline
among full-time staff at institutions of higher education. Among American
Indians and Alaska Natives, this occupational group also exhibited the least
growth, increasing only 12 percent.
Growth in full-time staff by sex. From 1983 to 1993, American Indian and
Alaska Native women and women overall experienced more rapid growth in
higher education professional occupation categories than men (figure 6-4). For
example, among full-time Native American faculty, men increased by 30
percent while women increased by 112 percent. Among all full-time faculty at
institutions of higher education, men increased by 2 percent and women by 41
percent.
Figure 6-4Percent change in the number of American Indian andAlaska Native full-time staff and total full-time staff ininstitutions of higher education, by sex and selectedprofessional occupations: Fall 1983-93
27%
2%
30%
1%
33%
147%
112%
161%
Men Women
Executive/Administrative/Managerial
Faculty
Professional support/service
Total
Total
Total
American Indian/Alaska Native
American Indian/Alaska Native
American Indian/Alaska Native
24%
51%
41%
51%
SOURCE: U.S. Equal Employment Opportunity Commission, “EEO-6 Higher Education Staff Information” survey, unpublished data, 1983; U.S.Department of Education, National Center for Education Statistics, Integrated Postsecondary Education Data System (IPEDS), “Fall Staff” survey,1993. As calculated from NCES, Fall Staff in Postsecondary Institutions, 1993, table B-1f, p. 72, 1996.
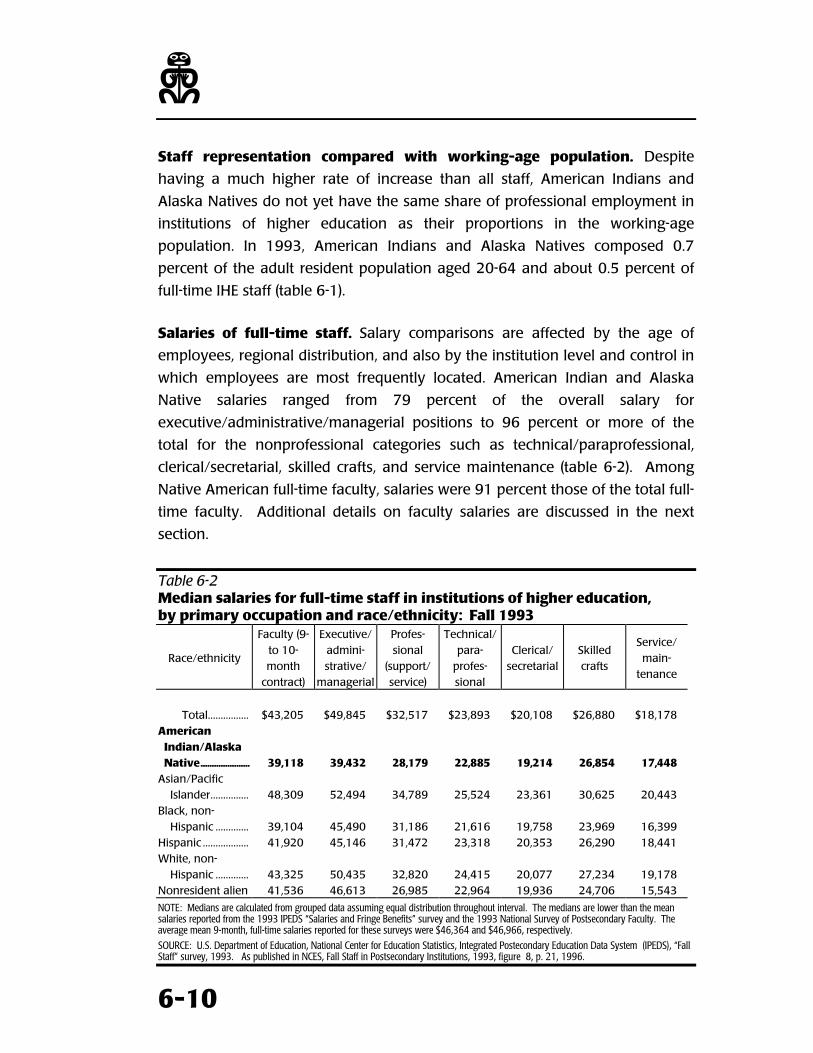
z
6-10
Staff representation compared with working-age population. Despite
having a much higher rate of increase than all staff, American Indians and
Alaska Natives do not yet have the same share of professional employment in
institutions of higher education as their proportions in the working-age
population. In 1993, American Indians and Alaska Natives composed 0.7
percent of the adult resident population aged 20-64 and about 0.5 percent of
full-time IHE staff (table 6-1).
Salaries of full-time staff. Salary comparisons are affected by the age of
employees, regional distribution, and also by the institution level and control in
which employees are most frequently located. American Indian and Alaska
Native salaries ranged from 79 percent of the overall salary for
executive/administrative/managerial positions to 96 percent or more of the
total for the nonprofessional categories such as technical/paraprofessional,
clerical/secretarial, skilled crafts, and service maintenance (table 6-2). Among
Native American full-time faculty, salaries were 91 percent those of the total full-
time faculty. Additional details on faculty salaries are discussed in the next
section.
Table 6-2Median salaries for full-time staff in institutions of higher education,by primary occupation and race/ethnicity: Fall 1993
Race/ethnicity
Faculty (9-to 10-month
contract)
Executive/admini-strative/
managerial
Profes-sional
(support/service)
Technical/para-
profes-sional
Clerical/secretarial
Skilledcrafts
Service/main-
tenance
Total................ $43,205 $49,845 $32,517 $23,893 $20,108 $26,880 $18,178American
Indian/AlaskaNative...................... 39,118 39,432 28,179 22,885 19,214 26,854 17,448
Asian/PacificIslander............... 48,309 52,494 34,789 25,524 23,361 30,625 20,443
Black, non-Hispanic ............. 39,104 45,490 31,186 21,616 19,758 23,969 16,399
Hispanic .................. 41,920 45,146 31,472 23,318 20,353 26,290 18,441White, non-
Hispanic ............. 43,325 50,435 32,820 24,415 20,077 27,234 19,178Nonresident alien 41,536 46,613 26,985 22,964 19,936 24,706 15,543
NOTE: Medians are calculated from grouped data assuming equal distribution throughout interval. The medians are lower than the meansalaries reported from the 1993 IPEDS “Salaries and Fringe Benefits” survey and the 1993 National Survey of Postsecondary Faculty. Theaverage mean 9-month, full-time salaries reported for these surveys were $46,364 and $46,966, respectively.
SOURCE: U.S. Department of Education, National Center for Education Statistics, Integrated Postecondary Education Data System (IPEDS), “FallStaff” survey, 1993. As published in NCES, Fall Staff in Postsecondary Institutions, 1993, figure 8, p. 21, 1996.
Staff and Faculty
6-11
AMERICAN INDIAN AND
ALASKA NATIVE FACULTY
This section focuses primarily on American Indian and Alaska Native faculty,
one segment of total IHE staff. First, estimates of the number of faculty from
NSOPF-93 are compared with counts of total faculty from IPEDS. This
is followed by a comparison of the percentage of full-time faculty with
student enrollment and completions. Then faculty distribution by
institution level, control, and program area are examined, followed by
a discussion of salary, rank, tenure, and new hire data. Lastly, information on
tribal college faculty and staff is examined.
ESTIMATES AND COUNTS OF THE NUMBER OF
AMERICAN INDIAN AND ALASKA NATIVE FACULTY
Because American Indian and Alaska Natives constitute a small percentage of
the total faculty, estimates from sample surveys, even of the number of
American Indian and Alaska Native faculty, and are subject to relatively large
sampling errors. Estimates from the IPEDS Fall Staff survey are
based on a census of all institutions and do not have the
problem of sampling error. However, as discussed in the
introduction to this sourcebook, self-identification as a member
of a particular racial/ethnic group is less stable among American Indians or
Alaska Natives than among other groups. It may also involve more situations
in which a person has multiple racial/ethnic identities, as has been revealed in
recent data collections.
Faculty estimates and counts. The NSOPF-93 study estimated that 5,424 full-
and part-time American Indian and Alaska Native faculty were employed in
postsecondary institutions in fall of 1992 (summary table S6-3). Of these, 2,793
were employed full time. Using a less inclusive definition of faculty, the IPEDS
Fall Staff survey counted a total of 3,407 full- and part-time American Indian
and Alaska Native faculty for fall of 1993 (summary table S6-1). In addition to
;
@
z
6-12
v
differences in faculty definitions, this variation in numbers may reflect either
sampling error from NSOPF or the fact that identity as a Native American is not
completely stable. The total faculty counted by NSOPF was 1,015,044
compared to 915,474 in IPEDS (summary tables S6-3 and S6-1, respectively).
Considered as a percentage of the total faculty, in the NSOPF-93 sample survey
estimates, Native Americans were 0.5 percent of the total; in the IPEDS counts,
they were 0.4 percent of the total. As a percentage of full-time faculty, American
Indians and Alaska Natives were 0.5 percent in NSOPF and 0.4 percent in IPEDS.
FULL-TIME FACULTY IN IHES
In 1976, fewer than 1,000 American Indian and Alaska Native full-time faculty
were employed in 3,031 institutions of higher education
(figure 6-5). By 1993, the number had reached 1,997 in about
3,670 institutions, an increase of about 130 percent among
Native Americans compared to an increase of 25 percent
among full-time faculty at all institutions of higher education over the same
period.3 As a proportion of all full-time faculty, American Indians and Alaska
Natives went from 0.2 percent to 0.4 percent of the total.
3 In 1976 there were an estimated 435,000 total full-time faculty; in 1993 the figure was 545,706 full-time faculty.
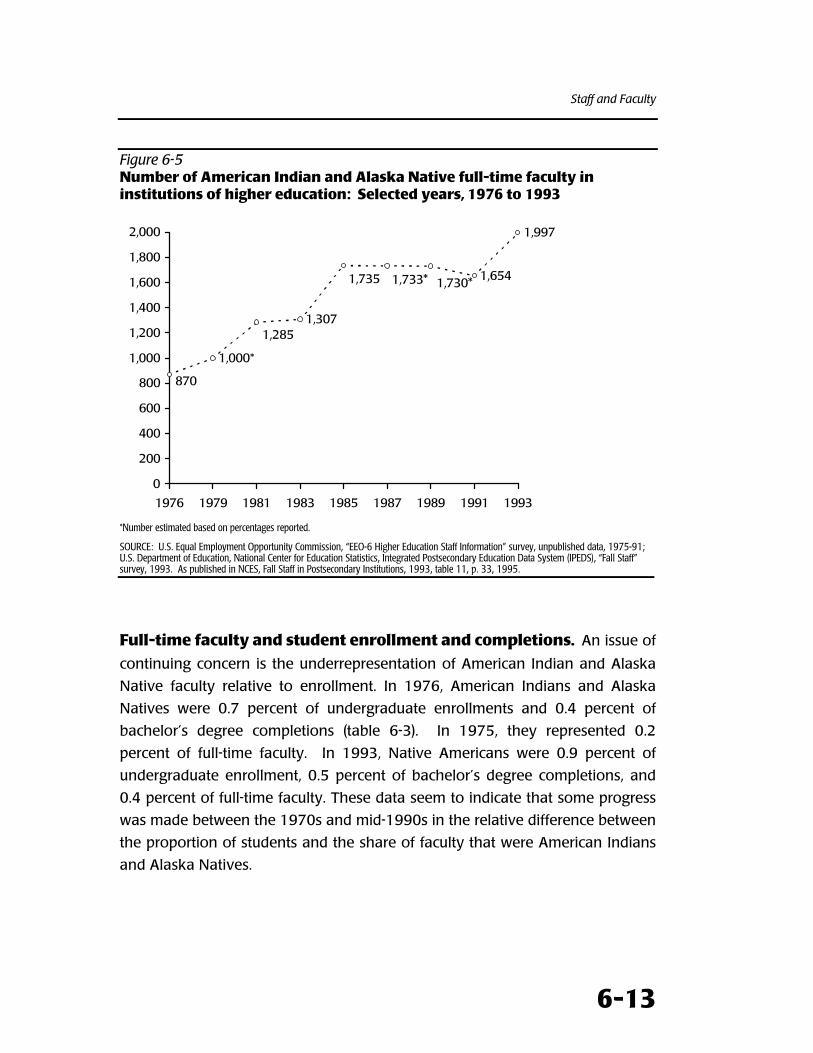
Staff and Faculty
6-13
Figure 6-5Number of American Indian and Alaska Native full-time faculty ininstitutions of higher education: Selected years, 1976 to 1993
1,307
1,654
1,997
1,730*1,733*1,735
1,285
870
1,000*
0
200
400
600
800
1,000
1,200
1,400
1,600
1,800
2,000
1976 1979 1981 1983 1985 1987 1989 1991 1993
*Number estimated based on percentages reported.
SOURCE: U.S. Equal Employment Opportunity Commission, “EEO-6 Higher Education Staff Information” survey, unpublished data, 1975-91;U.S. Department of Education, National Center for Education Statistics, Integrated Postsecondary Education Data System (IPEDS), “Fall Staff”survey, 1993. As published in NCES, Fall Staff in Postsecondary Institutions, 1993, table 11, p. 33, 1995.
Full-time faculty and student enrollment and completions. An issue of
continuing concern is the underrepresentation of American Indian and Alaska
Native faculty relative to enrollment. In 1976, American Indians and Alaska
Natives were 0.7 percent of undergraduate enrollments and 0.4 percent of
bachelor’s degree completions (table 6-3). In 1975, they represented 0.2
percent of full-time faculty. In 1993, Native Americans were 0.9 percent of
undergraduate enrollment, 0.5 percent of bachelor’s degree completions, and
0.4 percent of full-time faculty. These data seem to indicate that some progress
was made between the 1970s and mid-1990s in the relative difference between
the proportion of students and the share of faculty that were American Indians
and Alaska Natives.
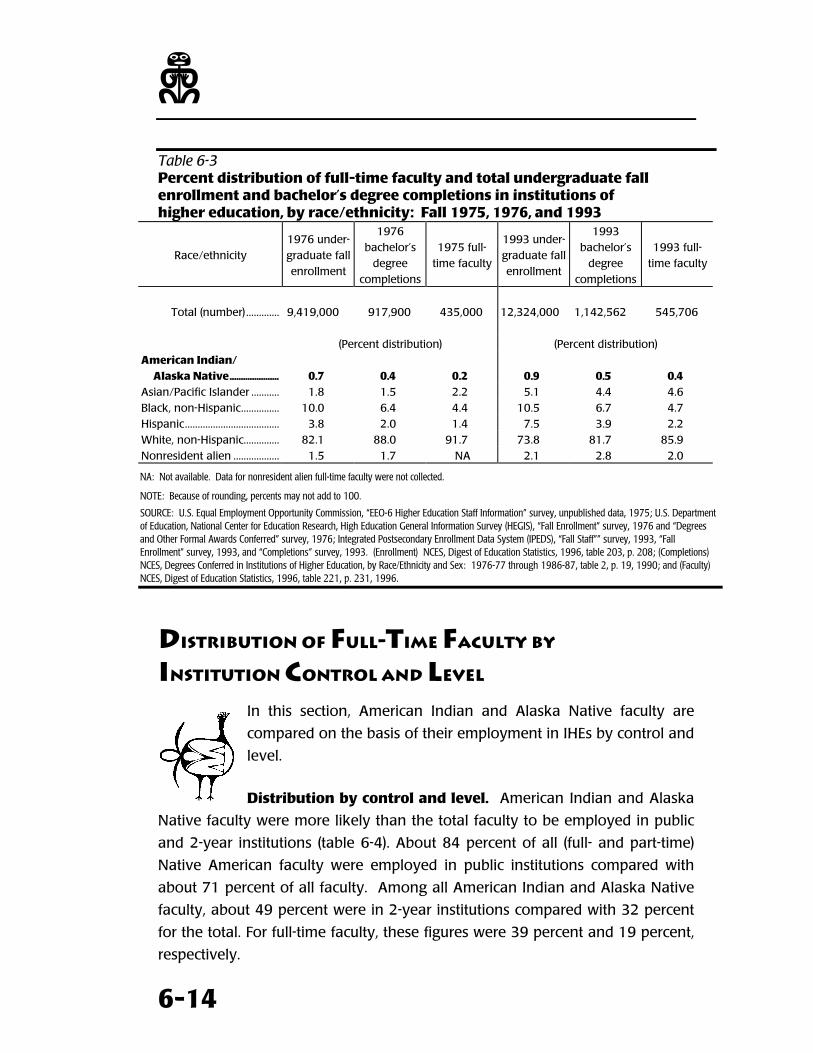
z
6-14
Table 6-3Percent distribution of full-time faculty and total undergraduate fallenrollment and bachelor’s degree completions in institutions ofhigher education, by race/ethnicity: Fall 1975, 1976, and 1993
Race/ethnicity1976 under-graduate fallenrollment
1976bachelor’s
degreecompletions
1975 full-time faculty
1993 under-graduate fallenrollment
1993bachelor’s
degreecompletions
1993 full-time faculty
Total (number)............. 9,419,000 917,900 435,000 12,324,000 1,142,562 545,706
(Percent distribution) (Percent distribution)American Indian/
Alaska Native...................... 0.7 0.4 0.2 0.9 0.5 0.4Asian/Pacific Islander ........... 1.8 1.5 2.2 5.1 4.4 4.6Black, non-Hispanic............... 10.0 6.4 4.4 10.5 6.7 4.7Hispanic..................................... 3.8 2.0 1.4 7.5 3.9 2.2White, non-Hispanic.............. 82.1 88.0 91.7 73.8 81.7 85.9Nonresident alien .................. 1.5 1.7 NA 2.1 2.8 2.0
NA: Not available. Data for nonresident alien full-time faculty were not collected.
NOTE: Because of rounding, percents may not add to 100.
SOURCE: U.S. Equal Employment Opportunity Commission, “EEO-6 Higher Education Staff Information” survey, unpublished data, 1975; U.S. Departmentof Education, National Center for Education Research, High Education General Information Survey (HEGIS), “Fall Enrollment” survey, 1976 and “Degreesand Other Formal Awards Conferred” survey, 1976; Integrated Postsecondary Enrollment Data System (IPEDS), “Fall Staff”” survey, 1993, “FallEnrollment” survey, 1993, and “Completions” survey, 1993. (Enrollment) NCES, Digest of Education Statistics, 1996, table 203, p. 208; (Completions)NCES, Degrees Conferred in Institutions of Higher Education, by Race/Ethnicity and Sex: 1976-77 through 1986-87, table 2, p. 19, 1990; and (Faculty)NCES, Digest of Education Statistics, 1996, table 221, p. 231, 1996.
DISTRIBUTION OF FULL-TIME FACULTY BY
INSTITUTION CONTROL AND LEVEL
In this section, American Indian and Alaska Native faculty are
compared on the basis of their employment in IHEs by control and
level.
Distribution by control and level. American Indian and Alaska
Native faculty were more likely than the total faculty to be employed in public
and 2-year institutions (table 6-4). About 84 percent of all (full- and part-time)
Native American faculty were employed in public institutions compared with
about 71 percent of all faculty. Among all American Indian and Alaska Native
faculty, about 49 percent were in 2-year institutions compared with 32 percent
for the total. For full-time faculty, these figures were 39 percent and 19 percent,
respectively.
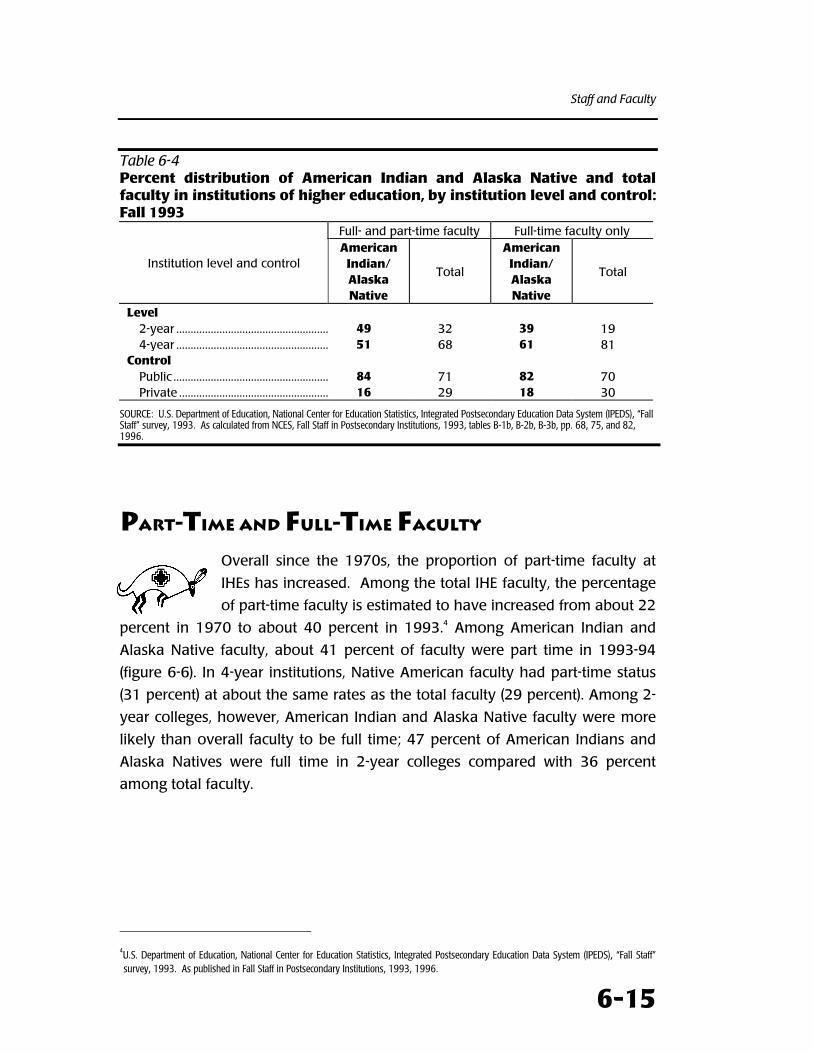
Staff and Faculty
6-15
Table 6-4Percent distribution of American Indian and Alaska Native and totalfaculty in institutions of higher education, by institution level and control:Fall 1993
Full- and part-time faculty Full-time faculty only
Institution level and controlAmerican
Indian/AlaskaNative
Total
AmericanIndian/AlaskaNative
Total
Level2-year ..................................................... 49 32 39 194-year ..................................................... 51 68 61 81
ControlPublic ...................................................... 84 71 82 70Private .................................................... 16 29 18 30
SOURCE: U.S. Department of Education, National Center for Education Statistics, Integrated Postsecondary Education Data System (IPEDS), “FallStaff” survey, 1993. As calculated from NCES, Fall Staff in Postsecondary Institutions, 1993, tables B-1b, B-2b, B-3b, pp. 68, 75, and 82,1996.
PART-TIME AND FULL-TIME FACULTY
Overall since the 1970s, the proportion of part-time faculty at
IHEs has increased. Among the total IHE faculty, the percentage
of part-time faculty is estimated to have increased from about 22
percent in 1970 to about 40 percent in 1993.4 Among American Indian and
Alaska Native faculty, about 41 percent of faculty were part time in 1993-94
(figure 6-6). In 4-year institutions, Native American faculty had part-time status
(31 percent) at about the same rates as the total faculty (29 percent). Among 2-
year colleges, however, American Indian and Alaska Native faculty were more
likely than overall faculty to be full time; 47 percent of American Indians and
Alaska Natives were full time in 2-year colleges compared with 36 percent
among total faculty.
4U.S. Department of Education, National Center for Education Statistics, Integrated Postsecondary Education Data System (IPEDS), “Fall Staff”survey, 1993. As published in Fall Staff in Postsecondary Institutions, 1993, 1996.
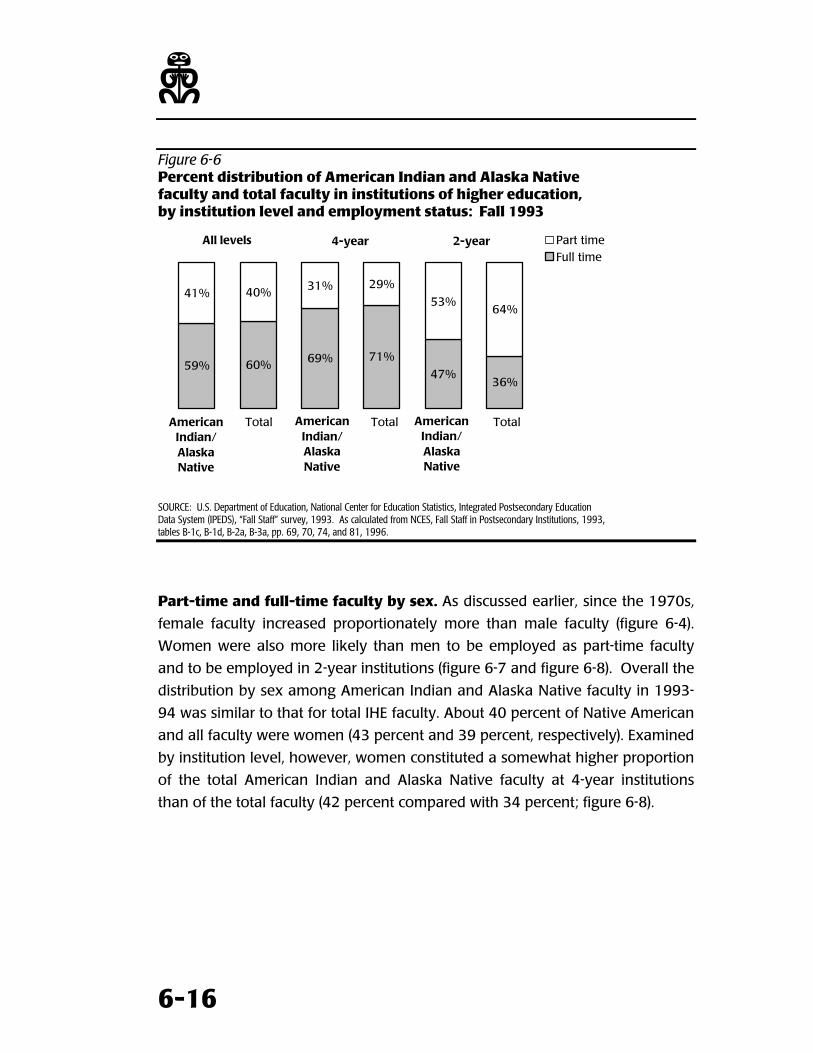
z
6-16
Figure 6-6Percent distribution of American Indian and Alaska Nativefaculty and total faculty in institutions of higher education,by institution level and employment status: Fall 1993
59% 60% 69% 71%
47%36%
41% 40% 31% 29%
53%64%
Part timeFull time
American Indian/Alaska Native
Total American Indian/Alaska Native
American Indian/Alaska Native
All levels 4-year 2-year
Total Total
SOURCE: U.S. Department of Education, National Center for Education Statistics, Integrated Postsecondary EducationData System (IPEDS), “Fall Staff” survey, 1993. As calculated from NCES, Fall Staff in Postsecondary Institutions, 1993,tables B-1c, B-1d, B-2a, B-3a, pp. 69, 70, 74, and 81, 1996.
Part-time and full-time faculty by sex. As discussed earlier, since the 1970s,
female faculty increased proportionately more than male faculty (figure 6-4).
Women were also more likely than men to be employed as part-time faculty
and to be employed in 2-year institutions (figure 6-7 and figure 6-8). Overall the
distribution by sex among American Indian and Alaska Native faculty in 1993-
94 was similar to that for total IHE faculty. About 40 percent of Native American
and all faculty were women (43 percent and 39 percent, respectively). Examined
by institution level, however, women constituted a somewhat higher proportion
of the total American Indian and Alaska Native faculty at 4-year institutions
than of the total faculty (42 percent compared with 34 percent; figure 6-8).
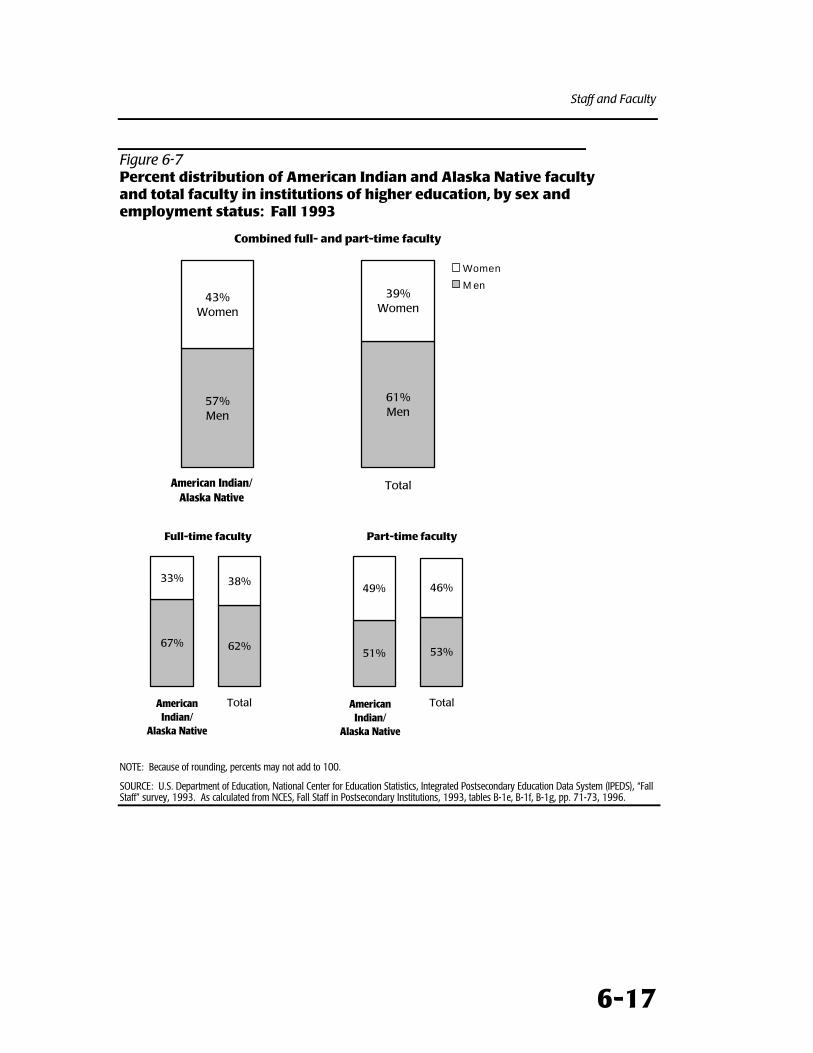
Staff and Faculty
6-17
Figure 6-7Percent distribution of American Indian and Alaska Native facultyand total faculty in institutions of higher education, by sex andemployment status: Fall 1993
Combined full- and part-time faculty
57%Men
61%Men
43%Women
39%Women
American Indian/Alaska Native
Total
Women
M en
American Indian/Alaska Native
67% 62%51% 53%
33% 38%49% 46%
Total Total
Full-time faculty Part-time faculty
AmericanIndian/
Alaska Native
AmericanIndian/
Alaska Native
NOTE: Because of rounding, percents may not add to 100.
SOURCE: U.S. Department of Education, National Center for Education Statistics, Integrated Postsecondary Education Data System (IPEDS), “FallStaff” survey, 1993. As calculated from NCES, Fall Staff in Postsecondary Institutions, 1993, tables B-1e, B-1f, B-1g, pp. 71-73, 1996.
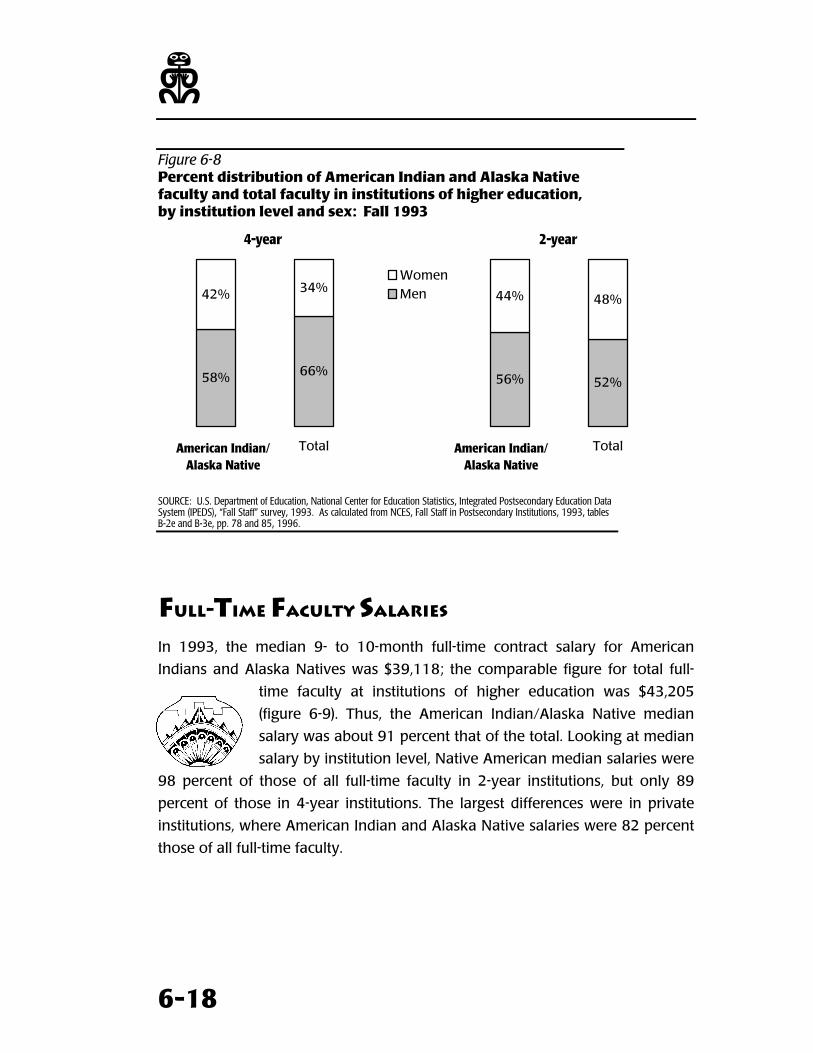
z
6-18
Figure 6-8Percent distribution of American Indian and Alaska Nativefaculty and total faculty in institutions of higher education,by institution level and sex: Fall 1993
58% 66%56% 52%
42% 34%44% 48%
AmericanIndian/
Alaska Native
Total AmericanIndian/
Alaska Native
Total
WomenMen
4-year 2-year
American Indian/Alaska Native
American Indian/Alaska Native
SOURCE: U.S. Department of Education, National Center for Education Statistics, Integrated Postsecondary Education DataSystem (IPEDS), “Fall Staff” survey, 1993. As calculated from NCES, Fall Staff in Postsecondary Institutions, 1993, tablesB-2e and B-3e, pp. 78 and 85, 1996.
FULL-TIME FACULTY SALARIES
In 1993, the median 9- to 10-month full-time contract salary for American
Indians and Alaska Natives was $39,118; the comparable figure for total full-
time faculty at institutions of higher education was $43,205
(figure 6-9). Thus, the American Indian/Alaska Native median
salary was about 91 percent that of the total. Looking at median
salary by institution level, Native American median salaries were
98 percent of those of all full-time faculty in 2-year institutions, but only 89
percent of those in 4-year institutions. The largest differences were in private
institutions, where American Indian and Alaska Native salaries were 82 percent
those of all full-time faculty.
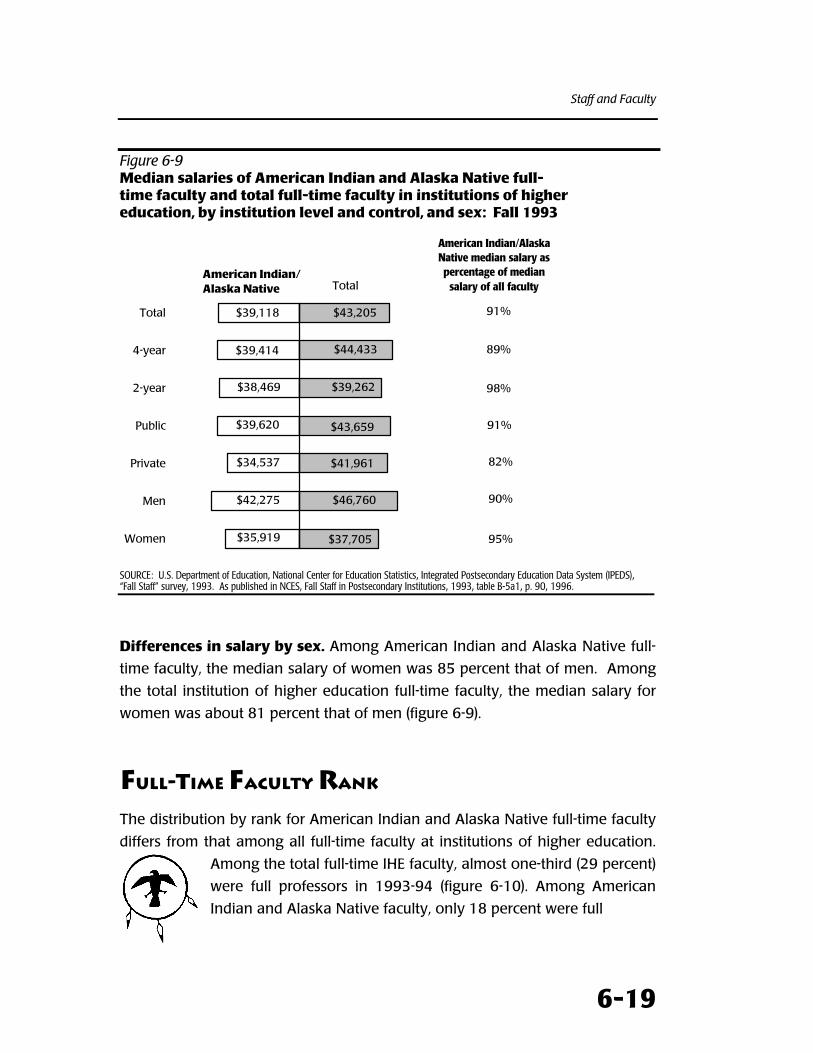
Staff and Faculty
6-19
Figure 6-9Median salaries of American Indian and Alaska Native full-time faculty and total full-time faculty in institutions of highereducation, by institution level and control, and sex: Fall 1993
$39,118
$39,414
$38,469
$39,620
$34,537
$42,275
$35,919
$43,205
$44,433
$39,262
$43,659
$41,961
$46,760
$37,705Women
Men
Private
Public
2-year
4-year
Total
American Indian/Alaska Native Total
91%
89%
98%
91%
82%
90%
95%
American Indian/Alaska Native median salary as percentage of median
salary of all faculty
SOURCE: U.S. Department of Education, National Center for Education Statistics, Integrated Postsecondary Education Data System (IPEDS),“Fall Staff” survey, 1993. As published in NCES, Fall Staff in Postsecondary Institutions, 1993, table B-5a1, p. 90, 1996.
Differences in salary by sex. Among American Indian and Alaska Native full-
time faculty, the median salary of women was 85 percent that of men. Among
the total institution of higher education full-time faculty, the median salary for
women was about 81 percent that of men (figure 6-9).
FULL-TIME FACULTY RANK
The distribution by rank for American Indian and Alaska Native full-time faculty
differs from that among all full-time faculty at institutions of higher education.
Among the total full-time IHE faculty, almost one-third (29 percent)
were full professors in 1993-94 (figure 6-10). Among American
Indian and Alaska Native faculty, only 18 percent were full
z
6-20
professors. The largest percentage of American Indians and Alaska Natives held
the rank of lecturer or instructor (33 percent).
Figure 6-10Percent distribution of American Indian and Alaska Native full-time faculty and total full-time faculty in institutions of highereducation, by rank: Fall 1993
13%
33%
15%
22%
24%
14%
22%
18%29%
American Indian/ka Native full-time faculty
Total
Full professor
Associate professor
Assistant professor
Lecturer, instructor
Other
American Indian/ Alaska Native
11%
NOTE: Because of rounding, percents may not add to 100.
SOURCE: U.S. Department of Education, National Center for Education Statistics, Integrated Postsecondary Education DataSystem (IPEDS), “Fall Staff” survey, 1993. As published in NCES, Fall Staff in Postsecondary Institutions, 1993, table B-7a1, p. 106, 1996.
Trend over time in rank distribution. National data on full-time faculty rank
by race/ethnicity first became available in 1981. A comparison of the 1981
distribution and the distribution in the early 1990s shows little change in rank
distribution (summary table S6-4). American Indians and Alaska Natives were
0.2 percent of full professors in both 1981 and 1993. The largest increase in
American Indian and Alaska Native faculty as a proportion of total faculty
occurred in the rank of instructors. In 1981, Native American faculty were 0.4
percent of total instructors; by 1993, they were 0.9 percent of this group.
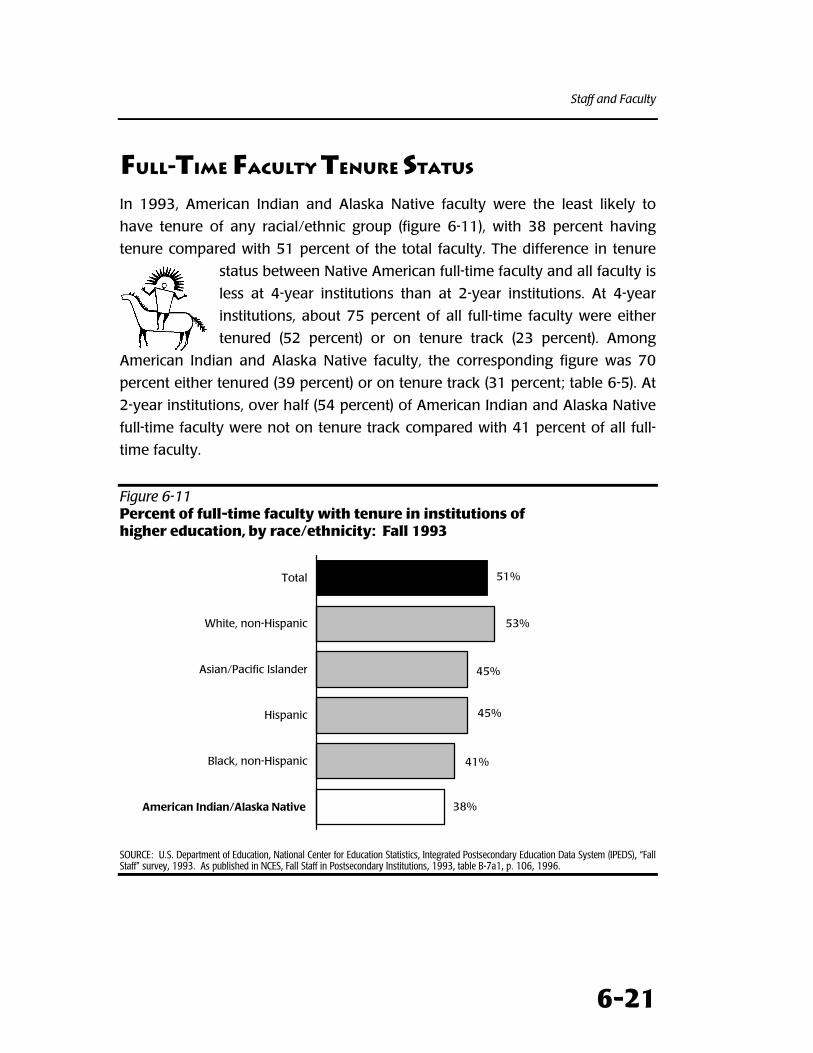
Staff and Faculty
6-21
FULL-TIME FACULTY TENURE STATUS
In 1993, American Indian and Alaska Native faculty were the least likely to
have tenure of any racial/ethnic group (figure 6-11), with 38 percent having
tenure compared with 51 percent of the total faculty. The difference in tenure
status between Native American full-time faculty and all faculty is
less at 4-year institutions than at 2-year institutions. At 4-year
institutions, about 75 percent of all full-time faculty were either
tenured (52 percent) or on tenure track (23 percent). Among
American Indian and Alaska Native faculty, the corresponding figure was 70
percent either tenured (39 percent) or on tenure track (31 percent; table 6-5). At
2-year institutions, over half (54 percent) of American Indian and Alaska Native
full-time faculty were not on tenure track compared with 41 percent of all full-
time faculty.
Figure 6-11Percent of full-time faculty with tenure in institutions ofhigher education, by race/ethnicity: Fall 1993
45%
51%
53%
45%
41%
38%American Indian or Alaska
Native
Black, non-Hispanic
Hispanic
Asian/Pacific Islander
White, non-Hispanic
Total
American Indian/Alaska Native
SOURCE: U.S. Department of Education, National Center for Education Statistics, Integrated Postsecondary Education Data System (IPEDS), “FallStaff” survey, 1993. As published in NCES, Fall Staff in Postsecondary Institutions, 1993, table B-7a1, p. 106, 1996.
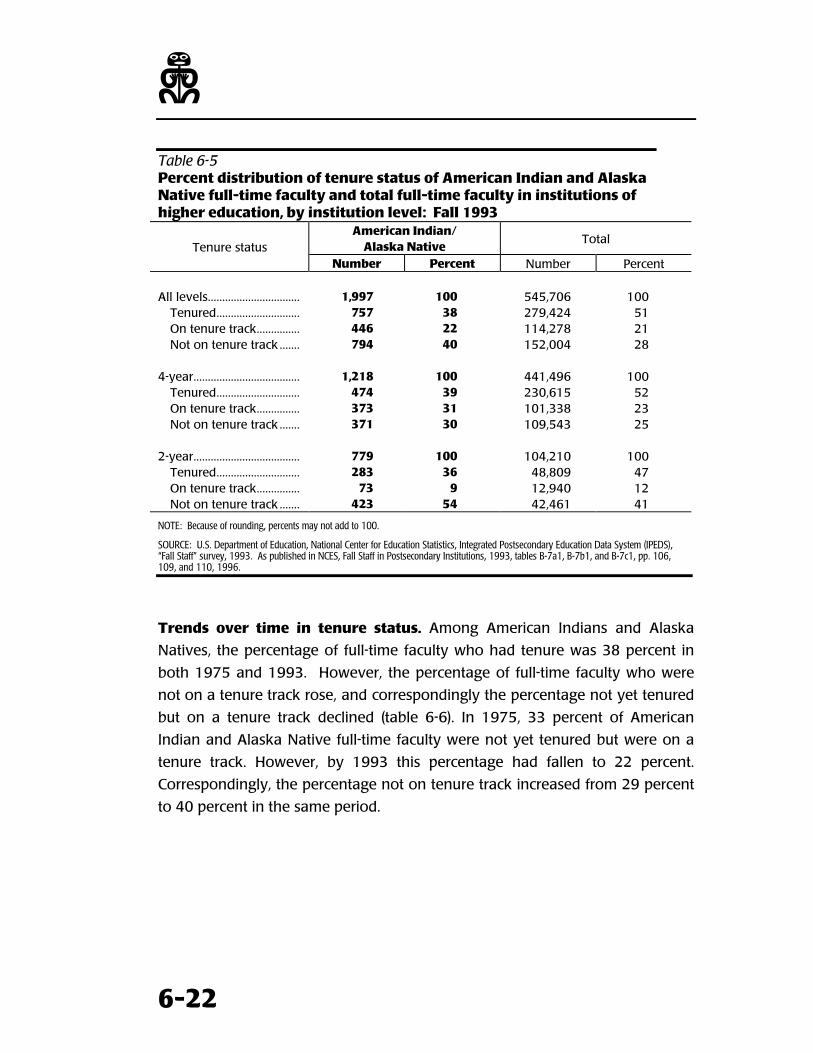
z
6-22
Table 6-5Percent distribution of tenure status of American Indian and AlaskaNative full-time faculty and total full-time faculty in institutions ofhigher education, by institution level: Fall 1993
American Indian/Alaska Native
TotalTenure status
Number Percent Number Percent
All levels................................ 1,997 100 545,706 100Tenured............................. 757 38 279,424 51On tenure track............... 446 22 114,278 21Not on tenure track ....... 794 40 152,004 28
4-year..................................... 1,218 100 441,496 100Tenured............................. 474 39 230,615 52On tenure track............... 373 31 101,338 23Not on tenure track ....... 371 30 109,543 25
2-year..................................... 779 100 104,210 100Tenured............................. 283 36 48,809 47On tenure track............... 73 9 12,940 12Not on tenure track ....... 423 54 42,461 41
NOTE: Because of rounding, percents may not add to 100.
SOURCE: U.S. Department of Education, National Center for Education Statistics, Integrated Postsecondary Education Data System (IPEDS),“Fall Staff” survey, 1993. As published in NCES, Fall Staff in Postsecondary Institutions, 1993, tables B-7a1, B-7b1, and B-7c1, pp. 106,109, and 110, 1996.
Trends over time in tenure status. Among American Indians and Alaska
Natives, the percentage of full-time faculty who had tenure was 38 percent in
both 1975 and 1993. However, the percentage of full-time faculty who were
not on a tenure track rose, and correspondingly the percentage not yet tenured
but on a tenure track declined (table 6-6). In 1975, 33 percent of American
Indian and Alaska Native full-time faculty were not yet tenured but were on a
tenure track. However, by 1993 this percentage had fallen to 22 percent.
Correspondingly, the percentage not on tenure track increased from 29 percent
to 40 percent in the same period.
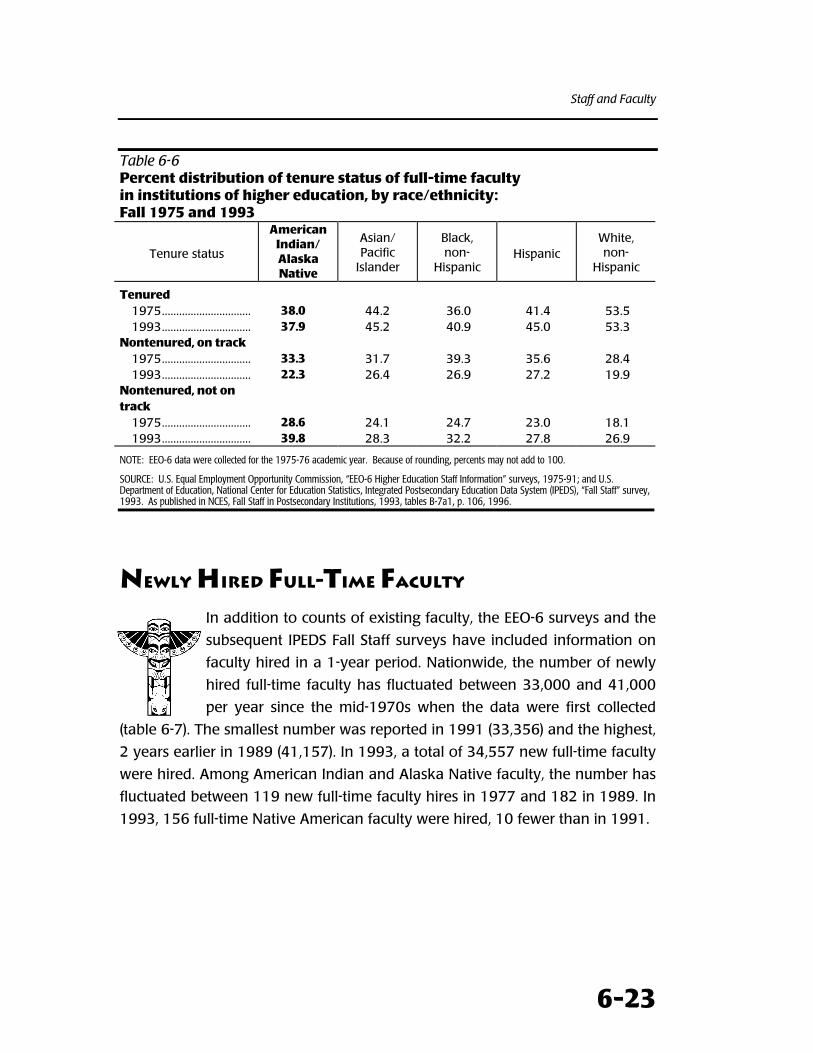
Staff and Faculty
6-23
Table 6-6Percent distribution of tenure status of full-time facultyin institutions of higher education, by race/ethnicity:Fall 1975 and 1993
Tenure status
AmericanIndian/AlaskaNative
Asian/Pacific
Islander
Black,non-
HispanicHispanic
White,non-
Hispanic
Tenured1975............................... 38.0 44.2 36.0 41.4 53.51993............................... 37.9 45.2 40.9 45.0 53.3
Nontenured, on track1975............................... 33.3 31.7 39.3 35.6 28.41993............................... 22.3 26.4 26.9 27.2 19.9
Nontenured, not ontrack
1975............................... 28.6 24.1 24.7 23.0 18.11993............................... 39.8 28.3 32.2 27.8 26.9
NOTE: EEO-6 data were collected for the 1975-76 academic year. Because of rounding, percents may not add to 100.
SOURCE: U.S. Equal Employment Opportunity Commission, “EEO-6 Higher Education Staff Information” surveys, 1975-91; and U.S.Department of Education, National Center for Education Statistics, Integrated Postsecondary Education Data System (IPEDS), “Fall Staff” survey,1993. As published in NCES, Fall Staff in Postsecondary Institutions, 1993, tables B-7a1, p. 106, 1996.
NEWLY HIRED FULL-TIME FACULTY
In addition to counts of existing faculty, the EEO-6 surveys and the
subsequent IPEDS Fall Staff surveys have included information on
faculty hired in a 1-year period. Nationwide, the number of newly
hired full-time faculty has fluctuated between 33,000 and 41,000
per year since the mid-1970s when the data were first collected
(table 6-7). The smallest number was reported in 1991 (33,356) and the highest,
2 years earlier in 1989 (41,157). In 1993, a total of 34,557 new full-time faculty
were hired. Among American Indian and Alaska Native faculty, the number has
fluctuated between 119 new full-time faculty hires in 1977 and 182 in 1989. In
1993, 156 full-time Native American faculty were hired, 10 fewer than in 1991.
z
6-24
Table 6-7Number of new full-time faculty hires in institutions of highereducation, by race/ethnicity: Selected years, 1977 to 1993
Year Total
AmericanIndian/AlaskaNative
Asian/Pacific
Islander
Black,non-
HispanicHispanic
White,non-
Hispanic
Non-resident
alien
Institutionsreporting
1977.......... 37,302 119 1,264 2,004 690 33,225 NA 3,0311989.......... 41,157 182 2,694 2,675 1,218 34,388 NA 3,4521991.......... 33,356 166 2,507 2,324 1,200 27,159 NA 3,2851993.......... 34,557 156 1,838 2,190 1,081 27,419 1,609 3,670NA: Not available; 1993 was the first year that nonresident alien was a separate staff category. For this reason, the number of new hires between1991 and 1993 decreased in certain categories, especially Asian or Pacific Islander.
NOTE: Between 1977 and 1991, the number of institutions reporting varies by year; 1993 data were imputed to cover 3,670 institutions. Therace/ethnicity unknown category, which is included in the total but not shown in the table, had 264 new hires in 1993.
SOURCE: U.S. Equal Employment Opportunity Commission, “EEO-6 Higher Education Staff Information” surveys, 1977, 1989, and 1991; U.S.Department of Education, National Center for Education Statistics, Integrated Postsecondary Education Data System (IPEDS), “Fall Staff” survey, 1993.As published in NCES, Fall Staff in Postsecondary Institutions, 1993, table 12, p. 38, 1996.
Considered as a proportion of newly hired faculty, American Indians and Alaska
Natives were about 0.5 percent of the total in 1993 (figure 6-12). This was
about 0.1 percent more than they were of the total full-time faculty in the same
year.
The extent to which new hires result in a net gain in full-time faculty is
influenced by several factors, including retirements and other exits from
academia, as well as the frequency of faculty moving from institution to
institution. Consequently, a portion of the new faculty hired each year
represents transfers of faculty among institutions. Estimates of the total number
of new faculty first-time hires over the 10-year period of 1981 to 1991 were
made using the EEO-6 data for the odd years and estimating the even year new
hires.5 The researchers found an estimated total of about 390,466 new full-
time hires between 1981 and 1991 (summary table S6-5) and a net gain of
about 53,247 faculty. They estimated 2,031 full-time American Indian and
Alaska Native faculty were newly hired between 1981 to 1991, but they
estimated a net gain of only about 224 faculty.
5D. Carter and E. O’Brien, “Employment and Hiring Patterns for Faculty of Color,” American Council on Education Research Briefs, Vol. 4, No. 6,1993.
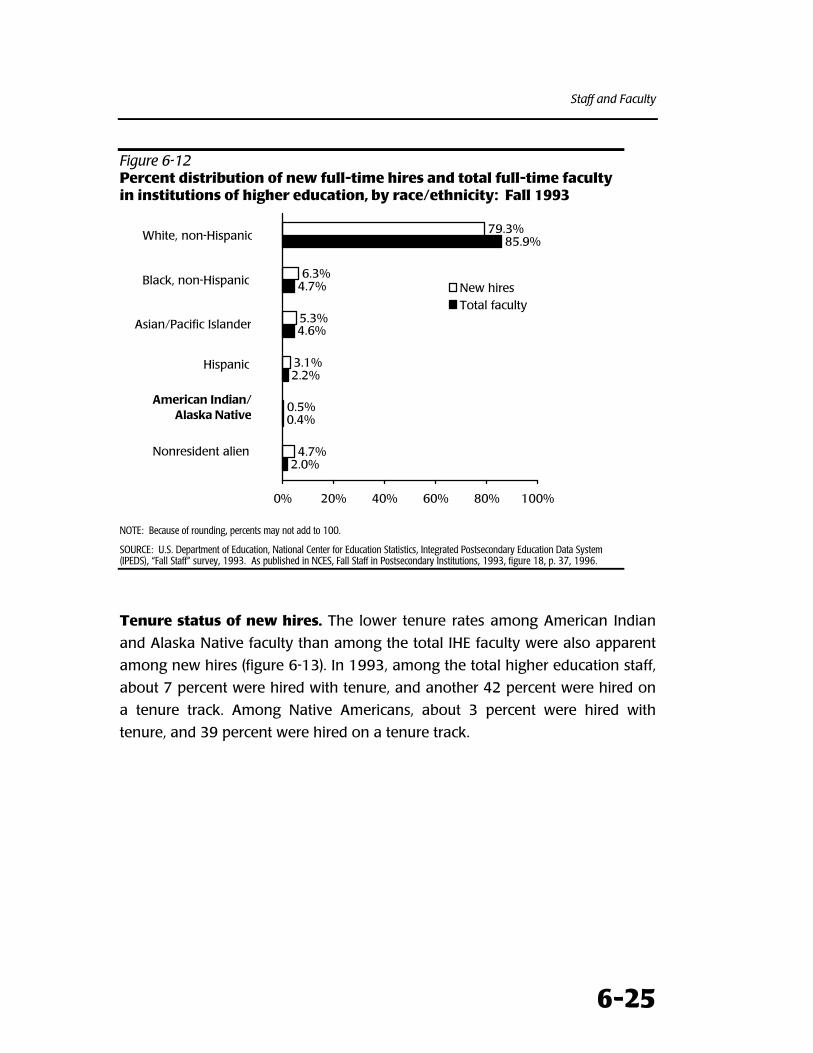
Staff and Faculty
6-25
Figure 6-12Percent distribution of new full-time hires and total full-time facultyin institutions of higher education, by race/ethnicity: Fall 1993
2.0%
0.4%
2.2%
4.6%
4.7%
85.9%
4.7%
0.5%
3.1%
5.3%
6.3%
79.3%
0% 20% 40% 60% 80% 100%
New hiresTotal faculty
White, non-Hispanic
Black, non-Hispanic
Asian/Pacific Islander
Hispanic
American Indian/Alaska Native
Nonresident alien
NOTE: Because of rounding, percents may not add to 100.
SOURCE: U.S. Department of Education, National Center for Education Statistics, Integrated Postsecondary Education Data System(IPEDS), “Fall Staff” survey, 1993. As published in NCES, Fall Staff in Postsecondary Institutions, 1993, figure 18, p. 37, 1996.
Tenure status of new hires. The lower tenure rates among American Indian
and Alaska Native faculty than among the total IHE faculty were also apparent
among new hires (figure 6-13). In 1993, among the total higher education staff,
about 7 percent were hired with tenure, and another 42 percent were hired on
a tenure track. Among Native Americans, about 3 percent were hired with
tenure, and 39 percent were hired on a tenure track.
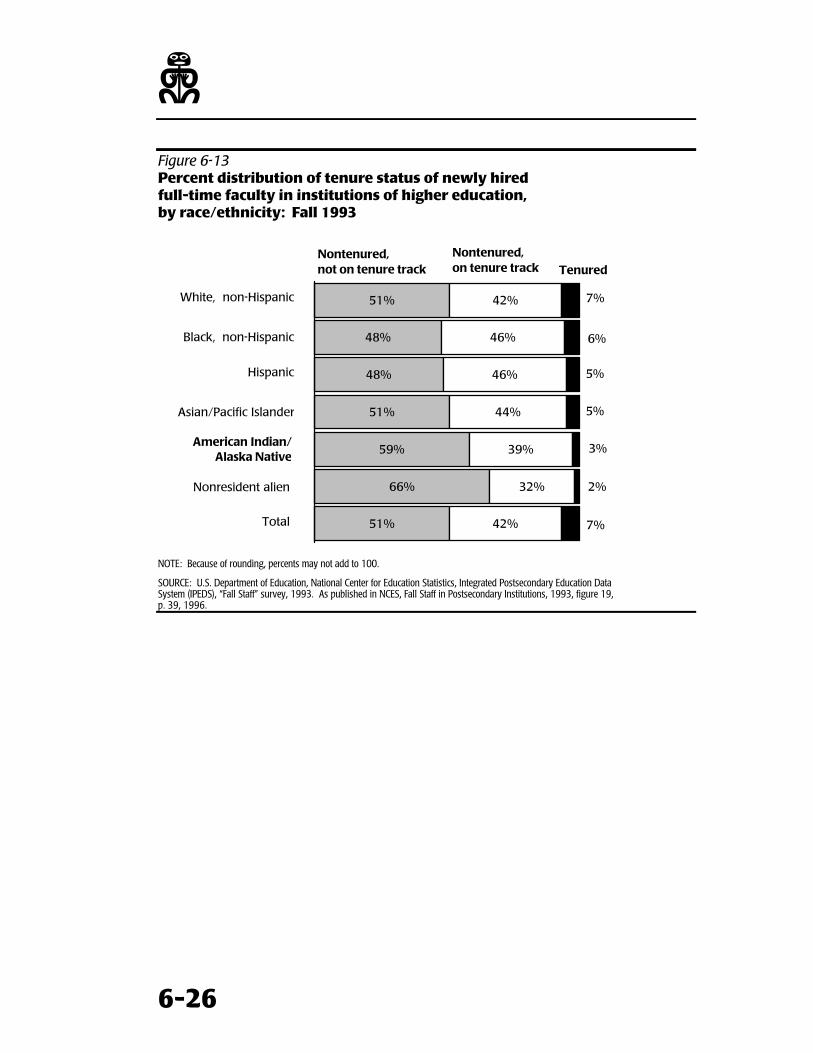
z
6-26
Figure 6-13Percent distribution of tenure status of newly hiredfull-time faculty in institutions of higher education,by race/ethnicity: Fall 1993
51%
66%
59%
51%
48%
51%
42%
32%
39%
44%
46%
46%
42%
48%
5%
7%
2%
3%
5%
6%
7%
Nontenured, not on tenure track
Nontenured, on tenure track Tenured
Black, non-Hispanic
White, non-Hispanic
Hispanic
Asian/Pacific Islander
American Indian/Alaska Native
Nonresident alien
Total
NOTE: Because of rounding, percents may not add to 100.
SOURCE: U.S. Department of Education, National Center for Education Statistics, Integrated Postsecondary Education DataSystem (IPEDS), “Fall Staff” survey, 1993. As published in NCES, Fall Staff in Postsecondary Institutions, 1993, figure 19,p. 39, 1996.
Staff and Faculty
6-27
LOCATION OF AMERICAN INDIAN AND
ALASKA NATIVE STAFF AND FACULTY
While there were some differences in the specific institutions where
the largest numbers of American Indian and Alaska Native staff and
faculty were employed, most staff and faculty were located in the
same areas where large numbers of Native Americans resided (see
figure 1-4).
Number of staff. The five largest employers of Native American staff
included Navajo Community College with 237, University of New
Mexico-Main Campus with 221, University of Oklahoma-Norman
Campus with 219, Oklahoma State-Main Campus with 209, and
Haskell Indian Junior College with 194 (table 6-8). Two of these
institutions are considered tribal colleges (Navajo Community College and
Haskell Indian Junior College).6 All 5 of these institutions were among the top
12 colleges in terms of number of degrees awarded to American Indian and
Alaska students (table 4-6).
Percent of staff. Institutions with the largest percentages of American Indian
and Alaska Native staff were Haskell Indian Nations University (87 percent of
the total staff), Oglala Lakota College (81 percent), Stone Child College (80
percent), and Turtle Mountain Community College (79 percent; table 6-8). All
four of these institutions have predominately American Indian/Alaska Native
enrollment (see chapter 3) and all are tribal colleges.7
6See chapter 7 for a detailed discussion of tribal colleges.
7Note 6.
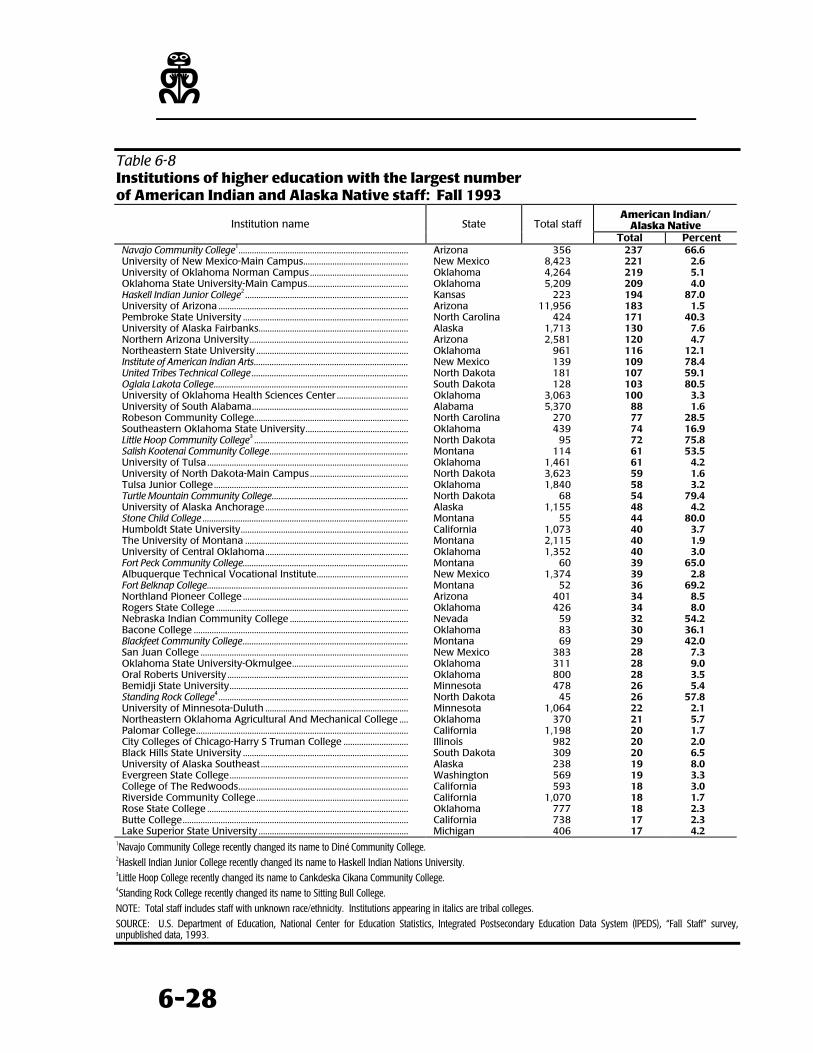
z
6-28
Table 6-8Institutions of higher education with the largest numberof American Indian and Alaska Native staff: Fall 1993
American Indian/Alaska NativeInstitution name State Total staff
Total PercentNavajo Community College1............................................................................ Arizona 356 237 66.6University of New Mexico-Main Campus............................................... New Mexico 8,423 221 2.6University of Oklahoma Norman Campus............................................ Oklahoma 4,264 219 5.1Oklahoma State University-Main Campus............................................. Oklahoma 5,209 209 4.0Haskell Indian Junior College2 ......................................................................... Kansas 223 194 87.0University of Arizona ..................................................................................... Arizona 11,956 183 1.5Pembroke State University .......................................................................... North Carolina 424 171 40.3University of Alaska Fairbanks................................................................... Alaska 1,713 130 7.6Northern Arizona University....................................................................... Arizona 2,581 120 4.7Northeastern State University .................................................................... Oklahoma 961 116 12.1Institute of American Indian Arts..................................................................... New Mexico 139 109 78.4United Tribes Technical College ...................................................................... North Dakota 181 107 59.1Oglala Lakota College....................................................................................... South Dakota 128 103 80.5University of Oklahoma Health Sciences Center ................................ Oklahoma 3,063 100 3.3University of South Alabama...................................................................... Alabama 5,370 88 1.6Robeson Community College..................................................................... North Carolina 270 77 28.5Southeastern Oklahoma State University.............................................. Oklahoma 439 74 16.9Little Hoop Community College3 ..................................................................... North Dakota 95 72 75.8Salish Kootenai Community College.............................................................. Montana 114 61 53.5University of Tulsa.......................................................................................... Oklahoma 1,461 61 4.2University of North Dakota-Main Campus............................................ North Dakota 3,623 59 1.6Tulsa Junior College....................................................................................... Oklahoma 1,840 58 3.2Turtle Mountain Community College............................................................. North Dakota 68 54 79.4University of Alaska Anchorage................................................................ Alaska 1,155 48 4.2Stone Child College ............................................................................................ Montana 55 44 80.0Humboldt State University........................................................................... California 1,073 40 3.7The University of Montana ......................................................................... Montana 2,115 40 1.9University of Central Oklahoma................................................................ Oklahoma 1,352 40 3.0Fort Peck Community College.......................................................................... Montana 60 39 65.0Albuquerque Technical Vocational Institute......................................... New Mexico 1,374 39 2.8Fort Belknap College.......................................................................................... Montana 52 36 69.2Northland Pioneer College .......................................................................... Arizona 401 34 8.5Rogers State College ...................................................................................... Oklahoma 426 34 8.0Nebraska Indian Community College ..................................................... Nevada 59 32 54.2Bacone College ................................................................................................ Oklahoma 83 30 36.1Blackfeet Community College.......................................................................... Montana 69 29 42.0San Juan College ............................................................................................. New Mexico 383 28 7.3Oklahoma State University-Okmulgee.................................................... Oklahoma 311 28 9.0Oral Roberts University ................................................................................. Oklahoma 800 28 3.5Bemidji State University................................................................................ Minnesota 478 26 5.4Standing Rock College4..................................................................................... North Dakota 45 26 57.8University of Minnesota-Duluth ................................................................ Minnesota 1,064 22 2.1Northeastern Oklahoma Agricultural And Mechanical College .... Oklahoma 370 21 5.7Palomar College............................................................................................... California 1,198 20 1.7City Colleges of Chicago-Harry S Truman College ............................. Illinois 982 20 2.0Black Hills State University .......................................................................... South Dakota 309 20 6.5University of Alaska Southeast .................................................................. Alaska 238 19 8.0Evergreen State College................................................................................ Washington 569 19 3.3College of The Redwoods............................................................................ California 593 18 3.0Riverside Community College.................................................................... California 1,070 18 1.7Rose State College .......................................................................................... Oklahoma 777 18 2.3Butte College..................................................................................................... California 738 17 2.3Lake Superior State University ................................................................... Michigan 406 17 4.2
1Navajo Community College recently changed its name to Diné Community College.2Haskell Indian Junior College recently changed its name to Haskell Indian Nations University.3Little Hoop College recently changed its name to Cankdeska Cikana Community College.4Standing Rock College recently changed its name to Sitting Bull College.
NOTE: Total staff includes staff with unknown race/ethnicity. Institutions appearing in italics are tribal colleges.
SOURCE: U.S. Department of Education, National Center for Education Statistics, Integrated Postsecondary Education Data System (IPEDS), “Fall Staff” survey,unpublished data, 1993.
Staff and Faculty
6-29
Faculty employment. In terms of total faculty, the largest numbers of American
Indians and Alaska Natives were found at Navajo Community College with 51,
University of New Mexico-Main Campus with 46, Robeson Community College
with 42, Southeastern Oklahoma State University with 32, Haskell Indian Junior
College with 28, Institute of American Indian Arts and Turtle Mountain
Community College with 25 each, and University of Alaska-Fairbanks with 24
(table 6-9). Haskell Indian Junior College, Institute of American Indian Arts, and
Turtle Mountain Community College are all tribal colleges.8
American Indian and Alaska Natives were the largest percentage of faculty at
Turtle Mountain Community College (69 percent), Institute of American Indian
Arts (66 percent), Fort Belknap College (56 percent), and Haskell Indian Junior
College (54 percent; table 6-9). All of these institutions are tribal colleges.
In terms of states, the largest number of American Indian and Alaska Native
faculty were found in California with 690, Oklahoma with 257, and Texas with
210 (summary table S6-6).
8 See chapter 7 for a detailed discussion of tribal colleges.
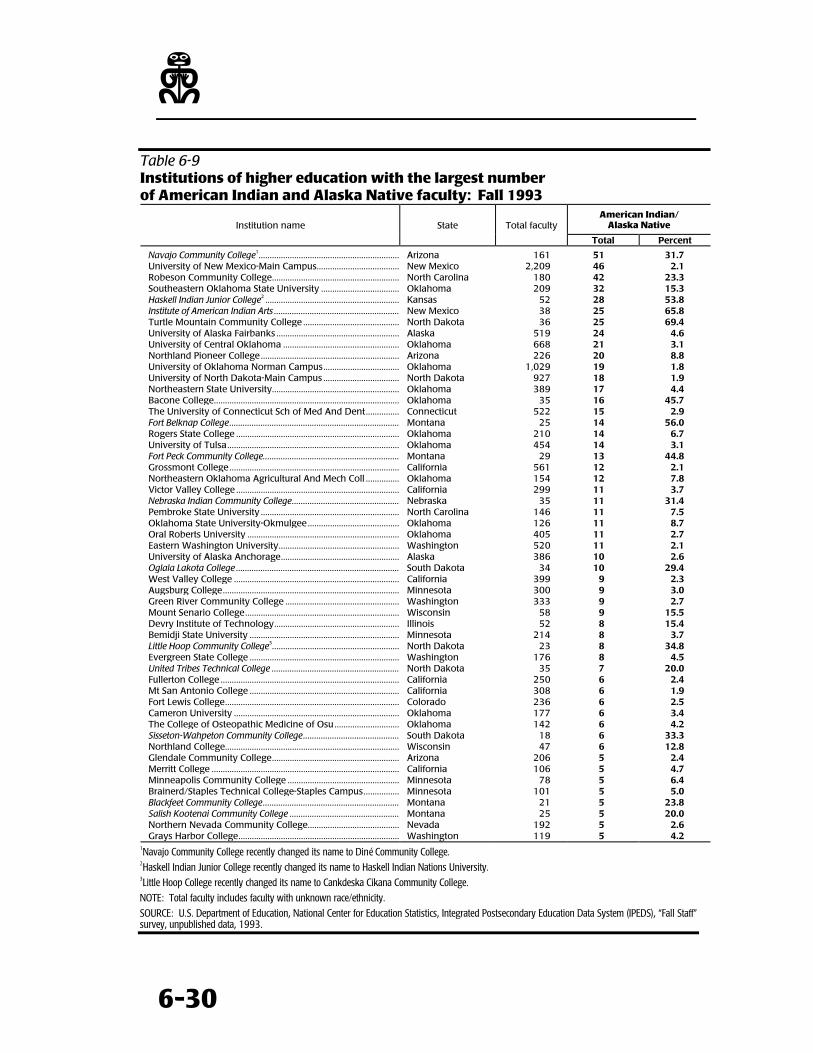
z
6-30
Table 6-9Institutions of higher education with the largest numberof American Indian and Alaska Native faculty: Fall 1993
American Indian/Alaska NativeInstitution name State Total faculty
Total Percent
Navajo Community College1............................................................... Arizona 161 51 31.7University of New Mexico-Main Campus..................................... New Mexico 2,209 46 2.1Robeson Community College......................................................... North Carolina 180 42 23.3Southeastern Oklahoma State University ................................... Oklahoma 209 32 15.3Haskell Indian Junior College2 ............................................................ Kansas 52 28 53.8Institute of American Indian Arts ........................................................ New Mexico 38 25 65.8Turtle Mountain Community College ........................................... North Dakota 36 25 69.4University of Alaska Fairbanks ....................................................... Alaska 519 24 4.6University of Central Oklahoma .................................................... Oklahoma 668 21 3.1Northland Pioneer College.............................................................. Arizona 226 20 8.8University of Oklahoma Norman Campus.................................. Oklahoma 1,029 19 1.8University of North Dakota-Main Campus .................................. North Dakota 927 18 1.9Northeastern State University......................................................... Oklahoma 389 17 4.4Bacone College................................................................................... Oklahoma 35 16 45.7The University of Connecticut Sch of Med And Dent............... Connecticut 522 15 2.9Fort Belknap College............................................................................ Montana 25 14 56.0Rogers State College ......................................................................... Oklahoma 210 14 6.7University of Tulsa............................................................................. Oklahoma 454 14 3.1Fort Peck Community College............................................................. Montana 29 13 44.8Grossmont College............................................................................ California 561 12 2.1Northeastern Oklahoma Agricultural And Mech Coll ............... Oklahoma 154 12 7.8Victor Valley College ......................................................................... California 299 11 3.7Nebraska Indian Community College................................................ Nebraska 35 11 31.4Pembroke State University .............................................................. North Carolina 146 11 7.5Oklahoma State University-Okmulgee......................................... Oklahoma 126 11 8.7Oral Roberts University .................................................................... Oklahoma 405 11 2.7Eastern Washington University...................................................... Washington 520 11 2.1University of Alaska Anchorage..................................................... Alaska 386 10 2.6Oglala Lakota College ......................................................................... South Dakota 34 10 29.4West Valley College .......................................................................... California 399 9 2.3Augsburg College............................................................................... Minnesota 300 9 3.0Green River Community College ................................................... Washington 333 9 2.7Mount Senario College..................................................................... Wisconsin 58 9 15.5Devry Institute of Technology........................................................ Illinois 52 8 15.4Bemidji State University ................................................................... Minnesota 214 8 3.7Little Hoop Community College3......................................................... North Dakota 23 8 34.8Evergreen State College ................................................................... Washington 176 8 4.5United Tribes Technical College ......................................................... North Dakota 35 7 20.0Fullerton College ................................................................................ California 250 6 2.4Mt San Antonio College ................................................................... California 308 6 1.9Fort Lewis College.............................................................................. Colorado 236 6 2.5Cameron University .......................................................................... Oklahoma 177 6 3.4The College of Osteopathic Medicine of Osu............................. Oklahoma 142 6 4.2Sisseton-Wahpeton Community College........................................... South Dakota 18 6 33.3Northland College.............................................................................. Wisconsin 47 6 12.8Glendale Community College......................................................... Arizona 206 5 2.4Merritt College .................................................................................... California 106 5 4.7Minneapolis Community College .................................................. Minnesota 78 5 6.4Brainerd/Staples Technical College-Staples Campus................ Minnesota 101 5 5.0Blackfeet Community College............................................................. Montana 21 5 23.8Salish Kootenai Community College ................................................. Montana 25 5 20.0Northern Nevada Community College......................................... Nevada 192 5 2.6Grays Harbor College........................................................................ Washington 119 5 4.2
1Navajo Community College recently changed its name to Diné Community College.2Haskell Indian Junior College recently changed its name to Haskell Indian Nations University.3Little Hoop College recently changed its name to Cankdeska Cikana Community College.
NOTE: Total faculty includes faculty with unknown race/ethnicity.
SOURCE: U.S. Department of Education, National Center for Education Statistics, Integrated Postsecondary Education Data System (IPEDS), “Fall Staff”survey, unpublished data, 1993.
Staff and Faculty
6-31
TRIBAL COLLEGE STAFF AND FACULTY
The development of tribal colleges represents the determination of
Native peoples to achieve academic excellence rooted in cultural
traditions.9 In addition to the goals of colleges in general, tribal
colleges have identified a set of goals that are intrinsic to their
mission. These include the following:
• Preserving and communicating traditional culture;
• Enhancing economic opportunity within the reservation community; and
• Improving health care at the community level through support orparticipation in alcohol and drug abuse programs.10
In keeping with this second objective, in particular, tribal colleges provide a
place of employment for Native Americans.
Staff employed in tribal colleges. The 26 tribal colleges reporting staffing
information to IPEDS in 1993 employed about 2,271 staff (table 6-10), about
half of whom (54 percent) were American Indians and Alaska Natives. Of the
781 total tribal college faculty, about 237 (or 30 percent) were American
Indians or Alaska Natives (table 6-11).
Faculty employed in tribal colleges. About 7 percent of the 3,407 American
Indian and Alaska Native faculty were employed in tribal colleges in 1993
(table 6-11 and summary table S6-1). Among the 1,997 Native American full-
time faculty, about 166 or 8 percent were employed in tribal colleges (table 6-9
and summary table S6-2).11 In 1994, about 8 percent of Native American
student enrollment was in tribal colleges (figure 7-4).
9C. Duran, “The Role of Libraries in American Tribal College Development.” College and Research Libraries, September 1991, p. 395.
10 Carnegie Foundation for the Advancement of Teaching, Tribal Colleges: Shaping the Future of Native America, 1989.
11Tribal college data used to calculate the percentage of Native American faculty in tribal colleges may include data from institutions that were
not recognized as institutions of higher education.
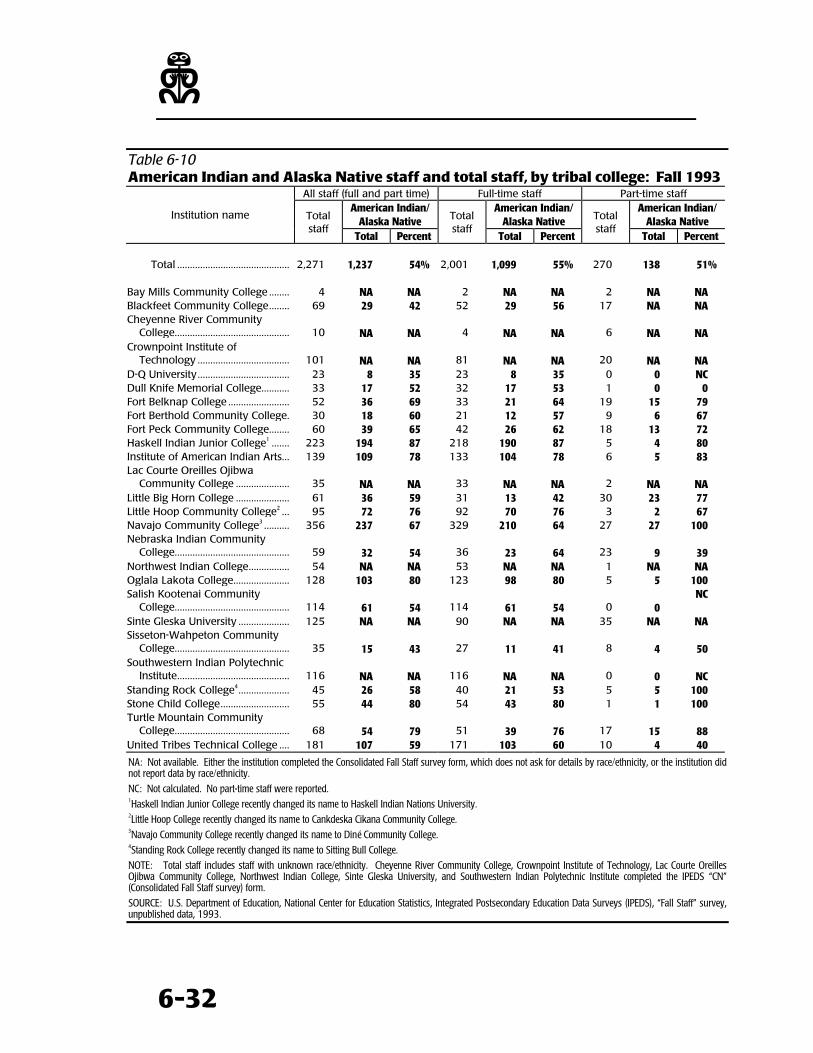
z
6-32
Table 6-10American Indian and Alaska Native staff and total staff, by tribal college: Fall 1993
All staff (full and part time) Full-time staff Part-time staffAmerican Indian/
Alaska NativeAmerican Indian/
Alaska NativeAmerican Indian/
Alaska NativeInstitution name Total
staffTotal Percent
Totalstaff
Total Percent
Totalstaff
Total Percent
Total ............................................ 2,271 1,237 54% 2,001 1,099 55% 270 138 51%
Bay Mills Community College ........ 4 NA NA 2 NA NA 2 NA NABlackfeet Community College........ 69 29 42 52 29 56 17 NA NACheyenne River Community
College............................................. 10 NA NA 4 NA NA 6 NA NACrownpoint Institute of
Technology .................................... 101 NA NA 81 NA NA 20 NA NAD-Q University.................................... 23 8 35 23 8 35 0 0 NCDull Knife Memorial College........... 33 17 52 32 17 53 1 0 0Fort Belknap College ........................ 52 36 69 33 21 64 19 15 79Fort Berthold Community College. 30 18 60 21 12 57 9 6 67Fort Peck Community College........ 60 39 65 42 26 62 18 13 72Haskell Indian Junior College1 ....... 223 194 87 218 190 87 5 4 80Institute of American Indian Arts... 139 109 78 133 104 78 6 5 83Lac Courte Oreilles Ojibwa
Community College ..................... 35 NA NA 33 NA NA 2 NA NALittle Big Horn College ..................... 61 36 59 31 13 42 30 23 77Little Hoop Community College2 ... 95 72 76 92 70 76 3 2 67Navajo Community College3 .......... 356 237 67 329 210 64 27 27 100Nebraska Indian Community
College............................................. 59 32 54 36 23 64 23 9 39Northwest Indian College................ 54 NA NA 53 NA NA 1 NA NAOglala Lakota College...................... 128 103 80 123 98 80 5 5 100Salish Kootenai Community
College............................................. 114 61 54 114 61 54 0 0NC
Sinte Gleska University .................... 125 NA NA 90 NA NA 35 NA NASisseton-Wahpeton Community
College............................................. 35 15 43 27 11 41 8 4 50Southwestern Indian Polytechnic
Institute............................................ 116 NA NA 116 NA NA 0 0 NCStanding Rock College4.................... 45 26 58 40 21 53 5 5 100Stone Child College........................... 55 44 80 54 43 80 1 1 100Turtle Mountain Community
College............................................. 68 54 79 51 39 76 17 15 88United Tribes Technical College .... 181 107 59 171 103 60 10 4 40
NA: Not available. Either the institution completed the Consolidated Fall Staff survey form, which does not ask for details by race/ethnicity, or the institution didnot report data by race/ethnicity.
NC: Not calculated. No part-time staff were reported.1Haskell Indian Junior College recently changed its name to Haskell Indian Nations University.2Little Hoop College recently changed its name to Cankdeska Cikana Community College.3Navajo Community College recently changed its name to Diné Community College.4Standing Rock College recently changed its name to Sitting Bull College.
NOTE: Total staff includes staff with unknown race/ethnicity. Cheyenne River Community College, Crownpoint Institute of Technology, Lac Courte OreillesOjibwa Community College, Northwest Indian College, Sinte Gleska University, and Southwestern Indian Polytechnic Institute completed the IPEDS “CN”(Consolidated Fall Staff survey) form.
SOURCE: U.S. Department of Education, National Center for Education Statistics, Integrated Postsecondary Education Data Surveys (IPEDS), “Fall Staff” survey,unpublished data, 1993.
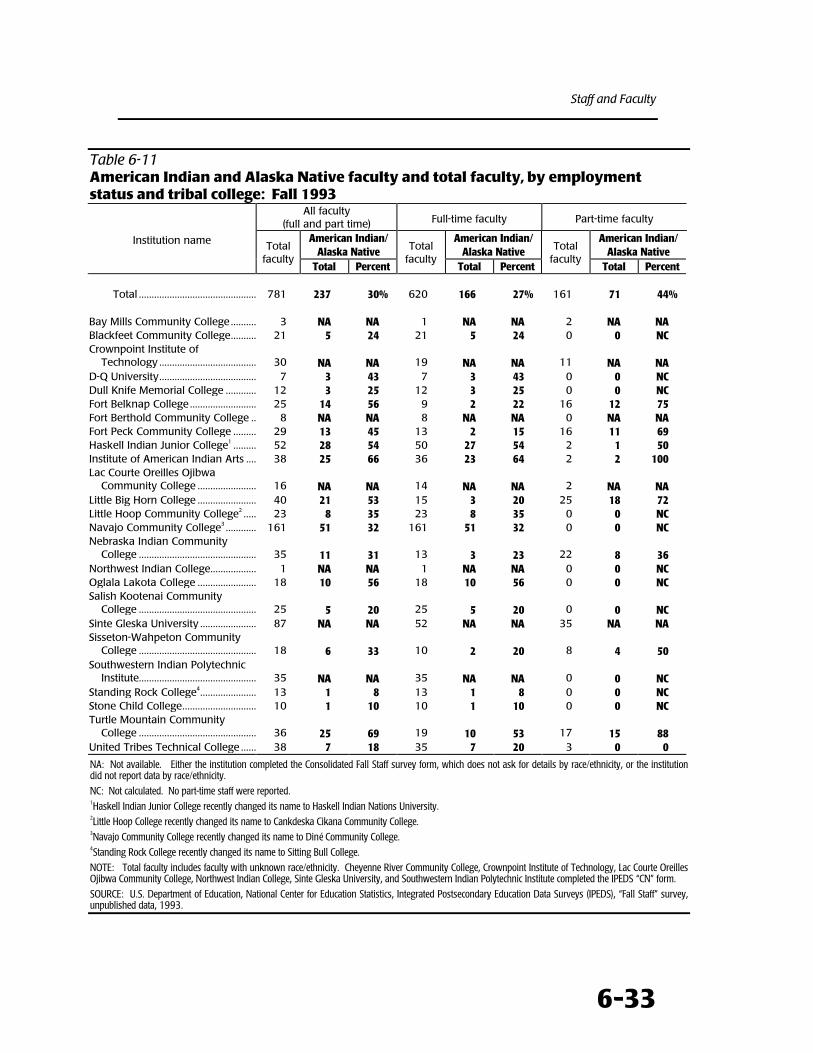
Staff and Faculty
6-33
Table 6-11American Indian and Alaska Native faculty and total faculty, by employmentstatus and tribal college: Fall 1993
All faculty(full and part time) Full-time faculty Part-time faculty
American Indian/Alaska Native
American Indian/Alaska Native
American Indian/Alaska Native
Institution name Totalfaculty
Total Percent
Totalfaculty
Total Percent
Totalfaculty
Total Percent
Total .............................................. 781 237 30% 620 166 27% 161 71 44%
Bay Mills Community College .......... 3 NA NA 1 NA NA 2 NA NABlackfeet Community College.......... 21 5 24 21 5 24 0 0 NCCrownpoint Institute of
Technology ...................................... 30 NA NA 19 NA NA 11 NA NAD-Q University...................................... 7 3 43 7 3 43 0 0 NCDull Knife Memorial College ............ 12 3 25 12 3 25 0 0 NCFort Belknap College .......................... 25 14 56 9 2 22 16 12 75Fort Berthold Community College .. 8 NA NA 8 NA NA 0 NA NAFort Peck Community College ......... 29 13 45 13 2 15 16 11 69Haskell Indian Junior College1 ......... 52 28 54 50 27 54 2 1 50Institute of American Indian Arts .... 38 25 66 36 23 64 2 2 100Lac Courte Oreilles Ojibwa
Community College ....................... 16 NA NA 14 NA NA 2 NA NALittle Big Horn College ....................... 40 21 53 15 3 20 25 18 72Little Hoop Community College2 ..... 23 8 35 23 8 35 0 0 NCNavajo Community College3 ............ 161 51 32 161 51 32 0 0 NCNebraska Indian Community
College .............................................. 35 11 31 13 3 23 22 8 36Northwest Indian College.................. 1 NA NA 1 NA NA 0 0 NCOglala Lakota College ....................... 18 10 56 18 10 56 0 0 NCSalish Kootenai Community
College .............................................. 25 5 20 25 5 20 0 0 NCSinte Gleska University ...................... 87 NA NA 52 NA NA 35 NA NASisseton-Wahpeton Community
College .............................................. 18 6 33 10 2 20 8 4 50Southwestern Indian Polytechnic
Institute.............................................. 35 NA NA 35 NA NA 0 0 NCStanding Rock College4...................... 13 1 8 13 1 8 0 0 NCStone Child College............................. 10 1 10 10 1 10 0 0 NCTurtle Mountain Community
College .............................................. 36 25 69 19 10 53 17 15 88United Tribes Technical College ...... 38 7 18 35 7 20 3 0 0
NA: Not available. Either the institution completed the Consolidated Fall Staff survey form, which does not ask for details by race/ethnicity, or the institutiondid not report data by race/ethnicity.
NC: Not calculated. No part-time staff were reported.1Haskell Indian Junior College recently changed its name to Haskell Indian Nations University.2Little Hoop College recently changed its name to Cankdeska Cikana Community College.3Navajo Community College recently changed its name to Diné Community College.4Standing Rock College recently changed its name to Sitting Bull College.
NOTE: Total faculty includes faculty with unknown race/ethnicity. Cheyenne River Community College, Crownpoint Institute of Technology, Lac Courte OreillesOjibwa Community College, Northwest Indian College, Sinte Gleska University, and Southwestern Indian Polytechnic Institute completed the IPEDS “CN” form.
SOURCE: U.S. Department of Education, National Center for Education Statistics, Integrated Postsecondary Education Data Surveys (IPEDS), “Fall Staff” survey,unpublished data, 1993.
z
6-34
CONCLUSION
These data document the slow growth in the share of higher education
professional staff and faculty who are American Indians and Alaska Natives.
They also indicate that there are clear differences in the
distribution of American Indian and Alaska Native faculty and the
total faculty with regard to institution control (public/private) and
level (2-year/4-year), salary, tenure, and rank. Examination of the
differing estimates of the numbers of faculty from different surveys also
documents the problems of achieving reliable estimates of the number of
American Indian and Alaska Native faculty from sample surveys. This problem
arises from the small sample sizes and the instability of American Indian and
Alaska Native self-reported identification.
e
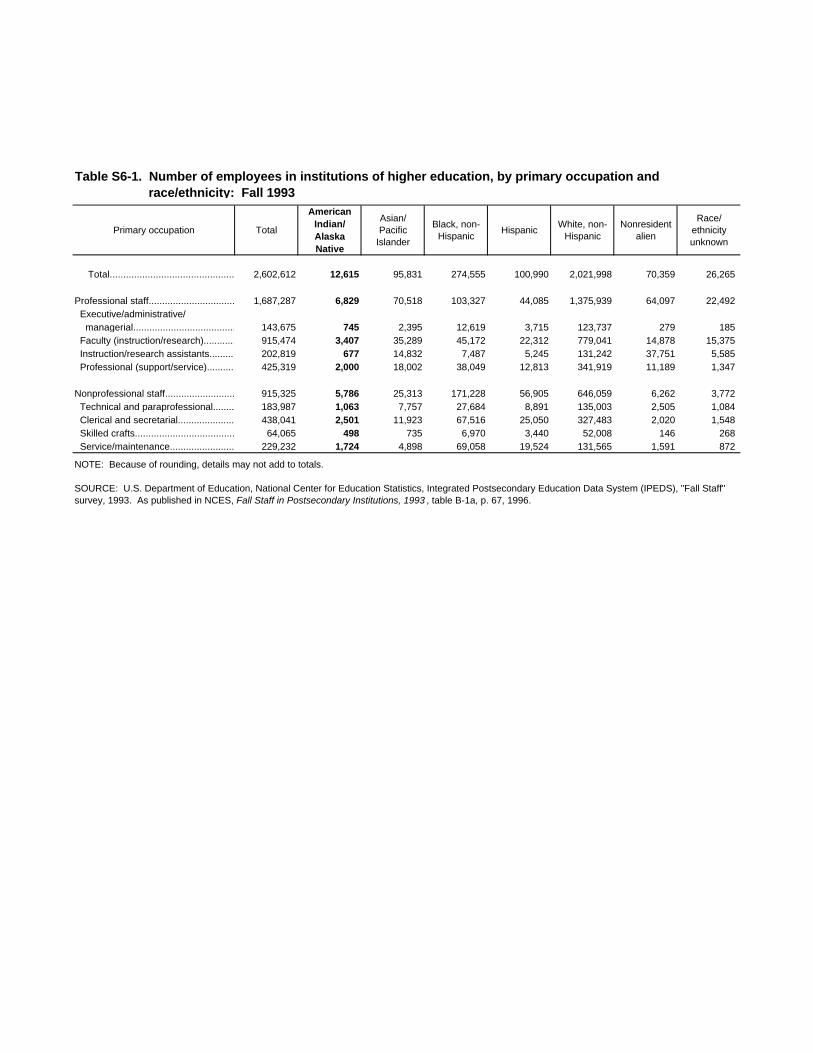
Primary occupation Total
American Indian/Alaska Native
Asian/Pacific
Islander
Black, non-Hispanic
HispanicWhite, non-
HispanicNonresident
alien
Race/ ethnicity unknown
Total................................................................2,602,612 12,615 95,831 274,555 100,990 2,021,998 70,359 26,265
Professional staff.............................................1,687,287 6,829 70,518 103,327 44,085 1,375,939 64,097 22,492 Executive/administrative/ managerial.....................................................143,675 745 2,395 12,619 3,715 123,737 279 185 Faculty (instruction/research)................ 915,474 3,407 35,289 45,172 22,312 779,041 14,878 15,375 Instruction/research assistants............ 202,819 677 14,832 7,487 5,245 131,242 37,751 5,585 Professional (support/service).............. 425,319 2,000 18,002 38,049 12,813 341,919 11,189 1,347
Nonprofessional staff................................... 915,325 5,786 25,313 171,228 56,905 646,059 6,262 3,772 Technical and paraprofessional.......... 183,987 1,063 7,757 27,684 8,891 135,003 2,505 1,084 Clerical and secretarial.................................438,041 2,501 11,923 67,516 25,050 327,483 2,020 1,548 Skilled crafts..................................................64,065 498 735 6,970 3,440 52,008 146 268 Service/maintenance..................................229,232 1,724 4,898 69,058 19,524 131,565 1,591 872
Table S6-1. Number of employees in institutions of higher education, by primary occupation and race/ethnicity: Fall 1993
NOTE: Because of rounding, details may not add to totals.
SOURCE: U.S. Department of Education, National Center for Education Statistics, Integrated Postsecondary Education Data System (IPEDS), "Fall Staff" survey, 1993. As published in NCES, Fall Staff in Postsecondary Institutions, 1993 , table B-1a, p. 67, 1996.
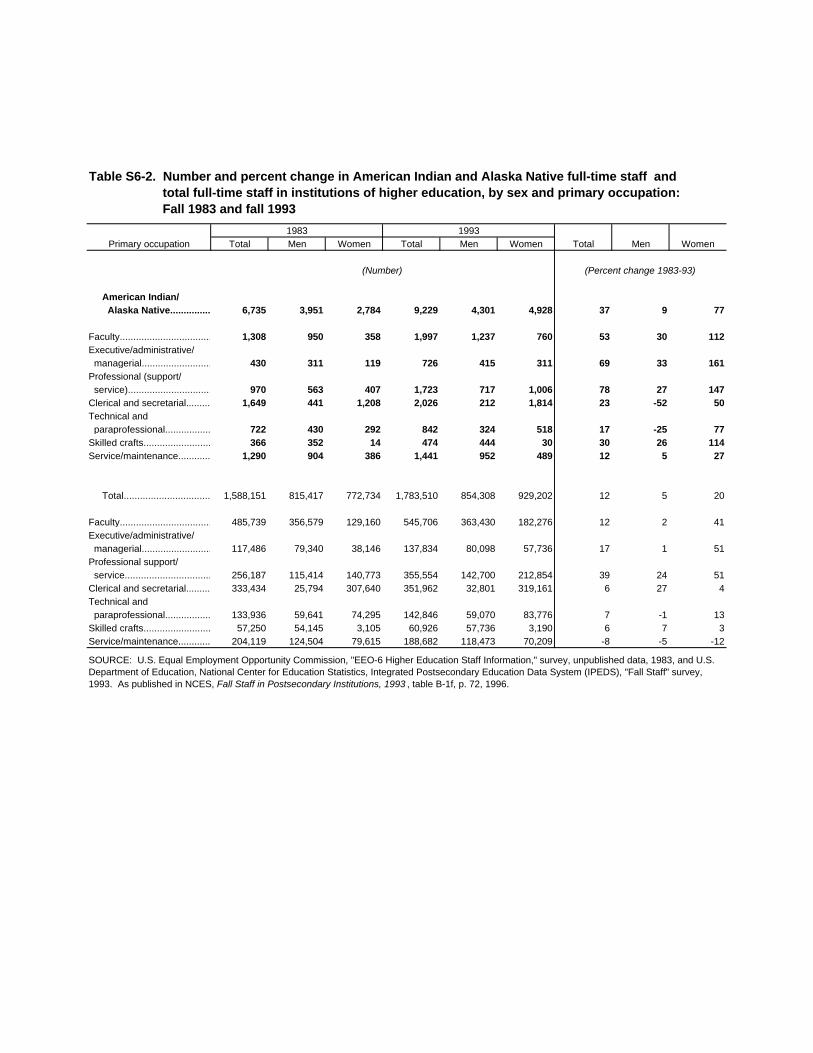
1983 1993Primary occupation Total Men Women Total Men Women Total Men Women
(Number) (Percent change 1983-93)
American Indian/ Alaska Native..................................6,735 3,951 2,784 9,229 4,301 4,928 37 9 77
Faculty........................................... 1,308 950 358 1,997 1,237 760 53 30 112Executive/administrative/ managerial.................................. 430 311 119 726 415 311 69 33 161Professional (support/ service)..............................................970 563 407 1,723 717 1,006 78 27 147Clerical and secretarial............... 1,649 441 1,208 2,026 212 1,814 23 -52 50Technical and paraprofessional......................... 722 430 292 842 324 518 17 -25 77Skilled crafts............................................366 352 14 474 444 30 30 26 114Service/maintenance................. 1,290 904 386 1,441 952 489 12 5 27
Total........................................'1,588,151 815,417 772,734 1,783,510 854,308 929,202 12 5 20
Faculty...........................................485,739 356,579 129,160 545,706 363,430 182,276 12 2 41Executive/administrative/ managerial..................................117,486 79,340 38,146 137,834 80,098 57,736 17 1 51Professional support/ service..............................................256,187 115,414 140,773 355,554 142,700 212,854 39 24 51Clerical and secretarial............... 333,434 25,794 307,640 351,962 32,801 319,161 6 27 4Technical and paraprofessional.........................133,936 59,641 74,295 142,846 59,070 83,776 7 -1 13Skilled crafts............................................57,250 54,145 3,105 60,926 57,736 3,190 6 7 3Service/maintenance................. 204,119 124,504 79,615 188,682 118,473 70,209 -8 -5 -12
Table S6-2. Number and percent change in American Indian and Alaska Native full-time staff and total full-time staff in institutions of higher education, by sex and primary occupation: Fall 1983 and fall 1993
SOURCE: U.S. Equal Employment Opportunity Commission, "EEO-6 Higher Education Staff Information," survey, unpublished data, 1983, and U.S. Department of Education, National Center for Education Statistics, Integrated Postsecondary Education Data System (IPEDS), "Fall Staff" survey, 1993. As published in NCES, Fall Staff in Postsecondary Institutions, 1993 , table B-1f, p. 72, 1996.
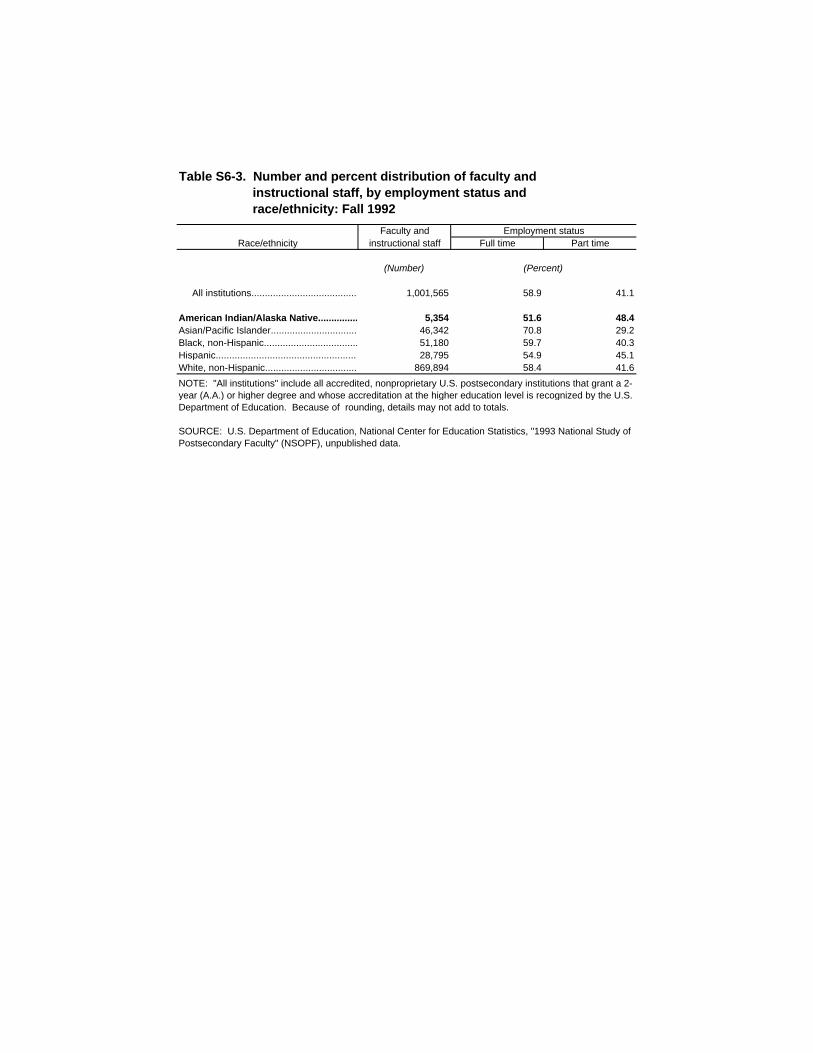
Faculty and Employment status Race/ethnicity instructional staff Full time Part time
(Number) (Percent)
All institutions...............................................................1,001,565 58.9 41.1
American Indian/Alaska Native................ 5,354 51.6 48.4Asian/Pacific Islander................................................ 46,342 70.8 29.2Black, non-Hispanic................................................. 51,180 59.7 40.3Hispanic................................................................. 28,795 54.9 45.1White, non-Hispanic................................................. 869,894 58.4 41.6
Table S6-3. Number and percent distribution of faculty and instructional staff, by employment status and race/ethnicity: Fall 1992
NOTE: "All institutions" include all accredited, nonproprietary U.S. postsecondary institutions that grant a 2-year (A.A.) or higher degree and whose accreditation at the higher education level is recognized by the U.S. Department of Education. Because of rounding, details may not add to totals.
SOURCE: U.S. Department of Education, National Center for Education Statistics, "1993 National Study of Postsecondary Faculty" (NSOPF), unpublished data.
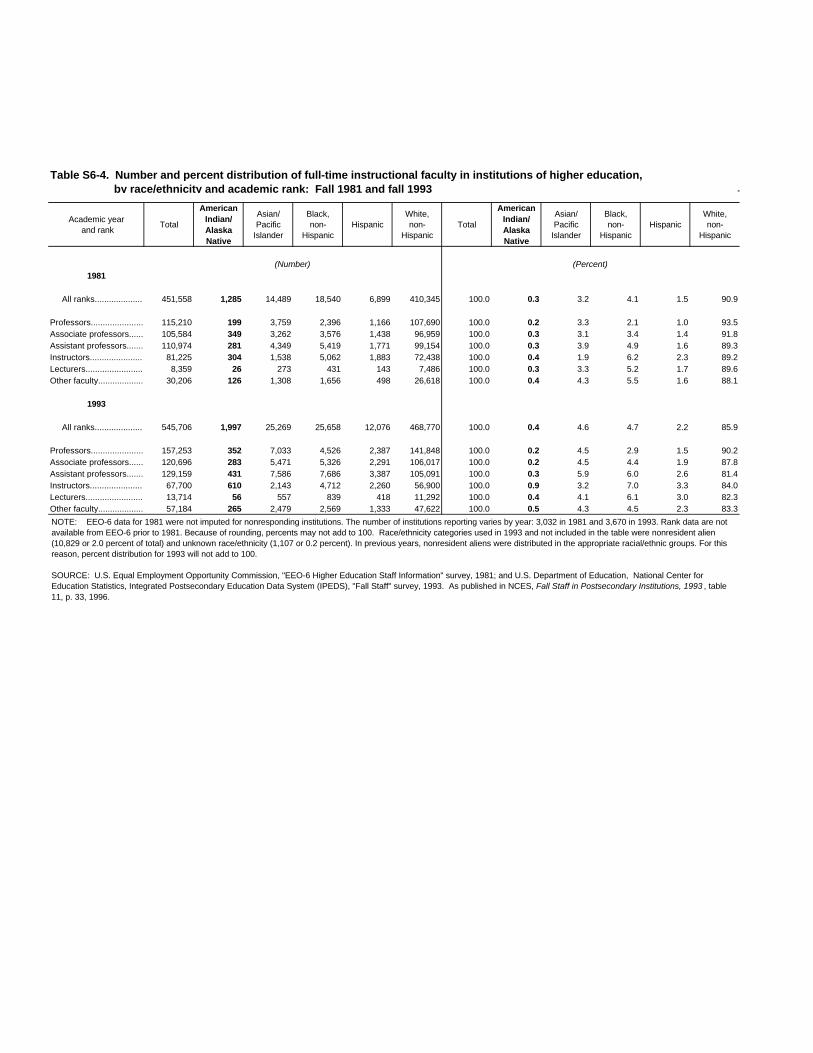
Academic year and rank
Total
American Indian/Alaska Native
Asian/Pacific
Islander
Black,non-
HispanicHispanic
White,non-
HispanicTotal
American Indian/Alaska Native
Asian/Pacific
Islander
Black,non-
HispanicHispanic
White,non-
Hispanic
(Number) (Percent)1981
All ranks................................................451,558 1,285 14,489 18,540 6,899 410,345 100.0 0.3 3.2 4.1 1.5 90.9
Professors............................................115,210 199 3,759 2,396 1,166 107,690 100.0 0.2 3.3 2.1 1.0 93.5Associate professors..........................105,584 349 3,262 3,576 1,438 96,959 100.0 0.3 3.1 3.4 1.4 91.8Assistant professors..........................110,974 281 4,349 5,419 1,771 99,154 100.0 0.3 3.9 4.9 1.6 89.3Instructors..........................................81,225 304 1,538 5,062 1,883 72,438 100.0 0.4 1.9 6.2 2.3 89.2Lecturers............................................8,359 26 273 431 143 7,486 100.0 0.3 3.3 5.2 1.7 89.6Other faculty......................................30,206 126 1,308 1,656 498 26,618 100.0 0.4 4.3 5.5 1.6 88.1
1993
All ranks................................................545,706 1,997 25,269 25,658 12,076 468,770 100.0 0.4 4.6 4.7 2.2 85.9
Professors............................................157,253 352 7,033 4,526 2,387 141,848 100.0 0.2 4.5 2.9 1.5 90.2Associate professors..........................120,696 283 5,471 5,326 2,291 106,017 100.0 0.2 4.5 4.4 1.9 87.8Assistant professors..........................129,159 431 7,586 7,686 3,387 105,091 100.0 0.3 5.9 6.0 2.6 81.4Instructors..........................................67,700 610 2,143 4,712 2,260 56,900 100.0 0.9 3.2 7.0 3.3 84.0Lecturers............................................13,714 56 557 839 418 11,292 100.0 0.4 4.1 6.1 3.0 82.3Other faculty......................................57,184 265 2,479 2,569 1,333 47,622 100.0 0.5 4.3 4.5 2.3 83.3
Table S6-4. Number and percent distribution of full-time instructional faculty in institutions of higher education, by race/ethnicity and academic rank: Fall 1981 and fall 1993
NOTE: EEO-6 data for 1981 were not imputed for nonresponding institutions. The number of institutions reporting varies by year: 3,032 in 1981 and 3,670 in 1993. Rank data are not available from EEO-6 prior to 1981. Because of rounding, percents may not add to 100. Race/ethnicity categories used in 1993 and not included in the table were nonresident alien (10,829 or 2.0 percent of total) and unknown race/ethnicity (1,107 or 0.2 percent). In previous years, nonresident aliens were distributed in the appropriate racial/ethnic groups. For this reason, percent distribution for 1993 will not add to 100.
SOURCE: U.S. Equal Employment Opportunity Commission, "EEO-6 Higher Education Staff Information" survey, 1981; and U.S. Department of Education, National Center for Education Statistics, Integrated Postsecondary Education Data System (IPEDS), "Fall Staff" survey, 1993. As published in NCES, Fall Staff in Postsecondary Institutions, 1993 , table 11, p. 33, 1996.
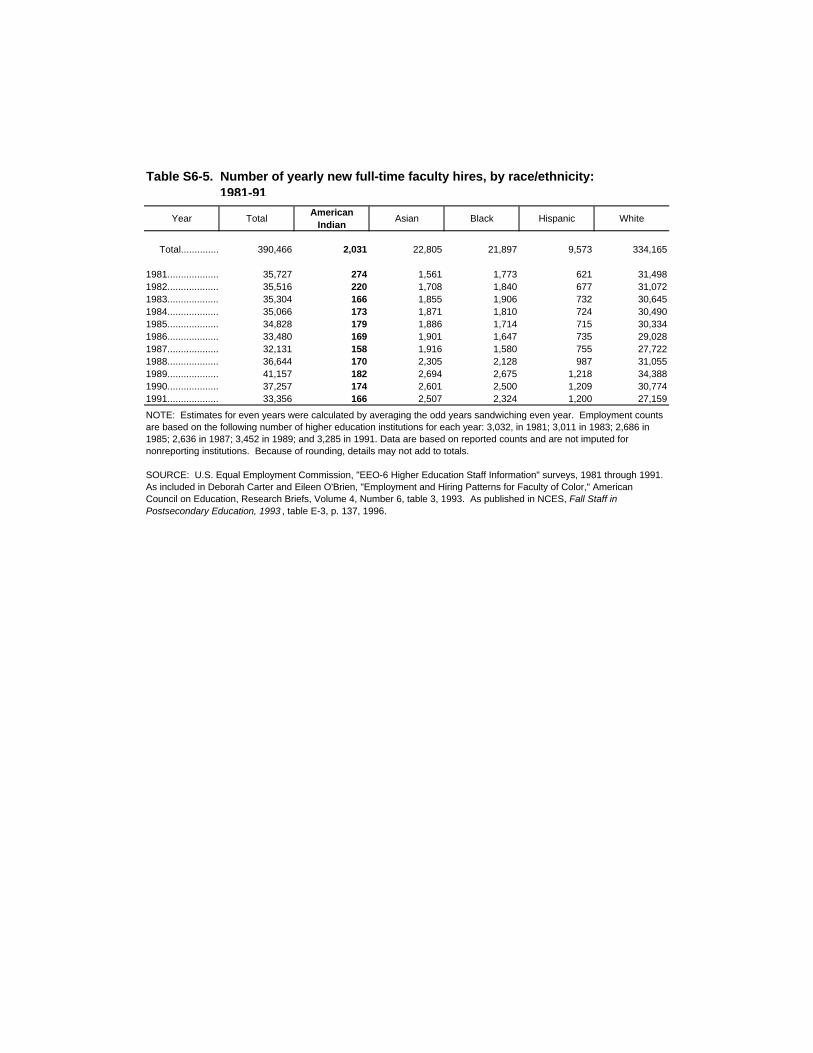
Year TotalAmerican
IndianAsian Black Hispanic White
Total...................... 390,466 2,031 22,805 21,897 9,573 334,165
1981....................................35,727 274 1,561 1,773 621 31,4981982......................... 35,516 220 1,708 1,840 677 31,0721983....................... 35,304 166 1,855 1,906 732 30,6451984............................ 35,066 173 1,871 1,810 724 30,4901985........................... 34,828 179 1,886 1,714 715 30,3341986............................. 33,480 169 1,901 1,647 735 29,0281987............................ 32,131 158 1,916 1,580 755 27,7221988......................... 36,644 170 2,305 2,128 987 31,0551989........................... 41,157 182 2,694 2,675 1,218 34,3881990.............................. 37,257 174 2,601 2,500 1,209 30,7741991........................... 33,356 166 2,507 2,324 1,200 27,159
Table S6-5. Number of yearly new full-time faculty hires, by race/ethnicity: 1981-91
NOTE: Estimates for even years were calculated by averaging the odd years sandwiching even year. Employment counts are based on the following number of higher education institutions for each year: 3,032, in 1981; 3,011 in 1983; 2,686 in 1985; 2,636 in 1987; 3,452 in 1989; and 3,285 in 1991. Data are based on reported counts and are not imputed for nonreporting institutions. Because of rounding, details may not add to totals.
SOURCE: U.S. Equal Employment Commission, "EEO-6 Higher Education Staff Information" surveys, 1981 through 1991. As included in Deborah Carter and Eileen O'Brien, "Employment and Hiring Patterns for Faculty of Color," American Council on Education, Research Briefs, Volume 4, Number 6, table 3, 1993. As published in NCES, Fall Staff in Postsecondary Education, 1993 , table E-3, p. 137, 1996.
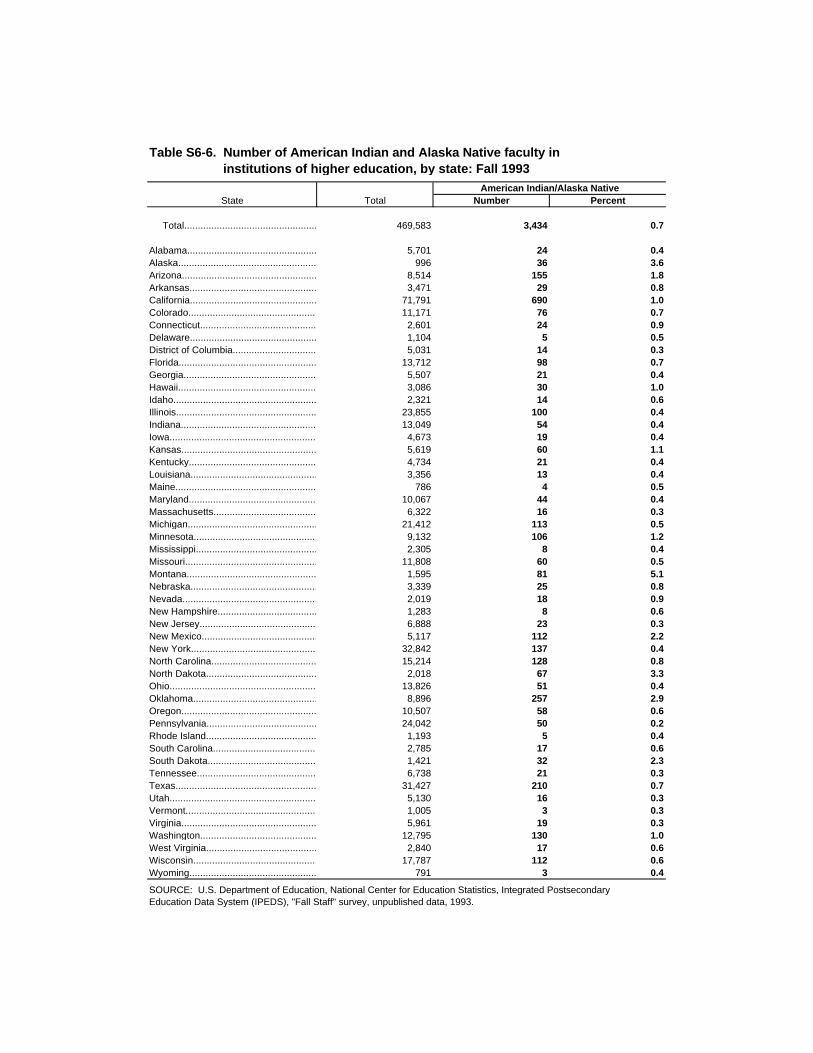
American Indian/Alaska NativeState Total Number Percent
Total............................................................ 469,583 3,434 0.7
Alabama........................................................ 5,701 24 0.4Alaska.............................................................. 996 36 3.6Arizona.......................................................... 8,514 155 1.8Arkansas...................................................................................3,471 29 0.8California........................................................ 71,791 690 1.0Colorado..................................................... 11,171 76 0.7Connecticut................................................... 2,601 24 0.9Delaware........................................................ 1,104 5 0.5District of Columbia........................................... 5,031 14 0.3Florida.......................................................... 13,712 98 0.7Georgia.......................................................... 5,507 21 0.4Hawaii............................................................. 3,086 30 1.0Idaho............................................................. 2,321 14 0.6Illinois............................................................ 23,855 100 0.4Indiana...................................................................... 13,049 54 0.4Iowa................................................................ 4,673 19 0.4Kansas.......................................................... 5,619 60 1.1Kentucky............................................................... 4,734 21 0.4Louisiana...................................................... 3,356 13 0.4Maine............................................................ 786 4 0.5Maryland........................................................... 10,067 44 0.4Massachusetts............................................... 6,322 16 0.3Michigan........................................................ 21,412 113 0.5Minnesota...................................................... 9,132 106 1.2Mississippi.......................................................... 2,305 8 0.4Missouri........................................................... 11,808 60 0.5Montana.......................................................... 1,595 81 5.1Nebraska..................................................... 3,339 25 0.8Nevada.............................................................. 2,019 18 0.9New Hampshire............................................ 1,283 8 0.6New Jersey.................................................... 6,888 23 0.3New Mexico..................................................... 5,117 112 2.2New York.................................................... 32,842 137 0.4North Carolina................................................. 15,214 128 0.8North Dakota................................................ 2,018 67 3.3Ohio............................................................... 13,826 51 0.4Oklahoma........................................................ 8,896 257 2.9Oregon............................................................ 10,507 58 0.6Pennsylvania................................................ 24,042 50 0.2Rhode Island.................................................... 1,193 5 0.4South Carolina................................................ 2,785 17 0.6South Dakota.............................................. 1,421 32 2.3Tennessee..................................................... 6,738 21 0.3Texas.............................................................. 31,427 210 0.7Utah.................................................................... 5,130 16 0.3Vermont........................................................ 1,005 3 0.3Virginia......................................................... 5,961 19 0.3Washington....................................................... 12,795 130 1.0West Virginia.................................................. 2,840 17 0.6Wisconsin..................................................... 17,787 112 0.6Wyoming........................................................ 791 3 0.4
Table S6-6. Number of American Indian and Alaska Native faculty in institutions of higher education, by state: Fall 1993
SOURCE: U.S. Department of Education, National Center for Education Statistics, Integrated Postsecondary Education Data System (IPEDS), "Fall Staff" survey, unpublished data, 1993.
Tribally ControlledColleges
“Tribal colleges came about becausemainstream institutions were failingIndian People...not the other way around.”
Wayne SteinTurtle Mountain Chippewa
Director, Center for Native American Studies
(7
Tribally Controlled Colleges
7-1
or the past 30 years, American Indians and Alaska Natives1 have been
chartering and developing their own institutions of higher education. While
these tribally controlled colleges (TCCs) are not the first attempt by Indian tribes
to provide their tribal members with a postsecondary education (see exhibit 1-
1), they do represent the first sustained, widespread effort. This chapter
concentrates on institutions that are tribally controlled, located on or near an
Indian reservation, and qualify for support under the Tribally Controlled
Community College Act. Highlights about each tribal college, derived from the
college materials and federal agency sources, follow the chapter text.
Highlights
# In 1968, Diné, Inc., an organization established by Native American politicaland education leaders, founded Navajo Community College, the first triballycontrolled college to be created on a Native American reservation. Thereare now 30 tribally controlled colleges in the United States.
# The goals of tribal colleges include preserving, enhancing, and promotingthe languages and cultures of their tribes; providing quality academicprograms; and serving as resources for research on economic andcommunity development (exhibit 7-1).
# In 1972, the tribal colleges organized the American Indian Higher EducationConsortium (AIHEC) to unify and strengthen the tribal college movementand to lobby for legislation and funding with federal and state governments.The Tribally Controlled Community College Act of 1978, which providespartial funding for the tribal colleges, was one result of AIHEC’s efforts.
# In fall 1994, tribal college enrollment reached almost 12,400 students (table3-3).
# Eight percent of all Native American students attending higher educationinstitutions in fall 1994 were enrolled in tribal colleges (figure 7-4).
# Eighty-five percent of tribal college graduates who stayed on the reservationfound employment (1983 AIHEC survey).
1The terms “Native American” and “American Indian and Alaska Native” are used interchangeably throughout this chapter.
F
(
7-2
# Tribal college faculty salaries were, on average, 29 percent lower than thoseearned by public community college faculty members in 1995-96 (figure 7-5).
# In 1995, five tribal colleges offered 4-year bachelor’s degree programs, oneoffered a postbaccalaureate degree, and two offered master’s degrees (table7-1).
# The establishment of the Tribal College Fund has assisted tribal colleges inexploring new programs, new curricula, and additional and advanceddegree options.
Founding of Navajo
Community College
The movement toward American Indian self-determination in the late 1960s
was hastened by earlier events such as World War II, the Civil Rights Movement,
and the political policies and leadership of presidents
Kennedy, Johnson, and Nixon. During this period, events
concerning American Indian control of Indian education
moved quickly in the Navajo Nation. Political leaders,
including councilmen Guy Gorman and Allen Yazzie; Navajo
Nation chairman Raymond Nakai; and educators including Dr. Ned Hatathli, Dr.
Robert Roessel, and Ruth Roessel formed Diné, Inc.,2 with the intention of taking
control of Navajo student education. One of their primary targets was Indian
higher education. Members of Diné began exploring the possibility of
establishing a community college for the Navajo people.3
Driven by the efforts of Diné members, the Navajo Nation founded and
chartered the Navajo Community College (NCC) in July 1968. The
establishment of NCC encouraged a number of other tribes to found and charter
their own colleges during the 1960s, `70s, `80s, and `90s.
2Diné is pronounced \’du nay\. It means “the people” in the Navajo language.
3W. J. Stein, Interview with G. Gorman concerning Navajo Community College, Reno, NV, Nov. 23, 1986.
Tribally Controlled Colleges
7-3
MISSION OF TRIBAL COLLEGES
The number of tribally controlled colleges has steadily increased since the
founding of Navajo Community College (figure 7-1). Today there are 30 tribally
controlled colleges located in the United States. Twenty-eight
of the 30 U.S. schools are chartered by Indian tribes. They are
located on or near Indian reservations, are controlled by tribal
boards, receive support through the Tribally Controlled
Community College Act, and have full membership in the
American Indian Higher Education Consortium (AIHEC). The remaining
institutions, Haskell Indian Junior College and Southwest Indian Polytechnic
Institute, are federally founded schools and are monitored by the Bureau of
Indian Affairs (BIA). They also, however, have tribal boards and have received
associate memberships in AIHEC, as they function similarly to the 28 tribally
chartered institutions.4
These colleges serve a wide variety of tribes, but all adhere to several basic
principles in their mission statements (exhibit 7-1). Each states that the will to
preserve, enhance, and promote the language and culture of its tribe is central
to its existence. The colleges serve their tribal communities as resources for
research on economic development, human resource development, and
community organization. They provide academic programs for students
seeking 2-year degrees and those wishing to transfer to 4-year institutions.
Some tribal colleges also provide vocational and technical programs that train
students for technical jobs available in their communities.5
4For the purposes of this report, Haskell Indian Junior College and Southwest Polytechnic Institute, are considered tribally controlled colleges.
5P. Boyer, Tribal Colleges, The Carnegie Foundation, 1989.
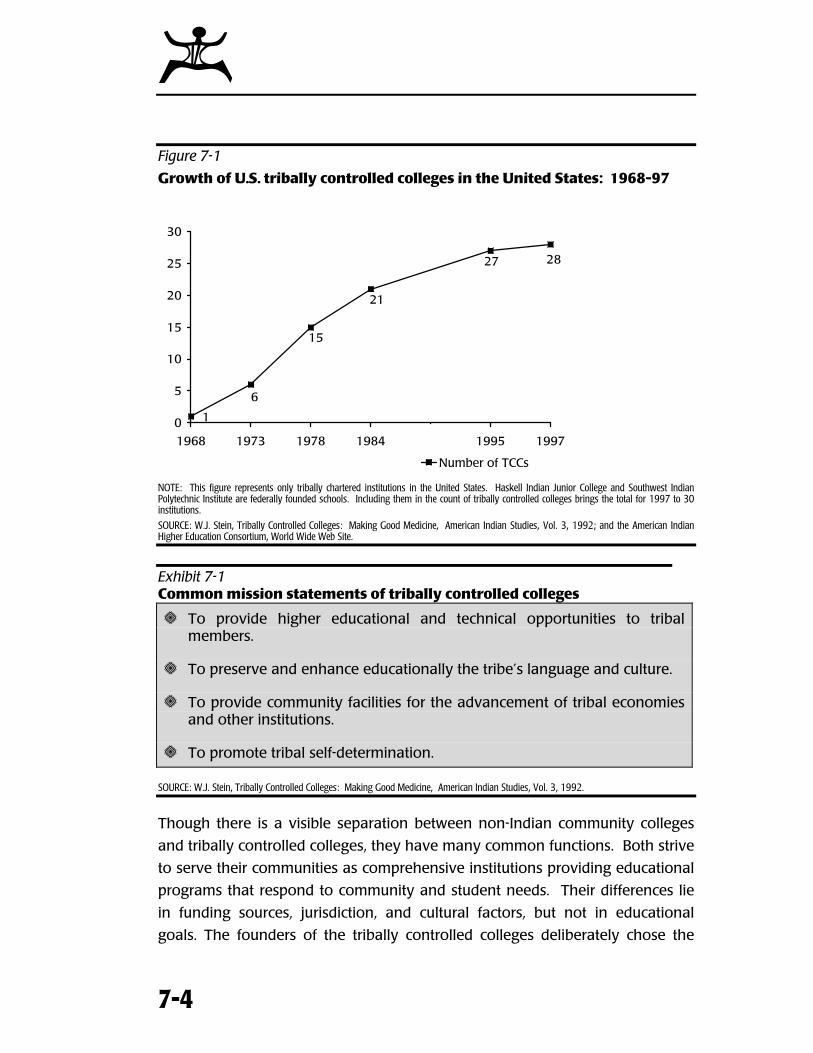
(
7-4
Figure 7-1
Growth of U.S. tribally controlled colleges in the United States: 1968-97
27
21
15
6
1
28
0
5
10
15
20
25
30
1968 1973 1978 1984 1995 1997
Number of TCCs
NOTE: This figure represents only tribally chartered institutions in the United States. Haskell Indian Junior College and Southwest IndianPolytechnic Institute are federally founded schools. Including them in the count of tribally controlled colleges brings the total for 1997 to 30institutions.
SOURCE: W.J. Stein, Tribally Controlled Colleges: Making Good Medicine, American Indian Studies, Vol. 3, 1992; and the American IndianHigher Education Consortium, World Wide Web Site.
Exhibit 7-1Common mission statements of tribally controlled colleges
# To provide higher educational and technical opportunities to tribalmembers.
# To preserve and enhance educationally the tribe’s language and culture.
# To provide community facilities for the advancement of tribal economiesand other institutions.
# To promote tribal self-determination.
SOURCE: W.J. Stein, Tribally Controlled Colleges: Making Good Medicine, American Indian Studies, Vol. 3, 1992.
Though there is a visible separation between non-Indian community colleges
and tribally controlled colleges, they have many common functions. Both strive
to serve their communities as comprehensive institutions providing educational
programs that respond to community and student needs. Their differences lie
in funding sources, jurisdiction, and cultural factors, but not in educational
goals. The founders of the tribally controlled colleges deliberately chose the
Tribally Controlled Colleges
7-5
community college model of higher education as being most appropriate to
meet their needs.
AMERICAN INDIAN
HIGHER EDUCATION CONSORTIUM
In 1972, leaders of the fledgling tribal community college
movement recognized that unity among the small number of
tribally controlled colleges was essential to promote the
schools as a viable postsecondary option for Indian students.6
This led to the creation of the American Indian Higher
Education Consortium (AIHEC). Figure 7-2 shows the location
of each AIHEC member institution.
Main role. One of AIHEC’s most important roles involves securing and
maintaining funding from the federal government, the principal source of
support for the tribally controlled colleges. The tribal colleges interact with the
federal government much as state-supported institutions do with their state
governments.
In 1978, AIHEC worked with Congress and President Carter to develop the
Tribally Controlled Community College Act7 of 1978. The Tribally Controlled
Community College Act provided federal funding to tribal colleges as part of the
federal government’s treaty agreements and obligations. This legislation has
had a stabilizing influence on the tribal college movement. Implementation of
the Tribal College Act came at a time when the future of a number of the fiscally
stressed tribally controlled colleges was unclear.
6 W.J. Stein, Interview with D. Risling concerning D-Q University, Reno, NV, Nov. 23, 1986.
7 The Tribally Controlled Community College Act is also known as the Tribal College Act.
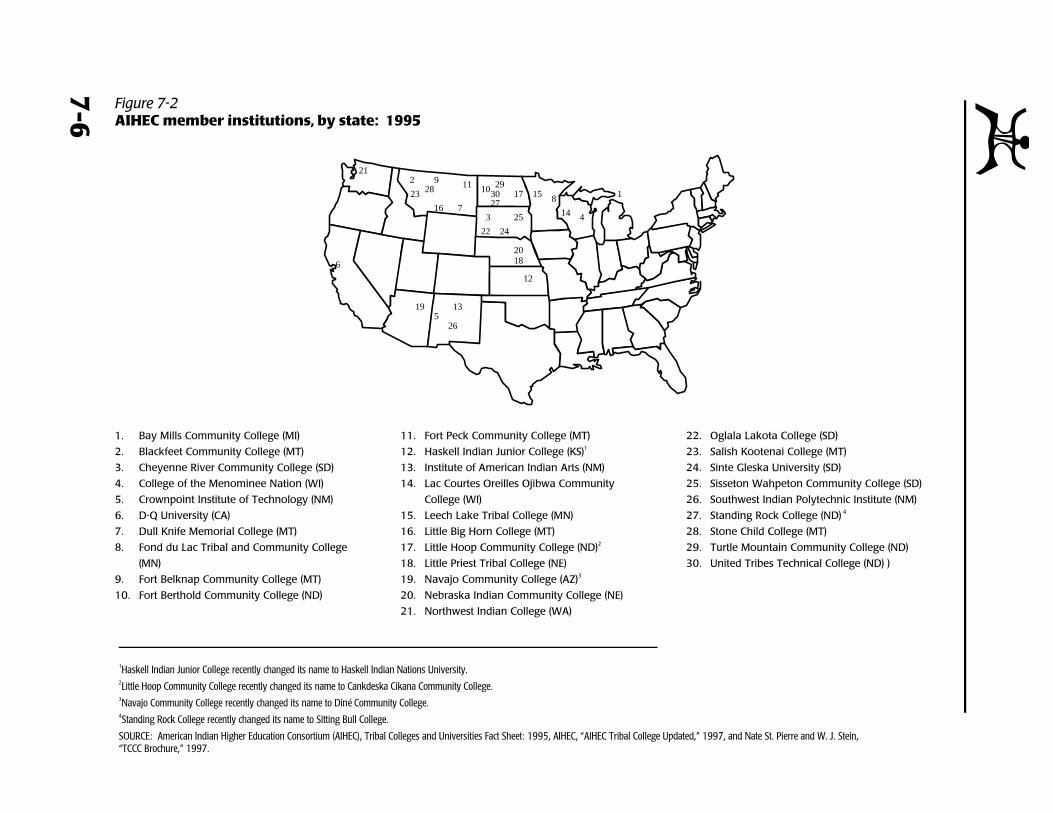
Figure 7-2AIHEC member institutions, by state: 1995
212 9 112823
16 7
10 291730
2715 8
14 4
1
3 25
22 24
20
12
135
26
19
6 18
1. Bay Mills Community College (MI)
2. Blackfeet Community College (MT)
3. Cheyenne River Community College (SD)
4. College of the Menominee Nation (WI)
5. Crownpoint Institute of Technology (NM)
6. D-Q University (CA)
7. Dull Knife Memorial College (MT)
8. Fond du Lac Tribal and Community College
(MN)
9. Fort Belknap Community College (MT)
10. Fort Berthold Community College (ND)
11. Fort Peck Community College (MT)
12. Haskell Indian Junior College (KS)1
13. Institute of American Indian Arts (NM)
14. Lac Courtes Oreilles Ojibwa Community
College (WI)
15. Leech Lake Tribal College (MN)
16. Little Big Horn College (MT)
17. Little Hoop Community College (ND)2
18. Little Priest Tribal College (NE)
19. Navajo Community College (AZ)3
20. Nebraska Indian Community College (NE)
21. Northwest Indian College (WA)
22. Oglala Lakota College (SD)
23. Salish Kootenai College (MT)
24. Sinte Gleska University (SD)
25. Sisseton Wahpeton Community College (SD)
26. Southwest Indian Polytechnic Institute (NM)
27. Standing Rock College (ND) 4
28. Stone Child College (MT)
29. Turtle Mountain Community College (ND)
30. United Tribes Technical College (ND) )
(
1Haskell Indian Junior College recently changed its name to Haskell Indian Nations University.2Little Hoop Community College recently changed its name to Cankdeska Cikana Community College.3Navajo Community College recently changed its name to Diné Community College.4Standing Rock College recently changed its name to Sitting Bull College.
SOURCE: American Indian Higher Education Consortium (AIHEC), Tribal Colleges and Universities Fact Sheet: 1995, AIHEC, “AIHEC Tribal College Updated,” 1997, and Nate St. Pierre and W. J. Stein,“TCCC Brochure,” 1997.
7-6
Tribally Controlled Colleges
7-7
TRIBALLY CONTROLLED
COMMUNITY COLLEGE ACT
Since 1978, the Tribally Controlled Community College Act has undergone
three reauthorizations, but continues to have two primary parts: Title I and Title
II.8 Title I provides federal funding for all tribally controlled colleges that
possess a tribal government charter, have an American Indian board of
directors, and have Native American students composing the
majority of their enrollment. Federal funds are dispersed through
the Bureau of Indian Affairs (BIA) based on Indian student counts
(ISC). As of 1996, 26 institutions were eligible for Title I funding.9
Title II funding is an annual lump sum payment made to Navajo
Community College (NCC) based on institutional need. Prior to the
signing of the Tribal College Act, NCC had already secured a funding bill from
the federal government. This bill was incorporated into the more
comprehensive legislation signed in 1978. The Tribal College Act also provides
for construction, technical assistance, and an endowment building fund. The
endowment fund was added to the 1978 legislation during the 1983
reauthorization. Through this fund, the federal government matches every
dollar raised by tribes for contribution to their institutional endowment funds.
The tribal colleges, however, have never been fully funded through the
congressional appropriation process at the level authorized by the Act. The
Tribal College Act authorized $5,820 per American Indian full-time-equivalent
(FTE) student in its 1983 reauthorization by Congress. Based on the Consumer
Price Index over the past decade, the authorization would have reached $8,450
per FTE in 1995 if Congress had adjusted it to keep pace with inflation. Both
figures, however, are considerably higher than the actual amounts of $2,990
and $2,900 per FTE appropriated in the 1995 and 1996 federal budgets,
respectively, for funding the Tribal College Act (figure 7-3).
8Two institutions, Haskell Indian Junior College and Southwest Indian Polytechnic Institute are not eligible for Title I or Title II funding as theyare not tribally chartered institutions. They receive separate funding from the federal government.
9 Haskell Indian Junior College, Southwest Indian Polytechnic Institute, and Navajo Community College were not eligible for Title I funding. Little Priest Tribal College was established in 1996.
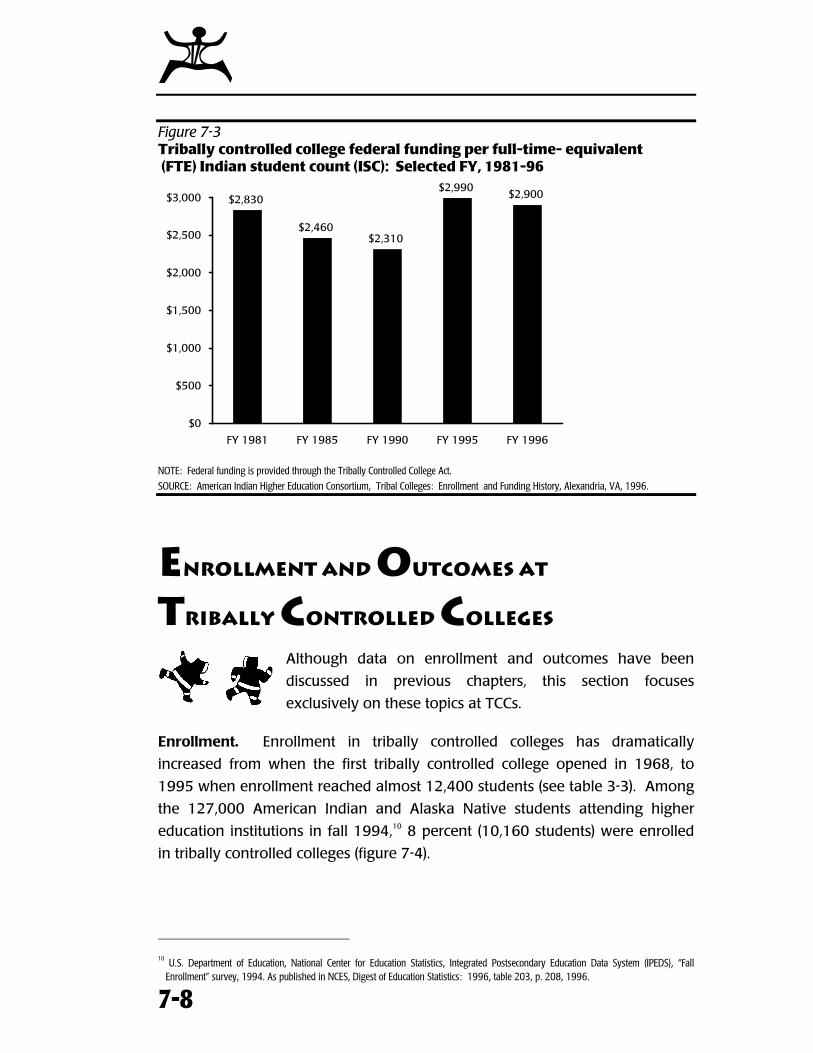
(
7-8
Figure 7-3Tribally controlled college federal funding per full-time- equivalent (FTE) Indian student count (ISC): Selected FY, 1981-96
$2,830
$2,460$2,310
$2,990$2,900
$0
$500
$1,000
$1,500
$2,000
$2,500
$3,000
FY 1981 FY 1985 FY 1990 FY 1995 FY 1996
NOTE: Federal funding is provided through the Tribally Controlled College Act.
SOURCE: American Indian Higher Education Consortium, Tribal Colleges: Enrollment and Funding History, Alexandria, VA, 1996.
ENROLLMENT AND OUTCOMES AT
TRIBALLY CONTROLLED COLLEGES
Although data on enrollment and outcomes have been
discussed in previous chapters, this section focuses
exclusively on these topics at TCCs.
Enrollment. Enrollment in tribally controlled colleges has dramatically
increased from when the first tribally controlled college opened in 1968, to
1995 when enrollment reached almost 12,400 students (see table 3-3). Among
the 127,000 American Indian and Alaska Native students attending higher
education institutions in fall 1994,10 8 percent (10,160 students) were enrolled
in tribally controlled colleges (figure 7-4).
10
U.S. Department of Education, National Center for Education Statistics, Integrated Postsecondary Education Data System (IPEDS), “FallEnrollment” survey, 1994. As published in NCES, Digest of Education Statistics: 1996, table 203, p. 208, 1996.
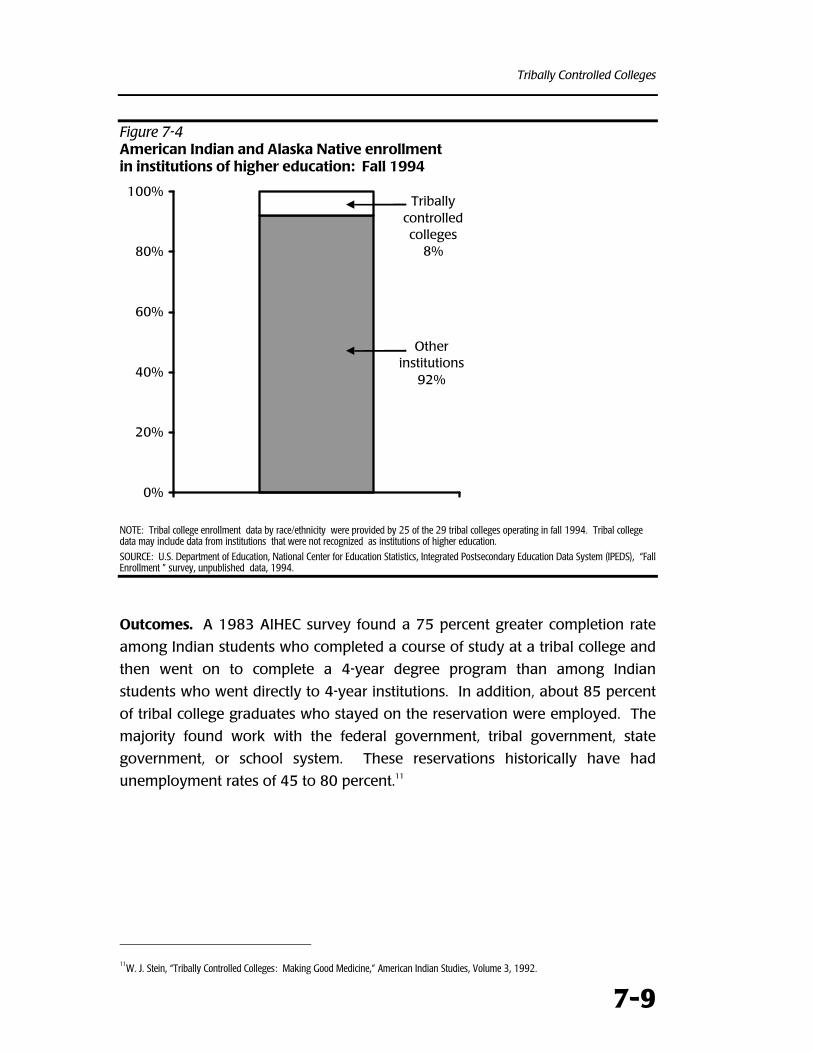
Tribally Controlled Colleges
7-9
Figure 7-4American Indian and Alaska Native enrollmentin institutions of higher education: Fall 1994
Other institutions
92%
Tribally controlled colleges
8%
0%
20%
40%
60%
80%
100%
NOTE: Tribal college enrollment data by race/ethnicity were provided by 25 of the 29 tribal colleges operating in fall 1994. Tribal collegedata may include data from institutions that were not recognized as institutions of higher education.
SOURCE: U.S. Department of Education, National Center for Education Statistics, Integrated Postsecondary Education Data System (IPEDS), “FallEnrollment ” survey, unpublished data, 1994.
Outcomes. A 1983 AIHEC survey found a 75 percent greater completion rate
among Indian students who completed a course of study at a tribal college and
then went on to complete a 4-year degree program than among Indian
students who went directly to 4-year institutions. In addition, about 85 percent
of tribal college graduates who stayed on the reservation were employed. The
majority found work with the federal government, tribal government, state
government, or school system. These reservations historically have had
unemployment rates of 45 to 80 percent.11
11
W. J. Stein, “Tribally Controlled Colleges: Making Good Medicine,” American Indian Studies, Volume 3, 1992.
(
7-10
TRIBAL COLLEGE OPERATIONS, FACULTY,
AND PROGRAM OFFERINGS
Tribal colleges operate differently from other higher education
institutions, face different challenges in retaining high-quality
faculty, and offer both mainstream coursework and tribal or Native
American studies. The majority of these institutions have received
accreditation, while those that have not continue to seek this status. This
section summarizes key issues in tribal colleges operations, faculty and
administration, and program offerings.
Board of trustees. All tribal colleges are controlled by boards of trustees,
which are composed almost entirely of members of the local tribal
communities. Boards of trustees for tribally controlled institutions function as
buffers between tribal politics and the colleges, and also act as mediators
among policymakers, personnel selection committees, and local watchdogs of
and for the tribal colleges. The boards of trustees are in a unique position to
handle these responsibilities because of the autonomous nature of their
authority as granted by their tribal college charters.
Administration and faculty. Tribal college administrators and faculty are a
mixture of American Indians and non-Indians. Administrators are generally
American Indian, but most faculty members are non-Indian.12
Tribally controlled colleges face several faculty problems that can be classified
into three main areas. First is the difficulty of finding and keeping science and
mathematics instructors. Second is the high turnover among faculty, who often
find life on Indian reservations too isolated and culturally different. Third, and
most challenging to solve, is that even as the colleges mature and their student
populations grow, faculty salaries at tribally controlled colleges remain
relatively low when compared with those at public community colleges. For
example, tribal college faculty earned 71 percent as much as faculty in 2-year
public institutions in 1995-96. The average salary for faculty at tribal colleges
was $27,401 compared with $38,573 at 2-year public institutions (figure 7-5).
12
W. J. Stein, “Tribally Controlled Colleges: Making Good Medicine,” American Indian Studies, Volume 3, 1992.
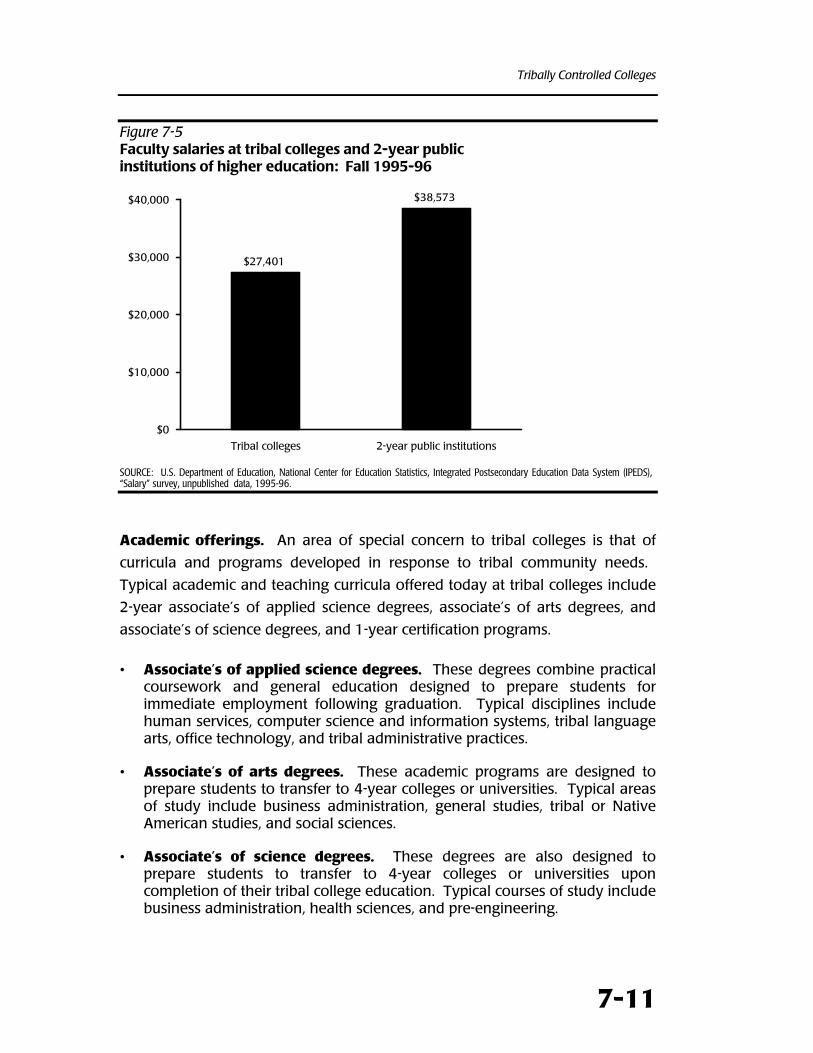
Tribally Controlled Colleges
7-11
Figure 7-5Faculty salaries at tribal colleges and 2-year publicinstitutions of higher education: Fall 1995-96
$27,401
$38,573
$0
$10,000
$20,000
$30,000
$40,000
Tribal colleges 2-year public institutions
SOURCE: U.S. Department of Education, National Center for Education Statistics, Integrated Postsecondary Education Data System (IPEDS), “Salary” survey, unpublished data, 1995-96.
Academic offerings. An area of special concern to tribal colleges is that of
curricula and programs developed in response to tribal community needs.
Typical academic and teaching curricula offered today at tribal colleges include
2-year associate’s of applied science degrees, associate’s of arts degrees, and
associate’s of science degrees, and 1-year certification programs.
• Associate’s of applied science degrees. These degrees combine practicalcoursework and general education designed to prepare students forimmediate employment following graduation. Typical disciplines includehuman services, computer science and information systems, tribal languagearts, office technology, and tribal administrative practices.
• Associate’s of arts degrees. These academic programs are designed toprepare students to transfer to 4-year colleges or universities. Typical areasof study include business administration, general studies, tribal or NativeAmerican studies, and social sciences.
• Associate’s of science degrees. These degrees are also designed toprepare students to transfer to 4-year colleges or universities uponcompletion of their tribal college education. Typical courses of study includebusiness administration, health sciences, and pre-engineering.
(
7-12
• One-year certificate programs. These programs are designed by the tribalcolleges to respond to local community employment opportunities. Students take a sharply focused vocational program with considerablehands-on practical experience. These wide ranging programs reflect thediversity of the communities and tribal colleges that create them. Generaloffice skills, health sciences, hospitality, automotive trade skills, andmanufacturing assembly are examples of certificate programs from onetribal college.13
Tribal colleges have made major strides in curriculum development. For
example, in 1972, Sinte Gleska University, then Sinte Gleska College, offered
only 22 courses in a variety of disciplines ranging from psychology to
mathematics, with 13 administrators and faculty members composing the entire
college staff. Since then, Sinte Gleska has developed a 4-year bachelor’s degree
program and the first master’s degree program in education at a tribally
controlled college. Three other tribally controlled colleges, Oglala Lakota
College, Haskell Indian Junior College, and Salish Kootenai College, also have
developed 4-year bachelor’s degree programs in human resources, social
sciences, and education (table 7-1).14 In addition, Oglala Lakota College recently
added a master’s degree in Lakota leadership.
Accreditation. The tribal colleges have made receiving full accreditation for
every tribal college a goal. Each college has had to seek accreditation
independently, but has received morale boosters and expertise from other
AIHEC members. By 1996, this accreditation effort had resulted in 27 of the 30
U.S. tribally controlled colleges gaining full accreditation as higher education
institutions. The three remaining tribal colleges were accreditation candidates.
13
Bay Mills Community College, 1994-96 Catalog, 1994.
14W. J. Stein, “Tribally Controlled Colleges: Making Good Medicine,” American Indian Studies, Volume 3, 1992.
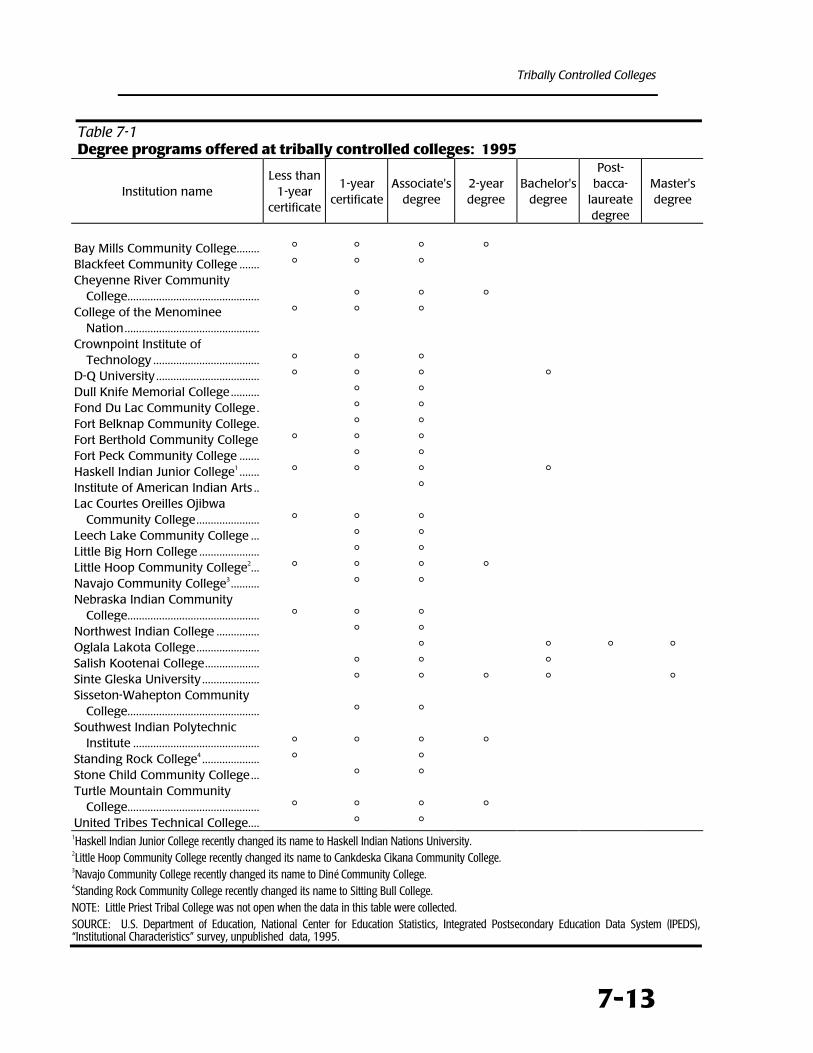
Tribally Controlled Colleges
7-13
Table 7-1Degree programs offered at tribally controlled colleges: 1995
Institution nameLess than
1-yearcertificate
1-yearcertificate
Associate'sdegree
2-yeardegree
Bachelor'sdegree
Post-bacca-
laureatedegree
Master'sdegree
Bay Mills Community College........ ° ° ° °Blackfeet Community College ....... ° ° °Cheyenne River Community
College.............................................. ° ° °College of the Menominee
Nation...............................................° ° °
Crownpoint Institute ofTechnology ..................................... ° ° °
D-Q University .................................... ° ° ° °Dull Knife Memorial College.......... ° °Fond Du Lac Community College. ° °Fort Belknap Community College. ° °Fort Berthold Community College ° ° °Fort Peck Community College ....... ° °Haskell Indian Junior College1 ....... ° ° ° °Institute of American Indian Arts .. °Lac Courtes Oreilles Ojibwa
Community College...................... ° ° °Leech Lake Community College ... ° °Little Big Horn College ..................... ° °Little Hoop Community College2... ° ° ° °Navajo Community College3.......... ° °Nebraska Indian Community
College.............................................. ° ° °Northwest Indian College ............... ° °Oglala Lakota College...................... ° ° ° °Salish Kootenai College................... ° ° °Sinte Gleska University .................... ° ° ° ° °Sisseton-Wahepton Community
College.............................................. ° °Southwest Indian Polytechnic
Institute ............................................ ° ° ° °Standing Rock College4 .................... ° °Stone Child Community College... ° °Turtle Mountain Community
College.............................................. ° ° ° °United Tribes Technical College.... ° °
1Haskell Indian Junior College recently changed its name to Haskell Indian Nations University.2Little Hoop Community College recently changed its name to Cankdeska Cikana Community College.3Navajo Community College recently changed its name to Diné Community College.4Standing Rock Community College recently changed its name to Sitting Bull College.NOTE: Little Priest Tribal College was not open when the data in this table were collected.SOURCE: U.S. Department of Education, National Center for Education Statistics, Integrated Postsecondary Education Data System (IPEDS),“Institutional Characteristics” survey, unpublished data, 1995.
(
7-14
INSTITUTIONAL FUNDING
The future of the tribally controlled colleges is promising for those American
Indian reservations where TCCs already exist. In part, tribal colleges have found
it possible to keep their doors open due to recent federal
legislation providing land-grant status to tribal colleges. Public
Law 1014-382, Equity in Educational Land-Grant Status Act of
1994, authorized the development of programs that tribal
colleges require to more effectively meet the agricultural
education needs of their people.15 Congressional appropriations to fund Public
Law 1014-382 will give tribal colleges resources to invest in additional faculty
members and/or equipment to conduct agricultural research both
independently and in collaboration with 4-year institutions. The results of these
efforts are designed to assist Indian tribes in the development of agricultural
and natural resources on their reservations.
The tribal colleges also seek funding from a number of other federal agencies
such as the National Science Foundation, philanthropic organizations such as
the Kellogg Foundation, and corporate foundations such as U.S. West. Funds
are targeted to specific tasks outlined by the individual colleges and are
generally awarded to tribal colleges and other higher education institutions on
a competitive basis.
These additional funds can be instrumental in carrying forward educational
programs within tribal colleges. A recent $12 million, 5-year grant awarded by
the National Science Foundation to Oglala Lakota College and Sinte Gleska
University illustrates the value of such supplementary funding. Oglala Lakota
College will develop a bachelor’s of science program in environmental science,
and Sinte Gleska University will develop a bachelor’s of science program in
computer science with a software engineering emphasis. Sinte Gleska
University will also create a 2-year degree program in basic engineering.16
Another major effort by the tribal colleges to build a diversified funding base
was the founding of the Tribal College Fund. This independent foundation has
15
American Indian Higher Education Consortium, Testimony to the Senate Agricultural, Rural Development, and Related AgenciesSubcommittee, U.S. Senate, May 31, 1995.
16M.E. Butler, “Tribally controlled colleges can start a technical career,” Diversity Careers, volume III, number 7, winter 1995/spring 1996.
Tribally Controlled Colleges
7-15
raised significant amounts of money over the past decade. The interest earned
on its endowment fund is used to award scholarships to each tribal college.
These additional funds provide resources for the tribal colleges to explore new
programs, new curricula, new forums, and additional and advanced degree
programs for their students and communities. For example, Haskell Indian
Junior College, Sinte Gleska University, Oglala Lakota College, and Salish
Kootenai College have demonstrated that it is possible for the tribal colleges to
offer advanced degree programs. Many of the other tribal colleges are now
studying such options, with an emphasis on becoming 4-year institutions.
EXPANSION TO 4-YEAR INSTITUTIONS
While the majority of tribal colleges have succeeded in becoming
fully accredited 2-year institutions, their expansion to 4-year
institutions is still relatively new. Consequently, tribal colleges
continue to reach out to their non-Indian sister institutions of
higher education, as they have done since the founding of the
tribal college movement. In the early days of the movement, non-Indian
institutions acted as funding conduits to the tribal colleges that had not yet
earned accreditation candidacy. Non-Indian institutions also participated in the
cross-registration of students and lent faculty to the tribal colleges when
requested. This tradition has developed into full partnerships between tribal
colleges and 4-year, non-tribally controlled institutions that provide innovative
science and mathematics opportunities, two-plus-two teacher training programs,
distance learning and other telecommunications programs, and effective
articulation and course transfer agreements to both kinds of institutions.
(
7-16
CONCLUSION
Even with all the advances over the past 30 years of the tribal college
movement, there are still major challenges facing tribes hoping to develop and
found new tribal colleges. Identifying and obtaining funding and
maintaining the will to persevere in the face of all the difficulties
inherent in such efforts are examples of two of these challenges.
Currently there are 30 tribally controlled colleges serving tribes on
geographically isolated reservations scattered across the western
half of the United States, but there are approximately 360 federally recognized
Indian reservations. There is much room for growth in the tribal college
movement, if adequate resources and leadership can be brought together in
Indian country.
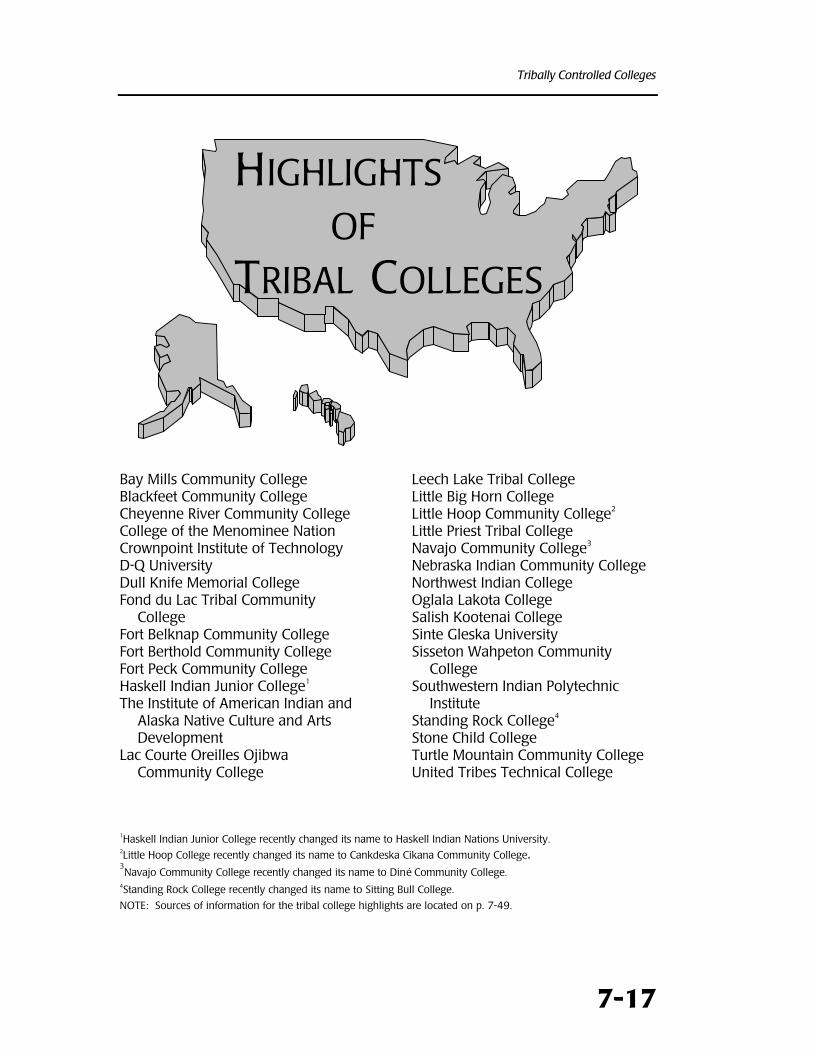
Tribally Controlled Colleges
7-17
Bay Mills Community CollegeBlackfeet Community CollegeCheyenne River Community CollegeCollege of the Menominee NationCrownpoint Institute of TechnologyD-Q UniversityDull Knife Memorial CollegeFond du Lac Tribal Community
CollegeFort Belknap Community CollegeFort Berthold Community CollegeFort Peck Community CollegeHaskell Indian Junior College1
The Institute of American Indian andAlaska Native Culture and ArtsDevelopment
Lac Courte Oreilles OjibwaCommunity College
Leech Lake Tribal CollegeLittle Big Horn CollegeLittle Hoop Community College2
Little Priest Tribal CollegeNavajo Community College3
Nebraska Indian Community CollegeNorthwest Indian CollegeOglala Lakota CollegeSalish Kootenai CollegeSinte Gleska UniversitySisseton Wahpeton Community
CollegeSouthwestern Indian Polytechnic
InstituteStanding Rock College4
Stone Child CollegeTurtle Mountain Community CollegeUnited Tribes Technical College
1Haskell Indian Junior College recently changed its name to Haskell Indian Nations University.2Little Hoop College recently changed its name to Cankdeska Cikana Community College.3Navajo Community College recently changed its name to Diné Community College.
4Standing Rock College recently changed its name to Sitting Bull College.
NOTE: Sources of information for the tribal college highlights are located on p. 7-49.
HIGHLIGHTSOF
TRIBAL COLLEGES

(
7-18
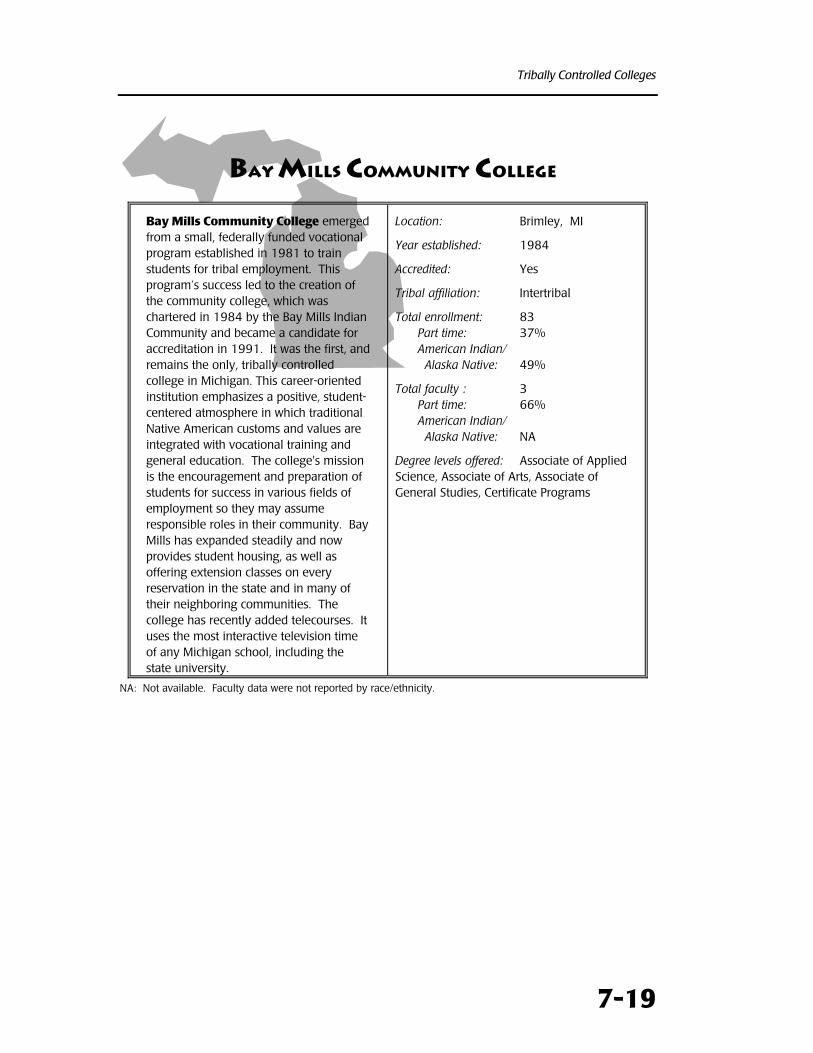
Tribally Controlled Colleges
7-19
BAY MILLS COMMUNITY COLLEGE
Bay Mills Community College emergedfrom a small, federally funded vocationalprogram established in 1981 to trainstudents for tribal employment. Thisprogram’s success led to the creation ofthe community college, which waschartered in 1984 by the Bay Mills IndianCommunity and became a candidate foraccreditation in 1991. It was the first, andremains the only, tribally controlledcollege in Michigan. This career-orientedinstitution emphasizes a positive, student-centered atmosphere in which traditionalNative American customs and values areintegrated with vocational training andgeneral education. The college's missionis the encouragement and preparation ofstudents for success in various fields ofemployment so they may assumeresponsible roles in their community. BayMills has expanded steadily and nowprovides student housing, as well asoffering extension classes on everyreservation in the state and in many oftheir neighboring communities. Thecollege has recently added telecourses. Ituses the most interactive television timeof any Michigan school, including thestate university.
Location: Brimley, MI
Year established: 1984
Accredited: Yes
Tribal affiliation: Intertribal
Total enrollment: 83Part time: 37%American Indian/ Alaska Native: 49%
Total faculty : 3Part time: 66%American Indian/ Alaska Native: NA
Degree levels offered: Associate of AppliedScience, Associate of Arts, Associate ofGeneral Studies, Certificate Programs
NA: Not available. Faculty data were not reported by race/ethnicity.
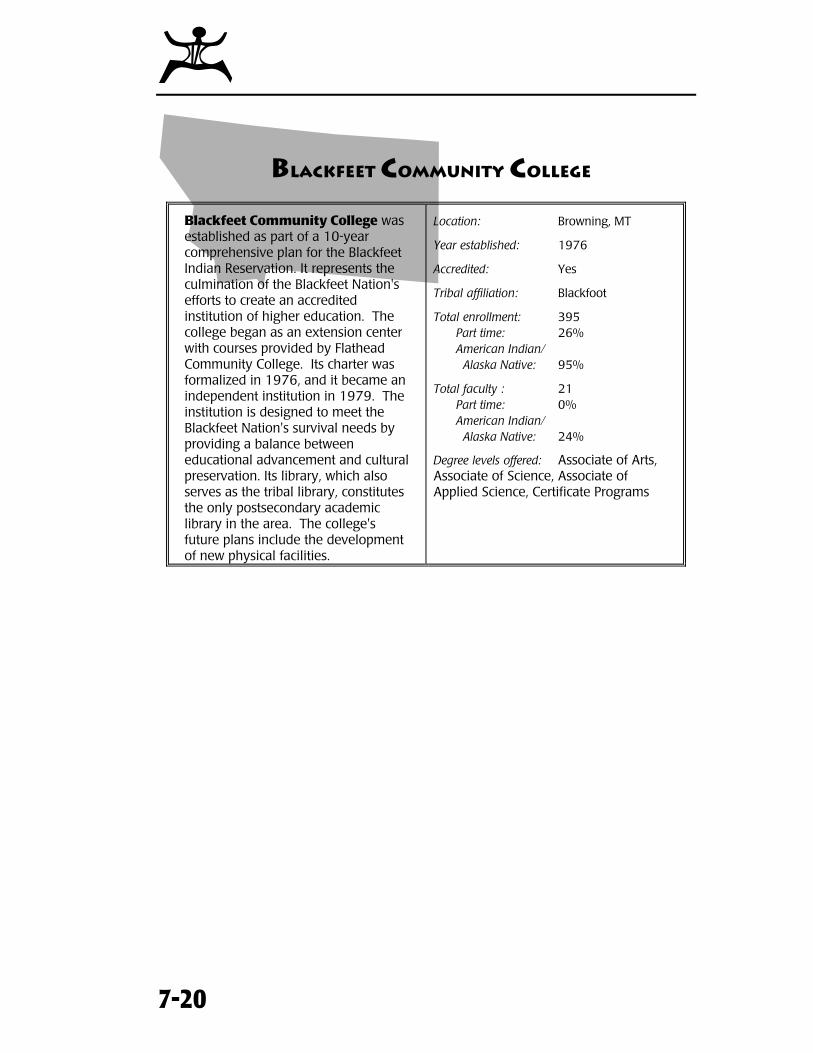
(
7-20
BLACKFEET COMMUNITY COLLEGE
Blackfeet Community College wasestablished as part of a 10-yearcomprehensive plan for the BlackfeetIndian Reservation. It represents theculmination of the Blackfeet Nation'sefforts to create an accreditedinstitution of higher education. Thecollege began as an extension centerwith courses provided by FlatheadCommunity College. Its charter wasformalized in 1976, and it became anindependent institution in 1979. Theinstitution is designed to meet theBlackfeet Nation's survival needs byproviding a balance betweeneducational advancement and culturalpreservation. Its library, which alsoserves as the tribal library, constitutesthe only postsecondary academiclibrary in the area. The college'sfuture plans include the developmentof new physical facilities.
Location: Browning, MT
Year established: 1976
Accredited: Yes
Tribal affiliation: Blackfoot
Total enrollment: 395Part time: 26%American Indian/ Alaska Native: 95%
Total faculty : 21Part time: 0%American Indian/ Alaska Native: 24%
Degree levels offered: Associate of Arts,Associate of Science, Associate ofApplied Science, Certificate Programs
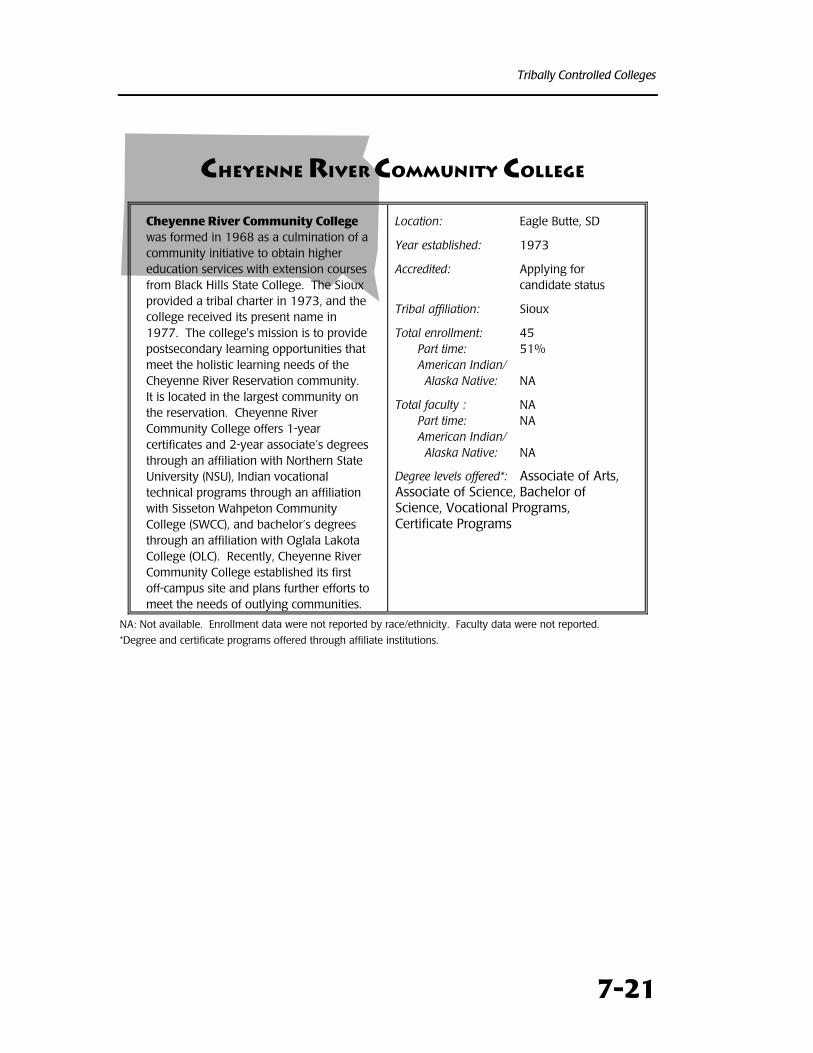
Tribally Controlled Colleges
7-21
cHEYENNE RIVER COMMUNITY COLLEGE
Cheyenne River Community Collegewas formed in 1968 as a culmination of acommunity initiative to obtain highereducation services with extension coursesfrom Black Hills State College. The Siouxprovided a tribal charter in 1973, and thecollege received its present name in1977. The college's mission is to providepostsecondary learning opportunities thatmeet the holistic learning needs of theCheyenne River Reservation community. It is located in the largest community onthe reservation. Cheyenne RiverCommunity College offers 1-yearcertificates and 2-year associate’s degreesthrough an affiliation with Northern StateUniversity (NSU), Indian vocationaltechnical programs through an affiliationwith Sisseton Wahpeton CommunityCollege (SWCC), and bachelor’s degreesthrough an affiliation with Oglala LakotaCollege (OLC). Recently, Cheyenne RiverCommunity College established its firstoff-campus site and plans further efforts tomeet the needs of outlying communities.
Location: Eagle Butte, SD
Year established: 1973
Accredited: Applying forcandidate status
Tribal affiliation: Sioux
Total enrollment: 45Part time: 51%American Indian/ Alaska Native: NA
Total faculty : NAPart time: NAAmerican Indian/ Alaska Native: NA
Degree levels offered*: Associate of Arts,Associate of Science, Bachelor ofScience, Vocational Programs,Certificate Programs
NA: Not available. Enrollment data were not reported by race/ethnicity. Faculty data were not reported.
*Degree and certificate programs offered through affiliate institutions.
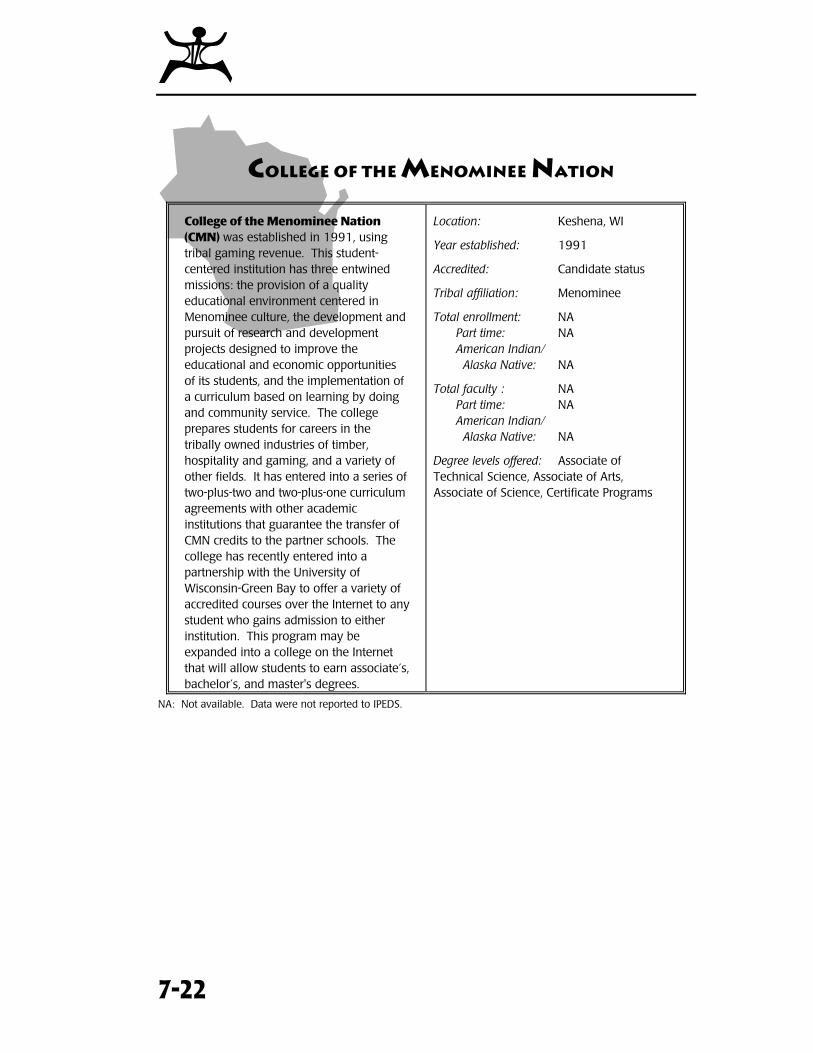
(
7-22
cOLLEGE OF THE MENOMINEE NATION
College of the Menominee Nation(CMN) was established in 1991, usingtribal gaming revenue. This student-centered institution has three entwinedmissions: the provision of a qualityeducational environment centered inMenominee culture, the development andpursuit of research and developmentprojects designed to improve theeducational and economic opportunitiesof its students, and the implementation ofa curriculum based on learning by doingand community service. The collegeprepares students for careers in thetribally owned industries of timber,hospitality and gaming, and a variety ofother fields. It has entered into a series oftwo-plus-two and two-plus-one curriculumagreements with other academicinstitutions that guarantee the transfer ofCMN credits to the partner schools. Thecollege has recently entered into apartnership with the University ofWisconsin-Green Bay to offer a variety ofaccredited courses over the Internet to anystudent who gains admission to eitherinstitution. This program may beexpanded into a college on the Internetthat will allow students to earn associate’s,bachelor’s, and master's degrees.
Location: Keshena, WI
Year established: 1991
Accredited: Candidate status
Tribal affiliation: Menominee
Total enrollment: NAPart time: NAAmerican Indian/ Alaska Native: NA
Total faculty : NAPart time: NAAmerican Indian/ Alaska Native: NA
Degree levels offered: Associate ofTechnical Science, Associate of Arts,Associate of Science, Certificate Programs
NA: Not available. Data were not reported to IPEDS.
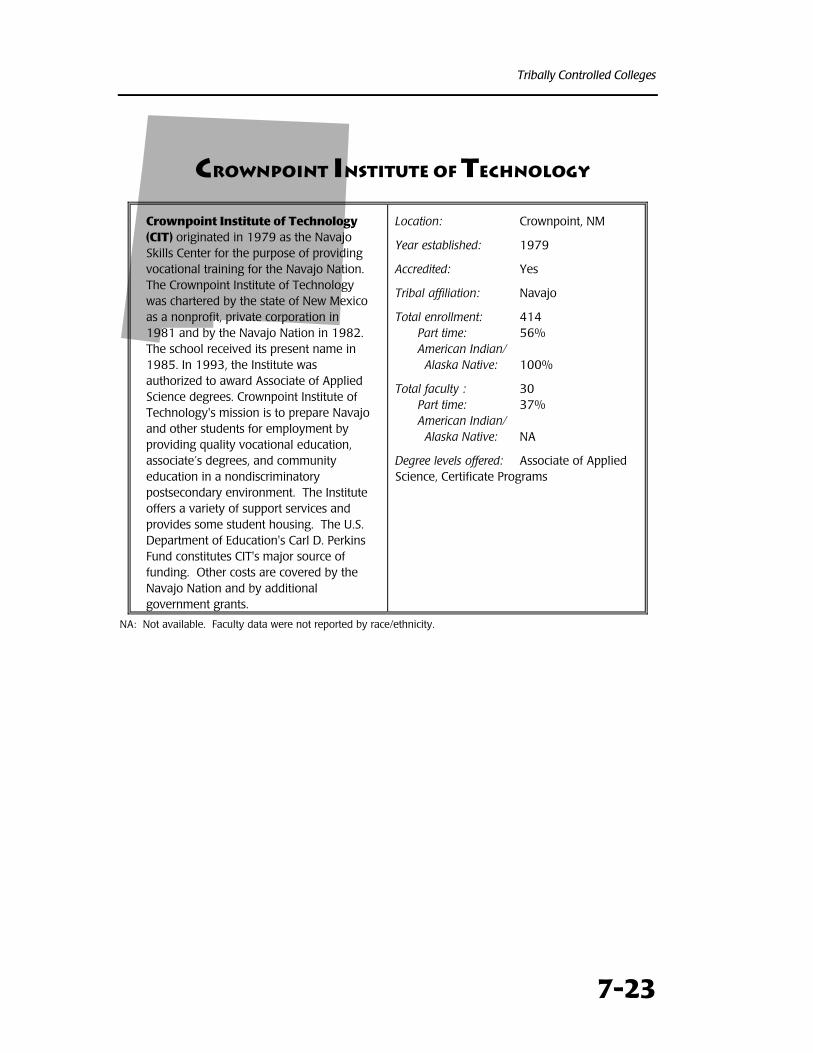
Tribally Controlled Colleges
7-23
cROWNPOINT INSTITUTE OF TECHNOLOGY
Crownpoint Institute of Technology(CIT) originated in 1979 as the NavajoSkills Center for the purpose of providingvocational training for the Navajo Nation. The Crownpoint Institute of Technologywas chartered by the state of New Mexicoas a nonprofit, private corporation in1981 and by the Navajo Nation in 1982. The school received its present name in1985. In 1993, the Institute wasauthorized to award Associate of AppliedScience degrees. Crownpoint Institute ofTechnology's mission is to prepare Navajoand other students for employment byproviding quality vocational education,associate’s degrees, and communityeducation in a nondiscriminatorypostsecondary environment. The Instituteoffers a variety of support services andprovides some student housing. The U.S.Department of Education's Carl D. PerkinsFund constitutes CIT's major source offunding. Other costs are covered by theNavajo Nation and by additionalgovernment grants.
Location: Crownpoint, NM
Year established: 1979
Accredited: Yes
Tribal affiliation: Navajo
Total enrollment: 414Part time: 56%American Indian/ Alaska Native: 100%
Total faculty : 30Part time: 37%American Indian/ Alaska Native: NA
Degree levels offered: Associate of AppliedScience, Certificate Programs
NA: Not available. Faculty data were not reported by race/ethnicity.
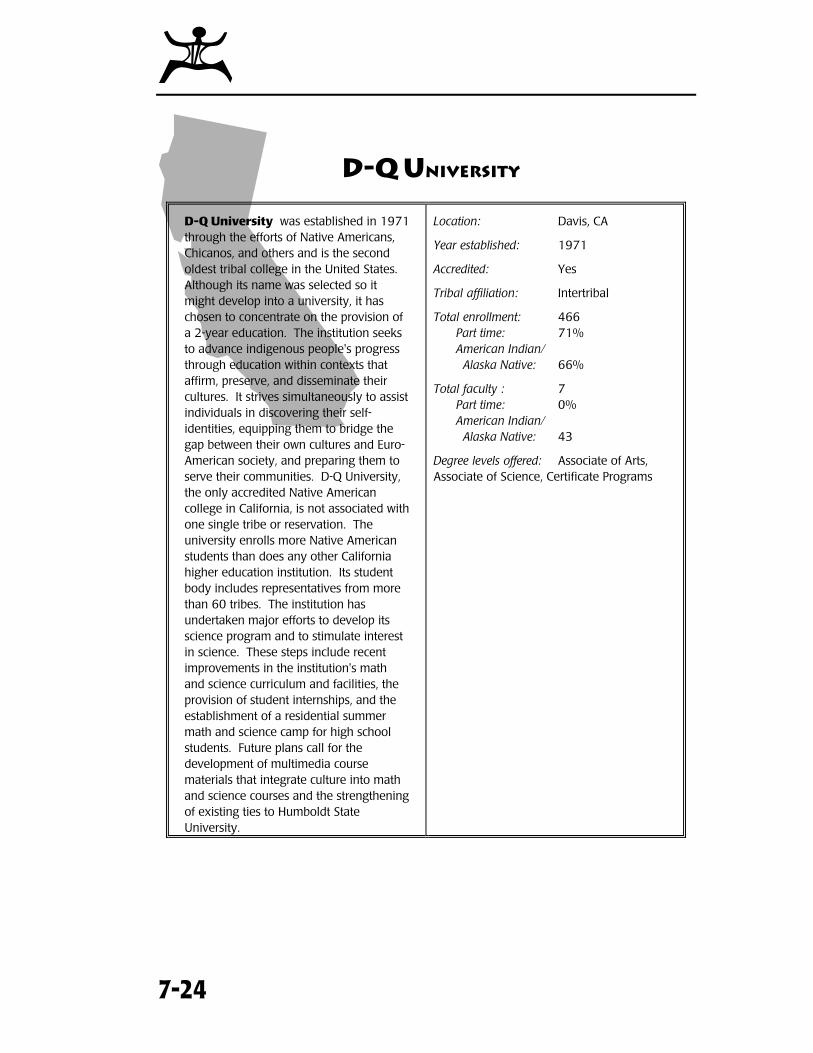
(
7-24
D-Q uNIVERSITY
D-Q University was established in 1971through the efforts of Native Americans,Chicanos, and others and is the secondoldest tribal college in the United States.Although its name was selected so itmight develop into a university, it haschosen to concentrate on the provision ofa 2-year education. The institution seeksto advance indigenous people's progressthrough education within contexts thataffirm, preserve, and disseminate theircultures. It strives simultaneously to assistindividuals in discovering their self-identities, equipping them to bridge thegap between their own cultures and Euro-American society, and preparing them toserve their communities. D-Q University,the only accredited Native Americancollege in California, is not associated withone single tribe or reservation. Theuniversity enrolls more Native Americanstudents than does any other Californiahigher education institution. Its studentbody includes representatives from morethan 60 tribes. The institution hasundertaken major efforts to develop itsscience program and to stimulate interestin science. These steps include recentimprovements in the institution's mathand science curriculum and facilities, theprovision of student internships, and theestablishment of a residential summermath and science camp for high schoolstudents. Future plans call for thedevelopment of multimedia coursematerials that integrate culture into mathand science courses and the strengtheningof existing ties to Humboldt StateUniversity.
Location: Davis, CA
Year established: 1971
Accredited: Yes
Tribal affiliation: Intertribal
Total enrollment: 466Part time: 71%American Indian/ Alaska Native: 66%
Total faculty : 7Part time: 0%American Indian/ Alaska Native: 43
Degree levels offered: Associate of Arts,Associate of Science, Certificate Programs
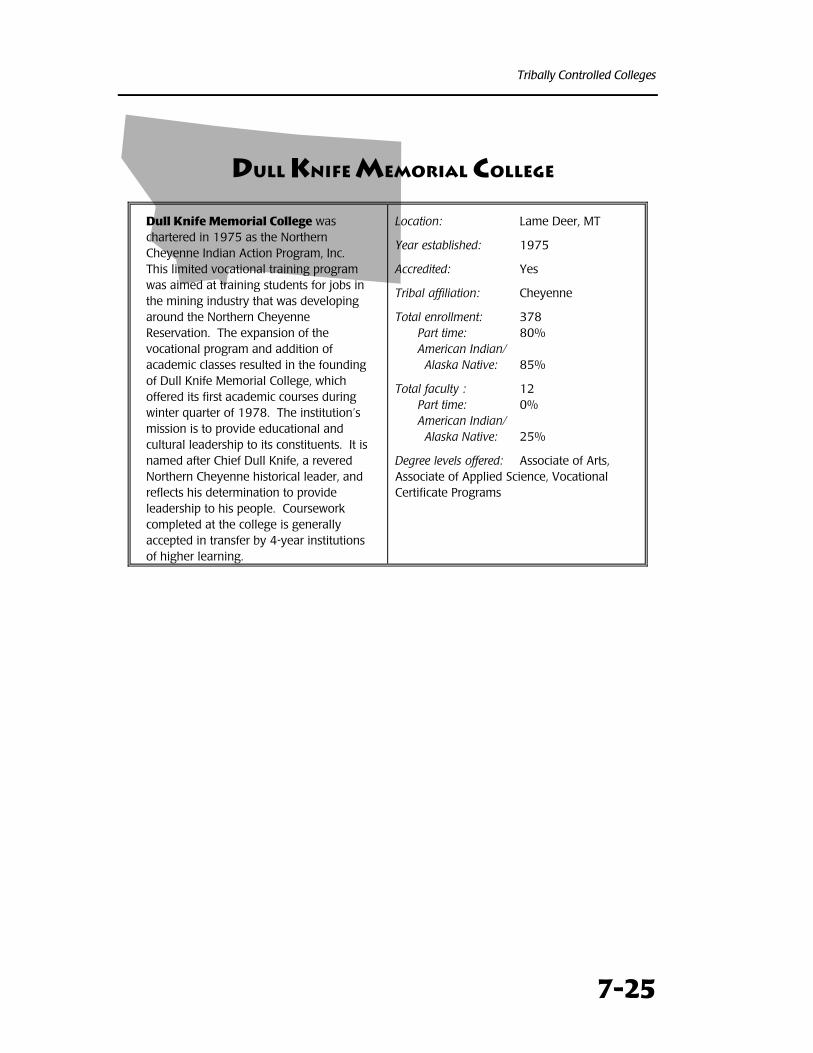
Tribally Controlled Colleges
7-25
dULL KNIFE mEMORIAL COLLEGE
Dull Knife Memorial College waschartered in 1975 as the NorthernCheyenne Indian Action Program, Inc. This limited vocational training programwas aimed at training students for jobs inthe mining industry that was developingaround the Northern CheyenneReservation. The expansion of thevocational program and addition ofacademic classes resulted in the foundingof Dull Knife Memorial College, whichoffered its first academic courses duringwinter quarter of 1978. The institution’smission is to provide educational andcultural leadership to its constituents. It isnamed after Chief Dull Knife, a reveredNorthern Cheyenne historical leader, andreflects his determination to provideleadership to his people. Courseworkcompleted at the college is generallyaccepted in transfer by 4-year institutionsof higher learning.
Location: Lame Deer, MT
Year established: 1975
Accredited: Yes
Tribal affiliation: Cheyenne
Total enrollment: 378Part time: 80%American Indian/ Alaska Native: 85%
Total faculty : 12Part time: 0%American Indian/ Alaska Native: 25%
Degree levels offered: Associate of Arts,Associate of Applied Science, VocationalCertificate Programs
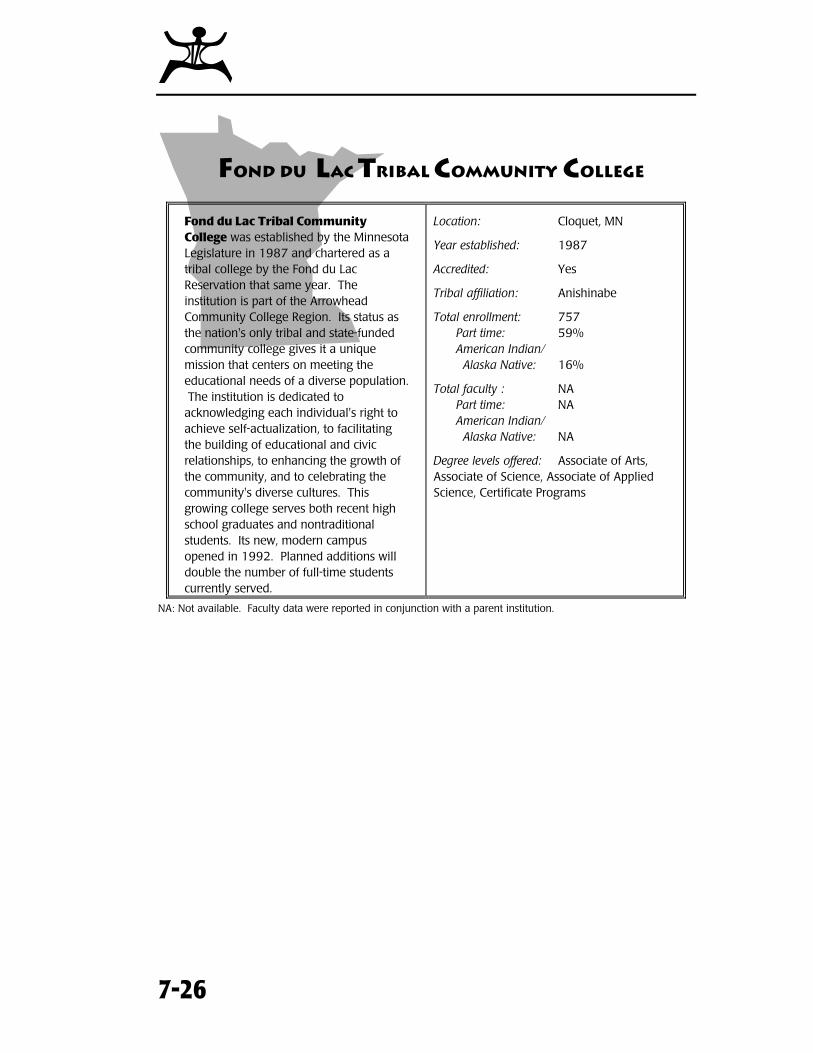
(
7-26
fOND DU LAC TRIBAL COMMUNITY COLLEGE
Fond du Lac Tribal CommunityCollege was established by the MinnesotaLegislature in 1987 and chartered as atribal college by the Fond du LacReservation that same year. Theinstitution is part of the ArrowheadCommunity College Region. Its status asthe nation's only tribal and state-fundedcommunity college gives it a uniquemission that centers on meeting theeducational needs of a diverse population. The institution is dedicated toacknowledging each individual's right toachieve self-actualization, to facilitatingthe building of educational and civicrelationships, to enhancing the growth ofthe community, and to celebrating thecommunity's diverse cultures. Thisgrowing college serves both recent highschool graduates and nontraditionalstudents. Its new, modern campusopened in 1992. Planned additions willdouble the number of full-time studentscurrently served.
Location: Cloquet, MN
Year established: 1987
Accredited: Yes
Tribal affiliation: Anishinabe
Total enrollment: 757Part time: 59%American Indian/ Alaska Native: 16%
Total faculty : NAPart time: NAAmerican Indian/ Alaska Native: NA
Degree levels offered: Associate of Arts,Associate of Science, Associate of AppliedScience, Certificate Programs
NA: Not available. Faculty data were reported in conjunction with a parent institution.
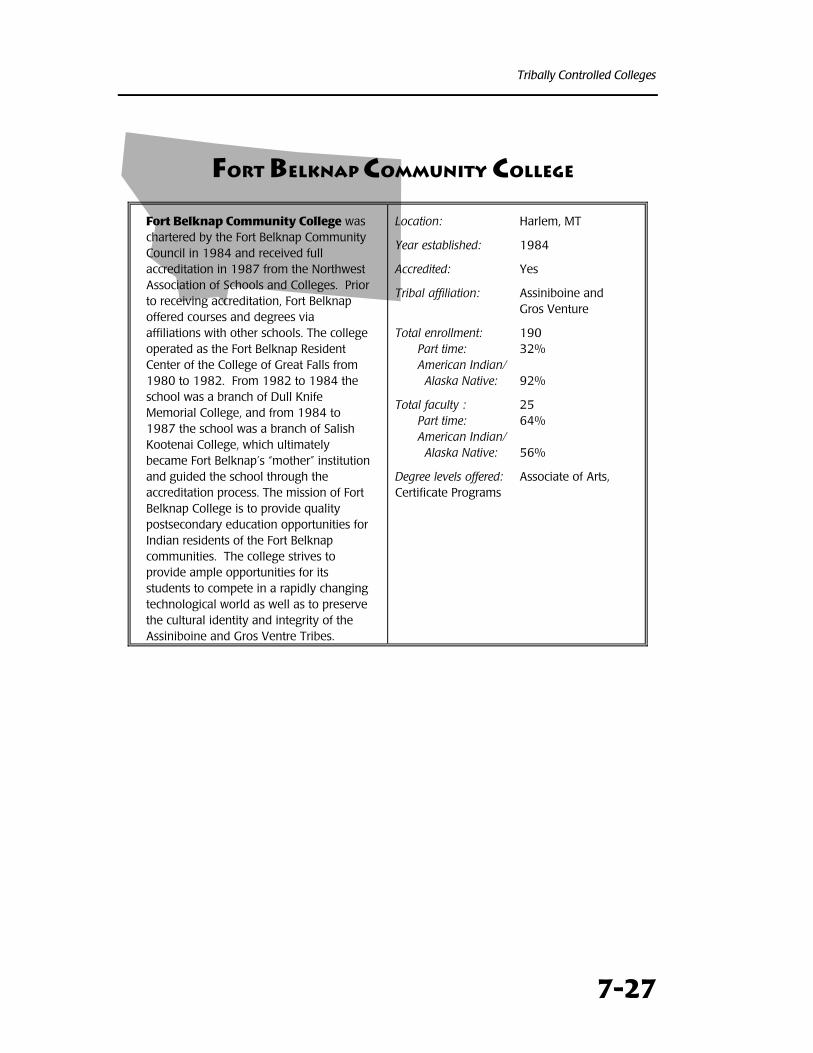
Tribally Controlled Colleges
7-27
fORT BELKNAP COMMUNITY COLLEGE
Fort Belknap Community College waschartered by the Fort Belknap CommunityCouncil in 1984 and received fullaccreditation in 1987 from the NorthwestAssociation of Schools and Colleges. Priorto receiving accreditation, Fort Belknapoffered courses and degrees viaaffiliations with other schools. The collegeoperated as the Fort Belknap ResidentCenter of the College of Great Falls from1980 to 1982. From 1982 to 1984 theschool was a branch of Dull KnifeMemorial College, and from 1984 to1987 the school was a branch of SalishKootenai College, which ultimatelybecame Fort Belknap’s “mother” institutionand guided the school through theaccreditation process. The mission of FortBelknap College is to provide qualitypostsecondary education opportunities forIndian residents of the Fort Belknapcommunities. The college strives toprovide ample opportunities for itsstudents to compete in a rapidly changingtechnological world as well as to preservethe cultural identity and integrity of theAssiniboine and Gros Ventre Tribes.
Location: Harlem, MT
Year established: 1984
Accredited: Yes
Tribal affiliation: Assiniboine andGros Venture
Total enrollment: 190Part time: 32%American Indian/ Alaska Native: 92%
Total faculty : 25Part time: 64%American Indian/ Alaska Native: 56%
Degree levels offered: Associate of Arts,Certificate Programs
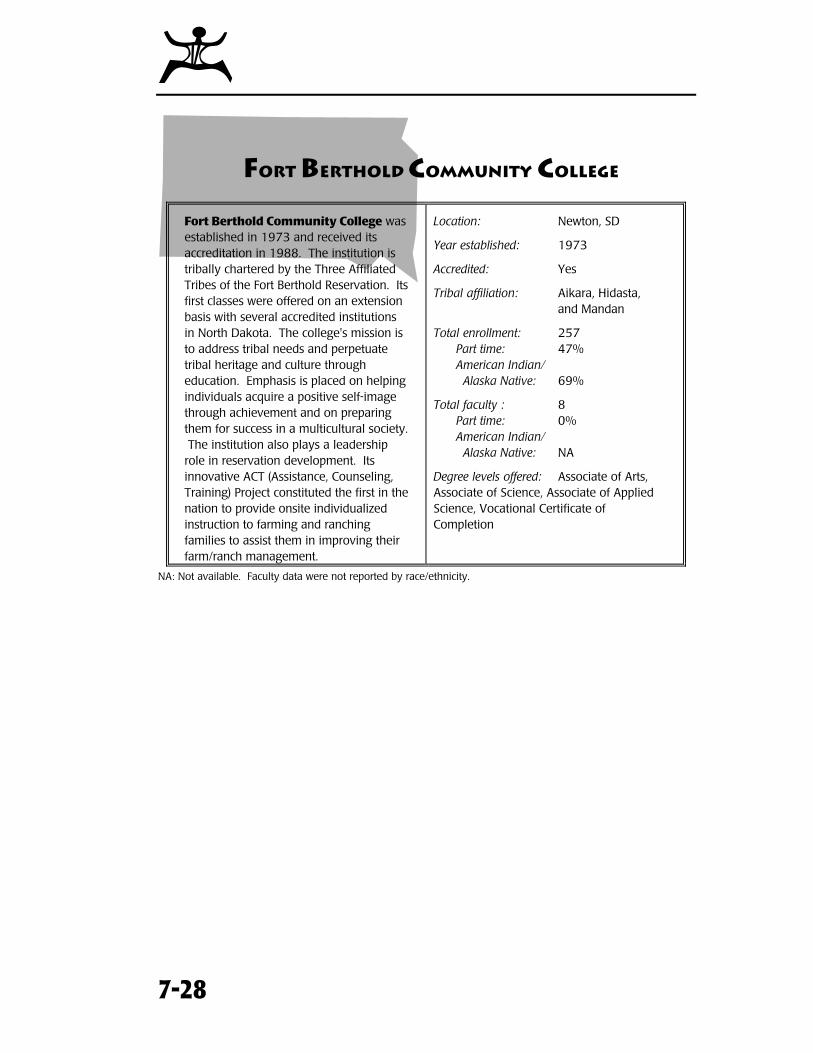
(
7-28
fORT BERTHOLD COMMUNITY COLLEGE
Fort Berthold Community College wasestablished in 1973 and received itsaccreditation in 1988. The institution istribally chartered by the Three AffiliatedTribes of the Fort Berthold Reservation. Itsfirst classes were offered on an extensionbasis with several accredited institutionsin North Dakota. The college's mission isto address tribal needs and perpetuatetribal heritage and culture througheducation. Emphasis is placed on helpingindividuals acquire a positive self-imagethrough achievement and on preparingthem for success in a multicultural society. The institution also plays a leadershiprole in reservation development. Itsinnovative ACT (Assistance, Counseling,Training) Project constituted the first in thenation to provide onsite individualizedinstruction to farming and ranchingfamilies to assist them in improving theirfarm/ranch management.
Location: Newton, SD
Year established: 1973
Accredited: Yes
Tribal affiliation: Aikara, Hidasta,and Mandan
Total enrollment: 257Part time: 47%American Indian/ Alaska Native: 69%
Total faculty : 8Part time: 0%American Indian/ Alaska Native: NA
Degree levels offered: Associate of Arts,Associate of Science, Associate of AppliedScience, Vocational Certificate ofCompletion
NA: Not available. Faculty data were not reported by race/ethnicity.
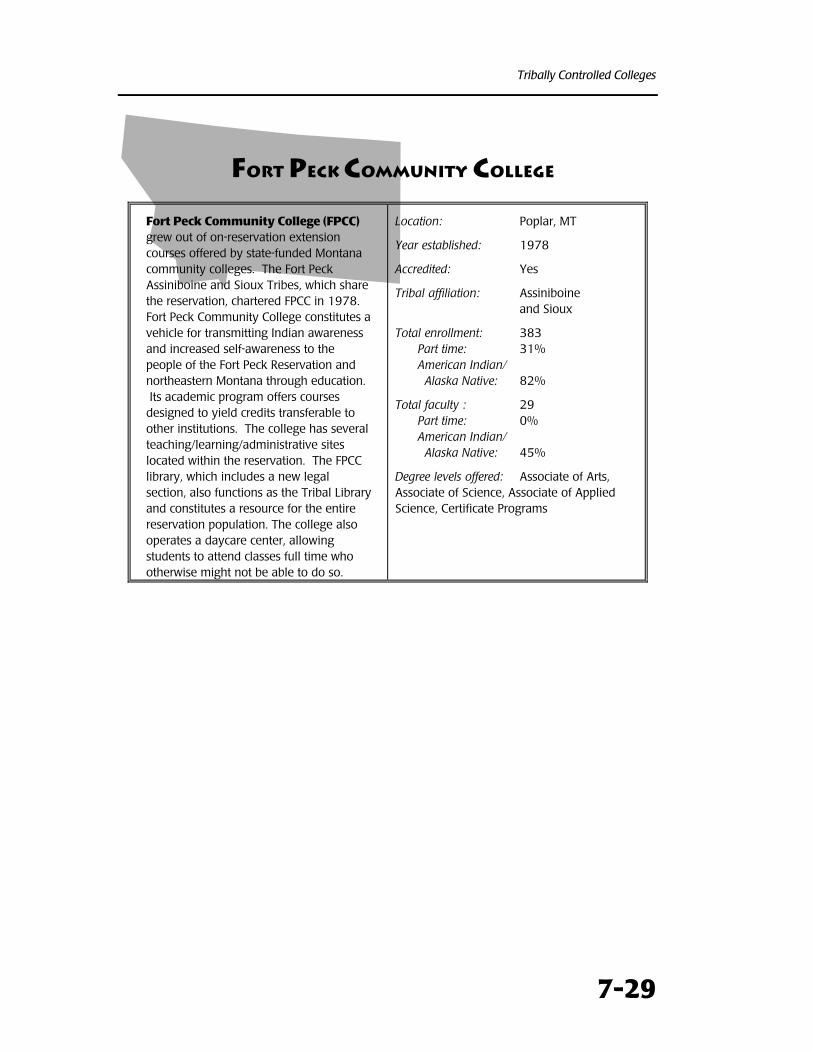
Tribally Controlled Colleges
7-29
fORT PECK COMMUNITY COLLEGE
Fort Peck Community College (FPCC)grew out of on-reservation extensioncourses offered by state-funded Montanacommunity colleges. The Fort PeckAssiniboine and Sioux Tribes, which sharethe reservation, chartered FPCC in 1978. Fort Peck Community College constitutes avehicle for transmitting Indian awarenessand increased self-awareness to thepeople of the Fort Peck Reservation andnortheastern Montana through education. Its academic program offers coursesdesigned to yield credits transferable toother institutions. The college has severalteaching/learning/administrative siteslocated within the reservation. The FPCClibrary, which includes a new legalsection, also functions as the Tribal Libraryand constitutes a resource for the entirereservation population. The college alsooperates a daycare center, allowingstudents to attend classes full time whootherwise might not be able to do so.
Location: Poplar, MT
Year established: 1978
Accredited: Yes
Tribal affiliation: Assiniboineand Sioux
Total enrollment: 383Part time: 31%American Indian/ Alaska Native: 82%
Total faculty : 29Part time: 0%American Indian/ Alaska Native: 45%
Degree levels offered: Associate of Arts,Associate of Science, Associate of AppliedScience, Certificate Programs
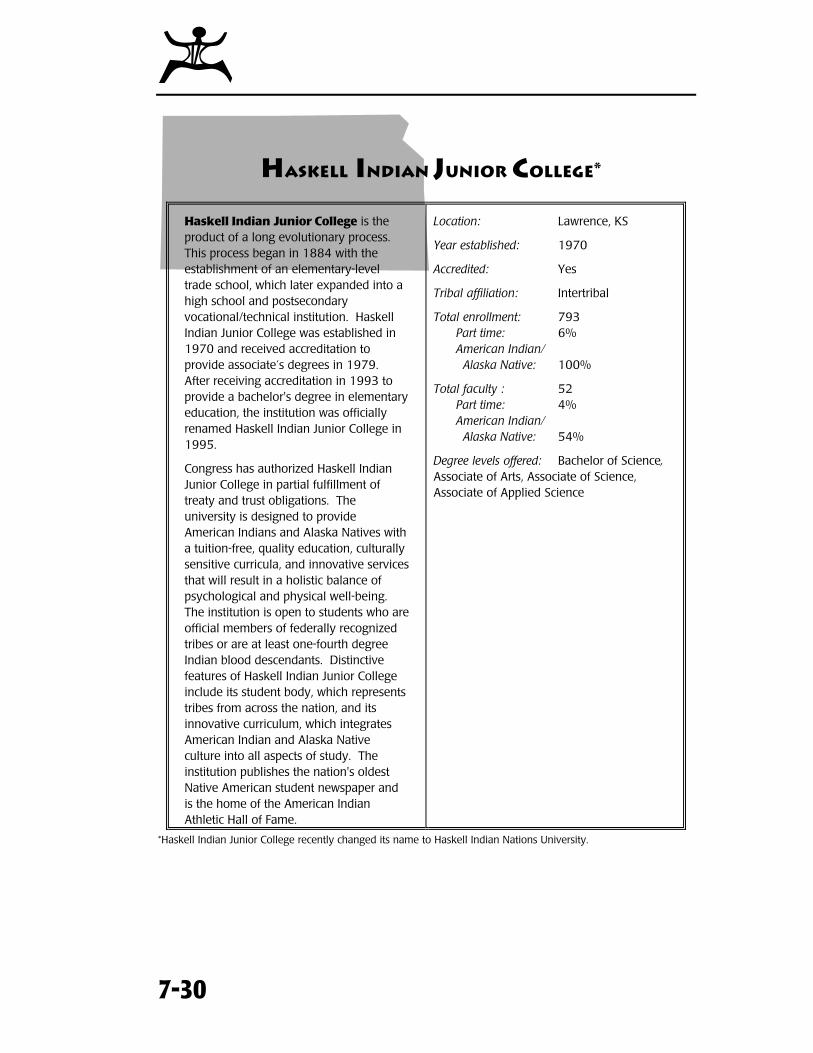
(
7-30
HASKELL INDIAN JUNIOR COLLEGE*
Haskell Indian Junior College is theproduct of a long evolutionary process. This process began in 1884 with theestablishment of an elementary-leveltrade school, which later expanded into ahigh school and postsecondaryvocational/technical institution. HaskellIndian Junior College was established in1970 and received accreditation toprovide associate’s degrees in 1979. After receiving accreditation in 1993 toprovide a bachelor's degree in elementaryeducation, the institution was officiallyrenamed Haskell Indian Junior College in1995.
Congress has authorized Haskell IndianJunior College in partial fulfillment oftreaty and trust obligations. Theuniversity is designed to provideAmerican Indians and Alaska Natives witha tuition-free, quality education, culturallysensitive curricula, and innovative servicesthat will result in a holistic balance ofpsychological and physical well-being. The institution is open to students who areofficial members of federally recognizedtribes or are at least one-fourth degreeIndian blood descendants. Distinctivefeatures of Haskell Indian Junior Collegeinclude its student body, which representstribes from across the nation, and itsinnovative curriculum, which integratesAmerican Indian and Alaska Nativeculture into all aspects of study. Theinstitution publishes the nation's oldestNative American student newspaper andis the home of the American IndianAthletic Hall of Fame.
Location: Lawrence, KS
Year established: 1970
Accredited: Yes
Tribal affiliation: Intertribal
Total enrollment: 793Part time: 6%American Indian/ Alaska Native: 100%
Total faculty : 52Part time: 4%American Indian/ Alaska Native: 54%
Degree levels offered: Bachelor of Science,Associate of Arts, Associate of Science,Associate of Applied Science
*Haskell Indian Junior College recently changed its name to Haskell Indian Nations University.
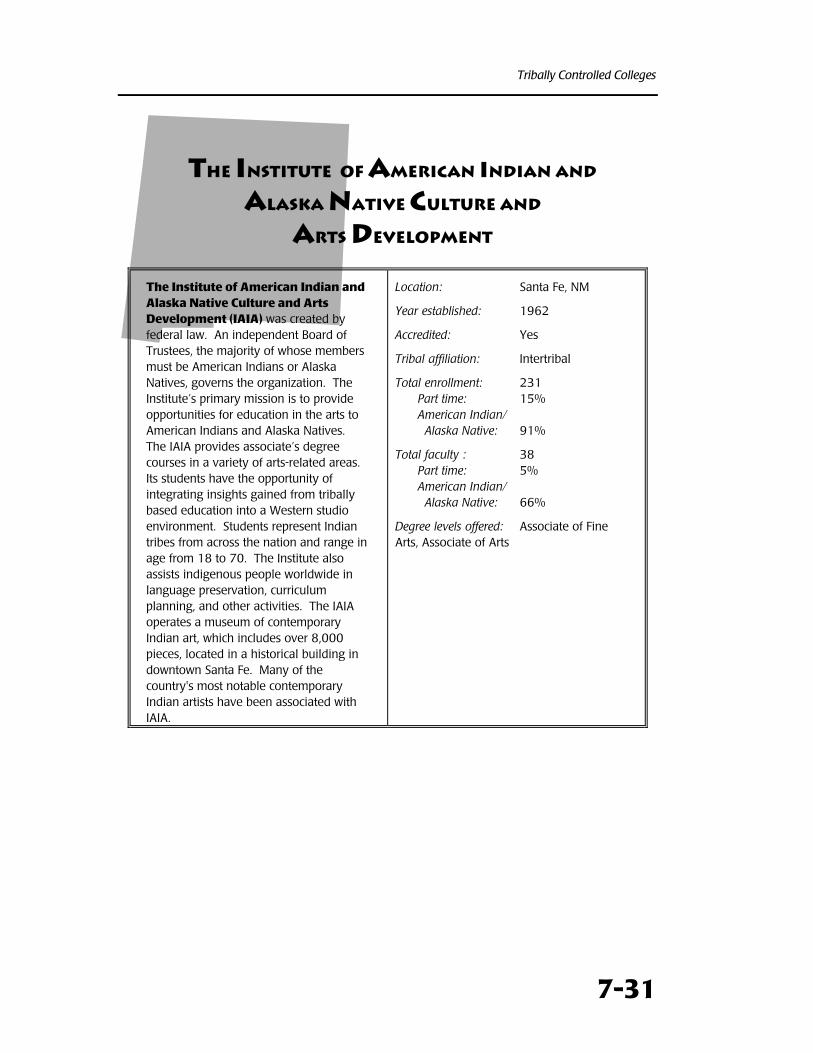
Tribally Controlled Colleges
7-31
THE INSTITUTE OF AMERICAN INDIAN AND
ALASKA NATIVE CULTURE AND
ARTS DEVELOPMENT
The Institute of American Indian andAlaska Native Culture and ArtsDevelopment (IAIA) was created byfederal law. An independent Board ofTrustees, the majority of whose membersmust be American Indians or AlaskaNatives, governs the organization. TheInstitute’s primary mission is to provideopportunities for education in the arts toAmerican Indians and Alaska Natives. The IAIA provides associate’s degreecourses in a variety of arts-related areas. Its students have the opportunity ofintegrating insights gained from triballybased education into a Western studioenvironment. Students represent Indiantribes from across the nation and range inage from 18 to 70. The Institute alsoassists indigenous people worldwide inlanguage preservation, curriculumplanning, and other activities. The IAIAoperates a museum of contemporaryIndian art, which includes over 8,000pieces, located in a historical building indowntown Santa Fe. Many of thecountry's most notable contemporaryIndian artists have been associated withIAIA.
Location: Santa Fe, NM
Year established: 1962
Accredited: Yes
Tribal affiliation: Intertribal
Total enrollment: 231Part time: 15%American Indian/ Alaska Native: 91%
Total faculty : 38Part time: 5%American Indian/ Alaska Native: 66%
Degree levels offered: Associate of FineArts, Associate of Arts
(
7-32
LAC COURTE OREILLES OJIBWA
COMMUNITY COLLEGE
Lac Courte Oreilles OjibwaCommunity College was chartered bythe Lac Courte Oreilles Band of LakeSuperior Chippewa Indians in 1982 anddraws most of its students from the LacCourte Oreilles Reservation. Its mission isthe provision of postsecondary andcontinuing education within the Indiancommunity. The curriculum is designed toreflect and strengthen Ojibwa culture andtribal self-determination, while providingopportunities for individual self-improvement in today's technologicalworld. The Tribal Governing Boardrecently granted the college over 100acres of land to be used for naturalresources and agricultural research,training, and demonstration. The collegehas a state-of-the-art, interactive DistanceLearning Studio. This facility providesstudents with access to a wide range ofeducational programming and is also usedto teach the Ojibwa language at severalhigh schools. The college has a two-plus-two program with the University ofWisconsin-Eau Claire, which enables itsstudents to obtain bachelor of nursingdegrees. Future plans include theestablishment of additional two-plus-twoprograms with other colleges anduniversities and the development of 4-year degrees in social work, teaching, andnatural resources.
Location: Hayward, WI
Year established: 1982
Accredited: Yes
Tribal affiliation: Chippewa
Total enrollment: 468Part time: 62%American Indian/ Alaska Native: 80%
Total faculty : 16Part time: 13%American Indian/ Alaska Native: NA
Degree levels offered: Associate of Arts,Associate of Applied Science, CertificatePrograms
NA: Not available. Faculty data were not reported by race/ethnicity.
Tribally Controlled Colleges
7-33
LEECH LAKE TRIBAL COLLEGE
Leech Lake Tribal College wasauthorized by the Leech Lake Band ofChippewa (Anishinabeg) in 1990. Its firstcourses were offered on an extensionbasis by other universities and colleges inMinnesota. The college began offeringits own courses in 1993. It now operatesout of a former high school building andother accommodations throughout thereservation. The college's missioninvolves providing all persons with aquality education that centers on thetransmission of Anishinabe spirituality,history, culture, and language. Theinstitution is also intended to serve as aneducational bridge for Leech Lake tribalmembers who wish to continue theireducation at 4-year institutions. LeechLake Tribal College constitutes the centerfor the study of Anishinabe culture andlanguage studies in Minnesota. Itsphilosophy is exemplified by its healthand healing department, which teachesusing a holistic approach that exemplifiesAmerican Indian knowledge and values.
Location: Cass Lake, MN
Year established: 1990
Accredited: Applying forcandidate status
Tribal affiliation: Anishinabeg
Total enrollment: NAPart time: NAAmerican Indian/ Alaska Native: NA
Total faculty : NAPart time: NAAmerican Indian/ Alaska Native: NA
Degree levels offered: Associate of Arts,Associate of Applied Science
NA: Not available. Data were not reported to IPEDS.
(
7-34
LITTLE BIG HORN COLLEGE
Little Big Horn College emerged from theCrow Central Education Commission'sextensive adult and higher educationprogramming efforts. The college, locatedin the capital of the Crow Indianreservation, received its tribal charter in1980. Little Big Horn College has acommitment to the development ofindividual students so that they mayadvance in the workplace or in highereducation and to the preservation andadvancement of the Crow language,culture, and community. Its original focuson vocational programs has widened toinclude a variety of academic offerings. The college's library includes the CrowIndian Archives, which constitute a majorlearning resource. Little Big Horn Collegealso has its own daycare center. Little BigHorn has excellent computer accessibilityvia a new community computer centerthat provides 45 new workstations,bringing the total workstations providingcomputer access to 75.
Location: Crow Agency, MT
Year established: 1980
Accredited: Yes
Tribal affiliation: Crow
Total enrollment: 274Part time: 28%American Indian/ Alaska Native: 91%
Total faculty : 40Part time: 63%American Indian/ Alaska Native: 53%
Degree levels offered: Associate of Arts,Certificate Programs
Tribally Controlled Colleges
7-35
LITTLE HOOP COMMUNITY COLLEGE*
Little Hoop Community College is thepostsecondary institution for the DevilsLake Sioux Tribe. The institution wasnamed in honor of a World War II hero,who received two Purple Hearts forbravery. It began operation in 1974 as asatellite campus of Lake RegionCommunity College. Its mission is toprovide comprehensive postsecondaryeducation that addresses both traditionaland contemporary aspects of learning andassists individuals in achieving theirpersonal goals. The college strives tofacilitate the development of tribalresources and to preserve, enhance, andtransmit the Dakota culture. As part of itsTalent Search program, it offers youth anintensive summer program that affords anoverview of available career options.
Location: Fort Totten, ND
Year established: 1974
Accredited: Yes
Tribal affiliation: Sioux
Total enrollment: 174Part time: 70%American Indian/ Alaska Native: 86%
Total faculty : 23Part time: 0%American Indian/ Alaska Native: 35%
Degree levels offered: Associate of Arts,Associate of Science, Associate of AppliedScience, Certificate Programs
*Little Hoop College recently changed its name to Cankdeska Cikana Community College.
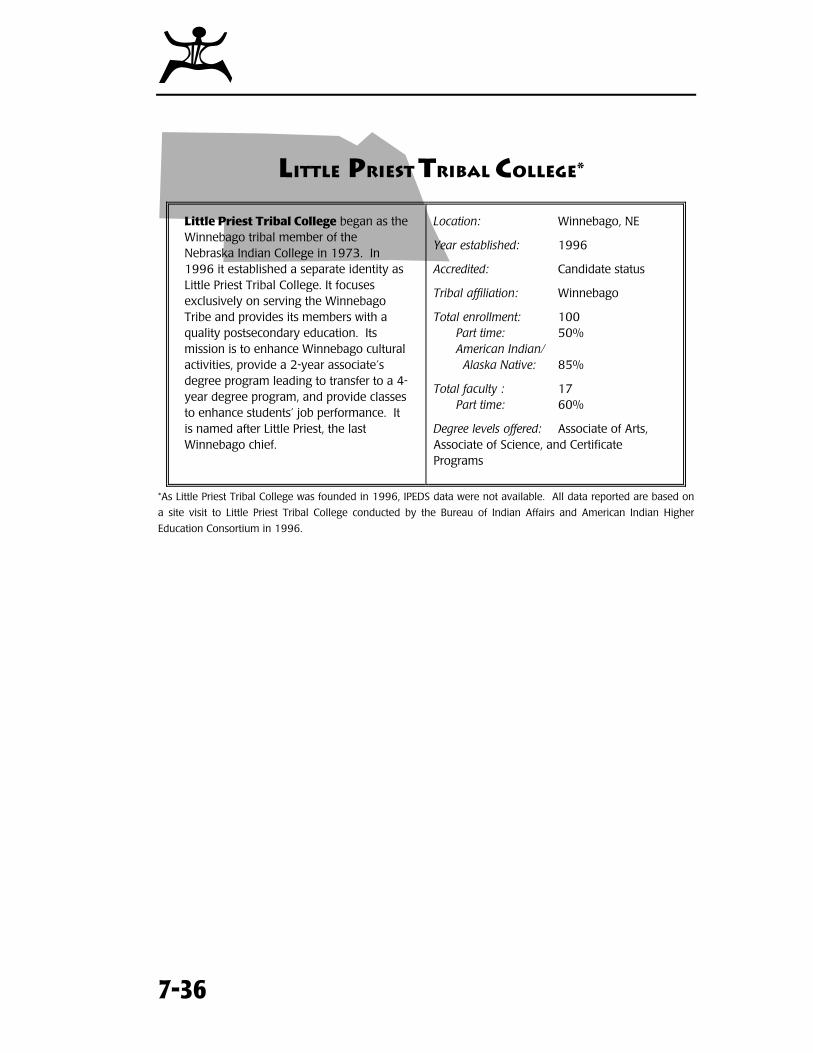
(
7-36
LITTLE PRIEST TRIBAL COLLEGE*
Little Priest Tribal College began as theWinnebago tribal member of theNebraska Indian College in 1973. In1996 it established a separate identity asLittle Priest Tribal College. It focusesexclusively on serving the WinnebagoTribe and provides its members with aquality postsecondary education. Itsmission is to enhance Winnebago culturalactivities, provide a 2-year associate’sdegree program leading to transfer to a 4-year degree program, and provide classesto enhance students’ job performance. Itis named after Little Priest, the lastWinnebago chief.
Location: Winnebago, NE
Year established: 1996
Accredited: Candidate status
Tribal affiliation: Winnebago
Total enrollment: 100Part time: 50%American Indian/ Alaska Native: 85%
Total faculty : 17Part time: 60%
Degree levels offered: Associate of Arts,Associate of Science, and CertificatePrograms
*As Little Priest Tribal College was founded in 1996, IPEDS data were not available. All data reported are based on
a site visit to Little Priest Tribal College conducted by the Bureau of Indian Affairs and American Indian Higher
Education Consortium in 1996.
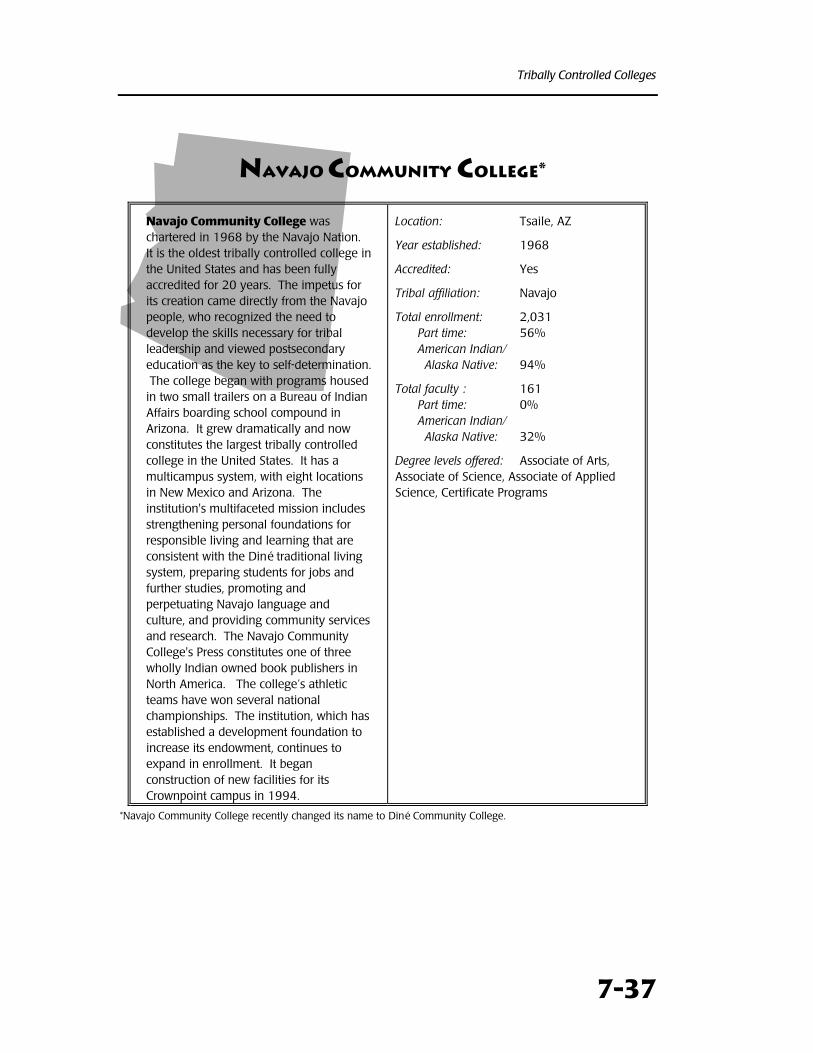
Tribally Controlled Colleges
7-37
NAVAJO COMMUNITY COLLEGE*
Navajo Community College waschartered in 1968 by the Navajo Nation. It is the oldest tribally controlled college inthe United States and has been fullyaccredited for 20 years. The impetus forits creation came directly from the Navajopeople, who recognized the need todevelop the skills necessary for triballeadership and viewed postsecondaryeducation as the key to self-determination. The college began with programs housedin two small trailers on a Bureau of IndianAffairs boarding school compound inArizona. It grew dramatically and nowconstitutes the largest tribally controlledcollege in the United States. It has amulticampus system, with eight locationsin New Mexico and Arizona. Theinstitution's multifaceted mission includesstrengthening personal foundations forresponsible living and learning that areconsistent with the Diné traditional livingsystem, preparing students for jobs andfurther studies, promoting andperpetuating Navajo language andculture, and providing community servicesand research. The Navajo CommunityCollege's Press constitutes one of threewholly Indian owned book publishers inNorth America. The college’s athleticteams have won several nationalchampionships. The institution, which hasestablished a development foundation toincrease its endowment, continues toexpand in enrollment. It beganconstruction of new facilities for itsCrownpoint campus in 1994.
Location: Tsaile, AZ
Year established: 1968
Accredited: Yes
Tribal affiliation: Navajo
Total enrollment: 2,031Part time: 56%American Indian/ Alaska Native: 94%
Total faculty : 161Part time: 0%American Indian/ Alaska Native: 32%
Degree levels offered: Associate of Arts,Associate of Science, Associate of AppliedScience, Certificate Programs
*Navajo Community College recently changed its name to Diné Community College.
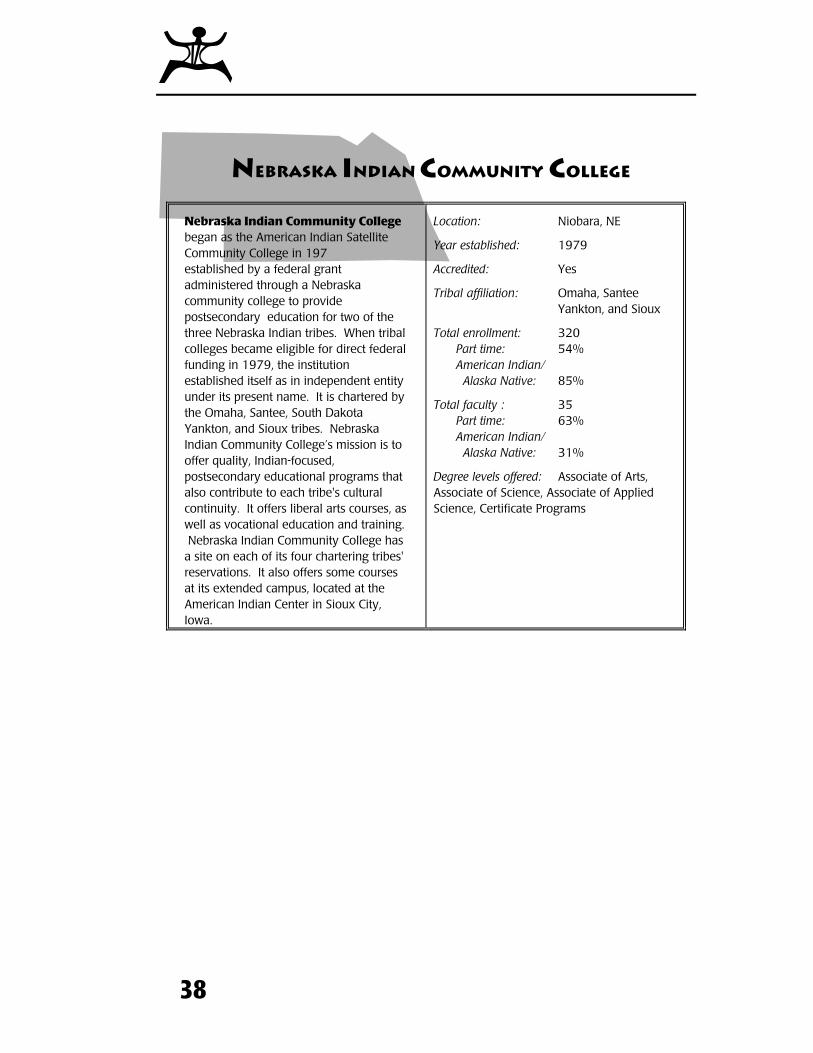
(
38
NEBRASKA INDIAN COMMUNITY COLLEGE
Nebraska Indian Community Collegebegan as the American Indian SatelliteCommunity College in 197established by a federal grantadministered through a Nebraskacommunity college to providepostsecondary education for two of thethree Nebraska Indian tribes. When tribalcolleges became eligible for direct federalfunding in 1979, the institutionestablished itself as in independent entityunder its present name. It is chartered bythe Omaha, Santee, South DakotaYankton, and Sioux tribes. NebraskaIndian Community College’s mission is tooffer quality, Indian-focused,postsecondary educational programs thatalso contribute to each tribe's culturalcontinuity. It offers liberal arts courses, aswell as vocational education and training. Nebraska Indian Community College hasa site on each of its four chartering tribes'reservations. It also offers some coursesat its extended campus, located at theAmerican Indian Center in Sioux City,Iowa.
Location: Niobara, NE
Year established: 1979
Accredited: Yes
Tribal affiliation: Omaha, SanteeYankton, and Sioux
Total enrollment: 320Part time: 54%American Indian/ Alaska Native: 85%
Total faculty : 35Part time: 63%American Indian/ Alaska Native: 31%
Degree levels offered: Associate of Arts,Associate of Science, Associate of AppliedScience, Certificate Programs
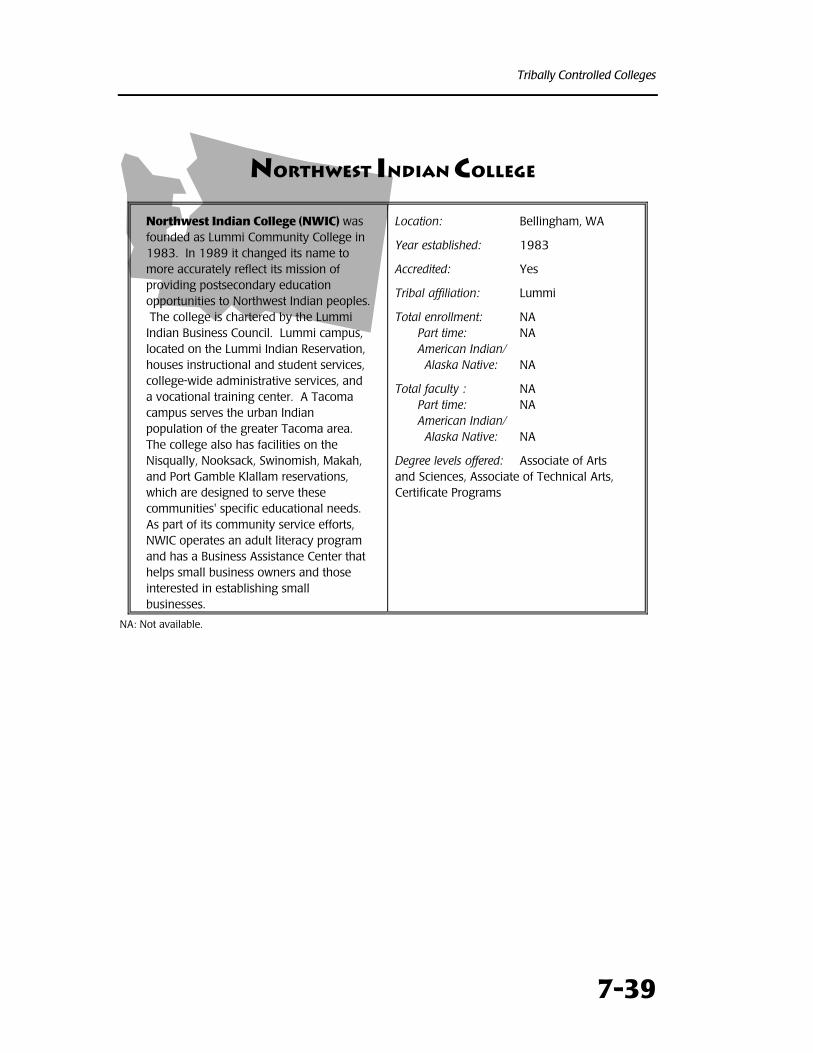
Tribally Controlled Colleges
7-39
NORTHWEST INDIAN COLLEGE
Northwest Indian College (NWIC) wasfounded as Lummi Community College in1983. In 1989 it changed its name tomore accurately reflect its mission ofproviding postsecondary educationopportunities to Northwest Indian peoples. The college is chartered by the LummiIndian Business Council. Lummi campus,located on the Lummi Indian Reservation,houses instructional and student services,college-wide administrative services, anda vocational training center. A Tacomacampus serves the urban Indianpopulation of the greater Tacoma area. The college also has facilities on theNisqually, Nooksack, Swinomish, Makah,and Port Gamble Klallam reservations,which are designed to serve thesecommunities' specific educational needs. As part of its community service efforts,NWIC operates an adult literacy programand has a Business Assistance Center thathelps small business owners and thoseinterested in establishing smallbusinesses.
Location: Bellingham, WA
Year established: 1983
Accredited: Yes
Tribal affiliation: Lummi
Total enrollment: NAPart time: NAAmerican Indian/ Alaska Native: NA
Total faculty : NAPart time: NAAmerican Indian/ Alaska Native: NA
Degree levels offered: Associate of Artsand Sciences, Associate of Technical Arts,Certificate Programs
NA: Not available.
(
7-40
OGLALA LAKOTA COLLEGE
Oglala Lakota College was establishedin 1971 on the Pine Ridge Reservation bythe Oglala Sioux Tribal Council. For thefirst few years courses were offered underagreements with Black Hills State College. It became Oglala Sioux CommunityCollege in 1978, and in 1983, received itspresent name, which more accuratelyreflects the tribe's language and status asa 4-year degree-granting institution. Oglala Lakota College stresses theacquisition of an understanding of thelarger society within the context of Lakotaculture and tribal self-determination. Itoffers a wide range of programs,extending from adult literacy services to amaster's degree in Lakota leadership. Oglala Lakota College has a dispersed,decentralized campus with sites in each ofthe nine reservation districts. With itsenrollment of around 1,000 students, theinstitution is the second largest tribalcollege. It is one of only two tribalcolleges to offer a master's degree. Thecollege recently received a large grantfrom the National Science Foundation todevelop a bachelor's degree inenvironmental science.
Location: Kyle, SD
Year established: 1971
Accredited: Yes
Tribal affiliation: Sioux
Total enrollment: 1,038Part time: 61%American Indian/ Alaska Native: 82%
Total faculty : 18Part time: 0%American Indian/ Alaska Native: 56%
Degree levels offered: Master of Arts,Bachelor of Arts, Bachelor of Science,Associate of Arts, Certificate Programs
Tribally Controlled Colleges
7-41
SALISH KOOTENAI COLLEGE
Salish Kootenai College, located on theFlathead Indian Reservation, waschartered by the confederated Salish andKootenai tribes in 1976. It was the firsttribal college in the Northwest to gainregional accreditation. The tribes startedthe college primarily to improve educationfor their members and to foster thereservation's economic development. The college also has the mission ofproviding quality postsecondaryeducational opportunities for NativeAmericans throughout the United States. Its student body includes students from 56tribes. Salish Kootenai College offers abachelor's degree in human service(concentration in rehabilitation), NativeAmerican human services, andenvironmental sciences, as well as anumber of associate’s degrees andvocational certificate programs of study. Its facilities include a tribal publictelevision station and dental labs. Thecollege is developing dental assistancetelevideo courses in conjunction with theIndian Health Service. The college was 1of only 23 institutions of higher educationnationwide to receive funding from theNational Science Foundation for itssuccessful proposal submitted for theNSF’s 1995 initiative for Institution-WideReform of Undergraduate Education inScience, Mathematics, Engineering, andTechnology (SM&T). The award was madeto stimulate comprehensive, innovativereforms that promote student learning,prepare students for rewarding careers,and enhance awareness of andappreciation for SM&T issues.
Location: Pablo, MT
Year established: 1976
Accredited: Yes
Tribal affiliation: Salish and Kootenai
Total enrollment: 874Part time: 33%American Indian/ Alaska Native: 75%
Total faculty : 25Part time: 0%American Indian/ Alaska Native: 20%
Degree levels offered: Bachelor of Arts,Bachelor of Science, Associate of Arts,Associate of Science, Associate of AppliedScience, Certificate and ApprenticeshipPrograms
(
7-42
SINTE GLESKA UNIVERSITY
Sinte Gleska University, originally SinteGleska College, was established by theRosebud (Sicanju) Sioux in 1971. Theinstitution is located on the Rosebud Siouxreservation in south central South Dakota.It emerged from the tribe's desire tocreate an academic and cultural bridgebetween the secondary schools located onthe reservation and postsecondaryeducational institutions off reservation,while reinforcing tribal culture andproviding service to the tribe andcommunity. The intent was to create aschool that would meet the postsecondaryeducational needs of the reservation'sresidents to the fullest extent possible. Inthe 1970s Sinte Gleska began to offer anassociate of arts degree and to providebachelor's degrees through the Universityof South Dakota. In 1983, Sinte Gleskabecame the first tribally controlled collegeaccredited to offer both bachelor’s andassociate’s degrees. It later added amaster's degree to its offerings. Theuniversity is currently sharing a $12million grant from the National ScienceFoundation with Oglala Lakota College. Sinte Gleska is using its share to developa bachelor of science program incomputer science and a 2-year degreeprogram in basic engineering.
Location: Rosebud, SD
Year established: 1971
Accredited: Yes
Tribal affiliation: Sioux
Total enrollment: 748Part time: 40%American Indian/ Alaska Native: 75%
Total faculty : 87Part time: 40%American Indian/ Alaska Native: NA
Degree levels offered: Master of Arts,Bachelor of Arts, Bachelor of Science,Associate of Arts, Associate of Science,Certificate Programs
NA: Not available. Faculty data were not reported by race/ethnicity.
Tribally Controlled Colleges
7-43
SISSETON WAHPETON COMMUNITY COLLEGE
Sisseton-Wahpeton CommunityCollege (SWCC) was established in 1979by the Sisseton Wahpeton Sioux Tribe. The institution has the mission of meetingthe postsecondary educational needs ofthe tribe's members and the otherresidents of the Lake TraverseReservation. It offers courses at its maincampus, at several other locations on thereservation, and elsewhere within thetraditional lands of the Dakota people.The institution's five divisions include theacademic departments, a vocational andtechnical education department, a nursingcenter, an adult and community educationcenter, and the Institute of Dakota Studies. The college recently added a tribalresource center, a tribal library, and tribalarchives. These new facilities were builtentirely by SWCC students and staff.
Location: Sisseton, SD
Year established: 1979
Accredited: Yes
Tribal affiliation: Sioux
Total enrollment: 197Part time: 29%American Indian/ Alaska Native: 68%
Total faculty : 18Part time: 44%American Indian/ Alaska Native: 33%
Degree levels offered: Associate of Arts,Associate of Science, Associate of AppliedScience, Certificate Programs
(
7-44
SOUTHWESTERN INDIAN POLYTECHNIC INSTITUTE
Southwestern Indian PolytechnicInstitute (SIPI) had its origins in the All-Indian Pueblo Council's vision of a schoolto serve the Native American community. Other tribal leaders, public officials, andinterested citizens contributed to therealization of this dream. The Instituteopened in 1971 as an open-entry, open-exit system of individualized training. Ithas since moved to a traditional semestersystem and has developed the traininginfrastructure needed for providingadvanced technical instruction and forgranting university transfer degrees. TheInstitute's newly revised mission involvesproviding a postsecondary learningenvironment that is both rigorous andtribally responsive. It is developingpostsecondary training programs to meetthe needs of industry and of NativeAmericans. The SIPI student body isdrawn from over 100 tribes, and the SIPIBoard of Regents includes representativesfrom 10 tribal entities. SIPI also operatesan Upward Bound program for high schoolstudents, which includes both a schoolyear and summer residential component.
Location: Albuquerque, NM
Year established: 1971
Accredited: Yes
Tribal affiliation: Intertribal
Total enrollment: 615Part time: 27%American Indian/ Alaska Native: 100%
Total faculty : 35Part time: 0%American Indian/ Alaska Native: NA
Degree levels offered: Associate of AppliedScience, Associate of Arts, Associate ofScience, Certificate Programs
NA: Not available. Faculty data were not reported by race/ethnicity.
Tribally Controlled Colleges
7-45
STANDING ROCK COLLEGE*
Standing Rock College was chartered bythe Standing Rock Sioux Tribal Council in1973. Several colleges were offering on-reservation courses at that time, but therewas no coordination between them. Standing Rock College is designed toprovide quality academic andoccupational training, improve the adultpopulation's educational level, encourageand promote the Dakota/Lakota culture,and assist in tribal development. It offersvocational training certificates and 2-yearassociate’s degree programs. Its studentscan obtain the bachelor of college studiesdegree in conjunction with Minot StateUniversity. Standing Rock College hasexpanded over the years with theaddition of new facilities and atransportation system.
Location: Fort Yates, ND
Year established: 1973
Accredited: Yes
Tribal affiliation: Sioux
Total enrollment: 196Part time: 35%American Indian/ Alaska Native: 92%
Total faculty : 13Part time: 0%American Indian/ Alaska Native: 8%
Degree levels offered: Bachelor of CollegeStudies (in conjunction with Minot StateUniversity), Associate of Applied Science,Associate of Science, Associate of Arts,Certificate Programs
*Standing Rock College recently changed its name to Sitting Bull College.
(
7-46
STONE CHILD COLLEGE
Stone Child College is located on RockyBoy Reservation, the smallest and mostrecently established Indian reservation inMontana. The college received its charterfrom the Chippewa-Cree BusinessCommittee in 1984. It was created topreserve and maintain the Chippewa-Creeculture and to ensure the provision ofpostsecondary educational programs thatmeet the tribal membership's specificneeds. The college, which recently gainedaccreditation, stresses its student-centeredstaff and its commitment to qualityeducation. It has a new addition, whichwas built by the staff and students in itsbuilding trades program. The college alsooperates its own child care center.
Location: Box Elder, MT
Year established: 1984
Accredited: Yes
Tribal affiliation: Chippewa-Cree
Total enrollment: 226Part time: 29%American Indian/ Alaska Native: 95%
Total faculty : 10Part time: 0%American Indian/ Alaska Native: 10%
Degree levels offered: Associate of Arts,Associate of Science, Certificate Programs
Tribally Controlled Colleges
7-47
TURTLE MOUNTAIN COMMUNITY COLLEGE
Turtle Mountain Community College(TMCC) is located on the Turtle MountainChippewa Reservation, a small reservationin north central North Dakota. Thecollege received its charter from the TurtleMountain Chippewa Tribe in 1972. Initialfunding came from a federal grant, withNorth Dakota State University at Bottineauas the sponsoring 4-year institution. Turtle Mountain Community Collegemaintained bilateral agreements with thisinstitution and with Mayville State Collegeuntil 1979. The school received fullaccreditation as a 2-year college in 1984. Its goals are the provision of generalstudies and vocational education, thepreservation and transmission of theTurtle Mountain Chippewa culturalheritage, and the provision of leadershipand service to the community. Instead ofmaintaining a separate native studiesprogram, TMCC strives to have AmericanIndian culture and values permeate alldepartments. The college has providedtechnical assistance to local industries thatwish to train their work forces andincrease productivity. It has undertakennumerous other efforts to improve thelocal economy and ensure that itsstudents are vocationally competitivethere.
Location: Belcourt, ND
Year established: 1972
Accredited: Yes
Tribal affiliation: Chippewa
Total enrollment: 585Part time: 49%American Indian/ Alaska Native: 87%
Total faculty : 36Part time: 47%American Indian/ Alaska Native: 69%
Degree levels offered: Associate of Arts,Associate of Science, Certificate Programs
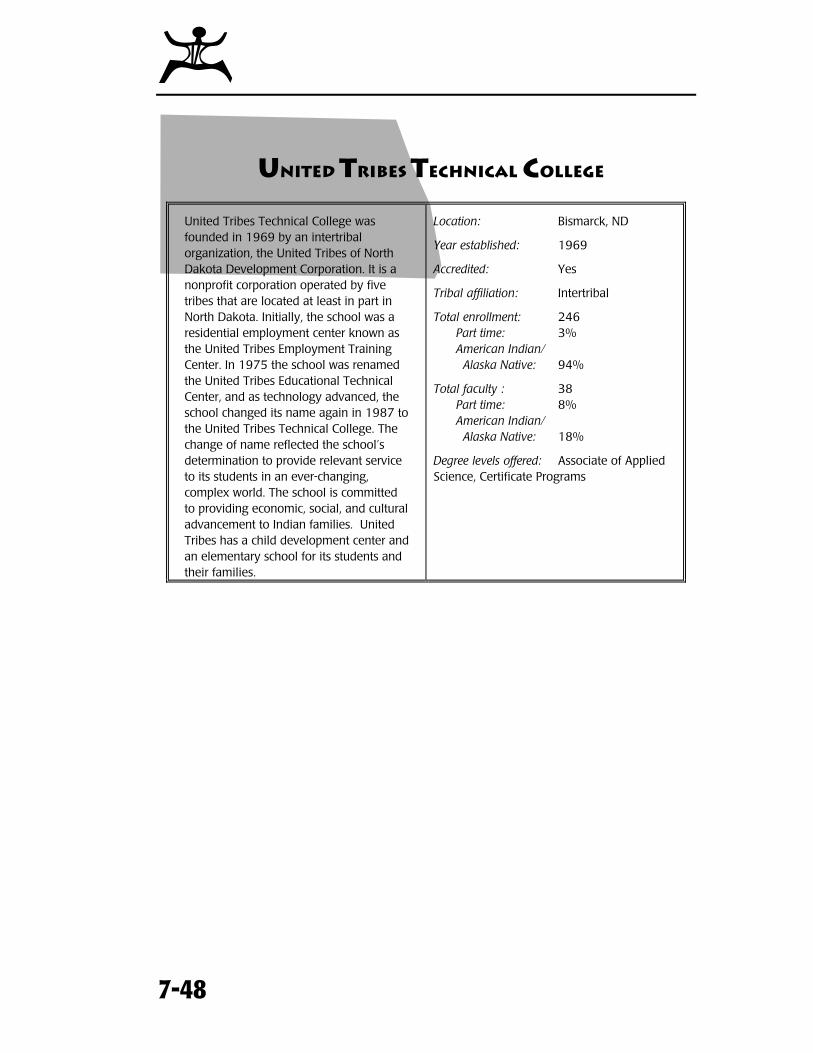
(
7-48
UNITED TRIBES TECHNICAL COLLEGE
United Tribes Technical College wasfounded in 1969 by an intertribalorganization, the United Tribes of NorthDakota Development Corporation. It is anonprofit corporation operated by fivetribes that are located at least in part inNorth Dakota. Initially, the school was aresidential employment center known asthe United Tribes Employment TrainingCenter. In 1975 the school was renamedthe United Tribes Educational TechnicalCenter, and as technology advanced, theschool changed its name again in 1987 tothe United Tribes Technical College. Thechange of name reflected the school’sdetermination to provide relevant serviceto its students in an ever-changing,complex world. The school is committedto providing economic, social, and culturaladvancement to Indian families. UnitedTribes has a child development center andan elementary school for its students andtheir families.
Location: Bismarck, ND
Year established: 1969
Accredited: Yes
Tribal affiliation: Intertribal
Total enrollment: 246Part time: 3%American Indian/ Alaska Native: 94%
Total faculty : 38Part time: 8%American Indian/ Alaska Native: 18%
Degree levels offered: Associate of AppliedScience, Certificate Programs
Tribally Controlled Colleges
7-49
Endnotes for Tribal College Highlights
All enrollment data were taken from the following source (except as noted in the highlights):
U.S. Department of Education, National Center for Education Statistics, Integrated PostsecondaryEducation Data System (IPEDS), “Fall Enrollment” survey, unpublished data, 1994-95.
All faculty data were taken from the following source (except as noted in the highlights):
U.S. Department of Education, National Center for Education Statistics, Integrated PostsecondaryEducation Data System (IPEDS), “Fall Staff” survey, unpublished data, 1993-94.
Additional data were taken from the following sources:
Bay Mills Community College: Catalog, 1994-96and 1996 Higher Education Directory, p. 169,1996
Blackfeet Community College: Catalog, 1994-96
Cheyenne River Community College: Catalog,1993-95 and admissions office telephoneconversation
College of the Menominee Nation: Catalog,1996-97
Crownpoint Institute of Technology: Catalog,1995-97
D-Q University: World Wide Web site
Dull Knife Memorial College: Catalog,1995-96 and admissions office telephoneconversation
Fond du Lac Tribal Community College: Catalog
Fort Belknap College: World Wide Web site
Fort Berthold Community College: Bulletin,1995-96
Fort Peck Community College: Course Schedule,1995-97
Haskell Indian Nations University: Catalog,1995-96
Institute of American Indian Arts: Catalog
Lac Courte Oreilles Ojibwa Community College: Catalog, 1995-98
Leech Lake Tribal College: Catalog of Coursesand Degree Requirements, 1995-97 andCorinne Nason, Admissions Director,telephone conversation
Little Big Horn College: Catalog, 1994-97
Little Hoop Community College: Catalog, 1995-96
Little Priest Tribal College: Bureau of Indian Affairsand American Indian Higher EducationConsortium, site visit report, 1996.
Navajo Community College: Institutional Report,1992-95
Nebraska Indian Community College: Catalog,1995-96
Northwest Indian College: Catalog,1994-96
Oglala Lakota College: Catalog, 1995-96
Salish Kootenai College: Catalog, 1995-97
Sinte Gleska University: World Wide Web siteand admissions office telephoneconversation
Sisseton Wahpeton Community College: Catalog,1994-96
Southwestern Indian Polytechnic Institute: Catalog, 1996-97
Standing Rock College: Catalog, 1994-96
Stone Child College: Catalog 1994-96
Turtle Mountain Community College: Catalog
United Tribes Technical College: World WideWeb site and admissions office telephoneconversation

(
7-50

A-1
Appendix A
Appendix Tables
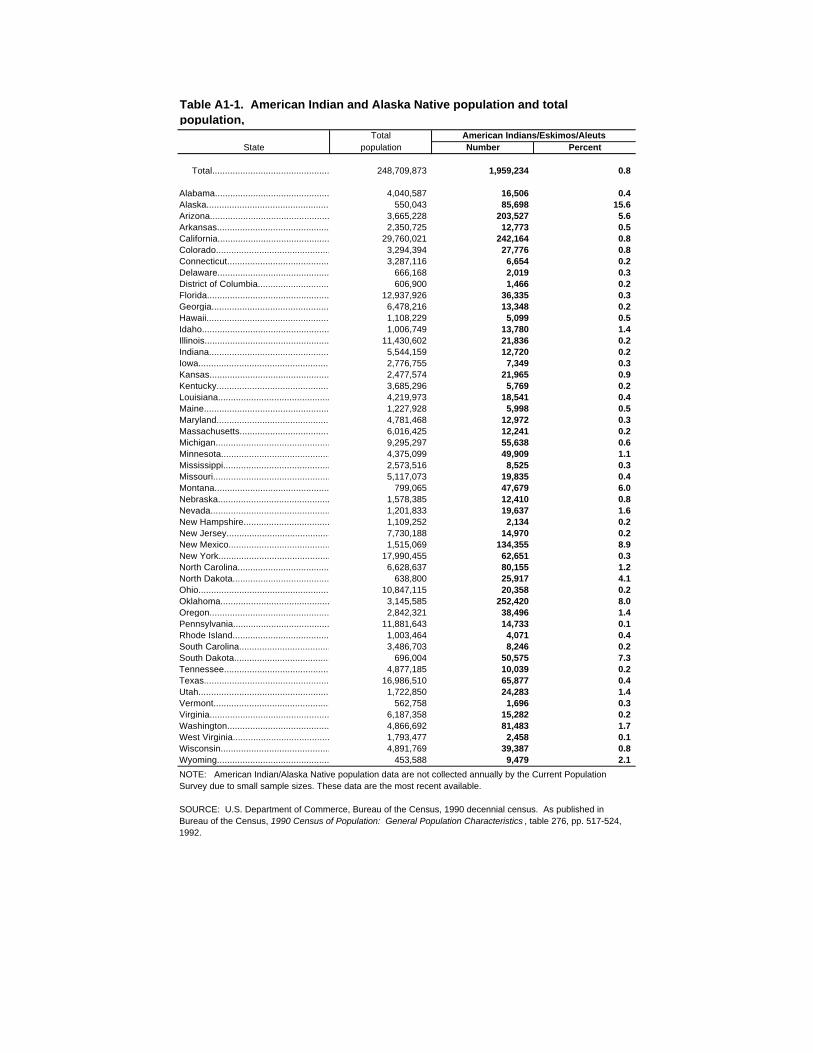
Total American Indians/Eskimos/AleutsState population Number Percent
Total......................................................................248,709,873 1,959,234 0.8
Alabama........................................................................4,040,587 16,506 0.4Alaska........................................................................ 550,043 85,698 15.6Arizona..................................................................... 3,665,228 203,527 5.6Arkansas.................................................................. 2,350,725 12,773 0.5California.................................................................29,760,021 242,164 0.8Colorado.................................................................. 3,294,394 27,776 0.8Connecticut.............................................................. 3,287,116 6,654 0.2Delaware................................................................ 666,168 2,019 0.3District of Columbia................................................ 606,900 1,466 0.2Florida........................................................................12,937,926 36,335 0.3Georgia.....................................................................6,478,216 13,348 0.2Hawaii.......................................................................1,108,229 5,099 0.5Idaho..........................................................................1,006,749 13,780 1.4Illinois.........................................................................11,430,602 21,836 0.2Indiana.................................................................... 5,544,159 12,720 0.2Iowa......................................................................... 2,776,755 7,349 0.3Kansas..................................................................... 2,477,574 21,965 0.9Kentucky.....................................................................3,685,296 5,769 0.2Louisiana..................................................................4,219,973 18,541 0.4Maine........................................................................1,227,928 5,998 0.5Maryland......................................................................4,781,468 12,972 0.3Massachusetts........................................................ 6,016,425 12,241 0.2Michigan....................................................................9,295,297 55,638 0.6Minnesota.................................................................4,375,099 49,909 1.1Mississippi............................................................... 2,573,516 8,525 0.3Missouri....................................................................5,117,073 19,835 0.4Montana.................................................................... 799,065 47,679 6.0Nebraska.................................................................. 1,578,385 12,410 0.8Nevada.................................................................... 1,201,833 19,637 1.6New Hampshire.................................................... 1,109,252 2,134 0.2New Jersey.............................................................. 7,730,188 14,970 0.2New Mexico..............................................................1,515,069 134,355 8.9New York..................................................................17,990,455 62,651 0.3North Carolina......................................................... 6,628,637 80,155 1.2North Dakota........................................................... 638,800 25,917 4.1Ohio.............................................................................10,847,115 20,358 0.2Oklahoma............................................................... 3,145,585 252,420 8.0Oregon...................................................................,. 2,842,321 38,496 1.4Pennsylvania.............................................................11,881,643 14,733 0.1Rhode Island......................................................... 1,003,464 4,071 0.4South Carolina......................................................... 3,486,703 8,246 0.2South Dakota.......................................................... 696,004 50,575 7.3Tennessee............................................................... 4,877,185 10,039 0.2Texas........................................................................16,986,510 65,877 0.4Utah...........................................................................1,722,850 24,283 1.4Vermont.................................................................. 562,758 1,696 0.3Virginia......................................................................6,187,358 15,282 0.2Washington.......................................................... 4,866,692 81,483 1.7West Virginia............................................................ 1,793,477 2,458 0.1Wisconsin................................................................ 4,891,769 39,387 0.8Wyoming................................................................... 453,588 9,479 2.1
NOTE: American Indian/Alaska Native population data are not collected annually by the Current Population Survey due to small sample sizes. These data are the most recent available.
SOURCE: U.S. Department of Commerce, Bureau of the Census, 1990 decennial census. As published in Bureau of the Census, 1990 Census of Population: General Population Characteristics , table 276, pp. 517-524, 1992.
Table A1-1. American Indian and Alaska Native population and total population,
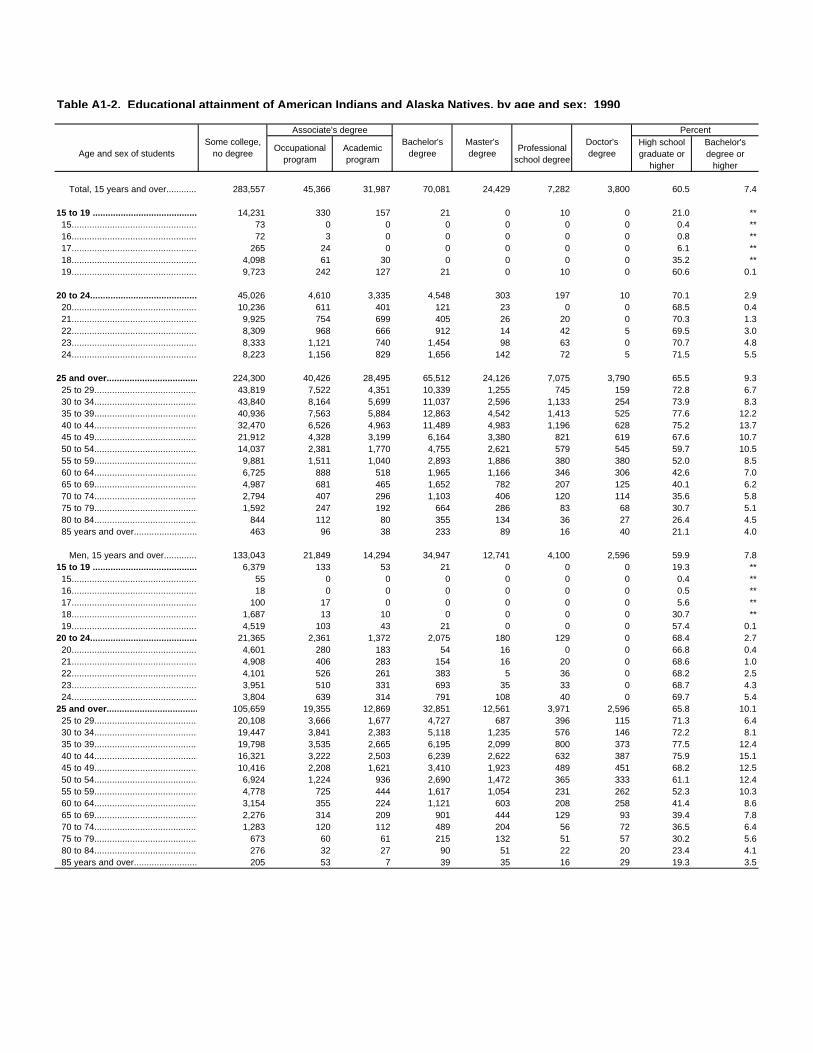
Associate's degree Percent
Age and sex of studentsSome college,
no degreeOccupational
programAcademic program
Bachelor's degree
Master's degree
Professional school degree
Doctor's degree
High school graduate or
higher
Bachelor's degree or
higher
Total, 15 years and over............. 283,557 45,366 31,987 70,081 24,429 7,282 3,800 60.5 7.4
15 to 19 ................................................ 14,231 330 157 21 0 10 0 21.0 ** 15.......................................................... 73 0 0 0 0 0 0 0.4 ** 16.......................................................... 72 3 0 0 0 0 0 0.8 ** 17......................................................... 265 24 0 0 0 0 0 6.1 ** 18.......................................................... 4,098 61 30 0 0 0 0 35.2 ** 19.......................................................... 9,723 242 127 21 0 10 0 60.6 0.1
20 to 24.............................................. 45,026 4,610 3,335 4,548 303 197 10 70.1 2.9 20....................................................... 10,236 611 401 121 23 0 0 68.5 0.4 21......................................................... 9,925 754 699 405 26 20 0 70.3 1.3 22......................................................... 8,309 968 666 912 14 42 5 69.5 3.0 23.......................................................... 8,333 1,121 740 1,454 98 63 0 70.7 4.8 24.......................................................... 8,223 1,156 829 1,656 142 72 5 71.5 5.5
25 and over......................................... 224,300 40,426 28,495 65,512 24,126 7,075 3,790 65.5 9.3 25 to 29.................................................... 43,819 7,522 4,351 10,339 1,255 745 159 72.8 6.7 30 to 34................................................ 43,840 8,164 5,699 11,037 2,596 1,133 254 73.9 8.3 35 to 39.............................................. 40,936 7,563 5,884 12,863 4,542 1,413 525 77.6 12.2 40 to 44................................................. 32,470 6,526 4,963 11,489 4,983 1,196 628 75.2 13.7 45 to 49.................................................. 21,912 4,328 3,199 6,164 3,380 821 619 67.6 10.7 50 to 54................................................ 14,037 2,381 1,770 4,755 2,621 579 545 59.7 10.5 55 to 59................................................ 9,881 1,511 1,040 2,893 1,886 380 380 52.0 8.5 60 to 64................................................ 6,725 888 518 1,965 1,166 346 306 42.6 7.0 65 to 69............................................... 4,987 681 465 1,652 782 207 125 40.1 6.2 70 to 74.................................................. 2,794 407 296 1,103 406 120 114 35.6 5.8 75 to 79................................................ 1,592 247 192 664 286 83 68 30.7 5.1 80 to 84................................................. 844 112 80 355 134 36 27 26.4 4.5 85 years and over................................... 463 96 38 233 89 16 40 21.1 4.0
Men, 15 years and over................ 133,043 21,849 14,294 34,947 12,741 4,100 2,596 59.9 7.815 to 19 ................................................ 6,379 133 53 21 0 0 0 19.3 ** 15.......................................................... 55 0 0 0 0 0 0 0.4 ** 16.......................................................... 18 0 0 0 0 0 0 0.5 ** 17......................................................... 100 17 0 0 0 0 0 5.6 ** 18.......................................................... 1,687 13 10 0 0 0 0 30.7 ** 19.......................................................... 4,519 103 43 21 0 0 0 57.4 0.120 to 24.............................................. 21,365 2,361 1,372 2,075 180 129 0 68.4 2.7 20....................................................... 4,601 280 183 54 16 0 0 66.8 0.4 21......................................................... 4,908 406 283 154 16 20 0 68.6 1.0 22......................................................... 4,101 526 261 383 5 36 0 68.2 2.5 23.......................................................... 3,951 510 331 693 35 33 0 68.7 4.3 24.......................................................... 3,804 639 314 791 108 40 0 69.7 5.425 and over......................................... 105,659 19,355 12,869 32,851 12,561 3,971 2,596 65.8 10.1 25 to 29.................................................... 20,108 3,666 1,677 4,727 687 396 115 71.3 6.4 30 to 34................................................ 19,447 3,841 2,383 5,118 1,235 576 146 72.2 8.1 35 to 39.............................................. 19,798 3,535 2,665 6,195 2,099 800 373 77.5 12.4 40 to 44................................................. 16,321 3,222 2,503 6,239 2,622 632 387 75.9 15.1 45 to 49.................................................. 10,416 2,208 1,621 3,410 1,923 489 451 68.2 12.5 50 to 54................................................ 6,924 1,224 936 2,690 1,472 365 333 61.1 12.4 55 to 59................................................ 4,778 725 444 1,617 1,054 231 262 52.3 10.3 60 to 64................................................ 3,154 355 224 1,121 603 208 258 41.4 8.6 65 to 69............................................... 2,276 314 209 901 444 129 93 39.4 7.8 70 to 74.................................................. 1,283 120 112 489 204 56 72 36.5 6.4 75 to 79................................................ 673 60 61 215 132 51 57 30.2 5.6 80 to 84................................................. 276 32 27 90 51 22 20 23.4 4.1 85 years and over................................... 205 53 7 39 35 16 29 19.3 3.5
Table A1-2. Educational attainment of American Indians and Alaska Natives, by age and sex: 1990
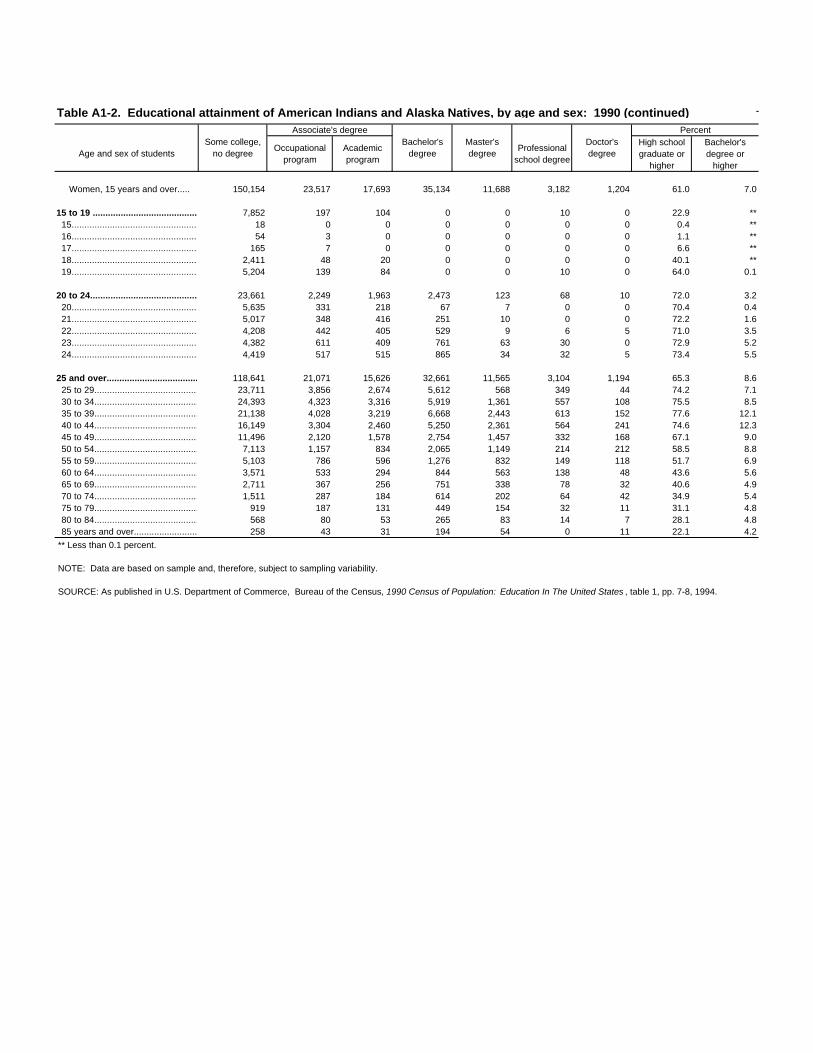
Associate's degree Percent
Age and sex of studentsSome college,
no degreeOccupational
programAcademic program
Bachelor's degree
Master's degree
Professional school degree
Doctor's degree
High school graduate or
higher
Bachelor's degree or
higher
Women, 15 years and over..... 150,154 23,517 17,693 35,134 11,688 3,182 1,204 61.0 7.0
15 to 19 ................................................ 7,852 197 104 0 0 10 0 22.9 ** 15.......................................................... 18 0 0 0 0 0 0 0.4 ** 16.......................................................... 54 3 0 0 0 0 0 1.1 ** 17......................................................... 165 7 0 0 0 0 0 6.6 ** 18.......................................................... 2,411 48 20 0 0 0 0 40.1 ** 19.......................................................... 5,204 139 84 0 0 10 0 64.0 0.1
20 to 24.............................................. 23,661 2,249 1,963 2,473 123 68 10 72.0 3.2 20....................................................... 5,635 331 218 67 7 0 0 70.4 0.4 21......................................................... 5,017 348 416 251 10 0 0 72.2 1.6 22......................................................... 4,208 442 405 529 9 6 5 71.0 3.5 23.......................................................... 4,382 611 409 761 63 30 0 72.9 5.2 24.......................................................... 4,419 517 515 865 34 32 5 73.4 5.5
25 and over......................................... 118,641 21,071 15,626 32,661 11,565 3,104 1,194 65.3 8.6 25 to 29.................................................... 23,711 3,856 2,674 5,612 568 349 44 74.2 7.1 30 to 34................................................ 24,393 4,323 3,316 5,919 1,361 557 108 75.5 8.5 35 to 39.............................................. 21,138 4,028 3,219 6,668 2,443 613 152 77.6 12.1 40 to 44................................................. 16,149 3,304 2,460 5,250 2,361 564 241 74.6 12.3 45 to 49.................................................. 11,496 2,120 1,578 2,754 1,457 332 168 67.1 9.0 50 to 54................................................ 7,113 1,157 834 2,065 1,149 214 212 58.5 8.8 55 to 59................................................ 5,103 786 596 1,276 832 149 118 51.7 6.9 60 to 64................................................ 3,571 533 294 844 563 138 48 43.6 5.6 65 to 69............................................... 2,711 367 256 751 338 78 32 40.6 4.9 70 to 74.................................................. 1,511 287 184 614 202 64 42 34.9 5.4 75 to 79................................................ 919 187 131 449 154 32 11 31.1 4.8 80 to 84................................................. 568 80 53 265 83 14 7 28.1 4.8 85 years and over................................... 258 43 31 194 54 0 11 22.1 4.2
** Less than 0.1 percent.
NOTE: Data are based on sample and, therefore, subject to sampling variability.
SOURCE: As published in U.S. Department of Commerce, Bureau of the Census, 1990 Census of Population: Education In The United States , table 1, pp. 7-8, 1994.
Table A1-2. Educational attainment of American Indians and Alaska Natives, by age and sex: 1990 (continued)
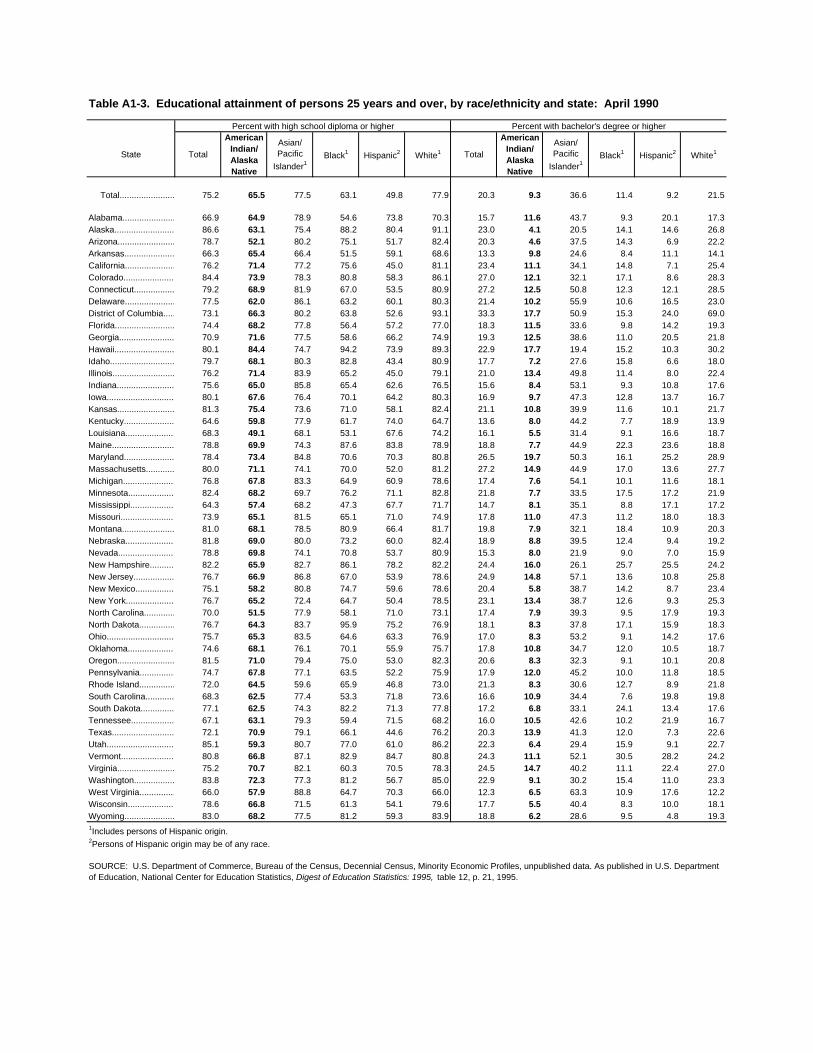
Percent with high school diploma or higher Percent with bachelor's degree or higher
State Total
American Indian/Alaska Native
Asian/Pacific
Islander1Black1 Hispanic2 White1 Total
American Indian/Alaska Native
Asian/Pacific
Islander1Black1 Hispanic2 White1
Total................................ 75.2 65.5 77.5 63.1 49.8 77.9 20.3 9.3 36.6 11.4 9.2 21.5
Alabama........................................................................66.9 64.9 78.9 54.6 73.8 70.3 15.7 11.6 43.7 9.3 20.1 17.3Alaska...................................................................86.6 63.1 75.4 88.2 80.4 91.1 23.0 4.1 20.5 14.1 14.6 26.8Arizona...................................................................78.7 52.1 80.2 75.1 51.7 82.4 20.3 4.6 37.5 14.3 6.9 22.2Arkansas..............................................................66.3 65.4 66.4 51.5 59.1 68.6 13.3 9.8 24.6 8.4 11.1 14.1California.................................................................76.2 71.4 77.2 75.6 45.0 81.1 23.4 11.1 34.1 14.8 7.1 25.4Colorado...............................................................84.4 73.9 78.3 80.8 58.3 86.1 27.0 12.1 32.1 17.1 8.6 28.3Connecticut..........................................................79.2 68.9 81.9 67.0 53.5 80.9 27.2 12.5 50.8 12.3 12.1 28.5Delaware................................................................77.5 62.0 86.1 63.2 60.1 80.3 21.4 10.2 55.9 10.6 16.5 23.0District of Columbia................................................73.1 66.3 80.2 63.8 52.6 93.1 33.3 17.7 50.9 15.3 24.0 69.0Florida...................................................................74.4 68.2 77.8 56.4 57.2 77.0 18.3 11.5 33.6 9.8 14.2 19.3Georgia................................................................70.9 71.6 77.5 58.6 66.2 74.9 19.3 12.5 38.6 11.0 20.5 21.8Hawaii....................................................................80.1 84.4 74.7 94.2 73.9 89.3 22.9 17.7 19.4 15.2 10.3 30.2Idaho......................................................................79.7 68.1 80.3 82.8 43.4 80.9 17.7 7.2 27.6 15.8 6.6 18.0Illinois.........................................................................76.2 71.4 83.9 65.2 45.0 79.1 21.0 13.4 49.8 11.4 8.0 22.4Indiana....................................................................75.6 65.0 85.8 65.4 62.6 76.5 15.6 8.4 53.1 9.3 10.8 17.6Iowa.........................................................................80.1 67.6 76.4 70.1 64.2 80.3 16.9 9.7 47.3 12.8 13.7 16.7Kansas.....................................................................81.3 75.4 73.6 71.0 58.1 82.4 21.1 10.8 39.9 11.6 10.1 21.7Kentucky.....................................................................64.6 59.8 77.9 61.7 74.0 64.7 13.6 8.0 44.2 7.7 18.9 13.9Louisiana..................................................................68.3 49.1 68.1 53.1 67.6 74.2 16.1 5.5 31.4 9.1 16.6 18.7Maine........................................................................78.8 69.9 74.3 87.6 83.8 78.9 18.8 7.7 44.9 22.3 23.6 18.8Maryland......................................................................78.4 73.4 84.8 70.6 70.3 80.8 26.5 19.7 50.3 16.1 25.2 28.9Massachusetts........................................................80.0 71.1 74.1 70.0 52.0 81.2 27.2 14.9 44.9 17.0 13.6 27.7Michigan...............................................................76.8 67.8 83.3 64.9 60.9 78.6 17.4 7.6 54.1 10.1 11.6 18.1Minnesota.................................................................82.4 68.2 69.7 76.2 71.1 82.8 21.8 7.7 33.5 17.5 17.2 21.9Mississippi..........................................................64.3 57.4 68.2 47.3 67.7 71.7 14.7 8.1 35.1 8.8 17.1 17.2Missouri...............................................................73.9 65.1 81.5 65.1 71.0 74.9 17.8 11.0 47.3 11.2 18.0 18.3Montana...............................................................81.0 68.1 78.5 80.9 66.4 81.7 19.8 7.9 32.1 18.4 10.9 20.3Nebraska..............................................................81.8 69.0 80.0 73.2 60.0 82.4 18.9 8.8 39.5 12.4 9.4 19.2Nevada....................................................................78.8 69.8 74.1 70.8 53.7 80.9 15.3 8.0 21.9 9.0 7.0 15.9New Hampshire....................................................82.2 65.9 82.7 86.1 78.2 82.2 24.4 16.0 26.1 25.7 25.5 24.2New Jersey..............................................................76.7 66.9 86.8 67.0 53.9 78.6 24.9 14.8 57.1 13.6 10.8 25.8New Mexico..........................................................75.1 58.2 80.8 74.7 59.6 78.6 20.4 5.8 38.7 14.2 8.7 23.4New York..............................................................76.7 65.2 72.4 64.7 50.4 78.5 23.1 13.4 38.7 12.6 9.3 25.3North Carolina.......................................................70.0 51.5 77.9 58.1 71.0 73.1 17.4 7.9 39.3 9.5 17.9 19.3North Dakota.........................................................76.7 64.3 83.7 95.9 75.2 76.9 18.1 8.3 37.8 17.1 15.9 18.3Ohio...........................................................................75.7 65.3 83.5 64.6 63.3 76.9 17.0 8.3 53.2 9.1 14.2 17.6Oklahoma.............................................................74.6 68.1 76.1 70.1 55.9 75.7 17.8 10.8 34.7 12.0 10.5 18.7Oregon..................................................................81.5 71.0 79.4 75.0 53.0 82.3 20.6 8.3 32.3 9.1 10.1 20.8Pennsylvania...........................................................74.7 67.8 77.1 63.5 52.2 75.9 17.9 12.0 45.2 10.0 11.8 18.5Rhode Island.........................................................72.0 64.5 59.6 65.9 46.8 73.0 21.3 8.3 30.6 12.7 8.9 21.8South Carolina........................................................68.3 62.5 77.4 53.3 71.8 73.6 16.6 10.9 34.4 7.6 19.8 19.8South Dakota.......................................................77.1 62.5 74.3 82.2 71.3 77.8 17.2 6.8 33.1 24.1 13.4 17.6Tennessee...............................................................67.1 63.1 79.3 59.4 71.5 68.2 16.0 10.5 42.6 10.2 21.9 16.7Texas....................................................................72.1 70.9 79.1 66.1 44.6 76.2 20.3 13.9 41.3 12.0 7.3 22.6Utah.......................................................................85.1 59.3 80.7 77.0 61.0 86.2 22.3 6.4 29.4 15.9 9.1 22.7Vermont..................................................................80.8 66.8 87.1 82.9 84.7 80.8 24.3 11.1 52.1 30.5 28.2 24.2Virginia................................................................75.2 70.7 82.1 60.3 70.5 78.3 24.5 14.7 40.2 11.1 22.4 27.0Washington..........................................................83.8 72.3 77.3 81.2 56.7 85.0 22.9 9.1 30.2 15.4 11.0 23.3West Virginia......................................................66.0 57.9 88.8 64.7 70.3 66.0 12.3 6.5 63.3 10.9 17.6 12.2Wisconsin............................................................78.6 66.8 71.5 61.3 54.1 79.6 17.7 5.5 40.4 8.3 10.0 18.1Wyoming...............................................................83.0 68.2 77.5 81.2 59.3 83.9 18.8 6.2 28.6 9.5 4.8 19.3
Table A1-3. Educational attainment of persons 25 years and over, by race/ethnicity and state: April 1990
1Includes persons of Hispanic origin.2Persons of Hispanic origin may be of any race.
SOURCE: U.S. Department of Commerce, Bureau of the Census, Decennial Census, Minority Economic Profiles, unpublished data. As published in U.S. Department of Education, National Center for Education Statistics, Digest of Education Statistics: 1995, table 12, p. 21, 1995.
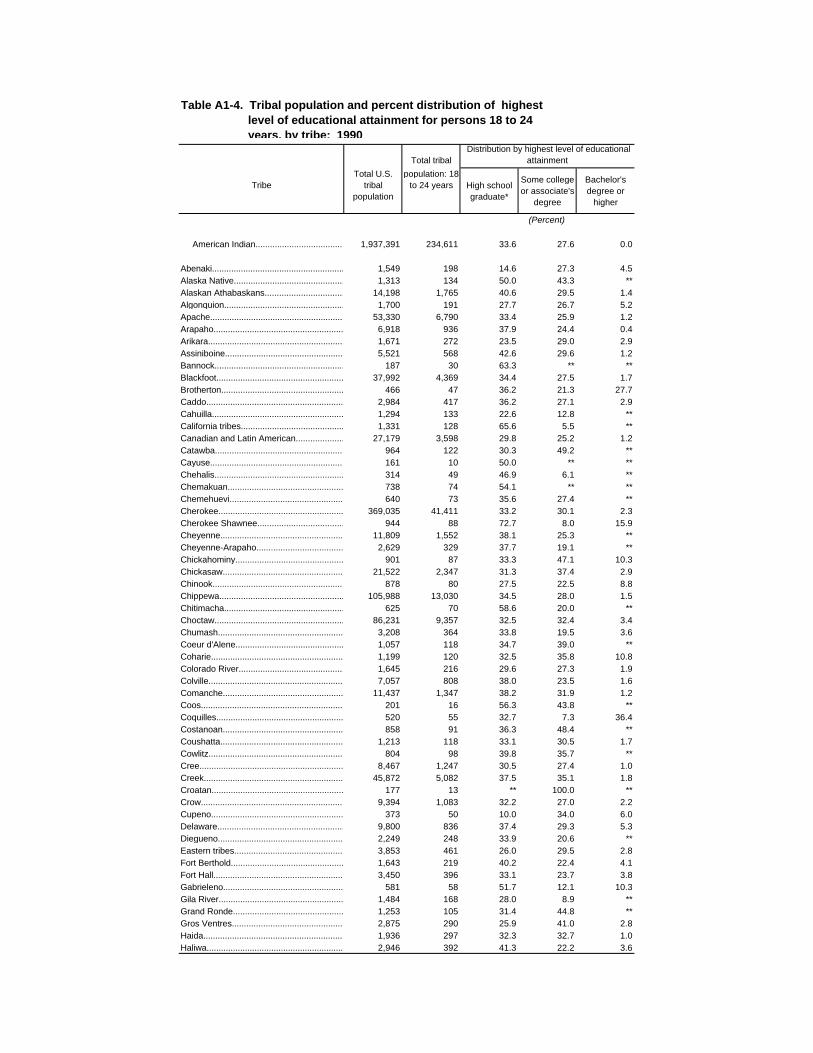
Total tribal Distribution by highest level of educational
attainment
TribeTotal U.S.
tribal population
population: 18 to 24 years High school
graduate*
Some college or associate's
degree
Bachelor's degree or
higher
(Percent)
American Indian...............................................1,937,391 234,611 33.6 27.6 0.0
Abenaki......................................................................1,549 198 14.6 27.3 4.5Alaska Native......................................................... 1,313 134 50.0 43.3 **Alaskan Athabaskans........................................... 14,198 1,765 40.6 29.5 1.4Algonquion.......................................................... 1,700 191 27.7 26.7 5.2Apache............................................................... 53,330 6,790 33.4 25.9 1.2Arapaho.............................................................. 6,918 936 37.9 24.4 0.4Arikara.................................................................. 1,671 272 23.5 29.0 2.9Assiniboine.......................................................... 5,521 568 42.6 29.6 1.2Bannock.............................................................. 187 30 63.3 ** **Blackfoot.............................................................. 37,992 4,369 34.4 27.5 1.7Brotherton......................................................... 466 47 36.2 21.3 27.7Caddo.................................................................. 2,984 417 36.2 27.1 2.9Cahuilla................................................................ 1,294 133 22.6 12.8 **California tribes..................................................... 1,331 128 65.6 5.5 **Canadian and Latin American.................................27,179 3,598 29.8 25.2 1.2Catawba.............................................................. 964 122 30.3 49.2 **Cayuse................................................................. 161 10 50.0 ** **Chehalis................................................................. 314 49 46.9 6.1 **Chemakuan....................................................... 738 74 54.1 ** **Chemehuevi........................................................ 640 73 35.6 27.4 **Cherokee........................................................... 369,035 41,411 33.2 30.1 2.3Cherokee Shawnee............................................... 944 88 72.7 8.0 15.9Cheyenne............................................................... 11,809 1,552 38.1 25.3 **Cheyenne-Arapaho............................................ 2,629 329 37.7 19.1 **Chickahominy.................................................. 901 87 33.3 47.1 10.3Chickasaw........................................................... 21,522 2,347 31.3 37.4 2.9Chinook............................................................... 878 80 27.5 22.5 8.8Chippewa.......................................................... 105,988 13,030 34.5 28.0 1.5Chitimacha.......................................................... 625 70 58.6 20.0 **Choctaw............................................................... 86,231 9,357 32.5 32.4 3.4Chumash.............................................................. 3,208 364 33.8 19.5 3.6Coeur d'Alene.................................................. 1,057 118 34.7 39.0 **Coharie.............................................................. 1,199 120 32.5 35.8 10.8Colorado River................................................... 1,645 216 29.6 27.3 1.9Colville................................................................. 7,057 808 38.0 23.5 1.6Comanche.......................................................... 11,437 1,347 38.2 31.9 1.2Coos....................................................................... 201 16 56.3 43.8 **Coquilles............................................................. 520 55 32.7 7.3 36.4Costanoan.......................................................... 858 91 36.3 48.4 **Coushatta........................................................... 1,213 118 33.1 30.5 1.7Cowlitz.................................................................. 804 98 39.8 35.7 **Cree...........................................................................8,467 1,247 30.5 27.4 1.0Creek...................................................................... 45,872 5,082 37.5 35.1 1.8Croatan............................................................... 177 13 ** 100.0 **Crow........................................................................ 9,394 1,083 32.2 27.0 2.2Cupeno................................................................ 373 50 10.0 34.0 6.0Delaware............................................................... 9,800 836 37.4 29.3 5.3Diegueno........................................................... 2,249 248 33.9 20.6 **Eastern tribes....................................................... 3,853 461 26.0 29.5 2.8Fort Berthold....................................................... 1,643 219 40.2 22.4 4.1Fort Hall.............................................................. 3,450 396 33.1 23.7 3.8Gabrieleno............................................................... 581 58 51.7 12.1 10.3Gila River................................................................. 1,484 168 28.0 8.9 **Grand Ronde....................................................... 1,253 105 31.4 44.8 **Gros Ventres........................................................ 2,875 290 25.9 41.0 2.8Haida.................................................................. 1,936 297 32.3 32.7 1.0Haliwa................................................................. 2,946 392 41.3 22.2 3.6
Table A1-4. Tribal population and percent distribution of highest level of educational attainment for persons 18 to 24 years, by tribe: 1990
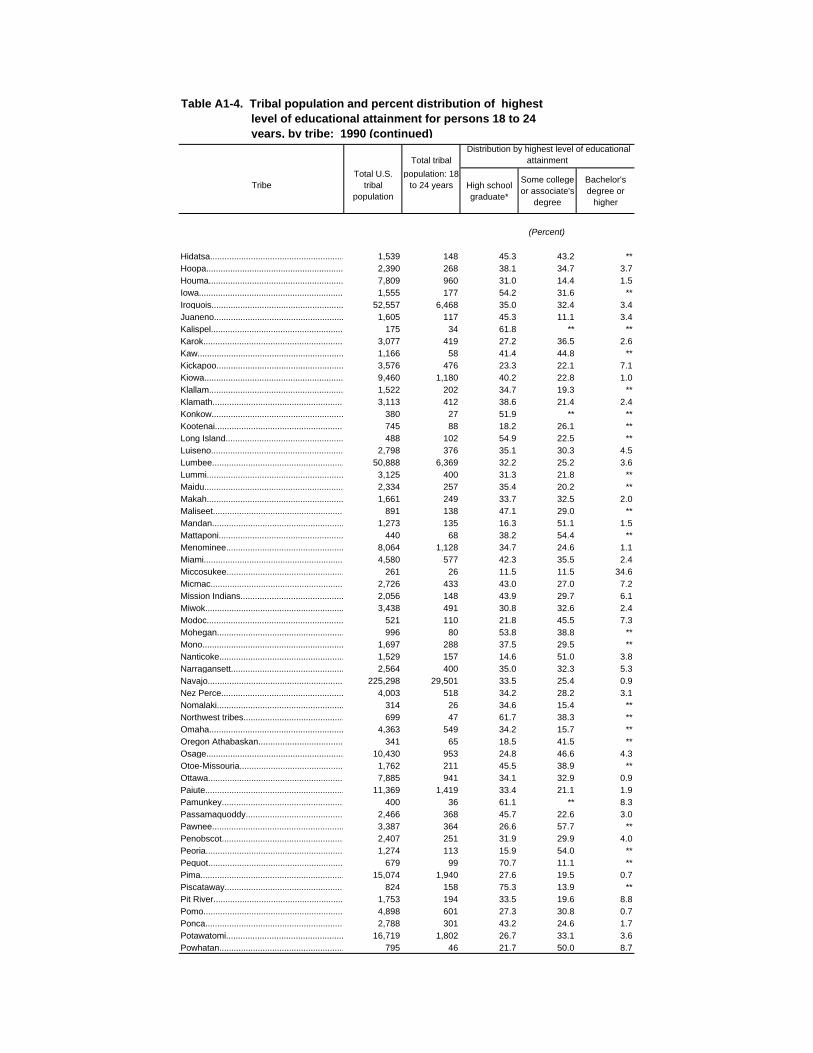
Total tribal Distribution by highest level of educational
attainment
TribeTotal U.S.
tribal population
population: 18 to 24 years High school
graduate*
Some college or associate's
degree
Bachelor's degree or
higher
(Percent)
Hidatsa.................................................................. 1,539 148 45.3 43.2 **Hoopa................................................................ 2,390 268 38.1 34.7 3.7Houma.................................................................. 7,809 960 31.0 14.4 1.5Iowa...................................................................... 1,555 177 54.2 31.6 **Iroquois............................................................. 52,557 6,468 35.0 32.4 3.4Juaneno............................................................. 1,605 117 45.3 11.1 3.4Kalispel................................................................... 175 34 61.8 ** **Karok..................................................................... 3,077 419 27.2 36.5 2.6Kaw..................................................................... 1,166 58 41.4 44.8 **Kickapoo................................................................ 3,576 476 23.3 22.1 7.1Kiowa................................................................... 9,460 1,180 40.2 22.8 1.0Klallam.................................................................. 1,522 202 34.7 19.3 **Klamath.............................................................. 3,113 412 38.6 21.4 2.4Konkow................................................................. 380 27 51.9 ** **Kootenai............................................................... 745 88 18.2 26.1 **Long Island.......................................................... 488 102 54.9 22.5 **Luiseno................................................................... 2,798 376 35.1 30.3 4.5Lumbee............................................................. 50,888 6,369 32.2 25.2 3.6Lummi.................................................................. 3,125 400 31.3 21.8 **Maidu.................................................................. 2,334 257 35.4 20.2 **Makah............................................................... 1,661 249 33.7 32.5 2.0Maliseet................................................................. 891 138 47.1 29.0 **Mandan................................................................ 1,273 135 16.3 51.1 1.5Mattaponi............................................................ 440 68 38.2 54.4 **Menominee............................................................. 8,064 1,128 34.7 24.6 1.1Miami........................................................................ 4,580 577 42.3 35.5 2.4Miccosukee........................................................... 261 26 11.5 11.5 34.6Micmac.................................................................... 2,726 433 43.0 27.0 7.2Mission Indians................................................ 2,056 148 43.9 29.7 6.1Miwok.................................................................. 3,438 491 30.8 32.6 2.4Modoc.................................................................... 521 110 21.8 45.5 7.3Mohegan.............................................................. 996 80 53.8 38.8 **Mono................................................................. 1,697 288 37.5 29.5 **Nanticoke............................................................ 1,529 157 14.6 51.0 3.8Narragansett...................................................... 2,564 400 35.0 32.3 5.3Navajo................................................................ 225,298 29,501 33.5 25.4 0.9Nez Perce.............................................................. 4,003 518 34.2 28.2 3.1Nomalaki................................................................ 314 26 34.6 15.4 **Northwest tribes.................................................. 699 47 61.7 38.3 **Omaha................................................................. 4,363 549 34.2 15.7 **Oregon Athabaskan.............................................. 341 65 18.5 41.5 **Osage............................................................... 10,430 953 24.8 46.6 4.3Otoe-Missouria.................................................. 1,762 211 45.5 38.9 **Ottawa................................................................... 7,885 941 34.1 32.9 0.9Paiute................................................................... 11,369 1,419 33.4 21.1 1.9Pamunkey......................................................... 400 36 61.1 ** 8.3Passamaquoddy............................................. 2,466 368 45.7 22.6 3.0Pawnee............................................................... 3,387 364 26.6 57.7 **Penobscot............................................................ 2,407 251 31.9 29.9 4.0Peoria................................................................ 1,274 113 15.9 54.0 **Pequot............................................................... 679 99 70.7 11.1 **Pima.................................................................... 15,074 1,940 27.6 19.5 0.7Piscataway........................................................... 824 158 75.3 13.9 **Pit River................................................................ 1,753 194 33.5 19.6 8.8Pomo...................................................................... 4,898 601 27.3 30.8 0.7Ponca................................................................... 2,788 301 43.2 24.6 1.7Potawatomi....................................................... 16,719 1,802 26.7 33.1 3.6Powhatan.......................................................... 795 46 21.7 50.0 8.7
Table A1-4. Tribal population and percent distribution of highest level of educational attainment for persons 18 to 24 years, by tribe: 1990 (continued)
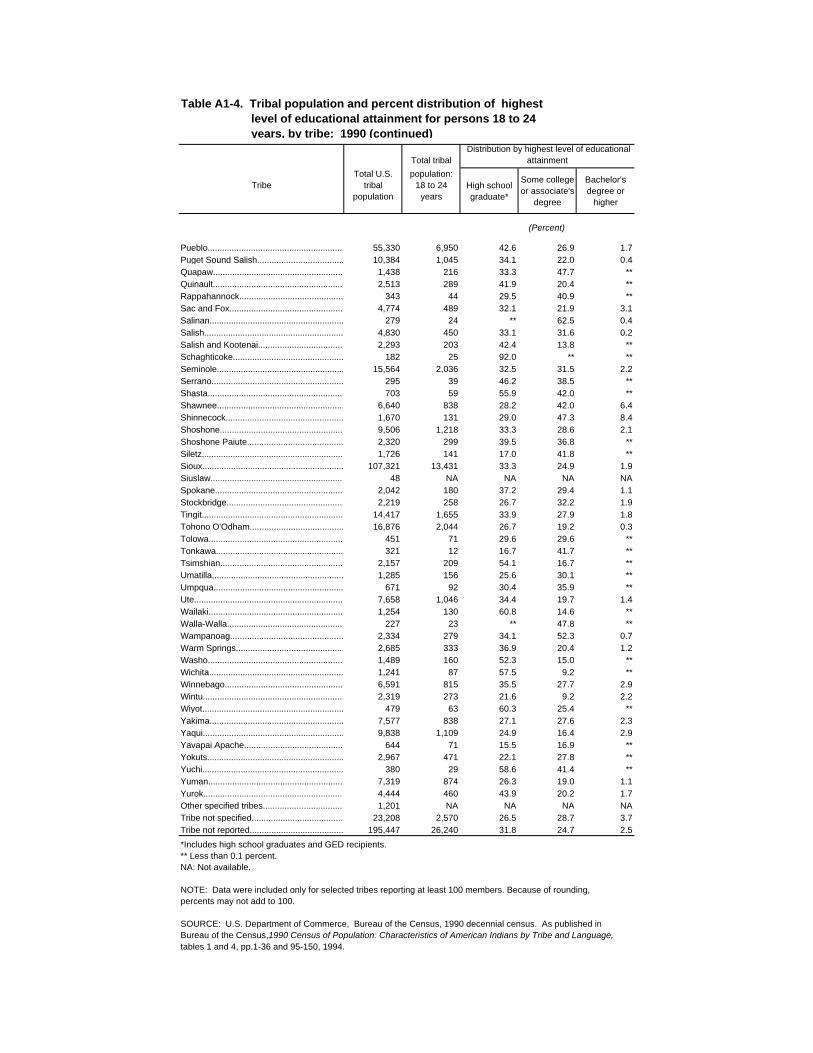
Total tribal Distribution by highest level of educational
attainment
TribeTotal U.S.
tribal population
population:18 to 24
yearsHigh school graduate*
Some college or associate's
degree
Bachelor's degree or
higher
(Percent)
Pueblo.............................................................. 55,330 6,950 42.6 26.9 1.7Puget Sound Salish............................................ 10,384 1,045 34.1 22.0 0.4Quapaw.............................................................. 1,438 216 33.3 47.7 **Quinault................................................................ 2,513 289 41.9 20.4 **Rappahannock................................................... 343 44 29.5 40.9 **Sac and Fox....................................................... 4,774 489 32.1 21.9 3.1Salinan.................................................................. 279 24 ** 62.5 0.4Salish................................................................. 4,830 450 33.1 31.6 0.2Salish and Kootenai.......................................... 2,293 203 42.4 13.8 **Schaghticoke....................................................... 182 25 92.0 ** **Seminole............................................................. 15,564 2,036 32.5 31.5 2.2Serrano.................................................................. 295 39 46.2 38.5 **Shasta................................................................. 703 59 55.9 42.0 **Shawnee............................................................ 6,640 838 28.2 42.0 6.4Shinnecock......................................................... 1,670 131 29.0 47.3 8.4Shoshone............................................................ 9,506 1,218 33.3 28.6 2.1Shoshone Paiute............................................... 2,320 299 39.5 36.8 **Siletz................................................................... 1,726 141 17.0 41.8 **Sioux................................................................... 107,321 13,431 33.3 24.9 1.9Siuslaw............................................................. 48 NA NA NA NASpokane.......................................................... 2,042 180 37.2 29.4 1.1Stockbridge........................................................ 2,219 258 26.7 32.2 1.9Tingit................................................................... 14,417 1,655 33.9 27.9 1.8Tohono O'Odham................................................. 16,876 2,044 26.7 19.2 0.3Tolowa................................................................ 451 71 29.6 29.6 **Tonkawa.......................................................... 321 12 16.7 41.7 **Tsimshian............................................................ 2,157 209 54.1 16.7 **Umatilla.................................................................. 1,285 156 25.6 30.1 **Umpqua.............................................................. 671 92 30.4 35.9 **Ute....................................................................... 7,658 1,046 34.4 19.7 1.4Wailaki................................................................. 1,254 130 60.8 14.6 **Walla-Walla........................................................... 227 23 ** 47.8 **Wampanoag........................................................ 2,334 279 34.1 52.3 0.7Warm Springs................................................... 2,685 333 36.9 20.4 1.2Washo.................................................................... 1,489 160 52.3 15.0 **Wichita................................................................... 1,241 87 57.5 9.2 **Winnebago.......................................................... 6,591 815 35.5 27.7 2.9Wintu.................................................................... 2,319 273 21.6 9.2 2.2Wiyot....................................................................... 479 63 60.3 25.4 **Yakima................................................................. 7,577 838 27.1 27.6 2.3Yaqui...................................................................... 9,838 1,109 24.9 16.4 2.9Yavapai Apache..................................................... 644 71 15.5 16.9 **Yokuts................................................................... 2,967 471 22.1 27.8 **Yuchi..................................................................... 380 29 58.6 41.4 **Yuman.................................................................. 7,319 874 26.3 19.0 1.1Yurok................................................................. 4,444 460 43.9 20.2 1.7Other specified tribes........................................... 1,201 NA NA NA NATribe not specified.............................................. 23,208 2,570 26.5 28.7 3.7Tribe not reported.................................................195,447 26,240 31.8 24.7 2.5
*Includes high school graduates and GED recipients.** Less than 0.1 percent.NA: Not available.
NOTE: Data were included only for selected tribes reporting at least 100 members. Because of rounding, percents may not add to 100.
SOURCE: U.S. Department of Commerce, Bureau of the Census, 1990 decennial census. As published in Bureau of the Census,1990 Census of Population: Characteristics of American Indians by Tribe and Language, tables 1 and 4, pp.1-36 and 95-150, 1994.
Table A1-4. Tribal population and percent distribution of highest level of educational attainment for persons 18 to 24 years, by tribe: 1990 (continued)
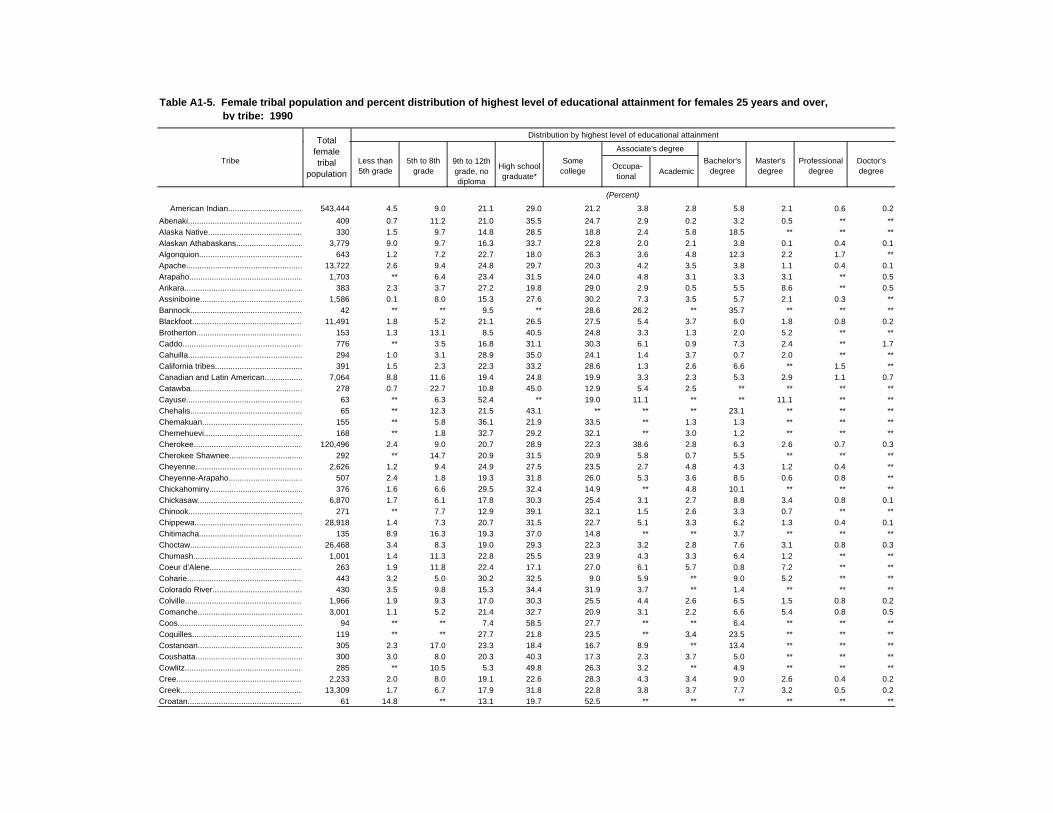
Distribution by highest level of educational attainment
Associate's degree
Tribe Less than 5th grade
5th to 8th grade
9th to 12th grade, no diploma
High school graduate*
Some college
Occupa-tional
AcademicBachelor's
degreeMaster's degree
Professional degree
Doctor's degree
(Percent)
American Indian.................................... 543,444 4.5 9.0 21.1 29.0 21.2 3.8 2.8 5.8 2.1 0.6 0.2
Abenaki......................................................................409 0.7 11.2 21.0 35.5 24.7 2.9 0.2 3.2 0.5 ** **Alaska Native.........................................................330 1.5 9.7 14.8 28.5 18.8 2.4 5.8 18.5 ** ** **Alaskan Athabaskans...........................................3,779 9.0 9.7 16.3 33.7 22.8 2.0 2.1 3.8 0.1 0.4 0.1Algonquion.......................................................... 643 1.2 7.2 22.7 18.0 26.3 3.6 4.8 12.3 2.2 1.7 **Apache...............................................................13,722 2.6 9.4 24.8 29.7 20.3 4.2 3.5 3.8 1.1 0.4 0.1Arapaho.............................................................. 1,703 ** 6.4 23.4 31.5 24.0 4.8 3.1 3.3 3.1 ** 0.5Arikara.................................................................. 383 2.3 3.7 27.2 19.8 29.0 2.9 0.5 5.5 8.6 ** 0.5Assiniboine..........................................................1,586 0.1 8.0 15.3 27.6 30.2 7.3 3.5 5.7 2.1 0.3 **Bannock.............................................................. 42 ** ** 9.5 ** 28.6 26.2 ** 35.7 ** ** **Blackfoot..............................................................11,491 1.8 5.2 21.1 26.5 27.5 5.4 3.7 6.0 1.8 0.8 0.2Brotherton......................................................... 153 1.3 13.1 8.5 40.5 24.8 3.3 1.3 2.0 5.2 ** **Caddo.................................................................. 776 ** 3.5 16.8 31.1 30.3 6.1 0.9 7.3 2.4 ** 1.7Cahuilla................................................................ 294 1.0 3.1 28.9 35.0 24.1 1.4 3.7 0.7 2.0 ** **California tribes..................................................... 391 1.5 2.3 22.3 33.2 28.6 1.3 2.6 6.6 ** 1.5 **Canadian and Latin American.................................7,064 8.8 11.6 19.4 24.8 19.9 3.3 2.3 5.3 2.9 1.1 0.7Catawba.............................................................. 278 0.7 22.7 10.8 45.0 12.9 5.4 2.5 ** ** ** **Cayuse................................................................. 63 ** 6.3 52.4 ** 19.0 11.1 ** ** 11.1 ** **Chehalis................................................................. 65 ** 12.3 21.5 43.1 ** ** ** 23.1 ** ** **Chemakuan....................................................... 155 ** 5.8 36.1 21.9 33.5 ** 1.3 1.3 ** ** **Chemehuevi........................................................ 168 ** 1.8 32.7 29.2 32.1 ** 3.0 1.2 ** ** **Cherokee...........................................................120,496 2.4 9.0 20.7 28.9 22.3 38.6 2.8 6.3 2.6 0.7 0.3Cherokee Shawnee............................................... 292 ** 14.7 20.9 31.5 20.9 5.8 0.7 5.5 ** ** **Cheyenne...............................................................2,626 1.2 9.4 24.9 27.5 23.5 2.7 4.8 4.3 1.2 0.4 **Cheyenne-Arapaho............................................ 507 2.4 1.8 19.3 31.8 26.0 5.3 3.6 8.5 0.6 0.8 **Chickahominy.................................................. 376 1.6 6.6 29.5 32.4 14.9 ** 4.8 10.1 ** ** **Chickasaw...........................................................6,870 1.7 6.1 17.8 30.3 25.4 3.1 2.7 8.8 3.4 0.8 0.1Chinook............................................................... 271 ** 7.7 12.9 39.1 32.1 1.5 2.6 3.3 0.7 ** **Chippewa..........................................................28,918 1.4 7.3 20.7 31.5 22.7 5.1 3.3 6.2 1.3 0.4 0.1Chitimacha.......................................................... 135 8.9 16.3 19.3 37.0 14.8 ** ** 3.7 ** ** **Choctaw...............................................................26,468 3.4 8.3 19.0 29.3 22.3 3.2 2.8 7.6 3.1 0.8 0.3Chumash..............................................................1,001 1.4 11.3 22.8 25.5 23.9 4.3 3.3 6.4 1.2 ** **Coeur d'Alene.................................................. 263 1.9 11.8 22.4 17.1 27.0 6.1 5.7 0.8 7.2 ** **Coharie.............................................................. 443 3.2 5.0 30.2 32.5 9.0 5.9 ** 9.0 5.2 ** **Colorado River................................................... 430 3.5 9.8 15.3 34.4 31.9 3.7 ** 1.4 ** ** **Colville.................................................................1,966 1.9 9.3 17.0 30.3 25.5 4.4 2.6 6.5 1.5 0.8 0.2Comanche.......................................................... 3,001 1.1 5.2 21.4 32.7 20.9 3.1 2.2 6.6 5.4 0.8 0.5Coos....................................................................... 94 ** ** 7.4 58.5 27.7 ** ** 6.4 ** ** **Coquilles............................................................. 119 ** ** 27.7 21.8 23.5 ** 3.4 23.5 ** ** **Costanoan........................................................ 305 2.3 17.0 23.3 18.4 16.7 8.9 ** 13.4 ** ** **Coushatta........................................................... 300 3.0 8.0 20.3 40.3 17.3 2.3 3.7 5.0 ** ** **Cowlitz.................................................................. 285 ** 10.5 5.3 49.8 26.3 3.2 ** 4.9 ** ** **Cree...........................................................................2,233 2.0 8.0 19.1 22.6 28.3 4.3 3.4 9.0 2.6 0.4 0.2Creek......................................................................13,309 1.7 6.7 17.9 31.8 22.8 3.8 3.7 7.7 3.2 0.5 0.2Croatan............................................................... 61 14.8 ** 13.1 19.7 52.5 ** ** ** ** ** **
Table A1-5. Female tribal population and percent distribution of highest level of educational attainment for females 25 years and over, by tribe: 1990
Total female tribal
population
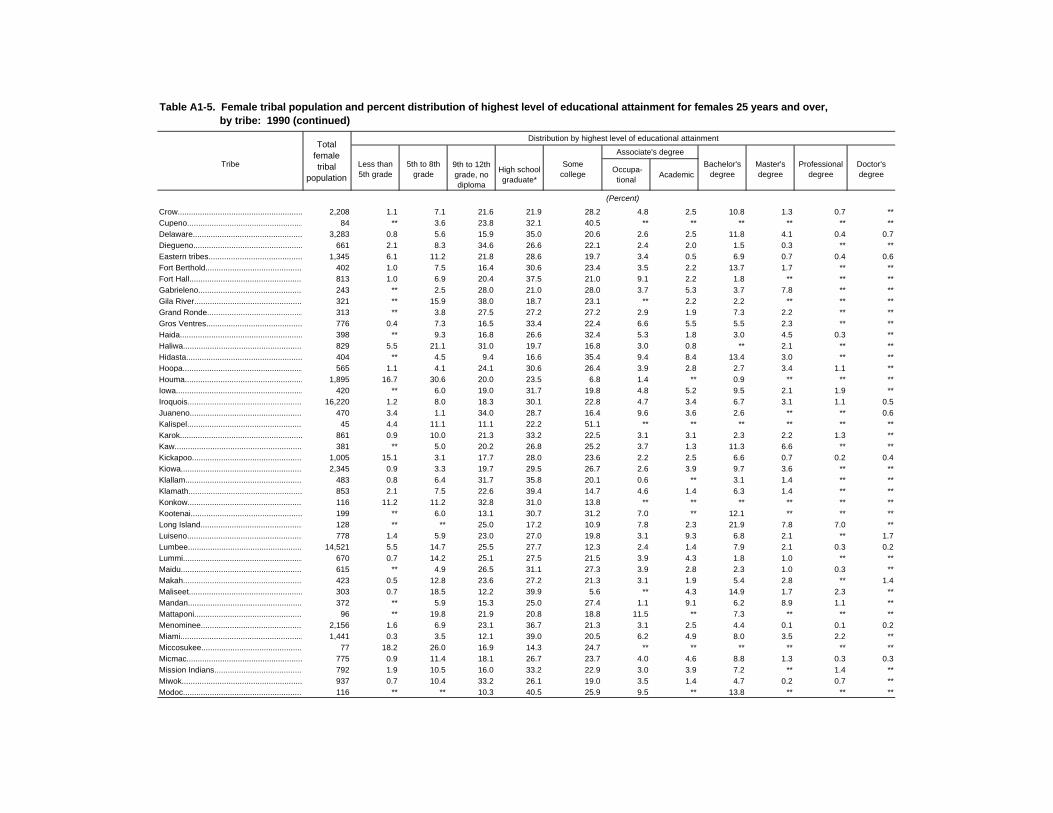
Distribution by highest level of educational attainment
Associate's degree
Tribe Less than 5th grade
5th to 8th grade
9th to 12th grade, no diploma
High school graduate*
Some college
Occupa-tional
AcademicBachelor's
degreeMaster's degree
Professional degree
Doctor's degree
(Percent)
Crow........................................................................2,208 1.1 7.1 21.6 21.9 28.2 4.8 2.5 10.8 1.3 0.7 **Cupeno................................................................ 84 ** 3.6 23.8 32.1 40.5 ** ** ** ** ** **Delaware...............................................................3,283 0.8 5.6 15.9 35.0 20.6 2.6 2.5 11.8 4.1 0.4 0.7Diegueno........................................................... 661 2.1 8.3 34.6 26.6 22.1 2.4 2.0 1.5 0.3 ** **Eastern tribes.......................................................1,345 6.1 11.2 21.8 28.6 19.7 3.4 0.5 6.9 0.7 0.4 0.6Fort Berthold....................................................... 402 1.0 7.5 16.4 30.6 23.4 3.5 2.2 13.7 1.7 ** **Fort Hall.............................................................. 813 1.0 6.9 20.4 37.5 21.0 9.1 2.2 1.8 ** ** **Gabrieleno...............................................................243 ** 2.5 28.0 21.0 28.0 3.7 5.3 3.7 7.8 ** **Gila River.................................................................321 ** 15.9 38.0 18.7 23.1 ** 2.2 2.2 ** ** **Grand Ronde....................................................... 313 ** 3.8 27.5 27.2 27.2 2.9 1.9 7.3 2.2 ** **Gros Ventres........................................................ 776 0.4 7.3 16.5 33.4 22.4 6.6 5.5 5.5 2.3 ** **Haida.................................................................. 398 ** 9.3 16.8 26.6 32.4 5.3 1.8 3.0 4.5 0.3 **Haliwa................................................................. 829 5.5 21.1 31.0 19.7 16.8 3.0 0.8 ** 2.1 ** **Hidasta............................................................. 404 ** 4.5 9.4 16.6 35.4 9.4 8.4 13.4 3.0 ** **Hoopa.............................................................. 565 1.1 4.1 24.1 30.6 26.4 3.9 2.8 2.7 3.4 1.1 **Houma............................................................ 1,895 16.7 30.6 20.0 23.5 6.8 1.4 ** 0.9 ** ** **Iowa...................................................................... 420 ** 6.0 19.0 31.7 19.8 4.8 5.2 9.5 2.1 1.9 **Iroquois.............................................................16,220 1.2 8.0 18.3 30.1 22.8 4.7 3.4 6.7 3.1 1.1 0.5Juaneno............................................................. 470 3.4 1.1 34.0 28.7 16.4 9.6 3.6 2.6 ** ** 0.6Kalispel................................................................... 45 4.4 11.1 11.1 22.2 51.1 ** ** ** ** ** **Karok.................................................................... 861 0.9 10.0 21.3 33.2 22.5 3.1 3.1 2.3 2.2 1.3 **Kaw..................................................................... 381 ** 5.0 20.2 26.8 25.2 3.7 1.3 11.3 6.6 ** **Kickapoo................................................................1,005 15.1 3.1 17.7 28.0 23.6 2.2 2.5 6.6 0.7 0.2 0.4Kiowa...................................................................2,345 0.9 3.3 19.7 29.5 26.7 2.6 3.9 9.7 3.6 ** **Klallam.................................................................. 483 0.8 6.4 31.7 35.8 20.1 0.6 ** 3.1 1.4 ** **Klamath.............................................................. 853 2.1 7.5 22.6 39.4 14.7 4.6 1.4 6.3 1.4 ** **Konkow................................................................. 116 11.2 11.2 32.8 31.0 13.8 ** ** ** ** ** **Kootenai............................................................... 199 ** 6.0 13.1 30.7 31.2 7.0 ** 12.1 ** ** **Long Island.......................................................... 128 ** ** 25.0 17.2 10.9 7.8 2.3 21.9 7.8 7.0 **Luiseno...................................................................778 1.4 5.9 23.0 27.0 19.8 3.1 9.3 6.8 2.1 ** 1.7Lumbee.............................................................14,521 5.5 14.7 25.5 27.7 12.3 2.4 1.4 7.9 2.1 0.3 0.2Lummi.................................................................. 670 0.7 14.2 25.1 27.5 21.5 3.9 4.3 1.8 1.0 ** **Maidu.................................................................. 615 ** 4.9 26.5 31.1 27.3 3.9 2.8 2.3 1.0 0.3 **Makah............................................................... 423 0.5 12.8 23.6 27.2 21.3 3.1 1.9 5.4 2.8 ** 1.4Maliseet................................................................. 303 0.7 18.5 12.2 39.9 5.6 ** 4.3 14.9 1.7 2.3 **Mandan........................................................... 372 ** 5.9 15.3 25.0 27.4 1.1 9.1 6.2 8.9 1.1 **Mattaponi............................................................ 96 ** 19.8 21.9 20.8 18.8 11.5 ** 7.3 ** ** **Menominee.............................................................2,156 1.6 6.9 23.1 36.7 21.3 3.1 2.5 4.4 0.1 0.1 0.2Miami........................................................................1,441 0.3 3.5 12.1 39.0 20.5 6.2 4.9 8.0 3.5 2.2 **Miccosukee........................................................... 77 18.2 26.0 16.9 14.3 24.7 ** ** ** ** ** **Micmac....................................................................775 0.9 11.4 18.1 26.7 23.7 4.0 4.6 8.8 1.3 0.3 0.3Mission Indians................................................ 792 1.9 10.5 16.0 33.2 22.9 3.0 3.9 7.2 ** 1.4 **Miwok.................................................................. 937 0.7 10.4 33.2 26.1 19.0 3.5 1.4 4.7 0.2 0.7 **Modoc.................................................................... 116 ** ** 10.3 40.5 25.9 9.5 ** 13.8 ** ** **
Table A1-5. Female tribal population and percent distribution of highest level of educational attainment for females 25 years and over, by tribe: 1990 (continued)
Total female tribal
population
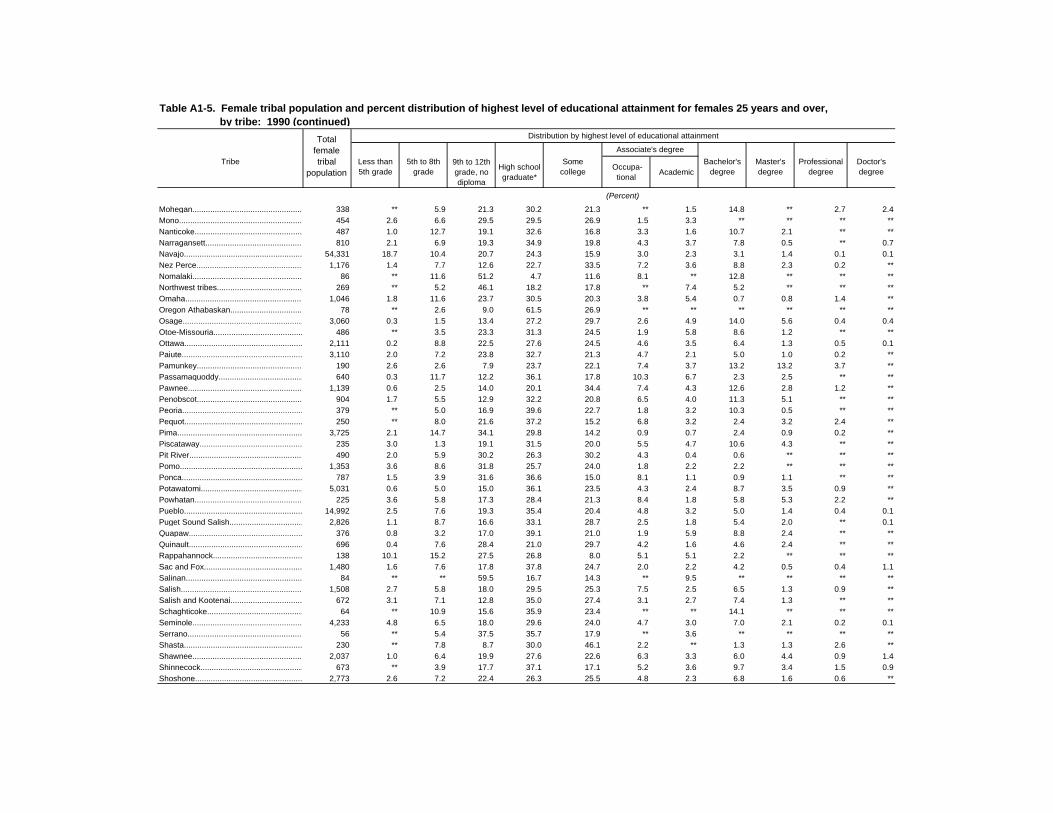
Distribution by highest level of educational attainment
Associate's degree
Tribe Less than 5th grade
5th to 8th grade
9th to 12th grade, no diploma
High school graduate*
Some college
Occupa-tional
AcademicBachelor's
degreeMaster's degree
Professional degree
Doctor's degree
(Percent)
Mohegan.............................................................. 338 ** 5.9 21.3 30.2 21.3 ** 1.5 14.8 ** 2.7 2.4Mono................................................................. 454 2.6 6.6 29.5 29.5 26.9 1.5 3.3 ** ** ** **Nanticoke............................................................ 487 1.0 12.7 19.1 32.6 16.8 3.3 1.6 10.7 2.1 ** **Narragansett...................................................... 810 2.1 6.9 19.3 34.9 19.8 4.3 3.7 7.8 0.5 ** 0.7Navajo................................................................54,331 18.7 10.4 20.7 24.3 15.9 3.0 2.3 3.1 1.4 0.1 0.1Nez Perce..............................................................1,176 1.4 7.7 12.6 22.7 33.5 7.2 3.6 8.8 2.3 0.2 **Nomalaki................................................................ 86 ** 11.6 51.2 4.7 11.6 8.1 ** 12.8 ** ** **Northwest tribes.................................................. 269 ** 5.2 46.1 18.2 17.8 ** 7.4 5.2 ** ** **Omaha.................................................................1,046 1.8 11.6 23.7 30.5 20.3 3.8 5.4 0.7 0.8 1.4 **Oregon Athabaskan.............................................. 78 ** 2.6 9.0 61.5 26.9 ** ** ** ** ** **Osage............................................................... 3,060 0.3 1.5 13.4 27.2 29.7 2.6 4.9 14.0 5.6 0.4 0.4Otoe-Missouria.................................................. 486 ** 3.5 23.3 31.3 24.5 1.9 5.8 8.6 1.2 ** **Ottawa...................................................................2,111 0.2 8.8 22.5 27.6 24.5 4.6 3.5 6.4 1.3 0.5 0.1Paiute...................................................................3,110 2.0 7.2 23.8 32.7 21.3 4.7 2.1 5.0 1.0 0.2 **Pamunkey......................................................... 190 2.6 2.6 7.9 23.7 22.1 7.4 3.7 13.2 13.2 3.7 **Passamaquoddy............................................. 640 0.3 11.7 12.2 36.1 17.8 10.3 6.7 2.3 2.5 ** **Pawnee...............................................................1,139 0.6 2.5 14.0 20.1 34.4 7.4 4.3 12.6 2.8 1.2 **Penobscot............................................................ 904 1.7 5.5 12.9 32.2 20.8 6.5 4.0 11.3 5.1 ** **Peoria................................................................ 379 ** 5.0 16.9 39.6 22.7 1.8 3.2 10.3 0.5 ** **Pequot............................................................... 250 ** 8.0 21.6 37.2 15.2 6.8 3.2 2.4 3.2 2.4 **Pima....................................................................3,725 2.1 14.7 34.1 29.8 14.2 0.9 0.7 2.4 0.9 0.2 **Piscataway........................................................... 235 3.0 1.3 19.1 31.5 20.0 5.5 4.7 10.6 4.3 ** **Pit River................................................................ 490 2.0 5.9 30.2 26.3 30.2 4.3 0.4 0.6 ** ** **Pomo......................................................................1,353 3.6 8.6 31.8 25.7 24.0 1.8 2.2 2.2 ** ** **Ponca................................................................... 787 1.5 3.9 31.6 36.6 15.0 8.1 1.1 0.9 1.1 ** **Potawatomi..................................................... 5,031 0.6 5.0 15.0 36.1 23.5 4.3 2.4 8.7 3.5 0.9 **Powhatan.......................................................... 225 3.6 5.8 17.3 28.4 21.3 8.4 1.8 5.8 5.3 2.2 **Pueblo.............................................................. 14,992 2.5 7.6 19.3 35.4 20.4 4.8 3.2 5.0 1.4 0.4 0.1Puget Sound Salish............................................ 2,826 1.1 8.7 16.6 33.1 28.7 2.5 1.8 5.4 2.0 ** 0.1Quapaw.............................................................. 376 0.8 3.2 17.0 39.1 21.0 1.9 5.9 8.8 2.4 ** **Quinault.......................................................... 696 0.4 7.6 28.4 21.0 29.7 4.2 1.6 4.6 2.4 ** **Rappahannock................................................. 138 10.1 15.2 27.5 26.8 8.0 5.1 5.1 2.2 ** ** **Sac and Fox................................................... 1,480 1.6 7.6 17.8 37.8 24.7 2.0 2.2 4.2 0.5 0.4 1.1Salinan.................................................................. 84 ** ** 59.5 16.7 14.3 ** 9.5 ** ** ** **Salish................................................................. 1,508 2.7 5.8 18.0 29.5 25.3 7.5 2.5 6.5 1.3 0.9 **Salish and Kootenai.......................................... 672 3.1 7.1 12.8 35.0 27.4 3.1 2.7 7.4 1.3 ** **Schaghticoke....................................................... 64 ** 10.9 15.6 35.9 23.4 ** ** 14.1 ** ** **Seminole.............................................................4,233 4.8 6.5 18.0 29.6 24.0 4.7 3.0 7.0 2.1 0.2 0.1Serrano.................................................................. 56 ** 5.4 37.5 35.7 17.9 ** 3.6 ** ** ** **Shasta................................................................. 230 ** 7.8 8.7 30.0 46.1 2.2 ** 1.3 1.3 2.6 **Shawnee..............................................................2,037 1.0 6.4 19.9 27.6 22.6 6.3 3.3 6.0 4.4 0.9 1.4Shinnecock......................................................... 673 ** 3.9 17.7 37.1 17.1 5.2 3.6 9.7 3.4 1.5 0.9Shoshone............................................................2,773 2.6 7.2 22.4 26.3 25.5 4.8 2.3 6.8 1.6 0.6 **
Table A1-5. Female tribal population and percent distribution of highest level of educational attainment for females 25 years and over, by tribe: 1990 (continued)
Total female tribal
population
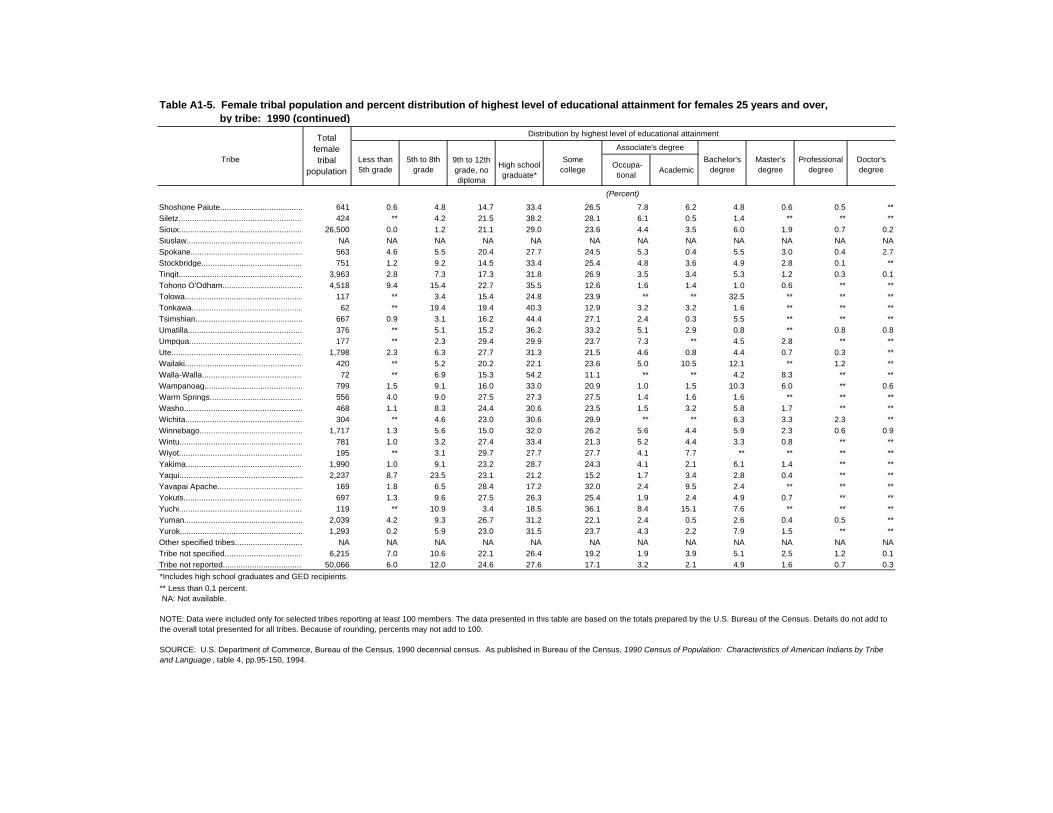
Distribution by highest level of educational attainment
Associate's degree
Tribe Less than 5th grade
5th to 8th grade
9th to 12th grade, no diploma
High school graduate*
Some college
Occupa-tional
AcademicBachelor's
degreeMaster's degree
Professional degree
Doctor's degree
(Percent)
Shoshone Paiute............................................... 641 0.6 4.8 14.7 33.4 26.5 7.8 6.2 4.8 0.6 0.5 **Siletz................................................................... 424 ** 4.2 21.5 38.2 28.1 6.1 0.5 1.4 ** ** **Sioux...................................................................26,500 0.0 1.2 21.1 29.0 23.6 4.4 3.5 6.0 1.9 0.7 0.2Siuslaw............................................................. NA NA NA NA NA NA NA NA NA NA NA NASpokane......................................................... 563 4.6 5.5 20.4 27.7 24.5 5.3 0.4 5.5 3.0 0.4 2.7Stockbridge........................................................ 751 1.2 9.2 14.5 33.4 25.4 4.8 3.6 4.9 2.8 0.1 **Tingit...................................................................3,963 2.8 7.3 17.3 31.8 26.9 3.5 3.4 5.3 1.2 0.3 0.1Tohono O'Odham.................................................4,518 9.4 15.4 22.7 35.5 12.6 1.6 1.4 1.0 0.6 ** **Tolowa................................................................ 117 ** 3.4 15.4 24.8 23.9 ** ** 32.5 ** ** **Tonkawa.......................................................... 62 ** 19.4 19.4 40.3 12.9 3.2 3.2 1.6 ** ** **Tsimshian............................................................ 667 0.9 3.1 16.2 44.4 27.1 2.4 0.3 5.5 ** ** **Umatilla..................................................................376 ** 5.1 15.2 36.2 33.2 5.1 2.9 0.8 ** 0.8 0.8Umpqua.............................................................. 177 ** 2.3 29.4 29.9 23.7 7.3 ** 4.5 2.8 ** **Ute.......................................................................1,798 2.3 6.3 27.7 31.3 21.5 4.6 0.8 4.4 0.7 0.3 **Wailaki................................................................. 420 ** 5.2 20.2 22.1 23.6 5.0 10.5 12.1 ** 1.2 **Walla-Walla........................................................... 72 ** 6.9 15.3 54.2 11.1 ** ** 4.2 8.3 ** **Wampanoag........................................................ 799 1.5 9.1 16.0 33.0 20.9 1.0 1.5 10.3 6.0 ** 0.6Warm Springs................................................... 556 4.0 9.0 27.5 27.3 27.5 1.4 1.6 1.6 ** ** **Washo....................................................................468 1.1 8.3 24.4 30.6 23.5 1.5 3.2 5.8 1.7 ** **Wichita...................................................................304 ** 4.6 23.0 30.6 29.9 ** ** 6.3 3.3 2.3 **Winnebago..........................................................1,717 1.3 5.6 15.0 32.0 26.2 5.6 4.4 5.9 2.3 0.6 0.9Wintu.................................................................... 781 1.0 3.2 27.4 33.4 21.3 5.2 4.4 3.3 0.8 ** **Wiyot.......................................................................195 ** 3.1 29.7 27.7 27.7 4.1 7.7 ** ** ** **Yakima.................................................................1,990 1.0 9.1 23.2 28.7 24.3 4.1 2.1 6.1 1.4 ** **Yaqui......................................................................2,237 8.7 23.5 23.1 21.2 15.2 1.7 3.4 2.8 0.4 ** **Yavapai Apache.....................................................169 1.8 6.5 28.4 17.2 32.0 2.4 9.5 2.4 ** ** **Yokuts................................................................... 697 1.3 9.6 27.5 26.3 25.4 1.9 2.4 4.9 0.7 ** **Yuchi..................................................................... 119 ** 10.9 3.4 18.5 36.1 8.4 15.1 7.6 ** ** **Yuman..................................................................2,039 4.2 9.3 26.7 31.2 22.1 2.4 0.5 2.6 0.4 0.5 **Yurok................................................................. 1,293 0.2 5.9 23.0 31.5 23.7 4.3 2.2 7.9 1.5 ** **Other specified tribes........................................... NA NA NA NA NA NA NA NA NA NA NA NATribe not specified.............................................. 6,215 7.0 10.6 22.1 26.4 19.2 1.9 3.9 5.1 2.5 1.2 0.1Tribe not reported.................................................50,066 6.0 12.0 24.6 27.6 17.1 3.2 2.1 4.9 1.6 0.7 0.3
*Includes high school graduates and GED recipients.
** Less than 0.1 percent. NA: Not available.
NOTE: Data were included only for selected tribes reporting at least 100 members. The data presented in this table are based on the totals prepared by the U.S. Bureau of the Census. Details do not add to the overall total presented for all tribes. Because of rounding, percents may not add to 100.
SOURCE: U.S. Department of Commerce, Bureau of the Census, 1990 decennial census. As published in Bureau of the Census, 1990 Census of Population: Characteristics of American Indians by Tribe and Language , table 4, pp.95-150, 1994.
Table A1-5. Female tribal population and percent distribution of highest level of educational attainment for females 25 years and over, by tribe: 1990 (continued)
Total female tribal
population
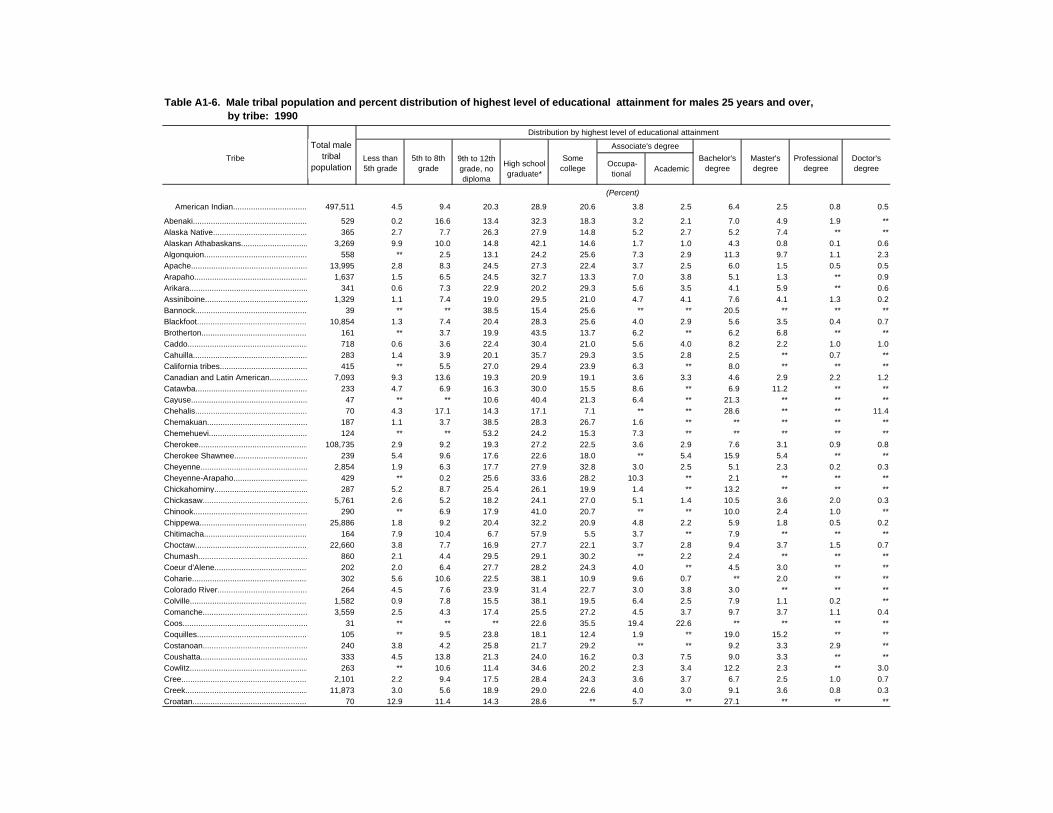
Distribution by highest level of educational attainment
Associate's degree
Tribe Less than 5th grade
5th to 8th grade
9th to 12th grade, no diploma
High school graduate*
Some college
Occupa-tional
AcademicBachelor's
degreeMaster's degree
Professional degree
Doctor's degree
(Percent)
American Indian.................................. 497,511 4.5 9.4 20.3 28.9 20.6 3.8 2.5 6.4 2.5 0.8 0.5
Abenaki......................................................................529 0.2 16.6 13.4 32.3 18.3 3.2 2.1 7.0 4.9 1.9 **Alaska Native.........................................................365 2.7 7.7 26.3 27.9 14.8 5.2 2.7 5.2 7.4 ** **Alaskan Athabaskans...........................................3,269 9.9 10.0 14.8 42.1 14.6 1.7 1.0 4.3 0.8 0.1 0.6Algonquion.......................................................... 558 ** 2.5 13.1 24.2 25.6 7.3 2.9 11.3 9.7 1.1 2.3Apache...............................................................13,995 2.8 8.3 24.5 27.3 22.4 3.7 2.5 6.0 1.5 0.5 0.5Arapaho.............................................................. 1,637 1.5 6.5 24.5 32.7 13.3 7.0 3.8 5.1 1.3 ** 0.9Arikara.................................................................. 341 0.6 7.3 22.9 20.2 29.3 5.6 3.5 4.1 5.9 ** 0.6Assiniboine..........................................................1,329 1.1 7.4 19.0 29.5 21.0 4.7 4.1 7.6 4.1 1.3 0.2Bannock.............................................................. 39 ** ** 38.5 15.4 25.6 ** ** 20.5 ** ** **Blackfoot..............................................................10,854 1.3 7.4 20.4 28.3 25.6 4.0 2.9 5.6 3.5 0.4 0.7Brotherton......................................................... 161 ** 3.7 19.9 43.5 13.7 6.2 ** 6.2 6.8 ** **Caddo.................................................................. 718 0.6 3.6 22.4 30.4 21.0 5.6 4.0 8.2 2.2 1.0 1.0Cahuilla................................................................ 283 1.4 3.9 20.1 35.7 29.3 3.5 2.8 2.5 ** 0.7 **California tribes..................................................... 415 ** 5.5 27.0 29.4 23.9 6.3 ** 8.0 ** ** **Canadian and Latin American.................................7,093 9.3 13.6 19.3 20.9 19.1 3.6 3.3 4.6 2.9 2.2 1.2Catawba.............................................................. 233 4.7 6.9 16.3 30.0 15.5 8.6 ** 6.9 11.2 ** **Cayuse................................................................. 47 ** ** 10.6 40.4 21.3 6.4 ** 21.3 ** ** **Chehalis................................................................. 70 4.3 17.1 14.3 17.1 7.1 ** ** 28.6 ** ** 11.4Chemakuan....................................................... 187 1.1 3.7 38.5 28.3 26.7 1.6 ** ** ** ** **Chemehuevi........................................................ 124 ** ** 53.2 24.2 15.3 7.3 ** ** ** ** **Cherokee...........................................................108,735 2.9 9.2 19.3 27.2 22.5 3.6 2.9 7.6 3.1 0.9 0.8Cherokee Shawnee............................................... 239 5.4 9.6 17.6 22.6 18.0 ** 5.4 15.9 5.4 ** **Cheyenne...............................................................2,854 1.9 6.3 17.7 27.9 32.8 3.0 2.5 5.1 2.3 0.2 0.3Cheyenne-Arapaho............................................ 429 ** 0.2 25.6 33.6 28.2 10.3 ** 2.1 ** ** **Chickahominy.................................................. 287 5.2 8.7 25.4 26.1 19.9 1.4 ** 13.2 ** ** **Chickasaw...........................................................5,761 2.6 5.2 18.2 24.1 27.0 5.1 1.4 10.5 3.6 2.0 0.3Chinook............................................................... 290 ** 6.9 17.9 41.0 20.7 ** ** 10.0 2.4 1.0 **Chippewa..........................................................25,886 1.8 9.2 20.4 32.2 20.9 4.8 2.2 5.9 1.8 0.5 0.2Chitimacha.......................................................... 164 7.9 10.4 6.7 57.9 5.5 3.7 ** 7.9 ** ** **Choctaw...............................................................22,660 3.8 7.7 16.9 27.7 22.1 3.7 2.8 9.4 3.7 1.5 0.7Chumash.............................................................. 860 2.1 4.4 29.5 29.1 30.2 ** 2.2 2.4 ** ** **Coeur d'Alene.................................................. 202 2.0 6.4 27.7 28.2 24.3 4.0 ** 4.5 3.0 ** **Coharie.............................................................. 302 5.6 10.6 22.5 38.1 10.9 9.6 0.7 ** 2.0 ** **Colorado River................................................... 264 4.5 7.6 23.9 31.4 22.7 3.0 3.8 3.0 ** ** **Colville.................................................................1,582 0.9 7.8 15.5 38.1 19.5 6.4 2.5 7.9 1.1 0.2 **Comanche.......................................................... 3,559 2.5 4.3 17.4 25.5 27.2 4.5 3.7 9.7 3.7 1.1 0.4Coos....................................................................... 31 ** ** ** 22.6 35.5 19.4 22.6 ** ** ** **Coquilles............................................................. 105 ** 9.5 23.8 18.1 12.4 1.9 ** 19.0 15.2 ** **Costanoan............................................................ 240 3.8 4.2 25.8 21.7 29.2 ** ** 9.2 3.3 2.9 **Coushatta........................................................... 333 4.5 13.8 21.3 24.0 16.2 0.3 7.5 9.0 3.3 ** **Cowlitz.................................................................. 263 ** 10.6 11.4 34.6 20.2 2.3 3.4 12.2 2.3 ** 3.0Cree...........................................................................2,101 2.2 9.4 17.5 28.4 24.3 3.6 3.7 6.7 2.5 1.0 0.7Creek......................................................................11,873 3.0 5.6 18.9 29.0 22.6 4.0 3.0 9.1 3.6 0.8 0.3Croatan............................................................... 70 12.9 11.4 14.3 28.6 ** 5.7 ** 27.1 ** ** **
Table A1-6. Male tribal population and percent distribution of highest level of educational attainment for males 25 years and over, by tribe: 1990
Total male tribal
population
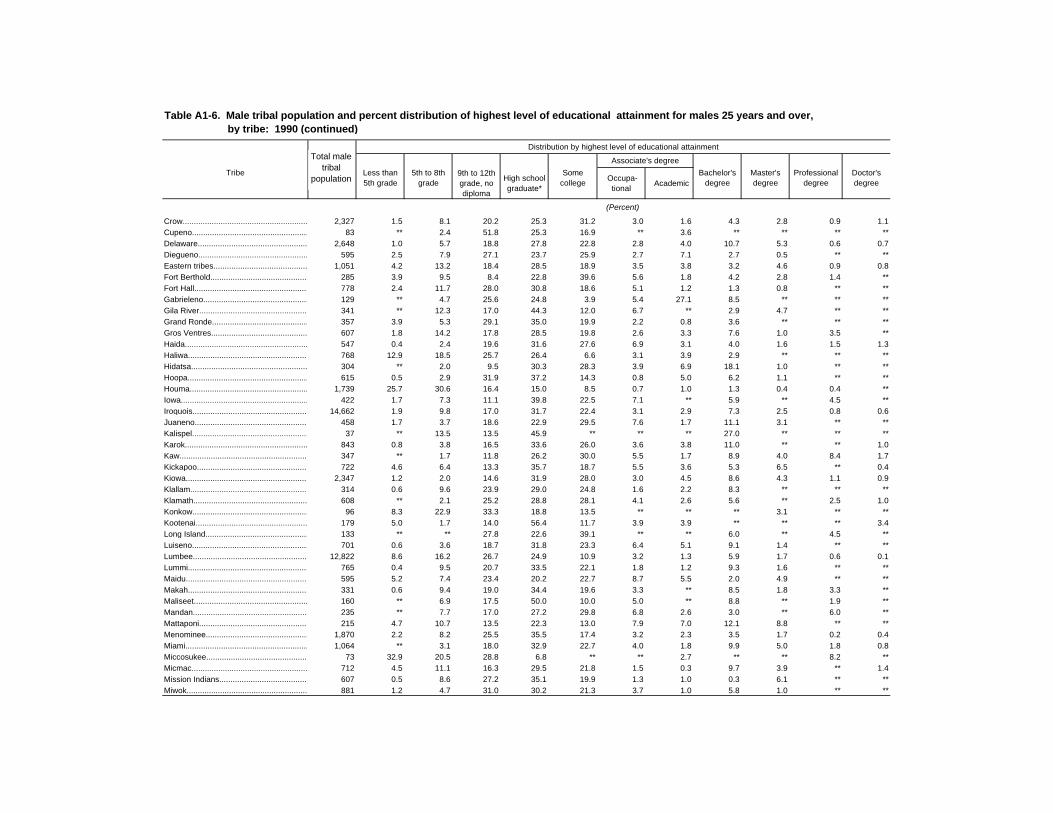
Distribution by highest level of educational attainment
Associate's degree
Tribe Less than 5th grade
5th to 8th grade
9th to 12th grade, no diploma
High school graduate*
Some college
Occupa-tional
AcademicBachelor's
degreeMaster's degree
Professional degree
Doctor's degree
(Percent)
Crow........................................................................2,327 1.5 8.1 20.2 25.3 31.2 3.0 1.6 4.3 2.8 0.9 1.1Cupeno................................................................ 83 ** 2.4 51.8 25.3 16.9 ** 3.6 ** ** ** **Delaware...............................................................2,648 1.0 5.7 18.8 27.8 22.8 2.8 4.0 10.7 5.3 0.6 0.7Diegueno........................................................... 595 2.5 7.9 27.1 23.7 25.9 2.7 7.1 2.7 0.5 ** **Eastern tribes.......................................................1,051 4.2 13.2 18.4 28.5 18.9 3.5 3.8 3.2 4.6 0.9 0.8Fort Berthold....................................................... 285 3.9 9.5 8.4 22.8 39.6 5.6 1.8 4.2 2.8 1.4 **Fort Hall.............................................................. 778 2.4 11.7 28.0 30.8 18.6 5.1 1.2 1.3 0.8 ** **Gabrieleno...............................................................129 ** 4.7 25.6 24.8 3.9 5.4 27.1 8.5 ** ** **Gila River.................................................................341 ** 12.3 17.0 44.3 12.0 6.7 ** 2.9 4.7 ** **Grand Ronde....................................................... 357 3.9 5.3 29.1 35.0 19.9 2.2 0.8 3.6 ** ** **Gros Ventres........................................................ 607 1.8 14.2 17.8 28.5 19.8 2.6 3.3 7.6 1.0 3.5 **Haida.................................................................. 547 0.4 2.4 19.6 31.6 27.6 6.9 3.1 4.0 1.6 1.5 1.3Haliwa................................................................. 768 12.9 18.5 25.7 26.4 6.6 3.1 3.9 2.9 ** ** **Hidatsa.................................................................. 304 ** 2.0 9.5 30.3 28.3 3.9 6.9 18.1 1.0 ** **Hoopa................................................................ 615 0.5 2.9 31.9 37.2 14.3 0.8 5.0 6.2 1.1 ** **Houma..................................................................1,739 25.7 30.6 16.4 15.0 8.5 0.7 1.0 1.3 0.4 0.4 **Iowa...................................................................... 422 1.7 7.3 11.1 39.8 22.5 7.1 ** 5.9 ** 4.5 **Iroquois.............................................................14,662 1.9 9.8 17.0 31.7 22.4 3.1 2.9 7.3 2.5 0.8 0.6Juaneno............................................................. 458 1.7 3.7 18.6 22.9 29.5 7.6 1.7 11.1 3.1 ** **Kalispel................................................................... 37 ** 13.5 13.5 45.9 ** ** ** 27.0 ** ** **Karok..................................................................... 843 0.8 3.8 16.5 33.6 26.0 3.6 3.8 11.0 ** ** 1.0Kaw..................................................................... 347 ** 1.7 11.8 26.2 30.0 5.5 1.7 8.9 4.0 8.4 1.7Kickapoo................................................................ 722 4.6 6.4 13.3 35.7 18.7 5.5 3.6 5.3 6.5 ** 0.4Kiowa...................................................................2,347 1.2 2.0 14.6 31.9 28.0 3.0 4.5 8.6 4.3 1.1 0.9Klallam.................................................................. 314 0.6 9.6 23.9 29.0 24.8 1.6 2.2 8.3 ** ** **Klamath.............................................................. 608 ** 2.1 25.2 28.8 28.1 4.1 2.6 5.6 ** 2.5 1.0Konkow................................................................. 96 8.3 22.9 33.3 18.8 13.5 ** ** ** 3.1 ** **Kootenai............................................................... 179 5.0 1.7 14.0 56.4 11.7 3.9 3.9 ** ** ** 3.4Long Island.......................................................... 133 ** ** 27.8 22.6 39.1 ** ** 6.0 ** 4.5 **Luiseno...................................................................701 0.6 3.6 18.7 31.8 23.3 6.4 5.1 9.1 1.4 ** **Lumbee.............................................................12,822 8.6 16.2 26.7 24.9 10.9 3.2 1.3 5.9 1.7 0.6 0.1Lummi.................................................................. 765 0.4 9.5 20.7 33.5 22.1 1.8 1.2 9.3 1.6 ** **Maidu.................................................................. 595 5.2 7.4 23.4 20.2 22.7 8.7 5.5 2.0 4.9 ** **Makah............................................................... 331 0.6 9.4 19.0 34.4 19.6 3.3 ** 8.5 1.8 3.3 **Maliseet................................................................. 160 ** 6.9 17.5 50.0 10.0 5.0 ** 8.8 ** 1.9 **Mandan................................................................ 235 ** 7.7 17.0 27.2 29.8 6.8 2.6 3.0 ** 6.0 **Mattaponi............................................................ 215 4.7 10.7 13.5 22.3 13.0 7.9 7.0 12.1 8.8 ** **Menominee.............................................................1,870 2.2 8.2 25.5 35.5 17.4 3.2 2.3 3.5 1.7 0.2 0.4Miami........................................................................1,064 ** 3.1 18.0 32.9 22.7 4.0 1.8 9.9 5.0 1.8 0.8Miccosukee........................................................... 73 32.9 20.5 28.8 6.8 ** ** 2.7 ** ** 8.2 **Micmac....................................................................712 4.5 11.1 16.3 29.5 21.8 1.5 0.3 9.7 3.9 ** 1.4Mission Indians................................................ 607 0.5 8.6 27.2 35.1 19.9 1.3 1.0 0.3 6.1 ** **Miwok.................................................................. 881 1.2 4.7 31.0 30.2 21.3 3.7 1.0 5.8 1.0 ** **
Table A1-6. Male tribal population and percent distribution of highest level of educational attainment for males 25 years and over, by tribe: 1990 (continued)
Total male tribal
population
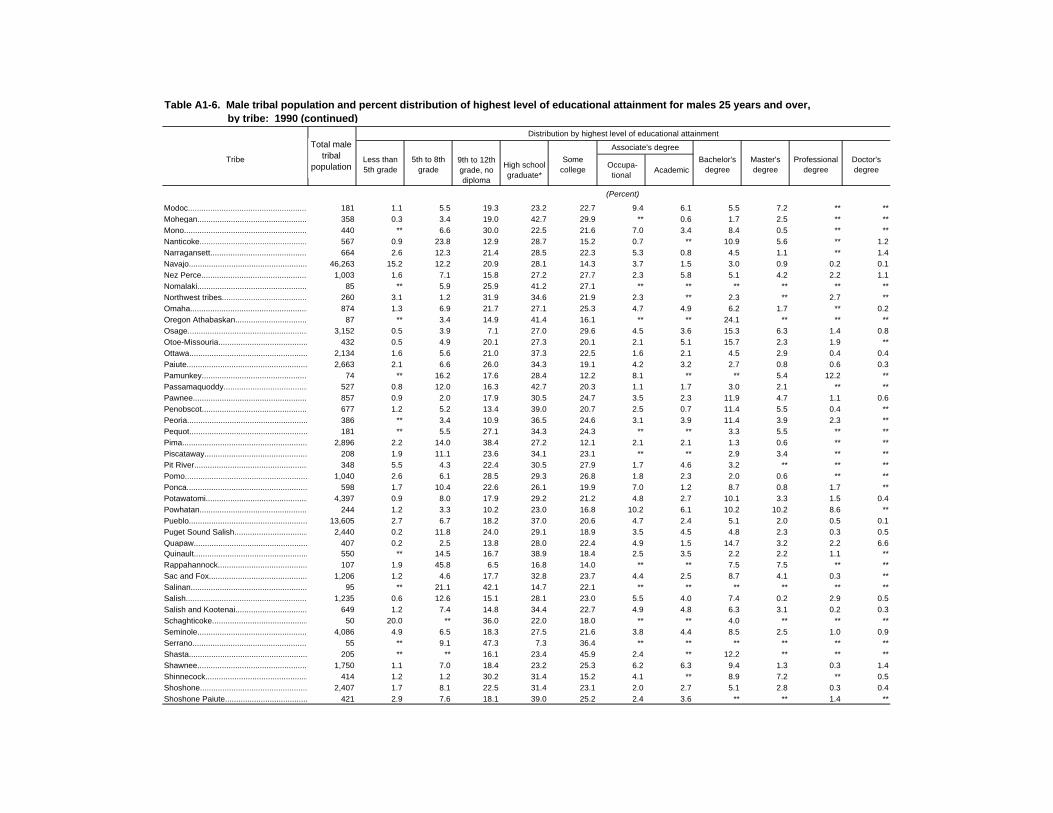
Distribution by highest level of educational attainment
Associate's degree
Tribe Less than 5th grade
5th to 8th grade
9th to 12th grade, no diploma
High school graduate*
Some college
Occupa-tional
AcademicBachelor's
degreeMaster's degree
Professional degree
Doctor's degree
(Percent)
Modoc.................................................................... 181 1.1 5.5 19.3 23.2 22.7 9.4 6.1 5.5 7.2 ** **Mohegan.............................................................. 358 0.3 3.4 19.0 42.7 29.9 ** 0.6 1.7 2.5 ** **Mono................................................................. 440 ** 6.6 30.0 22.5 21.6 7.0 3.4 8.4 0.5 ** **Nanticoke............................................................ 567 0.9 23.8 12.9 28.7 15.2 0.7 ** 10.9 5.6 ** 1.2Narragansett...................................................... 664 2.6 12.3 21.4 28.5 22.3 5.3 0.8 4.5 1.1 ** 1.4Navajo................................................................46,263 15.2 12.2 20.9 28.1 14.3 3.7 1.5 3.0 0.9 0.2 0.1Nez Perce..............................................................1,003 1.6 7.1 15.8 27.2 27.7 2.3 5.8 5.1 4.2 2.2 1.1Nomalaki................................................................ 85 ** 5.9 25.9 41.2 27.1 ** ** ** ** ** **Northwest tribes.................................................. 260 3.1 1.2 31.9 34.6 21.9 2.3 ** 2.3 ** 2.7 **Omaha................................................................. 874 1.3 6.9 21.7 27.1 25.3 4.7 4.9 6.2 1.7 ** 0.2Oregon Athabaskan.............................................. 87 ** 3.4 14.9 41.4 16.1 ** ** 24.1 ** ** **Osage............................................................... 3,152 0.5 3.9 7.1 27.0 29.6 4.5 3.6 15.3 6.3 1.4 0.8Otoe-Missouria.................................................. 432 0.5 4.9 20.1 27.3 20.1 2.1 5.1 15.7 2.3 1.9 **Ottawa...................................................................2,134 1.6 5.6 21.0 37.3 22.5 1.6 2.1 4.5 2.9 0.4 0.4Paiute...................................................................2,663 2.1 6.6 26.0 34.3 19.1 4.2 3.2 2.7 0.8 0.6 0.3Pamunkey......................................................... 74 ** 16.2 17.6 28.4 12.2 8.1 ** ** 5.4 12.2 **Passamaquoddy............................................. 527 0.8 12.0 16.3 42.7 20.3 1.1 1.7 3.0 2.1 ** **Pawnee............................................................... 857 0.9 2.0 17.9 30.5 24.7 3.5 2.3 11.9 4.7 1.1 0.6Penobscot............................................................ 677 1.2 5.2 13.4 39.0 20.7 2.5 0.7 11.4 5.5 0.4 **Peoria................................................................ 386 ** 3.4 10.9 36.5 24.6 3.1 3.9 11.4 3.9 2.3 **Pequot............................................................... 181 ** 5.5 27.1 34.3 24.3 ** ** 3.3 5.5 ** **Pima....................................................................2,896 2.2 14.0 38.4 27.2 12.1 2.1 2.1 1.3 0.6 ** **Piscataway........................................................... 208 1.9 11.1 23.6 34.1 23.1 ** ** 2.9 3.4 ** **Pit River................................................................ 348 5.5 4.3 22.4 30.5 27.9 1.7 4.6 3.2 ** ** **Pomo......................................................................1,040 2.6 6.1 28.5 29.3 26.8 1.8 2.3 2.0 0.6 ** **Ponca................................................................... 598 1.7 10.4 22.6 26.1 19.9 7.0 1.2 8.7 0.8 1.7 **Potawatomi..........................................................4,397 0.9 8.0 17.9 29.2 21.2 4.8 2.7 10.1 3.3 1.5 0.4Powhatan.......................................................... 244 1.2 3.3 10.2 23.0 16.8 10.2 6.1 10.2 10.2 8.6 **Pueblo.............................................................. 13,605 2.7 6.7 18.2 37.0 20.6 4.7 2.4 5.1 2.0 0.5 0.1Puget Sound Salish............................................ 2,440 0.2 11.8 24.0 29.1 18.9 3.5 4.5 4.8 2.3 0.3 0.5Quapaw.............................................................. 407 0.2 2.5 13.8 28.0 22.4 4.9 1.5 14.7 3.2 2.2 6.6Quinault................................................................ 550 ** 14.5 16.7 38.9 18.4 2.5 3.5 2.2 2.2 1.1 **Rappahannock................................................... 107 1.9 45.8 6.5 16.8 14.0 ** ** 7.5 7.5 ** **Sac and Fox....................................................... 1,206 1.2 4.6 17.7 32.8 23.7 4.4 2.5 8.7 4.1 0.3 **Salinan.................................................................. 95 ** 21.1 42.1 14.7 22.1 ** ** ** ** ** **Salish................................................................. 1,235 0.6 12.6 15.1 28.1 23.0 5.5 4.0 7.4 0.2 2.9 0.5Salish and Kootenai.......................................... 649 1.2 7.4 14.8 34.4 22.7 4.9 4.8 6.3 3.1 0.2 0.3Schaghticoke....................................................... 50 20.0 ** 36.0 22.0 18.0 ** ** 4.0 ** ** **Seminole.............................................................4,086 4.9 6.5 18.3 27.5 21.6 3.8 4.4 8.5 2.5 1.0 0.9Serrano.................................................................. 55 ** 9.1 47.3 7.3 36.4 ** ** ** ** ** **Shasta................................................................. 205 ** ** 16.1 23.4 45.9 2.4 ** 12.2 ** ** **Shawnee..............................................................1,750 1.1 7.0 18.4 23.2 25.3 6.2 6.3 9.4 1.3 0.3 1.4Shinnecock......................................................... 414 1.2 1.2 30.2 31.4 15.2 4.1 ** 8.9 7.2 ** 0.5Shoshone............................................................2,407 1.7 8.1 22.5 31.4 23.1 2.0 2.7 5.1 2.8 0.3 0.4Shoshone Paiute............................................... 421 2.9 7.6 18.1 39.0 25.2 2.4 3.6 ** ** 1.4 **
Table A1-6. Male tribal population and percent distribution of highest level of educational attainment for males 25 years and over, by tribe: 1990 (continued)
Total male tribal
population
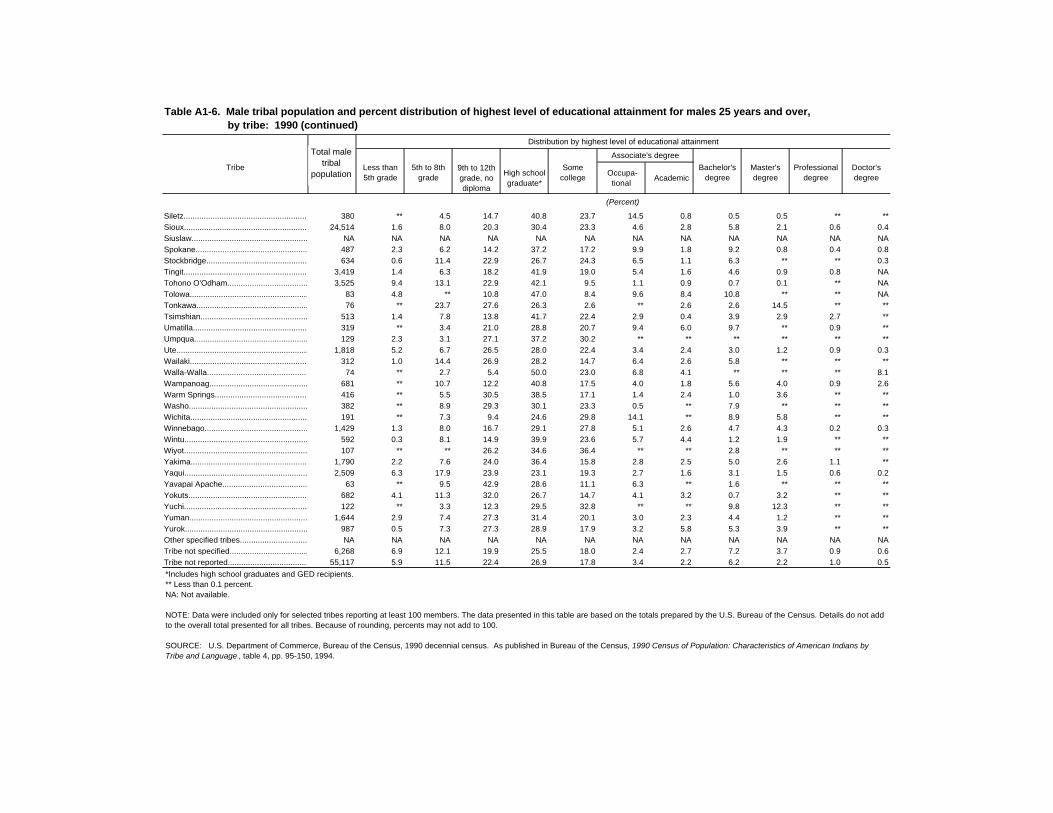
Distribution by highest level of educational attainment
Associate's degree
Tribe Less than 5th grade
5th to 8th grade
9th to 12th grade, no diploma
High school graduate*
Some college
Occupa-tional
AcademicBachelor's
degreeMaster's degree
Professional degree
Doctor's degree
(Percent)
Siletz................................................................... 380 ** 4.5 14.7 40.8 23.7 14.5 0.8 0.5 0.5 ** **Sioux...................................................................24,514 1.6 8.0 20.3 30.4 23.3 4.6 2.8 5.8 2.1 0.6 0.4Siuslaw............................................................. NA NA NA NA NA NA NA NA NA NA NA NASpokane.......................................................... 487 2.3 6.2 14.2 37.2 17.2 9.9 1.8 9.2 0.8 0.4 0.8Stockbridge........................................................ 634 0.6 11.4 22.9 26.7 24.3 6.5 1.1 6.3 ** ** 0.3Tingit...................................................................3,419 1.4 6.3 18.2 41.9 19.0 5.4 1.6 4.6 0.9 0.8 NATohono O'Odham.................................................3,525 9.4 13.1 22.9 42.1 9.5 1.1 0.9 0.7 0.1 ** NATolowa................................................................ 83 4.8 ** 10.8 47.0 8.4 9.6 8.4 10.8 ** ** NATonkawa.......................................................... 76 ** 23.7 27.6 26.3 2.6 ** 2.6 2.6 14.5 ** **Tsimshian............................................................ 513 1.4 7.8 13.8 41.7 22.4 2.9 0.4 3.9 2.9 2.7 **Umatilla..................................................................319 ** 3.4 21.0 28.8 20.7 9.4 6.0 9.7 ** 0.9 **Umpqua.............................................................. 129 2.3 3.1 27.1 37.2 30.2 ** ** ** ** ** **Ute.......................................................................1,818 5.2 6.7 26.5 28.0 22.4 3.4 2.4 3.0 1.2 0.9 0.3Wailaki................................................................. 312 1.0 14.4 26.9 28.2 14.7 6.4 2.6 5.8 ** ** **Walla-Walla........................................................... 74 ** 2.7 5.4 50.0 23.0 6.8 4.1 ** ** ** 8.1Wampanoag........................................................ 681 ** 10.7 12.2 40.8 17.5 4.0 1.8 5.6 4.0 0.9 2.6Warm Springs................................................... 416 ** 5.5 30.5 38.5 17.1 1.4 2.4 1.0 3.6 ** **Washo....................................................................382 ** 8.9 29.3 30.1 23.3 0.5 ** 7.9 ** ** **Wichita...................................................................191 ** 7.3 9.4 24.6 29.8 14.1 ** 8.9 5.8 ** **Winnebago..........................................................1,429 1.3 8.0 16.7 29.1 27.8 5.1 2.6 4.7 4.3 0.2 0.3Wintu.................................................................... 592 0.3 8.1 14.9 39.9 23.6 5.7 4.4 1.2 1.9 ** **Wiyot.......................................................................107 ** ** 26.2 34.6 36.4 ** ** 2.8 ** ** **Yakima.................................................................1,790 2.2 7.6 24.0 36.4 15.8 2.8 2.5 5.0 2.6 1.1 **Yaqui......................................................................2,509 6.3 17.9 23.9 23.1 19.3 2.7 1.6 3.1 1.5 0.6 0.2Yavapai Apache..................................................... 63 ** 9.5 42.9 28.6 11.1 6.3 ** 1.6 ** ** **Yokuts................................................................... 682 4.1 11.3 32.0 26.7 14.7 4.1 3.2 0.7 3.2 ** **Yuchi..................................................................... 122 ** 3.3 12.3 29.5 32.8 ** ** 9.8 12.3 ** **Yuman..................................................................1,644 2.9 7.4 27.3 31.4 20.1 3.0 2.3 4.4 1.2 ** **Yurok................................................................. 987 0.5 7.3 27.3 28.9 17.9 3.2 5.8 5.3 3.9 ** **Other specified tribes........................................... NA NA NA NA NA NA NA NA NA NA NA NATribe not specified.............................................. 6,268 6.9 12.1 19.9 25.5 18.0 2.4 2.7 7.2 3.7 0.9 0.6Tribe not reported.................................................55,117 5.9 11.5 22.4 26.9 17.8 3.4 2.2 6.2 2.2 1.0 0.5
*Includes high school graduates and GED recipients.** Less than 0.1 percent.NA: Not available.
NOTE: Data were included only for selected tribes reporting at least 100 members. The data presented in this table are based on the totals prepared by the U.S. Bureau of the Census. Details do not add to the overall total presented for all tribes. Because of rounding, percents may not add to 100.
SOURCE: U.S. Department of Commerce, Bureau of the Census, 1990 decennial census. As published in Bureau of the Census, 1990 Census of Population: Characteristics of American Indians by Tribe and Language , table 4, pp. 95-150, 1994.
Table A1-6. Male tribal population and percent distribution of highest level of educational attainment for males 25 years and over, by tribe: 1990 (continued)
Total male tribal
population
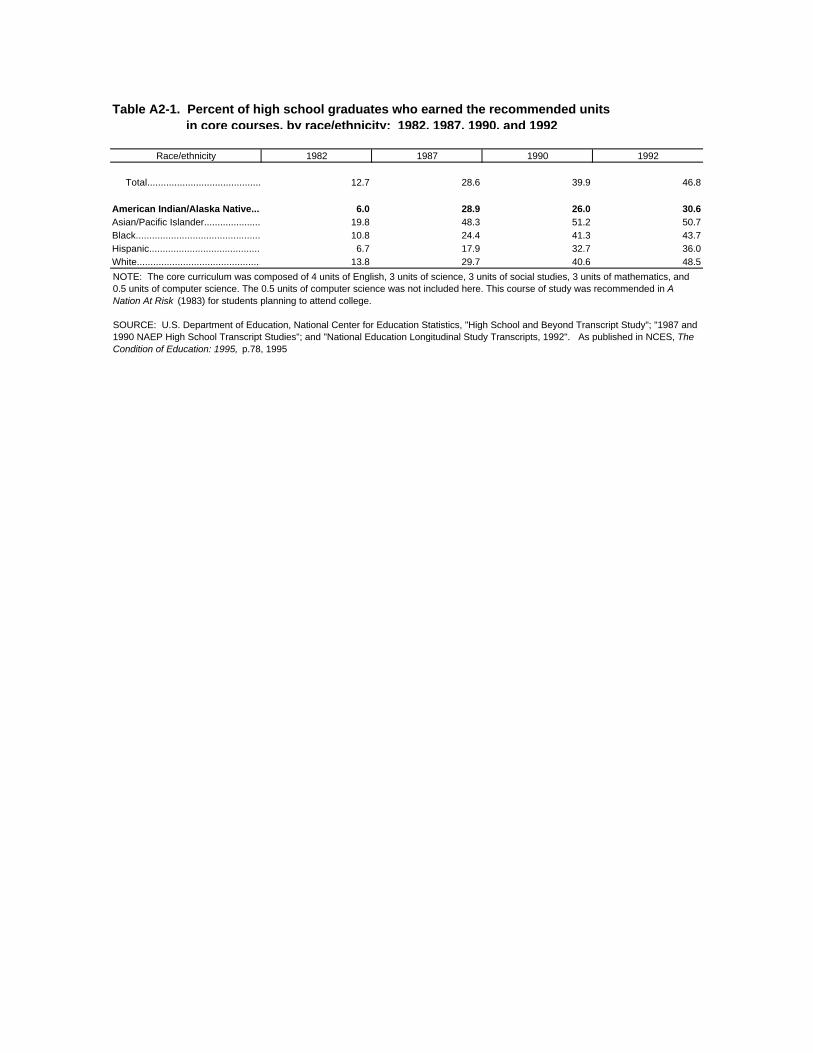
Race/ethnicity 1982 1987 1990 1992
Total........................................................... 12.7 28.6 39.9 46.8
American Indian/Alaska Native............ 6.0 28.9 26.0 30.6Asian/Pacific Islander............................... 19.8 48.3 51.2 50.7Black........................................................... 10.8 24.4 41.3 43.7Hispanic................................................... 6.7 17.9 32.7 36.0White......................................................... 13.8 29.7 40.6 48.5
NOTE: The core curriculum was composed of 4 units of English, 3 units of science, 3 units of social studies, 3 units of mathematics, and 0.5 units of computer science. The 0.5 units of computer science was not included here. This course of study was recommended in A Nation At Risk (1983) for students planning to attend college.
SOURCE: U.S. Department of Education, National Center for Education Statistics, "High School and Beyond Transcript Study"; "1987 and 1990 NAEP High School Transcript Studies"; and "National Education Longitudinal Study Transcripts, 1992". As published in NCES, The Condition of Education: 1995, p.78, 1995
Table A2-1. Percent of high school graduates who earned the recommended units in core courses, by race/ethnicity: 1982, 1987, 1990, and 1992
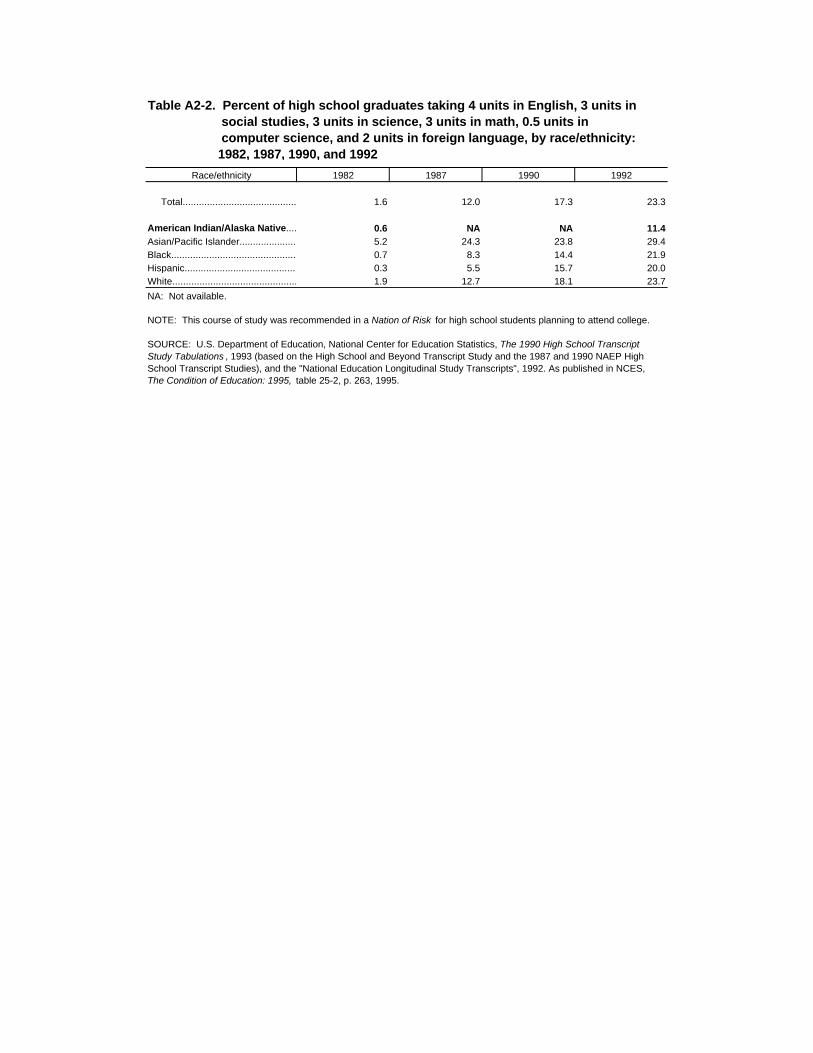
Race/ethnicity 1982 1987 1990 1992
Total....................................................... 1.6 12.0 17.3 23.3
American Indian/Alaska Native............. 0.6 NA NA 11.4Asian/Pacific Islander............................... 5.2 24.3 23.8 29.4Black............................................................ 0.7 8.3 14.4 21.9Hispanic................................................... 0.3 5.5 15.7 20.0White......................................................... 1.9 12.7 18.1 23.7
Table A2-2. Percent of high school graduates taking 4 units in English, 3 units in social studies, 3 units in science, 3 units in math, 0.5 units in computer science, and 2 units in foreign language, by race/ethnicity: 1982, 1987, 1990, and 1992
NA: Not available.
NOTE: This course of study was recommended in a Nation of Risk for high school students planning to attend college.
SOURCE: U.S. Department of Education, National Center for Education Statistics, The 1990 High School Transcript Study Tabulations , 1993 (based on the High School and Beyond Transcript Study and the 1987 and 1990 NAEP High School Transcript Studies), and the "National Education Longitudinal Study Transcripts", 1992. As published in NCES, The Condition of Education: 1995, table 25-2, p. 263, 1995.
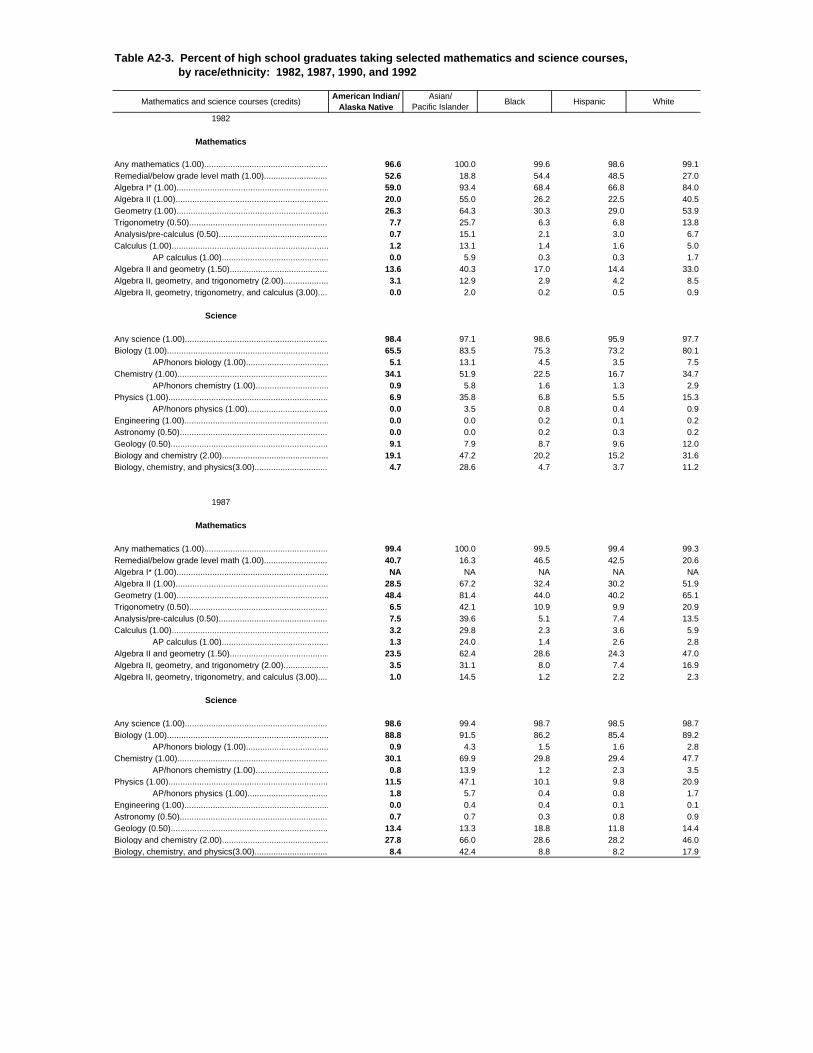
Mathematics and science courses (credits)American Indian/
Alaska NativeAsian/
Pacific IslanderBlack Hispanic White
1982
Mathematics
Any mathematics (1.00).................................................................. 96.6 100.0 99.6 98.6 99.1Remedial/below grade level math (1.00).................................. 52.6 18.8 54.4 48.5 27.0Algebra I* (1.00).............................................................................. 59.0 93.4 68.4 66.8 84.0Algebra II (1.00)................................................................................ 20.0 55.0 26.2 22.5 40.5Geometry (1.00)...................................................................................... 26.3 64.3 30.3 29.0 53.9Trigonometry (0.50)......................................................................... 7.7 25.7 6.3 6.8 13.8Analysis/pre-calculus (0.50)........................................................... 0.7 15.1 2.1 3.0 6.7Calculus (1.00)..................................................................................... 1.2 13.1 1.4 1.6 5.0 AP calculus (1.00).................................................... 0.0 5.9 0.3 0.3 1.7Algebra II and geometry (1.50)......................................................... 13.6 40.3 17.0 14.4 33.0Algebra II, geometry, and trigonometry (2.00)................................... 3.1 12.9 2.9 4.2 8.5Algebra II, geometry, trigonometry, and calculus (3.00)................ 0.0 2.0 0.2 0.5 0.9
Science
Any science (1.00)........................................................................ 98.4 97.1 98.6 95.9 97.7Biology (1.00)............................................................................... 65.5 83.5 75.3 73.2 80.1 AP/honors biology (1.00)........................................... 5.1 13.1 4.5 3.5 7.5Chemistry (1.00).............................................................................. 34.1 51.9 22.5 16.7 34.7 AP/honors chemistry (1.00)........................................ 0.9 5.8 1.6 1.3 2.9Physics (1.00)............................................................................... 6.9 35.8 6.8 5.5 15.3 AP/honors physics (1.00).......................................... 0.0 3.5 0.8 0.4 0.9Engineering (1.00)..................................................................... 0.0 0.0 0.2 0.1 0.2Astronomy (0.50)........................................................................... 0.0 0.0 0.2 0.3 0.2Geology (0.50)............................................................................... 9.1 7.9 8.7 9.6 12.0Biology and chemistry (2.00)..................................................... 19.1 47.2 20.2 15.2 31.6Biology, chemistry, and physics(3.00)...................................... 4.7 28.6 4.7 3.7 11.2
1987
Mathematics
Any mathematics (1.00).................................................................. 99.4 100.0 99.5 99.4 99.3Remedial/below grade level math (1.00).................................. 40.7 16.3 46.5 42.5 20.6Algebra I* (1.00).............................................................................. NA NA NA NA NAAlgebra II (1.00)................................................................................ 28.5 67.2 32.4 30.2 51.9Geometry (1.00)...................................................................................... 48.4 81.4 44.0 40.2 65.1Trigonometry (0.50)......................................................................... 6.5 42.1 10.9 9.9 20.9Analysis/pre-calculus (0.50)........................................................... 7.5 39.6 5.1 7.4 13.5Calculus (1.00)..................................................................................... 3.2 29.8 2.3 3.6 5.9 AP calculus (1.00).................................................... 1.3 24.0 1.4 2.6 2.8Algebra II and geometry (1.50)......................................................... 23.5 62.4 28.6 24.3 47.0Algebra II, geometry, and trigonometry (2.00)................................... 3.5 31.1 8.0 7.4 16.9Algebra II, geometry, trigonometry, and calculus (3.00)................ 1.0 14.5 1.2 2.2 2.3
Science
Any science (1.00)........................................................................ 98.6 99.4 98.7 98.5 98.7Biology (1.00)............................................................................... 88.8 91.5 86.2 85.4 89.2 AP/honors biology (1.00)........................................... 0.9 4.3 1.5 1.6 2.8Chemistry (1.00).............................................................................. 30.1 69.9 29.8 29.4 47.7 AP/honors chemistry (1.00)........................................ 0.8 13.9 1.2 2.3 3.5Physics (1.00)............................................................................... 11.5 47.1 10.1 9.8 20.9 AP/honors physics (1.00).......................................... 1.8 5.7 0.4 0.8 1.7Engineering (1.00)..................................................................... 0.0 0.4 0.4 0.1 0.1Astronomy (0.50)........................................................................... 0.7 0.7 0.3 0.8 0.9Geology (0.50)............................................................................... 13.4 13.3 18.8 11.8 14.4Biology and chemistry (2.00)..................................................... 27.8 66.0 28.6 28.2 46.0Biology, chemistry, and physics(3.00)...................................... 8.4 42.4 8.8 8.2 17.9
Table A2-3. Percent of high school graduates taking selected mathematics and science courses, by race/ethnicity: 1982, 1987, 1990, and 1992
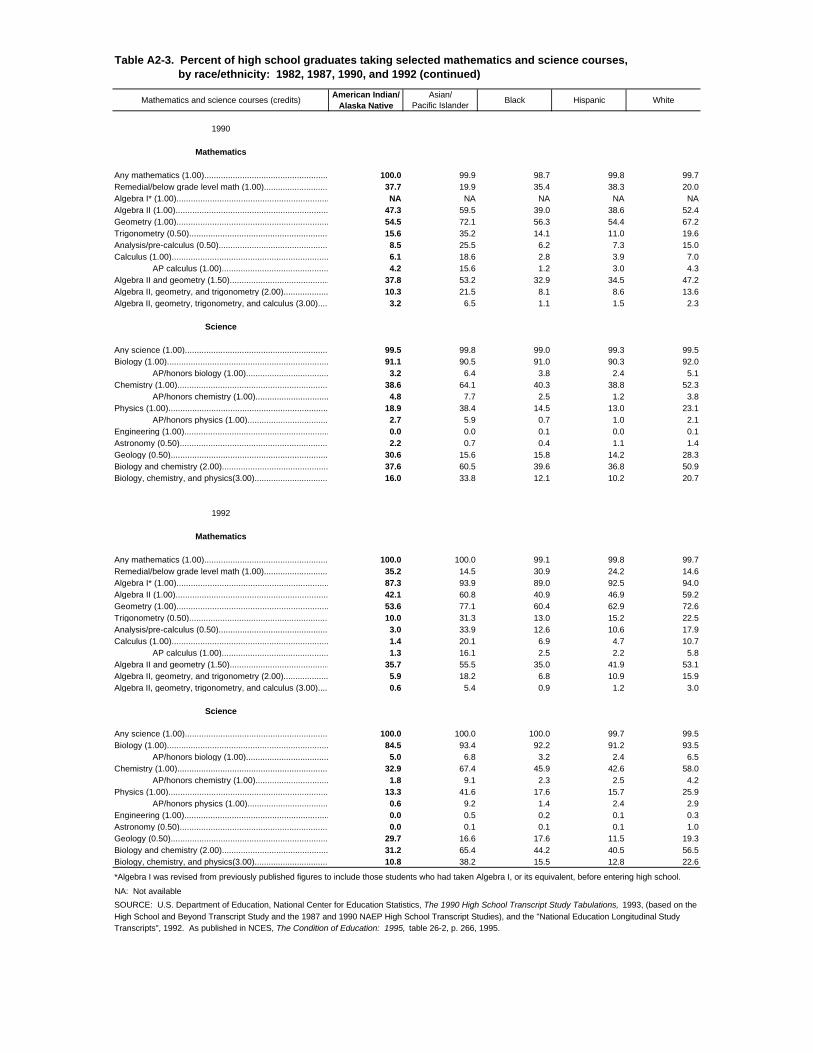
Mathematics and science courses (credits)American Indian/
Alaska NativeAsian/
Pacific IslanderBlack Hispanic White
1990
Mathematics
Any mathematics (1.00).................................................................. 100.0 99.9 98.7 99.8 99.7Remedial/below grade level math (1.00).................................. 37.7 19.9 35.4 38.3 20.0Algebra I* (1.00).............................................................................. NA NA NA NA NAAlgebra II (1.00)................................................................................ 47.3 59.5 39.0 38.6 52.4Geometry (1.00)...................................................................................... 54.5 72.1 56.3 54.4 67.2Trigonometry (0.50)......................................................................... 15.6 35.2 14.1 11.0 19.6Analysis/pre-calculus (0.50)........................................................... 8.5 25.5 6.2 7.3 15.0Calculus (1.00)..................................................................................... 6.1 18.6 2.8 3.9 7.0 AP calculus (1.00).................................................... 4.2 15.6 1.2 3.0 4.3Algebra II and geometry (1.50)......................................................... 37.8 53.2 32.9 34.5 47.2Algebra II, geometry, and trigonometry (2.00)................................... 10.3 21.5 8.1 8.6 13.6Algebra II, geometry, trigonometry, and calculus (3.00)................ 3.2 6.5 1.1 1.5 2.3
Science
Any science (1.00)........................................................................ 99.5 99.8 99.0 99.3 99.5Biology (1.00)............................................................................... 91.1 90.5 91.0 90.3 92.0 AP/honors biology (1.00)........................................... 3.2 6.4 3.8 2.4 5.1Chemistry (1.00).............................................................................. 38.6 64.1 40.3 38.8 52.3 AP/honors chemistry (1.00)........................................ 4.8 7.7 2.5 1.2 3.8Physics (1.00)............................................................................... 18.9 38.4 14.5 13.0 23.1 AP/honors physics (1.00).......................................... 2.7 5.9 0.7 1.0 2.1Engineering (1.00)..................................................................... 0.0 0.0 0.1 0.0 0.1Astronomy (0.50)........................................................................... 2.2 0.7 0.4 1.1 1.4Geology (0.50)............................................................................... 30.6 15.6 15.8 14.2 28.3Biology and chemistry (2.00)..................................................... 37.6 60.5 39.6 36.8 50.9Biology, chemistry, and physics(3.00)...................................... 16.0 33.8 12.1 10.2 20.7
1992
Mathematics
Any mathematics (1.00).................................................................. 100.0 100.0 99.1 99.8 99.7Remedial/below grade level math (1.00).................................. 35.2 14.5 30.9 24.2 14.6Algebra I* (1.00).............................................................................. 87.3 93.9 89.0 92.5 94.0Algebra II (1.00)................................................................................ 42.1 60.8 40.9 46.9 59.2Geometry (1.00)...................................................................................... 53.6 77.1 60.4 62.9 72.6Trigonometry (0.50)......................................................................... 10.0 31.3 13.0 15.2 22.5Analysis/pre-calculus (0.50)........................................................... 3.0 33.9 12.6 10.6 17.9Calculus (1.00)..................................................................................... 1.4 20.1 6.9 4.7 10.7 AP calculus (1.00).................................................... 1.3 16.1 2.5 2.2 5.8Algebra II and geometry (1.50)......................................................... 35.7 55.5 35.0 41.9 53.1Algebra II, geometry, and trigonometry (2.00)................................... 5.9 18.2 6.8 10.9 15.9Algebra II, geometry, trigonometry, and calculus (3.00)................ 0.6 5.4 0.9 1.2 3.0
Science
Any science (1.00)........................................................................ 100.0 100.0 100.0 99.7 99.5Biology (1.00)............................................................................... 84.5 93.4 92.2 91.2 93.5 AP/honors biology (1.00)........................................... 5.0 6.8 3.2 2.4 6.5Chemistry (1.00).............................................................................. 32.9 67.4 45.9 42.6 58.0 AP/honors chemistry (1.00)........................................ 1.8 9.1 2.3 2.5 4.2Physics (1.00)............................................................................... 13.3 41.6 17.6 15.7 25.9 AP/honors physics (1.00).......................................... 0.6 9.2 1.4 2.4 2.9Engineering (1.00)..................................................................... 0.0 0.5 0.2 0.1 0.3Astronomy (0.50)........................................................................... 0.0 0.1 0.1 0.1 1.0Geology (0.50)............................................................................... 29.7 16.6 17.6 11.5 19.3Biology and chemistry (2.00)..................................................... 31.2 65.4 44.2 40.5 56.5Biology, chemistry, and physics(3.00)...................................... 10.8 38.2 15.5 12.8 22.6
*Algebra I was revised from previously published figures to include those students who had taken Algebra I, or its equivalent, before entering high school.
NA: Not available
SOURCE: U.S. Department of Education, National Center for Education Statistics, The 1990 High School Transcript Study Tabulations, 1993, (based on theHigh School and Beyond Transcript Study and the 1987 and 1990 NAEP High School Transcript Studies), and the "National Education Longitudinal Study Transcripts", 1992. As published in NCES, The Condition of Education: 1995, table 26-2, p. 266, 1995.
Table A2-3. Percent of high school graduates taking selected mathematics and science courses, by race/ethnicity: 1982, 1987, 1990, and 1992 (continued)
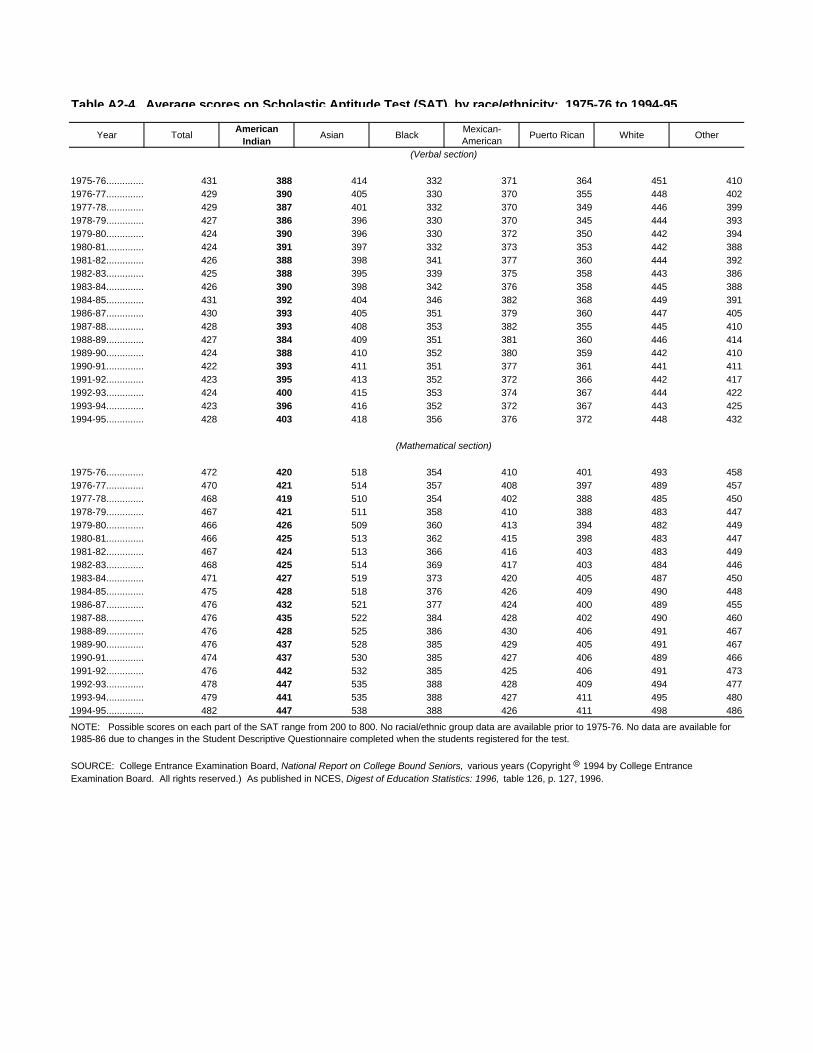
Year TotalAmerican
IndianAsian Black
Mexican-American
Puerto Rican White Other
(Verbal section)
1975-76................ 431 388 414 332 371 364 451 4101976-77................ 429 390 405 330 370 355 448 4021977-78...................... 429 387 401 332 370 349 446 3991978-79........................ 427 386 396 330 370 345 444 3931979-80....................... 424 390 396 330 372 350 442 3941980-81....................... 424 391 397 332 373 353 442 3881981-82........................ 426 388 398 341 377 360 444 3921982-83..................... 425 388 395 339 375 358 443 3861983-84......................... 426 390 398 342 376 358 445 3881984-85...................... 431 392 404 346 382 368 449 3911986-87......................... 430 393 405 351 379 360 447 4051987-88....................... 428 393 408 353 382 355 445 4101988-89......................... 427 384 409 351 381 360 446 4141989-90...................... 424 388 410 352 380 359 442 4101990-91......................... 422 393 411 351 377 361 441 4111991-92..................... 423 395 413 352 372 366 442 4171992-93......................... 424 400 415 353 374 367 444 4221993-94......................... 423 396 416 352 372 367 443 4251994-95.................... 428 403 418 356 376 372 448 432
(Mathematical section)
1975-76................ 472 420 518 354 410 401 493 4581976-77................ 470 421 514 357 408 397 489 4571977-78...................... 468 419 510 354 402 388 485 4501978-79........................ 467 421 511 358 410 388 483 4471979-80....................... 466 426 509 360 413 394 482 4491980-81....................... 466 425 513 362 415 398 483 4471981-82........................ 467 424 513 366 416 403 483 4491982-83..................... 468 425 514 369 417 403 484 4461983-84......................... 471 427 519 373 420 405 487 4501984-85...................... 475 428 518 376 426 409 490 4481986-87......................... 476 432 521 377 424 400 489 4551987-88....................... 476 435 522 384 428 402 490 4601988-89......................... 476 428 525 386 430 406 491 4671989-90...................... 476 437 528 385 429 405 491 4671990-91......................... 474 437 530 385 427 406 489 4661991-92..................... 476 442 532 385 425 406 491 4731992-93......................... 478 447 535 388 428 409 494 4771993-94......................... 479 441 535 388 427 411 495 4801994-95................ 482 447 538 388 426 411 498 486
Table A2-4. Average scores on Scholastic Aptitude Test (SAT), by race/ethnicity: 1975-76 to 1994-95
NOTE: Possible scores on each part of the SAT range from 200 to 800. No racial/ethnic group data are available prior to 1975-76. No data are available for 1985-86 due to changes in the Student Descriptive Questionnaire completed when the students registered for the test.
SOURCE: College Entrance Examination Board, National Report on College Bound Seniors, various years (Copyright 8 1994 by College Entrance Examination Board. All rights reserved.) As published in NCES, Digest of Education Statistics: 1996, table 126, p. 127, 1996.
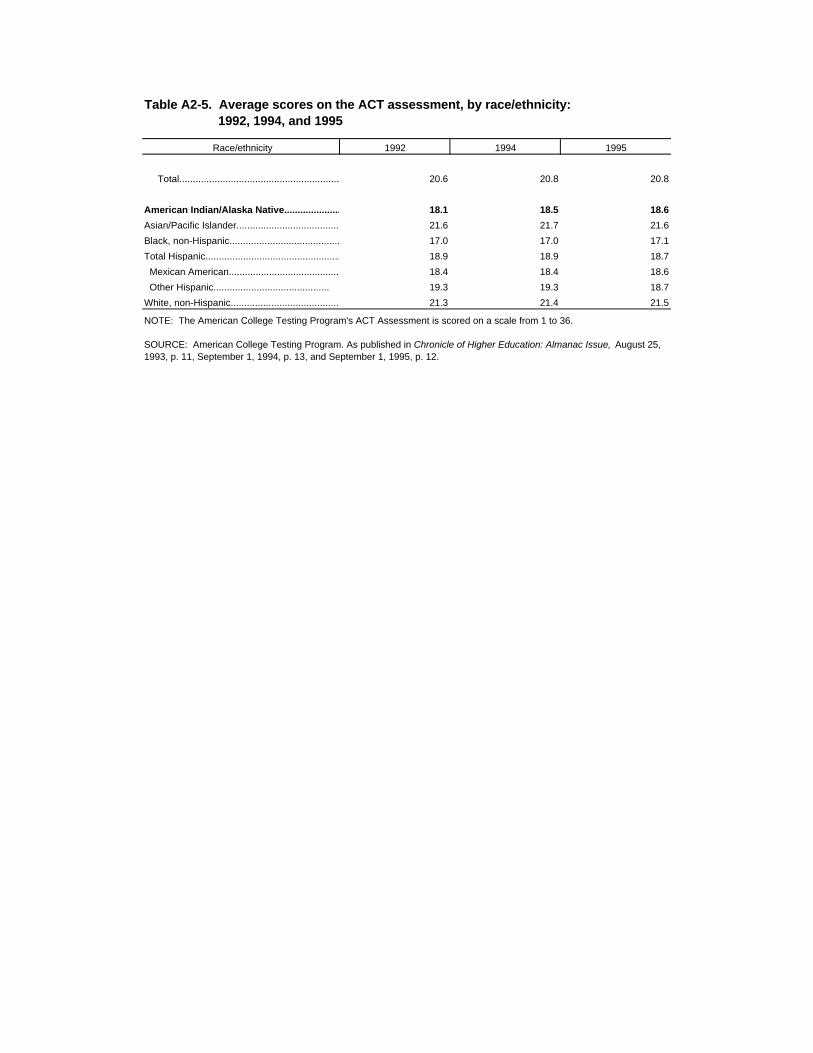
Race/ethnicity 1992 1994 1995
Total............................................................................ 20.6 20.8 20.8
American Indian/Alaska Native................................................ 18.1 18.5 18.6
Asian/Pacific Islander................................................................ 21.6 21.7 21.6
Black, non-Hispanic............................................................. 17.0 17.0 17.1
Total Hispanic.................................................. 18.9 18.9 18.7
Mexican American......................................... 18.4 18.4 18.6
Other Hispanic........................................... 19.3 19.3 18.7
White, non-Hispanic.....................................................................................21.3 21.4 21.5
NOTE: The American College Testing Program's ACT Assessment is scored on a scale from 1 to 36.
SOURCE: American College Testing Program. As published in Chronicle of Higher Education: Almanac Issue, August 25, 1993, p. 11, September 1, 1994, p. 13, and September 1, 1995, p. 12.
Table A2-5. Average scores on the ACT assessment, by race/ethnicity: 1992, 1994, and 1995
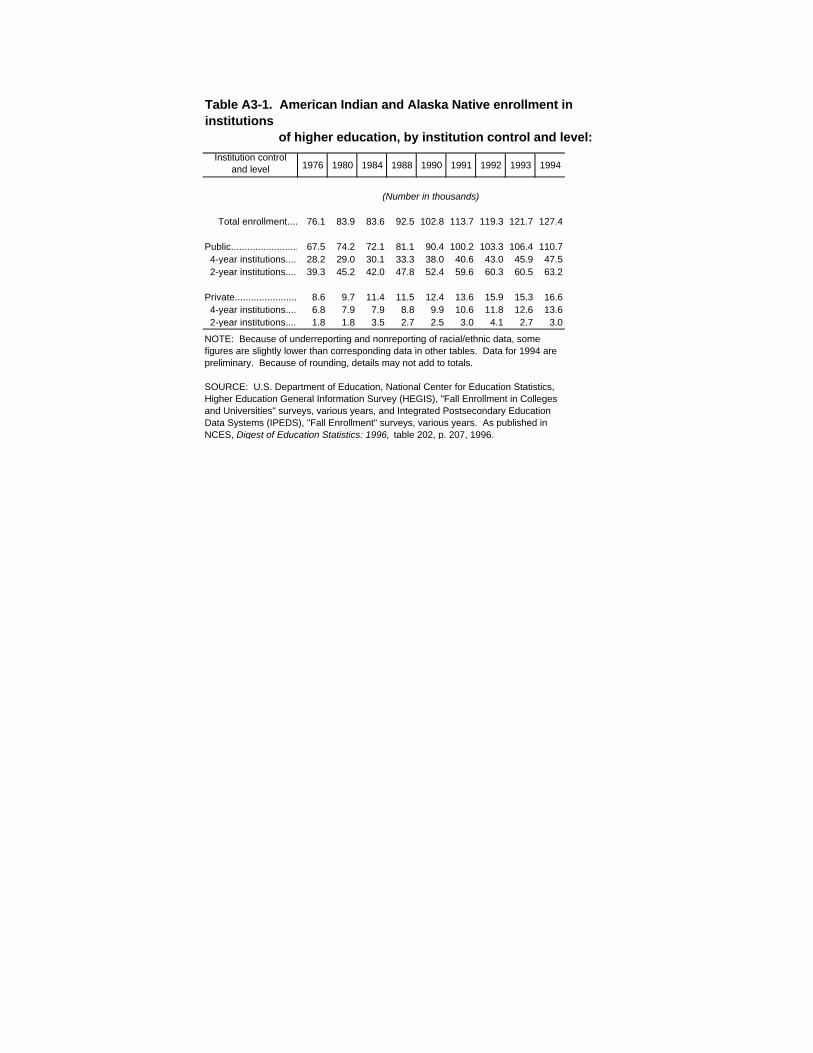
Institution control and level 1976 1980 1984 1988 1990 1991 1992 1993 1994
(Number in thousands)
Total enrollment....................76.1 83.9 83.6 92.5 102.8 113.7 119.3 121.7 127.4
Public.................................67.5 74.2 72.1 81.1 90.4 100.2 103.3 106.4 110.7 4-year institutions.................................28.2 29.0 30.1 33.3 38.0 40.6 43.0 45.9 47.5 2-year institutions................................39.3 45.2 42.0 47.8 52.4 59.6 60.3 60.5 63.2
Private................................8.6 9.7 11.4 11.5 12.4 13.6 15.9 15.3 16.6 4-year institutions.................................6.8 7.9 7.9 8.8 9.9 10.6 11.8 12.6 13.6 2-year institutions................................1.8 1.8 3.5 2.7 2.5 3.0 4.1 2.7 3.0
NOTE: Because of underreporting and nonreporting of racial/ethnic data, some figures are slightly lower than corresponding data in other tables. Data for 1994 are preliminary. Because of rounding, details may not add to totals.
SOURCE: U.S. Department of Education, National Center for Education Statistics, Higher Education General Information Survey (HEGIS), "Fall Enrollment in Colleges and Universities" surveys, various years, and Integrated Postsecondary Education Data Systems (IPEDS), "Fall Enrollment" surveys, various years. As published in NCES, Digest of Education Statistics: 1996, table 202, p. 207, 1996.
Table A3-1. American Indian and Alaska Native enrollment in institutions of higher education, by institution control and level: Selected years, 1976 to 1994
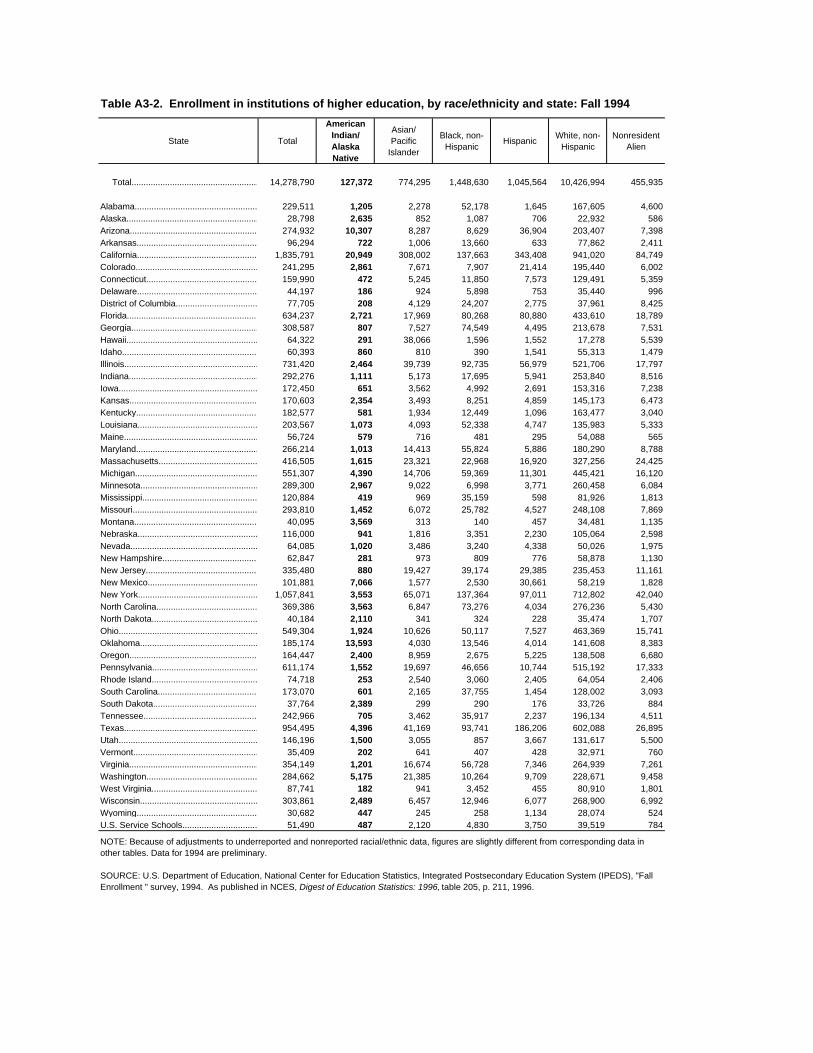
Table A3-2. Enrollment in institutions of higher education, by race/ethnicity and state: Fall 1994
State Total
American Indian/Alaska Native
Asian/Pacific
Islander
Black, non-Hispanic
HispanicWhite, non-
HispanicNonresident
Alien
Total................................................................14,278,790 127,372 774,295 1,448,630 1,045,564 10,426,994 455,935
Alabama........................................................ 229,511 1,205 2,278 52,178 1,645 167,605 4,600Alaska............................................................ 28,798 2,635 852 1,087 706 22,932 586Arizona........................................................... 274,932 10,307 8,287 8,629 36,904 203,407 7,398Arkansas...................................................... 96,294 722 1,006 13,660 633 77,862 2,411California....................................................... 1,835,791 20,949 308,002 137,663 343,408 941,020 84,749Colorado........................................................ 241,295 2,861 7,671 7,907 21,414 195,440 6,002Connecticut................................................... 159,990 472 5,245 11,850 7,573 129,491 5,359Delaware....................................................... 44,197 186 924 5,898 753 35,440 996District of Columbia.................................... 77,705 208 4,129 24,207 2,775 37,961 8,425Florida............................................................. 634,237 2,721 17,969 80,268 80,880 433,610 18,789Georgia.......................................................... 308,587 807 7,527 74,549 4,495 213,678 7,531Hawaii............................................................. 64,322 291 38,066 1,596 1,552 17,278 5,539Idaho............................................................... 60,393 860 810 390 1,541 55,313 1,479Illinois.............................................................. 731,420 2,464 39,739 92,735 56,979 521,706 17,797Indiana........................................................... 292,276 1,111 5,173 17,695 5,941 253,840 8,516Iowa................................................................. 172,450 651 3,562 4,992 2,691 153,316 7,238Kansas........................................................... 170,603 2,354 3,493 8,251 4,859 145,173 6,473Kentucky........................................................ 182,577 581 1,934 12,449 1,096 163,477 3,040Louisiana....................................................... 203,567 1,073 4,093 52,338 4,747 135,983 5,333Maine............................................................. 56,724 579 716 481 295 54,088 565Maryland....................................................... 266,214 1,013 14,413 55,824 5,886 180,290 8,788Massachusetts............................................ 416,505 1,615 23,321 22,968 16,920 327,256 24,425Michigan........................................................ 551,307 4,390 14,706 59,369 11,301 445,421 16,120Minnesota...................................................... 289,300 2,967 9,022 6,998 3,771 260,458 6,084Mississippi.................................................... 120,884 419 969 35,159 598 81,926 1,813Missouri......................................................... 293,810 1,452 6,072 25,782 4,527 248,108 7,869Montana......................................................... 40,095 3,569 313 140 457 34,481 1,135Nebraska........................................................ 116,000 941 1,816 3,351 2,230 105,064 2,598Nevada.......................................................... 64,085 1,020 3,486 3,240 4,338 50,026 1,975New Hampshire........................................... 62,847 281 973 809 776 58,878 1,130New Jersey.................................................. 335,480 880 19,427 39,174 29,385 235,453 11,161New Mexico.................................................... 101,881 7,066 1,577 2,530 30,661 58,219 1,828New York...................................................... 1,057,841 3,553 65,071 137,364 97,011 712,802 42,040North Carolina............................................. 369,386 3,563 6,847 73,276 4,034 276,236 5,430North Dakota............................................... 40,184 2,110 341 324 228 35,474 1,707Ohio................................................................. 549,304 1,924 10,626 50,117 7,527 463,369 15,741Oklahoma..................................................... 185,174 13,593 4,030 13,546 4,014 141,608 8,383Oregon........................................................... 164,447 2,400 8,959 2,675 5,225 138,508 6,680Pennsylvania................................................ 611,174 1,552 19,697 46,656 10,744 515,192 17,333Rhode Island............................................... 74,718 253 2,540 3,060 2,405 64,054 2,406South Carolina............................................. 173,070 601 2,165 37,755 1,454 128,002 3,093South Dakota............................................... 37,764 2,389 299 290 176 33,726 884Tennessee.................................................. 242,966 705 3,462 35,917 2,237 196,134 4,511Texas............................................................... 954,495 4,396 41,169 93,741 186,206 602,088 26,895Utah................................................................. 146,196 1,500 3,055 857 3,667 131,617 5,500Vermont......................................................... 35,409 202 641 407 428 32,971 760Virginia........................................................... 354,149 1,201 16,674 56,728 7,346 264,939 7,261Washington.................................................. 284,662 5,175 21,385 10,264 9,709 228,671 9,458West Virginia................................................ 87,741 182 941 3,452 455 80,910 1,801Wisconsin..................................................... 303,861 2,489 6,457 12,946 6,077 268,900 6,992Wyoming....................................................... 30,682 447 245 258 1,134 28,074 524U.S. Service Schools................................ 51,490 487 2,120 4,830 3,750 39,519 784
NOTE: Because of adjustments to underreported and nonreported racial/ethnic data, figures are slightly different from corresponding data in other tables. Data for 1994 are preliminary.
SOURCE: U.S. Department of Education, National Center for Education Statistics, Integrated Postsecondary Education System (IPEDS), "Fall Enrollment " survey, 1994. As published in NCES, Digest of Education Statistics: 1996, table 205, p. 211, 1996.
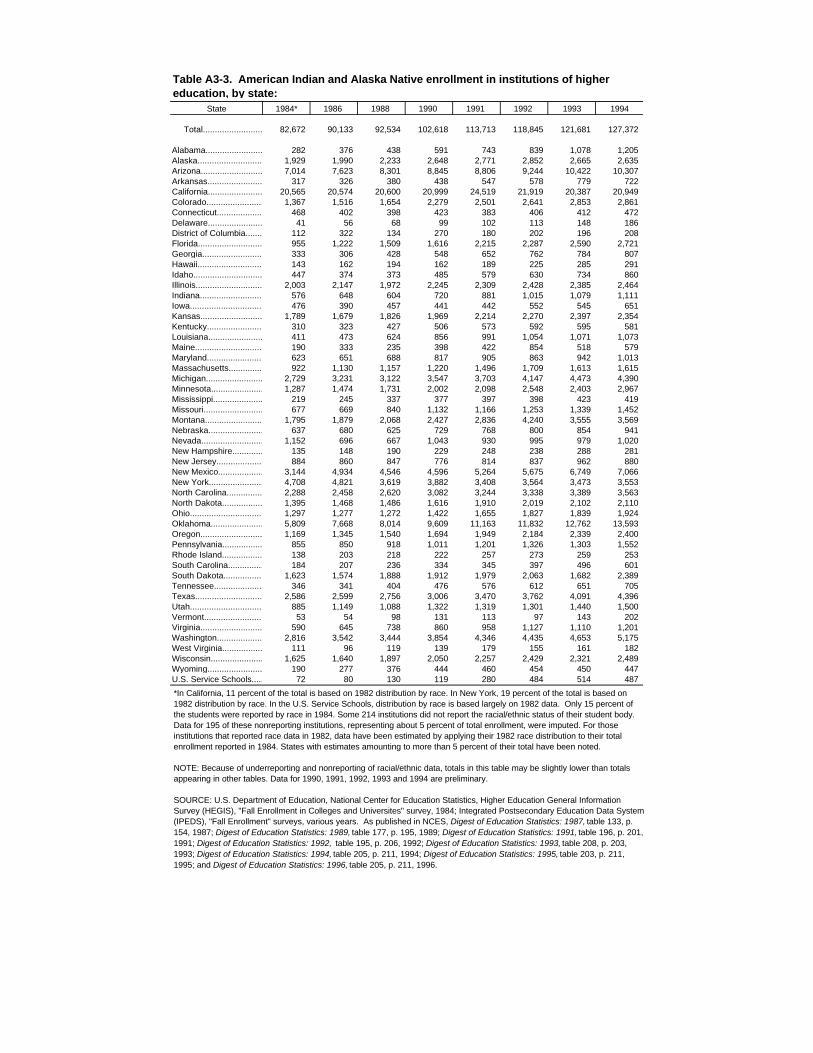
State 1984* 1986 1988 1990 1991 1992 1993 1994
Total.....................................................82,672 90,133 92,534 102,618 113,713 118,845 121,681 127,372
Alabama............................................282 376 438 591 743 839 1,078 1,205Alaska..............................................1,929 1,990 2,233 2,648 2,771 2,852 2,665 2,635Arizona.............................................7,014 7,623 8,301 8,845 8,806 9,244 10,422 10,307Arkansas.........................................317 326 380 438 547 578 779 722California.........................................20,565 20,574 20,600 20,999 24,519 21,919 20,387 20,949Colorado...........................................1,367 1,516 1,654 2,279 2,501 2,641 2,853 2,861Connecticut.....................................468 402 398 423 383 406 412 472Delaware..........................................41 56 68 99 102 113 148 186District of Columbia.......................112 322 134 270 180 202 196 208Florida..............................................955 1,222 1,509 1,616 2,215 2,287 2,590 2,721Georgia.............................................333 306 428 548 652 762 784 807Hawaii...............................................143 162 194 162 189 225 285 291Idaho...................................................447 374 373 485 579 630 734 860Illinois.................................................2,003 2,147 1,972 2,245 2,309 2,428 2,385 2,464Indiana...............................................576 648 604 720 881 1,015 1,079 1,111Iowa...................................................476 390 457 441 442 552 545 651Kansas............................................1,789 1,679 1,826 1,969 2,214 2,270 2,397 2,354Kentucky.............................................310 323 427 506 573 592 595 581Louisiana..........................................411 473 624 856 991 1,054 1,071 1,073Maine................................................190 333 235 398 422 854 518 579Maryland...........................................623 651 688 817 905 863 942 1,013Massachusetts...............................922 1,130 1,157 1,220 1,496 1,709 1,613 1,615Michigan...........................................2,729 3,231 3,122 3,547 3,703 4,147 4,473 4,390Minnesota.......................................1,287 1,474 1,731 2,002 2,098 2,548 2,403 2,967Mississippi......................................219 245 337 377 397 398 423 419Missouri.............................................677 669 840 1,132 1,166 1,253 1,339 1,452Montana............................................1,795 1,879 2,068 2,427 2,836 4,240 3,555 3,569Nebraska........................................637 680 625 729 768 800 854 941Nevada............................................1,152 696 667 1,043 930 995 979 1,020New Hampshire............................135 148 190 229 248 238 288 281New Jersey....................................884 860 847 776 814 837 962 880New Mexico....................................3,144 4,934 4,546 4,596 5,264 5,675 6,749 7,066New York.....................................4,708 4,821 3,619 3,882 3,408 3,564 3,473 3,553North Carolina..................................2,288 2,458 2,620 3,082 3,244 3,338 3,389 3,563North Dakota.................................1,395 1,468 1,486 1,616 1,910 2,019 2,102 2,110Ohio....................................................1,297 1,277 1,272 1,422 1,655 1,827 1,839 1,924Oklahoma....................................................5,809 7,668 8,014 9,609 11,163 11,832 12,762 13,593Oregon................................................1,169 1,345 1,540 1,694 1,949 2,184 2,339 2,400Pennsylvania...................................855 850 918 1,011 1,201 1,326 1,303 1,552Rhode Island......................................138 203 218 222 257 273 259 253South Carolina......................................184 207 236 334 345 397 496 601South Dakota....................................1,623 1,574 1,888 1,912 1,979 2,063 1,682 2,389Tennessee..........................................346 341 404 476 576 612 651 705Texas.....................................................2,586 2,599 2,756 3,006 3,470 3,762 4,091 4,396Utah.....................................................885 1,149 1,088 1,322 1,319 1,301 1,440 1,500Vermont..............................................53 54 98 131 113 97 143 202Virginia..................................................590 645 738 860 958 1,127 1,110 1,201Washington.......................................2,816 3,542 3,444 3,854 4,346 4,435 4,653 5,175West Virginia....................................111 96 119 139 179 155 161 182Wisconsin..........................................1,625 1,640 1,897 2,050 2,257 2,429 2,321 2,489Wyoming.............................................190 277 376 444 460 454 450 447U.S. Service Schools....................72 80 130 119 280 484 514 487
*In California, 11 percent of the total is based on 1982 distribution by race. In New York, 19 percent of the total is based on 1982 distribution by race. In the U.S. Service Schools, distribution by race is based largely on 1982 data. Only 15 percent of the students were reported by race in 1984. Some 214 institutions did not report the racial/ethnic status of their student body. Data for 195 of these nonreporting institutions, representing about 5 percent of total enrollment, were imputed. For those institutions that reported race data in 1982, data have been estimated by applying their 1982 race distribution to their total enrollment reported in 1984. States with estimates amounting to more than 5 percent of their total have been noted.
NOTE: Because of underreporting and nonreporting of racial/ethnic data, totals in this table may be slightly lower than totals appearing in other tables. Data for 1990, 1991, 1992, 1993 and 1994 are preliminary.
SOURCE: U.S. Department of Education, National Center for Education Statistics, Higher Education General Information Survey (HEGIS), "Fall Enrollment in Colleges and Universites" survey, 1984; Integrated Postsecondary Education Data System (IPEDS), "Fall Enrollment" surveys, various years. As published in NCES, Digest of Education Statistics: 1987, table 133, p. 154, 1987; Digest of Education Statistics: 1989, table 177, p. 195, 1989; Digest of Education Statistics: 1991, table 196, p. 201, 1991; Digest of Education Statistics: 1992, table 195, p. 206, 1992; Digest of Education Statistics: 1993, table 208, p. 203, 1993; Digest of Education Statistics: 1994, table 205, p. 211, 1994; Digest of Education Statistics: 1995, table 203, p. 211, 1995; and Digest of Education Statistics: 1996, table 205, p. 211, 1996.
Table A3-3. American Indian and Alaska Native enrollment in institutions of higher education, by state:
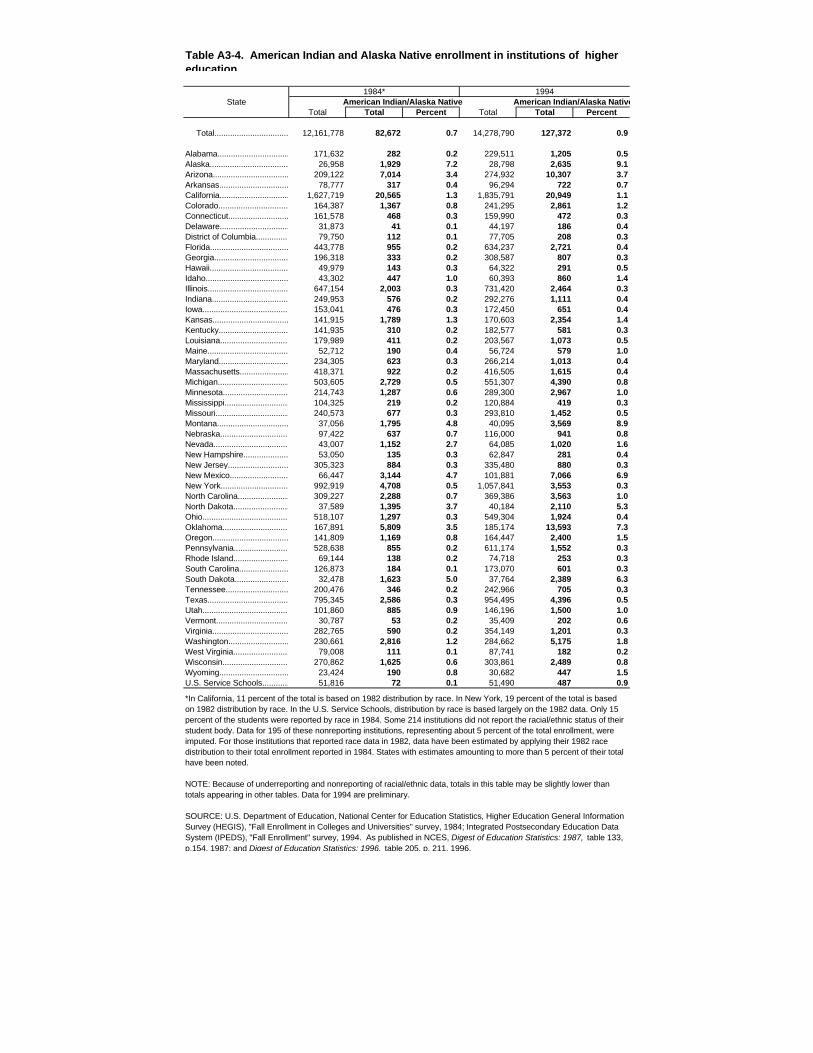
1984* 1994State American Indian/Alaska Native American Indian/Alaska Native
Total Total Percent Total Total Percent
Total......................................................................12,161,778 82,672 0.7 14,278,790 127,372 0.9
Alabama........................................................................171,632 282 0.2 229,511 1,205 0.5Alaska...................................................................26,958 1,929 7.2 28,798 2,635 9.1Arizona...................................................................209,122 7,014 3.4 274,932 10,307 3.7Arkansas..............................................................78,777 317 0.4 96,294 722 0.7California.................................................................1,627,719 20,565 1.3 1,835,791 20,949 1.1Colorado...............................................................164,387 1,367 0.8 241,295 2,861 1.2Connecticut..........................................................161,578 468 0.3 159,990 472 0.3Delaware................................................................31,873 41 0.1 44,197 186 0.4District of Columbia................................................79,750 112 0.1 77,705 208 0.3Florida...................................................................443,778 955 0.2 634,237 2,721 0.4Georgia................................................................196,318 333 0.2 308,587 807 0.3Hawaii....................................................................49,979 143 0.3 64,322 291 0.5Idaho......................................................................43,302 447 1.0 60,393 860 1.4Illinois.........................................................................647,154 2,003 0.3 731,420 2,464 0.3Indiana....................................................................249,953 576 0.2 292,276 1,111 0.4Iowa.........................................................................153,041 476 0.3 172,450 651 0.4Kansas.....................................................................141,915 1,789 1.3 170,603 2,354 1.4Kentucky.....................................................................141,935 310 0.2 182,577 581 0.3Louisiana..................................................................179,989 411 0.2 203,567 1,073 0.5Maine........................................................................52,712 190 0.4 56,724 579 1.0Maryland......................................................................234,305 623 0.3 266,214 1,013 0.4Massachusetts........................................................418,371 922 0.2 416,505 1,615 0.4Michigan...............................................................503,605 2,729 0.5 551,307 4,390 0.8Minnesota.................................................................214,743 1,287 0.6 289,300 2,967 1.0Mississippi..........................................................104,325 219 0.2 120,884 419 0.3Missouri...............................................................240,573 677 0.3 293,810 1,452 0.5Montana...............................................................37,056 1,795 4.8 40,095 3,569 8.9Nebraska..............................................................97,422 637 0.7 116,000 941 0.8Nevada....................................................................43,007 1,152 2.7 64,085 1,020 1.6New Hampshire....................................................53,050 135 0.3 62,847 281 0.4New Jersey..............................................................305,323 884 0.3 335,480 880 0.3New Mexico..........................................................66,447 3,144 4.7 101,881 7,066 6.9New York..............................................................992,919 4,708 0.5 1,057,841 3,553 0.3North Carolina.......................................................309,227 2,288 0.7 369,386 3,563 1.0North Dakota.........................................................37,589 1,395 3.7 40,184 2,110 5.3Ohio...........................................................................518,107 1,297 0.3 549,304 1,924 0.4Oklahoma.............................................................167,891 5,809 3.5 185,174 13,593 7.3Oregon..................................................................141,809 1,169 0.8 164,447 2,400 1.5Pennsylvania...........................................................528,638 855 0.2 611,174 1,552 0.3Rhode Island.........................................................69,144 138 0.2 74,718 253 0.3South Carolina........................................................126,873 184 0.1 173,070 601 0.3South Dakota.......................................................32,478 1,623 5.0 37,764 2,389 6.3Tennessee...............................................................200,476 346 0.2 242,966 705 0.3Texas....................................................................795,345 2,586 0.3 954,495 4,396 0.5Utah.......................................................................101,860 885 0.9 146,196 1,500 1.0Vermont..................................................................30,787 53 0.2 35,409 202 0.6Virginia................................................................282,765 590 0.2 354,149 1,201 0.3Washington..........................................................230,661 2,816 1.2 284,662 5,175 1.8West Virginia......................................................79,008 111 0.1 87,741 182 0.2Wisconsin............................................................270,862 1,625 0.6 303,861 2,489 0.8Wyoming...............................................................23,424 190 0.8 30,682 447 1.5U.S. Service Schools..........................51,816 72 0.1 51,490 487 0.9
*In California, 11 percent of the total is based on 1982 distribution by race. In New York, 19 percent of the total is based on 1982 distribution by race. In the U.S. Service Schools, distribution by race is based largely on the 1982 data. Only 15 percent of the students were reported by race in 1984. Some 214 institutions did not report the racial/ethnic status of their student body. Data for 195 of these nonreporting institutions, representing about 5 percent of the total enrollment, were imputed. For those institutions that reported race data in 1982, data have been estimated by applying their 1982 race distribution to their total enrollment reported in 1984. States with estimates amounting to more than 5 percent of their total have been noted.
NOTE: Because of underreporting and nonreporting of racial/ethnic data, totals in this table may be slightly lower than totals appearing in other tables. Data for 1994 are preliminary.
SOURCE: U.S. Department of Education, National Center for Education Statistics, Higher Education General Information Survey (HEGIS), "Fall Enrollment in Colleges and Universities" survey, 1984; Integrated Postsecondary Education Data System (IPEDS), "Fall Enrollment" survey, 1994. As published in NCES, Digest of Education Statistics: 1987, table 133, p.154, 1987; and Digest of Education Statistics: 1996, table 205, p. 211, 1996.
Table A3-4. American Indian and Alaska Native enrollment in institutions of higher education,
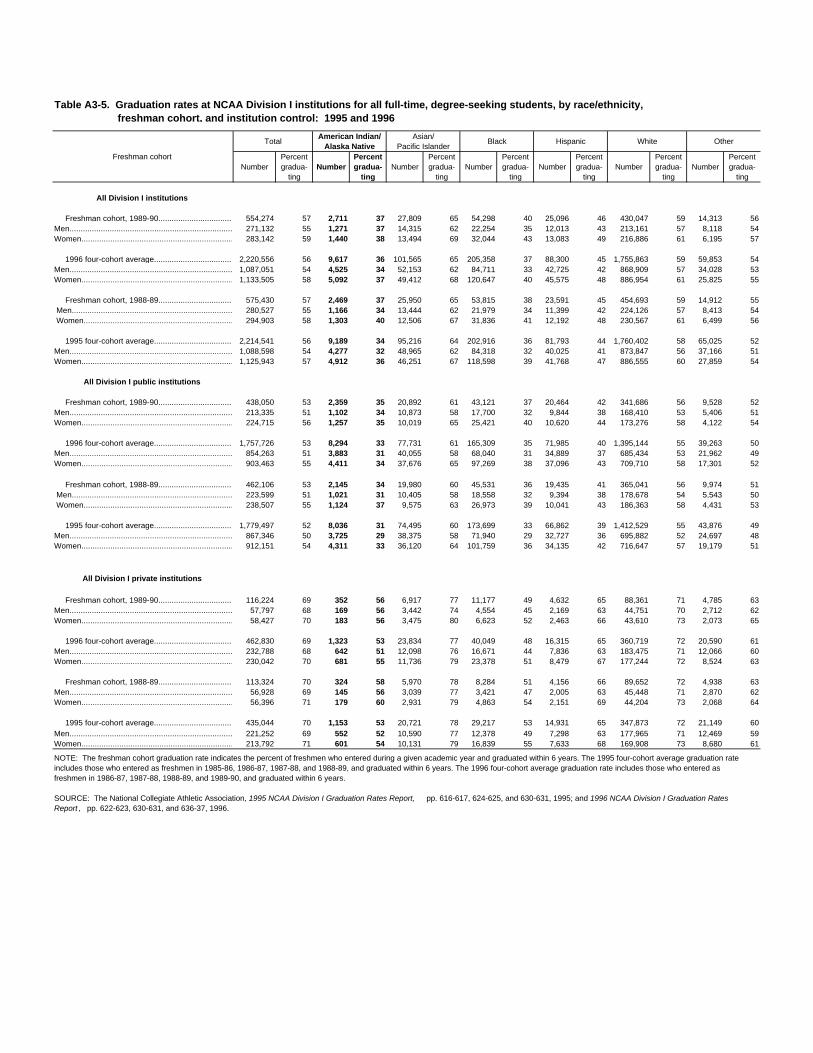
Total American Indian/
Alaska NativeAsian/
Pacific IslanderBlack Hispanic White Other
Freshman cohort Number
Percent gradua-
tingNumber
Percent gradua-
tingNumber
Percent gradua-
tingNumber
Percent gradua-
tingNumber
Percent gradua-
tingNumber
Percent gradua-
tingNumber
Percent gradua-
ting
All Division I institutions
Freshman cohort, 1989-90......................................................554,274 57 2,711 37 27,809 65 54,298 40 25,096 46 430,047 59 14,313 56Men.............................................................................. 271,132 55 1,271 37 14,315 62 22,254 35 12,013 43 213,161 57 8,118 54Women....................................................................... 283,142 59 1,440 38 13,494 69 32,044 43 13,083 49 216,886 61 6,195 57
1996 four-cohort average..................................................2,220,556 56 9,617 36 101,565 65 205,358 37 88,300 45 1,755,863 59 59,853 54Men..............................................................................1,087,051 54 4,525 34 52,153 62 84,711 33 42,725 42 868,909 57 34,028 53Women.......................................................................1,133,505 58 5,092 37 49,412 68 120,647 40 45,575 48 886,954 61 25,825 55
Freshman cohort, 1988-89........................................................575,430 57 2,469 37 25,950 65 53,815 38 23,591 45 454,693 59 14,912 55 Men..............................................................................280,527 55 1,166 34 13,444 62 21,979 34 11,399 42 224,126 57 8,413 54 Women....................................................................... 294,903 58 1,303 40 12,506 67 31,836 41 12,192 48 230,567 61 6,499 56
1995 four-cohort average..................................................2,214,541 56 9,189 34 95,216 64 202,916 36 81,793 44 1,760,402 58 65,025 52Men..............................................................................1,088,598 54 4,277 32 48,965 62 84,318 32 40,025 41 873,847 56 37,166 51Women.......................................................................1,125,943 57 4,912 36 46,251 67 118,598 39 41,768 47 886,555 60 27,859 54
All Division I public institutions
Freshman cohort, 1989-90......................................................438,050 53 2,359 35 20,892 61 43,121 37 20,464 42 341,686 56 9,528 52Men...............................................................................213,335 51 1,102 34 10,873 58 17,700 32 9,844 38 168,410 53 5,406 51Women...................................................................................224,715 56 1,257 35 10,019 65 25,421 40 10,620 44 173,276 58 4,122 54
1996 four-cohort average..................................................1,757,726 53 8,294 33 77,731 61 165,309 35 71,985 40 1,395,144 55 39,263 50Men............................................................................................854,263 51 3,883 31 40,055 58 68,040 31 34,889 37 685,434 53 21,962 49Women........................................................................................903,463 55 4,411 34 37,676 65 97,269 38 37,096 43 709,710 58 17,301 52
Freshman cohort, 1988-89....................................................462,106 53 2,145 34 19,980 60 45,531 36 19,435 41 365,041 56 9,974 51 Men..............................................................................223,599 51 1,021 31 10,405 58 18,558 32 9,394 38 178,678 54 5,543 50 Women....................................................................... 238,507 55 1,124 37 9,575 63 26,973 39 10,041 43 186,363 58 4,431 53
1995 four-cohort average..................................................1,779,497 52 8,036 31 74,495 60 173,699 33 66,862 39 1,412,529 55 43,876 49Men............................................................................................867,346 50 3,725 29 38,375 58 71,940 29 32,727 36 695,882 52 24,697 48Women.....................................................................................912,151 54 4,311 33 36,120 64 101,759 36 34,135 42 716,647 57 19,179 51
All Division I private institutions
Freshman cohort, 1989-90......................................................116,224 69 352 56 6,917 77 11,177 49 4,632 65 88,361 71 4,785 63Men...........................................................................................57,797 68 169 56 3,442 74 4,554 45 2,169 63 44,751 70 2,712 62Women.......................................................................................58,427 70 183 56 3,475 80 6,623 52 2,463 66 43,610 73 2,073 65
1996 four-cohort average..................................................462,830 69 1,323 53 23,834 77 40,049 48 16,315 65 360,719 72 20,590 61Men..................................................................................................232,788 68 642 51 12,098 76 16,671 44 7,836 63 183,475 71 12,066 60Women....................................................................... 230,042 70 681 55 11,736 79 23,378 51 8,479 67 177,244 72 8,524 63
Freshman cohort, 1988-89......................................................113,324 70 324 58 5,970 78 8,284 51 4,156 66 89,652 72 4,938 63Men...........................................................................................56,928 69 145 56 3,039 77 3,421 47 2,005 63 45,448 71 2,870 62Women.......................................................................................56,396 71 179 60 2,931 79 4,863 54 2,151 69 44,204 73 2,068 64
1995 four-cohort average..................................................435,044 70 1,153 53 20,721 78 29,217 53 14,931 65 347,873 72 21,149 60Men..................................................................................................221,252 69 552 52 10,590 77 12,378 49 7,298 63 177,965 71 12,469 59Women.............................................................................213,792 71 601 54 10,131 79 16,839 55 7,633 68 169,908 73 8,680 61
Table A3-5. Graduation rates at NCAA Division I institutions for all full-time, degree-seeking students, by race/ethnicity, freshman cohort, and institution control: 1995 and 1996
NOTE: The freshman cohort graduation rate indicates the percent of freshmen who entered during a given academic year and graduated within 6 years. The 1995 four-cohort average graduation rate includes those who entered as freshmen in 1985-86, 1986-87, 1987-88, and 1988-89, and graduated within 6 years. The 1996 four-cohort average graduation rate includes those who entered as freshmen in 1986-87, 1987-88, 1988-89, and 1989-90, and graduated within 6 years.
SOURCE: The National Collegiate Athletic Association, 1995 NCAA Division I Graduation Rates Report, pp. 616-617, 624-625, and 630-631, 1995; and 1996 NCAA Division I Graduation Rates Report , pp. 622-623, 630-631, and 636-37, 1996.
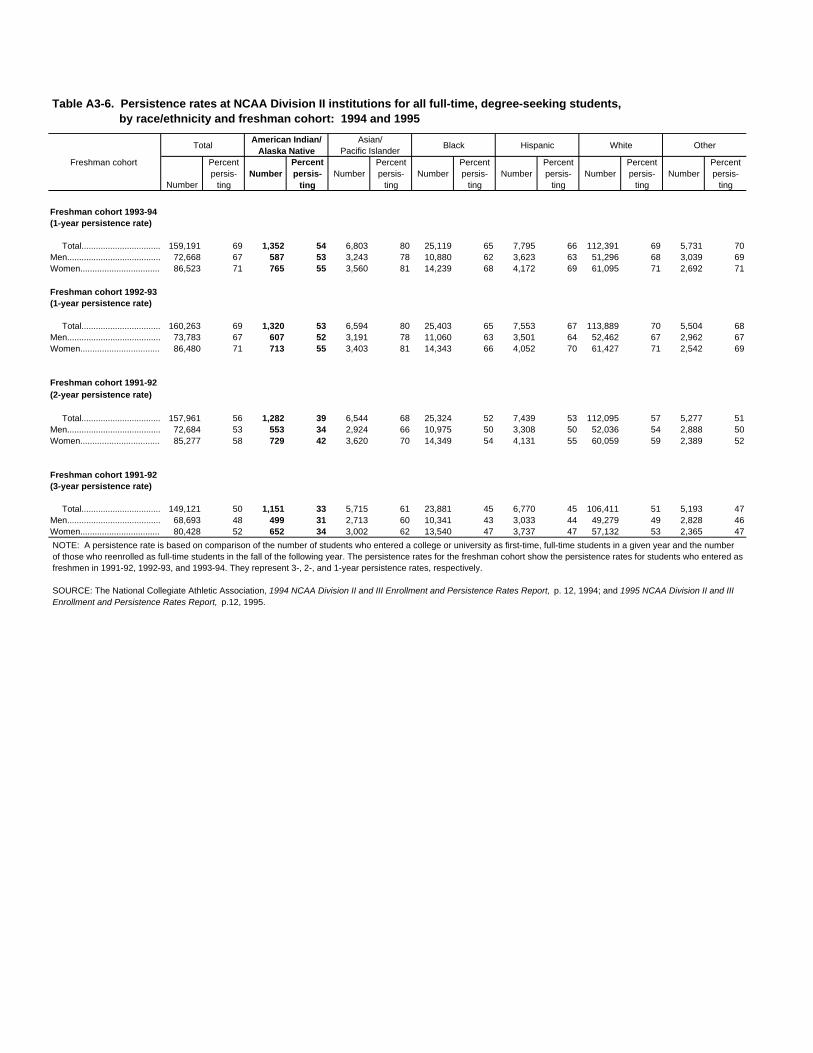
TotalAmerican Indian/
Alaska NativeAsian/
Pacific IslanderBlack Hispanic White Other
Freshman cohort
Number
Percent persis-
tingNumber
Percent persis-
tingNumber
Percent persis-
tingNumber
Percent persis-
tingNumber
Percent persis-
tingNumber
Percent persis-
tingNumber
Percent persis-
ting
Freshman cohort 1993-94(1-year persistence rate)
Total...........................................................159,191 69 1,352 54 6,803 80 25,119 65 7,795 66 112,391 69 5,731 70Men...........................................................72,668 67 587 53 3,243 78 10,880 62 3,623 63 51,296 68 3,039 69Women..............................................................86,523 71 765 55 3,560 81 14,239 68 4,172 69 61,095 71 2,692 71
Freshman cohort 1992-93(1-year persistence rate)
Total...........................................................160,263 69 1,320 53 6,594 80 25,403 65 7,553 67 113,889 70 5,504 68Men...........................................................73,783 67 607 52 3,191 78 11,060 63 3,501 64 52,462 67 2,962 67Women..............................................................86,480 71 713 55 3,403 81 14,343 66 4,052 70 61,427 71 2,542 69
Freshman cohort 1991-92(2-year persistence rate)
Total...........................................................157,961 56 1,282 39 6,544 68 25,324 52 7,439 53 112,095 57 5,277 51Men...........................................................72,684 53 553 34 2,924 66 10,975 50 3,308 50 52,036 54 2,888 50Women..............................................................85,277 58 729 42 3,620 70 14,349 54 4,131 55 60,059 59 2,389 52
Freshman cohort 1991-92(3-year persistence rate)
Total...........................................................149,121 50 1,151 33 5,715 61 23,881 45 6,770 45 106,411 51 5,193 47Men...........................................................68,693 48 499 31 2,713 60 10,341 43 3,033 44 49,279 49 2,828 46Women..............................................................80,428 52 652 34 3,002 62 13,540 47 3,737 47 57,132 53 2,365 47
Table A3-6. Persistence rates at NCAA Division II institutions for all full-time, degree-seeking students, by race/ethnicity and freshman cohort: 1994 and 1995
NOTE: A persistence rate is based on comparison of the number of students who entered a college or university as first-time, full-time students in a given year and the number of those who reenrolled as full-time students in the fall of the following year. The persistence rates for the freshman cohort show the persistence rates for students who entered as freshmen in 1991-92, 1992-93, and 1993-94. They represent 3-, 2-, and 1-year persistence rates, respectively.
SOURCE: The National Collegiate Athletic Association, 1994 NCAA Division II and III Enrollment and Persistence Rates Report, p. 12, 1994; and 1995 NCAA Division II and III Enrollment and Persistence Rates Report, p.12, 1995.
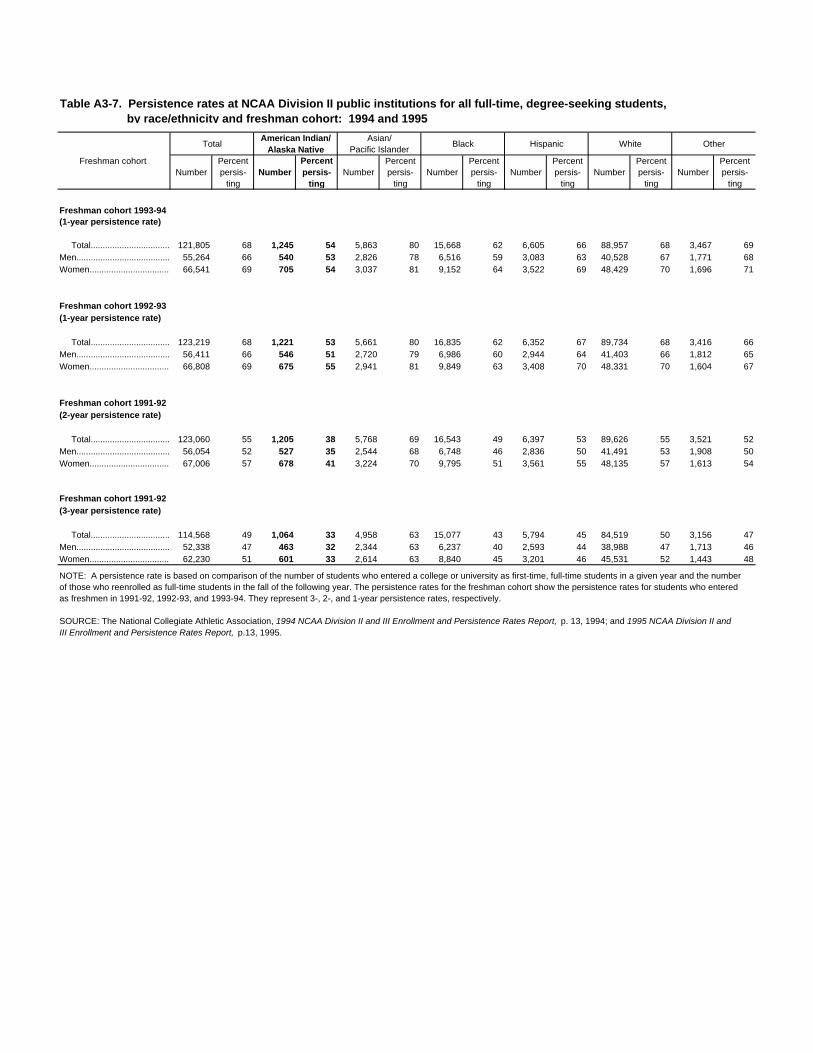
TotalAmerican Indian/
Alaska NativeAsian/
Pacific IslanderBlack Hispanic White Other
Freshman cohort Number
Percent persis-
tingNumber
Percent persis-
tingNumber
Percent persis-
tingNumber
Percent persis-
tingNumber
Percent persis-
tingNumber
Percent persis-
tingNumber
Percent persis-
ting
Freshman cohort 1993-94(1-year persistence rate)
Total...........................................................121,805 68 1,245 54 5,863 80 15,668 62 6,605 66 88,957 68 3,467 69Men...........................................................55,264 66 540 53 2,826 78 6,516 59 3,083 63 40,528 67 1,771 68Women...............................................................66,541 69 705 54 3,037 81 9,152 64 3,522 69 48,429 70 1,696 71
Freshman cohort 1992-93(1-year persistence rate)
Total...........................................................123,219 68 1,221 53 5,661 80 16,835 62 6,352 67 89,734 68 3,416 66Men...........................................................56,411 66 546 51 2,720 79 6,986 60 2,944 64 41,403 66 1,812 65Women...............................................................66,808 69 675 55 2,941 81 9,849 63 3,408 70 48,331 70 1,604 67
Freshman cohort 1991-92(2-year persistence rate)
Total...........................................................123,060 55 1,205 38 5,768 69 16,543 49 6,397 53 89,626 55 3,521 52Men...........................................................56,054 52 527 35 2,544 68 6,748 46 2,836 50 41,491 53 1,908 50Women...............................................................67,006 57 678 41 3,224 70 9,795 51 3,561 55 48,135 57 1,613 54
Freshman cohort 1991-92(3-year persistence rate)
Total...........................................................114,568 49 1,064 33 4,958 63 15,077 43 5,794 45 84,519 50 3,156 47Men...........................................................52,338 47 463 32 2,344 63 6,237 40 2,593 44 38,988 47 1,713 46Women...............................................................62,230 51 601 33 2,614 63 8,840 45 3,201 46 45,531 52 1,443 48
Table A3-7. Persistence rates at NCAA Division II public institutions for all full-time, degree-seeking students, by race/ethnicity and freshman cohort: 1994 and 1995
NOTE: A persistence rate is based on comparison of the number of students who entered a college or university as first-time, full-time students in a given year and the number of those who reenrolled as full-time students in the fall of the following year. The persistence rates for the freshman cohort show the persistence rates for students who entered as freshmen in 1991-92, 1992-93, and 1993-94. They represent 3-, 2-, and 1-year persistence rates, respectively.
SOURCE: The National Collegiate Athletic Association, 1994 NCAA Division II and III Enrollment and Persistence Rates Report, p. 13, 1994; and 1995 NCAA Division II and III Enrollment and Persistence Rates Report, p.13, 1995.
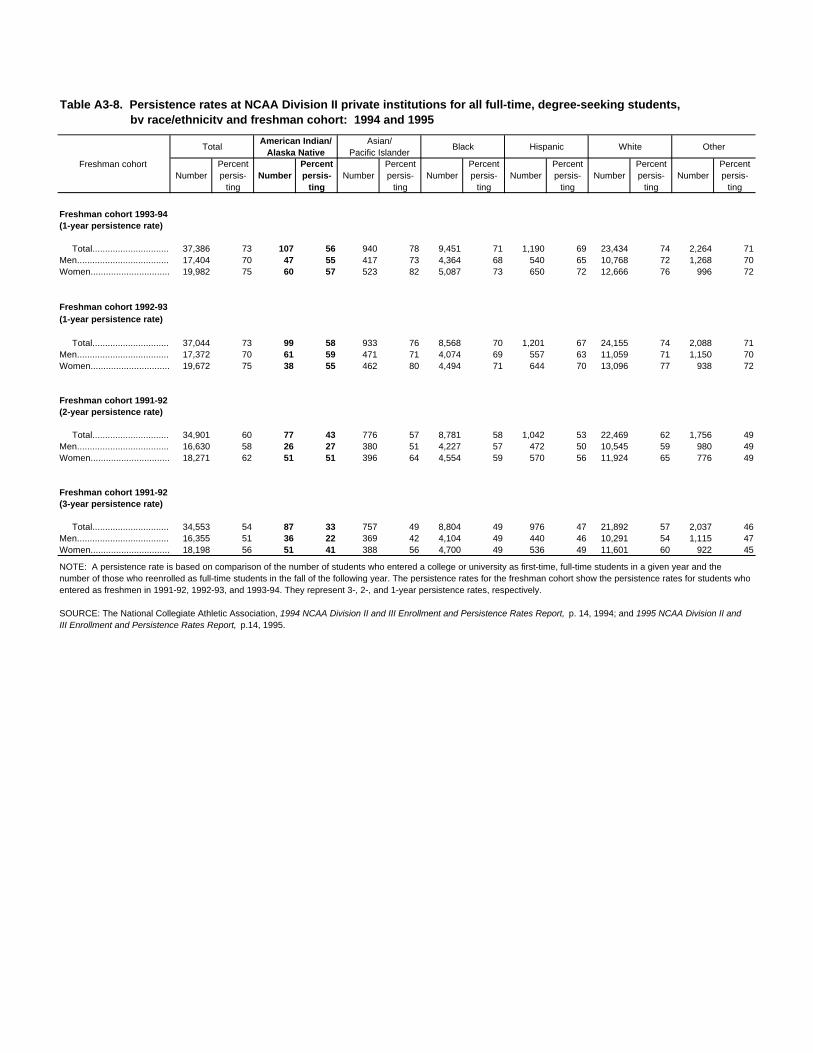
TotalAmerican Indian/
Alaska NativeAsian/
Pacific IslanderBlack Hispanic White Other
Freshman cohort Number
Percent persis-
tingNumber
Percent persis-
tingNumber
Percent persis-
tingNumber
Percent persis-
tingNumber
Percent persis-
tingNumber
Percent persis-
tingNumber
Percent persis-
ting
Freshman cohort 1993-94(1-year persistence rate)
Total...........................................................37,386 73 107 56 940 78 9,451 71 1,190 69 23,434 74 2,264 71Men...........................................................17,404 70 47 55 417 73 4,364 68 540 65 10,768 72 1,268 70Women...............................................................19,982 75 60 57 523 82 5,087 73 650 72 12,666 76 996 72
Freshman cohort 1992-93(1-year persistence rate)
Total...........................................................37,044 73 99 58 933 76 8,568 70 1,201 67 24,155 74 2,088 71Men...........................................................17,372 70 61 59 471 71 4,074 69 557 63 11,059 71 1,150 70Women...............................................................19,672 75 38 55 462 80 4,494 71 644 70 13,096 77 938 72
Freshman cohort 1991-92(2-year persistence rate)
Total...........................................................34,901 60 77 43 776 57 8,781 58 1,042 53 22,469 62 1,756 49Men...........................................................16,630 58 26 27 380 51 4,227 57 472 50 10,545 59 980 49Women...............................................................18,271 62 51 51 396 64 4,554 59 570 56 11,924 65 776 49
Freshman cohort 1991-92(3-year persistence rate)
Total...........................................................34,553 54 87 33 757 49 8,804 49 976 47 21,892 57 2,037 46Men...........................................................16,355 51 36 22 369 42 4,104 49 440 46 10,291 54 1,115 47Women...............................................................18,198 56 51 41 388 56 4,700 49 536 49 11,601 60 922 45
Table A3-8. Persistence rates at NCAA Division II private institutions for all full-time, degree-seeking students, by race/ethnicity and freshman cohort: 1994 and 1995
NOTE: A persistence rate is based on comparison of the number of students who entered a college or university as first-time, full-time students in a given year and the number of those who reenrolled as full-time students in the fall of the following year. The persistence rates for the freshman cohort show the persistence rates for students who entered as freshmen in 1991-92, 1992-93, and 1993-94. They represent 3-, 2-, and 1-year persistence rates, respectively.
SOURCE: The National Collegiate Athletic Association, 1994 NCAA Division II and III Enrollment and Persistence Rates Report, p. 14, 1994; and 1995 NCAA Division II and III Enrollment and Persistence Rates Report, p.14, 1995.
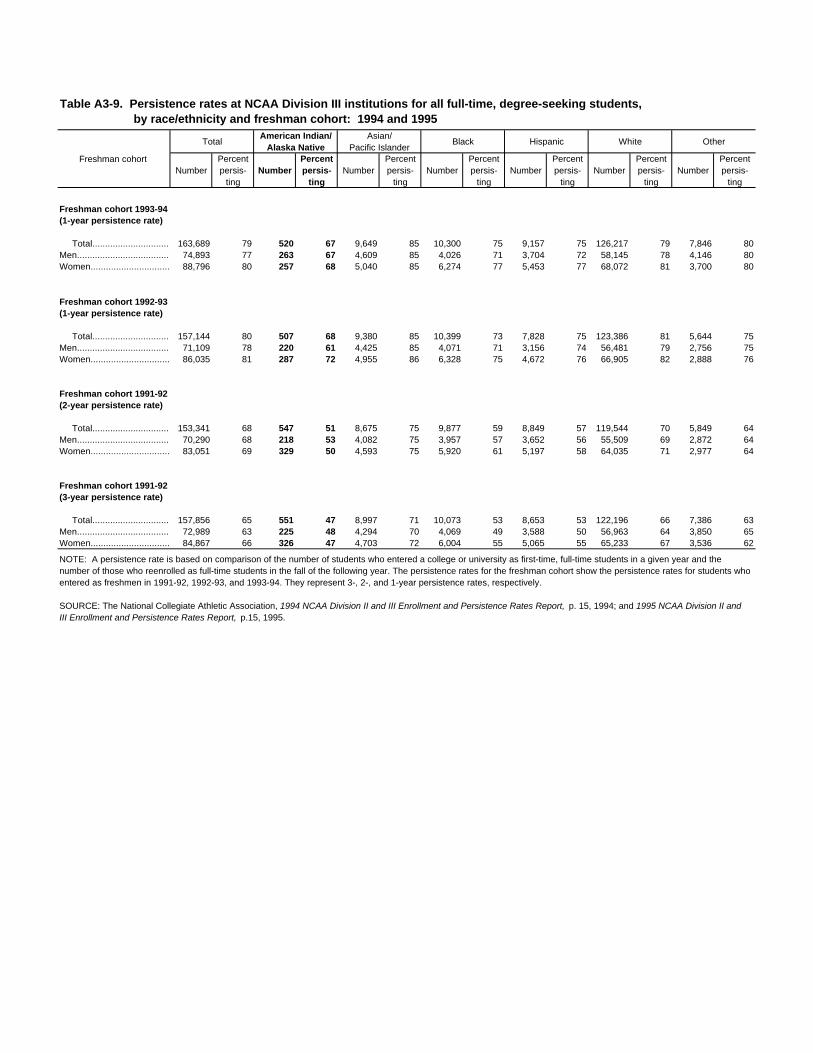
TotalAmerican Indian/
Alaska NativeAsian/
Pacific IslanderBlack Hispanic White Other
Freshman cohort Number
Percent persis-
tingNumber
Percent persis-
tingNumber
Percent persis-
tingNumber
Percent persis-
tingNumber
Percent persis-
tingNumber
Percent persis-
tingNumber
Percent persis-
ting
Freshman cohort 1993-94(1-year persistence rate)
Total...........................................................163,689 79 520 67 9,649 85 10,300 75 9,157 75 126,217 79 7,846 80Men...........................................................74,893 77 263 67 4,609 85 4,026 71 3,704 72 58,145 78 4,146 80Women..............................................................88,796 80 257 68 5,040 85 6,274 77 5,453 77 68,072 81 3,700 80
Freshman cohort 1992-93(1-year persistence rate)
Total...........................................................157,144 80 507 68 9,380 85 10,399 73 7,828 75 123,386 81 5,644 75Men...........................................................71,109 78 220 61 4,425 85 4,071 71 3,156 74 56,481 79 2,756 75Women..............................................................86,035 81 287 72 4,955 86 6,328 75 4,672 76 66,905 82 2,888 76
Freshman cohort 1991-92(2-year persistence rate)
Total...........................................................153,341 68 547 51 8,675 75 9,877 59 8,849 57 119,544 70 5,849 64Men...........................................................70,290 68 218 53 4,082 75 3,957 57 3,652 56 55,509 69 2,872 64Women...............................................................83,051 69 329 50 4,593 75 5,920 61 5,197 58 64,035 71 2,977 64
Freshman cohort 1991-92(3-year persistence rate)
Total...........................................................157,856 65 551 47 8,997 71 10,073 53 8,653 53 122,196 66 7,386 63Men...........................................................72,989 63 225 48 4,294 70 4,069 49 3,588 50 56,963 64 3,850 65Women..............................................................84,867 66 326 47 4,703 72 6,004 55 5,065 55 65,233 67 3,536 62
Table A3-9. Persistence rates at NCAA Division III institutions for all full-time, degree-seeking students, by race/ethnicity and freshman cohort: 1994 and 1995
NOTE: A persistence rate is based on comparison of the number of students who entered a college or university as first-time, full-time students in a given year and the number of those who reenrolled as full-time students in the fall of the following year. The persistence rates for the freshman cohort show the persistence rates for students who entered as freshmen in 1991-92, 1992-93, and 1993-94. They represent 3-, 2-, and 1-year persistence rates, respectively.
SOURCE: The National Collegiate Athletic Association, 1994 NCAA Division II and III Enrollment and Persistence Rates Report, p. 15, 1994; and 1995 NCAA Division II and III Enrollment and Persistence Rates Report, p.15, 1995.
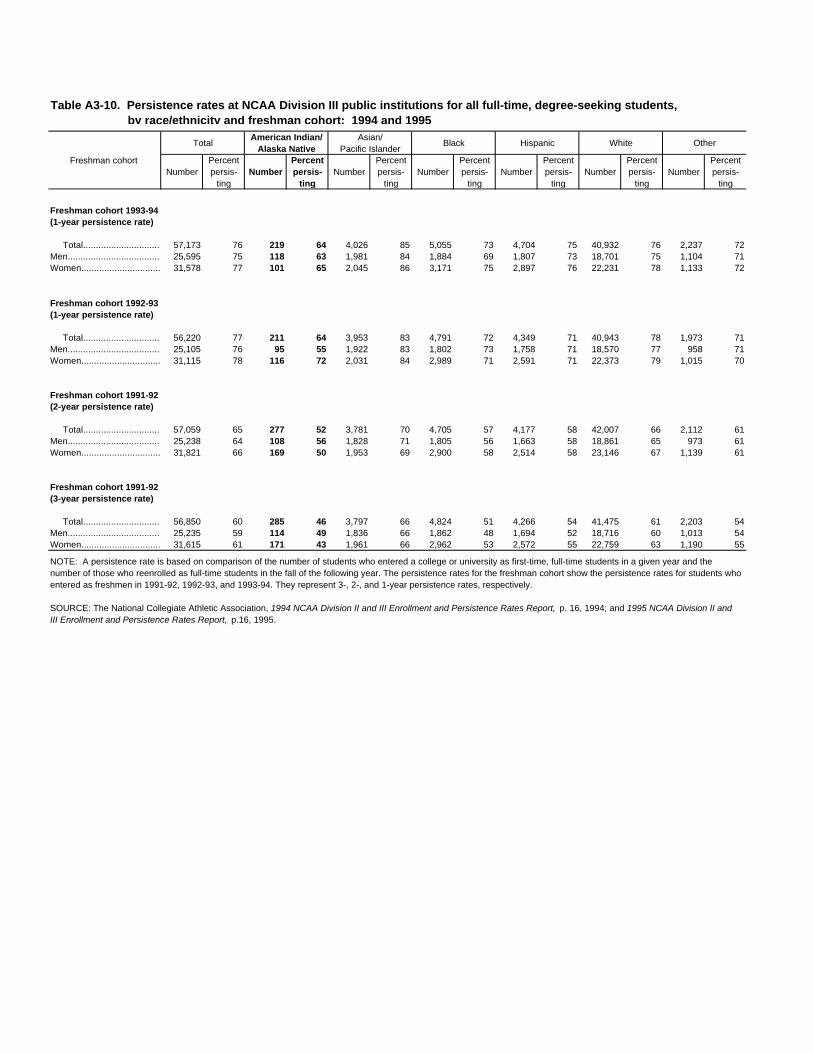
TotalAmerican Indian/
Alaska NativeAsian/
Pacific IslanderBlack Hispanic White Other
Freshman cohort Number
Percent persis-
tingNumber
Percent persis-
tingNumber
Percent persis-
tingNumber
Percent persis-
tingNumber
Percent persis-
tingNumber
Percent persis-
tingNumber
Percent persis-
ting
Freshman cohort 1993-94(1-year persistence rate)
Total...........................................................57,173 76 219 64 4,026 85 5,055 73 4,704 75 40,932 76 2,237 72Men...........................................................25,595 75 118 63 1,981 84 1,884 69 1,807 73 18,701 75 1,104 71Women..............................................................31,578 77 101 65 2,045 86 3,171 75 2,897 76 22,231 78 1,133 72
Freshman cohort 1992-93(1-year persistence rate)
Total...........................................................56,220 77 211 64 3,953 83 4,791 72 4,349 71 40,943 78 1,973 71Men...........................................................25,105 76 95 55 1,922 83 1,802 73 1,758 71 18,570 77 958 71Women..............................................................31,115 78 116 72 2,031 84 2,989 71 2,591 71 22,373 79 1,015 70
Freshman cohort 1991-92(2-year persistence rate)
Total...........................................................57,059 65 277 52 3,781 70 4,705 57 4,177 58 42,007 66 2,112 61Men...........................................................25,238 64 108 56 1,828 71 1,805 56 1,663 58 18,861 65 973 61Women..............................................................31,821 66 169 50 1,953 69 2,900 58 2,514 58 23,146 67 1,139 61
Freshman cohort 1991-92(3-year persistence rate)
Total...........................................................56,850 60 285 46 3,797 66 4,824 51 4,266 54 41,475 61 2,203 54Men...........................................................25,235 59 114 49 1,836 66 1,862 48 1,694 52 18,716 60 1,013 54Women..............................................................31,615 61 171 43 1,961 66 2,962 53 2,572 55 22,759 63 1,190 55
Table A3-10. Persistence rates at NCAA Division III public institutions for all full-time, degree-seeking students, by race/ethnicity and freshman cohort: 1994 and 1995
NOTE: A persistence rate is based on comparison of the number of students who entered a college or university as first-time, full-time students in a given year and the number of those who reenrolled as full-time students in the fall of the following year. The persistence rates for the freshman cohort show the persistence rates for students who entered as freshmen in 1991-92, 1992-93, and 1993-94. They represent 3-, 2-, and 1-year persistence rates, respectively.
SOURCE: The National Collegiate Athletic Association, 1994 NCAA Division II and III Enrollment and Persistence Rates Report, p. 16, 1994; and 1995 NCAA Division II and III Enrollment and Persistence Rates Report, p.16, 1995.
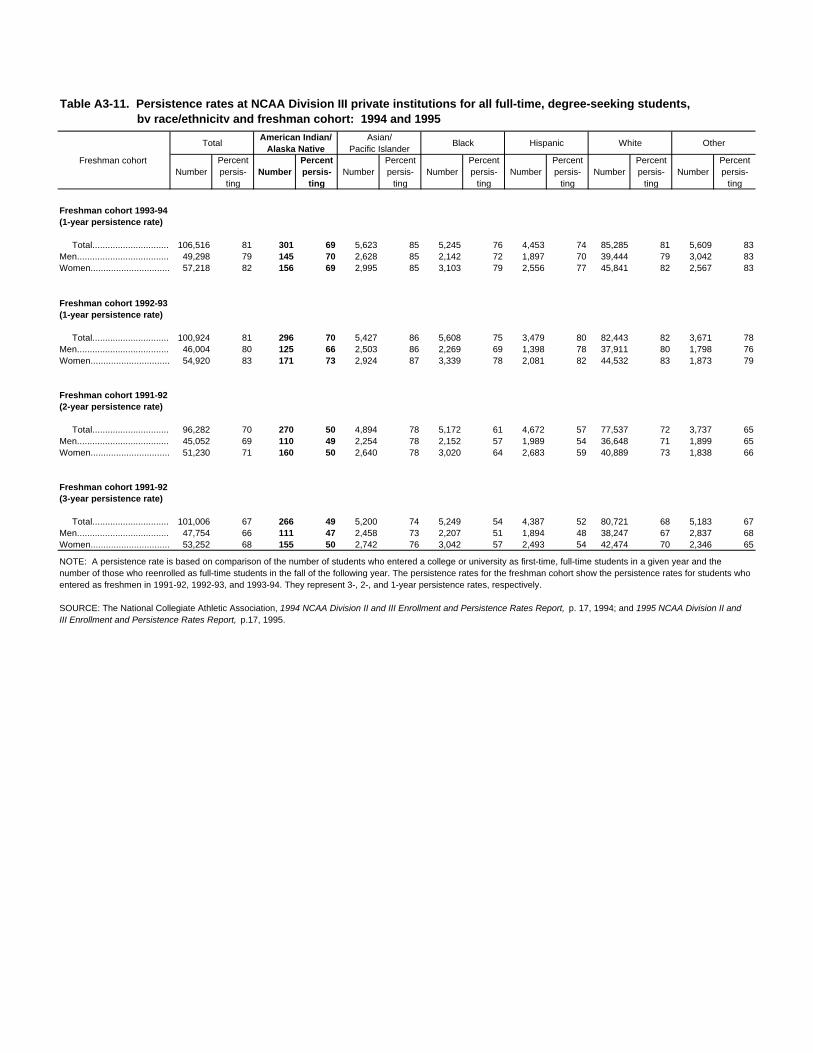
TotalAmerican Indian/
Alaska NativeAsian/
Pacific IslanderBlack Hispanic White Other
Freshman cohort Number
Percent persis-
tingNumber
Percent persis-
tingNumber
Percent persis-
tingNumber
Percent persis-
tingNumber
Percent persis-
tingNumber
Percent persis-
tingNumber
Percent persis-
ting
Freshman cohort 1993-94(1-year persistence rate)
Total...........................................................106,516 81 301 69 5,623 85 5,245 76 4,453 74 85,285 81 5,609 83Men...........................................................49,298 79 145 70 2,628 85 2,142 72 1,897 70 39,444 79 3,042 83Women...............................................................57,218 82 156 69 2,995 85 3,103 79 2,556 77 45,841 82 2,567 83
Freshman cohort 1992-93(1-year persistence rate)
Total...........................................................100,924 81 296 70 5,427 86 5,608 75 3,479 80 82,443 82 3,671 78Men...........................................................46,004 80 125 66 2,503 86 2,269 69 1,398 78 37,911 80 1,798 76Women...............................................................54,920 83 171 73 2,924 87 3,339 78 2,081 82 44,532 83 1,873 79
Freshman cohort 1991-92(2-year persistence rate)
Total...........................................................96,282 70 270 50 4,894 78 5,172 61 4,672 57 77,537 72 3,737 65Men...........................................................45,052 69 110 49 2,254 78 2,152 57 1,989 54 36,648 71 1,899 65Women...............................................................51,230 71 160 50 2,640 78 3,020 64 2,683 59 40,889 73 1,838 66
Freshman cohort 1991-92(3-year persistence rate)
Total...........................................................101,006 67 266 49 5,200 74 5,249 54 4,387 52 80,721 68 5,183 67Men...........................................................47,754 66 111 47 2,458 73 2,207 51 1,894 48 38,247 67 2,837 68Women...............................................................53,252 68 155 50 2,742 76 3,042 57 2,493 54 42,474 70 2,346 65
Table A3-11. Persistence rates at NCAA Division III private institutions for all full-time, degree-seeking students, by race/ethnicity and freshman cohort: 1994 and 1995
NOTE: A persistence rate is based on comparison of the number of students who entered a college or university as first-time, full-time students in a given year and the number of those who reenrolled as full-time students in the fall of the following year. The persistence rates for the freshman cohort show the persistence rates for students who entered as freshmen in 1991-92, 1992-93, and 1993-94. They represent 3-, 2-, and 1-year persistence rates, respectively.
SOURCE: The National Collegiate Athletic Association, 1994 NCAA Division II and III Enrollment and Persistence Rates Report, p. 17, 1994; and 1995 NCAA Division II and III Enrollment and Persistence Rates Report, p.17, 1995.
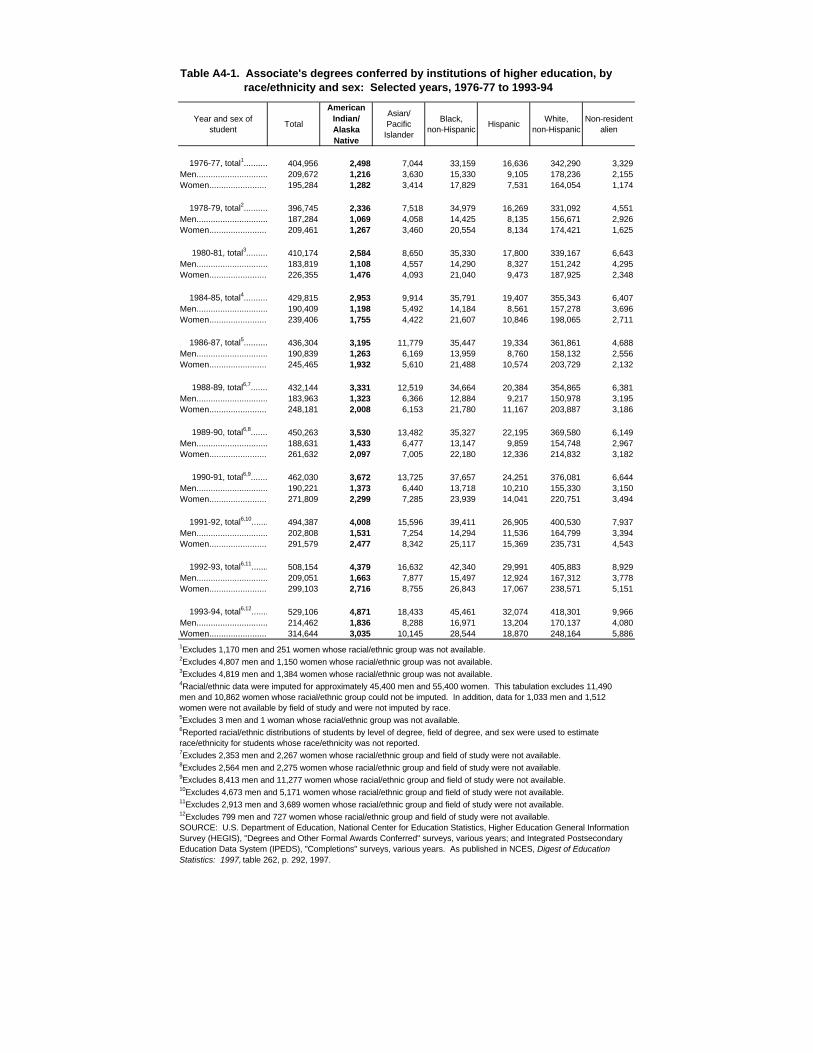
Year and sex of student
Total
American Indian/Alaska Native
Asian/Pacific
Islander
Black,non-Hispanic
HispanicWhite,
non-HispanicNon-resident
alien
1976-77, total1.................................404,956 2,498 7,044 33,159 16,636 342,290 3,329Men...................................... 209,672 1,216 3,630 15,330 9,105 178,236 2,155Women............................. 195,284 1,282 3,414 17,829 7,531 164,054 1,174
1978-79, total2...................................396,745 2,336 7,518 34,979 16,269 331,092 4,551Men...................................... 187,284 1,069 4,058 14,425 8,135 156,671 2,926Women............................. 209,461 1,267 3,460 20,554 8,134 174,421 1,625
1980-81, total3..................................410,174 2,584 8,650 35,330 17,800 339,167 6,643Men...................................... 183,819 1,108 4,557 14,290 8,327 151,242 4,295Women............................. 226,355 1,476 4,093 21,040 9,473 187,925 2,348
1984-85, total4....................................429,815 2,953 9,914 35,791 19,407 355,343 6,407Men...................................... 190,409 1,198 5,492 14,184 8,561 157,278 3,696Women............................. 239,406 1,755 4,422 21,607 10,846 198,065 2,711
1986-87, total5.................................436,304 3,195 11,779 35,447 19,334 361,861 4,688Men...................................... 190,839 1,263 6,169 13,959 8,760 158,132 2,556Women............................. 245,465 1,932 5,610 21,488 10,574 203,729 2,132
1988-89, total6,7...............................432,144 3,331 12,519 34,664 20,384 354,865 6,381Men...................................... 183,963 1,323 6,366 12,884 9,217 150,978 3,195Women............................. 248,181 2,008 6,153 21,780 11,167 203,887 3,186
1989-90, total6,8...............................450,263 3,530 13,482 35,327 22,195 369,580 6,149Men...................................... 188,631 1,433 6,477 13,147 9,859 154,748 2,967Women............................. 261,632 2,097 7,005 22,180 12,336 214,832 3,182
1990-91, total6,9.................................462,030 3,672 13,725 37,657 24,251 376,081 6,644Men...................................... 190,221 1,373 6,440 13,718 10,210 155,330 3,150Women............................. 271,809 2,299 7,285 23,939 14,041 220,751 3,494
1991-92, total6,10................................494,387 4,008 15,596 39,411 26,905 400,530 7,937Men...................................... 202,808 1,531 7,254 14,294 11,536 164,799 3,394Women............................. 291,579 2,477 8,342 25,117 15,369 235,731 4,543
1992-93, total6,11.................................508,154 4,379 16,632 42,340 29,991 405,883 8,929Men...................................... 209,051 1,663 7,877 15,497 12,924 167,312 3,778Women............................. 299,103 2,716 8,755 26,843 17,067 238,571 5,151
1993-94, total6,12.................................529,106 4,871 18,433 45,461 32,074 418,301 9,966Men...................................... 214,462 1,836 8,288 16,971 13,204 170,137 4,080Women............................. 314,644 3,035 10,145 28,544 18,870 248,164 5,8861Excludes 1,170 men and 251 women whose racial/ethnic group was not available.2Excludes 4,807 men and 1,150 women whose racial/ethnic group was not available.3Excludes 4,819 men and 1,384 women whose racial/ethnic group was not available.4Racial/ethnic data were imputed for approximately 45,400 men and 55,400 women. This tabulation excludes 11,490 men and 10,862 women whose racial/ethnic group could not be imputed. In addition, data for 1,033 men and 1,512 women were not available by field of study and were not imputed by race.5Excludes 3 men and 1 woman whose racial/ethnic group was not available.6Reported racial/ethnic distributions of students by level of degree, field of degree, and sex were used to estimate race/ethnicity for students whose race/ethnicity was not reported. 7Excludes 2,353 men and 2,267 women whose racial/ethnic group and field of study were not available.8Excludes 2,564 men and 2,275 women whose racial/ethnic group and field of study were not available.9Excludes 8,413 men and 11,277 women whose racial/ethnic group and field of study were not available.10Excludes 4,673 men and 5,171 women whose racial/ethnic group and field of study were not available.11Excludes 2,913 men and 3,689 women whose racial/ethnic group and field of study were not available.12Excludes 799 men and 727 women whose racial/ethnic group and field of study were not available.SOURCE: U.S. Department of Education, National Center for Education Statistics, Higher Education General Information Survey (HEGIS), "Degrees and Other Formal Awards Conferred" surveys, various years; and Integrated Postsecondary Education Data System (IPEDS), "Completions" surveys, various years. As published in NCES, Digest of Education Statistics: 1997, table 262, p. 292, 1997.
Table A4-1. Associate's degrees conferred by institutions of higher education, by race/ethnicity and sex: Selected years, 1976-77 to 1993-94
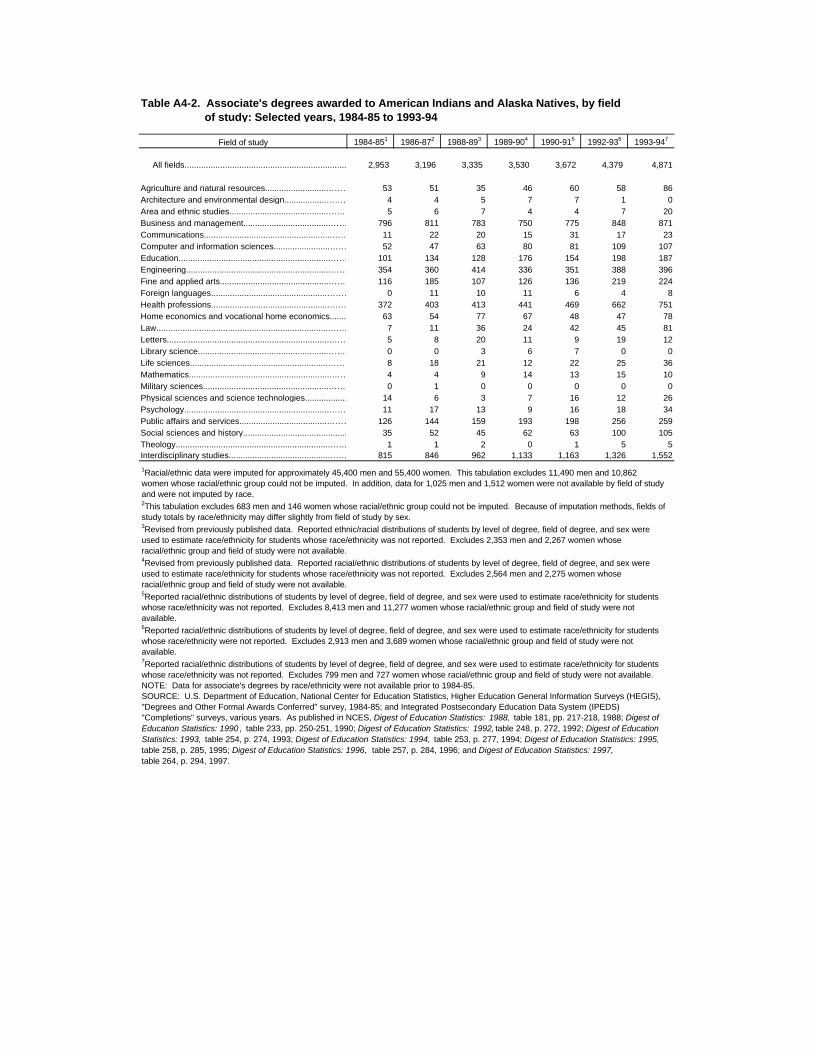
Field of study 1984-851 1986-872 1988-893 1989-904 1990-915 1992-936 1993-947
All fields................................................................................2,953 3,196 3,335 3,530 3,672 4,379 4,871
Agriculture and natural resources..........................………… 53 51 35 46 60 58 86Architecture and environmental design..................………… 4 4 5 7 7 1 0Area and ethnic studies..........................................……………….. 5 6 7 4 4 7 20Business and management.....................................…………………796 811 783 750 775 848 871Communications......................................................………………….11 22 20 15 31 17 23Computer and information sciences........................……………….52 47 63 80 81 109 107Education................................................................………………….101 134 128 176 154 198 187Engineering.............................................................……………. 354 360 414 336 351 388 396Fine and applied arts..............................................………….. 116 185 107 126 136 219 224Foreign languages.................................................………….. 0 11 10 11 6 4 8Health professions..................................................…………. 372 403 413 441 469 662 751Home economics and vocational home economics.......................................................63 54 77 67 48 47 78Law.........................................................................…………… 7 11 36 24 42 45 81Letters.....................................................................…………. 5 8 20 11 9 19 12Library science.......................................................………….. 0 0 3 6 7 0 0Life sciences..........................................................…………… 8 18 21 12 22 25 36Mathematics............................................................………….. 4 4 9 14 13 15 10Military sciences.....................................................…………. 0 1 0 0 0 0 0Physical sciences and science technologies......................................................14 6 3 7 16 12 26Psychology.............................................................…………….. 11 17 13 9 16 18 34Public affairs and services.....................................………….. 126 144 159 193 198 256 259Social sciences and history......................................................…………….35 52 45 62 63 100 105Theology.................................................................…………………1 1 2 0 1 5 5Interdisciplinary studies...........................................………….. 815 846 962 1,133 1,163 1,326 1,552
1Racial/ethnic data were imputed for approximately 45,400 men and 55,400 women. This tabulation excludes 11,490 men and 10,862 women whose racial/ethnic group could not be imputed. In addition, data for 1,025 men and 1,512 women were not available by field of study and were not imputed by race.2This tabulation excludes 683 men and 146 women whose racial/ethnic group could not be imputed. Because of imputation methods, fields of study totals by race/ethnicity may differ slightly from field of study by sex.3Revised from previously published data. Reported ethnic/racial distributions of students by level of degree, field of degree, and sex were used to estimate race/ethnicity for students whose race/ethnicity was not reported. Excludes 2,353 men and 2,267 women whose racial/ethnic group and field of study were not available.4Revised from previously published data. Reported racial/ethnic distributions of students by level of degree, field of degree, and sex were used to estimate race/ethnicity for students whose race/ethnicity was not reported. Excludes 2,564 men and 2,275 women whose racial/ethnic group and field of study were not available.5Reported racial/ethnic distributions of students by level of degree, field of degree, and sex were used to estimate race/ethnicity for students whose race/ethnicity was not reported. Excludes 8,413 men and 11,277 women whose racial/ethnic group and field of study were not available.6Reported racial/ethnic distributions of students by level of degree, field of degree, and sex were used to estimate race/ethnicity for students whose race/ethnicity were not reported. Excludes 2,913 men and 3,689 women whose racial/ethnic group and field of study were not available.7Reported racial/ethnic distributions of students by level of degree, field of degree, and sex were used to estimate race/ethnicity for students whose race/ethnicity was not reported. Excludes 799 men and 727 women whose racial/ethnic group and field of study were not available.NOTE: Data for associate's degrees by race/ethnicity were not available prior to 1984-85.SOURCE: U.S. Department of Education, National Center for Education Statistics, Higher Education General Information Surveys (HEGIS), "Degrees and Other Formal Awards Conferred" survey, 1984-85; and Integrated Postsecondary Education Data System (IPEDS) "Completions" surveys, various years. As published in NCES, Digest of Education Statistics: 1988, table 181, pp. 217-218, 1988; Digest of Education Statistics: 1990 , table 233, pp. 250-251, 1990; Digest of Education Statistics: 1992, table 248, p. 272, 1992; Digest of Education Statistics: 1993, table 254, p. 274, 1993; Digest of Education Statistics: 1994, table 253, p. 277, 1994; Digest of Education Statistics: 1995, table 258, p. 285, 1995; Digest of Education Statistics: 1996, table 257, p. 284, 1996; and Digest of Education Statistics: 1997, table 264, p. 294, 1997.
Table A4-2. Associate's degrees awarded to American Indians and Alaska Natives, by field of study: Selected years, 1984-85 to 1993-94
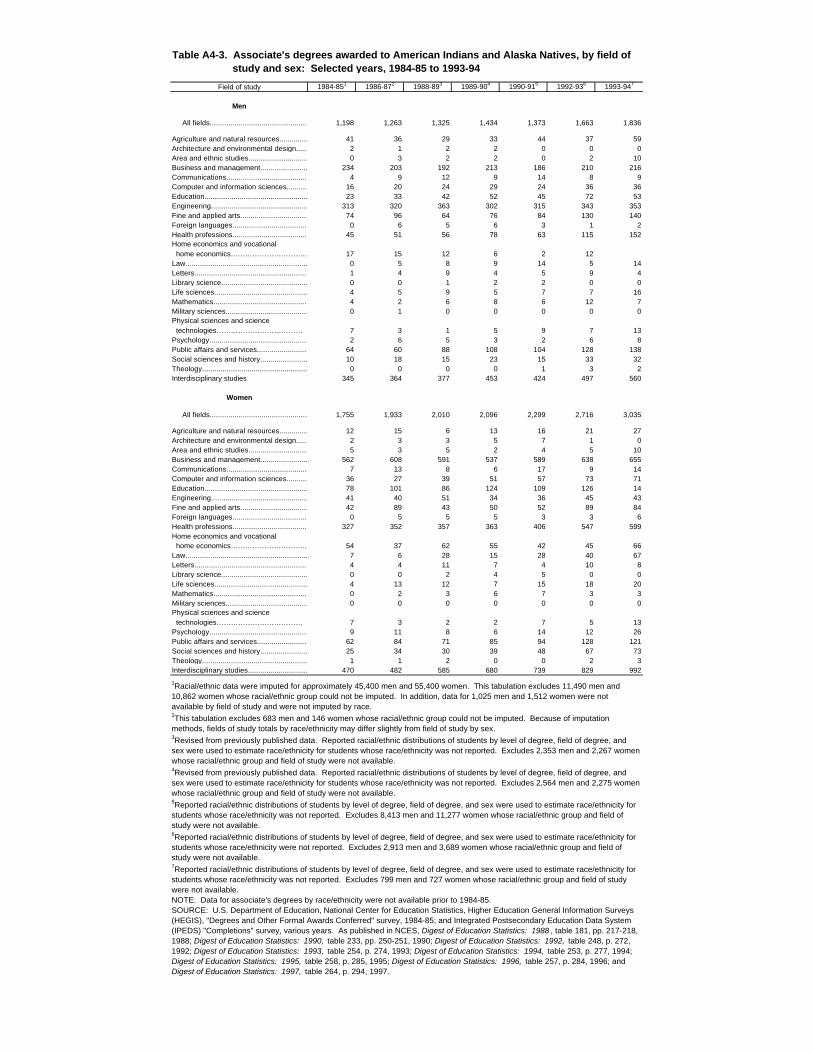
Field of study 1984-851 1986-872 1988-893 1989-904 1990-915 1992-936 1993-947
Men
All fields...........................................................................1,198 1,263 1,325 1,434 1,373 1,663 1,836
Agriculture and natural resources............................. 41 36 29 33 44 37 59Architecture and environmental design..................... 2 1 2 2 0 0 0Area and ethnic studies............................................. 0 3 2 2 0 2 10Business and management........................................234 203 192 213 186 210 216Communications......................................................... 4 9 12 9 14 8 9Computer and information sciences........................... 16 20 24 29 24 36 36Education................................................................... 23 33 42 52 45 72 53Engineering................................................................313 320 363 302 315 343 353Fine and applied arts................................................. 74 96 64 76 84 130 140Foreign languages.................................................... 0 6 5 6 3 1 2Health professions..................................................... 45 51 56 78 63 115 152Home economics and vocational home economics………………………….. 17 15 12 6 2 12Law............................................................................ 0 5 8 9 14 5 14Letters........................................................................ 1 4 9 4 5 9 4Library science.......................................................... 0 0 1 2 2 0 0Life sciences............................................................. 4 5 9 5 7 7 16Mathematics............................................................... 4 2 6 8 6 12 7Military sciences........................................................ 0 1 0 0 0 0 0Physical sciences and science technologies……………………………… 7 3 1 5 9 7 13Psychology................................................................ 2 6 5 3 2 6 8Public affairs and services........................................ 64 60 88 108 104 128 138Social sciences and history.........................................................10 18 15 23 15 33 32Theology.................................................................... 0 0 0 0 1 3 2Interdisciplinary studies 345 364 377 453 424 497 560
Women
All fields.........................................................................1,755 1,933 2,010 2,096 2,299 2,716 3,035
Agriculture and natural resources............................. 12 15 6 13 16 21 27Architecture and environmental design..................... 2 3 3 5 7 1 0Area and ethnic studies............................................. 5 3 5 2 4 5 10Business and management........................................562 608 591 537 589 638 655Communications......................................................... 7 13 8 6 17 9 14Computer and information sciences........................... 36 27 39 51 57 73 71Education................................................................... 78 101 86 124 109 126 14Engineering................................................................ 41 40 51 34 36 45 43Fine and applied arts................................................. 42 89 43 50 52 89 84Foreign languages.................................................... 0 5 5 5 3 3 6Health professions.....................................................327 352 357 363 406 547 599Home economics and vocational home economics………………………….. 54 37 62 55 42 45 66Law............................................................................ 7 6 28 15 28 40 67Letters........................................................................ 4 4 11 7 4 10 8Library science.......................................................... 0 0 2 4 5 0 0Life sciences............................................................. 4 13 12 7 15 18 20Mathematics............................................................... 0 2 3 6 7 3 3Military sciences........................................................ 0 0 0 0 0 0 0Physical sciences and science technologies……………………………… 7 3 2 2 7 5 13Psychology................................................................ 9 11 8 6 14 12 26Public affairs and services........................................ 62 84 71 85 94 128 121Social sciences and history.........................................................25 34 30 39 48 67 73Theology.................................................................... 1 1 2 0 0 2 3Interdisciplinary studies..............................................470 482 585 680 739 829 992
Table A4-3. Associate's degrees awarded to American Indians and Alaska Natives, by field of study and sex: Selected years, 1984-85 to 1993-94
1Racial/ethnic data were imputed for approximately 45,400 men and 55,400 women. This tabulation excludes 11,490 men and 10,862 women whose racial/ethnic group could not be imputed. In addition, data for 1,025 men and 1,512 women were not available by field of study and were not imputed by race.2This tabulation excludes 683 men and 146 women whose racial/ethnic group could not be imputed. Because of imputation methods, fields of study totals by race/ethnicity may differ slightly from field of study by sex.3Revised from previously published data. Reported racial/ethnic distributions of students by level of degree, field of degree, and sex were used to estimate race/ethnicity for students whose race/ethnicity was not reported. Excludes 2,353 men and 2,267 women whose racial/ethnic group and field of study were not available.4Revised from previously published data. Reported racial/ethnic distributions of students by level of degree, field of degree, and sex were used to estimate race/ethnicity for students whose race/ethnicity was not reported. Excludes 2,564 men and 2,275 women whose racial/ethnic group and field of study were not available.5Reported racial/ethnic distributions of students by level of degree, field of degree, and sex were used to estimate race/ethnicity for students whose race/ethnicity was not reported. Excludes 8,413 men and 11,277 women whose racial/ethnic group and field of study were not available.6Reported racial/ethnic distributions of students by level of degree, field of degree, and sex were used to estimate race/ethnicity for students whose race/ethnicity were not reported. Excludes 2,913 men and 3,689 women whose racial/ethnic group and field of study were not available.7Reported racial/ethnic distributions of students by level of degree, field of degree, and sex were used to estimate race/ethnicity for students whose race/ethnicity was not reported. Excludes 799 men and 727 women whose racial/ethnic group and field of study were not available.NOTE: Data for associate's degrees by race/ethnicity were not available prior to 1984-85.SOURCE: U.S. Department of Education, National Center for Education Statistics, Higher Education General Information Surveys (HEGIS), "Degrees and Other Formal Awards Conferred" survey, 1984-85; and Integrated Postsecondary Education Data System (IPEDS) "Completions" survey, various years. As published in NCES, Digest of Education Statistics: 1988 , table 181, pp. 217-218, 1988; Digest of Education Statistics: 1990, table 233, pp. 250-251, 1990; Digest of Education Statistics: 1992, table 248, p. 272, 1992; Digest of Education Statistics: 1993, table 254, p. 274, 1993; Digest of Education Statistics: 1994, table 253, p. 277, 1994; Digest of Education Statistics: 1995, table 258, p. 285, 1995; Digest of Education Statistics: 1996, table 257, p. 284, 1996; and Digest of Education Statistics: 1997, table 264, p. 294, 1997.
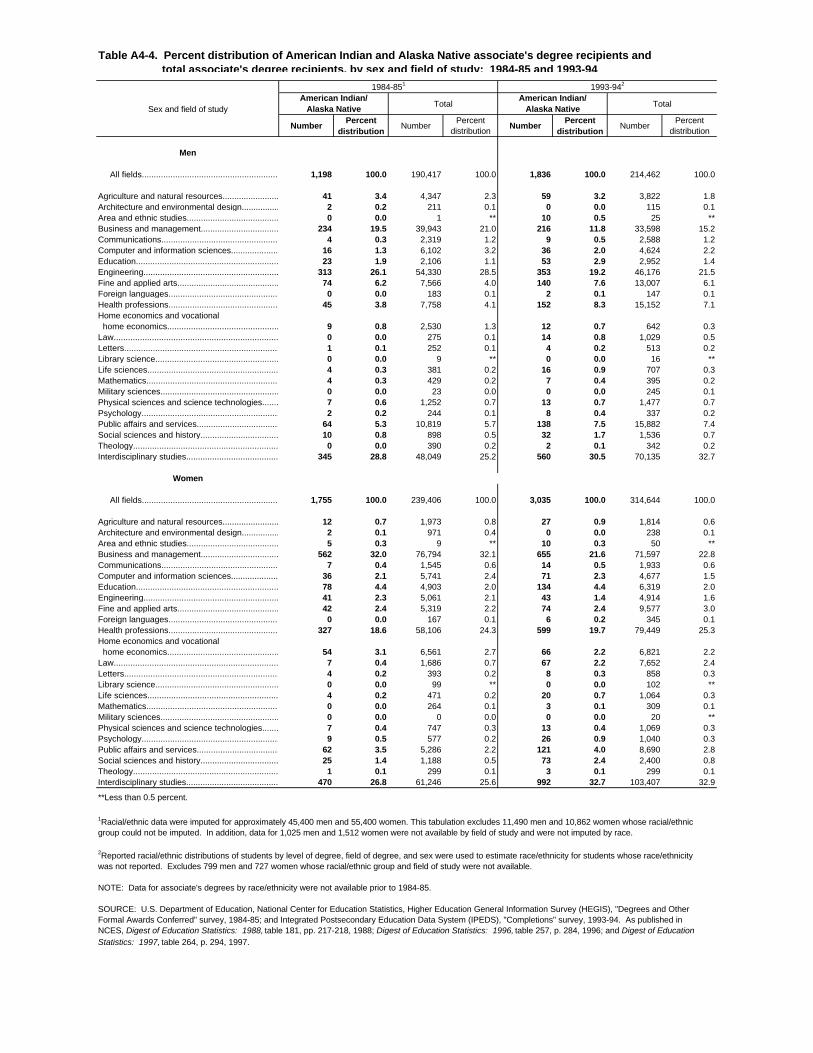
1984-851 1993-942
Sex and field of studyAmerican Indian/
Alaska NativeTotal
American Indian/Alaska Native
Total
NumberPercent
distributionNumber
Percent distribution
NumberPercent
distributionNumber
Percent distribution
Men
All fields...........................................................................1,198 100.0 190,417 100.0 1,836 100.0 214,462 100.0
Agriculture and natural resources............................. 41 3.4 4,347 2.3 59 3.2 3,822 1.8Architecture and environmental design..................... 2 0.2 211 0.1 0 0.0 115 0.1Area and ethnic studies............................................. 0 0.0 1 ** 10 0.5 25 **Business and management........................................ 234 19.5 39,943 21.0 216 11.8 33,598 15.2Communications......................................................……………………4 0.3 2,319 1.2 9 0.5 2,588 1.2Computer and information sciences........................... 16 1.3 6,102 3.2 36 2.0 4,624 2.2Education................................................................... 23 1.9 2,106 1.1 53 2.9 2,952 1.4Engineering................................................................ 313 26.1 54,330 28.5 353 19.2 46,176 21.5Fine and applied arts................................................. 74 6.2 7,566 4.0 140 7.6 13,007 6.1Foreign languages.................................................... 0 0.0 183 0.1 2 0.1 147 0.1Health professions..................................................... 45 3.8 7,758 4.1 152 8.3 15,152 7.1Home economics and vocational home economics....................................................... 9 0.8 2,530 1.3 12 0.7 642 0.3Law............................................................................ 0 0.0 275 0.1 14 0.8 1,029 0.5Letters........................................................................ 1 0.1 252 0.1 4 0.2 513 0.2Library science.......................................................... 0 0.0 9 ** 0 0.0 16 **Life sciences............................................................. 4 0.3 381 0.2 16 0.9 707 0.3Mathematics............................................................... 4 0.3 429 0.2 7 0.4 395 0.2Military sciences........................................................ 0 0.0 23 0.0 0 0.0 245 0.1Physical sciences and science technologies...............................................…7 0.6 1,252 0.7 13 0.7 1,477 0.7Psychology................................................................ 2 0.2 244 0.1 8 0.4 337 0.2Public affairs and services........................................ 64 5.3 10,819 5.7 138 7.5 15,882 7.4Social sciences and history.........................................................10 0.8 898 0.5 32 1.7 1,536 0.7Theology.................................................................... 0 0.0 390 0.2 2 0.1 342 0.2Interdisciplinary studies................................................ 345 28.8 48,049 25.2 560 30.5 70,135 32.7
Women
All fields.........................................................................1,755 100.0 239,406 100.0 3,035 100.0 314,644 100.0
Agriculture and natural resources............................. 12 0.7 1,973 0.8 27 0.9 1,814 0.6Architecture and environmental design..................... 2 0.1 971 0.4 0 0.0 238 0.1Area and ethnic studies............................................. 5 0.3 9 ** 10 0.3 50 **Business and management........................................ 562 32.0 76,794 32.1 655 21.6 71,597 22.8Communications......................................................... 7 0.4 1,545 0.6 14 0.5 1,933 0.6Computer and information sciences........................... 36 2.1 5,741 2.4 71 2.3 4,677 1.5Education................................................................... 78 4.4 4,903 2.0 134 4.4 6,319 2.0Engineering................................................................ 41 2.3 5,061 2.1 43 1.4 4,914 1.6Fine and applied arts................................................. 42 2.4 5,319 2.2 74 2.4 9,577 3.0Foreign languages.................................................... 0 0.0 167 0.1 6 0.2 345 0.1Health professions..................................................... 327 18.6 58,106 24.3 599 19.7 79,449 25.3Home economics and vocational home economics....................................................... 54 3.1 6,561 2.7 66 2.2 6,821 2.2Law............................................................................ 7 0.4 1,686 0.7 67 2.2 7,652 2.4Letters........................................................................ 4 0.2 393 0.2 8 0.3 858 0.3Library science.......................................................... 0 0.0 99 ** 0 0.0 102 **Life sciences............................................................. 4 0.2 471 0.2 20 0.7 1,064 0.3Mathematics............................................................... 0 0.0 264 0.1 3 0.1 309 0.1Military sciences........................................................ 0 0.0 0 0.0 0 0.0 20 **Physical sciences and science technologies................................................…7 0.4 747 0.3 13 0.4 1,069 0.3Psychology................................................................ 9 0.5 577 0.2 26 0.9 1,040 0.3Public affairs and services........................................ 62 3.5 5,286 2.2 121 4.0 8,690 2.8Social sciences and history.........................................................25 1.4 1,188 0.5 73 2.4 2,400 0.8Theology.................................................................... 1 0.1 299 0.1 3 0.1 299 0.1Interdisciplinary studies.............................................. 470 26.8 61,246 25.6 992 32.7 103,407 32.9
Table A4-4. Percent distribution of American Indian and Alaska Native associate's degree recipients and total associate's degree recipients, by sex and field of study: 1984-85 and 1993-94
**Less than 0.5 percent.
1Racial/ethnic data were imputed for approximately 45,400 men and 55,400 women. This tabulation excludes 11,490 men and 10,862 women whose racial/ethnic group could not be imputed. In addition, data for 1,025 men and 1,512 women were not available by field of study and were not imputed by race.
2Reported racial/ethnic distributions of students by level of degree, field of degree, and sex were used to estimate race/ethnicity for students whose race/ethnicity was not reported. Excludes 799 men and 727 women whose racial/ethnic group and field of study were not available.
NOTE: Data for associate's degrees by race/ethnicity were not available prior to 1984-85.
SOURCE: U.S. Department of Education, National Center for Education Statistics, Higher Education General Information Survey (HEGIS), "Degrees and Other Formal Awards Conferred" survey, 1984-85; and Integrated Postsecondary Education Data System (IPEDS), "Completions" survey, 1993-94. As published in NCES, Digest of Education Statistics: 1988, table 181, pp. 217-218, 1988; Digest of Education Statistics: 1996, table 257, p. 284, 1996; and Digest of Education Statistics: 1997, table 264, p. 294, 1997.
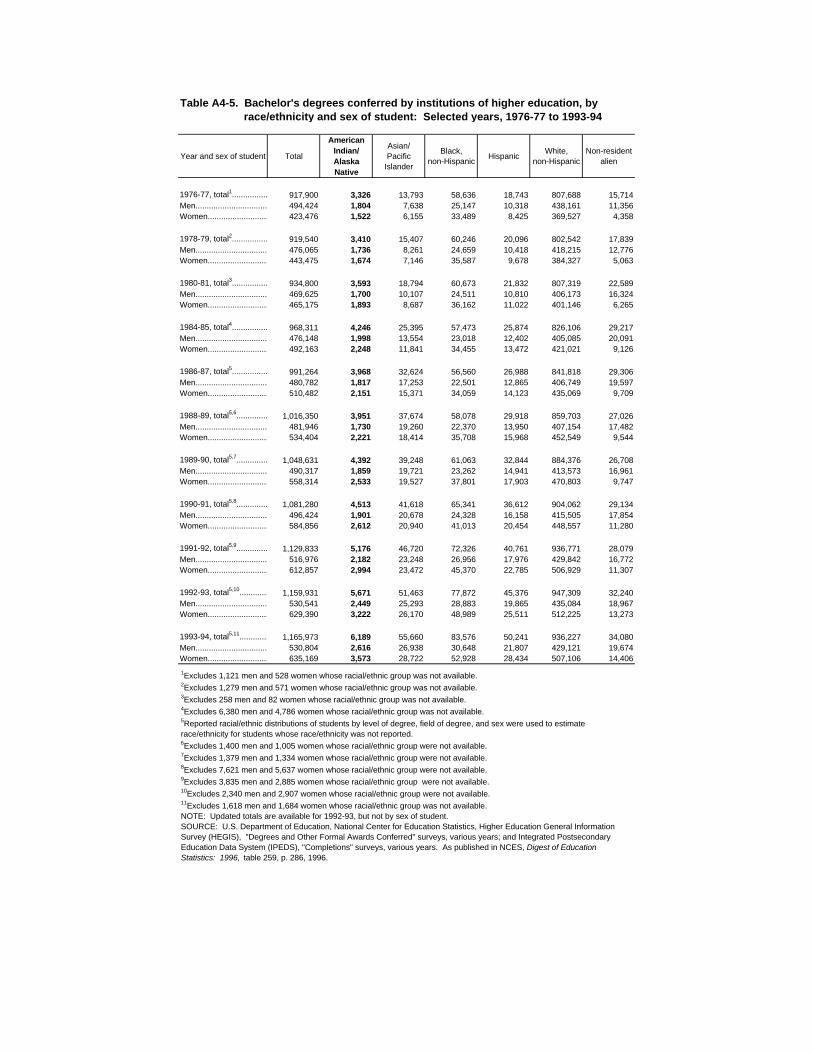
Year and sex of student Total
American Indian/Alaska Native
Asian/Pacific
Islander
Black,non-Hispanic
HispanicWhite,
non-HispanicNon-resident
alien
1976-77, total1................................917,900 3,326 13,793 58,636 18,743 807,688 15,714Men...................................... 494,424 1,804 7,638 25,147 10,318 438,161 11,356Women............................. 423,476 1,522 6,155 33,489 8,425 369,527 4,358
1978-79, total2...................................919,540 3,410 15,407 60,246 20,096 802,542 17,839Men...................................... 476,065 1,736 8,261 24,659 10,418 418,215 12,776Women............................. 443,475 1,674 7,146 35,587 9,678 384,327 5,063
1980-81, total3..................................934,800 3,593 18,794 60,673 21,832 807,319 22,589Men...................................... 469,625 1,700 10,107 24,511 10,810 406,173 16,324Women............................. 465,175 1,893 8,687 36,162 11,022 401,146 6,265
1984-85, total4....................................968,311 4,246 25,395 57,473 25,874 826,106 29,217Men...................................... 476,148 1,998 13,554 23,018 12,402 405,085 20,091Women............................. 492,163 2,248 11,841 34,455 13,472 421,021 9,126
1986-87, total5.................................991,264 3,968 32,624 56,560 26,988 841,818 29,306Men...................................... 480,782 1,817 17,253 22,501 12,865 406,749 19,597Women............................. 510,482 2,151 15,371 34,059 14,123 435,069 9,709
1988-89, total5,6...............................1,016,350 3,951 37,674 58,078 29,918 859,703 27,026Men...................................... 481,946 1,730 19,260 22,370 13,950 407,154 17,482Women............................. 534,404 2,221 18,414 35,708 15,968 452,549 9,544
1989-90, total5,7...............................1,048,631 4,392 39,248 61,063 32,844 884,376 26,708Men...................................... 490,317 1,859 19,721 23,262 14,941 413,573 16,961Women............................. 558,314 2,533 19,527 37,801 17,903 470,803 9,747
1990-91, total5,8.................................1,081,280 4,513 41,618 65,341 36,612 904,062 29,134Men...................................... 496,424 1,901 20,678 24,328 16,158 415,505 17,854Women............................. 584,856 2,612 20,940 41,013 20,454 448,557 11,280
1991-92, total5,9................................1,129,833 5,176 46,720 72,326 40,761 936,771 28,079Men...................................... 516,976 2,182 23,248 26,956 17,976 429,842 16,772Women............................. 612,857 2,994 23,472 45,370 22,785 506,929 11,307
1992-93, total5,10.................................1,159,931 5,671 51,463 77,872 45,376 947,309 32,240Men...................................... 530,541 2,449 25,293 28,883 19,865 435,084 18,967Women............................. 629,390 3,222 26,170 48,989 25,511 512,225 13,273
1993-94, total5,11.................................1,165,973 6,189 55,660 83,576 50,241 936,227 34,080Men...................................... 530,804 2,616 26,938 30,648 21,807 429,121 19,674Women............................. 635,169 3,573 28,722 52,928 28,434 507,106 14,406
1Excludes 1,121 men and 528 women whose racial/ethnic group was not available.2Excludes 1,279 men and 571 women whose racial/ethnic group was not available.3Excludes 258 men and 82 women whose racial/ethnic group was not available.4Excludes 6,380 men and 4,786 women whose racial/ethnic group was not available.5Reported racial/ethnic distributions of students by level of degree, field of degree, and sex were used to estimate race/ethnicity for students whose race/ethnicity was not reported. 6Excludes 1,400 men and 1,005 women whose racial/ethnic group were not available.7Excludes 1,379 men and 1,334 women whose racial/ethnic group were not available.8Excludes 7,621 men and 5,637 women whose racial/ethnic group were not available.9Excludes 3,835 men and 2,885 women whose racial/ethnic group were not available.10Excludes 2,340 men and 2,907 women whose racial/ethnic group were not available.11Excludes 1,618 men and 1,684 women whose racial/ethnic group was not available.NOTE: Updated totals are available for 1992-93, but not by sex of student.SOURCE: U.S. Department of Education, National Center for Education Statistics, Higher Education General Information Survey (HEGIS), "Degrees and Other Formal Awards Conferred" surveys, various years; and Integrated Postsecondary Education Data System (IPEDS), "Completions" surveys, various years. As published in NCES, Digest of Education Statistics: 1996, table 259, p. 286, 1996.
Table A4-5. Bachelor's degrees conferred by institutions of higher education, by race/ethnicity and sex of student: Selected years, 1976-77 to 1993-94
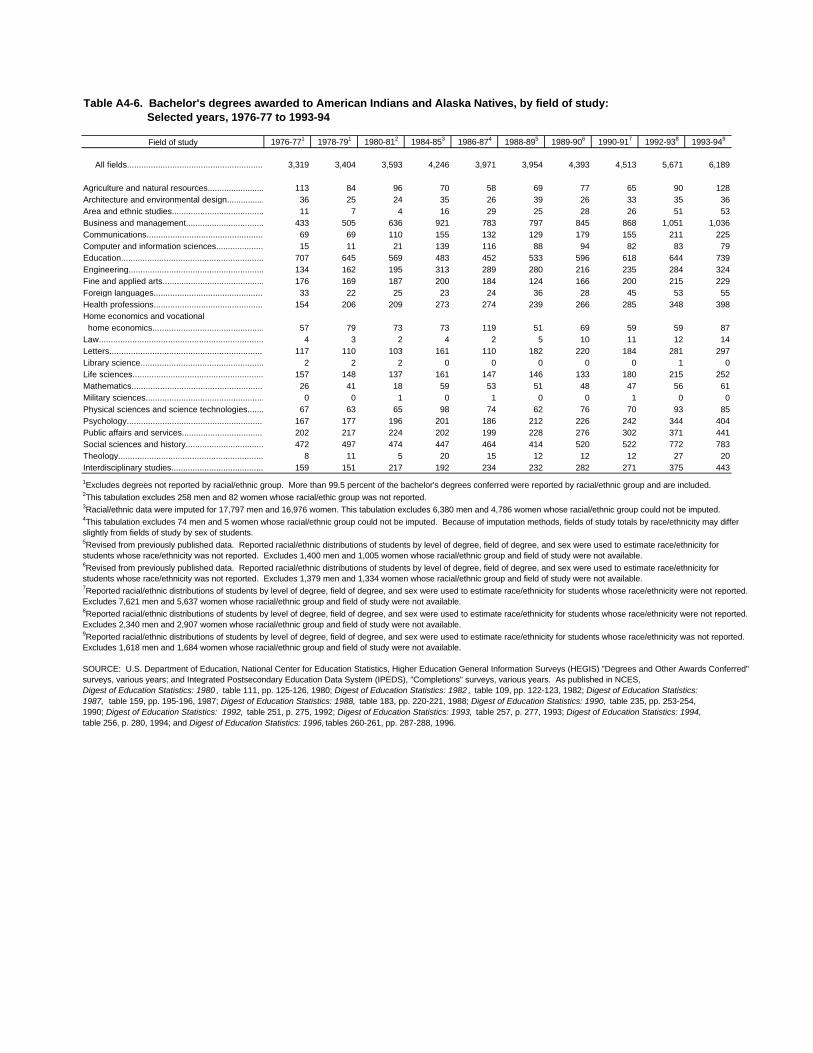
Field of study 1976-771 1978-791 1980-812 1984-853 1986-874 1988-895 1989-906 1990-917 1992-938 1993-949
All fields................................................................................3,319 3,404 3,593 4,246 3,971 3,954 4,393 4,513 5,671 6,189
Agriculture and natural resources............................. 113 84 96 70 58 69 77 65 90 128Architecture and environmental design..................... 36 25 24 35 26 39 26 33 35 36Area and ethnic studies............................................. 11 7 4 16 29 25 28 26 51 53Business and management........................................ 433 505 636 921 783 797 845 868 1,051 1,036Communications......................................................... 69 69 110 155 132 129 179 155 211 225Computer and information sciences........................... 15 11 21 139 116 88 94 82 83 79Education................................................................... 707 645 569 483 452 533 596 618 644 739Engineering................................................................ 134 162 195 313 289 280 216 235 284 324Fine and applied arts................................................. 176 169 187 200 184 124 166 200 215 229Foreign languages.................................................... 33 22 25 23 24 36 28 45 53 55Health professions..................................................... 154 206 209 273 274 239 266 285 348 398Home economics and vocational home economics....................................................... 57 79 73 73 119 51 69 59 59 87Law............................................................................ 4 3 2 4 2 5 10 11 12 14Letters........................................................................ 117 110 103 161 110 182 220 184 281 297Library science.......................................................... 2 2 2 0 0 0 0 0 1 0Life sciences............................................................. 157 148 137 161 147 146 133 180 215 252Mathematics............................................................... 26 41 18 59 53 51 48 47 56 61Military sciences........................................................ 0 0 1 0 1 0 0 1 0 0Physical sciences and science technologies......................................................67 63 65 98 74 62 76 70 93 85Psychology................................................................ 167 177 196 201 186 212 226 242 344 404Public affairs and services........................................ 202 217 224 202 199 228 276 302 371 441Social sciences and history.........................................................472 497 474 447 464 414 520 522 772 783Theology.................................................................... 8 11 5 20 15 12 12 12 27 20Interdisciplinary studies.............................................. 159 151 217 192 234 232 282 271 375 443
1Excludes degrees not reported by racial/ethnic group. More than 99.5 percent of the bachelor's degrees conferred were reported by racial/ethnic group and are included.2This tabulation excludes 258 men and 82 women whose racial/ethic group was not reported.3Racial/ethnic data were imputed for 17,797 men and 16,976 women. This tabulation excludes 6,380 men and 4,786 women whose racial/ethnic group could not be imputed. 4This tabulation excludes 74 men and 5 women whose racial/ethnic group could not be imputed. Because of imputation methods, fields of study totals by race/ethnicity may differ slightly from fields of study by sex of students.5Revised from previously published data. Reported racial/ethnic distributions of students by level of degree, field of degree, and sex were used to estimate race/ethnicity for students whose race/ethnicity was not reported. Excludes 1,400 men and 1,005 women whose racial/ethnic group and field of study were not available.6Revised from previously published data. Reported racial/ethnic distributions of students by level of degree, field of degree, and sex were used to estimate race/ethnicity for students whose race/ethnicity was not reported. Excludes 1,379 men and 1,334 women whose racial/ethnic group and field of study were not available.7Reported racial/ethnic distributions of students by level of degree, field of degree, and sex were used to estimate race/ethnicity for students whose race/ethnicity were not reported. Excludes 7,621 men and 5,637 women whose racial/ethnic group and field of study were not available.8Reported racial/ethnic distributions of students by level of degree, field of degree, and sex were used to estimate race/ethnicity for students whose race/ethnicity were not reported. Excludes 2,340 men and 2,907 women whose racial/ethnic group and field of study were not available.9Reported racial/ethnic distributions of students by level of degree, field of degree, and sex were used to estimate race/ethnicity for students whose race/ethnicity was not reported. Excludes 1,618 men and 1,684 women whose racial/ethnic group and field of study were not available.
SOURCE: U.S. Department of Education, National Center for Education Statistics, Higher Education General Information Surveys (HEGIS) "Degrees and Other Awards Conferred" surveys, various years; and Integrated Postsecondary Education Data System (IPEDS), "Completions" surveys, various years. As published in NCES,Digest of Education Statistics: 1980 , table 111, pp. 125-126, 1980; Digest of Education Statistics: 1982 , table 109, pp. 122-123, 1982; Digest of Education Statistics:1987, table 159, pp. 195-196, 1987; Digest of Education Statistics: 1988, table 183, pp. 220-221, 1988; Digest of Education Statistics: 1990, table 235, pp. 253-254,1990; Digest of Education Statistics: 1992, table 251, p. 275, 1992; Digest of Education Statistics: 1993, table 257, p. 277, 1993; Digest of Education Statistics: 1994,table 256, p. 280, 1994; and Digest of Education Statistics: 1996, tables 260-261, pp. 287-288, 1996.
Table A4-6. Bachelor's degrees awarded to American Indians and Alaska Natives, by field of study: Selected years, 1976-77 to 1993-94
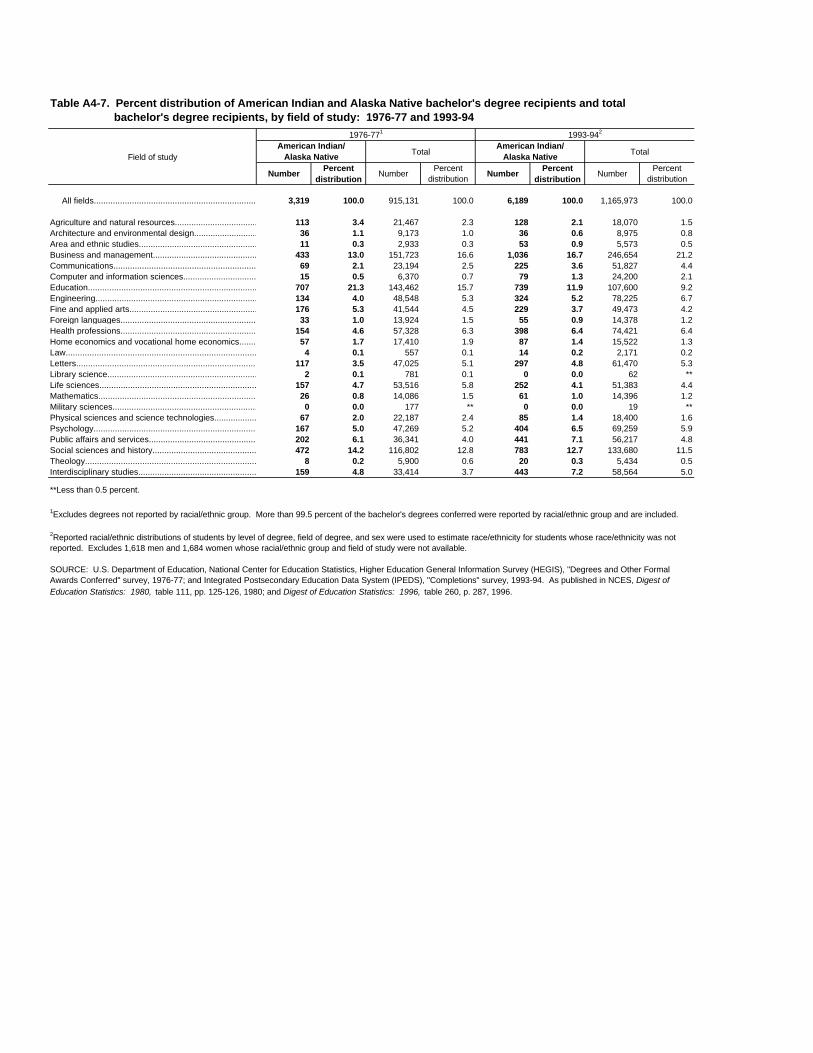
1976-771 1993-942
Field of studyAmerican Indian/
Alaska NativeTotal
American Indian/Alaska Native
Total
NumberPercent
distributionNumber
Percent distribution
NumberPercent
distributionNumber
Percent distribution
All fields............................................................................. 3,319 100.0 915,131 100.0 6,189 100.0 1,165,973 100.0
Agriculture and natural resources............................................. 113 3.4 21,467 2.3 128 2.1 18,070 1.5Architecture and environmental design................................. 36 1.1 9,173 1.0 36 0.6 8,975 0.8Area and ethnic studies............................................................. 11 0.3 2,933 0.3 53 0.9 5,573 0.5Business and management...................................................... 433 13.0 151,723 16.6 1,036 16.7 246,654 21.2Communications......................................................................... 69 2.1 23,194 2.5 225 3.6 51,827 4.4Computer and information sciences...................................... 15 0.5 6,370 0.7 79 1.3 24,200 2.1Education...................................................................................... 707 21.3 143,462 15.7 739 11.9 107,600 9.2Engineering............................................................................... 134 4.0 48,548 5.3 324 5.2 78,225 6.7Fine and applied arts................................................................ 176 5.3 41,544 4.5 229 3.7 49,473 4.2Foreign languages................................................................... 33 1.0 13,924 1.5 55 0.9 14,378 1.2Health professions.................................................................... 154 4.6 57,328 6.3 398 6.4 74,421 6.4Home economics and vocational home economics.........................................................................57 1.7 17,410 1.9 87 1.4 15,522 1.3Law.............................................................................................. 4 0.1 557 0.1 14 0.2 2,171 0.2Letters............................................................................................117 3.5 47,025 5.1 297 4.8 61,470 5.3Library science............................................................................ 2 0.1 781 0.1 0 0.0 62 **Life sciences................................................................................. 157 4.7 53,516 5.8 252 4.1 51,383 4.4Mathematics................................................................................... 26 0.8 14,086 1.5 61 1.0 14,396 1.2Military sciences............................................................................. 0 0.0 177 ** 0 0.0 19 **Physical sciences and science technologies......................................................67 2.0 22,187 2.4 85 1.4 18,400 1.6Psychology................................................................................... 167 5.0 47,269 5.2 404 6.5 69,259 5.9Public affairs and services........................................................ 202 6.1 36,341 4.0 441 7.1 56,217 4.8Social sciences and history......................................................... 472 14.2 116,802 12.8 783 12.7 133,680 11.5Theology....................................................................................... 8 0.2 5,900 0.6 20 0.3 5,434 0.5Interdisciplinary studies............................................................. 159 4.8 33,414 3.7 443 7.2 58,564 5.0
Table A4-7. Percent distribution of American Indian and Alaska Native bachelor's degree recipients and total bachelor's degree recipients, by field of study: 1976-77 and 1993-94
**Less than 0.5 percent.
1Excludes degrees not reported by racial/ethnic group. More than 99.5 percent of the bachelor's degrees conferred were reported by racial/ethnic group and are included.
2Reported racial/ethnic distributions of students by level of degree, field of degree, and sex were used to estimate race/ethnicity for students whose race/ethnicity was not reported. Excludes 1,618 men and 1,684 women whose racial/ethnic group and field of study were not available.
SOURCE: U.S. Department of Education, National Center for Education Statistics, Higher Education General Information Survey (HEGIS), "Degrees and Other Formal Awards Conferred" survey, 1976-77; and Integrated Postsecondary Education Data System (IPEDS), "Completions" survey, 1993-94. As published in NCES, Digest of Education Statistics: 1980, table 111, pp. 125-126, 1980; and Digest of Education Statistics: 1996, table 260, p. 287, 1996.
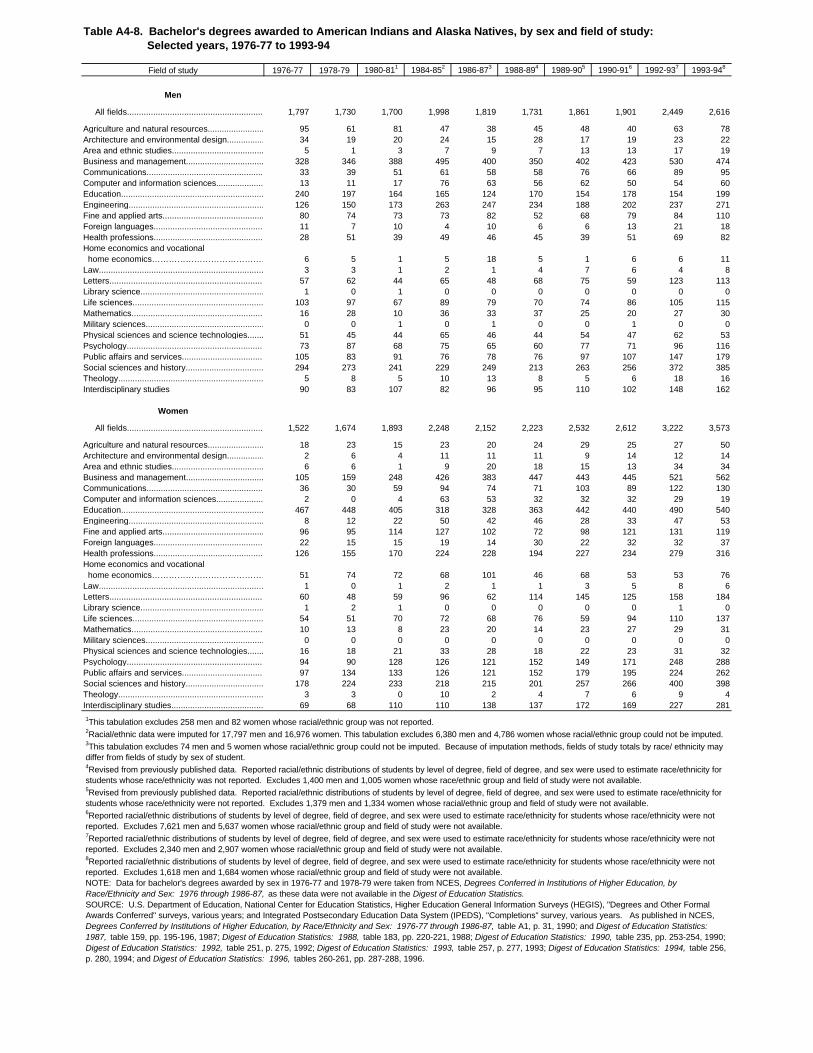
Field of study 1976-77 1978-79 1980-811 1984-852 1986-873 1988-894 1989-905 1990-916 1992-937 1993-948
Men
All fields...........................................................................1,797 1,730 1,700 1,998 1,819 1,731 1,861 1,901 2,449 2,616
Agriculture and natural resources............................. 95 61 81 47 38 45 48 40 63 78Architecture and environmental design..................... 34 19 20 24 15 28 17 19 23 22Area and ethnic studies............................................. 5 1 3 7 9 7 13 13 17 19Business and management........................................ 328 346 388 495 400 350 402 423 530 474Communications......................................................... 33 39 51 61 58 58 76 66 89 95Computer and information sciences........................... 13 11 17 76 63 56 62 50 54 60Education................................................................... 240 197 164 165 124 170 154 178 154 199Engineering................................................................ 126 150 173 263 247 234 188 202 237 271Fine and applied arts................................................. 80 74 73 73 82 52 68 79 84 110Foreign languages.................................................... 11 7 10 4 10 6 6 13 21 18Health professions..................................................... 28 51 39 49 46 45 39 51 69 82Home economics and vocational home economics…………………………………….. 6 5 1 5 18 5 1 6 6 11Law............................................................................ 3 3 1 2 1 4 7 6 4 8Letters........................................................................ 57 62 44 65 48 68 75 59 123 113Library science.......................................................... 1 0 1 0 0 0 0 0 0 0Life sciences............................................................. 103 97 67 89 79 70 74 86 105 115Mathematics............................................................... 16 28 10 36 33 37 25 20 27 30Military sciences........................................................ 0 0 1 0 1 0 0 1 0 0Physical sciences and science technologies......................................................51 45 44 65 46 44 54 47 62 53Psychology................................................................ 73 87 68 75 65 60 77 71 96 116Public affairs and services........................................ 105 83 91 76 78 76 97 107 147 179Social sciences and history.........................................................294 273 241 229 249 213 263 256 372 385Theology.................................................................... 5 8 5 10 13 8 5 6 18 16Interdisciplinary studies 90 83 107 82 96 95 110 102 148 162
Women
All fields.........................................................................1,522 1,674 1,893 2,248 2,152 2,223 2,532 2,612 3,222 3,573
Agriculture and natural resources............................. 18 23 15 23 20 24 29 25 27 50Architecture and environmental design..................... 2 6 4 11 11 11 9 14 12 14Area and ethnic studies............................................. 6 6 1 9 20 18 15 13 34 34Business and management........................................ 105 159 248 426 383 447 443 445 521 562Communications......................................................... 36 30 59 94 74 71 103 89 122 130Computer and information sciences........................... 2 0 4 63 53 32 32 32 29 19Education................................................................... 467 448 405 318 328 363 442 440 490 540Engineering................................................................ 8 12 22 50 42 46 28 33 47 53Fine and applied arts................................................. 96 95 114 127 102 72 98 121 131 119Foreign languages.................................................... 22 15 15 19 14 30 22 32 32 37Health professions..................................................... 126 155 170 224 228 194 227 234 279 316Home economics and vocational home economics…………………………………….. 51 74 72 68 101 46 68 53 53 76Law............................................................................ 1 0 1 2 1 1 3 5 8 6Letters........................................................................ 60 48 59 96 62 114 145 125 158 184Library science.......................................................... 1 2 1 0 0 0 0 0 1 0Life sciences............................................................. 54 51 70 72 68 76 59 94 110 137Mathematics............................................................... 10 13 8 23 20 14 23 27 29 31Military sciences........................................................ 0 0 0 0 0 0 0 0 0 0Physical sciences and science technologies......................................................16 18 21 33 28 18 22 23 31 32Psychology................................................................ 94 90 128 126 121 152 149 171 248 288Public affairs and services........................................ 97 134 133 126 121 152 179 195 224 262Social sciences and history.........................................................178 224 233 218 215 201 257 266 400 398Theology.................................................................... 3 3 0 10 2 4 7 6 9 4Interdisciplinary studies.............................................. 69 68 110 110 138 137 172 169 227 281
1This tabulation excludes 258 men and 82 women whose racial/ethnic group was not reported.2Racial/ethnic data were imputed for 17,797 men and 16,976 women. This tabulation excludes 6,380 men and 4,786 women whose racial/ethnic group could not be imputed.3This tabulation excludes 74 men and 5 women whose racial/ethnic group could not be imputed. Because of imputation methods, fields of study totals by race/ ethnicity may differ from fields of study by sex of student.4Revised from previously published data. Reported racial/ethnic distributions of students by level of degree, field of degree, and sex were used to estimate race/ethnicity for students whose race/ethnicity was not reported. Excludes 1,400 men and 1,005 women whose race/ethnic group and field of study were not available.5Revised from previously published data. Reported racial/ethnic distributions of students by level of degree, field of degree, and sex were used to estimate race/ethnicity for students whose race/ethnicity were not reported. Excludes 1,379 men and 1,334 women whose racial/ethnic group and field of study were not available.6Reported racial/ethnic distributions of students by level of degree, field of degree, and sex were used to estimate race/ethnicity for students whose race/ethnicity were not reported. Excludes 7,621 men and 5,637 women whose racial/ethnic group and field of study were not available.7Reported racial/ethnic distributions of students by level of degree, field of degree, and sex were used to estimate race/ethnicity for students whose race/ethnicity were not reported. Excludes 2,340 men and 2,907 women whose racial/ethnic group and field of study were not available.8Reported racial/ethnic distributions of students by level of degree, field of degree, and sex were used to estimate race/ethnicity for students whose race/ethnicity were not reported. Excludes 1,618 men and 1,684 women whose racial/ethnic group and field of study were not available.NOTE: Data for bachelor's degrees awarded by sex in 1976-77 and 1978-79 were taken from NCES, Degrees Conferred in Institutions of Higher Education, by Race/Ethnicity and Sex: 1976 through 1986-87, as these data were not available in the Digest of Education Statistics.SOURCE: U.S. Department of Education, National Center for Education Statistics, Higher Education General Information Surveys (HEGIS), "Degrees and Other Formal Awards Conferred" surveys, various years; and Integrated Postsecondary Education Data System (IPEDS), "Completions" survey, various years. As published in NCES, Degrees Conferred by Institutions of Higher Education, by Race/Ethnicity and Sex: 1976-77 through 1986-87, table A1, p. 31, 1990; and Digest of Education Statistics: 1987, table 159, pp. 195-196, 1987; Digest of Education Statistics: 1988, table 183, pp. 220-221, 1988; Digest of Education Statistics: 1990, table 235, pp. 253-254, 1990; Digest of Education Statistics: 1992, table 251, p. 275, 1992; Digest of Education Statistics: 1993, table 257, p. 277, 1993; Digest of Education Statistics: 1994, table 256, p. 280, 1994; and Digest of Education Statistics: 1996, tables 260-261, pp. 287-288, 1996.
Table A4-8. Bachelor's degrees awarded to American Indians and Alaska Natives, by sex and field of study: Selected years, 1976-77 to 1993-94
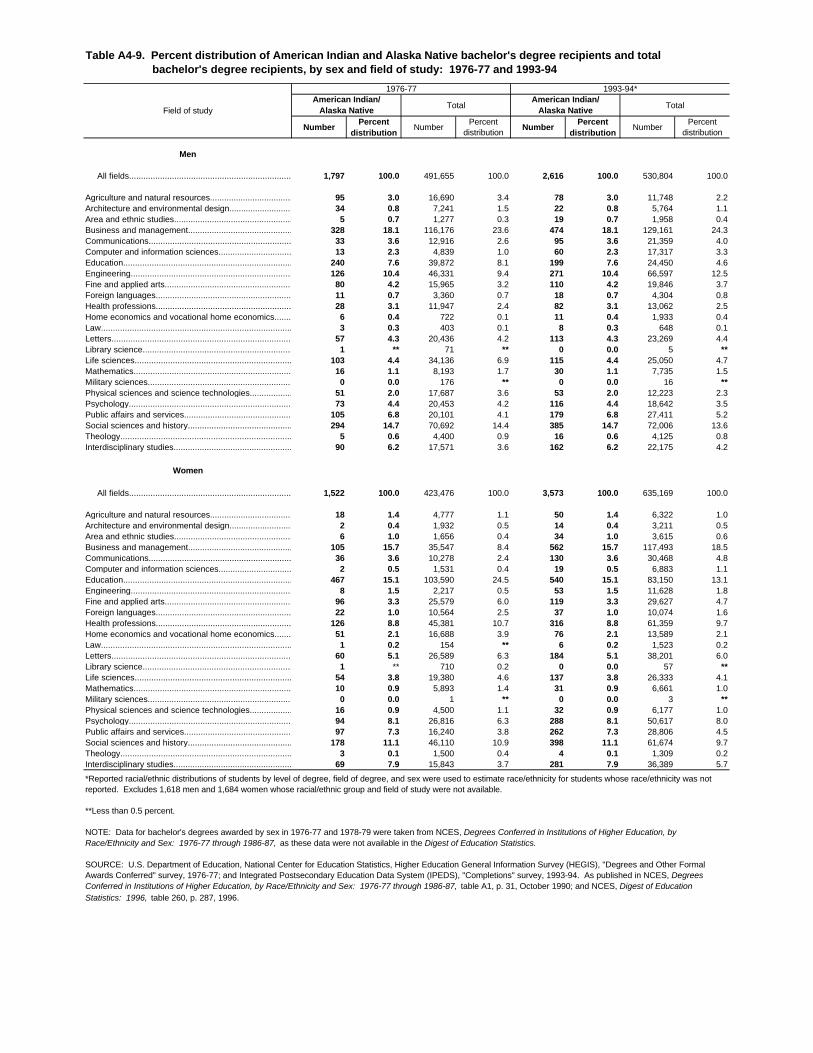
1976-77 1993-94*
Field of studyAmerican Indian/
Alaska NativeTotal
American Indian/Alaska Native
Total
NumberPercent
distributionNumber
Percent distribution
NumberPercent
distributionNumber
Percent distribution
Men
All fields........................................................................... 1,797 100.0 491,655 100.0 2,616 100.0 530,804 100.0
Agriculture and natural resources......................................... 95 3.0 16,690 3.4 78 3.0 11,748 2.2Architecture and environmental design................................ 34 0.8 7,241 1.5 22 0.8 5,764 1.1Area and ethnic studies......................................................... 5 0.7 1,277 0.3 19 0.7 1,958 0.4Business and management................................................... 328 18.1 116,176 23.6 474 18.1 129,161 24.3Communications..................................................................... 33 3.6 12,916 2.6 95 3.6 21,359 4.0Computer and information sciences..................................... 13 2.3 4,839 1.0 60 2.3 17,317 3.3Education..................................................................................... 240 7.6 39,872 8.1 199 7.6 24,450 4.6Engineering.............................................................................. 126 10.4 46,331 9.4 271 10.4 66,597 12.5Fine and applied arts................................................................. 80 4.2 15,965 3.2 110 4.2 19,846 3.7Foreign languages................................................................. 11 0.7 3,360 0.7 18 0.7 4,304 0.8Health professions................................................................... 28 3.1 11,947 2.4 82 3.1 13,062 2.5Home economics and vocational home economics...................................................................6 0.4 722 0.1 11 0.4 1,933 0.4Law.............................................................................................. 3 0.3 403 0.1 8 0.3 648 0.1Letters.......................................................................................... 57 4.3 20,436 4.2 113 4.3 23,269 4.4Library science.......................................................................... 1 ** 71 ** 0 0.0 5 **Life sciences............................................................................... 103 4.4 34,136 6.9 115 4.4 25,050 4.7Mathematics............................................................................... 16 1.1 8,193 1.7 30 1.1 7,735 1.5Military sciences......................................................................... 0 0.0 176 ** 0 0.0 16 **Physical sciences and science technologies.....................................................................51 2.0 17,687 3.6 53 2.0 12,223 2.3Psychology................................................................................... 73 4.4 20,453 4.2 116 4.4 18,642 3.5Public affairs and services....................................................... 105 6.8 20,101 4.1 179 6.8 27,411 5.2Social sciences and history..........................................................................294 14.7 70,692 14.4 385 14.7 72,006 13.6Theology......................................................................................... 5 0.6 4,400 0.9 16 0.6 4,125 0.8Interdisciplinary studies................................................................. 90 6.2 17,571 3.6 162 6.2 22,175 4.2
Women
All fields......................................................................... 1,522 100.0 423,476 100.0 3,573 100.0 635,169 100.0
Agriculture and natural resources............................................. 18 1.4 4,777 1.1 50 1.4 6,322 1.0Architecture and environmental design.................................... 2 0.4 1,932 0.5 14 0.4 3,211 0.5Area and ethnic studies............................................................. 6 1.0 1,656 0.4 34 1.0 3,615 0.6Business and management..................................................... 105 15.7 35,547 8.4 562 15.7 117,493 18.5Communications........................................................................ 36 3.6 10,278 2.4 130 3.6 30,468 4.8Computer and information sciences........................................ 2 0.5 1,531 0.4 19 0.5 6,883 1.1Education........................................................................................467 15.1 103,590 24.5 540 15.1 83,150 13.1Engineering.................................................................................... 8 1.5 2,217 0.5 53 1.5 11,628 1.8Fine and applied arts................................................................... 96 3.3 25,579 6.0 119 3.3 29,627 4.7Foreign languages...................................................................... 22 1.0 10,564 2.5 37 1.0 10,074 1.6Health professions.................................................................... 126 8.8 45,381 10.7 316 8.8 61,359 9.7Home economics and vocational home economics.......................................................................51 2.1 16,688 3.9 76 2.1 13,589 2.1Law............................................................................................... 1 0.2 154 ** 6 0.2 1,523 0.2Letters....................................................................................... 60 5.1 26,589 6.3 184 5.1 38,201 6.0Library science.......................................................................... 1 ** 710 0.2 0 0.0 57 **Life sciences............................................................................. 54 3.8 19,380 4.6 137 3.8 26,333 4.1Mathematics................................................................................. 10 0.9 5,893 1.4 31 0.9 6,661 1.0Military sciences........................................................................ 0 0.0 1 ** 0 0.0 3 **Physical sciences and science technologies....................................................................16 0.9 4,500 1.1 32 0.9 6,177 1.0Psychology................................................................................ 94 8.1 26,816 6.3 288 8.1 50,617 8.0Public affairs and services...................................................... 97 7.3 16,240 3.8 262 7.3 28,806 4.5Social sciences and history.........................................................................178 11.1 46,110 10.9 398 11.1 61,674 9.7Theology..................................................................................... 3 0.1 1,500 0.4 4 0.1 1,309 0.2Interdisciplinary studies............................................................ 69 7.9 15,843 3.7 281 7.9 36,389 5.7
Table A4-9. Percent distribution of American Indian and Alaska Native bachelor's degree recipients and total bachelor's degree recipients, by sex and field of study: 1976-77 and 1993-94
*Reported racial/ethnic distributions of students by level of degree, field of degree, and sex were used to estimate race/ethnicity for students whose race/ethnicity was not reported. Excludes 1,618 men and 1,684 women whose racial/ethnic group and field of study were not available.
**Less than 0.5 percent.
NOTE: Data for bachelor's degrees awarded by sex in 1976-77 and 1978-79 were taken from NCES, Degrees Conferred in Institutions of Higher Education, by Race/Ethnicity and Sex: 1976-77 through 1986-87, as these data were not available in the Digest of Education Statistics.
SOURCE: U.S. Department of Education, National Center for Education Statistics, Higher Education General Information Survey (HEGIS), "Degrees and Other Formal Awards Conferred" survey, 1976-77; and Integrated Postsecondary Education Data System (IPEDS), "Completions" survey, 1993-94. As published in NCES, Degrees Conferred in Institutions of Higher Education, by Race/Ethnicity and Sex: 1976-77 through 1986-87, table A1, p. 31, October 1990; and NCES, Digest of Education Statistics: 1996, table 260, p. 287, 1996.
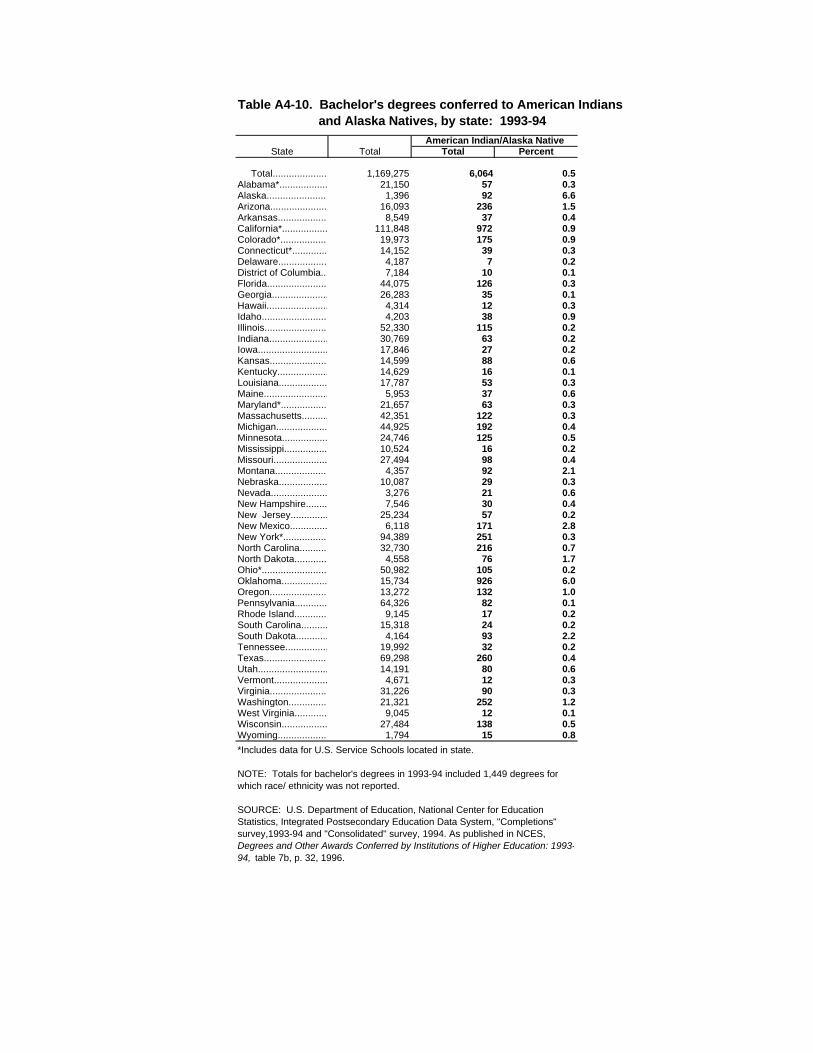
American Indian/Alaska NativeState Total Total Percent
Total.......................................1,169,275 6,064 0.5Alabama*..................................... 21,150 57 0.3Alaska...................................... 1,396 92 6.6Arizona................................. 16,093 236 1.5Arkansas............................... 8,549 37 0.4California*................................. 111,848 972 0.9Colorado*................................. 19,973 175 0.9Connecticut*........................... 14,152 39 0.3Delaware................................ 4,187 7 0.2District of Columbia.................. 7,184 10 0.1Florida.................................. 44,075 126 0.3Georgia................................... 26,283 35 0.1Hawaii..................................... 4,314 12 0.3Idaho..................................... 4,203 38 0.9Illinois.................................... 52,330 115 0.2Indiana.................................. 30,769 63 0.2Iowa...................................... 17,846 27 0.2Kansas................................. 14,599 88 0.6Kentucky................................ 14,629 16 0.1Louisiana............................... 17,787 53 0.3Maine....................................... 5,953 37 0.6Maryland*................................. 21,657 63 0.3Massachusetts...................... 42,351 122 0.3Michigan................................. 44,925 192 0.4Minnesota............................. 24,746 125 0.5Mississippi........................... 10,524 16 0.2Missouri............................... 27,494 98 0.4Montana................................ 4,357 92 2.1Nebraska.............................. 10,087 29 0.3Nevada.................................... 3,276 21 0.6New Hampshire................... 7,546 30 0.4New Jersey............................. 25,234 57 0.2New Mexico........................... 6,118 171 2.8New York*.............................. 94,389 251 0.3North Carolina......................... 32,730 216 0.7North Dakota.......................... 4,558 76 1.7Ohio*...................................... 50,982 105 0.2Oklahoma............................. 15,734 926 6.0Oregon.................................. 13,272 132 1.0Pennsylvania..................................64,326 82 0.1Rhode Island............................. 9,145 17 0.2South Carolina......................... 15,318 24 0.2South Dakota........................ 4,164 93 2.2Tennessee.............................. 19,992 32 0.2Texas.................................... 69,298 260 0.4Utah....................................... 14,191 80 0.6Vermont................................ 4,671 12 0.3Virginia................................... 31,226 90 0.3Washington............................. 21,321 252 1.2West Virginia......................... 9,045 12 0.1Wisconsin.............................. 27,484 138 0.5Wyoming.............................. 1,794 15 0.8
Table A4-10. Bachelor's degrees conferred to American Indians and Alaska Natives, by state: 1993-94
*Includes data for U.S. Service Schools located in state.
NOTE: Totals for bachelor's degrees in 1993-94 included 1,449 degrees for which race/ ethnicity was not reported.
SOURCE: U.S. Department of Education, National Center for Education Statistics, Integrated Postsecondary Education Data System, "Completions" survey,1993-94 and "Consolidated" survey, 1994. As published in NCES, Degrees and Other Awards Conferred by Institutions of Higher Education: 1993-94, table 7b, p. 32, 1996.
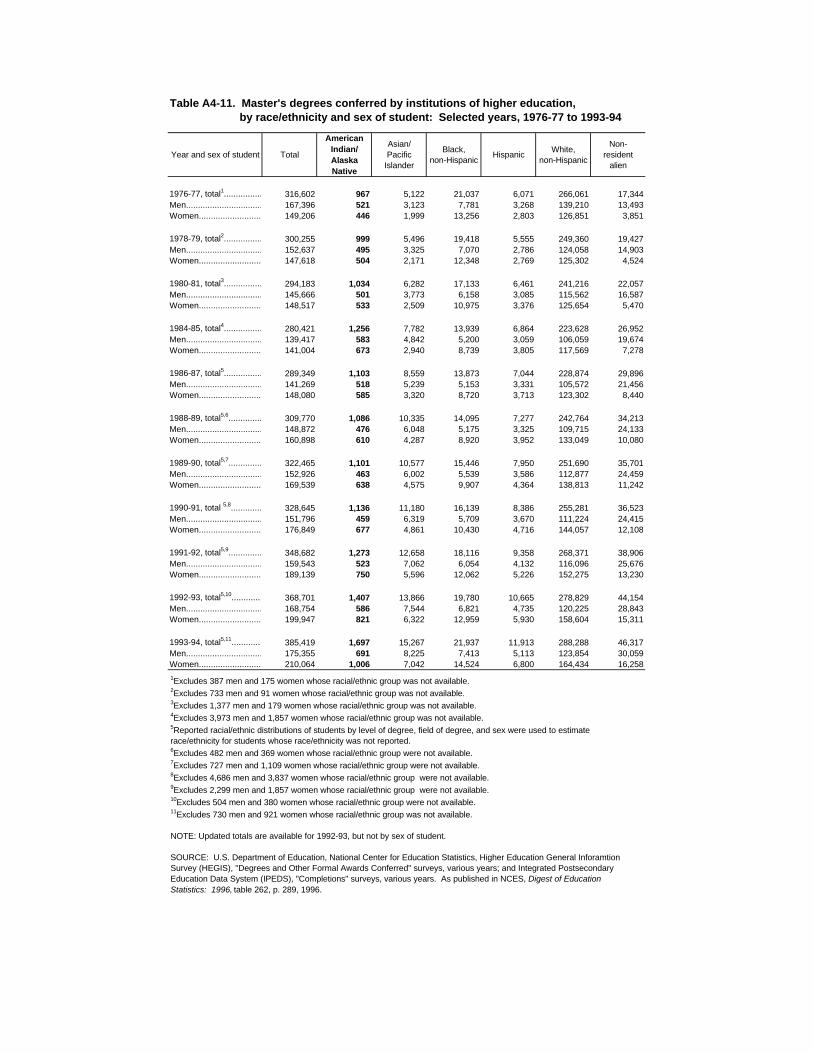
Year and sex of student Total
American Indian/Alaska Native
Asian/Pacific
Islander
Black,non-Hispanic
HispanicWhite,
non-Hispanic
Non-resident
alien
1976-77, total1................................316,602 967 5,122 21,037 6,071 266,061 17,344Men...................................... 167,396 521 3,123 7,781 3,268 139,210 13,493Women............................. 149,206 446 1,999 13,256 2,803 126,851 3,851
1978-79, total2...................................300,255 999 5,496 19,418 5,555 249,360 19,427Men...................................... 152,637 495 3,325 7,070 2,786 124,058 14,903Women............................. 147,618 504 2,171 12,348 2,769 125,302 4,524
1980-81, total3..................................294,183 1,034 6,282 17,133 6,461 241,216 22,057Men...................................... 145,666 501 3,773 6,158 3,085 115,562 16,587Women............................. 148,517 533 2,509 10,975 3,376 125,654 5,470
1984-85, total4....................................280,421 1,256 7,782 13,939 6,864 223,628 26,952Men...................................... 139,417 583 4,842 5,200 3,059 106,059 19,674Women............................. 141,004 673 2,940 8,739 3,805 117,569 7,278
1986-87, total5.................................289,349 1,103 8,559 13,873 7,044 228,874 29,896Men...................................... 141,269 518 5,239 5,153 3,331 105,572 21,456Women............................. 148,080 585 3,320 8,720 3,713 123,302 8,440
1988-89, total5,6...............................309,770 1,086 10,335 14,095 7,277 242,764 34,213Men...................................... 148,872 476 6,048 5,175 3,325 109,715 24,133Women............................. 160,898 610 4,287 8,920 3,952 133,049 10,080
1989-90, total5,7...............................322,465 1,101 10,577 15,446 7,950 251,690 35,701Men...................................... 152,926 463 6,002 5,539 3,586 112,877 24,459Women............................. 169,539 638 4,575 9,907 4,364 138,813 11,242
1990-91, total 5,8.................................328,645 1,136 11,180 16,139 8,386 255,281 36,523Men...................................... 151,796 459 6,319 5,709 3,670 111,224 24,415Women............................. 176,849 677 4,861 10,430 4,716 144,057 12,108
1991-92, total5,9................................348,682 1,273 12,658 18,116 9,358 268,371 38,906Men...................................... 159,543 523 7,062 6,054 4,132 116,096 25,676Women............................. 189,139 750 5,596 12,062 5,226 152,275 13,230
1992-93, total5,10.................................368,701 1,407 13,866 19,780 10,665 278,829 44,154Men...................................... 168,754 586 7,544 6,821 4,735 120,225 28,843Women............................. 199,947 821 6,322 12,959 5,930 158,604 15,311
1993-94, total5,11.................................385,419 1,697 15,267 21,937 11,913 288,288 46,317Men...................................... 175,355 691 8,225 7,413 5,113 123,854 30,059Women............................. 210,064 1,006 7,042 14,524 6,800 164,434 16,258
1Excludes 387 men and 175 women whose racial/ethnic group was not available.2Excludes 733 men and 91 women whose racial/ethnic group was not available.3Excludes 1,377 men and 179 women whose racial/ethnic group was not available.4Excludes 3,973 men and 1,857 women whose racial/ethnic group was not available.5Reported racial/ethnic distributions of students by level of degree, field of degree, and sex were used to estimate race/ethnicity for students whose race/ethnicity was not reported. 6Excludes 482 men and 369 women whose racial/ethnic group were not available.7Excludes 727 men and 1,109 women whose racial/ethnic group were not available.8Excludes 4,686 men and 3,837 women whose racial/ethnic group were not available.9Excludes 2,299 men and 1,857 women whose racial/ethnic group were not available.10Excludes 504 men and 380 women whose racial/ethnic group were not available.11Excludes 730 men and 921 women whose racial/ethnic group was not available.
NOTE: Updated totals are available for 1992-93, but not by sex of student.
SOURCE: U.S. Department of Education, National Center for Education Statistics, Higher Education General Inforamtion Survey (HEGIS), "Degrees and Other Formal Awards Conferred" surveys, various years; and Integrated Postsecondary Education Data System (IPEDS), "Completions" surveys, various years. As published in NCES, Digest of Education Statistics: 1996, table 262, p. 289, 1996.
Table A4-11. Master's degrees conferred by institutions of higher education, by race/ethnicity and sex of student: Selected years, 1976-77 to 1993-94
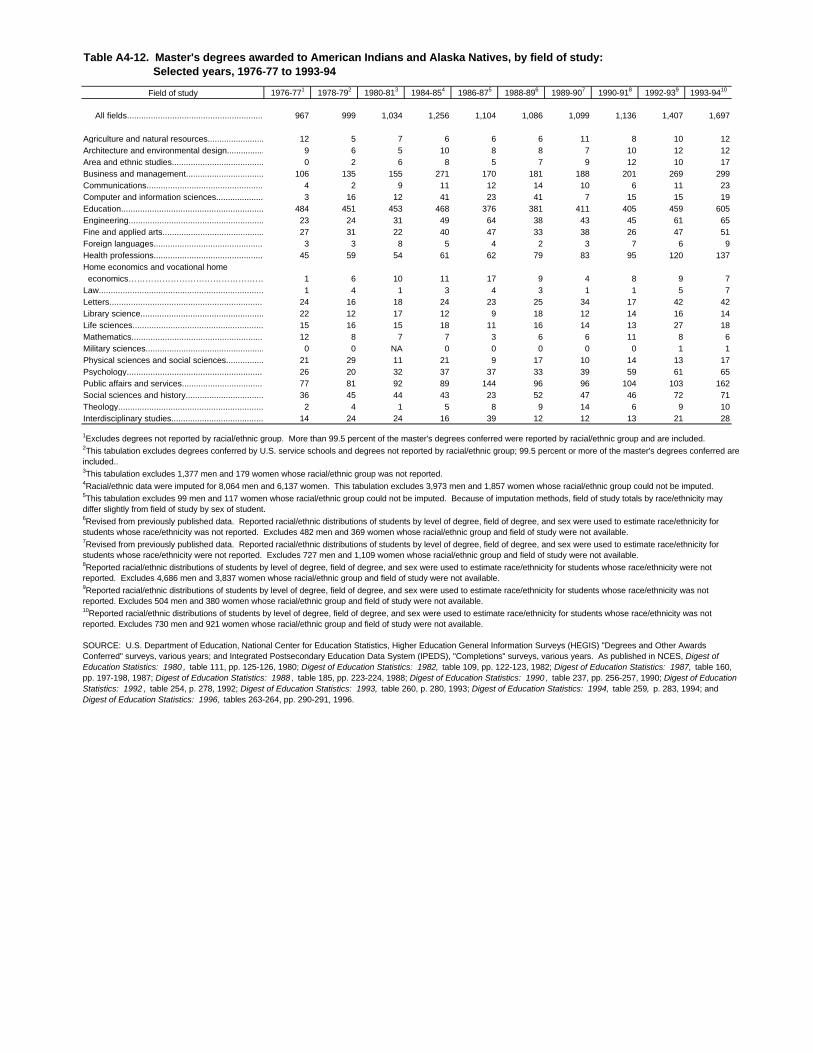
Field of study 1976-771 1978-792 1980-813 1984-854 1986-875 1988-896 1989-907 1990-918 1992-939 1993-9410
All fields...................................................................... 967 999 1,034 1,256 1,104 1,086 1,099 1,136 1,407 1,697
Agriculture and natural resources............................ 12 5 7 6 6 6 11 8 10 12Architecture and environmental design..................... 9 6 5 10 8 8 7 10 12 12Area and ethnic studies............................................ 0 2 6 8 5 7 9 12 10 17Business and management........................................ 106 135 155 271 170 181 188 201 269 299Communications......................................................... 4 2 9 11 12 14 10 6 11 23Computer and information sciences.......................... 3 16 12 41 23 41 7 15 15 19Education.................................................................. 484 451 453 468 376 381 411 405 459 605Engineering............................................................... 23 24 31 49 64 38 43 45 61 65Fine and applied arts................................................ 27 31 22 40 47 33 38 26 47 51Foreign languages.................................................... 3 3 8 5 4 2 3 7 6 9Health professions..................................................... 45 59 54 61 62 79 83 95 120 137Home economics and vocational home economics………………………………………………………………1 6 10 11 17 9 4 8 9 7Law............................................................................ 1 4 1 3 4 3 1 1 5 7Letters........................................................................ 24 16 18 24 23 25 34 17 42 42Library science.......................................................... 22 12 17 12 9 18 12 14 16 14Life sciences............................................................. 15 16 15 18 11 16 14 13 27 18Mathematics.............................................................. 12 8 7 7 3 6 6 11 8 6Military sciences........................................................ 0 0 NA 0 0 0 0 0 1 1Physical sciences and social sciences......................................................21 29 11 21 9 17 10 14 13 17Psychology................................................................ 26 20 32 37 37 33 39 59 61 65Public affairs and services........................................ 77 81 92 89 144 96 96 104 103 162Social sciences and history.........................................................36 45 44 43 23 52 47 46 72 71Theology.................................................................... 2 4 1 5 8 9 14 6 9 10Interdisciplinary studies.............................................. 14 24 24 16 39 12 12 13 21 28
Table A4-12. Master's degrees awarded to American Indians and Alaska Natives, by field of study: Selected years, 1976-77 to 1993-94
1Excludes degrees not reported by racial/ethnic group. More than 99.5 percent of the master's degrees conferred were reported by racial/ethnic group and are included.2This tabulation excludes degrees conferred by U.S. service schools and degrees not reported by racial/ethnic group; 99.5 percent or more of the master's degrees conferred are included..3This tabulation excludes 1,377 men and 179 women whose racial/ethnic group was not reported.4Racial/ethnic data were imputed for 8,064 men and 6,137 women. This tabulation excludes 3,973 men and 1,857 women whose racial/ethnic group could not be imputed.5This tabulation excludes 99 men and 117 women whose racial/ethnic group could not be imputed. Because of imputation methods, field of study totals by race/ethnicity may differ slightly from field of study by sex of student.6Revised from previously published data. Reported racial/ethnic distributions of students by level of degree, field of degree, and sex were used to estimate race/ethnicity for students whose race/ethnicity was not reported. Excludes 482 men and 369 women whose racial/ethnic group and field of study were not available.7Revised from previously published data. Reported racial/ethnic distributions of students by level of degree, field of degree, and sex were used to estimate race/ethnicity for students whose race/ethnicity were not reported. Excludes 727 men and 1,109 women whose racial/ethnic group and field of study were not available.8Reported racial/ethnic distributions of students by level of degree, field of degree, and sex were used to estimate race/ethnicity for students whose race/ethnicity were not reported. Excludes 4,686 men and 3,837 women whose racial/ethnic group and field of study were not available.9Reported racial/ethnic distributions of students by level of degree, field of degree, and sex were used to estimate race/ethnicity for students whose race/ethnicity was not reported. Excludes 504 men and 380 women whose racial/ethnic group and field of study were not available.10Reported racial/ethnic distributions of students by level of degree, field of degree, and sex were used to estimate race/ethnicity for students whose race/ethnicity was not reported. Excludes 730 men and 921 women whose racial/ethnic group and field of study were not available.
SOURCE: U.S. Department of Education, National Center for Education Statistics, Higher Education General Information Surveys (HEGIS) "Degrees and Other Awards Conferred" surveys, various years; and Integrated Postsecondary Education Data System (IPEDS), "Completions" surveys, various years. As published in NCES, Digest of Education Statistics: 1980 , table 111, pp. 125-126, 1980; Digest of Education Statistics: 1982, table 109, pp. 122-123, 1982; Digest of Education Statistics: 1987, table 160, pp. 197-198, 1987; Digest of Education Statistics: 1988 , table 185, pp. 223-224, 1988; Digest of Education Statistics: 1990 , table 237, pp. 256-257, 1990; Digest of Education Statistics: 1992 , table 254, p. 278, 1992; Digest of Education Statistics: 1993, table 260, p. 280, 1993; Digest of Education Statistics: 1994, table 259, p. 283, 1994; and Digest of Education Statistics: 1996, tables 263-264, pp. 290-291, 1996.
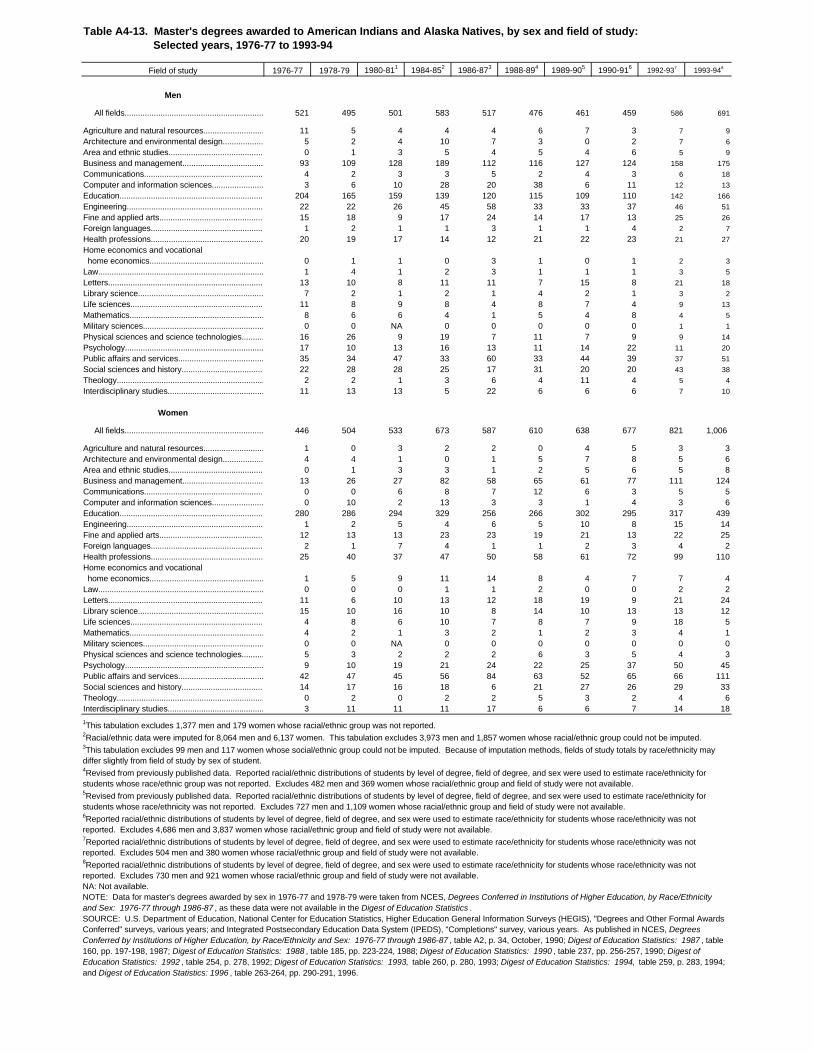
Field of study 1976-77 1978-79 1980-811 1984-852 1986-873 1988-894 1989-905 1990-916 1992-937 1993-948
Men
All fields........................................................................... 521 495 501 583 517 476 461 459 586 691
Agriculture and natural resources............................ 11 5 4 4 4 6 7 3 7 9
Architecture and environmental design..................... 5 2 4 10 7 3 0 2 7 6
Area and ethnic studies............................................ 0 1 3 5 4 5 4 6 5 9
Business and management........................................ 93 109 128 189 112 116 127 124 158 175
Communications......................................................... 4 2 3 3 5 2 4 3 6 18
Computer and information sciences.......................... 3 6 10 28 20 38 6 11 12 13
Education.................................................................. 204 165 159 139 120 115 109 110 142 166
Engineering............................................................... 22 22 26 45 58 33 33 37 46 51
Fine and applied arts................................................ 15 18 9 17 24 14 17 13 25 26
Foreign languages.................................................... 1 2 1 1 3 1 1 4 2 7
Health professions..................................................... 20 19 17 14 12 21 22 23 21 27
Home economics and vocational home economics....................................................... 0 1 1 0 3 1 0 1 2 3
Law............................................................................ 1 4 1 2 3 1 1 1 3 5
Letters........................................................................ 13 10 8 11 11 7 15 8 21 18
Library science.......................................................... 7 2 1 2 1 4 2 1 3 2
Life sciences............................................................. 11 8 9 8 4 8 7 4 9 13
Mathematics............................................................... 8 6 6 4 1 5 4 8 4 5
Military sciences........................................................ 0 0 NA 0 0 0 0 0 1 1
Physical sciences and science technologies......................................................16 26 9 19 7 11 7 9 9 14
Psychology................................................................ 17 10 13 16 13 11 14 22 11 20
Public affairs and services........................................ 35 34 47 33 60 33 44 39 37 51
Social sciences and history.........................................................22 28 28 25 17 31 20 20 43 38
Theology.................................................................... 2 2 1 3 6 4 11 4 5 4
Interdisciplinary studies................................................ 11 13 13 5 22 6 6 6 7 10
Women
All fields.......................................................................... 446 504 533 673 587 610 638 677 821 1,006
Agriculture and natural resources............................ 1 0 3 2 2 0 4 5 3 3Architecture and environmental design..................... 4 4 1 0 1 5 7 8 5 6Area and ethnic studies............................................ 0 1 3 3 1 2 5 6 5 8Business and management........................................ 13 26 27 82 58 65 61 77 111 124Communications......................................................... 0 0 6 8 7 12 6 3 5 5Computer and information sciences.......................... 0 10 2 13 3 3 1 4 3 6Education.................................................................. 280 286 294 329 256 266 302 295 317 439Engineering............................................................... 1 2 5 4 6 5 10 8 15 14Fine and applied arts................................................ 12 13 13 23 23 19 21 13 22 25Foreign languages.................................................... 2 1 7 4 1 1 2 3 4 2Health professions..................................................... 25 40 37 47 50 58 61 72 99 110Home economics and vocational home economics....................................................... 1 5 9 11 14 8 4 7 7 4Law............................................................................ 0 0 0 1 1 2 0 0 2 2Letters........................................................................ 11 6 10 13 12 18 19 9 21 24Library science.......................................................... 15 10 16 10 8 14 10 13 13 12Life sciences............................................................. 4 8 6 10 7 8 7 9 18 5Mathematics............................................................... 4 2 1 3 2 1 2 3 4 1Military sciences........................................................ 0 0 NA 0 0 0 0 0 0 0Physical sciences and science technologies......................................................5 3 2 2 2 6 3 5 4 3Psychology................................................................ 9 10 19 21 24 22 25 37 50 45Public affairs and services........................................ 42 47 45 56 84 63 52 65 66 111Social sciences and history.........................................................14 17 16 18 6 21 27 26 29 33Theology.................................................................... 0 2 0 2 2 5 3 2 4 6Interdisciplinary studies................................................ 3 11 11 11 17 6 6 7 14 18
1This tabulation excludes 1,377 men and 179 women whose racial/ethnic group was not reported.2Racial/ethnic data were imputed for 8,064 men and 6,137 women. This tabulation excludes 3,973 men and 1,857 women whose racial/ethnic group could not be imputed.3This tabulation excludes 99 men and 117 women whose social/ethnic group could not be imputed. Because of imputation methods, fields of study totals by race/ethnicity may differ slightly from field of study by sex of student.4Revised from previously published data. Reported racial/ethnic distributions of students by level of degree, field of degree, and sex were used to estimate race/ethnicity for students whose race/ethnic group was not reported. Excludes 482 men and 369 women whose racial/ethnic group and field of study were not available.5Revised from previously published data. Reported racial/ethnic distributions of students by level of degree, field of degree, and sex were used to estimate race/ethnicity for students whose race/ethnicity was not reported. Excludes 727 men and 1,109 women whose racial/ethnic group and field of study were not available.6Reported racial/ethnic distributions of students by level of degree, field of degree, and sex were used to estimate race/ethnicity for students whose race/ethnicity was not reported. Excludes 4,686 men and 3,837 women whose racial/ethnic group and field of study were not available.7Reported racial/ethnic distributions of students by level of degree, field of degree, and sex were used to estimate race/ethnicity for students whose race/ethnicity was not reported. Excludes 504 men and 380 women whose racial/ethnic group and field of study were not available.8Reported racial/ethnic distributions of students by level of degree, field of degree, and sex were used to estimate race/ethnicity for students whose race/ethnicity was not reported. Excludes 730 men and 921 women whose racial/ethnic group and field of study were not available.NA: Not available.NOTE: Data for master's degrees awarded by sex in 1976-77 and 1978-79 were taken from NCES, Degrees Conferred in Institutions of Higher Education, by Race/Ethnicity and Sex: 1976-77 through 1986-87 , as these data were not available in the Digest of Education Statistics . SOURCE: U.S. Department of Education, National Center for Education Statistics, Higher Education General Information Surveys (HEGIS), "Degrees and Other Formal Awards Conferred" surveys, various years; and Integrated Postsecondary Education Data System (IPEDS), "Completions" survey, various years. As published in NCES, Degrees Conferred by Institutions of Higher Education, by Race/Ethnicity and Sex: 1976-77 through 1986-87 , table A2, p. 34, October, 1990; Digest of Education Statistics: 1987 , table 160, pp. 197-198, 1987; Digest of Education Statistics: 1988 , table 185, pp. 223-224, 1988; Digest of Education Statistics: 1990 , table 237, pp. 256-257, 1990; Digest of Education Statistics: 1992 , table 254, p. 278, 1992; Digest of Education Statistics: 1993, table 260, p. 280, 1993; Digest of Education Statistics: 1994, table 259, p. 283, 1994; and Digest of Education Statistics: 1996 , table 263-264, pp. 290-291, 1996.
Table A4-13. Master's degrees awarded to American Indians and Alaska Natives, by sex and field of study: Selected years, 1976-77 to 1993-94
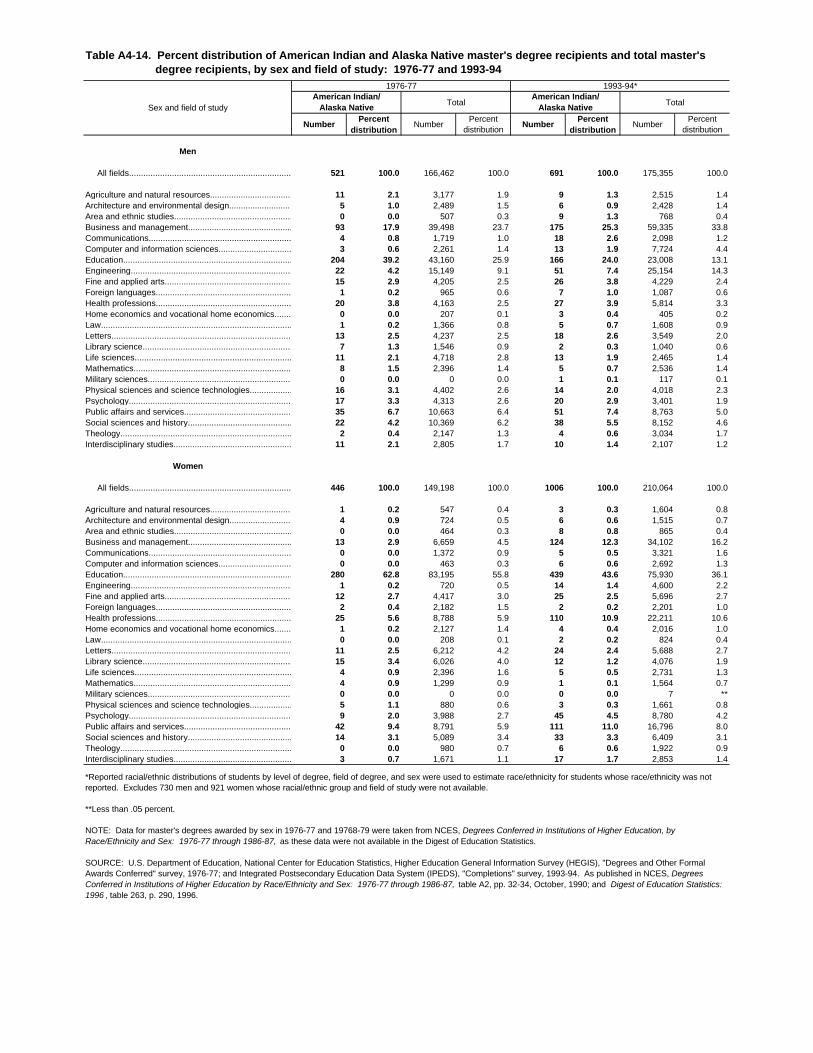
1976-77 1993-94*
Sex and field of studyAmerican Indian/
Alaska NativeTotal
American Indian/Alaska Native
Total
NumberPercent
distributionNumber
Percent distribution
NumberPercent
distributionNumber
Percent distribution
Men
All fields........................................................................... 521 100.0 166,462 100.0 691 100.0 175,355 100.0
Agriculture and natural resources............................................ 11 2.1 3,177 1.9 9 1.3 2,515 1.4Architecture and environmental design.......................... 5 1.0 2,489 1.5 6 0.9 2,428 1.4Area and ethnic studies........................................................... 0 0.0 507 0.3 9 1.3 768 0.4Business and management.................................................... 93 17.9 39,498 23.7 175 25.3 59,335 33.8Communications...................................................................... 4 0.8 1,719 1.0 18 2.6 2,098 1.2Computer and information sciences...................................... 3 0.6 2,261 1.4 13 1.9 7,724 4.4Education................................................................................ 204 39.2 43,160 25.9 166 24.0 23,008 13.1Engineering............................................................................... 22 4.2 15,149 9.1 51 7.4 25,154 14.3Fine and applied arts.............................................................. 15 2.9 4,205 2.5 26 3.8 4,229 2.4Foreign languages................................................................... 1 0.2 965 0.6 7 1.0 1,087 0.6Health professions.................................................................. 20 3.8 4,163 2.5 27 3.9 5,814 3.3Home economics and vocational home economics.......................................................................0 0.0 207 0.1 3 0.4 405 0.2Law................................................................................................ 1 0.2 1,366 0.8 5 0.7 1,608 0.9Letters......................................................................................... 13 2.5 4,237 2.5 18 2.6 3,549 2.0Library science.......................................................................... 7 1.3 1,546 0.9 2 0.3 1,040 0.6Life sciences............................................................................. 11 2.1 4,718 2.8 13 1.9 2,465 1.4Mathematics.......................................................................... 8 1.5 2,396 1.4 5 0.7 2,536 1.4Military sciences...................................................................... 0 0.0 0 0.0 1 0.1 117 0.1Physical sciences and science technologies...................................................................16 3.1 4,402 2.6 14 2.0 4,018 2.3Psychology............................................................................... 17 3.3 4,313 2.6 20 2.9 3,401 1.9Public affairs and services....................................................... 35 6.7 10,663 6.4 51 7.4 8,763 5.0Social sciences and history.........................................................................22 4.2 10,369 6.2 38 5.5 8,152 4.6Theology..................................................................................... 2 0.4 2,147 1.3 4 0.6 3,034 1.7Interdisciplinary studies.................................................... 11 2.1 2,805 1.7 10 1.4 2,107 1.2
Women
All fields.......................................................................... 446 100.0 149,198 100.0 1006 100.0 210,064 100.0
Agriculture and natural resources............................................. 1 0.2 547 0.4 3 0.3 1,604 0.8Architecture and environmental design.................................... 4 0.9 724 0.5 6 0.6 1,515 0.7Area and ethnic studies..................................................... 0 0.0 464 0.3 8 0.8 865 0.4Business and management............................................. 13 2.9 6,659 4.5 124 12.3 34,102 16.2Communications................................................................ 0 0.0 1,372 0.9 5 0.5 3,321 1.6Computer and information sciences............................... 0 0.0 463 0.3 6 0.6 2,692 1.3Education.................................................................................... 280 62.8 83,195 55.8 439 43.6 75,930 36.1Engineering............................................................................... 1 0.2 720 0.5 14 1.4 4,600 2.2Fine and applied arts................................................................ 12 2.7 4,417 3.0 25 2.5 5,696 2.7Foreign languages.................................................................... 2 0.4 2,182 1.5 2 0.2 2,201 1.0Health professions.................................................................... 25 5.6 8,788 5.9 110 10.9 22,211 10.6Home economics and vocational home economics.......................................................................1 0.2 2,127 1.4 4 0.4 2,016 1.0Law................................................................................................ 0 0.0 208 0.1 2 0.2 824 0.4Letters......................................................................................... 11 2.5 6,212 4.2 24 2.4 5,688 2.7Library science.......................................................................... 15 3.4 6,026 4.0 12 1.2 4,076 1.9Life sciences............................................................................. 4 0.9 2,396 1.6 5 0.5 2,731 1.3Mathematics.......................................................................... 4 0.9 1,299 0.9 1 0.1 1,564 0.7Military sciences...................................................................... 0 0.0 0 0.0 0 0.0 7 **Physical sciences and science technologies...................................................................5 1.1 880 0.6 3 0.3 1,661 0.8Psychology............................................................................... 9 2.0 3,988 2.7 45 4.5 8,780 4.2Public affairs and services....................................................... 42 9.4 8,791 5.9 111 11.0 16,796 8.0Social sciences and history.........................................................................14 3.1 5,089 3.4 33 3.3 6,409 3.1Theology....................................................................................... 0 0.0 980 0.7 6 0.6 1,922 0.9Interdisciplinary studies............................................................. 3 0.7 1,671 1.1 17 1.7 2,853 1.4
Table A4-14. Percent distribution of American Indian and Alaska Native master's degree recipients and total master's degree recipients, by sex and field of study: 1976-77 and 1993-94
*Reported racial/ethnic distributions of students by level of degree, field of degree, and sex were used to estimate race/ethnicity for students whose race/ethnicity was not reported. Excludes 730 men and 921 women whose racial/ethnic group and field of study were not available.
**Less than .05 percent.
NOTE: Data for master's degrees awarded by sex in 1976-77 and 19768-79 were taken from NCES, Degrees Conferred in Institutions of Higher Education, by Race/Ethnicity and Sex: 1976-77 through 1986-87, as these data were not available in the Digest of Education Statistics.
SOURCE: U.S. Department of Education, National Center for Education Statistics, Higher Education General Information Survey (HEGIS), "Degrees and Other Formal Awards Conferred" survey, 1976-77; and Integrated Postsecondary Education Data System (IPEDS), "Completions" survey, 1993-94. As published in NCES, Degrees Conferred in Institutions of Higher Education by Race/Ethnicity and Sex: 1976-77 through 1986-87, table A2, pp. 32-34, October, 1990; and Digest of Education Statistics: 1996 , table 263, p. 290, 1996.
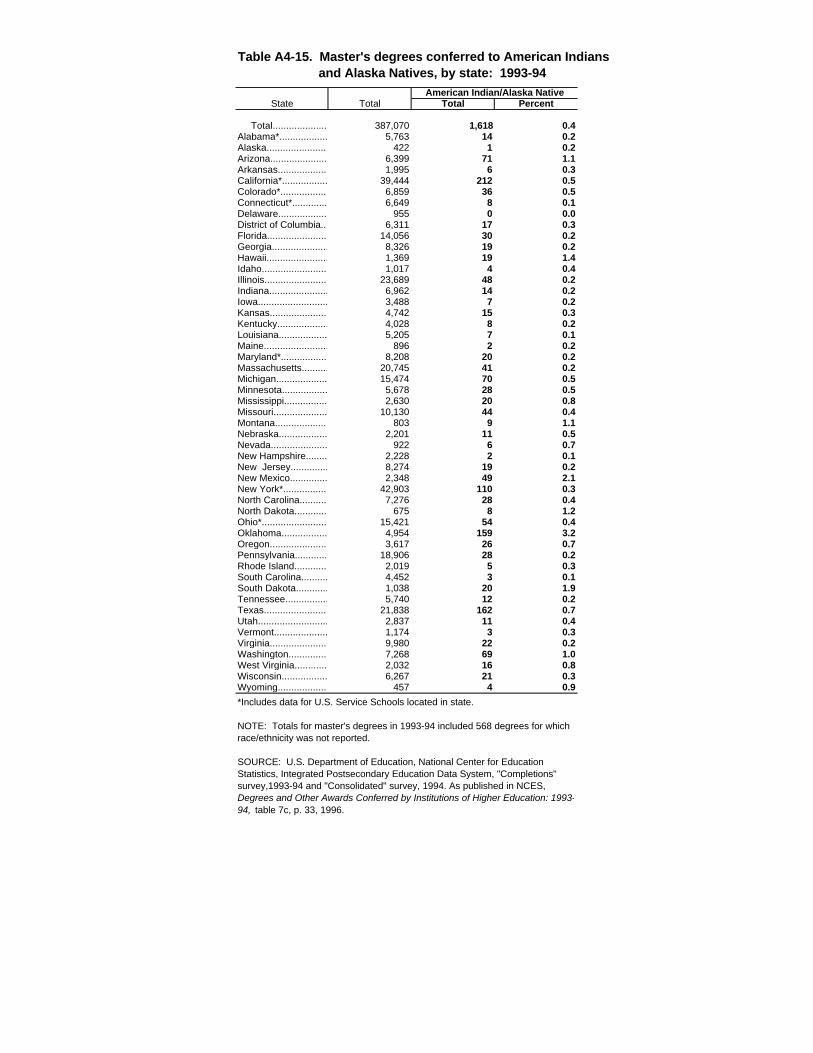
American Indian/Alaska NativeState Total Total Percent
Total.......................................387,070 1,618 0.4Alabama*..................................... 5,763 14 0.2Alaska...................................... 422 1 0.2Arizona................................. 6,399 71 1.1Arkansas............................... 1,995 6 0.3California*................................. 39,444 212 0.5Colorado*................................. 6,859 36 0.5Connecticut*........................... 6,649 8 0.1Delaware................................ 955 0 0.0District of Columbia.................. 6,311 17 0.3Florida.................................. 14,056 30 0.2Georgia................................... 8,326 19 0.2Hawaii..................................... 1,369 19 1.4Idaho..................................... 1,017 4 0.4Illinois.................................... 23,689 48 0.2Indiana.................................. 6,962 14 0.2Iowa...................................... 3,488 7 0.2Kansas................................. 4,742 15 0.3Kentucky................................ 4,028 8 0.2Louisiana............................... 5,205 7 0.1Maine....................................... 896 2 0.2Maryland*................................. 8,208 20 0.2Massachusetts...................... 20,745 41 0.2Michigan................................. 15,474 70 0.5Minnesota............................. 5,678 28 0.5Mississippi........................... 2,630 20 0.8Missouri............................... 10,130 44 0.4Montana................................ 803 9 1.1Nebraska.............................. 2,201 11 0.5Nevada.................................... 922 6 0.7New Hampshire................... 2,228 2 0.1New Jersey............................. 8,274 19 0.2New Mexico........................... 2,348 49 2.1New York*.............................. 42,903 110 0.3North Carolina......................... 7,276 28 0.4North Dakota.......................... 675 8 1.2Ohio*...................................... 15,421 54 0.4Oklahoma............................. 4,954 159 3.2Oregon.................................. 3,617 26 0.7Pennsylvania..................................18,906 28 0.2Rhode Island............................. 2,019 5 0.3South Carolina......................... 4,452 3 0.1South Dakota........................ 1,038 20 1.9Tennessee.............................. 5,740 12 0.2Texas.................................... 21,838 162 0.7Utah....................................... 2,837 11 0.4Vermont................................ 1,174 3 0.3Virginia................................... 9,980 22 0.2Washington............................. 7,268 69 1.0West Virginia......................... 2,032 16 0.8Wisconsin.............................. 6,267 21 0.3Wyoming.............................. 457 4 0.9
Table A4-15. Master's degrees conferred to American Indians and Alaska Natives, by state: 1993-94
*Includes data for U.S. Service Schools located in state.
NOTE: Totals for master's degrees in 1993-94 included 568 degrees for which race/ethnicity was not reported.
SOURCE: U.S. Department of Education, National Center for Education Statistics, Integrated Postsecondary Education Data System, "Completions" survey,1993-94 and "Consolidated" survey, 1994. As published in NCES, Degrees and Other Awards Conferred by Institutions of Higher Education: 1993-94, table 7c, p. 33, 1996.
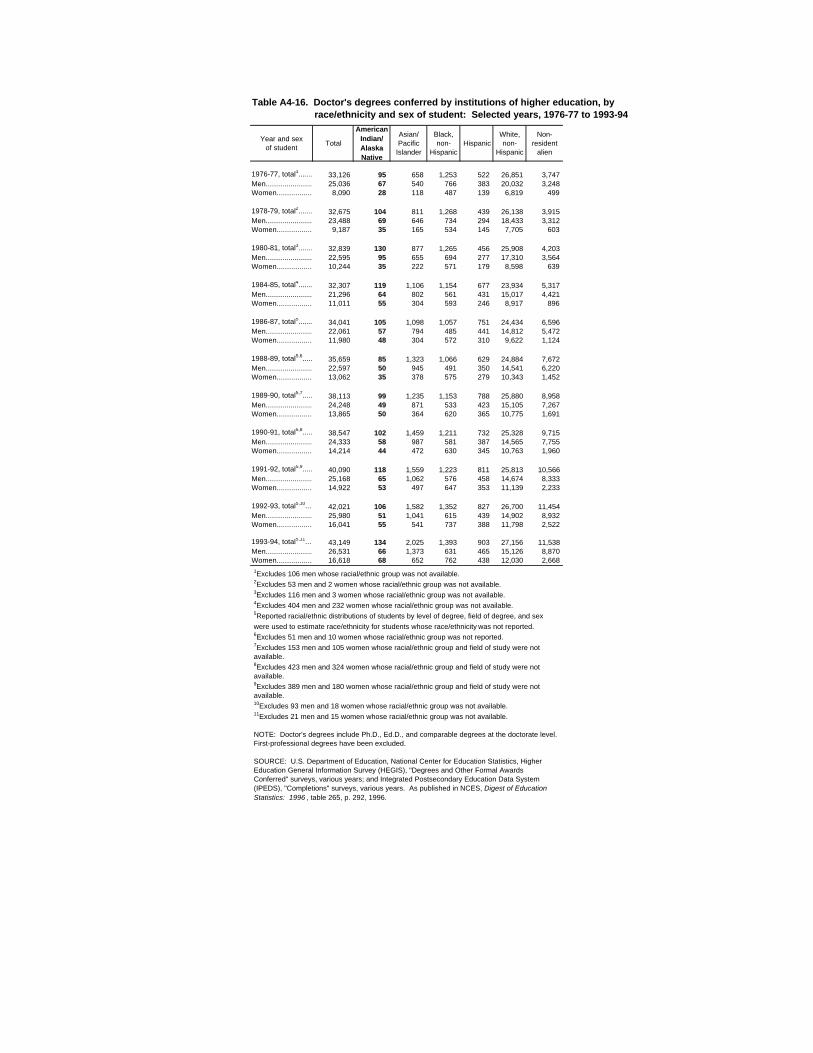
Year and sex of student
Total
American Indian/Alaska Native
Asian/Pacific
Islander
Black,non-
HispanicHispanic
White,non-
Hispanic
Non-resident
alien
1976-77, total1.................................33,126 95 658 1,253 522 26,851 3,747Men......................................25,036 67 540 766 383 20,032 3,248Women.............................8,090 28 118 487 139 6,819 499
1978-79, total2...................................32,675 104 811 1,268 439 26,138 3,915Men......................................23,488 69 646 734 294 18,433 3,312Women.............................9,187 35 165 534 145 7,705 603
1980-81, total3..................................32,839 130 877 1,265 456 25,908 4,203Men......................................22,595 95 655 694 277 17,310 3,564Women.............................10,244 35 222 571 179 8,598 639
1984-85, total4....................................32,307 119 1,106 1,154 677 23,934 5,317Men......................................21,296 64 802 561 431 15,017 4,421Women.............................11,011 55 304 593 246 8,917 896
1986-87, total5.................................34,041 105 1,098 1,057 751 24,434 6,596Men......................................22,061 57 794 485 441 14,812 5,472Women.............................11,980 48 304 572 310 9,622 1,124
1988-89, total5,6...............................35,659 85 1,323 1,066 629 24,884 7,672Men......................................22,597 50 945 491 350 14,541 6,220Women.............................13,062 35 378 575 279 10,343 1,452
1989-90, total5,7...............................38,113 99 1,235 1,153 788 25,880 8,958Men......................................24,248 49 871 533 423 15,105 7,267Women.............................13,865 50 364 620 365 10,775 1,691
1990-91, total5,8.................................38,547 102 1,459 1,211 732 25,328 9,715Men......................................24,333 58 987 581 387 14,565 7,755Women.............................14,214 44 472 630 345 10,763 1,960
1991-92, total5,9................................40,090 118 1,559 1,223 811 25,813 10,566Men......................................25,168 65 1,062 576 458 14,674 8,333Women.............................14,922 53 497 647 353 11,139 2,233
1992-93, total5,10.................................42,021 106 1,582 1,352 827 26,700 11,454Men......................................25,980 51 1,041 615 439 14,902 8,932Women.............................16,041 55 541 737 388 11,798 2,522
1993-94, total5,11.................................43,149 134 2,025 1,393 903 27,156 11,538Men......................................26,531 66 1,373 631 465 15,126 8,870Women.............................16,618 68 652 762 438 12,030 2,668
1Excludes 106 men whose racial/ethnic group was not available.2Excludes 53 men and 2 women whose racial/ethnic group was not available.3Excludes 116 men and 3 women whose racial/ethnic group was not available.4Excludes 404 men and 232 women whose racial/ethnic group was not available. 5Reported racial/ethnic distributions of students by level of degree, field of degree, and sex
were used to estimate race/ethnicity for students whose race/ethnicity was not reported.6Excludes 51 men and 10 women whose racial/ethnic group was not reported.7Excludes 153 men and 105 women whose racial/ethnic group and field of study were not available.8Excludes 423 men and 324 women whose racial/ethnic group and field of study were not available.9Excludes 389 men and 180 women whose racial/ethnic group and field of study were not available.10Excludes 93 men and 18 women whose racial/ethnic group was not available.11Excludes 21 men and 15 women whose racial/ethnic group was not available.
NOTE: Doctor's degrees include Ph.D., Ed.D., and comparable degrees at the doctorate level. First-professional degrees have been excluded. SOURCE: U.S. Department of Education, National Center for Education Statistics, Higher Education General Information Survey (HEGIS), "Degrees and Other Formal Awards Conferred" surveys, various years; and Integrated Postsecondary Education Data System (IPEDS), "Completions" surveys, various years. As published in NCES, Digest of Education Statistics: 1996 , table 265, p. 292, 1996.
Table A4-16. Doctor's degrees conferred by institutions of higher education, by race/ethnicity and sex of student: Selected years, 1976-77 to 1993-94
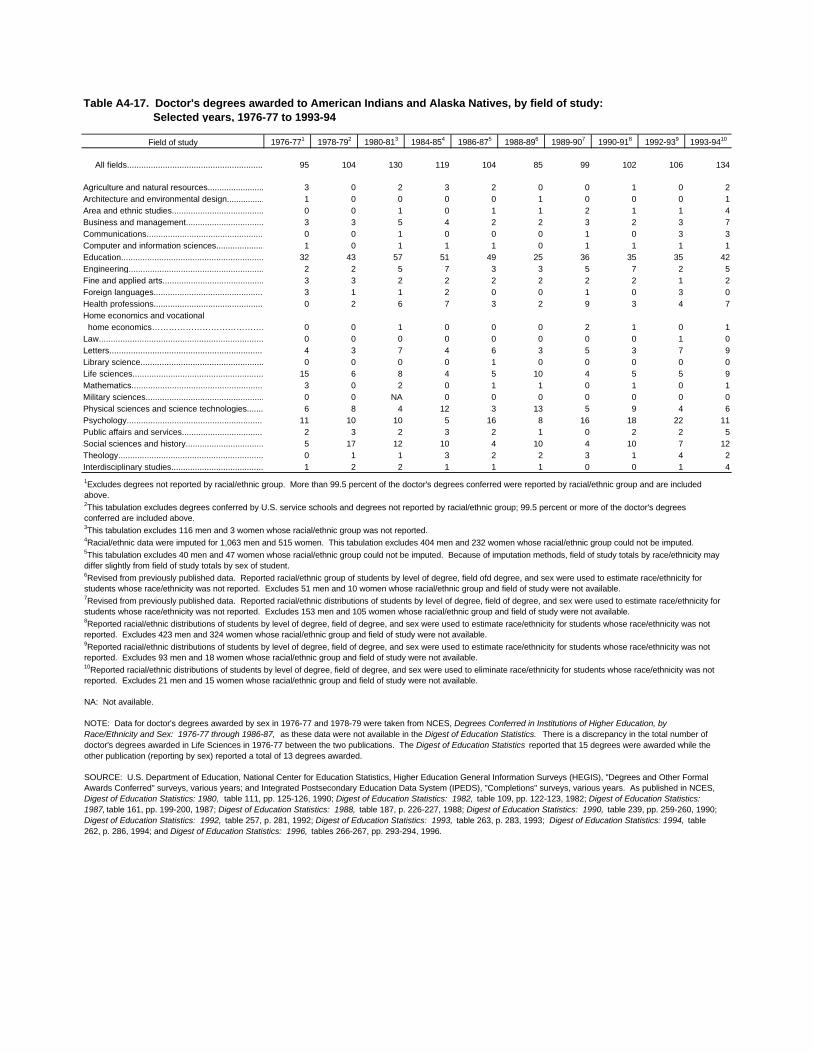
Field of study 1976-771 1978-792 1980-813 1984-854 1986-875 1988-896 1989-907 1990-918 1992-939 1993-9410
All fields..................................................................................95 104 130 119 104 85 99 102 106 134
Agriculture and natural resources............................ 3 0 2 3 2 0 0 1 0 2Architecture and environmental design..................... 1 0 0 0 0 1 0 0 0 1Area and ethnic studies............................................ 0 0 1 0 1 1 2 1 1 4Business and management........................................ 3 3 5 4 2 2 3 2 3 7Communications......................................................... 0 0 1 0 0 0 1 0 3 3Computer and information sciences.......................... 1 0 1 1 1 0 1 1 1 1Education.................................................................. 32 43 57 51 49 25 36 35 35 42Engineering............................................................... 2 2 5 7 3 3 5 7 2 5Fine and applied arts................................................ 3 3 2 2 2 2 2 2 1 2Foreign languages.................................................... 3 1 1 2 0 0 1 0 3 0Health professions..................................................... 0 2 6 7 3 2 9 3 4 7Home economics and vocational home economics…………………………………. 0 0 1 0 0 0 2 1 0 1Law............................................................................ 0 0 0 0 0 0 0 0 1 0Letters........................................................................ 4 3 7 4 6 3 5 3 7 9Library science.......................................................... 0 0 0 0 1 0 0 0 0 0Life sciences............................................................. 15 6 8 4 5 10 4 5 5 9Mathematics.............................................................. 3 0 2 0 1 1 0 1 0 1Military sciences........................................................ 0 0 NA 0 0 0 0 0 0 0Physical sciences and science technologies.............................6 8 4 12 3 13 5 9 4 6Psychology................................................................ 11 10 10 5 16 8 16 18 22 11Public affairs and services........................................ 2 3 2 3 2 1 0 2 2 5Social sciences and history.........................................................5 17 12 10 4 10 4 10 7 12Theology.................................................................... 0 1 1 3 2 2 3 1 4 2Interdisciplinary studies.............................................. 1 2 2 1 1 1 0 0 1 4
1Excludes degrees not reported by racial/ethnic group. More than 99.5 percent of the doctor's degrees conferred were reported by racial/ethnic group and are included above.2This tabulation excludes degrees conferred by U.S. service schools and degrees not reported by racial/ethnic group; 99.5 percent or more of the doctor's degrees conferred are included above.3This tabulation excludes 116 men and 3 women whose racial/ethnic group was not reported.4Racial/ethnic data were imputed for 1,063 men and 515 women. This tabulation excludes 404 men and 232 women whose racial/ethnic group could not be imputed.5This tabulation excludes 40 men and 47 women whose racial/ethnic group could not be imputed. Because of imputation methods, field of study totals by race/ethnicity may differ slightly from field of study totals by sex of student.6Revised from previously published data. Reported racial/ethnic group of students by level of degree, field ofd degree, and sex were used to estimate race/ethnicity for students whose race/ethnicity was not reported. Excludes 51 men and 10 women whose racial/ethnic group and field of study were not available.7Revised from previously published data. Reported racial/ethnic distributions of students by level of degree, field of degree, and sex were used to estimate race/ethnicity for students whose race/ethnicity was not reported. Excludes 153 men and 105 women whose racial/ethnic group and field of study were not available.8Reported racial/ethnic distributions of students by level of degree, field of degree, and sex were used to estimate race/ethnicity for students whose race/ethnicity was not reported. Excludes 423 men and 324 women whose racial/ethnic group and field of study were not available.9Reported racial/ethnic distributions of students by level of degree, field of degree, and sex were used to estimate race/ethnicity for students whose race/ethnicity was not reported. Excludes 93 men and 18 women whose racial/ethnic group and field of study were not available.10Reported racial/ethnic distributions of students by level of degree, field of degree, and sex were used to eliminate race/ethnicity for students whose race/ethnicity was not reported. Excludes 21 men and 15 women whose racial/ethnic group and field of study were not available.
NA: Not available.
NOTE: Data for doctor's degrees awarded by sex in 1976-77 and 1978-79 were taken from NCES, Degrees Conferred in Institutions of Higher Education, by Race/Ethnicity and Sex: 1976-77 through 1986-87, as these data were not available in the Digest of Education Statistics. There is a discrepancy in the total number of doctor's degrees awarded in Life Sciences in 1976-77 between the two publications. The Digest of Education Statistics reported that 15 degrees were awarded while the other publication (reporting by sex) reported a total of 13 degrees awarded.
SOURCE: U.S. Department of Education, National Center for Education Statistics, Higher Education General Information Surveys (HEGIS), "Degrees and Other Formal Awards Conferred" surveys, various years; and Integrated Postsecondary Education Data System (IPEDS), "Completions" surveys, various years. As published in NCES, Digest of Education Statistics: 1980, table 111, pp. 125-126, 1990; Digest of Education Statistics: 1982, table 109, pp. 122-123, 1982; Digest of Education Statistics: 1987, table 161, pp. 199-200, 1987; Digest of Education Statistics: 1988, table 187, p. 226-227, 1988; Digest of Education Statistics: 1990, table 239, pp. 259-260, 1990; Digest of Education Statistics: 1992, table 257, p. 281, 1992; Digest of Education Statistics: 1993, table 263, p. 283, 1993; Digest of Education Statistics: 1994, table 262, p. 286, 1994; and Digest of Education Statistics: 1996, tables 266-267, pp. 293-294, 1996.
Table A4-17. Doctor's degrees awarded to American Indians and Alaska Natives, by field of study: Selected years, 1976-77 to 1993-94
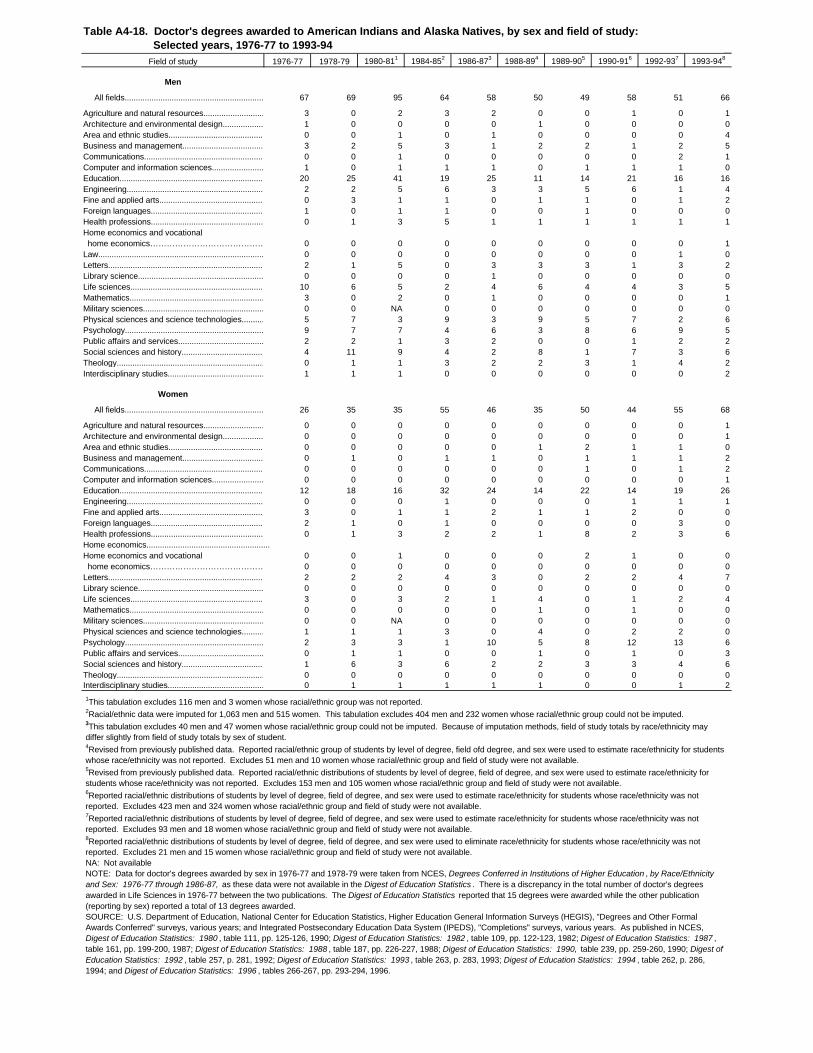
Field of study 1976-77 1978-79 1980-811 1984-852 1986-873 1988-894 1989-905 1990-916 1992-937 1993-948
Men
All fields.......................................................................... 67 69 95 64 58 50 49 58 51 66
Agriculture and natural resources............................ 3 0 2 3 2 0 0 1 0 1Architecture and environmental design..................... 1 0 0 0 0 1 0 0 0 0Area and ethnic studies............................................ 0 0 1 0 1 0 0 0 0 4Business and management........................................ 3 2 5 3 1 2 2 1 2 5Communications......................................................... 0 0 1 0 0 0 0 0 2 1Computer and information sciences.......................... 1 0 1 1 1 0 1 1 1 0Education.................................................................. 20 25 41 19 25 11 14 21 16 16Engineering............................................................... 2 2 5 6 3 3 5 6 1 4Fine and applied arts................................................ 0 3 1 1 0 1 1 0 1 2Foreign languages.................................................... 1 0 1 1 0 0 1 0 0 0Health professions..................................................... 0 1 3 5 1 1 1 1 1 1Home economics and vocational home economics…………………………………….. 0 0 0 0 0 0 0 0 0 1Law............................................................................ 0 0 0 0 0 0 0 0 1 0Letters........................................................................ 2 1 5 0 3 3 3 1 3 2Library science.......................................................... 0 0 0 0 1 0 0 0 0 0Life sciences............................................................. 10 6 5 2 4 6 4 4 3 5Mathematics.............................................................. 3 0 2 0 1 0 0 0 0 1Military sciences........................................................ 0 0 NA 0 0 0 0 0 0 0Physical sciences and science technologies......................................................5 7 3 9 3 9 5 7 2 6Psychology................................................................ 9 7 7 4 6 3 8 6 9 5Public affairs and services........................................ 2 2 1 3 2 0 0 1 2 2Social sciences and history.........................................................4 11 9 4 2 8 1 7 3 6Theology.................................................................... 0 1 1 3 2 2 3 1 4 2Interdisciplinary studies.............................................. 1 1 1 0 0 0 0 0 0 2
Women
All fields........................................................................ 26 35 35 55 46 35 50 44 55 68
Agriculture and natural resources............................ 0 0 0 0 0 0 0 0 0 1Architecture and environmental design..................... 0 0 0 0 0 0 0 0 0 1Area and ethnic studies............................................ 0 0 0 0 0 1 2 1 1 0Business and management........................................ 0 1 0 1 1 0 1 1 1 2Communications......................................................... 0 0 0 0 0 0 1 0 1 2Computer and information sciences.......................... 0 0 0 0 0 0 0 0 0 1Education.................................................................. 12 18 16 32 24 14 22 14 19 26Engineering............................................................... 0 0 0 1 0 0 0 1 1 1Fine and applied arts................................................ 3 0 1 1 2 1 1 2 0 0Foreign languages.................................................... 2 1 0 1 0 0 0 0 3 0Health professions..................................................... 0 1 3 2 2 1 8 2 3 6Home economics.......................................................Home economics and vocational 0 0 1 0 0 0 2 1 0 0 home economics…………………………………….. 0 0 0 0 0 0 0 0 0 0Letters........................................................................ 2 2 2 4 3 0 2 2 4 7Library science.......................................................... 0 0 0 0 0 0 0 0 0 0Life sciences............................................................. 3 0 3 2 1 4 0 1 2 4Mathematics.............................................................. 0 0 0 0 0 1 0 1 0 0Military sciences........................................................ 0 0 NA 0 0 0 0 0 0 0Physical sciences and science technologies......................................................1 1 1 3 0 4 0 2 2 0Psychology................................................................ 2 3 3 1 10 5 8 12 13 6Public affairs and services........................................ 0 1 1 0 0 1 0 1 0 3Social sciences and history.........................................................1 6 3 6 2 2 3 3 4 6Theology.................................................................... 0 0 0 0 0 0 0 0 0 0Interdisciplinary studies.............................................. 0 1 1 1 1 1 0 0 1 2
1This tabulation excludes 116 men and 3 women whose racial/ethnic group was not reported.2Racial/ethnic data were imputed for 1,063 men and 515 women. This tabulation excludes 404 men and 232 women whose racial/ethnic group could not be imputed.3This tabulation excludes 40 men and 47 women whose racial/ethnic group could not be imputed. Because of imputation methods, field of study totals by race/ethnicity may differ slightly from field of study totals by sex of student.4Revised from previously published data. Reported racial/ethnic group of students by level of degree, field ofd degree, and sex were used to estimate race/ethnicity for students whose race/ethnicity was not reported. Excludes 51 men and 10 women whose racial/ethnic group and field of study were not available.5Revised from previously published data. Reported racial/ethnic distributions of students by level of degree, field of degree, and sex were used to estimate race/ethnicity for students whose race/ethnicity was not reported. Excludes 153 men and 105 women whose racial/ethnic group and field of study were not available.6Reported racial/ethnic distributions of students by level of degree, field of degree, and sex were used to estimate race/ethnicity for students whose race/ethnicity was not reported. Excludes 423 men and 324 women whose racial/ethnic group and field of study were not available.7Reported racial/ethnic distributions of students by level of degree, field of degree, and sex were used to estimate race/ethnicity for students whose race/ethnicity was not reported. Excludes 93 men and 18 women whose racial/ethnic group and field of study were not available.8Reported racial/ethnic distributions of students by level of degree, field of degree, and sex were used to eliminate race/ethnicity for students whose race/ethnicity was not reported. Excludes 21 men and 15 women whose racial/ethnic group and field of study were not available.NA: Not availableNOTE: Data for doctor's degrees awarded by sex in 1976-77 and 1978-79 were taken from NCES, Degrees Conferred in Institutions of Higher Education , by Race/Ethnicity and Sex: 1976-77 through 1986-87, as these data were not available in the Digest of Education Statistics . There is a discrepancy in the total number of doctor's degrees awarded in Life Sciences in 1976-77 between the two publications. The Digest of Education Statistics reported that 15 degrees were awarded while the other publication (reporting by sex) reported a total of 13 degrees awarded.SOURCE: U.S. Department of Education, National Center for Education Statistics, Higher Education General Information Surveys (HEGIS), "Degrees and Other Formal Awards Conferred" surveys, various years; and Integrated Postsecondary Education Data System (IPEDS), "Completions" surveys, various years. As published in NCES, Digest of Education Statistics: 1980 , table 111, pp. 125-126, 1990; Digest of Education Statistics: 1982 , table 109, pp. 122-123, 1982; Digest of Education Statistics: 1987 , table 161, pp. 199-200, 1987; Digest of Education Statistics: 1988 , table 187, pp. 226-227, 1988; Digest of Education Statistics: 1990, table 239, pp. 259-260, 1990; Digest of Education Statistics: 1992 , table 257, p. 281, 1992; Digest of Education Statistics: 1993 , table 263, p. 283, 1993; Digest of Education Statistics: 1994 , table 262, p. 286, 1994; and Digest of Education Statistics: 1996 , tables 266-267, pp. 293-294, 1996.
Table A4-18. Doctor's degrees awarded to American Indians and Alaska Natives, by sex and field of study: Selected years, 1976-77 to 1993-94
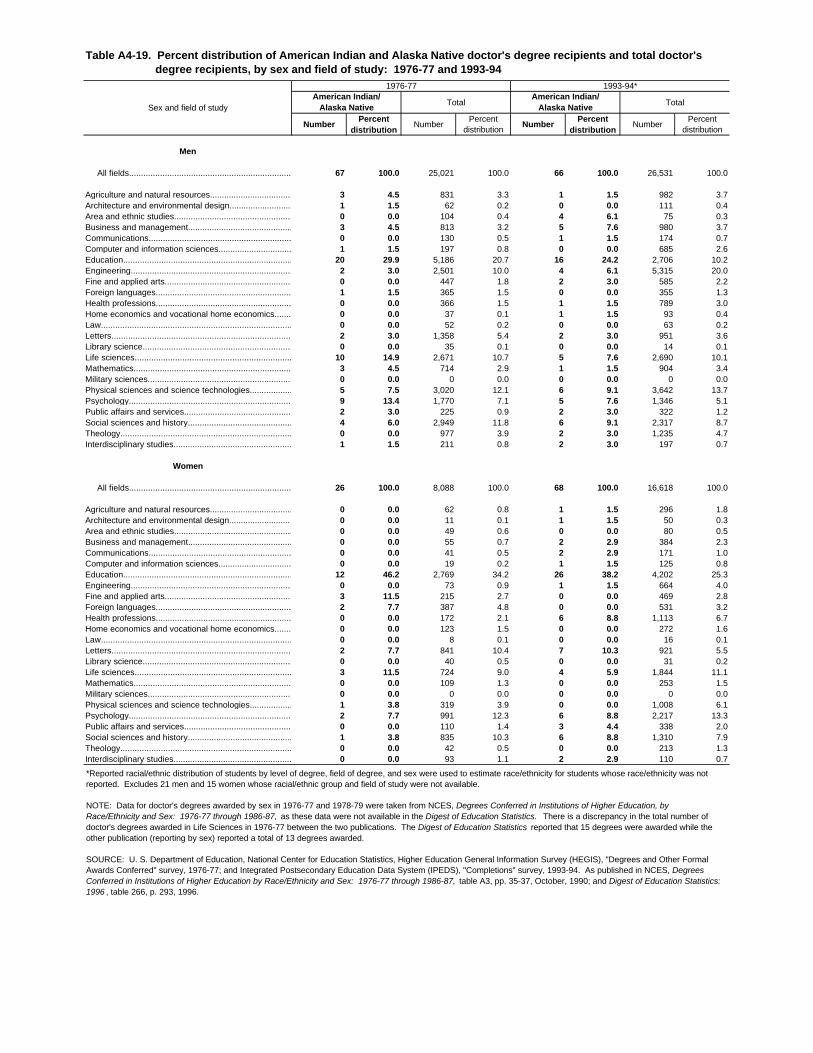
1976-77 1993-94*
Sex and field of studyAmerican Indian/
Alaska NativeTotal
American Indian/Alaska Native
Total
NumberPercent
distributionNumber
Percent distribution
NumberPercent
distributionNumber
Percent distribution
Men
All fields.......................................................................... 67 100.0 25,021 100.0 66 100.0 26,531 100.0
Agriculture and natural resources.......................................... 3 4.5 831 3.3 1 1.5 982 3.7Architecture and environmental design.................................... 1 1.5 62 0.2 0 0.0 111 0.4Area and ethnic studies............................................................. 0 0.0 104 0.4 4 6.1 75 0.3Business and management.................................................... 3 4.5 813 3.2 5 7.6 980 3.7Communications......................................................................... 0 0.0 130 0.5 1 1.5 174 0.7Computer and information sciences....................................... 1 1.5 197 0.8 0 0.0 685 2.6Education..................................................................................... 20 29.9 5,186 20.7 16 24.2 2,706 10.2Engineering................................................................................. 2 3.0 2,501 10.0 4 6.1 5,315 20.0Fine and applied arts............................................................... 0 0.0 447 1.8 2 3.0 585 2.2Foreign languages................................................................... 1 1.5 365 1.5 0 0.0 355 1.3Health professions.................................................................... 0 0.0 366 1.5 1 1.5 789 3.0Home economics and vocational home economics.......................................................................0 0.0 37 0.1 1 1.5 93 0.4Law............................................................................................. 0 0.0 52 0.2 0 0.0 63 0.2Letters......................................................................................... 2 3.0 1,358 5.4 2 3.0 951 3.6Library science........................................................................... 0 0.0 35 0.1 0 0.0 14 0.1Life sciences.............................................................................. 10 14.9 2,671 10.7 5 7.6 2,690 10.1Mathematics.............................................................................. 3 4.5 714 2.9 1 1.5 904 3.4Military sciences.......................................................................... 0 0.0 0 0.0 0 0.0 0 0.0Physical sciences and science technologies.....................................................................5 7.5 3,020 12.1 6 9.1 3,642 13.7Psychology................................................................................. 9 13.4 1,770 7.1 5 7.6 1,346 5.1Public affairs and services...................................................... 2 3.0 225 0.9 2 3.0 322 1.2Social sciences and history.........................................................................4 6.0 2,949 11.8 6 9.1 2,317 8.7Theology................................................................................... 0 0.0 977 3.9 2 3.0 1,235 4.7Interdisciplinary studies.......................................................... 1 1.5 211 0.8 2 3.0 197 0.7
Women
All fields.................................................................................. 26 100.0 8,088 100.0 68 100.0 16,618 100.0
Agriculture and natural resources.................................... 0 0.0 62 0.8 1 1.5 296 1.8Architecture and environmental design.......................... 0 0.0 11 0.1 1 1.5 50 0.3Area and ethnic studies......................................................... 0 0.0 49 0.6 0 0.0 80 0.5Business and management................................................. 0 0.0 55 0.7 2 2.9 384 2.3Communications.................................................................... 0 0.0 41 0.5 2 2.9 171 1.0Computer and information sciences................................ 0 0.0 19 0.2 1 1.5 125 0.8Education.................................................................................... 12 46.2 2,769 34.2 26 38.2 4,202 25.3Engineering............................................................................... 0 0.0 73 0.9 1 1.5 664 4.0Fine and applied arts............................................................... 3 11.5 215 2.7 0 0.0 469 2.8Foreign languages.................................................................. 2 7.7 387 4.8 0 0.0 531 3.2Health professions................................................................... 0 0.0 172 2.1 6 8.8 1,113 6.7Home economics and vocational home economics.......................................................................0 0.0 123 1.5 0 0.0 272 1.6Law............................................................................................. 0 0.0 8 0.1 0 0.0 16 0.1Letters......................................................................................... 2 7.7 841 10.4 7 10.3 921 5.5Library science........................................................................... 0 0.0 40 0.5 0 0.0 31 0.2Life sciences.............................................................................. 3 11.5 724 9.0 4 5.9 1,844 11.1Mathematics.............................................................................. 0 0.0 109 1.3 0 0.0 253 1.5Military sciences.......................................................................... 0 0.0 0 0.0 0 0.0 0 0.0Physical sciences and science technologies.....................................................................1 3.8 319 3.9 0 0.0 1,008 6.1Psychology................................................................................. 2 7.7 991 12.3 6 8.8 2,217 13.3Public affairs and services...................................................... 0 0.0 110 1.4 3 4.4 338 2.0Social sciences and history.........................................................................1 3.8 835 10.3 6 8.8 1,310 7.9Theology..................................................................................... 0 0.0 42 0.5 0 0.0 213 1.3Interdisciplinary studies........................................................ 0 0.0 93 1.1 2 2.9 110 0.7
Table A4-19. Percent distribution of American Indian and Alaska Native doctor's degree recipients and total doctor's degree recipients, by sex and field of study: 1976-77 and 1993-94
*Reported racial/ethnic distribution of students by level of degree, field of degree, and sex were used to estimate race/ethnicity for students whose race/ethnicity was not reported. Excludes 21 men and 15 women whose racial/ethnic group and field of study were not available.
NOTE: Data for doctor's degrees awarded by sex in 1976-77 and 1978-79 were taken from NCES, Degrees Conferred in Institutions of Higher Education, by Race/Ethnicity and Sex: 1976-77 through 1986-87, as these data were not available in the Digest of Education Statistics. There is a discrepancy in the total number of doctor's degrees awarded in Life Sciences in 1976-77 between the two publications. The Digest of Education Statistics reported that 15 degrees were awarded while the other publication (reporting by sex) reported a total of 13 degrees awarded.
SOURCE: U. S. Department of Education, National Center for Education Statistics, Higher Education General Information Survey (HEGIS), "Degrees and Other Formal Awards Conferred" survey, 1976-77; and Integrated Postsecondary Education Data System (IPEDS), "Completions" survey, 1993-94. As published in NCES, Degrees Conferred in Institutions of Higher Education by Race/Ethnicity and Sex: 1976-77 through 1986-87, table A3, pp. 35-37, October, 1990; and Digest of Education Statistics: 1996 , table 266, p. 293, 1996.
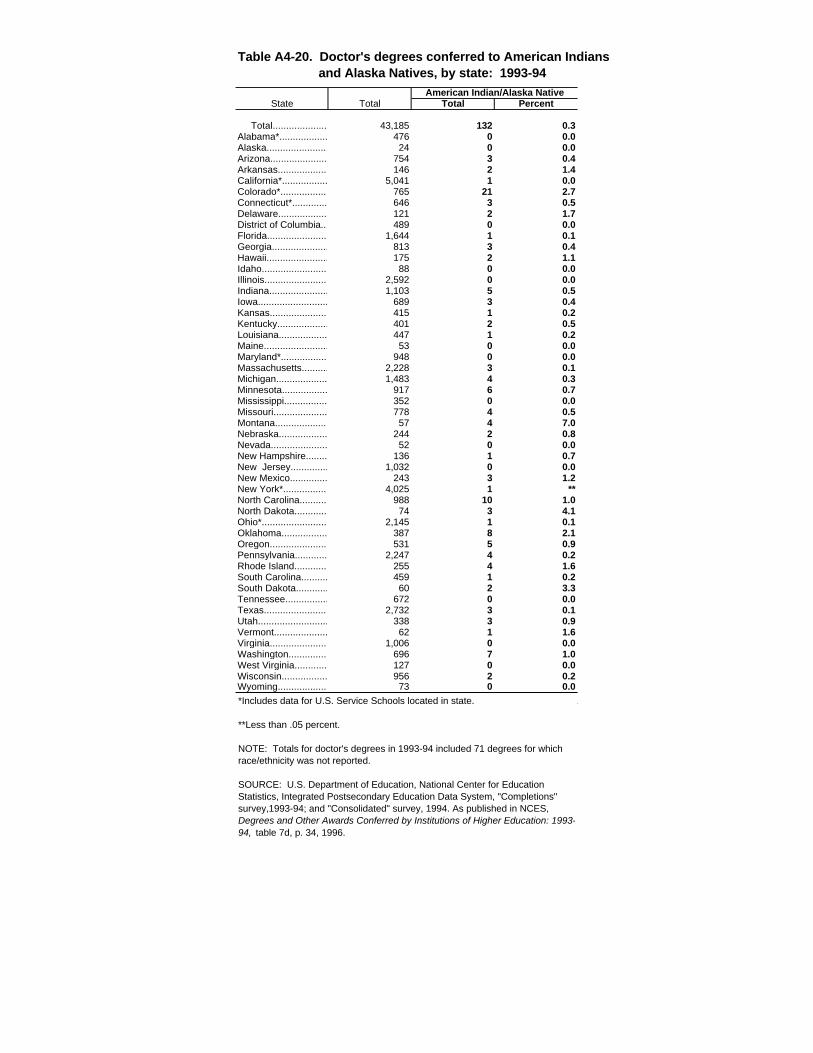
American Indian/Alaska NativeState Total Total Percent
Total....................................... 43,185 132 0.3Alabama*..................................... 476 0 0.0Alaska...................................... 24 0 0.0Arizona................................. 754 3 0.4Arkansas............................... 146 2 1.4California*................................. 5,041 1 0.0Colorado*................................. 765 21 2.7Connecticut*........................... 646 3 0.5Delaware................................ 121 2 1.7District of Columbia.................. 489 0 0.0Florida.................................. 1,644 1 0.1Georgia................................... 813 3 0.4Hawaii..................................... 175 2 1.1Idaho..................................... 88 0 0.0Illinois.................................... 2,592 0 0.0Indiana.................................. 1,103 5 0.5Iowa...................................... 689 3 0.4Kansas................................. 415 1 0.2Kentucky................................ 401 2 0.5Louisiana............................... 447 1 0.2Maine....................................... 53 0 0.0Maryland*................................. 948 0 0.0Massachusetts...................... 2,228 3 0.1Michigan................................. 1,483 4 0.3Minnesota............................. 917 6 0.7Mississippi........................... 352 0 0.0Missouri............................... 778 4 0.5Montana................................ 57 4 7.0Nebraska.............................. 244 2 0.8Nevada.................................... 52 0 0.0New Hampshire................... 136 1 0.7New Jersey............................. 1,032 0 0.0New Mexico........................... 243 3 1.2New York*.............................. 4,025 1 **North Carolina......................... 988 10 1.0North Dakota.......................... 74 3 4.1Ohio*...................................... 2,145 1 0.1Oklahoma............................. 387 8 2.1Oregon.................................. 531 5 0.9Pennsylvania..................................2,247 4 0.2Rhode Island............................. 255 4 1.6South Carolina......................... 459 1 0.2South Dakota........................ 60 2 3.3Tennessee.............................. 672 0 0.0Texas.................................... 2,732 3 0.1Utah....................................... 338 3 0.9Vermont................................ 62 1 1.6Virginia................................... 1,006 0 0.0Washington............................. 696 7 1.0West Virginia......................... 127 0 0.0Wisconsin.............................. 956 2 0.2Wyoming.............................. 73 0 0.0
Table A4-20. Doctor's degrees conferred to American Indians and Alaska Natives, by state: 1993-94
*Includes data for U.S. Service Schools located in state.
**Less than .05 percent.
NOTE: Totals for doctor's degrees in 1993-94 included 71 degrees for which race/ethnicity was not reported.
SOURCE: U.S. Department of Education, National Center for Education Statistics, Integrated Postsecondary Education Data System, "Completions" survey,1993-94; and "Consolidated" survey, 1994. As published in NCES, Degrees and Other Awards Conferred by Institutions of Higher Education: 1993-94, table 7d, p. 34, 1996.
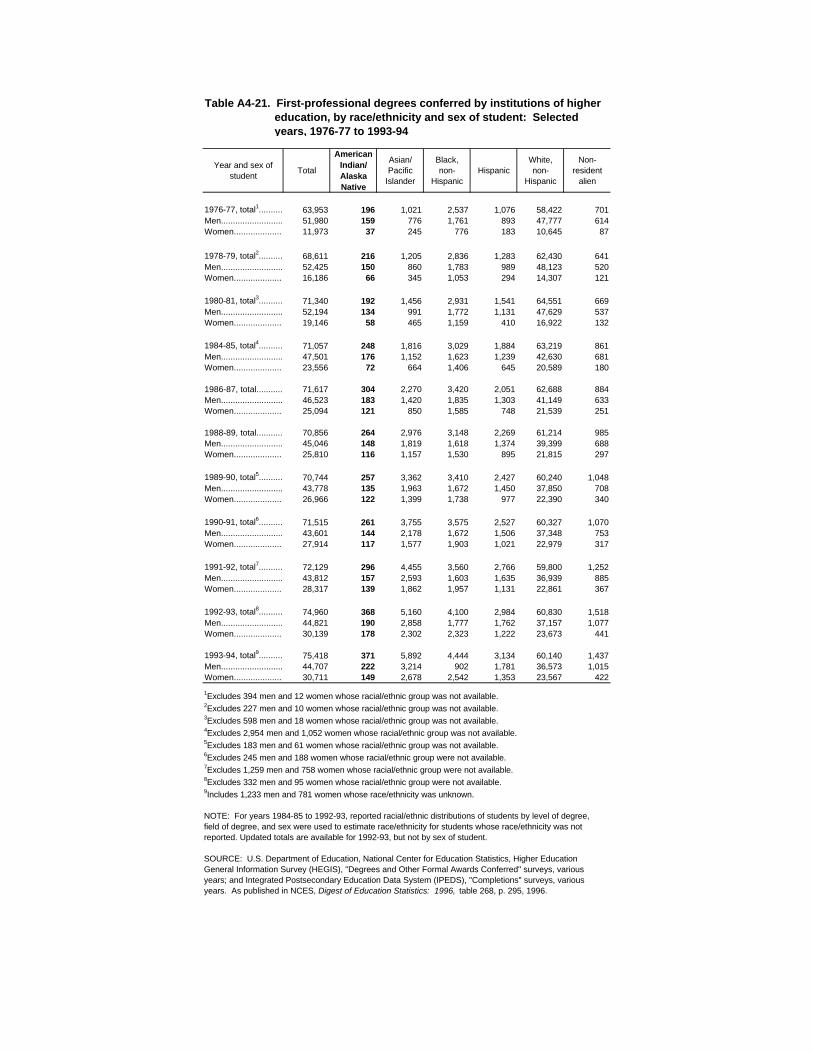
Year and sex of student
Total
American Indian/Alaska Native
Asian/Pacific
Islander
Black,non-
HispanicHispanic
White, non-
Hispanic
Non-resident
alien
1976-77, total1................................63,953 196 1,021 2,537 1,076 58,422 701Men......................................51,980 159 776 1,761 893 47,777 614Women.............................11,973 37 245 776 183 10,645 87
1978-79, total2...................................68,611 216 1,205 2,836 1,283 62,430 641Men......................................52,425 150 860 1,783 989 48,123 520Women.............................16,186 66 345 1,053 294 14,307 121
1980-81, total3..................................71,340 192 1,456 2,931 1,541 64,551 669Men......................................52,194 134 991 1,772 1,131 47,629 537Women.............................19,146 58 465 1,159 410 16,922 132
1984-85, total4....................................71,057 248 1,816 3,029 1,884 63,219 861Men......................................47,501 176 1,152 1,623 1,239 42,630 681Women.............................23,556 72 664 1,406 645 20,589 180
1986-87, total.................................71,617 304 2,270 3,420 2,051 62,688 884Men......................................46,523 183 1,420 1,835 1,303 41,149 633Women.............................25,094 121 850 1,585 748 21,539 251
1988-89, total...............................70,856 264 2,976 3,148 2,269 61,214 985Men......................................45,046 148 1,819 1,618 1,374 39,399 688Women.............................25,810 116 1,157 1,530 895 21,815 297
1989-90, total5...............................70,744 257 3,362 3,410 2,427 60,240 1,048Men......................................43,778 135 1,963 1,672 1,450 37,850 708Women.............................26,966 122 1,399 1,738 977 22,390 340
1990-91, total6.................................71,515 261 3,755 3,575 2,527 60,327 1,070Men......................................43,601 144 2,178 1,672 1,506 37,348 753Women.............................27,914 117 1,577 1,903 1,021 22,979 317
1991-92, total7................................72,129 296 4,455 3,560 2,766 59,800 1,252Men......................................43,812 157 2,593 1,603 1,635 36,939 885Women.............................28,317 139 1,862 1,957 1,131 22,861 367
1992-93, total8.................................74,960 368 5,160 4,100 2,984 60,830 1,518Men......................................44,821 190 2,858 1,777 1,762 37,157 1,077Women.............................30,139 178 2,302 2,323 1,222 23,673 441
1993-94, total9.................................75,418 371 5,892 4,444 3,134 60,140 1,437Men......................................44,707 222 3,214 902 1,781 36,573 1,015Women.............................30,711 149 2,678 2,542 1,353 23,567 422
1Excludes 394 men and 12 women whose racial/ethnic group was not available.2Excludes 227 men and 10 women whose racial/ethnic group was not available.3Excludes 598 men and 18 women whose racial/ethnic group was not available.4Excludes 2,954 men and 1,052 women whose racial/ethnic group was not available.5Excludes 183 men and 61 women whose racial/ethnic group was not available.6Excludes 245 men and 188 women whose racial/ethnic group were not available.7Excludes 1,259 men and 758 women whose racial/ethnic group were not available.8Excludes 332 men and 95 women whose racial/ethnic group were not available.9Includes 1,233 men and 781 women whose race/ethnicity was unknown.
NOTE: For years 1984-85 to 1992-93, reported racial/ethnic distributions of students by level of degree, field of degree, and sex were used to estimate race/ethnicity for students whose race/ethnicity was not reported. Updated totals are available for 1992-93, but not by sex of student.
SOURCE: U.S. Department of Education, National Center for Education Statistics, Higher Education General Information Survey (HEGIS), "Degrees and Other Formal Awards Conferred" surveys, various years; and Integrated Postsecondary Education Data System (IPEDS), "Completions" surveys, various years. As published in NCES, Digest of Education Statistics: 1996, table 268, p. 295, 1996.
Table A4-21. First-professional degrees conferred by institutions of higher education, by race/ethnicity and sex of student: Selected years, 1976-77 to 1993-94
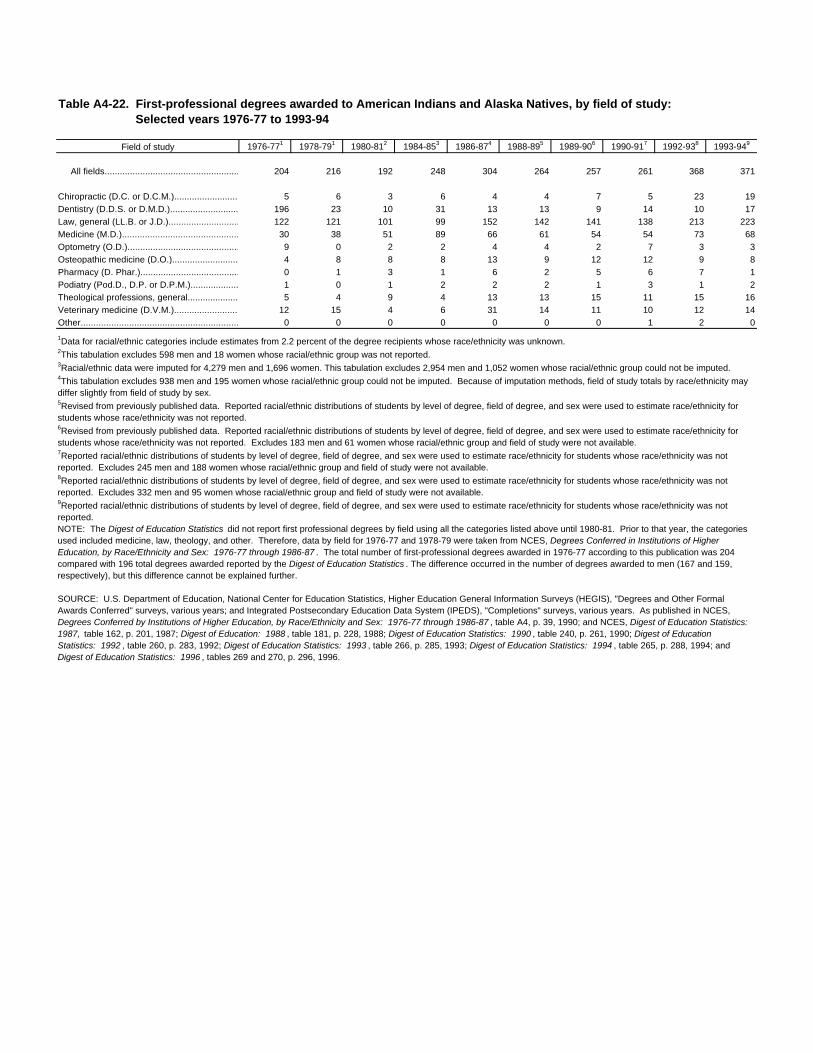
Field of study 1976-771 1978-791 1980-812 1984-853 1986-874 1988-895 1989-906 1990-917 1992-938 1993-949
All fields............................................................................204 216 192 248 304 264 257 261 368 371
Chiropractic (D.C. or D.C.M.)......................................... 5 6 3 6 4 4 7 5 23 19Dentistry (D.D.S. or D.M.D.)..................................... 196 23 10 31 13 13 9 14 10 17Law, general (LL.B. or J.D.)......................................... 122 121 101 99 152 142 141 138 213 223Medicine (M.D.)......................................................... 30 38 51 89 66 61 54 54 73 68Optometry (O.D.)................................................... 9 0 2 2 4 4 2 7 3 3Osteopathic medicine (D.O.)...................................... 4 8 8 8 13 9 12 12 9 8Pharmacy (D. Phar.)..................................................... 0 1 3 1 6 2 5 6 7 1Podiatry (Pod.D., D.P. or D.P.M.)................................ 1 0 1 2 2 2 1 3 1 2Theological professions, general................................. 5 4 9 4 13 13 15 11 15 16Veterinary medicine (D.V.M.)......................................... 12 15 4 6 31 14 11 10 12 14Other.......................................................................... 0 0 0 0 0 0 0 1 2 0
Table A4-22. First-professional degrees awarded to American Indians and Alaska Natives, by field of study: Selected years 1976-77 to 1993-94
1Data for racial/ethnic categories include estimates from 2.2 percent of the degree recipients whose race/ethnicity was unknown. 2This tabulation excludes 598 men and 18 women whose racial/ethnic group was not reported.3Racial/ethnic data were imputed for 4,279 men and 1,696 women. This tabulation excludes 2,954 men and 1,052 women whose racial/ethnic group could not be imputed.4This tabulation excludes 938 men and 195 women whose racial/ethnic group could not be imputed. Because of imputation methods, field of study totals by race/ethnicity may differ slightly from field of study by sex.5Revised from previously published data. Reported racial/ethnic distributions of students by level of degree, field of degree, and sex were used to estimate race/ethnicity for students whose race/ethnicity was not reported.6Revised from previously published data. Reported racial/ethnic distributions of students by level of degree, field of degree, and sex were used to estimate race/ethnicity for students whose race/ethnicity was not reported. Excludes 183 men and 61 women whose racial/ethnic group and field of study were not available.7Reported racial/ethnic distributions of students by level of degree, field of degree, and sex were used to estimate race/ethnicity for students whose race/ethnicity was not reported. Excludes 245 men and 188 women whose racial/ethnic group and field of study were not available.8Reported racial/ethnic distributions of students by level of degree, field of degree, and sex were used to estimate race/ethnicity for students whose race/ethnicity was not reported. Excludes 332 men and 95 women whose racial/ethnic group and field of study were not available.9Reported racial/ethnic distributions of students by level of degree, field of degree, and sex were used to estimate race/ethnicity for students whose race/ethnicity was not reported.NOTE: The Digest of Education Statistics did not report first professional degrees by field using all the categories listed above until 1980-81. Prior to that year, the categories used included medicine, law, theology, and other. Therefore, data by field for 1976-77 and 1978-79 were taken from NCES, Degrees Conferred in Institutions of Higher Education, by Race/Ethnicity and Sex: 1976-77 through 1986-87 . The total number of first-professional degrees awarded in 1976-77 according to this publication was 204 compared with 196 total degrees awarded reported by the Digest of Education Statistics . The difference occurred in the number of degrees awarded to men (167 and 159, respectively), but this difference cannot be explained further.
SOURCE: U.S. Department of Education, National Center for Education Statistics, Higher Education General Information Surveys (HEGIS), "Degrees and Other Formal Awards Conferred" surveys, various years; and Integrated Postsecondary Education Data System (IPEDS), "Completions" surveys, various years. As published in NCES, Degrees Conferred by Institutions of Higher Education, by Race/Ethnicity and Sex: 1976-77 through 1986-87 , table A4, p. 39, 1990; and NCES, Digest of Education Statistics: 1987, table 162, p. 201, 1987; Digest of Education: 1988 , table 181, p. 228, 1988; Digest of Education Statistics: 1990 , table 240, p. 261, 1990; Digest of Education Statistics: 1992 , table 260, p. 283, 1992; Digest of Education Statistics: 1993 , table 266, p. 285, 1993; Digest of Education Statistics: 1994 , table 265, p. 288, 1994; and Digest of Education Statistics: 1996 , tables 269 and 270, p. 296, 1996.
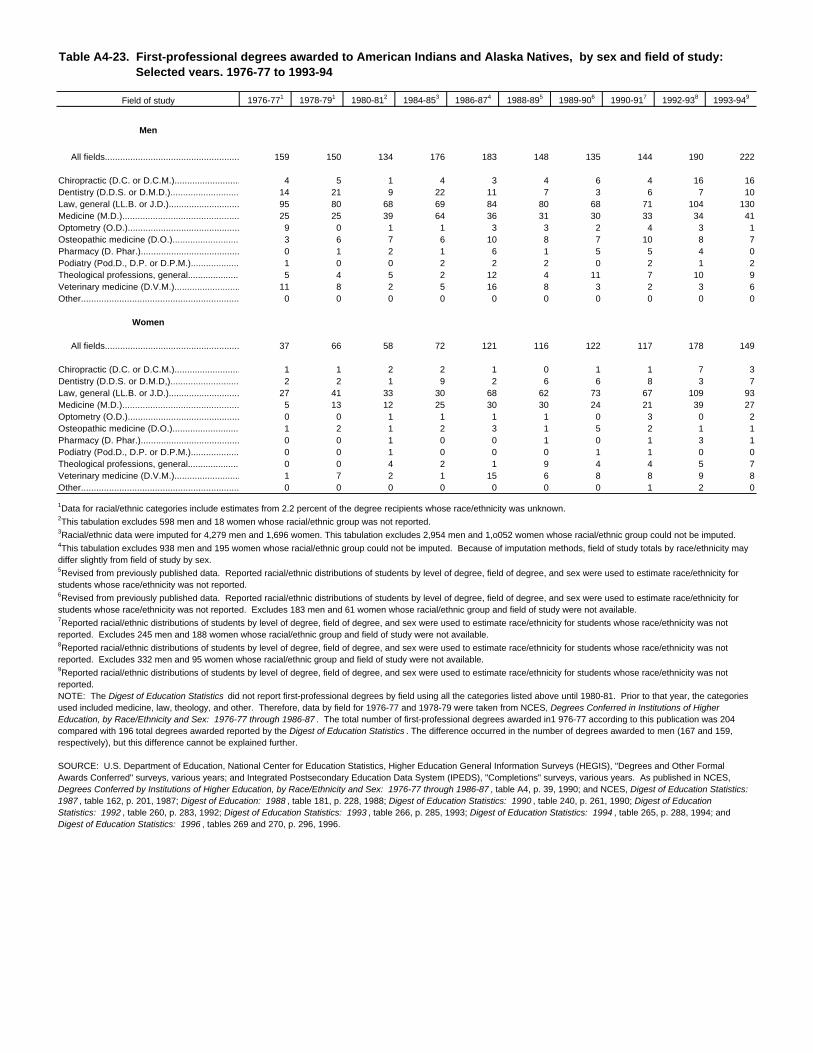
Field of study 1976-771 1978-791 1980-812 1984-853 1986-874 1988-895 1989-906 1990-917 1992-938 1993-949
Men
All fields...........................................................................159 150 134 176 183 148 135 144 190 222
Chiropractic (D.C. or D.C.M.)......................................... 4 5 1 4 3 4 6 4 16 16Dentistry (D.D.S. or D.M.D.)..................................... 14 21 9 22 11 7 3 6 7 10Law, general (LL.B. or J.D.)......................................... 95 80 68 69 84 80 68 71 104 130Medicine (M.D.)......................................................... 25 25 39 64 36 31 30 33 34 41Optometry (O.D.)................................................... 9 0 1 1 3 3 2 4 3 1Osteopathic medicine (D.O.)...................................... 3 6 7 6 10 8 7 10 8 7Pharmacy (D. Phar.)..................................................... 0 1 2 1 6 1 5 5 4 0Podiatry (Pod.D., D.P. or D.P.M.)................................ 1 0 0 2 2 2 0 2 1 2Theological professions, general................................. 5 4 5 2 12 4 11 7 10 9Veterinary medicine (D.V.M.)......................................... 11 8 2 5 16 8 3 2 3 6Other.......................................................................... 0 0 0 0 0 0 0 0 0 0
Women
All fields.......................................................................37 66 58 72 121 116 122 117 178 149
Chiropractic (D.C. or D.C.M.)......................................... 1 1 2 2 1 0 1 1 7 3Dentistry (D.D.S. or D.M.D,)..................................... 2 2 1 9 2 6 6 8 3 7Law, general (LL.B. or J.D.)......................................... 27 41 33 30 68 62 73 67 109 93Medicine (M.D.)......................................................... 5 13 12 25 30 30 24 21 39 27Optometry (O.D.)................................................... 0 0 1 1 1 1 0 3 0 2Osteopathic medicine (D.O.)...................................... 1 2 1 2 3 1 5 2 1 1Pharmacy (D. Phar.)..................................................... 0 0 1 0 0 1 0 1 3 1Podiatry (Pod.D., D.P. or D.P.M.)................................ 0 0 1 0 0 0 1 1 0 0Theological professions, general................................. 0 0 4 2 1 9 4 4 5 7Veterinary medicine (D.V.M.)......................................... 1 7 2 1 15 6 8 8 9 8Other.......................................................................... 0 0 0 0 0 0 0 1 2 0
Table A4-23. First-professional degrees awarded to American Indians and Alaska Natives, by sex and field of study: Selected years, 1976-77 to 1993-94
1Data for racial/ethnic categories include estimates from 2.2 percent of the degree recipients whose race/ethnicity was unknown. 2This tabulation excludes 598 men and 18 women whose racial/ethnic group was not reported.3Racial/ethnic data were imputed for 4,279 men and 1,696 women. This tabulation excludes 2,954 men and 1,o052 women whose racial/ethnic group could not be imputed.4This tabulation excludes 938 men and 195 women whose racial/ethnic group could not be imputed. Because of imputation methods, field of study totals by race/ethnicity may differ slightly from field of study by sex.5Revised from previously published data. Reported racial/ethnic distributions of students by level of degree, field of degree, and sex were used to estimate race/ethnicity for students whose race/ethnicity was not reported.6Revised from previously published data. Reported racial/ethnic distributions of students by level of degree, field of degree, and sex were used to estimate race/ethnicity for students whose race/ethnicity was not reported. Excludes 183 men and 61 women whose racial/ethnic group and field of study were not available.7Reported racial/ethnic distributions of students by level of degree, field of degree, and sex were used to estimate race/ethnicity for students whose race/ethnicity was not reported. Excludes 245 men and 188 women whose racial/ethnic group and field of study were not available.8Reported racial/ethnic distributions of students by level of degree, field of degree, and sex were used to estimate race/ethnicity for students whose race/ethnicity was not reported. Excludes 332 men and 95 women whose racial/ethnic group and field of study were not available.9Reported racial/ethnic distributions of students by level of degree, field of degree, and sex were used to estimate race/ethnicity for students whose race/ethnicity was not reported.NOTE: The Digest of Education Statistics did not report first-professional degrees by field using all the categories listed above until 1980-81. Prior to that year, the categories used included medicine, law, theology, and other. Therefore, data by field for 1976-77 and 1978-79 were taken from NCES, Degrees Conferred in Institutions of Higher Education, by Race/Ethnicity and Sex: 1976-77 through 1986-87 . The total number of first-professional degrees awarded in1 976-77 according to this publication was 204 compared with 196 total degrees awarded reported by the Digest of Education Statistics . The difference occurred in the number of degrees awarded to men (167 and 159, respectively), but this difference cannot be explained further.
SOURCE: U.S. Department of Education, National Center for Education Statistics, Higher Education General Information Surveys (HEGIS), "Degrees and Other Formal Awards Conferred" surveys, various years; and Integrated Postsecondary Education Data System (IPEDS), "Completions" surveys, various years. As published in NCES, Degrees Conferred by Institutions of Higher Education, by Race/Ethnicity and Sex: 1976-77 through 1986-87 , table A4, p. 39, 1990; and NCES, Digest of Education Statistics: 1987 , table 162, p. 201, 1987; Digest of Education: 1988 , table 181, p. 228, 1988; Digest of Education Statistics: 1990 , table 240, p. 261, 1990; Digest of Education Statistics: 1992 , table 260, p. 283, 1992; Digest of Education Statistics: 1993 , table 266, p. 285, 1993; Digest of Education Statistics: 1994 , table 265, p. 288, 1994; and Digest of Education Statistics: 1996 , tables 269 and 270, p. 296, 1996.
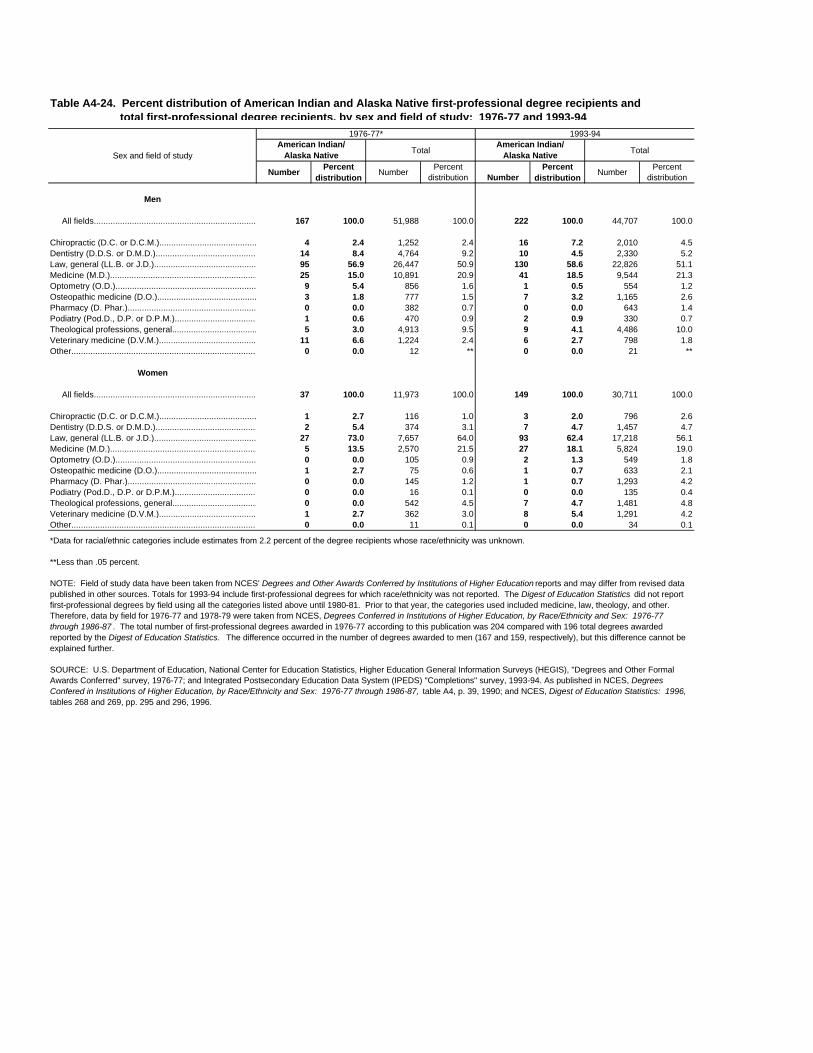
1976-77* 1993-94
Sex and field of studyAmerican Indian/
Alaska NativeTotal
American Indian/Alaska Native
Total
NumberPercent
distributionNumber
Percent distribution Number
Percent distribution
NumberPercent
distribution
Men
All fields.....................................................................................167 100.0 51,988 100.0 222 100.0 44,707 100.0
Chiropractic (D.C. or D.C.M.)............................................................ 4 2.4 1,252 2.4 16 7.2 2,010 4.5Dentistry (D.D.S. or D.M.D.)................................................................................14 8.4 4,764 9.2 10 4.5 2,330 5.2Law, general (LL.B. or J.D.)..................................................... 95 56.9 26,447 50.9 130 58.6 22,826 51.1Medicine (M.D.).......................................................................... 25 15.0 10,891 20.9 41 18.5 9,544 21.3Optometry (O.D.).......................................................................... 9 5.4 856 1.6 1 0.5 554 1.2Osteopathic medicine (D.O.)...................................................... 3 1.8 777 1.5 7 3.2 1,165 2.6Pharmacy (D. Phar.).................................................................... 0 0.0 382 0.7 0 0.0 643 1.4Podiatry (Pod.D., D.P. or D.P.M.).............................................. 1 0.6 470 0.9 2 0.9 330 0.7Theological professions, general................................................ 5 3.0 4,913 9.5 9 4.1 4,486 10.0Veterinary medicine (D.V.M.).................................................... 11 6.6 1,224 2.4 6 2.7 798 1.8Other............................................................................................. 0 0.0 12 ** 0 0.0 21 **
Women
All fields..................................................................................... 37 100.0 11,973 100.0 149 100.0 30,711 100.0
Chiropractic (D.C. or D.C.M.).................................................... 1 2.7 116 1.0 3 2.0 796 2.6Dentistry (D.D.S. or D.M.D.)...................................................... 2 5.4 374 3.1 7 4.7 1,457 4.7Law, general (LL.B. or J.D.).......................................................... 27 73.0 7,657 64.0 93 62.4 17,218 56.1Medicine (M.D.)......................................................................... 5 13.5 2,570 21.5 27 18.1 5,824 19.0Optometry (O.D.)....................................................................... 0 0.0 105 0.9 2 1.3 549 1.8Osteopathic medicine (D.O.)................................................... 1 2.7 75 0.6 1 0.7 633 2.1Pharmacy (D. Phar.).................................................................. 0 0.0 145 1.2 1 0.7 1,293 4.2Podiatry (Pod.D., D.P. or D.P.M.)................................................ 0 0.0 16 0.1 0 0.0 135 0.4Theological professions, general................................................................0 0.0 542 4.5 7 4.7 1,481 4.8Veterinary medicine (D.V.M.).................................................... 1 2.7 362 3.0 8 5.4 1,291 4.2Other.............................................................................................. 0 0.0 11 0.1 0 0.0 34 0.1
Table A4-24. Percent distribution of American Indian and Alaska Native first-professional degree recipients and total first-professional degree recipients, by sex and field of study: 1976-77 and 1993-94
*Data for racial/ethnic categories include estimates from 2.2 percent of the degree recipients whose race/ethnicity was unknown.
**Less than .05 percent.
NOTE: Field of study data have been taken from NCES' Degrees and Other Awards Conferred by Institutions of Higher Education reports and may differ from revised data published in other sources. Totals for 1993-94 include first-professional degrees for which race/ethnicity was not reported. The Digest of Education Statistics did not report first-professional degrees by field using all the categories listed above until 1980-81. Prior to that year, the categories used included medicine, law, theology, and other. Therefore, data by field for 1976-77 and 1978-79 were taken from NCES, Degrees Conferred in Institutions of Higher Education, by Race/Ethnicity and Sex: 1976-77 through 1986-87 . The total number of first-professional degrees awarded in 1976-77 according to this publication was 204 compared with 196 total degrees awarded reported by the Digest of Education Statistics. The difference occurred in the number of degrees awarded to men (167 and 159, respectively), but this difference cannot be explained further.
SOURCE: U.S. Department of Education, National Center for Education Statistics, Higher Education General Information Surveys (HEGIS), "Degrees and Other Formal Awards Conferred" survey, 1976-77; and Integrated Postsecondary Education Data System (IPEDS) "Completions" survey, 1993-94. As published in NCES, Degrees Confered in Institutions of Higher Education, by Race/Ethnicity and Sex: 1976-77 through 1986-87, table A4, p. 39, 1990; and NCES, Digest of Education Statistics: 1996, tables 268 and 269, pp. 295 and 296, 1996.
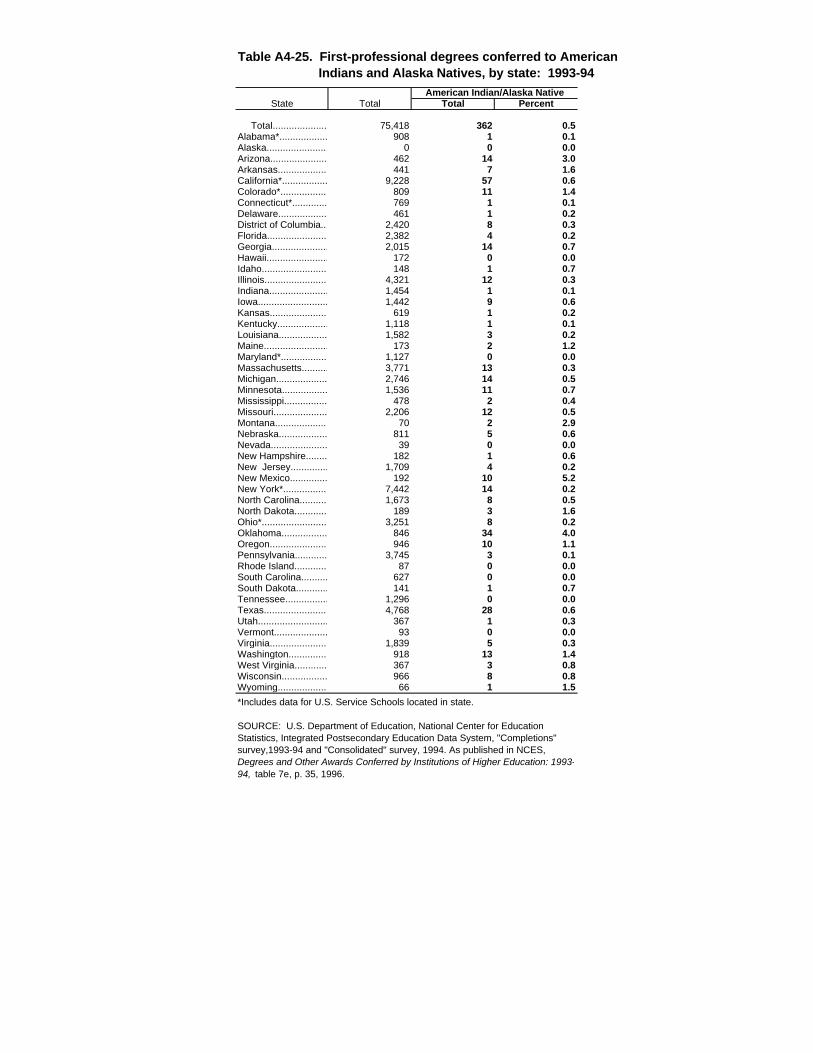
American Indian/Alaska NativeState Total Total Percent
Total....................................... 75,418 362 0.5Alabama*..................................... 908 1 0.1Alaska...................................... 0 0 0.0Arizona................................. 462 14 3.0Arkansas............................... 441 7 1.6California*................................. 9,228 57 0.6Colorado*................................. 809 11 1.4Connecticut*........................... 769 1 0.1Delaware................................ 461 1 0.2District of Columbia.................. 2,420 8 0.3Florida.................................. 2,382 4 0.2Georgia................................... 2,015 14 0.7Hawaii..................................... 172 0 0.0Idaho..................................... 148 1 0.7Illinois.................................... 4,321 12 0.3Indiana.................................. 1,454 1 0.1Iowa...................................... 1,442 9 0.6Kansas................................. 619 1 0.2Kentucky................................ 1,118 1 0.1Louisiana............................... 1,582 3 0.2Maine....................................... 173 2 1.2Maryland*................................. 1,127 0 0.0Massachusetts...................... 3,771 13 0.3Michigan................................. 2,746 14 0.5Minnesota............................. 1,536 11 0.7Mississippi........................... 478 2 0.4Missouri............................... 2,206 12 0.5Montana................................ 70 2 2.9Nebraska.............................. 811 5 0.6Nevada.................................... 39 0 0.0New Hampshire................... 182 1 0.6New Jersey............................. 1,709 4 0.2New Mexico........................... 192 10 5.2New York*.............................. 7,442 14 0.2North Carolina......................... 1,673 8 0.5North Dakota.......................... 189 3 1.6Ohio*...................................... 3,251 8 0.2Oklahoma............................. 846 34 4.0Oregon.................................. 946 10 1.1Pennsylvania..................................3,745 3 0.1Rhode Island............................. 87 0 0.0South Carolina......................... 627 0 0.0South Dakota........................ 141 1 0.7Tennessee.............................. 1,296 0 0.0Texas.................................... 4,768 28 0.6Utah....................................... 367 1 0.3Vermont................................ 93 0 0.0Virginia................................... 1,839 5 0.3Washington............................. 918 13 1.4West Virginia......................... 367 3 0.8Wisconsin.............................. 966 8 0.8Wyoming.............................. 66 1 1.5
Table A4-25. First-professional degrees conferred to American Indians and Alaska Natives, by state: 1993-94
*Includes data for U.S. Service Schools located in state.
SOURCE: U.S. Department of Education, National Center for Education Statistics, Integrated Postsecondary Education Data System, "Completions" survey,1993-94 and "Consolidated" survey, 1994. As published in NCES, Degrees and Other Awards Conferred by Institutions of Higher Education: 1993-94, table 7e, p. 35, 1996.
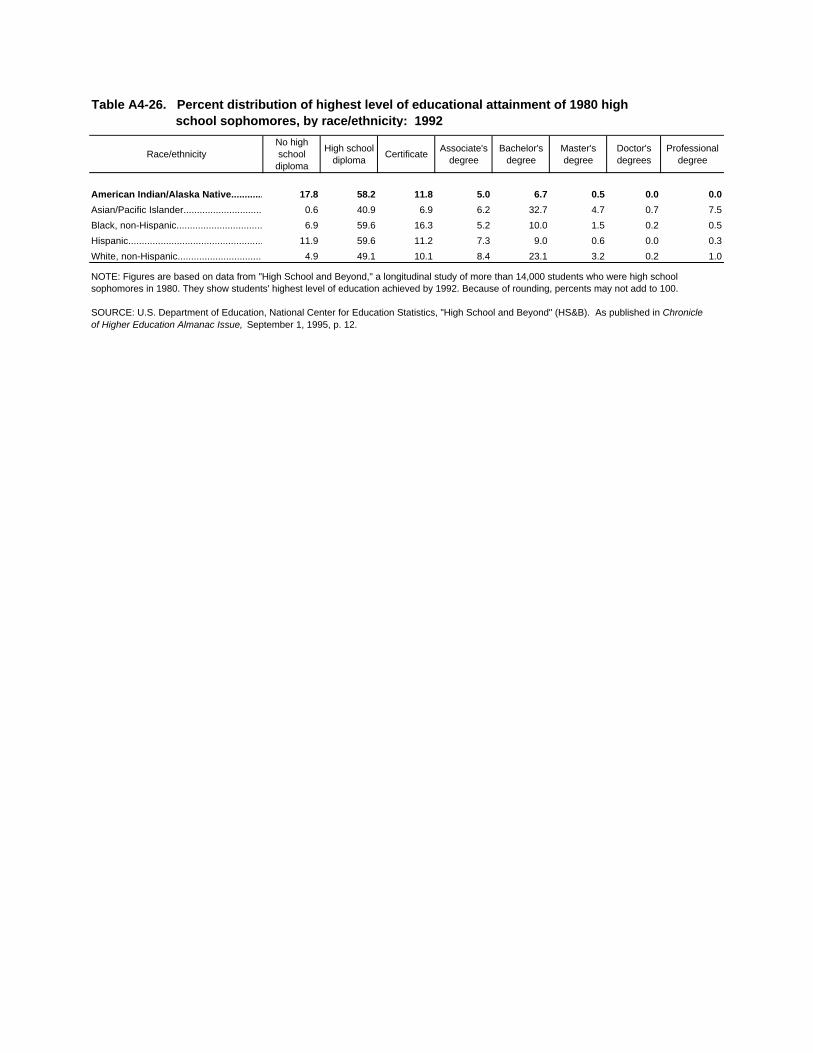
Race/ethnicityNo high school
diploma
High school diploma
CertificateAssociate's
degreeBachelor's
degreeMaster's degree
Doctor's degrees
Professional degree
American Indian/Alaska Native................................................17.8 58.2 11.8 5.0 6.7 0.5 0.0 0.0
Asian/Pacific Islander................................................................0.6 40.9 6.9 6.2 32.7 4.7 0.7 7.5
Black, non-Hispanic............................................. 6.9 59.6 16.3 5.2 10.0 1.5 0.2 0.5
Hispanic...................................................... 11.9 59.6 11.2 7.3 9.0 0.6 0.0 0.3
White, non-Hispanic........................................... 4.9 49.1 10.1 8.4 23.1 3.2 0.2 1.0
Table A4-26. Percent distribution of highest level of educational attainment of 1980 high school sophomores, by race/ethnicity: 1992
NOTE: Figures are based on data from "High School and Beyond," a longitudinal study of more than 14,000 students who were high school sophomores in 1980. They show students' highest level of education achieved by 1992. Because of rounding, percents may not add to 100.
SOURCE: U.S. Department of Education, National Center for Education Statistics, "High School and Beyond" (HS&B). As published in Chronicle of Higher Education Almanac Issue, September 1, 1995, p. 12.
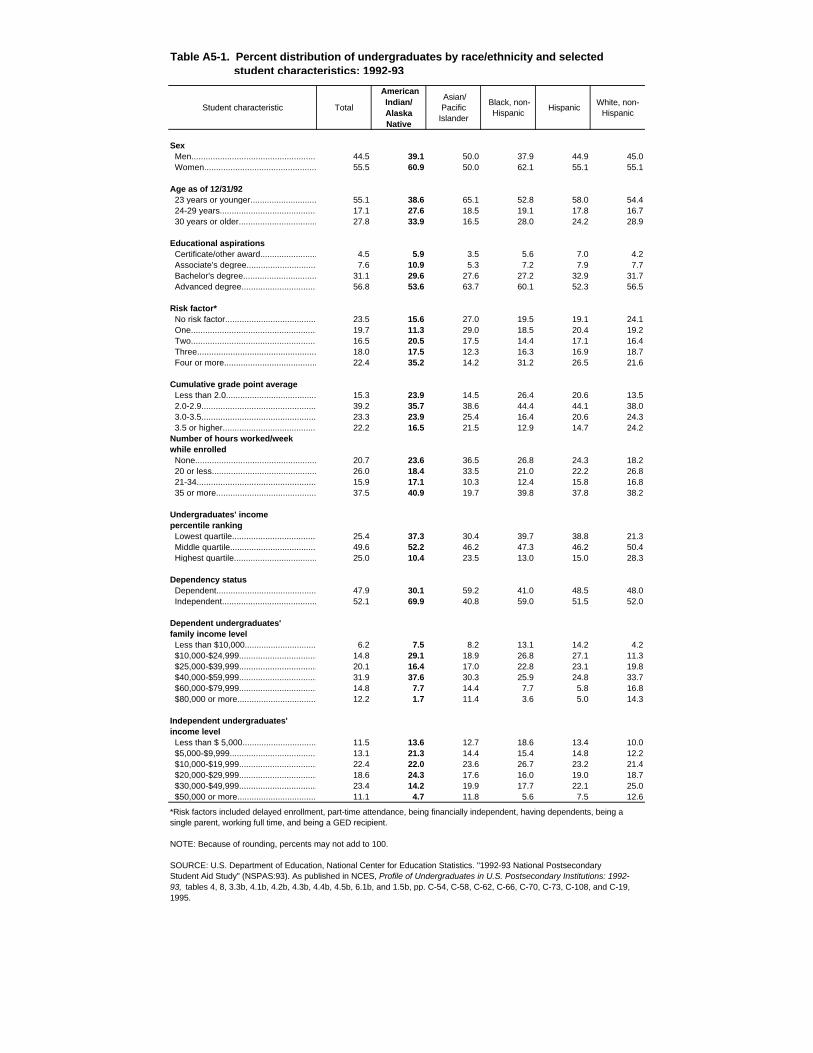
Student characteristic Total
American Indian/ Alaska Native
Asian/Pacific
Islander
Black, non-Hispanic
Hispanic White, non-
Hispanic
Sex Men.....................................................................44.5 39.1 50.0 37.9 44.9 45.0 Women.....................................................................55.5 60.9 50.0 62.1 55.1 55.1
Age as of 12/31/92 23 years or younger................................................55.1 38.6 65.1 52.8 58.0 54.4 24-29 years................................................................17.1 27.6 18.5 19.1 17.8 16.7 30 years or older........................................................27.8 33.9 16.5 28.0 24.2 28.9
Educational aspirations Certificate/other award...........................................4.5 5.9 3.5 5.6 7.0 4.2 Associate's degree................................................7.6 10.9 5.3 7.2 7.9 7.7 Bachelor's degree.................................................31.1 29.6 27.6 27.2 32.9 31.7 Advanced degree.................................................56.8 53.6 63.7 60.1 52.3 56.5
Risk factor* No risk factor.......................................................23.5 15.6 27.0 19.5 19.1 24.1 One...........................................................................19.7 11.3 29.0 18.5 20.4 19.2 Two........................................................................16.5 20.5 17.5 14.4 17.1 16.4 Three............................................................ 18.0 17.5 12.3 16.3 16.9 18.7 Four or more........................................................22.4 35.2 14.2 31.2 26.5 21.6
Cumulative grade point average Less than 2.0.................................................... 15.3 23.9 14.5 26.4 20.6 13.5 2.0-2.9............................................................ 39.2 35.7 38.6 44.4 44.1 38.0 3.0-3.5.............................................................. 23.3 23.9 25.4 16.4 20.6 24.3 3.5 or higher..................................................... 22.2 16.5 21.5 12.9 14.7 24.2Number of hours worked/week while enrolled None............................................................. 20.7 23.6 36.5 26.8 24.3 18.2 20 or less......................................................... 26.0 18.4 33.5 21.0 22.2 26.8 21-34...................................................................15.9 17.1 10.3 12.4 15.8 16.8 35 or more......................................................... 37.5 40.9 19.7 39.8 37.8 38.2
Undergraduates' income percentile ranking Lowest quartile...................................................25.4 37.3 30.4 39.7 38.8 21.3 Middle quartile.......................................................49.6 52.2 46.2 47.3 46.2 50.4 Highest quartile....................................................25.0 10.4 23.5 13.0 15.0 28.3
Dependency status Dependent...................................................... 47.9 30.1 59.2 41.0 48.5 48.0 Independent..........................................................52.1 69.9 40.8 59.0 51.5 52.0
Dependent undergraduates' family income level Less than $10,000............................................ 6.2 7.5 8.2 13.1 14.2 4.2 $10,000-$24,999......................................................14.8 29.1 18.9 26.8 27.1 11.3 $25,000-$39,999......................................................20.1 16.4 17.0 22.8 23.1 19.8 $40,000-$59,999......................................................31.9 37.6 30.3 25.9 24.8 33.7 $60,000-$79,999......................................................14.8 7.7 14.4 7.7 5.8 16.8 $80,000 or more.....................................................12.2 1.7 11.4 3.6 5.0 14.3
Independent undergraduates'income level Less than $ 5,000..................................................11.5 13.6 12.7 18.6 13.4 10.0 $5,000-$9,999......................................................13.1 21.3 14.4 15.4 14.8 12.2 $10,000-$19,999......................................................22.4 22.0 23.6 26.7 23.2 21.4 $20,000-$29,999......................................................18.6 24.3 17.6 16.0 19.0 18.7 $30,000-$49,999......................................................23.4 14.2 19.9 17.7 22.1 25.0 $50,000 or more....................................................11.1 4.7 11.8 5.6 7.5 12.6
*Risk factors included delayed enrollment, part-time attendance, being financially independent, having dependents, being a single parent, working full time, and being a GED recipient.
NOTE: Because of rounding, percents may not add to 100.
SOURCE: U.S. Department of Education, National Center for Education Statistics. "1992-93 National PostsecondaryStudent Aid Study" (NSPAS:93). As published in NCES, Profile of Undergraduates in U.S. Postsecondary Institutions: 1992-93, tables 4, 8, 3.3b, 4.1b, 4.2b, 4.3b, 4.4b, 4.5b, 6.1b, and 1.5b, pp. C-54, C-58, C-62, C-66, C-70, C-73, C-108, and C-19, 1995.
Table A5-1. Percent distribution of undergraduates by race/ethnicity and selected student characteristics: 1992-93
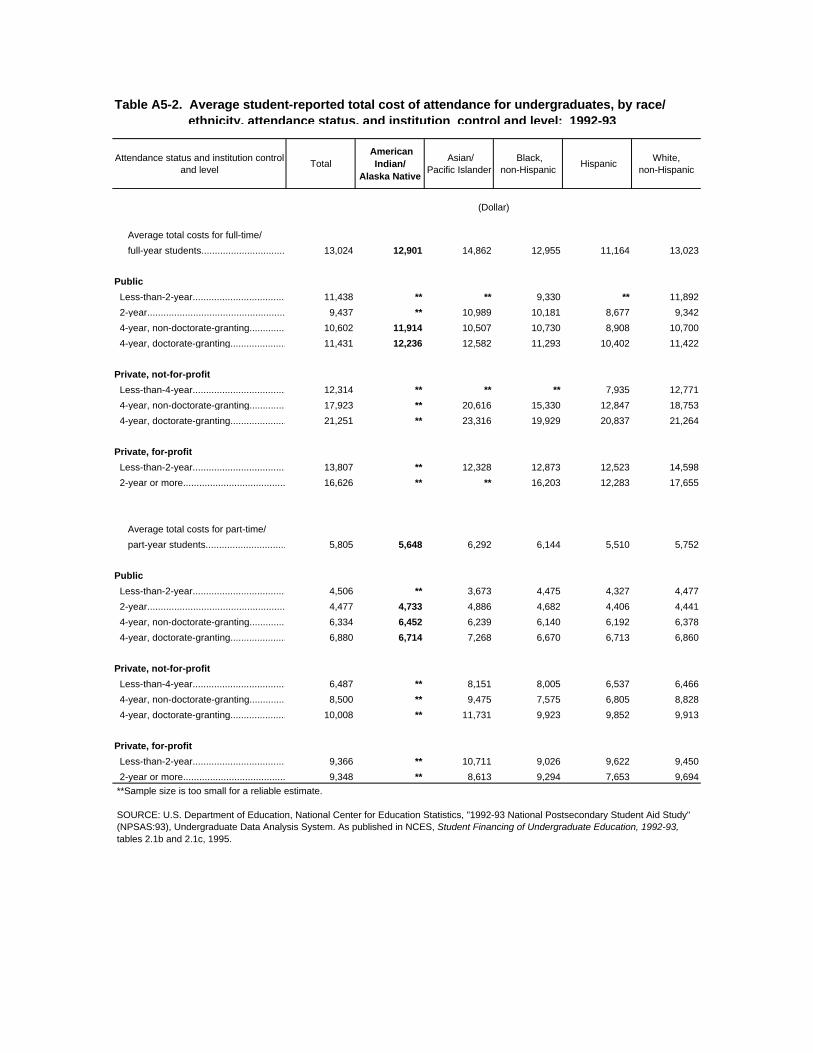
Attendance status and institution control and level
Total American
Indian/ Alaska Native
Asian/Pacific Islander
Black, non-Hispanic
Hispanic White,
non-Hispanic
(Dollar)
Average total costs for full-time/
full-year students............................................. 13,024 12,901 14,862 12,955 11,164 13,023
Public
Less-than-2-year.............................................. 11,438 ** ** 9,330 ** 11,892
2-year.............................................................. 9,437 ** 10,989 10,181 8,677 9,342
4-year, non-doctorate-granting...............................10,602 11,914 10,507 10,730 8,908 10,700
4-year, doctorate-granting............................... 11,431 12,236 12,582 11,293 10,402 11,422
Private, not-for-profit
Less-than-4-year............................................... 12,314 ** ** ** 7,935 12,771
4-year, non-doctorate-granting...............................17,923 ** 20,616 15,330 12,847 18,753
4-year, doctorate-granting............................... 21,251 ** 23,316 19,929 20,837 21,264
Private, for-profit
Less-than-2-year.............................................. 13,807 ** 12,328 12,873 12,523 14,598
2-year or more..............................................................16,626 ** ** 16,203 12,283 17,655
Average total costs for part-time/
part-year students........................................ 5,805 5,648 6,292 6,144 5,510 5,752
Public
Less-than-2-year.............................................. 4,506 ** 3,673 4,475 4,327 4,477
2-year.............................................................. 4,477 4,733 4,886 4,682 4,406 4,441
4-year, non-doctorate-granting...............................6,334 6,452 6,239 6,140 6,192 6,378
4-year, doctorate-granting............................... 6,880 6,714 7,268 6,670 6,713 6,860
Private, not-for-profit
Less-than-4-year............................................... 6,487 ** 8,151 8,005 6,537 6,466
4-year, non-doctorate-granting...............................8,500 ** 9,475 7,575 6,805 8,828
4-year, doctorate-granting............................... 10,008 ** 11,731 9,923 9,852 9,913
Private, for-profit
Less-than-2-year.............................................. 9,366 ** 10,711 9,026 9,622 9,450
2-year or more..............................................................9,348 ** 8,613 9,294 7,653 9,694
Table A5-2. Average student-reported total cost of attendance for undergraduates, by race/ ethnicity, attendance status, and institution control and level: 1992-93
**Sample size is too small for a reliable estimate.
SOURCE: U.S. Department of Education, National Center for Education Statistics, "1992-93 National Postsecondary Student Aid Study" (NPSAS:93), Undergraduate Data Analysis System. As published in NCES, Student Financing of Undergraduate Education, 1992-93, tables 2.1b and 2.1c, 1995.
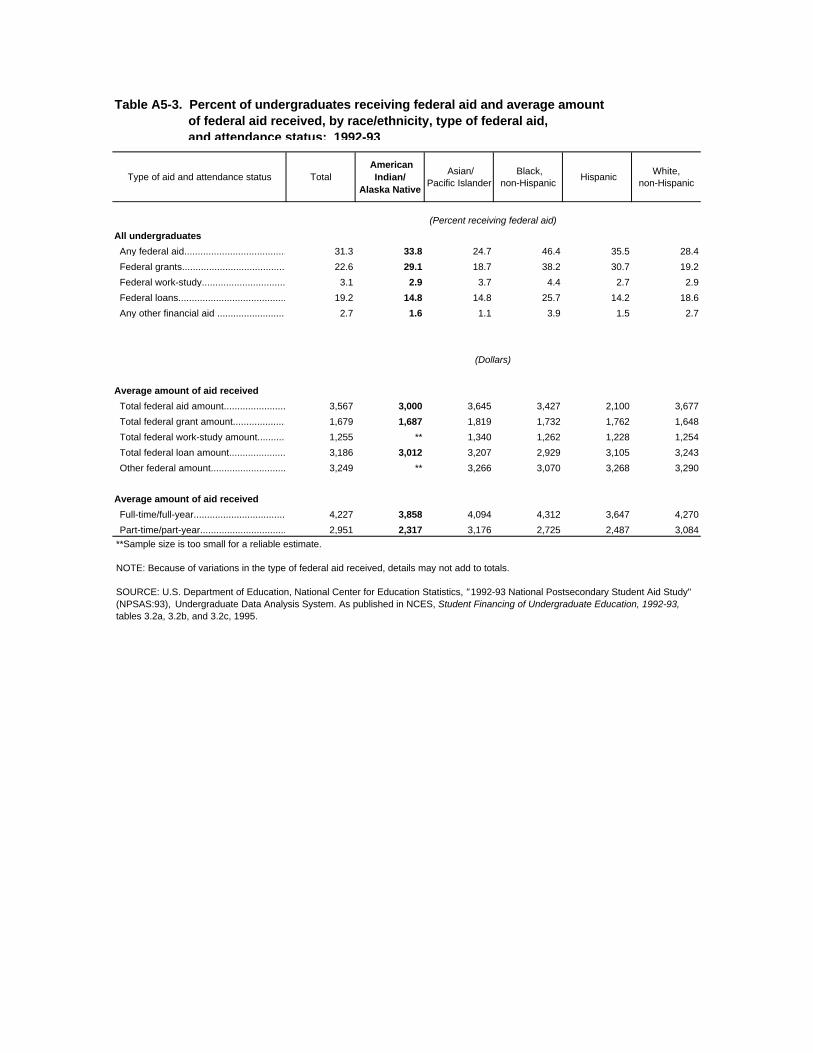
Type of aid and attendance status Total American
Indian/ Alaska Native
Asian/Pacific Islander
Black, non-Hispanic
Hispanic White,
non-Hispanic
(Percent receiving federal aid)
All undergraduates
Any federal aid..................................................................31.3 33.8 24.7 46.4 35.5 28.4
Federal grants..........................................................22.6 29.1 18.7 38.2 30.7 19.2
Federal work-study.......................................................3.1 2.9 3.7 4.4 2.7 2.9
Federal loans...........................................................19.2 14.8 14.8 25.7 14.2 18.6
Any other financial aid ................................... 2.7 1.6 1.1 3.9 1.5 2.7
(Dollars)
Average amount of aid received
Total federal aid amount.................................................................3,567 3,000 3,645 3,427 2,100 3,677
Total federal grant amount..........................................................1,679 1,687 1,819 1,732 1,762 1,648
Total federal work-study amount.......................................................1,255 ** 1,340 1,262 1,228 1,254
Total federal loan amount..........................................................3,186 3,012 3,207 2,929 3,105 3,243
Other federal amount.................................... 3,249 ** 3,266 3,070 3,268 3,290
Average amount of aid received
Full-time/full-year..................................... 4,227 3,858 4,094 4,312 3,647 4,270
Part-time/part-year............................................... 2,951 2,317 3,176 2,725 2,487 3,084
**Sample size is too small for a reliable estimate.
NOTE: Because of variations in the type of federal aid received, details may not add to totals.
SOURCE: U.S. Department of Education, National Center for Education Statistics, " 1992-93 National Postsecondary Student Aid Study" (NPSAS:93), Undergraduate Data Analysis System. As published in NCES, Student Financing of Undergraduate Education, 1992-93, tables 3.2a, 3.2b, and 3.2c, 1995.
Table A5-3. Percent of undergraduates receiving federal aid and average amount of federal aid received, by race/ethnicity, type of federal aid, and attendance status: 1992-93
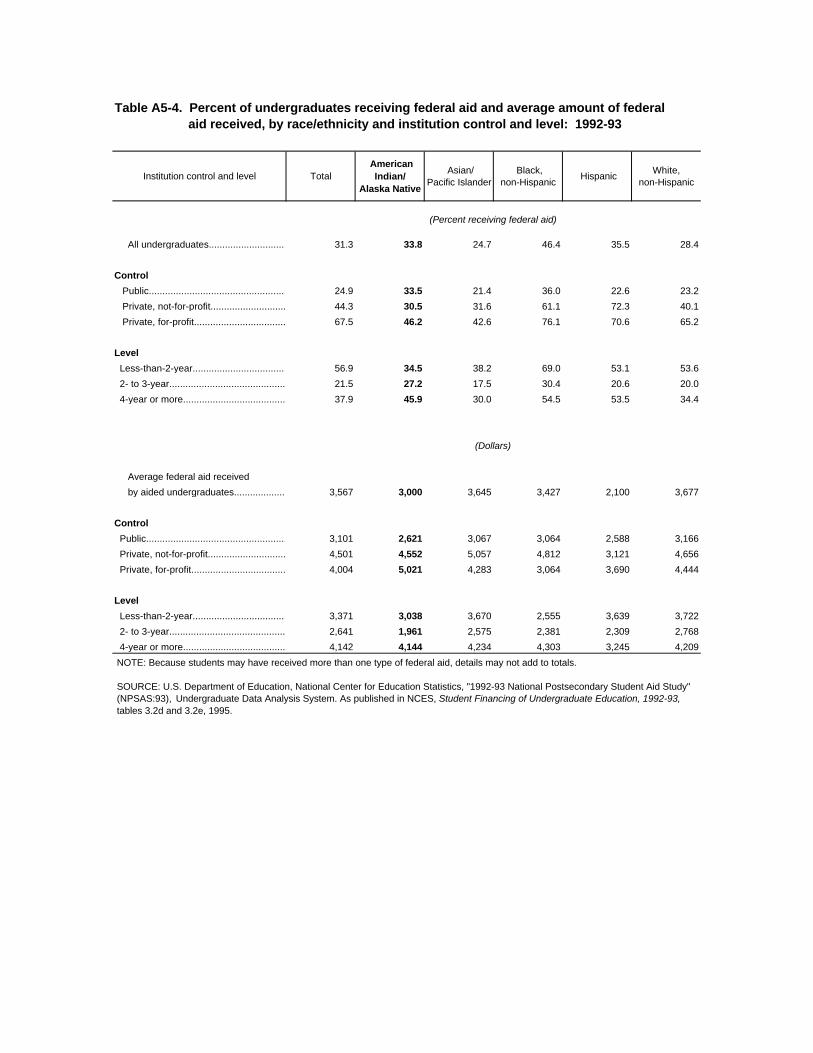
Institution control and level Total American
Indian/ Alaska Native
Asian/Pacific Islander
Black, non-Hispanic
Hispanic White,
non-Hispanic
(Percent receiving federal aid)
All undergraduates..................................................31.3 33.8 24.7 46.4 35.5 28.4
Control
Public................................................................... 24.9 33.5 21.4 36.0 22.6 23.2
Private, not-for-profit......................................... 44.3 30.5 31.6 61.1 72.3 40.1
Private, for-profit....................................................67.5 46.2 42.6 76.1 70.6 65.2
Level
Less-than-2-year................................................ 56.9 34.5 38.2 69.0 53.1 53.6
2- to 3-year........................................................... 21.5 27.2 17.5 30.4 20.6 20.0
4-year or more................................................. 37.9 45.9 30.0 54.5 53.5 34.4
(Dollars)
Average federal aid received
by aided undergraduates........................ 3,567 3,000 3,645 3,427 2,100 3,677
Control
Public................................................................ 3,101 2,621 3,067 3,064 2,588 3,166
Private, not-for-profit...................................... 4,501 4,552 5,057 4,812 3,121 4,656
Private, for-profit................................................. 4,004 5,021 4,283 3,064 3,690 4,444
Level
Less-than-2-year.............................................. 3,371 3,038 3,670 2,555 3,639 3,722
2- to 3-year...........................................................2,641 1,961 2,575 2,381 2,309 2,768
4-year or more................................................. 4,142 4,144 4,234 4,303 3,245 4,209
NOTE: Because students may have received more than one type of federal aid, details may not add to totals.
SOURCE: U.S. Department of Education, National Center for Education Statistics, "1992-93 National Postsecondary Student Aid Study" (NPSAS:93), Undergraduate Data Analysis System. As published in NCES, Student Financing of Undergraduate Education, 1992-93, tables 3.2d and 3.2e, 1995.
Table A5-4. Percent of undergraduates receiving federal aid and average amount of federal aid received, by race/ethnicity and institution control and level: 1992-93
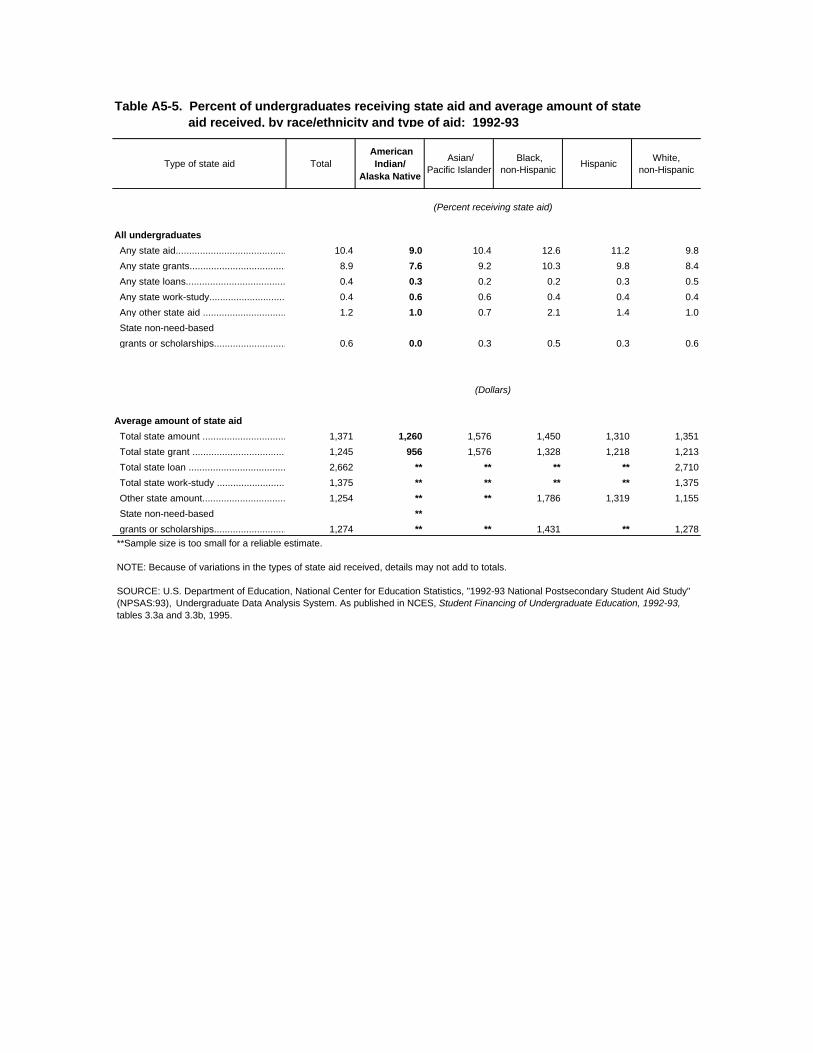
Type of state aid Total American
Indian/ Alaska Native
Asian/Pacific Islander
Black, non-Hispanic
Hispanic White,
non-Hispanic
(Percent receiving state aid)
All undergraduates
Any state aid.................................................................10.4 9.0 10.4 12.6 11.2 9.8
Any state grants..........................................................8.9 7.6 9.2 10.3 9.8 8.4
Any state loans...................................................... 0.4 0.3 0.2 0.2 0.3 0.5
Any state work-study............................................ 0.4 0.6 0.6 0.4 0.4 0.4
Any other state aid ................................... 1.2 1.0 0.7 2.1 1.4 1.0
State non-need-based
grants or scholarships....................................... 0.6 0.0 0.3 0.5 0.3 0.6
(Dollars)
Average amount of state aid
Total state amount ................................................................1,371 1,260 1,576 1,450 1,310 1,351
Total state grant .........................................................1,245 956 1,576 1,328 1,218 1,213
Total state loan ..........................................................2,662 ** ** ** ** 2,710
Total state work-study ......................................................1,375 ** ** ** ** 1,375
Other state amount.................................... 1,254 ** ** 1,786 1,319 1,155
State non-need-based **
grants or scholarships....................................... 1,274 ** ** 1,431 ** 1,278
**Sample size is too small for a reliable estimate.
NOTE: Because of variations in the types of state aid received, details may not add to totals.
SOURCE: U.S. Department of Education, National Center for Education Statistics, "1992-93 National Postsecondary Student Aid Study" (NPSAS:93), Undergraduate Data Analysis System. As published in NCES, Student Financing of Undergraduate Education, 1992-93, tables 3.3a and 3.3b, 1995.
Table A5-5. Percent of undergraduates receiving state aid and average amount of state aid received, by race/ethnicity and type of aid: 1992-93
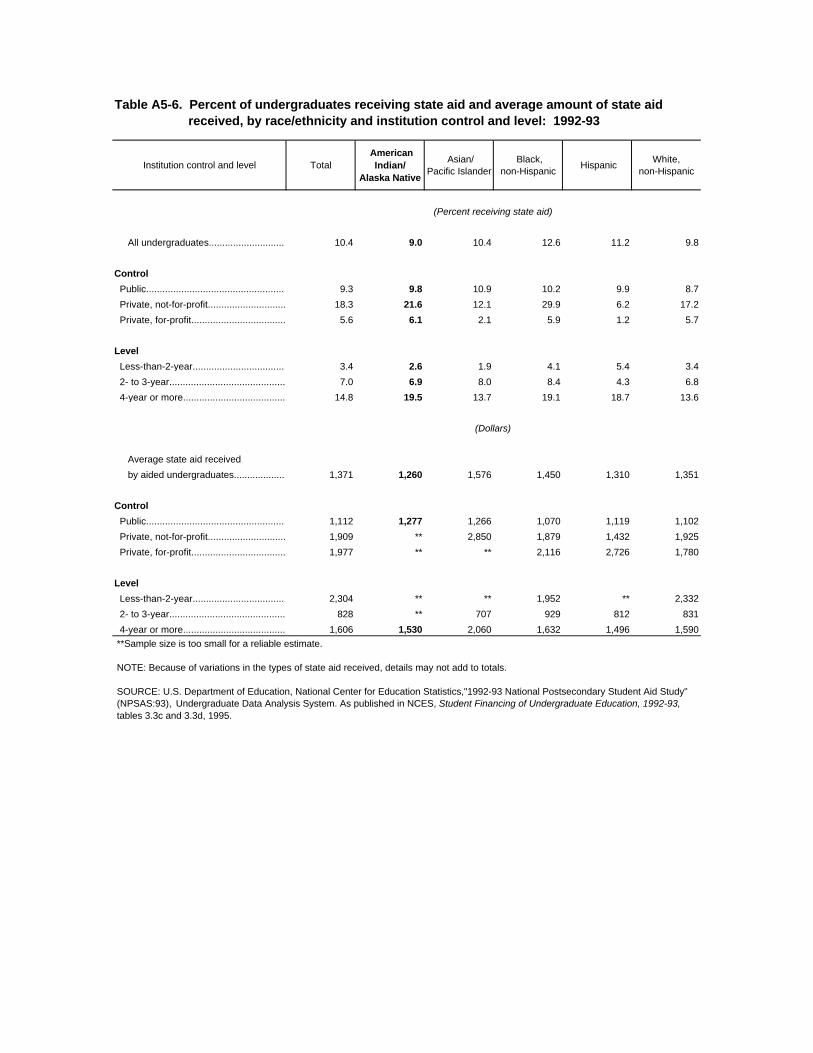
Institution control and level Total American
Indian/ Alaska Native
Asian/Pacific Islander
Black, non-Hispanic
Hispanic White,
non-Hispanic
(Percent receiving state aid)
All undergraduates.......................................................10.4 9.0 10.4 12.6 11.2 9.8
Control
Public.................................................................... 9.3 9.8 10.9 10.2 9.9 8.7
Private, not-for-profit......................................... 18.3 21.6 12.1 29.9 6.2 17.2
Private, for-profit.................................................... 5.6 6.1 2.1 5.9 1.2 5.7
Level
Less-than-2-year.............................................. 3.4 2.6 1.9 4.1 5.4 3.4
2- to 3-year........................................................... 7.0 6.9 8.0 8.4 4.3 6.8
4-year or more................................................. 14.8 19.5 13.7 19.1 18.7 13.6
(Dollars)
Average state aid received
by aided undergraduates................... 1,371 1,260 1,576 1,450 1,310 1,351
Control
Public................................................................ 1,112 1,277 1,266 1,070 1,119 1,102
Private, not-for-profit...................................... 1,909 ** 2,850 1,879 1,432 1,925
Private, for-profit................................................. 1,977 ** ** 2,116 2,726 1,780
Level
Less-than-2-year.............................................. 2,304 ** ** 1,952 ** 2,332
2- to 3-year........................................................... 828 ** 707 929 812 831
4-year or more................................................. 1,606 1,530 2,060 1,632 1,496 1,590
**Sample size is too small for a reliable estimate.
NOTE: Because of variations in the types of state aid received, details may not add to totals.
SOURCE: U.S. Department of Education, National Center for Education Statistics,"1992-93 National Postsecondary Student Aid Study" (NPSAS:93), Undergraduate Data Analysis System. As published in NCES, Student Financing of Undergraduate Education, 1992-93, tables 3.3c and 3.3d, 1995.
Table A5-6. Percent of undergraduates receiving state aid and average amount of state aid received, by race/ethnicity and institution control and level: 1992-93
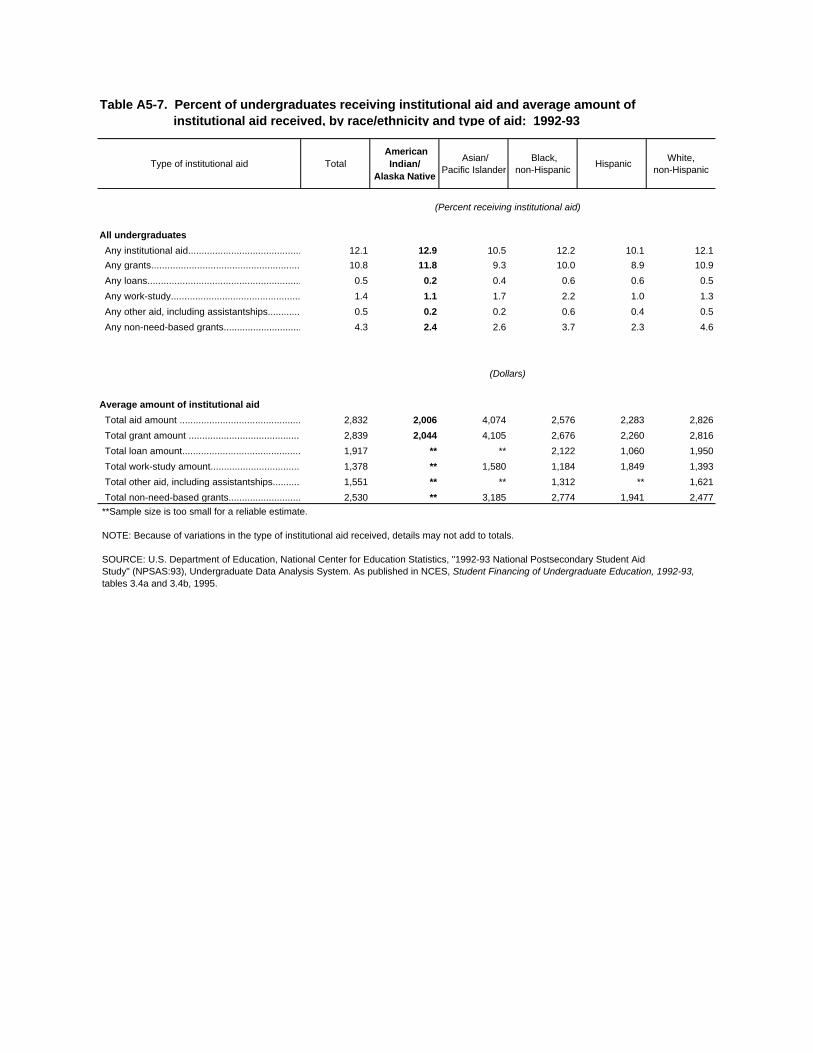
Type of institutional aid Total American
Indian/ Alaska Native
Asian/Pacific Islander
Black, non-Hispanic
Hispanic White,
non-Hispanic
(Percent receiving institutional aid)
All undergraduates
Any institutional aid.................................................................12.1 12.9 10.5 12.2 10.1 12.1
Any grants..................................................................... 10.8 11.8 9.3 10.0 8.9 10.9
Any loans....................................................................... 0.5 0.2 0.4 0.6 0.6 0.5
Any work-study.............................................................. 1.4 1.1 1.7 2.2 1.0 1.3
Any other aid, including assistantships...................................0.5 0.2 0.2 0.6 0.4 0.5
Any non-need-based grants............................................ 4.3 2.4 2.6 3.7 2.3 4.6
(Dollars)
Average amount of institutional aid
Total aid amount ................................................................2,832 2,006 4,074 2,576 2,283 2,826
Total grant amount ......................................................... 2,839 2,044 4,105 2,676 2,260 2,816
Total loan amount.......................................................... 1,917 ** ** 2,122 1,060 1,950
Total work-study amount.....................................................1,378 ** 1,580 1,184 1,849 1,393
Total other aid, including assistantships...................................1,551 ** ** 1,312 ** 1,621
Total non-need-based grants.......................................... 2,530 ** 3,185 2,774 1,941 2,477
**Sample size is too small for a reliable estimate.
NOTE: Because of variations in the type of institutional aid received, details may not add to totals.
SOURCE: U.S. Department of Education, National Center for Education Statistics, "1992-93 National Postsecondary Student AidStudy" (NPSAS:93), Undergraduate Data Analysis System. As published in NCES, Student Financing of Undergraduate Education, 1992-93, tables 3.4a and 3.4b, 1995.
Table A5-7. Percent of undergraduates receiving institutional aid and average amount of institutional aid received, by race/ethnicity and type of aid: 1992-93
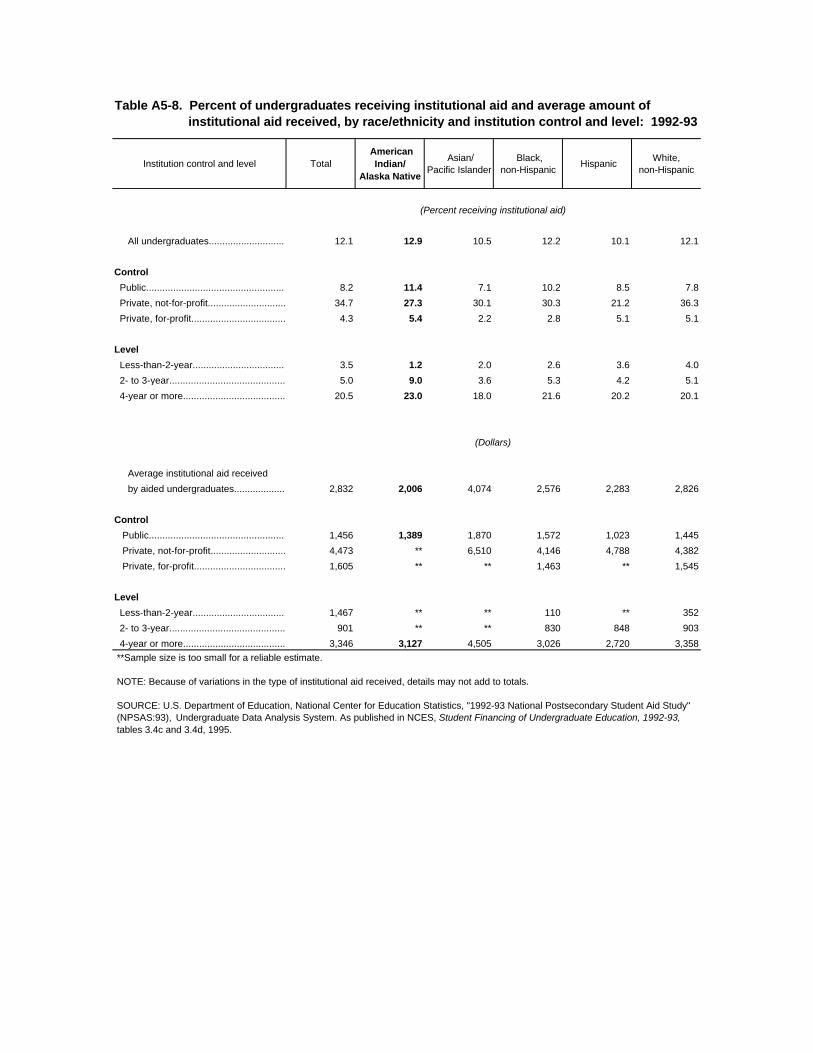
Institution control and level Total American
Indian/ Alaska Native
Asian/Pacific Islander
Black, non-Hispanic
Hispanic White,
non-Hispanic
(Percent receiving institutional aid)
All undergraduates...................................................12.1 12.9 10.5 12.2 10.1 12.1
Control
Public................................................................... 8.2 11.4 7.1 10.2 8.5 7.8
Private, not-for-profit......................................... 34.7 27.3 30.1 30.3 21.2 36.3
Private, for-profit................................................... 4.3 5.4 2.2 2.8 5.1 5.1
Level
Less-than-2-year.............................................. 3.5 1.2 2.0 2.6 3.6 4.0
2- to 3-year........................................................... 5.0 9.0 3.6 5.3 4.2 5.1
4-year or more................................................. 20.5 23.0 18.0 21.6 20.2 20.1
(Dollars)
Average institutional aid received
by aided undergraduates........................ 2,832 2,006 4,074 2,576 2,283 2,826
Control
Public................................................................ 1,456 1,389 1,870 1,572 1,023 1,445
Private, not-for-profit...................................... 4,473 ** 6,510 4,146 4,788 4,382
Private, for-profit................................................. 1,605 ** ** 1,463 ** 1,545
Level
Less-than-2-year.............................................. 1,467 ** ** 110 ** 352
2- to 3-year........................................................... 901 ** ** 830 848 903
4-year or more................................................. 3,346 3,127 4,505 3,026 2,720 3,358
**Sample size is too small for a reliable estimate.
NOTE: Because of variations in the type of institutional aid received, details may not add to totals.
SOURCE: U.S. Department of Education, National Center for Education Statistics, "1992-93 National Postsecondary Student Aid Study" (NPSAS:93), Undergraduate Data Analysis System. As published in NCES, Student Financing of Undergraduate Education, 1992-93, tables 3.4c and 3.4d, 1995.
Table A5-8. Percent of undergraduates receiving institutional aid and average amount of institutional aid received, by race/ethnicity and institution control and level: 1992-93
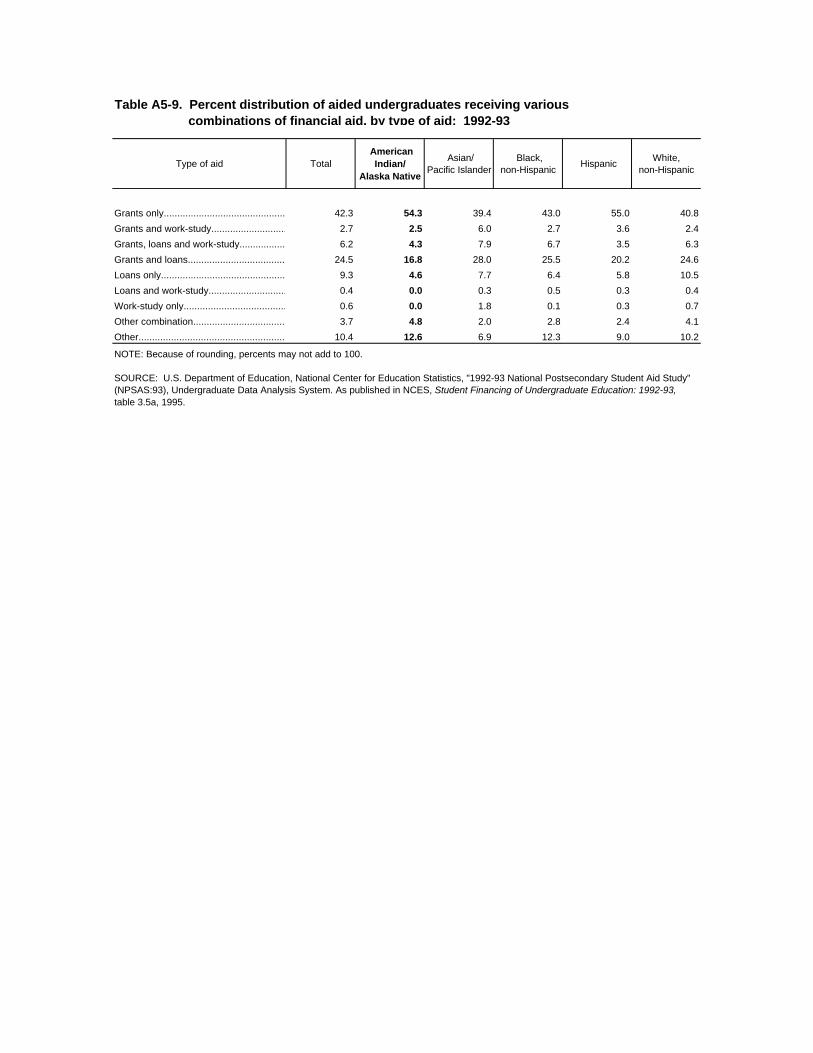
Type of aid Total American
Indian/ Alaska Native
Asian/Pacific Islander
Black,non-Hispanic
Hispanic White,
non-Hispanic
Grants only..................................................... 42.3 54.3 39.4 43.0 55.0 40.8
Grants and work-study.................................... 2.7 2.5 6.0 2.7 3.6 2.4
Grants, loans and work-study............................ 6.2 4.3 7.9 6.7 3.5 6.3
Grants and loans.............................................. 24.5 16.8 28.0 25.5 20.2 24.6
Loans only....................................................... 9.3 4.6 7.7 6.4 5.8 10.5
Loans and work-study........................................ 0.4 0.0 0.3 0.5 0.3 0.4
Work-study only................................................. 0.6 0.0 1.8 0.1 0.3 0.7
Other combination........................................................3.7 4.8 2.0 2.8 2.4 4.1
Other................................................................. 10.4 12.6 6.9 12.3 9.0 10.2
Table A5-9. Percent distribution of aided undergraduates receiving various combinations of financial aid, by type of aid: 1992-93
NOTE: Because of rounding, percents may not add to 100.
SOURCE: U.S. Department of Education, National Center for Education Statistics, "1992-93 National Postsecondary Student Aid Study" (NPSAS:93), Undergraduate Data Analysis System. As published in NCES, Student Financing of Undergraduate Education: 1992-93, table 3.5a, 1995.
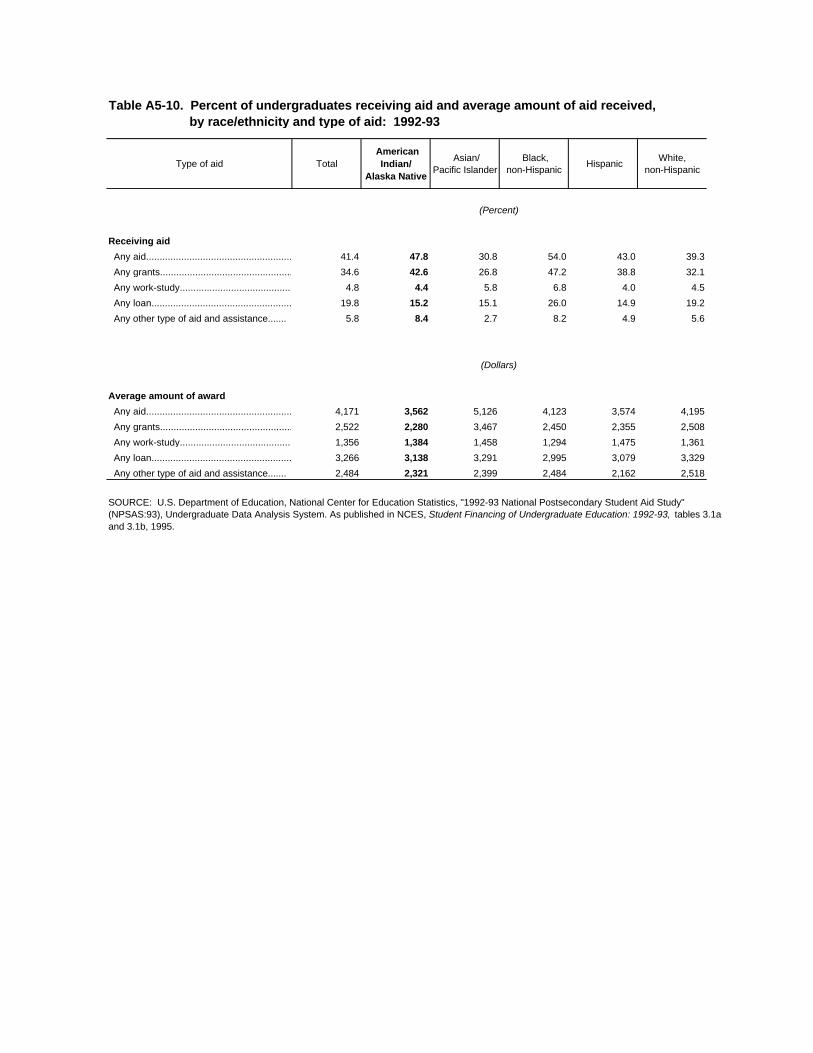
Type of aid Total American
Indian/ Alaska Native
Asian/Pacific Islander
Black, non-Hispanic
Hispanic White,
non-Hispanic
(Percent)
Receiving aid
Any aid.............................................................. 41.4 47.8 30.8 54.0 43.0 39.3
Any grants.....................................................................34.6 42.6 26.8 47.2 38.8 32.1
Any work-study................................................. 4.8 4.4 5.8 6.8 4.0 4.5
Any loan....................................................... 19.8 15.2 15.1 26.0 14.9 19.2
Any other type of aid and assistance....... 5.8 8.4 2.7 8.2 4.9 5.6
(Dollars)
Average amount of award
Any aid.............................................................. 4,171 3,562 5,126 4,123 3,574 4,195
Any grants.....................................................................2,522 2,280 3,467 2,450 2,355 2,508
Any work-study................................................. 1,356 1,384 1,458 1,294 1,475 1,361
Any loan....................................................... 3,266 3,138 3,291 2,995 3,079 3,329
Any other type of aid and assistance....... 2,484 2,321 2,399 2,484 2,162 2,518
SOURCE: U.S. Department of Education, National Center for Education Statistics, "1992-93 National Postsecondary Student Aid Study" (NPSAS:93), Undergraduate Data Analysis System. As published in NCES, Student Financing of Undergraduate Education: 1992-93, tables 3.1a and 3.1b, 1995.
Table A5-10. Percent of undergraduates receiving aid and average amount of aid received, by race/ethnicity and type of aid: 1992-93
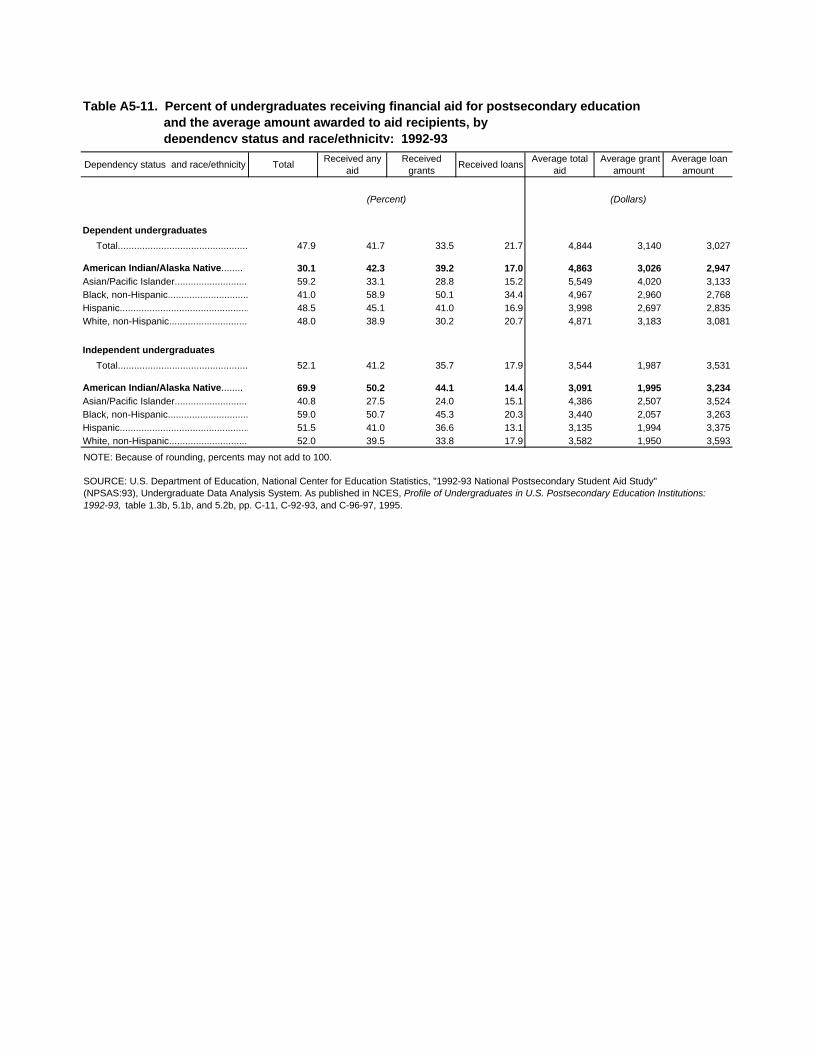
Dependency status and race/ethnicity TotalReceived any
aidReceived
grantsReceived loans
Average total aid
Average grant amount
Average loan amount
(Percent) (Dollars)
Dependent undergraduates
Total..................................................................47.9 41.7 33.5 21.7 4,844 3,140 3,027
American Indian/Alaska Native........ 30.1 42.3 39.2 17.0 4,863 3,026 2,947Asian/Pacific Islander........................... 59.2 33.1 28.8 15.2 5,549 4,020 3,133Black, non-Hispanic................................. 41.0 58.9 50.1 34.4 4,967 2,960 2,768Hispanic.................................................. 48.5 45.1 41.0 16.9 3,998 2,697 2,835White, non-Hispanic............................... 48.0 38.9 30.2 20.7 4,871 3,183 3,081
Independent undergraduates
Total..................................................................................52.1 41.2 35.7 17.9 3,544 1,987 3,531
American Indian/Alaska Native........ 69.9 50.2 44.1 14.4 3,091 1,995 3,234Asian/Pacific Islander........................... 40.8 27.5 24.0 15.1 4,386 2,507 3,524Black, non-Hispanic................................. 59.0 50.7 45.3 20.3 3,440 2,057 3,263Hispanic.................................................. 51.5 41.0 36.6 13.1 3,135 1,994 3,375White, non-Hispanic............................... 52.0 39.5 33.8 17.9 3,582 1,950 3,593
Table A5-11. Percent of undergraduates receiving financial aid for postsecondary education and the average amount awarded to aid recipients, by dependency status and race/ethnicity: 1992-93
NOTE: Because of rounding, percents may not add to 100.
SOURCE: U.S. Department of Education, National Center for Education Statistics, "1992-93 National Postsecondary Student Aid Study"(NPSAS:93), Undergraduate Data Analysis System. As published in NCES, Profile of Undergraduates in U.S. Postsecondary Education Institutions: 1992-93, table 1.3b, 5.1b, and 5.2b, pp. C-11, C-92-93, and C-96-97, 1995.
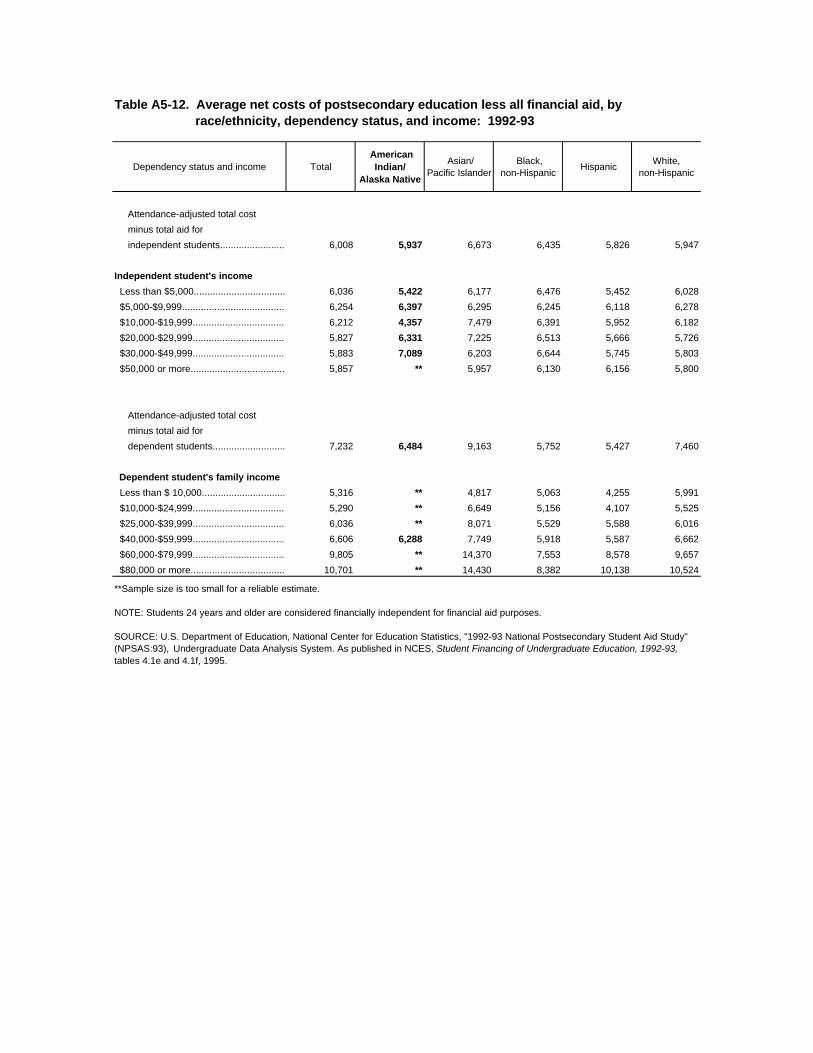
Dependency status and income Total American
Indian/ Alaska Native
Asian/Pacific Islander
Black, non-Hispanic
Hispanic White,
non-Hispanic
Attendance-adjusted total cost
minus total aid for
independent students...................................................6,008 5,937 6,673 6,435 5,826 5,947
Independent student's income
Less than $5,000..................................................6,036 5,422 6,177 6,476 5,452 6,028
$5,000-$9,999...................................................... 6,254 6,397 6,295 6,245 6,118 6,278
$10,000-$19,999......................................................6,212 4,357 7,479 6,391 5,952 6,182
$20,000-$29,999......................................................5,827 6,331 7,225 6,513 5,666 5,726
$30,000-$49,999......................................................5,883 7,089 6,203 6,644 5,745 5,803
$50,000 or more.....................................................5,857 ** 5,957 6,130 6,156 5,800
Attendance-adjusted total cost
minus total aid for
dependent students...................................................7,232 6,484 9,163 5,752 5,427 7,460
Dependent student's family income
Less than $ 10,000..................................................5,316 ** 4,817 5,063 4,255 5,991
$10,000-$24,999......................................................5,290 ** 6,649 5,156 4,107 5,525
$25,000-$39,999......................................................6,036 ** 8,071 5,529 5,588 6,016
$40,000-$59,999......................................................6,606 6,288 7,749 5,918 5,587 6,662
$60,000-$79,999......................................................9,805 ** 14,370 7,553 8,578 9,657
$80,000 or more.....................................................10,701 ** 14,430 8,382 10,138 10,524
Table A5-12. Average net costs of postsecondary education less all financial aid, by race/ethnicity, dependency status, and income: 1992-93
**Sample size is too small for a reliable estimate.
NOTE: Students 24 years and older are considered financially independent for financial aid purposes.
SOURCE: U.S. Department of Education, National Center for Education Statistics, "1992-93 National Postsecondary Student Aid Study" (NPSAS:93), Undergraduate Data Analysis System. As published in NCES, Student Financing of Undergraduate Education, 1992-93, tables 4.1e and 4.1f, 1995.
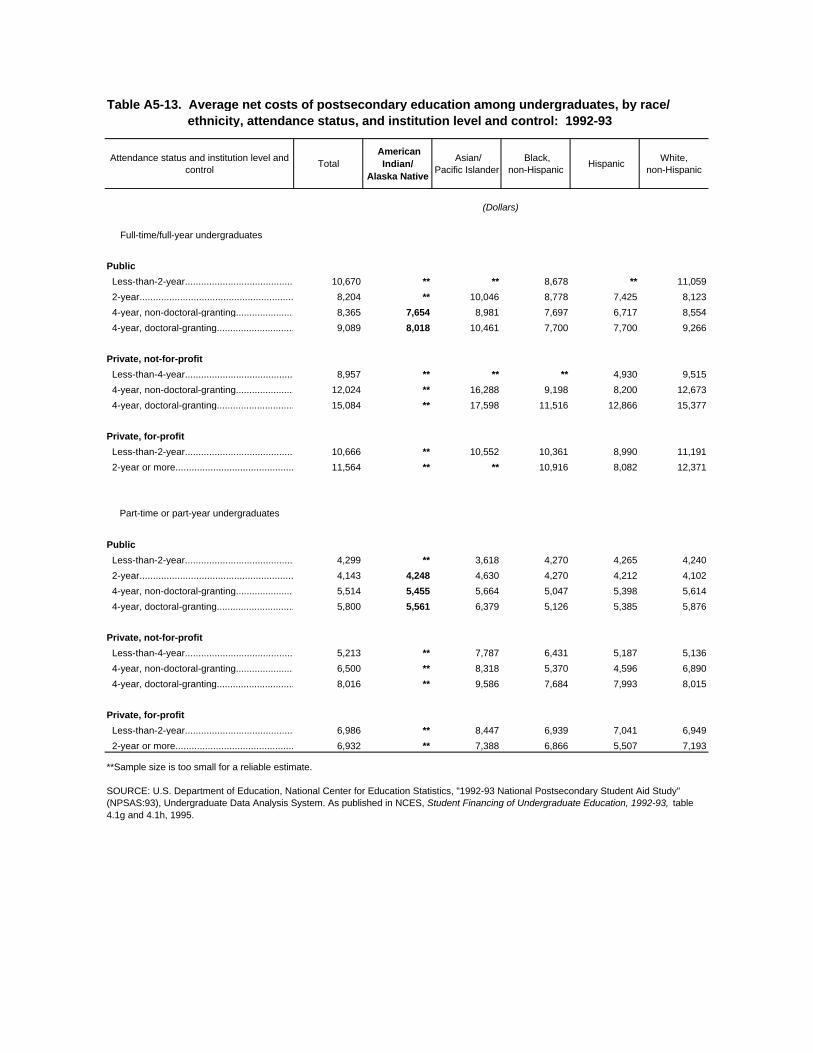
Attendance status and institution level and control
Total American
Indian/ Alaska Native
Asian/Pacific Islander
Black, non-Hispanic
Hispanic White,
non-Hispanic
(Dollars)
Full-time/full-year undergraduates
Public
Less-than-2-year.............................................. 10,670 ** ** 8,678 ** 11,059
2-year.............................................................. 8,204 ** 10,046 8,778 7,425 8,123
4-year, non-doctoral-granting............................... 8,365 7,654 8,981 7,697 6,717 8,554
4-year, doctoral-granting............................... 9,089 8,018 10,461 7,700 7,700 9,266
Private, not-for-profit
Less-than-4-year............................................... 8,957 ** ** ** 4,930 9,515
4-year, non-doctoral-granting............................... 12,024 ** 16,288 9,198 8,200 12,673
4-year, doctoral-granting............................... 15,084 ** 17,598 11,516 12,866 15,377
Private, for-profit
Less-than-2-year.............................................. 10,666 ** 10,552 10,361 8,990 11,191
2-year or more..............................................................11,564 ** ** 10,916 8,082 12,371
Part-time or part-year undergraduates
Public
Less-than-2-year.............................................. 4,299 ** 3,618 4,270 4,265 4,240
2-year.............................................................. 4,143 4,248 4,630 4,270 4,212 4,102
4-year, non-doctoral-granting............................... 5,514 5,455 5,664 5,047 5,398 5,614
4-year, doctoral-granting............................... 5,800 5,561 6,379 5,126 5,385 5,876
Private, not-for-profit
Less-than-4-year............................................... 5,213 ** 7,787 6,431 5,187 5,136
4-year, non-doctoral-granting............................... 6,500 ** 8,318 5,370 4,596 6,890
4-year, doctoral-granting............................... 8,016 ** 9,586 7,684 7,993 8,015
Private, for-profit
Less-than-2-year.............................................. 6,986 ** 8,447 6,939 7,041 6,949
2-year or more..............................................................6,932 ** 7,388 6,866 5,507 7,193
Table A5-13. Average net costs of postsecondary education among undergraduates, by race/ ethnicity, attendance status, and institution level and control: 1992-93
**Sample size is too small for a reliable estimate.
SOURCE: U.S. Department of Education, National Center for Education Statistics, "1992-93 National Postsecondary Student Aid Study" (NPSAS:93), Undergraduate Data Analysis System. As published in NCES, Student Financing of Undergraduate Education, 1992-93, table 4.1g and 4.1h, 1995.
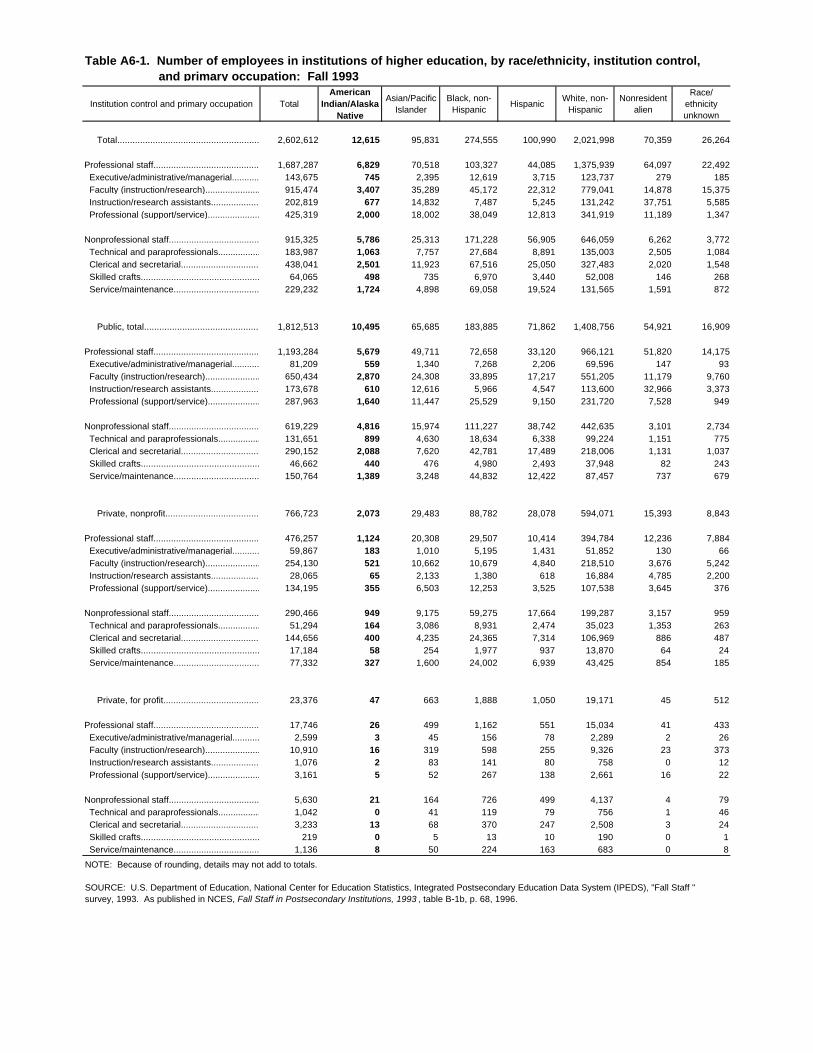
Institution control and primary occupation TotalAmerican
Indian/Alaska Native
Asian/Pacific Islander
Black, non-Hispanic
Hispanic White, non-
HispanicNonresident
alien
Race/ ethnicity unknown
Total.................................................................2,602,612 12,615 95,831 274,555 100,990 2,021,998 70,359 26,264
Professional staff..................................................1,687,287 6,829 70,518 103,327 44,085 1,375,939 64,097 22,492 Executive/administrative/managerial............. 143,675 745 2,395 12,619 3,715 123,737 279 185 Faculty (instruction/research)........................... 915,474 3,407 35,289 45,172 22,312 779,041 14,878 15,375 Instruction/research assistants........................... 202,819 677 14,832 7,487 5,245 131,242 37,751 5,585 Professional (support/service)........................ 425,319 2,000 18,002 38,049 12,813 341,919 11,189 1,347
Nonprofessional staff................................................915,325 5,786 25,313 171,228 56,905 646,059 6,262 3,772 Technical and paraprofessionals....................... 183,987 1,063 7,757 27,684 8,891 135,003 2,505 1,084 Clerical and secretarial..........................................438,041 2,501 11,923 67,516 25,050 327,483 2,020 1,548 Skilled crafts.......................................................... 64,065 498 735 6,970 3,440 52,008 146 268 Service/maintenance............................................229,232 1,724 4,898 69,058 19,524 131,565 1,591 872
Public, total...........................................................1,812,513 10,495 65,685 183,885 71,862 1,408,756 54,921 16,909
Professional staff...................................................1,193,284 5,679 49,711 72,658 33,120 966,121 51,820 14,175 Executive/administrative/managerial................ 81,209 559 1,340 7,268 2,206 69,596 147 93 Faculty (instruction/research)........................... 650,434 2,870 24,308 33,895 17,217 551,205 11,179 9,760 Instruction/research assistants............................ 173,678 610 12,616 5,966 4,547 113,600 32,966 3,373 Professional (support/service).............................. 287,963 1,640 11,447 25,529 9,150 231,720 7,528 949
Nonprofessional staff............................................ 619,229 4,816 15,974 111,227 38,742 442,635 3,101 2,734 Technical and paraprofessionals........................ 131,651 899 4,630 18,634 6,338 99,224 1,151 775 Clerical and secretarial...........................................290,152 2,088 7,620 42,781 17,489 218,006 1,131 1,037 Skilled crafts...........................................................46,662 440 476 4,980 2,493 37,948 82 243 Service/maintenance.............................................150,764 1,389 3,248 44,832 12,422 87,457 737 679
Private, nonprofit....................................................766,723 2,073 29,483 88,782 28,078 594,071 15,393 8,843
Professional staff.................................................. 476,257 1,124 20,308 29,507 10,414 394,784 12,236 7,884 Executive/administrative/managerial.................. 59,867 183 1,010 5,195 1,431 51,852 130 66 Faculty (instruction/research)............................... 254,130 521 10,662 10,679 4,840 218,510 3,676 5,242 Instruction/research assistants......................... 28,065 65 2,133 1,380 618 16,884 4,785 2,200 Professional (support/service)............................. 134,195 355 6,503 12,253 3,525 107,538 3,645 376
Nonprofessional staff..............................................290,466 949 9,175 59,275 17,664 199,287 3,157 959 Technical and paraprofessionals..................... 51,294 164 3,086 8,931 2,474 35,023 1,353 263 Clerical and secretarial..........................................144,656 400 4,235 24,365 7,314 106,969 886 487 Skilled crafts.............................................................17,184 58 254 1,977 937 13,870 64 24 Service/maintenance................................................77,332 327 1,600 24,002 6,939 43,425 854 185
Private, for profit........................................................23,376 47 663 1,888 1,050 19,171 45 512
Professional staff..................................................... 17,746 26 499 1,162 551 15,034 41 433 Executive/administrative/managerial..................... 2,599 3 45 156 78 2,289 2 26 Faculty (instruction/research).......................... 10,910 16 319 598 255 9,326 23 373 Instruction/research assistants............................ 1,076 2 83 141 80 758 0 12 Professional (support/service).............................. 3,161 5 52 267 138 2,661 16 22
Nonprofessional staff................................................ 5,630 21 164 726 499 4,137 4 79 Technical and paraprofessionals.......................... 1,042 0 41 119 79 756 1 46 Clerical and secretarial........................................... 3,233 13 68 370 247 2,508 3 24 Skilled crafts.......................................................... 219 0 5 13 10 190 0 1 Service/maintenance............................................ 1,136 8 50 224 163 683 0 8
NOTE: Because of rounding, details may not add to totals.
SOURCE: U.S. Department of Education, National Center for Education Statistics, Integrated Postsecondary Education Data System (IPEDS), "Fall Staff " survey, 1993. As published in NCES, Fall Staff in Postsecondary Institutions, 1993 , table B-1b, p. 68, 1996.
Table A6-1. Number of employees in institutions of higher education, by race/ethnicity, institution control, and primary occupation: Fall 1993
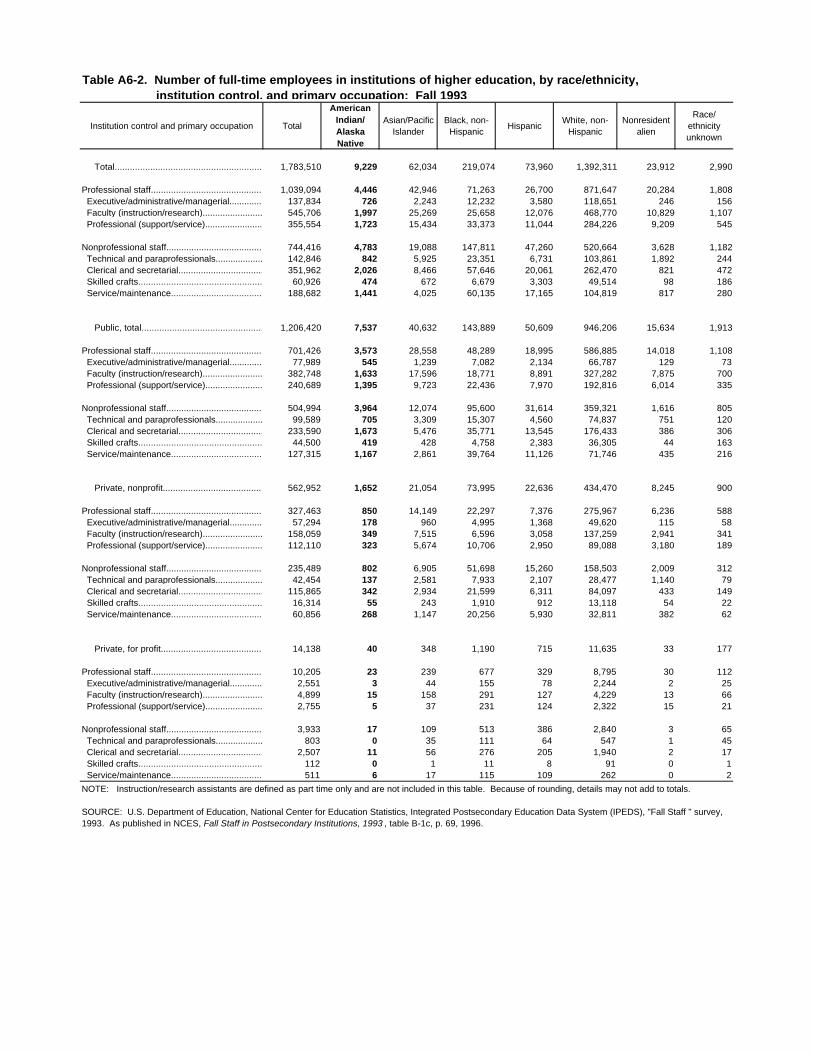
Institution control and primary occupation Total
American Indian/ Alaska Native
Asian/Pacific Islander
Black, non-Hispanic
HispanicWhite, non-
HispanicNonresident
alien
Race/ ethnicity unknown
Total.................................................................1,783,510 9,229 62,034 219,074 73,960 1,392,311 23,912 2,990
Professional staff.................................................. 1,039,094 4,446 42,946 71,263 26,700 871,647 20,284 1,808 Executive/administrative/managerial............. 137,834 726 2,243 12,232 3,580 118,651 246 156 Faculty (instruction/research)........................... 545,706 1,997 25,269 25,658 12,076 468,770 10,829 1,107 Professional (support/service)........................ 355,554 1,723 15,434 33,373 11,044 284,226 9,209 545
Nonprofessional staff................................................ 744,416 4,783 19,088 147,811 47,260 520,664 3,628 1,182 Technical and paraprofessionals....................... 142,846 842 5,925 23,351 6,731 103,861 1,892 244 Clerical and secretarial.......................................... 351,962 2,026 8,466 57,646 20,061 262,470 821 472 Skilled crafts.......................................................... 60,926 474 672 6,679 3,303 49,514 98 186 Service/maintenance............................................ 188,682 1,441 4,025 60,135 17,165 104,819 817 280
Public, total...........................................................1,206,420 7,537 40,632 143,889 50,609 946,206 15,634 1,913
Professional staff................................................... 701,426 3,573 28,558 48,289 18,995 586,885 14,018 1,108 Executive/administrative/managerial................ 77,989 545 1,239 7,082 2,134 66,787 129 73 Faculty (instruction/research)........................... 382,748 1,633 17,596 18,771 8,891 327,282 7,875 700 Professional (support/service).............................. 240,689 1,395 9,723 22,436 7,970 192,816 6,014 335
Nonprofessional staff............................................ 504,994 3,964 12,074 95,600 31,614 359,321 1,616 805 Technical and paraprofessionals........................ 99,589 705 3,309 15,307 4,560 74,837 751 120 Clerical and secretarial........................................... 233,590 1,673 5,476 35,771 13,545 176,433 386 306 Skilled crafts........................................................... 44,500 419 428 4,758 2,383 36,305 44 163 Service/maintenance............................................. 127,315 1,167 2,861 39,764 11,126 71,746 435 216
Private, nonprofit....................................................562,952 1,652 21,054 73,995 22,636 434,470 8,245 900
Professional staff.................................................. 327,463 850 14,149 22,297 7,376 275,967 6,236 588 Executive/administrative/managerial.................. 57,294 178 960 4,995 1,368 49,620 115 58 Faculty (instruction/research)............................... 158,059 349 7,515 6,596 3,058 137,259 2,941 341 Professional (support/service)............................. 112,110 323 5,674 10,706 2,950 89,088 3,180 189
Nonprofessional staff.............................................. 235,489 802 6,905 51,698 15,260 158,503 2,009 312 Technical and paraprofessionals..................... 42,454 137 2,581 7,933 2,107 28,477 1,140 79 Clerical and secretarial.......................................... 115,865 342 2,934 21,599 6,311 84,097 433 149 Skilled crafts.............................................................16,314 55 243 1,910 912 13,118 54 22 Service/maintenance................................................60,856 268 1,147 20,256 5,930 32,811 382 62
Private, for profit........................................................14,138 40 348 1,190 715 11,635 33 177
Professional staff..................................................... 10,205 23 239 677 329 8,795 30 112 Executive/administrative/managerial..................... 2,551 3 44 155 78 2,244 2 25 Faculty (instruction/research).......................... 4,899 15 158 291 127 4,229 13 66 Professional (support/service).............................. 2,755 5 37 231 124 2,322 15 21
Nonprofessional staff................................................ 3,933 17 109 513 386 2,840 3 65 Technical and paraprofessionals.......................... 803 0 35 111 64 547 1 45 Clerical and secretarial........................................... 2,507 11 56 276 205 1,940 2 17 Skilled crafts.......................................................... 112 0 1 11 8 91 0 1 Service/maintenance............................................ 511 6 17 115 109 262 0 2
NOTE: Instruction/research assistants are defined as part time only and are not included in this table. Because of rounding, details may not add to totals.
SOURCE: U.S. Department of Education, National Center for Education Statistics, Integrated Postsecondary Education Data System (IPEDS), "Fall Staff " survey, 1993. As published in NCES, Fall Staff in Postsecondary Institutions, 1993 , table B-1c, p. 69, 1996.
Table A6-2. Number of full-time employees in institutions of higher education, by race/ethnicity, institution control, and primary occupation: Fall 1993
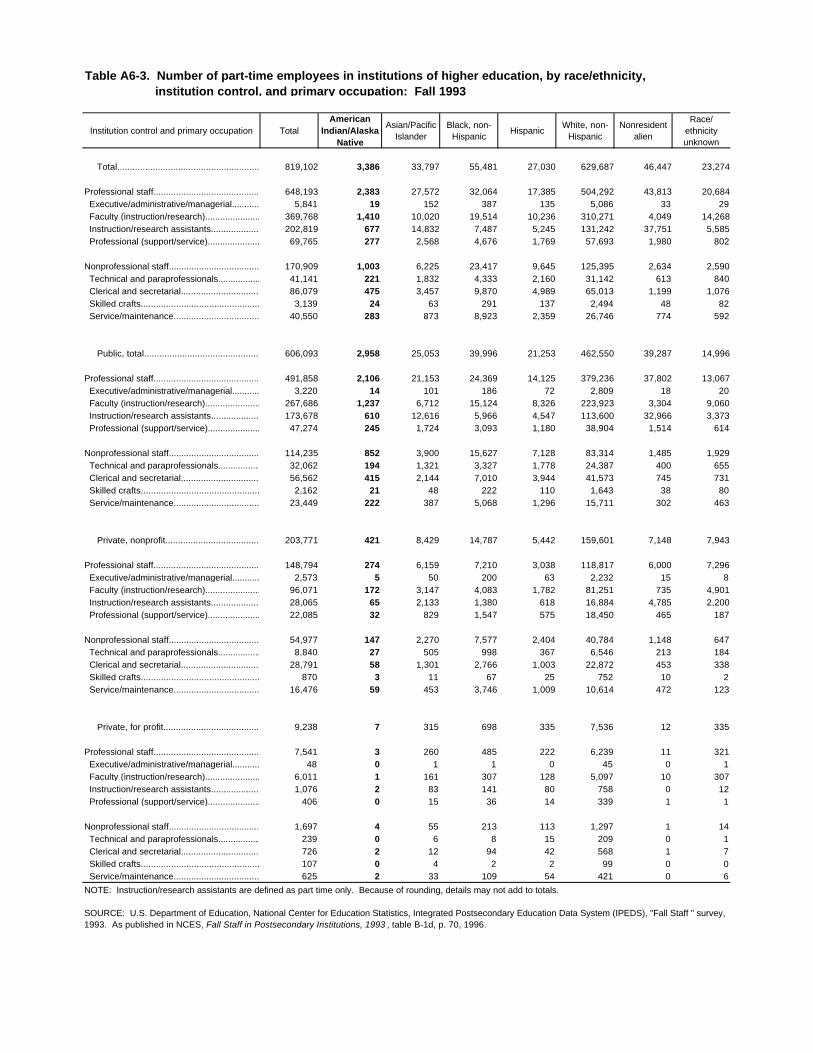
Institution control and primary occupation TotalAmerican
Indian/Alaska Native
Asian/Pacific Islander
Black, non-Hispanic
Hispanic White, non-
HispanicNonresident
alien
Race/ ethnicity unknown
Total................................................................. 819,102 3,386 33,797 55,481 27,030 629,687 46,447 23,274
Professional staff.................................................. 648,193 2,383 27,572 32,064 17,385 504,292 43,813 20,684 Executive/administrative/managerial............. 5,841 19 152 387 135 5,086 33 29 Faculty (instruction/research)........................... 369,768 1,410 10,020 19,514 10,236 310,271 4,049 14,268 Instruction/research assistants........................... 202,819 677 14,832 7,487 5,245 131,242 37,751 5,585 Professional (support/service)........................ 69,765 277 2,568 4,676 1,769 57,693 1,980 802
Nonprofessional staff................................................170,909 1,003 6,225 23,417 9,645 125,395 2,634 2,590 Technical and paraprofessionals....................... 41,141 221 1,832 4,333 2,160 31,142 613 840 Clerical and secretarial.......................................... 86,079 475 3,457 9,870 4,989 65,013 1,199 1,076 Skilled crafts.......................................................... 3,139 24 63 291 137 2,494 48 82 Service/maintenance............................................ 40,550 283 873 8,923 2,359 26,746 774 592
Public, total...........................................................606,093 2,958 25,053 39,996 21,253 462,550 39,287 14,996
Professional staff................................................... 491,858 2,106 21,153 24,369 14,125 379,236 37,802 13,067 Executive/administrative/managerial................ 3,220 14 101 186 72 2,809 18 20 Faculty (instruction/research)........................... 267,686 1,237 6,712 15,124 8,326 223,923 3,304 9,060 Instruction/research assistants............................ 173,678 610 12,616 5,966 4,547 113,600 32,966 3,373 Professional (support/service).............................. 47,274 245 1,724 3,093 1,180 38,904 1,514 614
Nonprofessional staff............................................ 114,235 852 3,900 15,627 7,128 83,314 1,485 1,929 Technical and paraprofessionals........................ 32,062 194 1,321 3,327 1,778 24,387 400 655 Clerical and secretarial........................................... 56,562 415 2,144 7,010 3,944 41,573 745 731 Skilled crafts........................................................... 2,162 21 48 222 110 1,643 38 80 Service/maintenance............................................. 23,449 222 387 5,068 1,296 15,711 302 463
Private, nonprofit....................................................203,771 421 8,429 14,787 5,442 159,601 7,148 7,943
Professional staff.................................................. 148,794 274 6,159 7,210 3,038 118,817 6,000 7,296 Executive/administrative/managerial.................. 2,573 5 50 200 63 2,232 15 8 Faculty (instruction/research)............................... 96,071 172 3,147 4,083 1,782 81,251 735 4,901 Instruction/research assistants......................... 28,065 65 2,133 1,380 618 16,884 4,785 2,200 Professional (support/service)............................. 22,085 32 829 1,547 575 18,450 465 187
Nonprofessional staff.............................................. 54,977 147 2,270 7,577 2,404 40,784 1,148 647 Technical and paraprofessionals..................... 8,840 27 505 998 367 6,546 213 184 Clerical and secretarial.......................................... 28,791 58 1,301 2,766 1,003 22,872 453 338 Skilled crafts............................................................. 870 3 11 67 25 752 10 2 Service/maintenance................................................16,476 59 453 3,746 1,009 10,614 472 123
Private, for profit........................................................9,238 7 315 698 335 7,536 12 335
Professional staff..................................................... 7,541 3 260 485 222 6,239 11 321 Executive/administrative/managerial..................... 48 0 1 1 0 45 0 1 Faculty (instruction/research).......................... 6,011 1 161 307 128 5,097 10 307 Instruction/research assistants............................ 1,076 2 83 141 80 758 0 12 Professional (support/service).............................. 406 0 15 36 14 339 1 1
Nonprofessional staff................................................ 1,697 4 55 213 113 1,297 1 14 Technical and paraprofessionals.......................... 239 0 6 8 15 209 0 1 Clerical and secretarial........................................... 726 2 12 94 42 568 1 7 Skilled crafts.......................................................... 107 0 4 2 2 99 0 0 Service/maintenance............................................ 625 2 33 109 54 421 0 6
NOTE: Instruction/research assistants are defined as part time only. Because of rounding, details may not add to totals.
SOURCE: U.S. Department of Education, National Center for Education Statistics, Integrated Postsecondary Education Data System (IPEDS), "Fall Staff " survey, 1993. As published in NCES, Fall Staff in Postsecondary Institutions, 1993 , table B-1d, p. 70, 1996.
Table A6-3. Number of part-time employees in institutions of higher education, by race/ethnicity, institution control, and primary occupation: Fall 1993
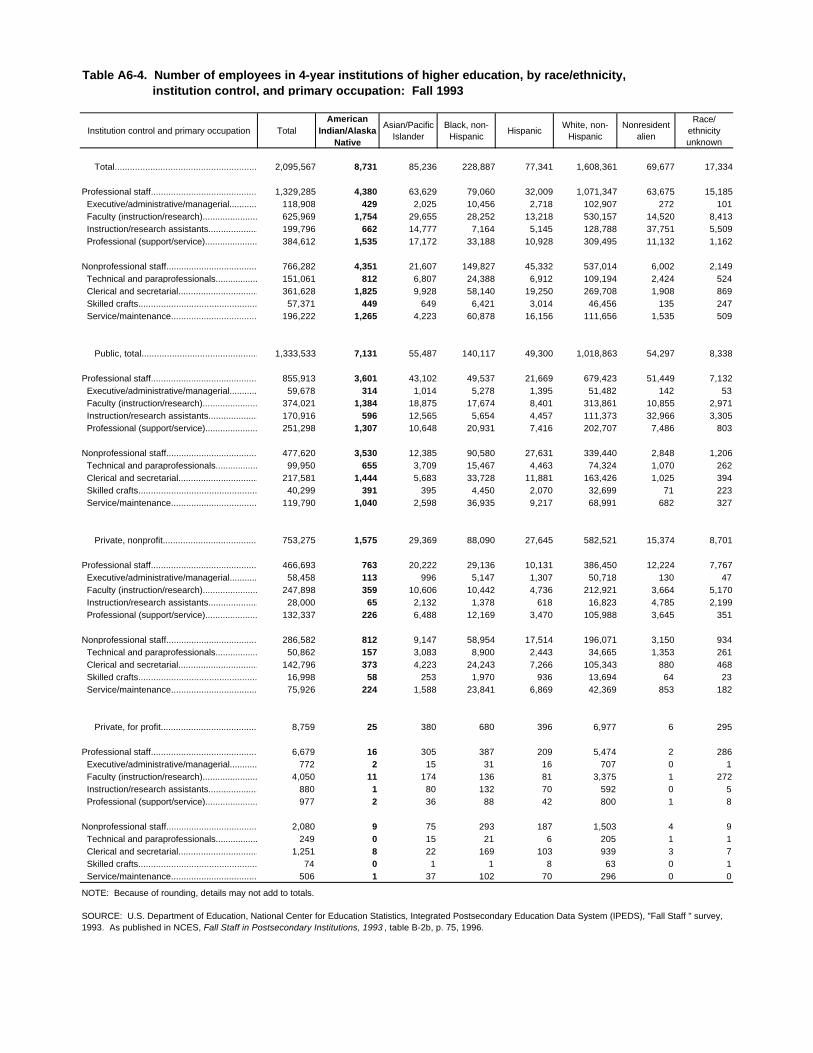
Institution control and primary occupation TotalAmerican
Indian/Alaska Native
Asian/Pacific Islander
Black, non-Hispanic
HispanicWhite, non-
HispanicNonresident
alien
Race/ ethnicity unknown
Total.................................................................2,095,567 8,731 85,236 228,887 77,341 1,608,361 69,677 17,334
Professional staff..................................................1,329,285 4,380 63,629 79,060 32,009 1,071,347 63,675 15,185 Executive/administrative/managerial............. 118,908 429 2,025 10,456 2,718 102,907 272 101 Faculty (instruction/research)........................... 625,969 1,754 29,655 28,252 13,218 530,157 14,520 8,413 Instruction/research assistants........................... 199,796 662 14,777 7,164 5,145 128,788 37,751 5,509 Professional (support/service)........................ 384,612 1,535 17,172 33,188 10,928 309,495 11,132 1,162
Nonprofessional staff................................................766,282 4,351 21,607 149,827 45,332 537,014 6,002 2,149 Technical and paraprofessionals....................... 151,061 812 6,807 24,388 6,912 109,194 2,424 524 Clerical and secretarial..........................................361,628 1,825 9,928 58,140 19,250 269,708 1,908 869 Skilled crafts.......................................................... 57,371 449 649 6,421 3,014 46,456 135 247 Service/maintenance............................................196,222 1,265 4,223 60,878 16,156 111,656 1,535 509
Public, total...........................................................1,333,533 7,131 55,487 140,117 49,300 1,018,863 54,297 8,338
Professional staff................................................... 855,913 3,601 43,102 49,537 21,669 679,423 51,449 7,132 Executive/administrative/managerial................ 59,678 314 1,014 5,278 1,395 51,482 142 53 Faculty (instruction/research)........................... 374,021 1,384 18,875 17,674 8,401 313,861 10,855 2,971 Instruction/research assistants............................ 170,916 596 12,565 5,654 4,457 111,373 32,966 3,305 Professional (support/service).............................. 251,298 1,307 10,648 20,931 7,416 202,707 7,486 803
Nonprofessional staff............................................ 477,620 3,530 12,385 90,580 27,631 339,440 2,848 1,206 Technical and paraprofessionals........................ 99,950 655 3,709 15,467 4,463 74,324 1,070 262 Clerical and secretarial...........................................217,581 1,444 5,683 33,728 11,881 163,426 1,025 394 Skilled crafts...........................................................40,299 391 395 4,450 2,070 32,699 71 223 Service/maintenance.............................................119,790 1,040 2,598 36,935 9,217 68,991 682 327
Private, nonprofit....................................................753,275 1,575 29,369 88,090 27,645 582,521 15,374 8,701
Professional staff.................................................. 466,693 763 20,222 29,136 10,131 386,450 12,224 7,767 Executive/administrative/managerial.................. 58,458 113 996 5,147 1,307 50,718 130 47 Faculty (instruction/research)............................... 247,898 359 10,606 10,442 4,736 212,921 3,664 5,170 Instruction/research assistants......................... 28,000 65 2,132 1,378 618 16,823 4,785 2,199 Professional (support/service)............................. 132,337 226 6,488 12,169 3,470 105,988 3,645 351
Nonprofessional staff..............................................286,582 812 9,147 58,954 17,514 196,071 3,150 934 Technical and paraprofessionals..................... 50,862 157 3,083 8,900 2,443 34,665 1,353 261 Clerical and secretarial..........................................142,796 373 4,223 24,243 7,266 105,343 880 468 Skilled crafts.............................................................16,998 58 253 1,970 936 13,694 64 23 Service/maintenance................................................75,926 224 1,588 23,841 6,869 42,369 853 182
Private, for profit........................................................8,759 25 380 680 396 6,977 6 295
Professional staff..................................................... 6,679 16 305 387 209 5,474 2 286 Executive/administrative/managerial..................... 772 2 15 31 16 707 0 1 Faculty (instruction/research).......................... 4,050 11 174 136 81 3,375 1 272 Instruction/research assistants............................ 880 1 80 132 70 592 0 5 Professional (support/service).............................. 977 2 36 88 42 800 1 8
Nonprofessional staff................................................ 2,080 9 75 293 187 1,503 4 9 Technical and paraprofessionals.......................... 249 0 15 21 6 205 1 1 Clerical and secretarial........................................... 1,251 8 22 169 103 939 3 7 Skilled crafts.......................................................... 74 0 1 1 8 63 0 1 Service/maintenance............................................ 506 1 37 102 70 296 0 0
NOTE: Because of rounding, details may not add to totals.
SOURCE: U.S. Department of Education, National Center for Education Statistics, Integrated Postsecondary Education Data System (IPEDS), "Fall Staff " survey, 1993. As published in NCES, Fall Staff in Postsecondary Institutions, 1993 , table B-2b, p. 75, 1996.
Table A6-4. Number of employees in 4-year institutions of higher education, by race/ethnicity, institution control, and primary occupation: Fall 1993
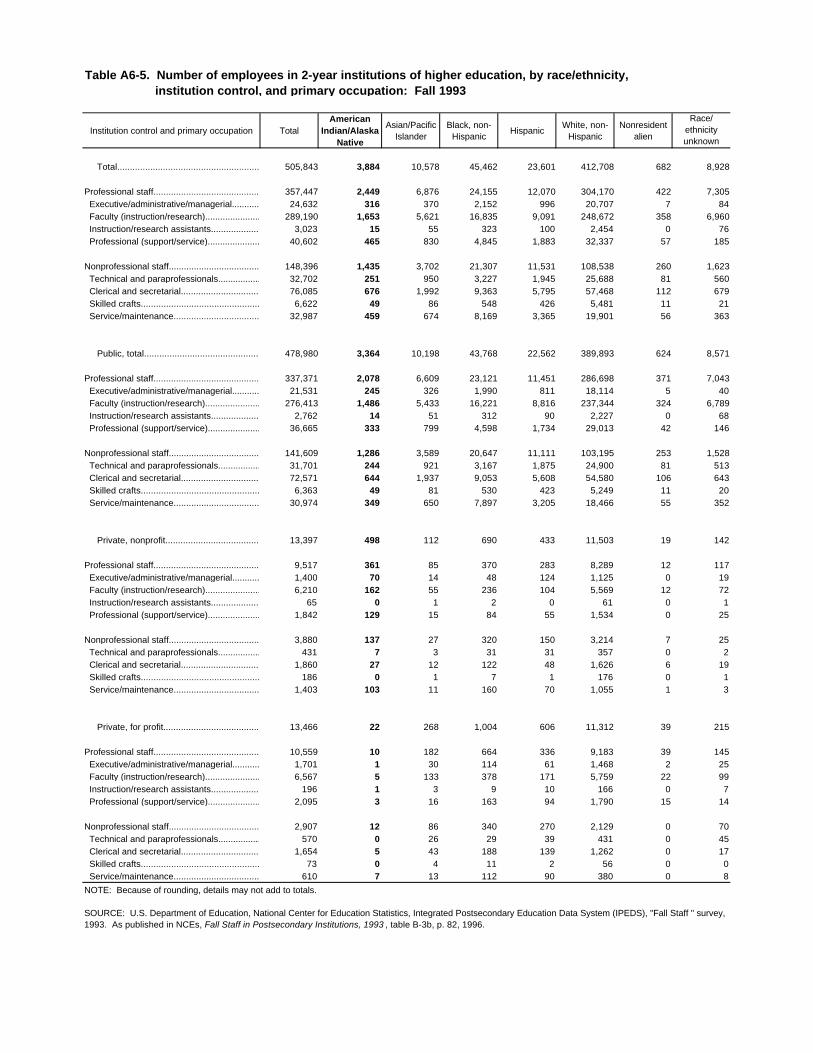
Institution control and primary occupation TotalAmerican
Indian/Alaska Native
Asian/Pacific Islander
Black, non-Hispanic
HispanicWhite, non-
HispanicNonresident
alien
Race/ ethnicity unknown
Total................................................................. 505,843 3,884 10,578 45,462 23,601 412,708 682 8,928
Professional staff.................................................. 357,447 2,449 6,876 24,155 12,070 304,170 422 7,305 Executive/administrative/managerial............. 24,632 316 370 2,152 996 20,707 7 84 Faculty (instruction/research)........................... 289,190 1,653 5,621 16,835 9,091 248,672 358 6,960 Instruction/research assistants........................... 3,023 15 55 323 100 2,454 0 76 Professional (support/service)........................ 40,602 465 830 4,845 1,883 32,337 57 185
Nonprofessional staff................................................148,396 1,435 3,702 21,307 11,531 108,538 260 1,623 Technical and paraprofessionals....................... 32,702 251 950 3,227 1,945 25,688 81 560 Clerical and secretarial.......................................... 76,085 676 1,992 9,363 5,795 57,468 112 679 Skilled crafts.......................................................... 6,622 49 86 548 426 5,481 11 21 Service/maintenance............................................ 32,987 459 674 8,169 3,365 19,901 56 363
Public, total...........................................................478,980 3,364 10,198 43,768 22,562 389,893 624 8,571
Professional staff................................................... 337,371 2,078 6,609 23,121 11,451 286,698 371 7,043 Executive/administrative/managerial................ 21,531 245 326 1,990 811 18,114 5 40 Faculty (instruction/research)........................... 276,413 1,486 5,433 16,221 8,816 237,344 324 6,789 Instruction/research assistants............................ 2,762 14 51 312 90 2,227 0 68 Professional (support/service).............................. 36,665 333 799 4,598 1,734 29,013 42 146
Nonprofessional staff............................................ 141,609 1,286 3,589 20,647 11,111 103,195 253 1,528 Technical and paraprofessionals........................ 31,701 244 921 3,167 1,875 24,900 81 513 Clerical and secretarial........................................... 72,571 644 1,937 9,053 5,608 54,580 106 643 Skilled crafts........................................................... 6,363 49 81 530 423 5,249 11 20 Service/maintenance............................................. 30,974 349 650 7,897 3,205 18,466 55 352
Private, nonprofit....................................................13,397 498 112 690 433 11,503 19 142
Professional staff.................................................. 9,517 361 85 370 283 8,289 12 117 Executive/administrative/managerial.................. 1,400 70 14 48 124 1,125 0 19 Faculty (instruction/research)............................... 6,210 162 55 236 104 5,569 12 72 Instruction/research assistants......................... 65 0 1 2 0 61 0 1 Professional (support/service)............................. 1,842 129 15 84 55 1,534 0 25
Nonprofessional staff.............................................. 3,880 137 27 320 150 3,214 7 25 Technical and paraprofessionals..................... 431 7 3 31 31 357 0 2 Clerical and secretarial.......................................... 1,860 27 12 122 48 1,626 6 19 Skilled crafts............................................................. 186 0 1 7 1 176 0 1 Service/maintenance................................................1,403 103 11 160 70 1,055 1 3
Private, for profit........................................................13,466 22 268 1,004 606 11,312 39 215
Professional staff..................................................... 10,559 10 182 664 336 9,183 39 145 Executive/administrative/managerial..................... 1,701 1 30 114 61 1,468 2 25 Faculty (instruction/research).......................... 6,567 5 133 378 171 5,759 22 99 Instruction/research assistants............................ 196 1 3 9 10 166 0 7 Professional (support/service).............................. 2,095 3 16 163 94 1,790 15 14
Nonprofessional staff................................................ 2,907 12 86 340 270 2,129 0 70 Technical and paraprofessionals.......................... 570 0 26 29 39 431 0 45 Clerical and secretarial........................................... 1,654 5 43 188 139 1,262 0 17 Skilled crafts.......................................................... 73 0 4 11 2 56 0 0 Service/maintenance............................................ 610 7 13 112 90 380 0 8
NOTE: Because of rounding, details may not add to totals.
SOURCE: U.S. Department of Education, National Center for Education Statistics, Integrated Postsecondary Education Data System (IPEDS), "Fall Staff " survey, 1993. As published in NCEs, Fall Staff in Postsecondary Institutions, 1993 , table B-3b, p. 82, 1996.
Table A6-5. Number of employees in 2-year institutions of higher education, by race/ethnicity, institution control, and primary occupation: Fall 1993
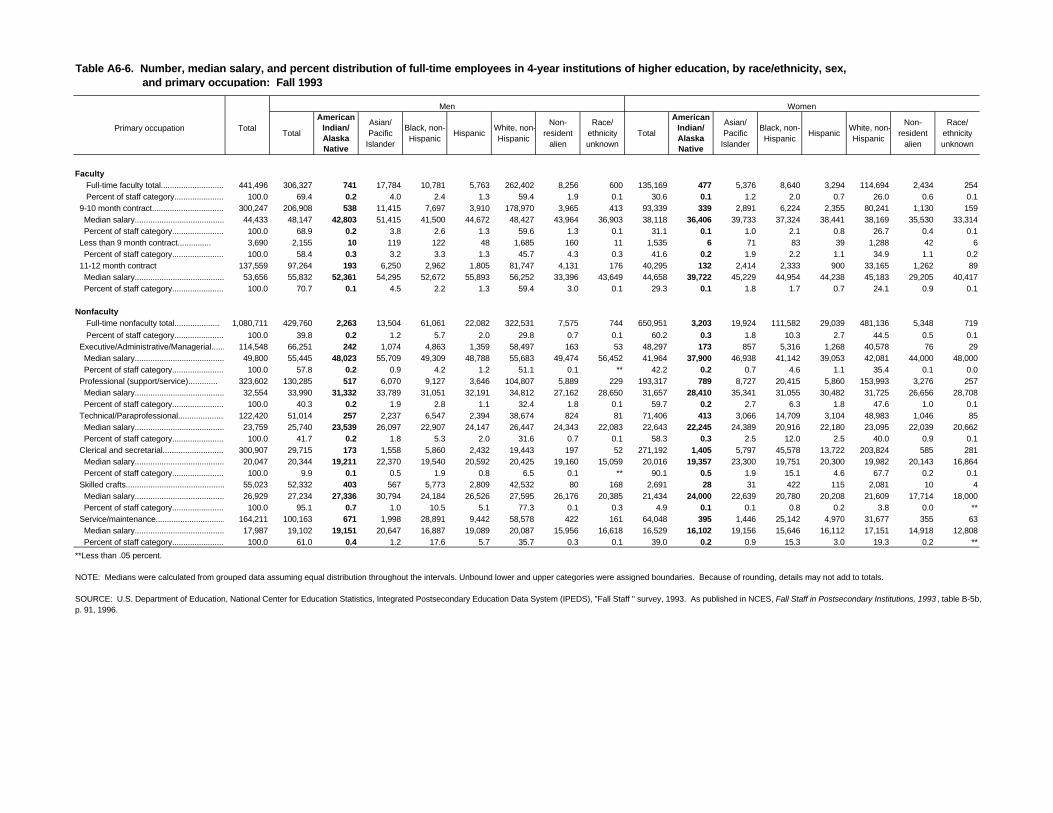
Men Women
Primary occupation TotalTotal
American Indian/ Alaska Native
Asian/ Pacific
Islander
Black, non-Hispanic
HispanicWhite, non-Hispanic
Non-resident
alien
Race/ ethnicity unknown
Total
American Indian/ Alaska Native
Asian/ Pacific
Islander
Black, non-Hispanic
HispanicWhite, non-Hispanic
Non-resident
alien
Race/ ethnicity unknown
Faculty Full-time faculty total......................................441,496 306,327 741 17,784 10,781 5,763 262,402 8,256 600 135,169 477 5,376 8,640 3,294 114,694 2,434 254 Percent of staff category.......................................100.0 69.4 0.2 4.0 2.4 1.3 59.4 1.9 0.1 30.6 0.1 1.2 2.0 0.7 26.0 0.6 0.1 9-10 month contract........................................300,247 206,908 538 11,415 7,697 3,910 178,970 3,965 413 93,339 339 2,891 6,224 2,355 80,241 1,130 159 Median salary........................................... 44,433 48,147 42,803 51,415 41,500 44,672 48,427 43,964 36,903 38,118 36,406 39,733 37,324 38,441 38,169 35,530 33,314 Percent of staff category.......................................100.0 68.9 0.2 3.8 2.6 1.3 59.6 1.3 0.1 31.1 0.1 1.0 2.1 0.8 26.7 0.4 0.1 Less than 9 month contract............... 3,690 2,155 10 119 122 48 1,685 160 11 1,535 6 71 83 39 1,288 42 6 Percent of staff category.......................................100.0 58.4 0.3 3.2 3.3 1.3 45.7 4.3 0.3 41.6 0.2 1.9 2.2 1.1 34.9 1.1 0.2 11-12 month contract 137,559 97,264 193 6,250 2,962 1,805 81,747 4,131 176 40,295 132 2,414 2,333 900 33,165 1,262 89 Median salary........................................... 53,656 55,832 52,361 54,295 52,672 55,893 56,252 33,396 43,649 44,658 39,722 45,229 44,954 44,238 45,183 29,205 40,417 Percent of staff category.......................................100.0 70.7 0.1 4.5 2.2 1.3 59.4 3.0 0.1 29.3 0.1 1.8 1.7 0.7 24.1 0.9 0.1
Nonfaculty Full-time nonfaculty total.................... 1,080,711 429,760 2,263 13,504 61,061 22,082 322,531 7,575 744 650,951 3,203 19,924 111,582 29,039 481,136 5,348 719
Percent of staff category.......................................100.0 39.8 0.2 1.2 5.7 2.0 29.8 0.7 0.1 60.2 0.3 1.8 10.3 2.7 44.5 0.5 0.1 Executive/Administrative/Managerial............114,548 66,251 242 1,074 4,863 1,359 58,497 163 53 48,297 173 857 5,316 1,268 40,578 76 29 Median salary........................................... 49,800 55,445 48,023 55,709 49,309 48,788 55,683 49,474 56,452 41,964 37,900 46,938 41,142 39,053 42,081 44,000 48,000 Percent of staff category.......................................100.0 57.8 0.2 0.9 4.2 1.2 51.1 0.1 ** 42.2 0.2 0.7 4.6 1.1 35.4 0.1 0.0 Professional (support/service)............. 323,602 130,285 517 6,070 9,127 3,646 104,807 5,889 229 193,317 789 8,727 20,415 5,860 153,993 3,276 257 Median salary........................................... 32,554 33,990 31,332 33,789 31,051 32,191 34,812 27,162 28,650 31,657 28,410 35,341 31,055 30,482 31,725 26,656 28,708 Percent of staff category.......................................100.0 40.3 0.2 1.9 2.8 1.1 32.4 1.8 0.1 59.7 0.2 2.7 6.3 1.8 47.6 1.0 0.1 Technical/Paraprofessional..............................122,420 51,014 257 2,237 6,547 2,394 38,674 824 81 71,406 413 3,066 14,709 3,104 48,983 1,046 85 Median salary........................................... 23,759 25,740 23,539 26,097 22,907 24,147 26,447 24,343 22,083 22,643 22,245 24,389 20,916 22,180 23,095 22,039 20,662 Percent of staff category.......................................100.0 41.7 0.2 1.8 5.3 2.0 31.6 0.7 0.1 58.3 0.3 2.5 12.0 2.5 40.0 0.9 0.1 Clerical and secretarial...........................................300,907 29,715 173 1,558 5,860 2,432 19,443 197 52 271,192 1,405 5,797 45,578 13,722 203,824 585 281 Median salary........................................... 20,047 20,344 19,211 22,370 19,540 20,592 20,425 19,160 15,059 20,016 19,357 23,300 19,751 20,300 19,982 20,143 16,864 Percent of staff category.......................................100.0 9.9 0.1 0.5 1.9 0.8 6.5 0.1 ** 90.1 0.5 1.9 15.1 4.6 67.7 0.2 0.1 Skilled crafts......................................................55,023 52,332 403 567 5,773 2,809 42,532 80 168 2,691 28 31 422 115 2,081 10 4 Median salary........................................... 26,929 27,234 27,336 30,794 24,184 26,526 27,595 26,176 20,385 21,434 24,000 22,639 20,780 20,208 21,609 17,714 18,000 Percent of staff category.......................................100.0 95.1 0.7 1.0 10.5 5.1 77.3 0.1 0.3 4.9 0.1 0.1 0.8 0.2 3.8 0.0 ** Service/maintenance..........................................164,211 100,163 671 1,998 28,891 9,442 58,578 422 161 64,048 395 1,446 25,142 4,970 31,677 355 63 Median salary........................................... 17,987 19,102 19,151 20,647 16,887 19,089 20,087 15,956 16,618 16,529 16,102 19,156 15,646 16,112 17,151 14,918 12,808 Percent of staff category.......................................100.0 61.0 0.4 1.2 17.6 5.7 35.7 0.3 0.1 39.0 0.2 0.9 15.3 3.0 19.3 0.2 **
**Less than .05 percent.
NOTE: Medians were calculated from grouped data assuming equal distribution throughout the intervals. Unbound lower and upper categories were assigned boundaries. Because of rounding, details may not add to totals.
SOURCE: U.S. Department of Education, National Center for Education Statistics, Integrated Postsecondary Education Data System (IPEDS), "Fall Staff " survey, 1993. As published in NCES, Fall Staff in Postsecondary Institutions, 1993 , table B-5b, p. 91, 1996.
Table A6-6. Number, median salary, and percent distribution of full-time employees in 4-year institutions of higher education, by race/ethnicity, sex, and primary occupation: Fall 1993
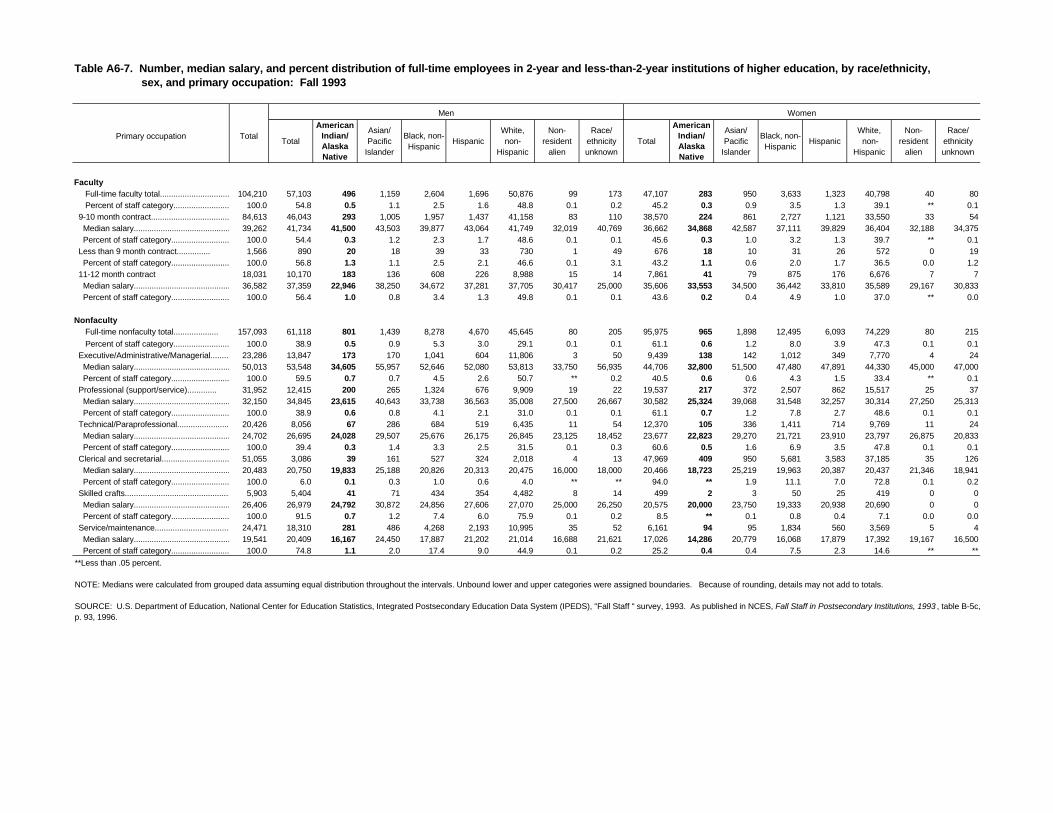
Men Women
Primary occupation TotalTotal
American Indian/ Alaska Native
Asian/ Pacific
Islander
Black, non-Hispanic
HispanicWhite, non-
Hispanic
Non-resident
alien
Race/ ethnicity unknown
Total
American Indian/ Alaska Native
Asian/ Pacific
Islander
Black, non-Hispanic
HispanicWhite, non-
Hispanic
Non-resident
alien
Race/ ethnicity unknown
Faculty Full-time faculty total......................................104,210 57,103 496 1,159 2,604 1,696 50,876 99 173 47,107 283 950 3,633 1,323 40,798 40 80 Percent of staff category.......................................100.0 54.8 0.5 1.1 2.5 1.6 48.8 0.1 0.2 45.2 0.3 0.9 3.5 1.3 39.1 ** 0.1 9-10 month contract........................................ 84,613 46,043 293 1,005 1,957 1,437 41,158 83 110 38,570 224 861 2,727 1,121 33,550 33 54 Median salary........................................... 39,262 41,734 41,500 43,503 39,877 43,064 41,749 32,019 40,769 36,662 34,868 42,587 37,111 39,829 36,404 32,188 34,375 Percent of staff category.......................................100.0 54.4 0.3 1.2 2.3 1.7 48.6 0.1 0.1 45.6 0.3 1.0 3.2 1.3 39.7 ** 0.1 Less than 9 month contract............... 1,566 890 20 18 39 33 730 1 49 676 18 10 31 26 572 0 19 Percent of staff category.......................................100.0 56.8 1.3 1.1 2.5 2.1 46.6 0.1 3.1 43.2 1.1 0.6 2.0 1.7 36.5 0.0 1.2 11-12 month contract 18,031 10,170 183 136 608 226 8,988 15 14 7,861 41 79 875 176 6,676 7 7 Median salary........................................... 36,582 37,359 22,946 38,250 34,672 37,281 37,705 30,417 25,000 35,606 33,553 34,500 36,442 33,810 35,589 29,167 30,833 Percent of staff category.......................................100.0 56.4 1.0 0.8 3.4 1.3 49.8 0.1 0.1 43.6 0.2 0.4 4.9 1.0 37.0 ** 0.0
Nonfaculty Full-time nonfaculty total.................... 157,093 61,118 801 1,439 8,278 4,670 45,645 80 205 95,975 965 1,898 12,495 6,093 74,229 80 215
Percent of staff category.......................................100.0 38.9 0.5 0.9 5.3 3.0 29.1 0.1 0.1 61.1 0.6 1.2 8.0 3.9 47.3 0.1 0.1 Executive/Administrative/Managerial............ 23,286 13,847 173 170 1,041 604 11,806 3 50 9,439 138 142 1,012 349 7,770 4 24 Median salary........................................... 50,013 53,548 34,605 55,957 52,646 52,080 53,813 33,750 56,935 44,706 32,800 51,500 47,480 47,891 44,330 45,000 47,000 Percent of staff category.......................................100.0 59.5 0.7 0.7 4.5 2.6 50.7 ** 0.2 40.5 0.6 0.6 4.3 1.5 33.4 ** 0.1 Professional (support/service)............. 31,952 12,415 200 265 1,324 676 9,909 19 22 19,537 217 372 2,507 862 15,517 25 37 Median salary........................................... 32,150 34,845 23,615 40,643 33,738 36,563 35,008 27,500 26,667 30,582 25,324 39,068 31,548 32,257 30,314 27,250 25,313 Percent of staff category.......................................100.0 38.9 0.6 0.8 4.1 2.1 31.0 0.1 0.1 61.1 0.7 1.2 7.8 2.7 48.6 0.1 0.1 Technical/Paraprofessional..............................20,426 8,056 67 286 684 519 6,435 11 54 12,370 105 336 1,411 714 9,769 11 24 Median salary........................................... 24,702 26,695 24,028 29,507 25,676 26,175 26,845 23,125 18,452 23,677 22,823 29,270 21,721 23,910 23,797 26,875 20,833 Percent of staff category.......................................100.0 39.4 0.3 1.4 3.3 2.5 31.5 0.1 0.3 60.6 0.5 1.6 6.9 3.5 47.8 0.1 0.1 Clerical and secretarial...........................................51,055 3,086 39 161 527 324 2,018 4 13 47,969 409 950 5,681 3,583 37,185 35 126 Median salary........................................... 20,483 20,750 19,833 25,188 20,826 20,313 20,475 16,000 18,000 20,466 18,723 25,219 19,963 20,387 20,437 21,346 18,941 Percent of staff category.......................................100.0 6.0 0.1 0.3 1.0 0.6 4.0 ** ** 94.0 ** 1.9 11.1 7.0 72.8 0.1 0.2 Skilled crafts......................................................5,903 5,404 41 71 434 354 4,482 8 14 499 2 3 50 25 419 0 0 Median salary........................................... 26,406 26,979 24,792 30,872 24,856 27,606 27,070 25,000 26,250 20,575 20,000 23,750 19,333 20,938 20,690 0 0 Percent of staff category.......................................100.0 91.5 0.7 1.2 7.4 6.0 75.9 0.1 0.2 8.5 ** 0.1 0.8 0.4 7.1 0.0 0.0 Service/maintenance..........................................24,471 18,310 281 486 4,268 2,193 10,995 35 52 6,161 94 95 1,834 560 3,569 5 4 Median salary........................................... 19,541 20,409 16,167 24,450 17,887 21,202 21,014 16,688 21,621 17,026 14,286 20,779 16,068 17,879 17,392 19,167 16,500 Percent of staff category.......................................100.0 74.8 1.1 2.0 17.4 9.0 44.9 0.1 0.2 25.2 0.4 0.4 7.5 2.3 14.6 ** **
**Less than .05 percent.
NOTE: Medians were calculated from grouped data assuming equal distribution throughout the intervals. Unbound lower and upper categories were assigned boundaries. Because of rounding, details may not add to totals.
SOURCE: U.S. Department of Education, National Center for Education Statistics, Integrated Postsecondary Education Data System (IPEDS), "Fall Staff " survey, 1993. As published in NCES, Fall Staff in Postsecondary Institutions, 1993 , table B-5c, p. 93, 1996.
Table A6-7. Number, median salary, and percent distribution of full-time employees in 2-year and less-than-2-year institutions of higher education, by race/ethnicity, sex, and primary occupation: Fall 1993
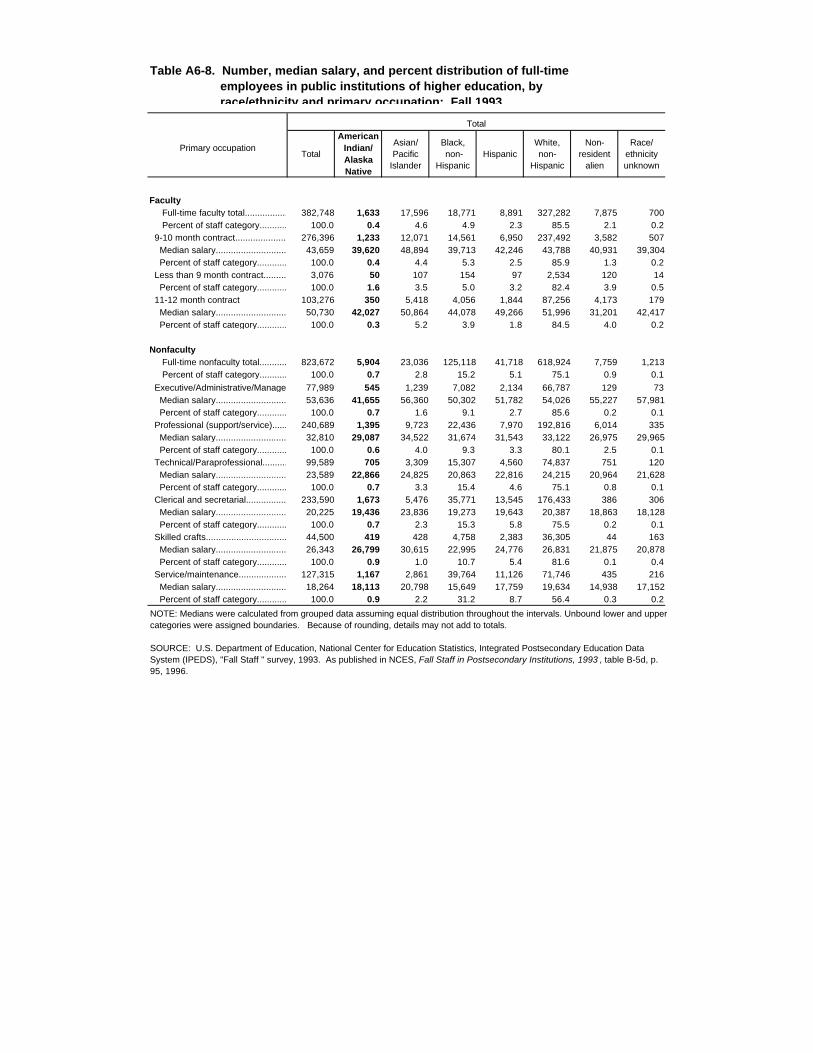
Total
Primary occupationTotal
American Indian/ Alaska Native
Asian/ Pacific
Islander
Black, non-
HispanicHispanic
White, non-
Hispanic
Non-resident
alien
Race/ ethnicity unknown
Faculty Full-time faculty total......................................382,748 1,633 17,596 18,771 8,891 327,282 7,875 700 Percent of staff category.......................................100.0 0.4 4.6 4.9 2.3 85.5 2.1 0.2 9-10 month contract........................................276,396 1,233 12,071 14,561 6,950 237,492 3,582 507 Median salary...........................................43,659 39,620 48,894 39,713 42,246 43,788 40,931 39,304 Percent of staff category.......................................100.0 0.4 4.4 5.3 2.5 85.9 1.3 0.2 Less than 9 month contract............... 3,076 50 107 154 97 2,534 120 14 Percent of staff category.......................................100.0 1.6 3.5 5.0 3.2 82.4 3.9 0.5 11-12 month contract 103,276 350 5,418 4,056 1,844 87,256 4,173 179 Median salary...........................................50,730 42,027 50,864 44,078 49,266 51,996 31,201 42,417 Percent of staff category.......................................100.0 0.3 5.2 3.9 1.8 84.5 4.0 0.2
Nonfaculty Full-time nonfaculty total....................823,672 5,904 23,036 125,118 41,718 618,924 7,759 1,213 Percent of staff category.......................................100.0 0.7 2.8 15.2 5.1 75.1 0.9 0.1
Executive/Administrative/Managerial............77,989 545 1,239 7,082 2,134 66,787 129 73 Median salary...........................................53,636 41,655 56,360 50,302 51,782 54,026 55,227 57,981 Percent of staff category.......................................100.0 0.7 1.6 9.1 2.7 85.6 0.2 0.1 Professional (support/service).............240,689 1,395 9,723 22,436 7,970 192,816 6,014 335 Median salary...........................................32,810 29,087 34,522 31,674 31,543 33,122 26,975 29,965 Percent of staff category.......................................100.0 0.6 4.0 9.3 3.3 80.1 2.5 0.1 Technical/Paraprofessional..............................99,589 705 3,309 15,307 4,560 74,837 751 120 Median salary...........................................23,589 22,866 24,825 20,863 22,816 24,215 20,964 21,628 Percent of staff category.......................................100.0 0.7 3.3 15.4 4.6 75.1 0.8 0.1 Clerical and secretarial...........................................233,590 1,673 5,476 35,771 13,545 176,433 386 306 Median salary...........................................20,225 19,436 23,836 19,273 19,643 20,387 18,863 18,128 Percent of staff category.......................................100.0 0.7 2.3 15.3 5.8 75.5 0.2 0.1 Skilled crafts......................................................44,500 419 428 4,758 2,383 36,305 44 163 Median salary...........................................26,343 26,799 30,615 22,995 24,776 26,831 21,875 20,878 Percent of staff category.......................................100.0 0.9 1.0 10.7 5.4 81.6 0.1 0.4 Service/maintenance..........................................127,315 1,167 2,861 39,764 11,126 71,746 435 216 Median salary...........................................18,264 18,113 20,798 15,649 17,759 19,634 14,938 17,152 Percent of staff category.......................................100.0 0.9 2.2 31.2 8.7 56.4 0.3 0.2
NOTE: Medians were calculated from grouped data assuming equal distribution throughout the intervals. Unbound lower and upper categories were assigned boundaries. Because of rounding, details may not add to totals.
SOURCE: U.S. Department of Education, National Center for Education Statistics, Integrated Postsecondary Education Data System (IPEDS), "Fall Staff " survey, 1993. As published in NCES, Fall Staff in Postsecondary Institutions, 1993 , table B-5d, p. 95, 1996.
Table A6-8. Number, median salary, and percent distribution of full-time employees in public institutions of higher education, by race/ethnicity and primary occupation: Fall 1993
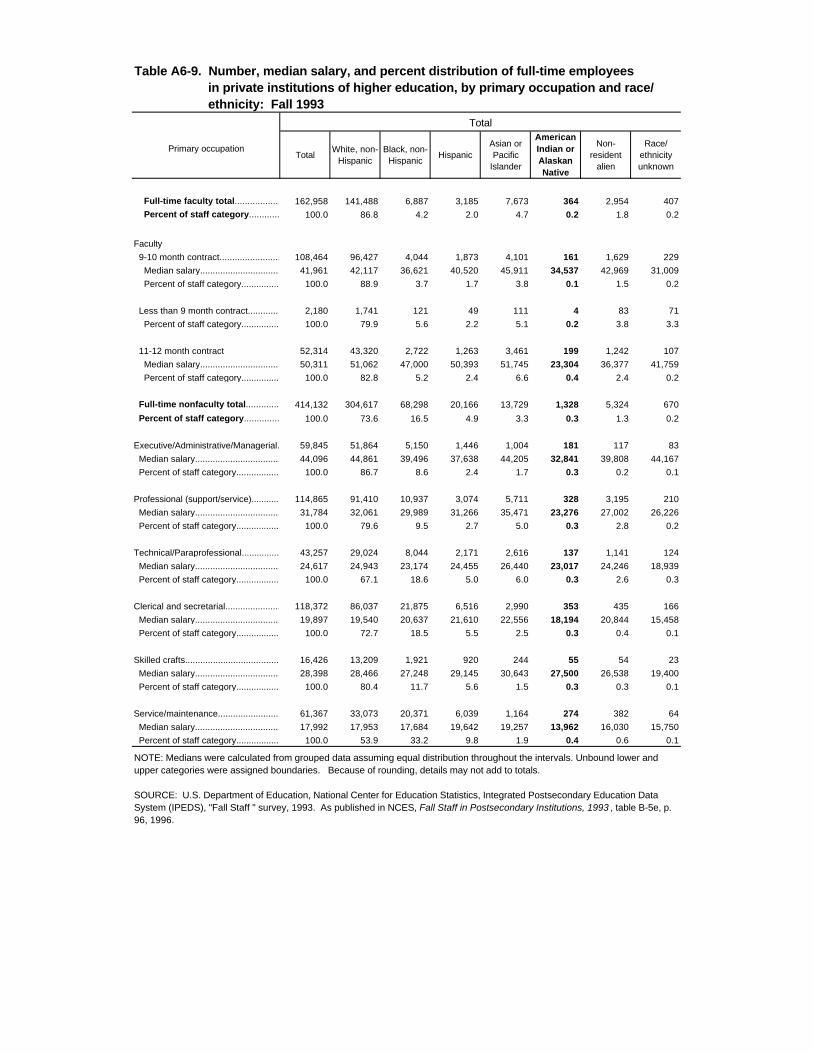
Table A6-9. Number, median salary, and percent distribution of full-time employees in private institutions of higher education, by primary occupation and race/ ethnicity: Fall 1993
Total
Primary occupationTotal
White, non-Hispanic
Black, non-Hispanic
HispanicAsian or Pacific
Islander
American Indian or Alaskan Native
Non-resident
alien
Race/ ethnicity unknown
Full-time faculty total......................................162,958 141,488 6,887 3,185 7,673 364 2,954 407
Percent of staff category.......................................100.0 86.8 4.2 2.0 4.7 0.2 1.8 0.2
Faculty
9-10 month contract........................................108,464 96,427 4,044 1,873 4,101 161 1,629 229
Median salary...........................................41,961 42,117 36,621 40,520 45,911 34,537 42,969 31,009
Percent of staff category.......................................100.0 88.9 3.7 1.7 3.8 0.1 1.5 0.2
Less than 9 month contract............... 2,180 1,741 121 49 111 4 83 71
Percent of staff category.......................................100.0 79.9 5.6 2.2 5.1 0.2 3.8 3.3
11-12 month contract 52,314 43,320 2,722 1,263 3,461 199 1,242 107
Median salary...........................................50,311 51,062 47,000 50,393 51,745 23,304 36,377 41,759
Percent of staff category.......................................100.0 82.8 5.2 2.4 6.6 0.4 2.4 0.2
Full-time nonfaculty total....................414,132 304,617 68,298 20,166 13,729 1,328 5,324 670
Percent of staff category.......................................100.0 73.6 16.5 4.9 3.3 0.3 1.3 0.2
Executive/Administrative/Managerial............59,845 51,864 5,150 1,446 1,004 181 117 83
Median salary...........................................44,096 44,861 39,496 37,638 44,205 32,841 39,808 44,167
Percent of staff category.......................................100.0 86.7 8.6 2.4 1.7 0.3 0.2 0.1
Professional (support/service)............. 114,865 91,410 10,937 3,074 5,711 328 3,195 210
Median salary...........................................31,784 32,061 29,989 31,266 35,471 23,276 27,002 26,226
Percent of staff category.......................................100.0 79.6 9.5 2.7 5.0 0.3 2.8 0.2
Technical/Paraprofessional..............................43,257 29,024 8,044 2,171 2,616 137 1,141 124
Median salary...........................................24,617 24,943 23,174 24,455 26,440 23,017 24,246 18,939
Percent of staff category.......................................100.0 67.1 18.6 5.0 6.0 0.3 2.6 0.3
Clerical and secretarial...........................................118,372 86,037 21,875 6,516 2,990 353 435 166
Median salary...........................................19,897 19,540 20,637 21,610 22,556 18,194 20,844 15,458
Percent of staff category.......................................100.0 72.7 18.5 5.5 2.5 0.3 0.4 0.1
Skilled crafts......................................................16,426 13,209 1,921 920 244 55 54 23
Median salary...........................................28,398 28,466 27,248 29,145 30,643 27,500 26,538 19,400
Percent of staff category.......................................100.0 80.4 11.7 5.6 1.5 0.3 0.3 0.1
Service/maintenance..........................................61,367 33,073 20,371 6,039 1,164 274 382 64
Median salary...........................................17,992 17,953 17,684 19,642 19,257 13,962 16,030 15,750
Percent of staff category.......................................100.0 53.9 33.2 9.8 1.9 0.4 0.6 0.1
NOTE: Medians were calculated from grouped data assuming equal distribution throughout the intervals. Unbound lower and upper categories were assigned boundaries. Because of rounding, details may not add to totals.
SOURCE: U.S. Department of Education, National Center for Education Statistics, Integrated Postsecondary Education Data System (IPEDS), "Fall Staff " survey, 1993. As published in NCES, Fall Staff in Postsecondary Institutions, 1993 , table B-5e, p. 96, 1996.
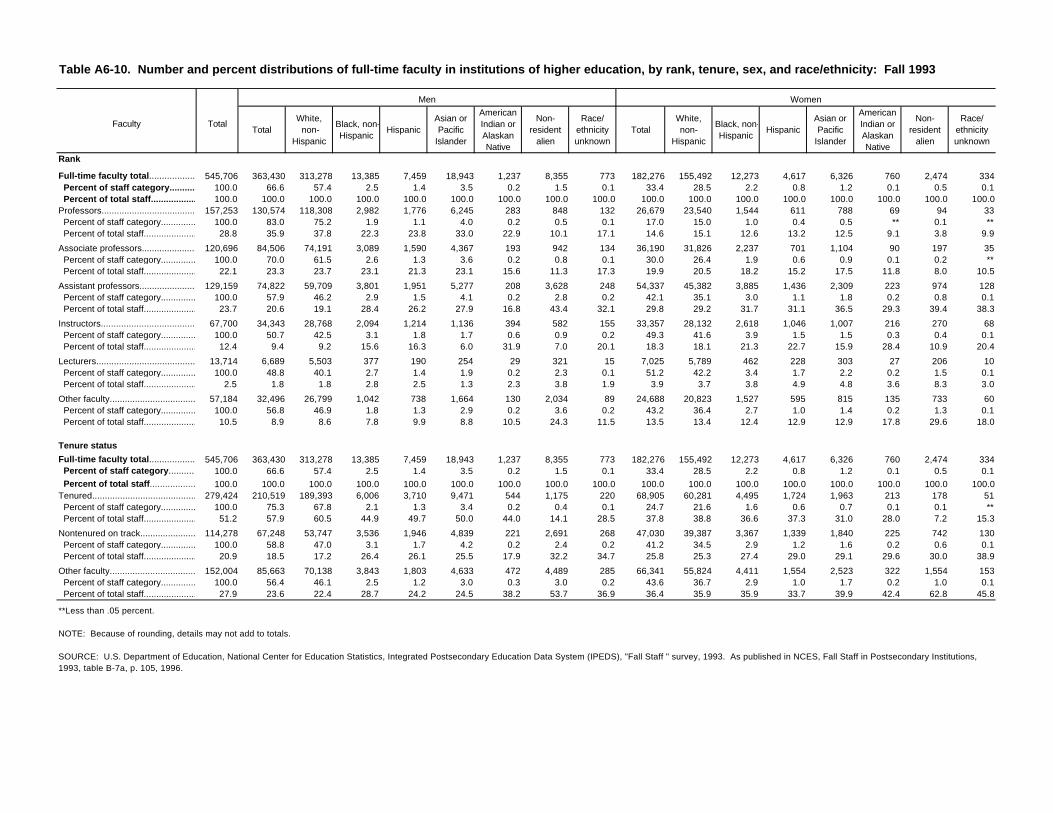
Table A6-10. Number and percent distributions of full-time faculty in institutions of higher education, by rank, tenure, sex, and race/ethnicity: Fall 1993
Men Women
Faculty TotalTotal
White, non-
Hispanic
Black, non-Hispanic
HispanicAsian or Pacific
Islander
American Indian or Alaskan Native
Non-resident
alien
Race/ ethnicity unknown
TotalWhite, non-
Hispanic
Black, non-Hispanic
Hispanic Asian or Pacific
Islander
American Indian or Alaskan Native
Non-resident
alien
Race/ ethnicity unknown
Rank
Full-time faculty total.......................545,706 363,430 313,278 13,385 7,459 18,943 1,237 8,355 773 182,276 155,492 12,273 4,617 6,326 760 2,474 334 Percent of staff category.......................................100.0 66.6 57.4 2.5 1.4 3.5 0.2 1.5 0.1 33.4 28.5 2.2 0.8 1.2 0.1 0.5 0.1 Percent of total staff.......................................100.0 100.0 100.0 100.0 100.0 100.0 100.0 100.0 100.0 100.0 100.0 100.0 100.0 100.0 100.0 100.0 100.0Professors..........................................157,253 130,574 118,308 2,982 1,776 6,245 283 848 132 26,679 23,540 1,544 611 788 69 94 33 Percent of staff category.......................................100.0 83.0 75.2 1.9 1.1 4.0 0.2 0.5 0.1 17.0 15.0 1.0 0.4 0.5 ** 0.1 ** Percent of total staff...........................................28.8 35.9 37.8 22.3 23.8 33.0 22.9 10.1 17.1 14.6 15.1 12.6 13.2 12.5 9.1 3.8 9.9
Associate professors..................................120,696 84,506 74,191 3,089 1,590 4,367 193 942 134 36,190 31,826 2,237 701 1,104 90 197 35 Percent of staff category.......................................100.0 70.0 61.5 2.6 1.3 3.6 0.2 0.8 0.1 30.0 26.4 1.9 0.6 0.9 0.1 0.2 ** Percent of total staff...........................................22.1 23.3 23.7 23.1 21.3 23.1 15.6 11.3 17.3 19.9 20.5 18.2 15.2 17.5 11.8 8.0 10.5
Assistant professors..........................129,159 74,822 59,709 3,801 1,951 5,277 208 3,628 248 54,337 45,382 3,885 1,436 2,309 223 974 128 Percent of staff category.......................................100.0 57.9 46.2 2.9 1.5 4.1 0.2 2.8 0.2 42.1 35.1 3.0 1.1 1.8 0.2 0.8 0.1 Percent of total staff...........................................23.7 20.6 19.1 28.4 26.2 27.9 16.8 43.4 32.1 29.8 29.2 31.7 31.1 36.5 29.3 39.4 38.3
Instructors...............................................67,700 34,343 28,768 2,094 1,214 1,136 394 582 155 33,357 28,132 2,618 1,046 1,007 216 270 68 Percent of staff category.......................................100.0 50.7 42.5 3.1 1.8 1.7 0.6 0.9 0.2 49.3 41.6 3.9 1.5 1.5 0.3 0.4 0.1 Percent of total staff...........................................12.4 9.4 9.2 15.6 16.3 6.0 31.9 7.0 20.1 18.3 18.1 21.3 22.7 15.9 28.4 10.9 20.4
Lecturers..............................................13,714 6,689 5,503 377 190 254 29 321 15 7,025 5,789 462 228 303 27 206 10 Percent of staff category.......................................100.0 48.8 40.1 2.7 1.4 1.9 0.2 2.3 0.1 51.2 42.2 3.4 1.7 2.2 0.2 1.5 0.1 Percent of total staff...........................................2.5 1.8 1.8 2.8 2.5 1.3 2.3 3.8 1.9 3.9 3.7 3.8 4.9 4.8 3.6 8.3 3.0
Other faculty....................................... 57,184 32,496 26,799 1,042 738 1,664 130 2,034 89 24,688 20,823 1,527 595 815 135 733 60 Percent of staff category.......................................100.0 56.8 46.9 1.8 1.3 2.9 0.2 3.6 0.2 43.2 36.4 2.7 1.0 1.4 0.2 1.3 0.1 Percent of total staff...........................................10.5 8.9 8.6 7.8 9.9 8.8 10.5 24.3 11.5 13.5 13.4 12.4 12.9 12.9 17.8 29.6 18.0
Tenure status
Full-time faculty total.....................................545,706 363,430 313,278 13,385 7,459 18,943 1,237 8,355 773 182,276 155,492 12,273 4,617 6,326 760 2,474 334 Percent of staff category.......................................100.0 66.6 57.4 2.5 1.4 3.5 0.2 1.5 0.1 33.4 28.5 2.2 0.8 1.2 0.1 0.5 0.1 Percent of total staff.......................................100.0 100.0 100.0 100.0 100.0 100.0 100.0 100.0 100.0 100.0 100.0 100.0 100.0 100.0 100.0 100.0 100.0Tenured.................................................279,424 210,519 189,393 6,006 3,710 9,471 544 1,175 220 68,905 60,281 4,495 1,724 1,963 213 178 51 Percent of staff category.......................................100.0 75.3 67.8 2.1 1.3 3.4 0.2 0.4 0.1 24.7 21.6 1.6 0.6 0.7 0.1 0.1 ** Percent of total staff...........................................51.2 57.9 60.5 44.9 49.7 50.0 44.0 14.1 28.5 37.8 38.8 36.6 37.3 31.0 28.0 7.2 15.3
Nontenured on track................................114,278 67,248 53,747 3,536 1,946 4,839 221 2,691 268 47,030 39,387 3,367 1,339 1,840 225 742 130 Percent of staff category.......................................100.0 58.8 47.0 3.1 1.7 4.2 0.2 2.4 0.2 41.2 34.5 2.9 1.2 1.6 0.2 0.6 0.1 Percent of total staff...........................................20.9 18.5 17.2 26.4 26.1 25.5 17.9 32.2 34.7 25.8 25.3 27.4 29.0 29.1 29.6 30.0 38.9
Other faculty.........................................152,004 85,663 70,138 3,843 1,803 4,633 472 4,489 285 66,341 55,824 4,411 1,554 2,523 322 1,554 153 Percent of staff category.......................................100.0 56.4 46.1 2.5 1.2 3.0 0.3 3.0 0.2 43.6 36.7 2.9 1.0 1.7 0.2 1.0 0.1 Percent of total staff...........................................27.9 23.6 22.4 28.7 24.2 24.5 38.2 53.7 36.9 36.4 35.9 35.9 33.7 39.9 42.4 62.8 45.8
**Less than .05 percent.
NOTE: Because of rounding, details may not add to totals.
SOURCE: U.S. Department of Education, National Center for Education Statistics, Integrated Postsecondary Education Data System (IPEDS), "Fall Staff " survey, 1993. As published in NCES, Fall Staff in Postsecondary Institutions, 1993, table B-7a, p. 105, 1996.
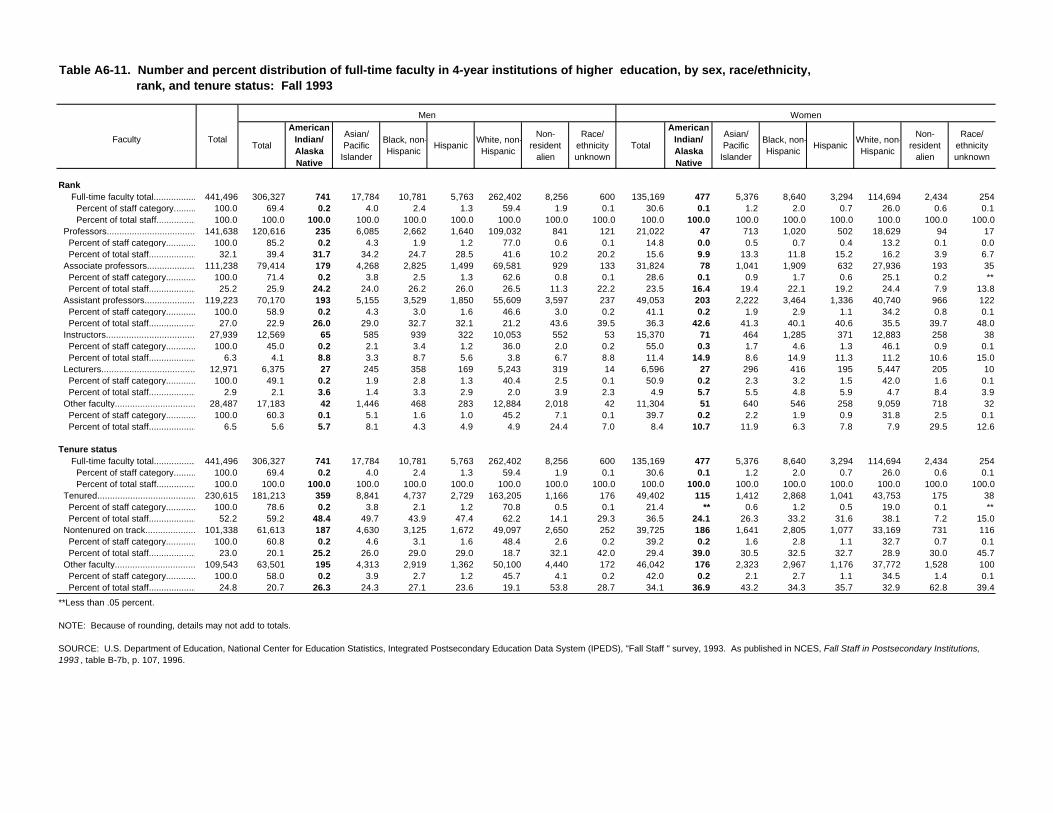
Men Women
Faculty TotalTotal
American Indian/ Alaska Native
Asian/ Pacific
Islander
Black, non-Hispanic
HispanicWhite, non-Hispanic
Non-resident
alien
Race/ ethnicity unknown
Total
American Indian/ Alaska Native
Asian/ Pacific
Islander
Black, non-Hispanic
HispanicWhite, non-Hispanic
Non-resident
alien
Race/ ethnicity unknown
Rank Full-time faculty total.......................441,496 306,327 741 17,784 10,781 5,763 262,402 8,256 600 135,169 477 5,376 8,640 3,294 114,694 2,434 254 Percent of staff category.......................................100.0 69.4 0.2 4.0 2.4 1.3 59.4 1.9 0.1 30.6 0.1 1.2 2.0 0.7 26.0 0.6 0.1 Percent of total staff.......................................100.0 100.0 100.0 100.0 100.0 100.0 100.0 100.0 100.0 100.0 100.0 100.0 100.0 100.0 100.0 100.0 100.0 Professors..........................................141,638 120,616 235 6,085 2,662 1,640 109,032 841 121 21,022 47 713 1,020 502 18,629 94 17 Percent of staff category.......................................100.0 85.2 0.2 4.3 1.9 1.2 77.0 0.6 0.1 14.8 0.0 0.5 0.7 0.4 13.2 0.1 0.0 Percent of total staff...........................................32.1 39.4 31.7 34.2 24.7 28.5 41.6 10.2 20.2 15.6 9.9 13.3 11.8 15.2 16.2 3.9 6.7 Associate professors..................................111,238 79,414 179 4,268 2,825 1,499 69,581 929 133 31,824 78 1,041 1,909 632 27,936 193 35 Percent of staff category.......................................100.0 71.4 0.2 3.8 2.5 1.3 62.6 0.8 0.1 28.6 0.1 0.9 1.7 0.6 25.1 0.2 ** Percent of total staff...........................................25.2 25.9 24.2 24.0 26.2 26.0 26.5 11.3 22.2 23.5 16.4 19.4 22.1 19.2 24.4 7.9 13.8 Assistant professors..........................119,223 70,170 193 5,155 3,529 1,850 55,609 3,597 237 49,053 203 2,222 3,464 1,336 40,740 966 122 Percent of staff category.......................................100.0 58.9 0.2 4.3 3.0 1.6 46.6 3.0 0.2 41.1 0.2 1.9 2.9 1.1 34.2 0.8 0.1 Percent of total staff...........................................27.0 22.9 26.0 29.0 32.7 32.1 21.2 43.6 39.5 36.3 42.6 41.3 40.1 40.6 35.5 39.7 48.0 Instructors...............................................27,939 12,569 65 585 939 322 10,053 552 53 15,370 71 464 1,285 371 12,883 258 38 Percent of staff category.......................................100.0 45.0 0.2 2.1 3.4 1.2 36.0 2.0 0.2 55.0 0.3 1.7 4.6 1.3 46.1 0.9 0.1 Percent of total staff...........................................6.3 4.1 8.8 3.3 8.7 5.6 3.8 6.7 8.8 11.4 14.9 8.6 14.9 11.3 11.2 10.6 15.0 Lecturers..............................................12,971 6,375 27 245 358 169 5,243 319 14 6,596 27 296 416 195 5,447 205 10 Percent of staff category.......................................100.0 49.1 0.2 1.9 2.8 1.3 40.4 2.5 0.1 50.9 0.2 2.3 3.2 1.5 42.0 1.6 0.1 Percent of total staff...........................................2.9 2.1 3.6 1.4 3.3 2.9 2.0 3.9 2.3 4.9 5.7 5.5 4.8 5.9 4.7 8.4 3.9 Other faculty.......................................28,487 17,183 42 1,446 468 283 12,884 2,018 42 11,304 51 640 546 258 9,059 718 32 Percent of staff category.......................................100.0 60.3 0.1 5.1 1.6 1.0 45.2 7.1 0.1 39.7 0.2 2.2 1.9 0.9 31.8 2.5 0.1 Percent of total staff...........................................6.5 5.6 5.7 8.1 4.3 4.9 4.9 24.4 7.0 8.4 10.7 11.9 6.3 7.8 7.9 29.5 12.6
Tenure status Full-time faculty total.....................................441,496 306,327 741 17,784 10,781 5,763 262,402 8,256 600 135,169 477 5,376 8,640 3,294 114,694 2,434 254 Percent of staff category.......................................100.0 69.4 0.2 4.0 2.4 1.3 59.4 1.9 0.1 30.6 0.1 1.2 2.0 0.7 26.0 0.6 0.1 Percent of total staff.......................................100.0 100.0 100.0 100.0 100.0 100.0 100.0 100.0 100.0 100.0 100.0 100.0 100.0 100.0 100.0 100.0 100.0 Tenured.................................................230,615 181,213 359 8,841 4,737 2,729 163,205 1,166 176 49,402 115 1,412 2,868 1,041 43,753 175 38 Percent of staff category.......................................100.0 78.6 0.2 3.8 2.1 1.2 70.8 0.5 0.1 21.4 ** 0.6 1.2 0.5 19.0 0.1 ** Percent of total staff...........................................52.2 59.2 48.4 49.7 43.9 47.4 62.2 14.1 29.3 36.5 24.1 26.3 33.2 31.6 38.1 7.2 15.0 Nontenured on track................................101,338 61,613 187 4,630 3,125 1,672 49,097 2,650 252 39,725 186 1,641 2,805 1,077 33,169 731 116 Percent of staff category.......................................100.0 60.8 0.2 4.6 3.1 1.6 48.4 2.6 0.2 39.2 0.2 1.6 2.8 1.1 32.7 0.7 0.1 Percent of total staff...........................................23.0 20.1 25.2 26.0 29.0 29.0 18.7 32.1 42.0 29.4 39.0 30.5 32.5 32.7 28.9 30.0 45.7 Other faculty.........................................109,543 63,501 195 4,313 2,919 1,362 50,100 4,440 172 46,042 176 2,323 2,967 1,176 37,772 1,528 100 Percent of staff category.......................................100.0 58.0 0.2 3.9 2.7 1.2 45.7 4.1 0.2 42.0 0.2 2.1 2.7 1.1 34.5 1.4 0.1 Percent of total staff...........................................24.8 20.7 26.3 24.3 27.1 23.6 19.1 53.8 28.7 34.1 36.9 43.2 34.3 35.7 32.9 62.8 39.4
**Less than .05 percent.
NOTE: Because of rounding, details may not add to totals.
SOURCE: U.S. Department of Education, National Center for Education Statistics, Integrated Postsecondary Education Data System (IPEDS), "Fall Staff " survey, 1993. As published in NCES, Fall Staff in Postsecondary Institutions, 1993 , table B-7b, p. 107, 1996.
Table A6-11. Number and percent distribution of full-time faculty in 4-year institutions of higher education, by sex, race/ethnicity, rank, and tenure status: Fall 1993
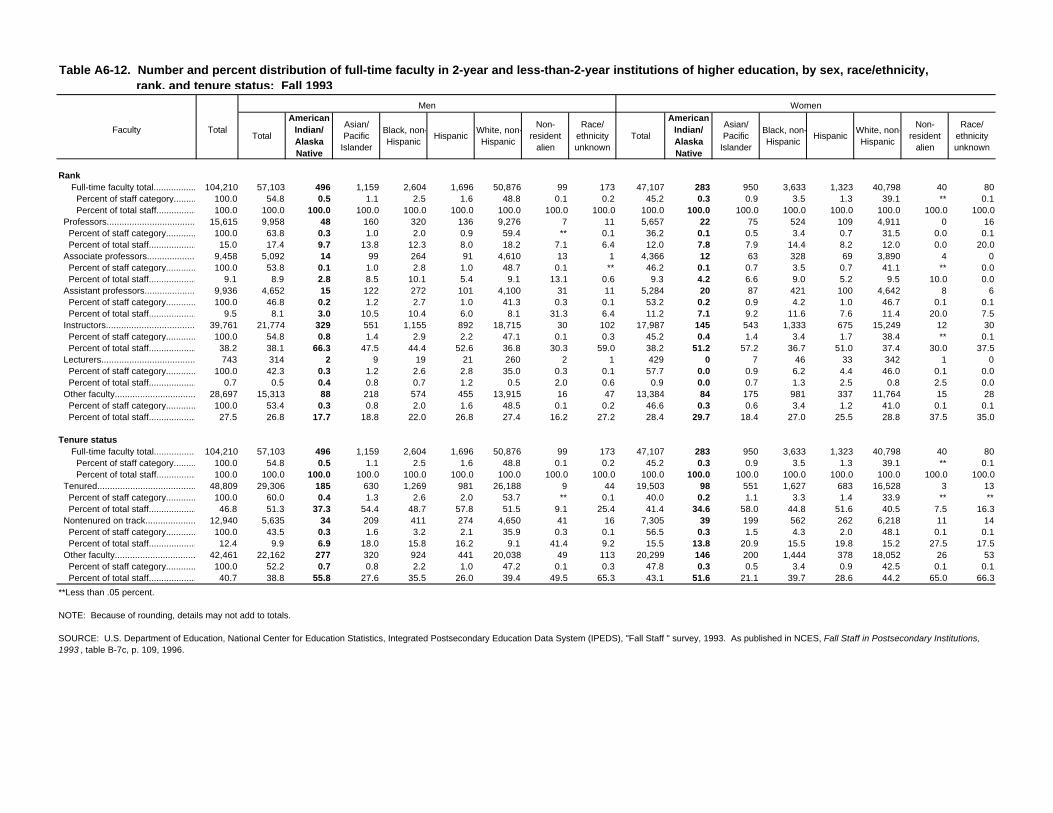
Men Women
Faculty TotalTotal
American Indian/ Alaska Native
Asian/ Pacific
Islander
Black, non-Hispanic
HispanicWhite, non-Hispanic
Non-resident
alien
Race/ ethnicity unknown
Total
American Indian/ Alaska Native
Asian/ Pacific
Islander
Black, non-Hispanic
HispanicWhite, non-Hispanic
Non-resident
alien
Race/ ethnicity unknown
Rank Full-time faculty total.......................104,210 57,103 496 1,159 2,604 1,696 50,876 99 173 47,107 283 950 3,633 1,323 40,798 40 80 Percent of staff category.......................................100.0 54.8 0.5 1.1 2.5 1.6 48.8 0.1 0.2 45.2 0.3 0.9 3.5 1.3 39.1 ** 0.1 Percent of total staff.......................................100.0 100.0 100.0 100.0 100.0 100.0 100.0 100.0 100.0 100.0 100.0 100.0 100.0 100.0 100.0 100.0 100.0 Professors..........................................15,615 9,958 48 160 320 136 9,276 7 11 5,657 22 75 524 109 4,911 0 16 Percent of staff category.......................................100.0 63.8 0.3 1.0 2.0 0.9 59.4 ** 0.1 36.2 0.1 0.5 3.4 0.7 31.5 0.0 0.1 Percent of total staff...........................................15.0 17.4 9.7 13.8 12.3 8.0 18.2 7.1 6.4 12.0 7.8 7.9 14.4 8.2 12.0 0.0 20.0 Associate professors..................................9,458 5,092 14 99 264 91 4,610 13 1 4,366 12 63 328 69 3,890 4 0 Percent of staff category.......................................100.0 53.8 0.1 1.0 2.8 1.0 48.7 0.1 ** 46.2 0.1 0.7 3.5 0.7 41.1 ** 0.0 Percent of total staff...........................................9.1 8.9 2.8 8.5 10.1 5.4 9.1 13.1 0.6 9.3 4.2 6.6 9.0 5.2 9.5 10.0 0.0 Assistant professors.......................... 9,936 4,652 15 122 272 101 4,100 31 11 5,284 20 87 421 100 4,642 8 6 Percent of staff category.......................................100.0 46.8 0.2 1.2 2.7 1.0 41.3 0.3 0.1 53.2 0.2 0.9 4.2 1.0 46.7 0.1 0.1 Percent of total staff...........................................9.5 8.1 3.0 10.5 10.4 6.0 8.1 31.3 6.4 11.2 7.1 9.2 11.6 7.6 11.4 20.0 7.5 Instructors...............................................39,761 21,774 329 551 1,155 892 18,715 30 102 17,987 145 543 1,333 675 15,249 12 30 Percent of staff category.......................................100.0 54.8 0.8 1.4 2.9 2.2 47.1 0.1 0.3 45.2 0.4 1.4 3.4 1.7 38.4 ** 0.1 Percent of total staff...........................................38.2 38.1 66.3 47.5 44.4 52.6 36.8 30.3 59.0 38.2 51.2 57.2 36.7 51.0 37.4 30.0 37.5 Lecturers.............................................. 743 314 2 9 19 21 260 2 1 429 0 7 46 33 342 1 0 Percent of staff category.......................................100.0 42.3 0.3 1.2 2.6 2.8 35.0 0.3 0.1 57.7 0.0 0.9 6.2 4.4 46.0 0.1 0.0 Percent of total staff...........................................0.7 0.5 0.4 0.8 0.7 1.2 0.5 2.0 0.6 0.9 0.0 0.7 1.3 2.5 0.8 2.5 0.0 Other faculty.......................................28,697 15,313 88 218 574 455 13,915 16 47 13,384 84 175 981 337 11,764 15 28 Percent of staff category.......................................100.0 53.4 0.3 0.8 2.0 1.6 48.5 0.1 0.2 46.6 0.3 0.6 3.4 1.2 41.0 0.1 0.1 Percent of total staff...........................................27.5 26.8 17.7 18.8 22.0 26.8 27.4 16.2 27.2 28.4 29.7 18.4 27.0 25.5 28.8 37.5 35.0
Tenure status Full-time faculty total.....................................104,210 57,103 496 1,159 2,604 1,696 50,876 99 173 47,107 283 950 3,633 1,323 40,798 40 80 Percent of staff category.......................................100.0 54.8 0.5 1.1 2.5 1.6 48.8 0.1 0.2 45.2 0.3 0.9 3.5 1.3 39.1 ** 0.1 Percent of total staff.......................................100.0 100.0 100.0 100.0 100.0 100.0 100.0 100.0 100.0 100.0 100.0 100.0 100.0 100.0 100.0 100.0 100.0 Tenured.................................................48,809 29,306 185 630 1,269 981 26,188 9 44 19,503 98 551 1,627 683 16,528 3 13 Percent of staff category.......................................100.0 60.0 0.4 1.3 2.6 2.0 53.7 ** 0.1 40.0 0.2 1.1 3.3 1.4 33.9 ** ** Percent of total staff...........................................46.8 51.3 37.3 54.4 48.7 57.8 51.5 9.1 25.4 41.4 34.6 58.0 44.8 51.6 40.5 7.5 16.3 Nontenured on track................................12,940 5,635 34 209 411 274 4,650 41 16 7,305 39 199 562 262 6,218 11 14 Percent of staff category.......................................100.0 43.5 0.3 1.6 3.2 2.1 35.9 0.3 0.1 56.5 0.3 1.5 4.3 2.0 48.1 0.1 0.1 Percent of total staff...........................................12.4 9.9 6.9 18.0 15.8 16.2 9.1 41.4 9.2 15.5 13.8 20.9 15.5 19.8 15.2 27.5 17.5 Other faculty.........................................42,461 22,162 277 320 924 441 20,038 49 113 20,299 146 200 1,444 378 18,052 26 53 Percent of staff category.......................................100.0 52.2 0.7 0.8 2.2 1.0 47.2 0.1 0.3 47.8 0.3 0.5 3.4 0.9 42.5 0.1 0.1 Percent of total staff...........................................40.7 38.8 55.8 27.6 35.5 26.0 39.4 49.5 65.3 43.1 51.6 21.1 39.7 28.6 44.2 65.0 66.3
**Less than .05 percent.
NOTE: Because of rounding, details may not add to totals.
SOURCE: U.S. Department of Education, National Center for Education Statistics, Integrated Postsecondary Education Data System (IPEDS), "Fall Staff " survey, 1993. As published in NCES, Fall Staff in Postsecondary Institutions, 1993 , table B-7c, p. 109, 1996.
Table A6-12. Number and percent distribution of full-time faculty in 2-year and less-than-2-year institutions of higher education, by sex, race/ethnicity, rank, and tenure status: Fall 1993
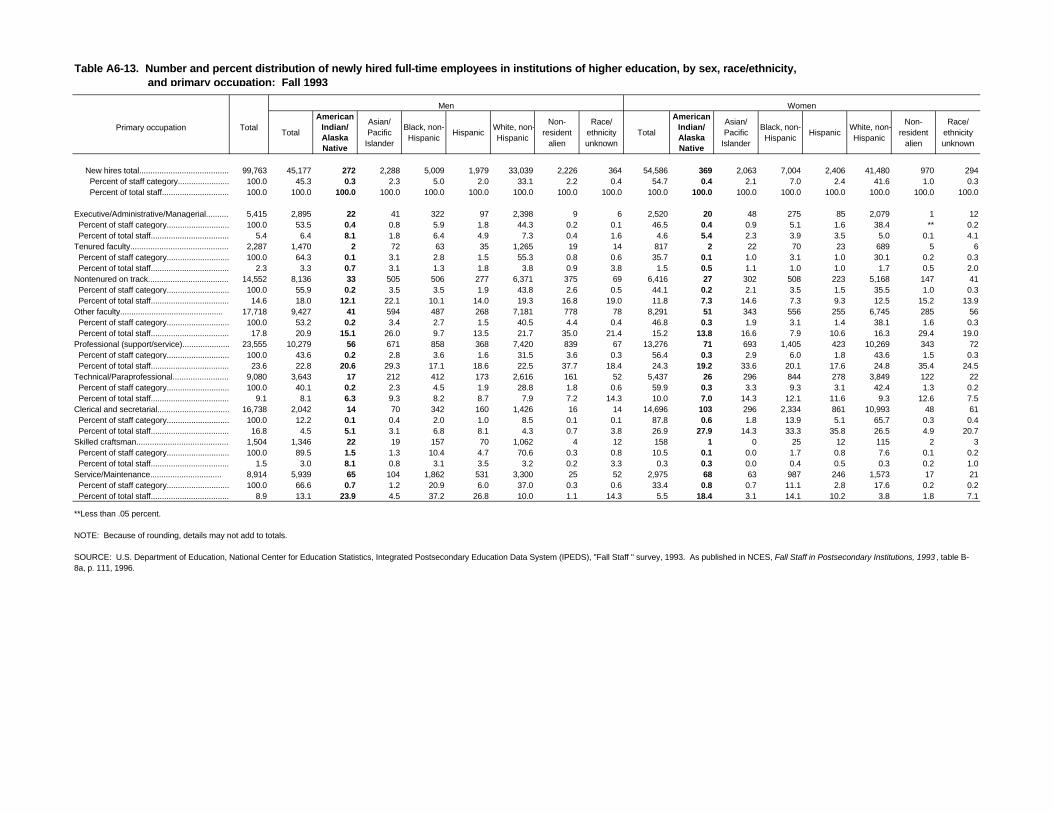
Men Women
Primary occupation TotalTotal
American Indian/ Alaska Native
Asian/ Pacific
Islander
Black, non-Hispanic
HispanicWhite, non-Hispanic
Non-resident
alien
Race/ ethnicity unknown
Total
American Indian/ Alaska Native
Asian/ Pacific
Islander
Black, non-Hispanic
HispanicWhite, non-Hispanic
Non-resident
alien
Race/ ethnicity unknown
New hires total..............................................99,763 45,177 272 2,288 5,009 1,979 33,039 2,226 364 54,586 369 2,063 7,004 2,406 41,480 970 294 Percent of staff category.......................................100.0 45.3 0.3 2.3 5.0 2.0 33.1 2.2 0.4 54.7 0.4 2.1 7.0 2.4 41.6 1.0 0.3 Percent of total staff.......................................100.0 100.0 100.0 100.0 100.0 100.0 100.0 100.0 100.0 100.0 100.0 100.0 100.0 100.0 100.0 100.0 100.0
Executive/Administrative/Managerial................ 5,415 2,895 22 41 322 97 2,398 9 6 2,520 20 48 275 85 2,079 1 12 Percent of staff category.......................................100.0 53.5 0.4 0.8 5.9 1.8 44.3 0.2 0.1 46.5 0.4 0.9 5.1 1.6 38.4 ** 0.2 Percent of total staff........................................... 5.4 6.4 8.1 1.8 6.4 4.9 7.3 0.4 1.6 4.6 5.4 2.3 3.9 3.5 5.0 0.1 4.1Tenured faculty....................................................2,287 1,470 2 72 63 35 1,265 19 14 817 2 22 70 23 689 5 6 Percent of staff category.......................................100.0 64.3 0.1 3.1 2.8 1.5 55.3 0.8 0.6 35.7 0.1 1.0 3.1 1.0 30.1 0.2 0.3 Percent of total staff........................................... 2.3 3.3 0.7 3.1 1.3 1.8 3.8 0.9 3.8 1.5 0.5 1.1 1.0 1.0 1.7 0.5 2.0Nontenured on track..........................................14,552 8,136 33 505 506 277 6,371 375 69 6,416 27 302 508 223 5,168 147 41 Percent of staff category.......................................100.0 55.9 0.2 3.5 3.5 1.9 43.8 2.6 0.5 44.1 0.2 2.1 3.5 1.5 35.5 1.0 0.3 Percent of total staff........................................... 14.6 18.0 12.1 22.1 10.1 14.0 19.3 16.8 19.0 11.8 7.3 14.6 7.3 9.3 12.5 15.2 13.9Other faculty.............................................. 17,718 9,427 41 594 487 268 7,181 778 78 8,291 51 343 556 255 6,745 285 56 Percent of staff category.......................................100.0 53.2 0.2 3.4 2.7 1.5 40.5 4.4 0.4 46.8 0.3 1.9 3.1 1.4 38.1 1.6 0.3 Percent of total staff........................................... 17.8 20.9 15.1 26.0 9.7 13.5 21.7 35.0 21.4 15.2 13.8 16.6 7.9 10.6 16.3 29.4 19.0Professional (support/service).........................................23,555 10,279 56 671 858 368 7,420 839 67 13,276 71 693 1,405 423 10,269 343 72 Percent of staff category.......................................100.0 43.6 0.2 2.8 3.6 1.6 31.5 3.6 0.3 56.4 0.3 2.9 6.0 1.8 43.6 1.5 0.3 Percent of total staff........................................... 23.6 22.8 20.6 29.3 17.1 18.6 22.5 37.7 18.4 24.3 19.2 33.6 20.1 17.6 24.8 35.4 24.5Technical/Paraprofessional................................................9,080 3,643 17 212 412 173 2,616 161 52 5,437 26 296 844 278 3,849 122 22 Percent of staff category.......................................................100.0 40.1 0.2 2.3 4.5 1.9 28.8 1.8 0.6 59.9 0.3 3.3 9.3 3.1 42.4 1.3 0.2 Percent of total staff...........................................................9.1 8.1 6.3 9.3 8.2 8.7 7.9 7.2 14.3 10.0 7.0 14.3 12.1 11.6 9.3 12.6 7.5Clerical and secretarial................................... 16,738 2,042 14 70 342 160 1,426 16 14 14,696 103 296 2,334 861 10,993 48 61 Percent of staff category.......................................100.0 12.2 0.1 0.4 2.0 1.0 8.5 0.1 0.1 87.8 0.6 1.8 13.9 5.1 65.7 0.3 0.4 Percent of total staff........................................... 16.8 4.5 5.1 3.1 6.8 8.1 4.3 0.7 3.8 26.9 27.9 14.3 33.3 35.8 26.5 4.9 20.7Skilled craftsman............................................... 1,504 1,346 22 19 157 70 1,062 4 12 158 1 0 25 12 115 2 3 Percent of staff category.......................................100.0 89.5 1.5 1.3 10.4 4.7 70.6 0.3 0.8 10.5 0.1 0.0 1.7 0.8 7.6 0.1 0.2 Percent of total staff........................................... 1.5 3.0 8.1 0.8 3.1 3.5 3.2 0.2 3.3 0.3 0.3 0.0 0.4 0.5 0.3 0.2 1.0Service/Maintenance................................ 8,914 5,939 65 104 1,862 531 3,300 25 52 2,975 68 63 987 246 1,573 17 21 Percent of staff category.......................................100.0 66.6 0.7 1.2 20.9 6.0 37.0 0.3 0.6 33.4 0.8 0.7 11.1 2.8 17.6 0.2 0.2 Percent of total staff........................................... 8.9 13.1 23.9 4.5 37.2 26.8 10.0 1.1 14.3 5.5 18.4 3.1 14.1 10.2 3.8 1.8 7.1
**Less than .05 percent.
NOTE: Because of rounding, details may not add to totals.
SOURCE: U.S. Department of Education, National Center for Education Statistics, Integrated Postsecondary Education Data System (IPEDS), "Fall Staff " survey, 1993. As published in NCES, Fall Staff in Postsecondary Institutions, 1993 , table B-8a, p. 111, 1996.
Table A6-13. Number and percent distribution of newly hired full-time employees in institutions of higher education, by sex, race/ethnicity, and primary occupation: Fall 1993

B-1
Appendix B
Selected Standard Error Tables
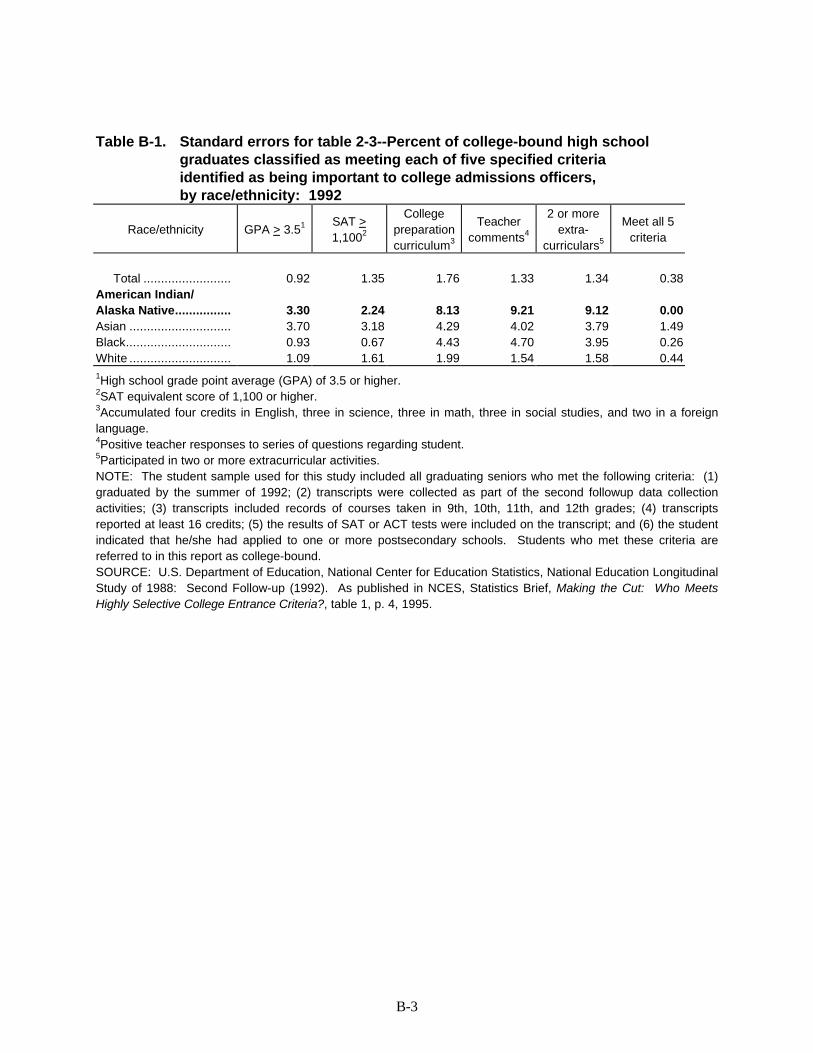
B-3
Table B-1. Standard errors for table 2-3--Percent of college-bound high schoolgraduates classified as meeting each of five specified criteriaidentified as being important to college admissions officers,by race/ethnicity: 1992
Race/ethnicity GPA > 3.51 SAT >1,1002
Collegepreparationcurriculum3
Teachercomments4
2 or moreextra-
curriculars5
Meet all 5criteria
Total ......................... 0.92 1.35 1.76 1.33 1.34 0.38American Indian/Alaska Native................ 3.30 2.24 8.13 9.21 9.12 0.00Asian ............................. 3.70 3.18 4.29 4.02 3.79 1.49Black.............................. 0.93 0.67 4.43 4.70 3.95 0.26White ............................. 1.09 1.61 1.99 1.54 1.58 0.441High school grade point average (GPA) of 3.5 or higher.2SAT equivalent score of 1,100 or higher.3Accumulated four credits in English, three in science, three in math, three in social studies, and two in a foreignlanguage.4Positive teacher responses to series of questions regarding student.5Participated in two or more extracurricular activities.NOTE: The student sample used for this study included all graduating seniors who met the following criteria: (1)graduated by the summer of 1992; (2) transcripts were collected as part of the second followup data collectionactivities; (3) transcripts included records of courses taken in 9th, 10th, 11th, and 12th grades; (4) transcriptsreported at least 16 credits; (5) the results of SAT or ACT tests were included on the transcript; and (6) the studentindicated that he/she had applied to one or more postsecondary schools. Students who met these criteria arereferred to in this report as college-bound.SOURCE: U.S. Department of Education, National Center for Education Statistics, National Education LongitudinalStudy of 1988: Second Follow-up (1992). As published in NCES, Statistics Brief, Making the Cut: Who MeetsHighly Selective College Entrance Criteria?, table 1, p. 4, 1995.
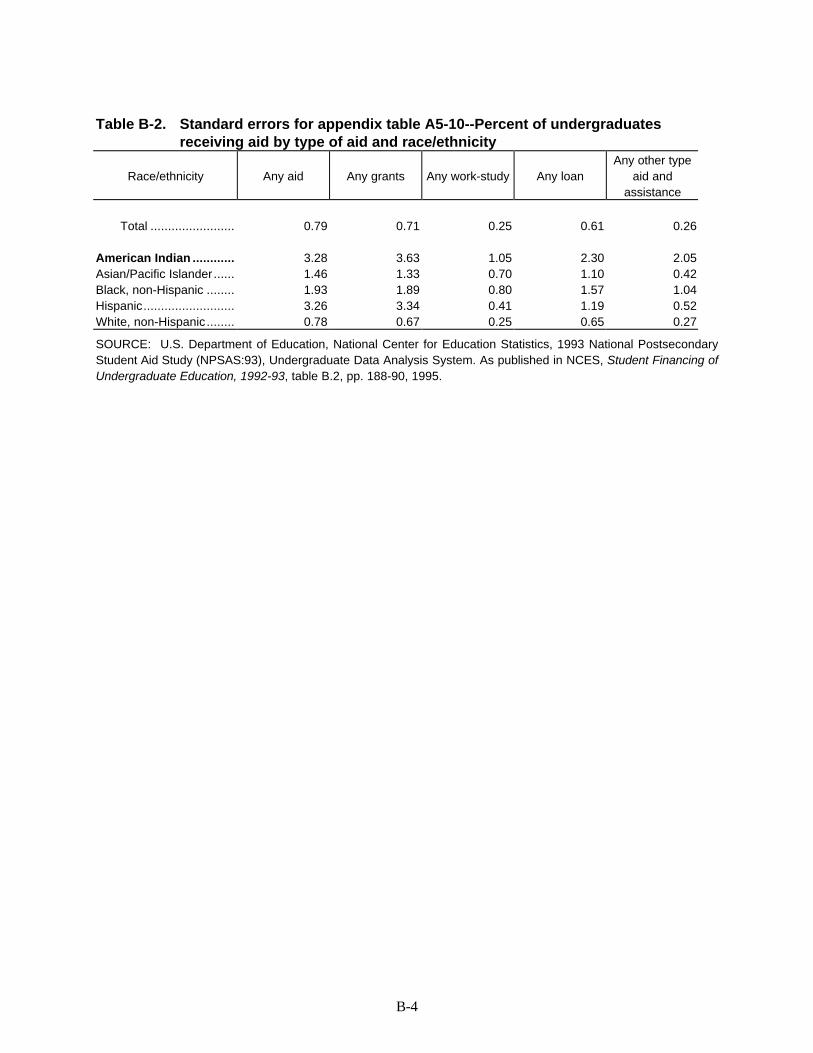
B-4
Table B-2. Standard errors for appendix table A5-10--Percent of undergraduatesreceiving aid by type of aid and race/ethnicity
Race/ethnicity Any aid Any grants Any work-study Any loanAny other type
aid andassistance
Total ........................ 0.79 0.71 0.25 0.61 0.26
American Indian ............ 3.28 3.63 1.05 2.30 2.05Asian/Pacific Islander...... 1.46 1.33 0.70 1.10 0.42Black, non-Hispanic ........ 1.93 1.89 0.80 1.57 1.04Hispanic.......................... 3.26 3.34 0.41 1.19 0.52White, non-Hispanic ........ 0.78 0.67 0.25 0.65 0.27
SOURCE: U.S. Department of Education, National Center for Education Statistics, 1993 National PostsecondaryStudent Aid Study (NPSAS:93), Undergraduate Data Analysis System. As published in NCES, Student Financing ofUndergraduate Education, 1992-93, table B.2, pp. 188-90, 1995.

C-1
Appendix C
Glossary
C-3
Glossary
1Achievement test—An examination thatmeasures the extent to which a personhas acquired certain information ormastered certain skills, usually as a resultof specific instruction.
1Administrative support staff—Includespersonnel dealing with salary, benefits,supplies, and contractual fees for theoffice of the principal, full-time departmentchairpersons, and graduation expenses.
1Agriculture—Courses designed toimprove competencies in agriculturaloccupations. Included is the study ofagricultural production, supplies,mechanization and products, agriculturalscience, forestry, and related services.
1American College Testing Program(ACT)—The ACT assessment programmeasures educational development andreadiness to pursue college-levelcoursework in English, mathematics,natural science, and social studies.Student performance on the tests does notreflect innate ability and is influenced by astudent’s educational preparedness.
1Associate degree—A degree granted forthe successful completion of a sub-baccalaureate program of studies, usuallyrequiring at least 2 years (or equivalent) offull-time college-level study. This includesdegrees granted in a cooperative or work-study program.
1Bachelor’s degree—A degree granted forthe successful completion of abaccalaureate program of studies, usuallyrequiring at least 4 years (or equivalent) offull-time college-level study. This includes
degrees granted in a cooperative or work-study program.
1Business—Program of instruction thatprepares individuals for a variety ofactivities in planning, organizing, directing,and controlling business office systemsand procedures.
1Cohort—A group of individuals that havea statistical factor in common, forexample, year of birth.
1College—A postsecondary school whichoffers general or liberal arts education,usually leading to an associate, bachelor’s,master’s, doctors, or first-professionaldegree. Junior colleges and communitycolleges are included under thisterminology.
1Computer science—A group ofinstructional programs that describescomputer and information sciences,including computer programming, dataprocessing, and information systems.
1Control of institutions—A classificationof institutions of elementary/secondary orhigher education by whether theinstitution is operated by publicly electedor appointed officials (public control) or byprivately elected or appointed officials andderives its major source of funds fromprivate sources (private control).
1Doctor’s degree—An earned degreecarrying the title of Doctor. The Doctor ofPhilosophy degree (Ph.D.) is the highestacademic degree and requires masterywithin a field of knowledge anddemonstrated ability to perform scholarlyresearch. Other doctorates are awardedfor fulfilling specialized requirements in
C-4
professional fields, such as education(Ed.D.), musical arts (D.M.A.), business oradministration (D.B.A), and engineering(D.Eng. or D.E.S.). Many doctor’s degreesin academic and professional fields requirean earned master’s degree as a pre-requisite. First-professional degrees, suchas M.D. and D.D.S., are not included underthis heading.
1Educational attainment—The highestgrade of regular school attended andcompleted.
1Engineering—Instructional programs thatdescribe the mathematical and naturalscience knowledge gained by study,experience, and practice and applied withjudgment to develop ways to utilize thematerials and forces of natureeconomically for the benefit of mankind.Include programs that prepare individualsto support and assist engineers and similarprofessionals.
1English—A group of instructionalprograms that describes the Englishlanguage arts, including composition,creative writing, and the study of literature.
1Enrollment—The total number ofstudents registered in a given school unitat a given time, generally in the fall of ayear.
1Extracurricular activities—Activities thatare not part of the required curriculum andthat take place outside of the regularcourse of study. As used here, theyinclude both school-sponsored (e.g.,varsity athletics, drama and debate clubs)and community-sponsored (e.g., hobbyclubs and youth organizations like theJunior Chamber of Commerce or BoyScouts) activities.
1Family—A group of two persons or more(one of whom is the householder) relatedby birth, marriage, or adoption andresiding together. All such persons(including related subfamily members) areconsidered as members of one family.
1First-professional degree—A degree thatsignifies both completion of the academicrequirements for beginning practice in agiven professional and a level ofprofessional skill beyond that normallyrequired for a bachelor’s degree. Thisdegree usually is based on a programrequiring at least 2 academic years ofwork prior to entrance and a total of atleast 6 academic years of work tocomplete the degree program, includingboth prior-required college work and theprofessional program itself. By NCESdefinition, first-professional degrees areawarded in the fields of dentistry (D.D.S. orD.M.D.), medicine (M.D.), optometry (O.D.),osteopathic medicine (D.O.), pharmacy(D.Phar.), podiatric medicine (D.P.M.),veterinary medicine (D.V.M.), chiropractic(D.C. or D.C.M.), law (J.D.), and theologicalprofessions (M.Div. or M.H.L.).
1First-professional enrollment—Thenumber of students enrolled in aprofessional school or program whichrequires at least 2 years of academiccollege work for entrance and a total of atleast 6 years for a degree. By NCESdefinition, first-professional enrollmentincludes only students in certain programs.(See First-professional degree for a list ofprograms.)
1Fiscal year—The yearly accounting periodfor the Federal Government, which beginson October 1 and ends on the followingSeptember 30. The fiscal year isdesignated by the calendar year in whichit ends; e.g., fiscal year 1988 begins onOctober 1, 1987, and ends on September
C-5
30, 1988. (From fiscal year 1844 to fiscalyear 1976, the fiscal year began on July 1and ended on the following June 30.)
1Foreign language—A group ofinstructional programs that describes thestructure and use of language that iscommon or indigenous to people of thesame community or nation, the samegeographical area, or the same culturaltraditions. Programs cover such featuresas sound, literature, syntax, phonology,semantics, sentences, prose, and verse, aswell as the development of skills andattitudes used in communicating andevaluating thoughts and feelings throughoral and written language.
1Full-time enrollment—The number ofstudents enrolled in higher educationcourses with total credit load equal to atleast 75 percent of the normal full-timecourse load.
1Full-time-equivalent (FTE) enrollment—For institutions of higher education,enrollment of full-time students, plus thefull-time equivalent of the part-timestudents. The full-time equivalent of thepart-time students is estimated usingdifferent factors depending on the typeand control of institution and level ofstudent.
1Full-time instructional faculty—Thosemembers of the instruction/research staffwho are employed full time as defined bythe institution, including faculty withreleased time for research and faculty onsabbatical leave. Full-time counts excludefaculty who are employed to teach lessthan two semesters, three quarters, twotrimesters, or two 4-month h sessions;replacements for faculty on sabbaticalleave or those on leave without pay;faculty for preclinical and clinicalmedicine; faculty who are donating their
services; faculty who are members ofmilitary organizations and paid on adifferent pay scale from civilianemployees; academic officers, whoseprimary duties are administrative; andgraduate students who assist in theinstruction of courses.
1General Educational Development(GED) program—Academic instruction toprepare persons to take the high schoolequivalency examination. See GEDrecipient.
1GED recipient—A person who hasobtained certification of high schoolequivalency by meeting Staterequirements and passing an approvedexam, which is intended to provide anappraisal of the person’s achievement orperformance in the broad subject matterareas usually required for high schoolgraduation.
1Geographic region—One of the regionsor divisions used by the U.S. Bureau of theCensus in Current Population Surveytabulations, as follows:
Northeast Midwest
(New England) (East North Central)Maine OhioNew Hampshire IndianaVermont IllinoisMassachusetts MichiganRhode Island WisconsinConnecticut
(Middle Atlantic) (West North Central)New York MinnesotaNew Jersey IowaPennsylvania Missouri
North DakotaSouth DakotaNebraskaKansas
C-6
South West
(South Atlantic) (Mountain)Delaware MontanaMaryland IdahoDistrict ofColumbia
WyomingColorado
Virginia New MexicoWest Virginia ArizonaNorth Carolina UtahSouth Carolina NevadaGeorgiaFlorida
(East South Central) (Pacific)Kentucky WashingtonTennessee OregonAlabama CaliforniaMississippi Alaska
Hawaii
(West South Central)ArkansasLouisianaOklahomaTexas
1Graduate—An individual who hasreceived formal recognition for thesuccessful completion of a prescribedprogram of studies.
1Graduate enrollment—The number ofstudents who hold the bachelor’s or first-professional degree, or the equivalent,and who are working towards a master’sor doctor’s degree. First-professionalstudents are counted separately. Theseenrollment data measure those studentswho are registered at a particular timeduring the fall. At some institutions,graduate enrollment also includesstudents who are in postbaccalaureateclasses but not in degree programs. Inspecified tables, graduate enrollmentincludes all students in regular graduate
programs and all students inpostbaccalaureate classes but not indegree programs (unclassifiedpostbaccalaureate students).
1Graduation—Formal recognition given anindividual for the successful completion ofa prescribed program of studies.
1Higher education—Study beyondsecondary school at an institution thatoffers programs terminating in anassociate, baccalaureate, or higher degree.
1Higher education institutions(traditional classification)—
4-year institution—An institutionlegally authorized to offer andoffering at least a 4-year program ofcollege-level studies wholly orprincipally creditable toward abaccalaureate degree. In some tables,a further division between universitiesand other 4-year institutions is made.A “university” is a postsecondaryinstitution which typically comprisesone or more graduate professionalschools (also see University). Forpurposes of trend comparisons in thisvolume, the selection of universitieshas been held constant for alltabulations after 1982. “Other 4-yearinstitutions” would include the rest ofthe nonuniversity 4-year institutions.
2-year institution—An institutionlegally authorized to offer andoffering at least a 2-year program ofcollege-level studies which terminatesin an associate degree or is principallycreditable toward a baccalaureatedegree. Also includes someinstitutions that have a less than 2-year program, but were designated asinstitutions of higher education in the
C-7
Higher Education General InformationSurvey.
1High school—A secondary school offeringthe final years of high school worknecessary for graduation, usually includinggrades 10, 11, 12 (in a 6-3-3 plan), orgrades 9, 10, 11, and 12 (in a 6-2-4 plan).
1High school program—A program ofstudies designed to prepare students fortheir postsecondary education andoccupation. Three types of programs areusually distinguished—academic,vocational, and general. An academicprogram is designed to prepare studentsfor continued study at a college oruniversity. A vocational program isdesigned to prepare students foremployment in one or more semiskilled,skilled, or technical occupations. Ageneral program is designed to providestudents with the understanding andcompetence to function effectively in afree society and usually represents amixture of academic and vocationalcomponents.
1Household—All the persons who occupya housing unit. A house, apartment, orother group of rooms, or a single room, isregarded as a housing unit when it isoccupied or intended for occupancy asseparate living quarters, that is, when theoccupants do not live and eat with anyother persons in the structure, and there isdirect access from the outside or through acommon hall.
1Instructional staff—Full-time-equivalentnumber of positions, not the number ofdifferent individuals occupying thepositions during the school year. In localschools, includes all public elementary andsecondary (junior and senior high) day-school positions that are in the nature ofteaching or in the improvement of the
teaching-learning situation. Includesconsultants or supervisors of instruction,principals, teachers, guidance personnel,librarians, psychological personnel, andother instructional staff. Excludesadministrative staff, attendance personnel,clerical personnel, and junior college staff.
1Instructional support services—Includessalary, benefits, supplies, and contractualfees for staff providing instructionalimprovement, educational media (libraryand audiovisual), and other instructionalsupport services.
1Master’s degree—A degree awarded forsuccessful completion of a programgenerally requiring 1 or 2 years of full-timecollege level study beyond the bachelor’sdegree. One type of master’s degree,including the Masters of Art degree, orM.A., and the Master of Science degree, orM.S., is awarded in the liberal arts andsciences for advanced scholarship in asubject field or discipline anddemonstrated ability to perform scholarlyresearch. A second type of master’sdegree is awarded for the completion of aprofessional oriented program, forexample, an M.Ed. in education, an M.B.A.in business administration, an M.F.A. infine arts, and an M.M. in music, an M.S.W.in social work, and an M.P.A. in publicadministration. A third type of master’sdegree is awarded in professional fieldsfor study beyond the first-professionaldegree, for example, the Master of Laws(L.L.M.) and Master of Science in variousmedical specializations.
1Mathematics—A group of instructionalprograms that describes the science ofnumbers and their operations,interrelations, combinations, generaliza-tions, and abstractions and of spaceconfigurations and their structure,
C-8
measurement, transformations, andgeneralizations.
1Nonresident alien—A person who is nota citizen of the United States and who is inthis country on a temporary basis anddoes not have the right to remainindefinitely.
1Other support services—Includes salary,benefits, supplies, and contractual fees forbusiness support services, central supportservices, other support services nototherwise classified.
1Other support services staff—All staffnot reported in other categories. Thisgroup includes media personnel, socialworkers, bus drivers, security, cafeteriaworkers, and other staff.
1Part-time enrollment—The number ofstudents enrolled in higher educationcourses with a total credit load less than75 percent of the normal full-time creditload.
1Postbaccalaureate enrollment—Thenumber of graduate and first-professionalstudents working towards advanceddegrees and of students enrolled ingraduate-level classes but not enrolled indegree programs. See also Graduateenrollment and First-professionalenrollment.
1Postsecondary education—Theprovision of formal instructional programswith a curriculum designed primarily forstudents who have completed therequirements for a high school diploma orequivalent. This includes programs of anacademic, vocational, and continuingprofessional education purpose, andexcludes avocational and adult basiceducation programs.
1Racial/ethnic group—Classification indi-cating general racial or ethnic heritagebased on self-identification, as in datacollected by the Bureau of the Census oron observer identification, as in datacollected by the Office for Civil Rights.These categories are in accordance withthe Office of Management and Budgetstandard classification scheme presentedbelow:
White—A person having origins inany of the original peoples of Europe,North Africa, or the Middle East.Normally excludes persons ofHispanic origin except for tabulationsproduced by the Bureau of theCensus, which are noted accordinglyin this volume.
Black—A person having origins in anyof the black racial groups in Africa.Normally excludes persons ofHispanic origin except for tabulationsproduced by the Bureau of theCensus, which are noted accordinglyin this volume.
Hispanic—A person of Mexican,Puerto Rican, Cuban, Central or SouthAmerican, or other Spanish culture ororigin, regardless of race.
Asian or Pacific Islander—A personhaving origins in any of the originalpeoples of the Far East, SoutheastAsia, the Indian subcontinent, or thePacific Islands. This area includes, forexample, China, India, Japan, Korea,the Philippine Islands, and Samoa.
American Indian or AlaskanNative—A person having origins inany of the original peoples of NorthAmerica and maintaining culturalidentification through tribal affiliationor community recognition.
C-9
1Salary—The total amount regularly paidor stipulated to be paid to an individual,before deductions, for personal servicesrendered while on the payroll of abusiness or organization.
1Scholarships and fellowships—Thiscategory of college expenditures appliesonly to money given in the form ofoutright grants and trainee stipends toindividuals enrolled in formal coursework,either for credit or not. Aid to students inthe form of tuition or fee remissions isincluded. College Work-Study funds areexcluded and are reported under theprogram in which the student is working.In the tabulations in this volume, PellGrants are not included in this expenditurecategory.
1Scholastic Aptitude Test (SAT)—Anexamination administered by theEducational Testing Service and used topredict the facility with which an individualwill progress in learning college-levelacademic subjects.
1Science—The body of related coursesconcerned with knowledge of the physicaland biological world and with theprocesses of discovering and validatingthis knowledge.
1Student—An individual for whominstruction is provided in an educationalprogram under the jurisdiction of a school,school system, or other educationinstitution. No distinction is madebetween the term “student” and “pupil,”though “student” may refer to onereceiving instruction at any level while“pupil” refers only to one attending schoolat the elementary or secondary level. Astudent may receive instruction in a schoolfacility or in another location, such as athome or in a hospital. Instruction may beprovided by direct student-teacher
interaction or by some other approvedmedium such as television, radio,telephone, and correspondence.
1Tuition and fees—A payment or chargefor instruction or compensation forservices, privileges, or the use ofequipment, books, or other goods.
1U.S. Service Schools—These institutionsof higher education are controlled by theU.S. Department of Defense and the U.S.Department of Transportation. The teninstitutions counted in the NCES surveys ofhigher education institutions include: theAir Force Institute of Technology,Community College of the Air Force, NavalPostgraduate School, Uniformed ServicesUniversity of the Health Sciences, U.S. AirForce Academy, U.S. Army Command AndGeneral Staff College, U.S. Coast GuardAcademy, U.S. Merchant Marine Academy,U.S. Military Academy, and the U.S. NavalAcademy.
1University—An institution of highereducation consisting of a liberal artscollege, a diverse graduate program, andusually two or more professional schoolsor faculties and empowered to conferdegrees in various fields of study. Forpurposes of maintaining trend data in thispublication, the selection of universityinstitutions has not been revised since1982.
1Visual and performing arts—A group ofinstructional programs that generallydescribes the historic development,aesthetic qualities, and creative processesof the visual and performing arts.
1U.S. Department of Education, National Center for Education Statistics, Digest of Education Statistics: 1996, pp. 497-510, 1996.

C-10

D-1
Appendix D
Works Cited
D-3
Works Cited
American Indian Higher Education Consortium (AIHEC). (1995). Tribal Colleges.Informational handout. Alexandria, Virginia: AIHEC.
American Indian Higher Education Consortium (AIHEC). (1995, April 5). Testimony to theHouse Subcommittee on Veterans' Affairs, Housing and Urban Development, and IndependentAgencies Appropriations. Washington, DC: U.S. House of Representatives.
American Indian Higher Education Consortium (AIHEC). (1995, May 31). Testimony to theSenate Agricultural, Rural Development, and Related Agencies Appropriations Subcommittee.Washington, DC: U. S. Senate.
American Indian Higher Education Consortium (AIHEC). (1995). Tribal Colleges andUniversities Fact Sheet. Alexandria, VA: AIHEC.
American Indian Higher Education Consortium (AIHEC). (1996). Tribal Colleges: Enrollmentand Funding History. Alexandria, VA: AIHEC.
American Indian Higher Education Consortium (AIHEC). (June, 1997). AIHEC Tribal CollegesUpdated. Alexandria, VA: AIHEC.
Bay Mills Community College. (1994). 1994-1996 Catalog. Bay Mills, Michigan.
Bennett, C.I. (1995). Research on Racial Issues in American Higher Education. ERIC, ED 382 733.
Boyer, P. (1989). Tribal Colleges. The Carnegie Foundation. Princeton, NJ: PrincetonUniversity Press.
Butler, M.E. (1995-96). Tribally Controlled Colleges Can Start a Technical Career. DiversityCareers. Vol. III, No. 7 (Winter/Spring). Springfield, NJ: Renaud Communication, Inc.
Carnegie Foundation for the Advancement of Teaching. (1989). Tribal Colleges: Shaping theFuture of Native America. Princeton, NJ: Princeton University Press.
Carter, D.J., and Wilson, R. (1995). Minorities in Higher Education. 1994 Thirteenth AnnualStatus Report. Washington, DC: American Council on Education.
Carter, D., and O’Brien, E. (1993). Employment and Hiring Patterns for Faculty of Color.Research Briefs, Vol. 4, No. 6. Washington, DC: American Council on Education.
Chronicle of Higher Education. (1993). Almanac Issue. August 25.
Chronicle of Higher Education. (1994). Almanac Issue. September 1.
Chronicle of Higher Education. (1995). Almanac Issue. September 1.
D-4
Deloria, V., Jr. (1985). American Indian Policy in the Twentieth Century. Norman, OK:University of Oklahoma Press.
Deloria, V., Jr., and Lytle, C.M. (1983). American Indians, American Justice. Austin, TX:University of Texas Press.
Duran, C. (1991). The Role of Libraries on American Indian Tribal College Development.College and Research Libraries 52(5), 395-406.
Fries, J. (1987). The American Indian in Higher Education: 1975-76 to 1984-85. (U.S.Department of Education, National Center for Education Statistics). Washington, DC: U.S.Government Printing Office.
Houser, S. (1992). Underfunded Miracles; Tribal Colleges. Paper No. 8. Washington, DC: U.S.Department of Education, Indian Nations at Risk Task Force.
Indian Nations At Risk Task Force. (1990). Indian Nations At Risk, Summary of Issues andRecommendations from Regional Hearings. Journal of American Indian Education 30(2), 1-15.
National Advisory Council on Indian Education. (1992). Indian Education: A FederalEntitlement, 19th Annual Report to Congress. Fiscal Year 1992 Annual Report. Washington, DC:Author.
National Collegiate Athletic Association (NCAA). (1995). 1995 NCAA Division I GraduationRates Report. Overland Park, KS: NCAA.
National Collegiate Athletic Association (NCAA). (1994). 1995 NCAA Division II and Division IIIEnrollment and Persistence Rates Report. Overland Park, KS: NCAA.
National Collegiate Athletic Association (NCAA). (1995). 1995 NCAA Division II and Division IIIEnrollment and Persistence Rates Report. Overland Park, KS: NCAA.
National Collegiate Athletic Association (NCAA). (1996). 1996 NCAA Division I GraduationRates Report. Overland Park, KS: NCAA.
National Research Council. (1994). Summary Report 1994: Doctorate Recipients from UnitedStates Universities: Summary Report 1994. Washington, DC: National Academy Press.
Native Education Initiative of the Regional Educational Labs. (1995). Promising Programs inNative Education. ERIC, ED 385 420.
Oppelt, N.T. (1990). The Tribally Controlled Indian College. The Beginning of Self Determinationin American Indian Education. Tsaile, AZ: Navajo Community College Press. ERIC, ED 356108.
Palumbo, D.J. (1994). Public Policy in America. Orlando, FL: Harcourt Brace & Company.
D-5
Pavel D.M., Sanchez, T., Pueble, F., and Machamer, A. (1994). Ethnic Fraud, NativePeoples, and Higher Education, Thought and Action: The NEA Journal of Higher Education 10(1),91-100.
Ramirez-Shkweqnaabi, B. (1987). Roles of Tribally Controlled Community College Trustees:A Comparison of Trustees' and Presidents' Perceptions of Trustees' Role. Unpublisheddissertation. Madison, WI: University of Wisconsin-Madison.
Richardson, R.C., Jr., and Skinner, E.F. (1990). Adapting to Diversity: OrganizationalInfluences on Student Achievement. Journal of Higher Education 61(5), 485-511.
Richardson, R.C., Jr., and Skinner, E.F. (1990). Achieving Quality and Diversity: Universities in aMulticultural Society. New York: Macmillan.
Shom, C.L. (1991). Minority Access to Higher Education: The Precollegiate Response toMinority Economic and Social Enhancement. Journal of College Admission, 132, 16-20.
Stein, W.J. (1995). The Survival of American Indian Faculty. Thought and Action: The NEAJournal of Higher Education, p. 101.
Stein, W. J. (1992). Tribally Controlled Colleges: Making Good Medicine. American IndianStudies, Volume 3.
Stein, W.J. (1991). Interview with A. Three Irons concerning first generation American Indianstudents in TCCs. Bozeman, MT, Dec. 5.
Stein, W.J. (1986). Interview with G. Gorman concerning Navajo Community College. Reno,NV, Nov. 23.
Stein, W.J. (1986). Interview with D. Risling concerning D-Q University. Reno, NV: Nov. 23.
Tiger, G. (March 1995). Testimony to Ralph Regula, Chairman of the Subcommittee onAppropriations for Interior and Related Agencies. Washington, DC: U.S. House ofRepresentatives.
U.S. Department of Commerce, Bureau of the Census. (1995). Statistical Abstract of the UnitedStates: 1995. 115th ed. Washington, DC: U.S. Government Printing Office.
U.S. Department of Commerce, Bureau of the Census. (1994). Characteristics of AmericanIndians by Tribe and Language . Washington, DC: U.S. Government Printing Office.
U.S. Department of Commerce, Bureau of the Census. (1994). Educational Attainment in theUnited States, March 1993 and 1992. Washington, DC: U.S. Government Printing Office.
U.S. Department of Commerce, Bureau of the Census. (1994). Statistical Abstract of the UnitedStates: 1994. 114th ed. Washington, DC: U.S. Government Printing Office.
D-6
U.S. Department of Commerce, Bureau of the Census. (1993). We, the First Americans.Washington, DC: U.S. Government Printing Office.
U.S. Department of Commerce, Bureau of the Census. (1992). General PopulationCharacteristics: United States Summary. Washington, DC: U.S. Government Printing Office.
U.S. Department of Commerce, Bureau of the Census. (1990). General PopulationCharacteristics: United States. Washington, DC: U.S. Government Printing Office.
U.S. Department of Commerce, Bureau of the Census. (1990). Education in the United States.Washington, DC: U.S. Government Printing Office.
U.S. Department of Commerce, Bureau of the Census. (1983). General Social and EconomicCharacteristics. Washington, DC: U.S. Government Printing Office.
U.S. Department of Commerce, Bureau of the Census. (1982). General PopulationCharacteristics: United States Summary. Washington, DC: U.S. Government Printing Office.
U.S. Department of Education, National Center for Education Statistics. (Various Years).Digest of Education Statistics. Washington, DC: U.S. Government Printing Office.
U.S. Department of Education, National Center for Education Statistics. (Various Years). TheCondition of Education. Washington, DC: U.S. Government Printing Office.
U.S. Department of Education, National Center for Education Statistics. (1997). Characteristicsof American Indian and Alaska Native Education: Results from the 1990-91 and 1993-94 Schoolsand Staffing Surveys. Washington, DC: U.S. Government Printing Office.
U.S. Department of Education, National Center for Education Statistics. (1996). A DescriptiveSummary of 1992-93 Bachelor’s Degree Recipients 1 Year Later. Washington, DC: U.S.Government Printing Office.
U.S. Department of Education, National Center for Education Statistics. (1996). A DescriptiveSummary of 1989-90 Beginning Postsecondary Students: 5 Years Later. Statistical Analysis Report.Washington, DC: U.S. Government Printing Office.
U.S. Department of Education, National Center for Education Statistics. (1996). Degrees andOther Awards Conferred by Institutions of Higher Education: 1993-94. E.D. TABS. Washington,DC: Government Printing Office.
U.S. Department of Education, National Center for Education Statistics. (1996). Enrollment inHigher Education: Fall 1986 Through Fall 1994. E.D. TABS. Washington, DC: U.S. GovernmentPrinting Office.
U.S. Department of Education, National Center for Education Statistics. (1996). Fall Staff inPostsecondary Institutions, 1993. Washington, DC: U.S. Government Printing Office.
D-7
U.S. Department of Education, National Center for Education Statistics. (1995-96). IntegratedPostsecondary Education Data System (IPEDS). “Salary” survey. Unpublished data.
U.S. Department of Education, National Center for Education Statistics. (1995). Characteristicsof American Indian and Alaska Native Education: Results from the 1990-91 Schools and StaffingSurvey. Washington, DC: U.S. Government Printing Office.
U.S. Department of Education, National Center for Education Statistics. (1995). IntegratedPostsecondary Education Data System (IPEDS). “Institutional Characteristics” survey.Unpublished data.
U.S. Department of Education, National Center for Education Statistics. (1995). Making theCut: Who Meets Highly Selective College Entrance Criteria? Statistics in Brief. Washington, DC:U.S. Government Printing Office.
U.S. Department of Education, National Center for Education Statistics. (1995). Profile ofUndergraduates in U.S. Postsecondary Education Institutions: 1992-93. Statistical Analysis Report.Washington, DC: U.S. Government Printing Office.
U.S. Department of Education, National Center for Education Statistics. (1995). StudentFinancing of Undergraduate Education, 1992-93. Statistical Analysis Report. Washington, DC:U.S. Government Printing Office.
U.S. Department of Education, National Center for Education Statistics. (1994-95). IntegratedPostsecondary Education Data System (IPEDS). “Completions” survey. Unpublished data.
U.S. Department of Education, National Center for Education Statistics. (1994). Faculty andInstructional Staff: Who Are They and What Do They Do? Survey Report. Washington, DC: U.S.Government Printing Office.
U.S. Department of Education, National Center for Education Statistics. (1994). IntegratedPostsecondary Education Data System (IPEDS). “Fall Enrollment” survey. Unpublished data.
U.S. Department of Education, National Center for Education Statistics. (1994). Trends inEnrollment in Higher Education by Racial/Ethnic Category: Fall 1982 Through Fall 1992. E.D. TABS.Washington, DC: U.S. Government Printing Office.
U.S. Department of Education, National Center for Education Statistics. (1993). IntegratedPostsecondary Education Data System (IPEDS). “Fall Staff” survey. Unpublished data.
U.S. Department of Education, National Center for Education Statistics. (1993). NationalSurvey of Postsecondary Faculty, 1993 (NSOPF). Unpublished data.
U.S. Department of Education, National Center for Education Statistics. (1992). NCESStatistical Standards. Washington, DC: U.S. Government Printing Office.
U.S. Department of Education, Indian Nations At Risk Task Force. (1991). Indian Nations atRisk: An Educational Strategy for Action. Washington, DC: U.S. Government Printing Office.
D-8
U.S. Department of Education, National Center for Education Statistics. (1991). Projections ofEducation Statistics to 2002. Washington, DC: U.S. Government Printing Office.
U.S. Department of Education, National Center for Education Statistics. (1990). DegreesConferred by Institutions of Higher Education, by Race/Ethnicity and Sex: 1976-77 through 1986-87.Survey Report. Washington, DC: Government Printing Office.
U.S. Department of Labor, Bureau of Labor Statistics. (1995). A Test of Methods for CollectingRacial and Ethnic Information. Washington, DC: Author.
U.S. Equal Employment Opportunity Commission. (Various Years). EEO-6 Higher EducationStaff Information Surveys. Unpublished data.
Wright, B. (1991). American Indian and Alaska Native Higher Education: Toward a New Centuryof Academic Achievement and Cultural Integrity. ERIC, ED343771. Washington, DC: U.S.Department of Education, Indian Nations At Risk Task Force.
Wright, B., and Tierney, W. (1991). American Indians in Higher Education: A History ofCultural Conflict. Winds of Change (March/April): 11-18.
E-1
Appendix E
Additional Sources
E-3
Additional Sources
American Council on Education, Department of Membership. (1994). UnpublishedTabulations.
American Council on Education, Office of Minorities in Higher Education. (1992). Environments of Support. Washington, DC: Author.
American Indian Higher Education Consortium (AIHEC). (June 1997). AIHEC Tribal CollegesUpdated. Alexandria , VA: AIHEC.
American Indian Higher Education Consortium (AIHEC). (1997). Tribal College Locations. Available online at nikkan.fdl.cc.mn.US/aihec.
American Indian Higher Education Consortium (AIHEC). (November 1996). BIA & AIHECLittle Priest Tribal College Site Visit. Alexandria , VA: AIHEC.
American Indian Higher Education Consortium (AIHEC). (1995, April 5). Testimony to theHouse Subcommittee on Veterans’ Affairs, Housing and Urban Development, andIndependent Agencies Appropriations. Washington, DC: U.S. House of Representatives.
American Indian Higher Education Consortium (AIHEC). (1995, May 31). Testimony to theSenate Agricultural, Rural Development, and Related Agencies Appropriations Subcommittee.Washington, DC: U.S. Senate.
American Indian Higher Education Consortium (AIHEC). (1995). Tribal Colleges andUniversities Fact Sheet. Alexandria, VA: AIHEC.
American Indian Higher Education Consortium (AIHEC). (1994, March 8). Testimony to theAppropriations Subcommittee on Interior. Washington, DC: U.S. House of Representatives.
American Indian Higher Education Consortium (AIHEC). (1983). Testimony to AppropriationsCommittee. Washington, DC: U.S. House of Representatives.
Annual College Guide for American Indians for 1994-95. (1994). Winds of Change. Boulder,CO: AISES Publishing, Inc.
Barbett, S.F., et al. (1995). Enrollment in Higher Education: Fall 1984 Through Fall 1993. E.D.TABS. (U.S. Department of Education, National Center for Education Statistics). Washington,DC: U.S. Government Printing Office.
Benjamin, D., Chambers, S., and Reiterman, G. (1993). A Focus on American Indian CollegePersistence. Journal of American Indian Education 32(2): 24-40.
Borden, V.M.H. (1993). Procedures and Analysis for Top 100 Degree Producer Rankings. Black Issues in Higher Education (May 20): 60-102.
Boudreaux, E. (1979). Indian Career Education: The Choctaw Experience. Bureau of IndianAffairs Research Bulletin 7, 2.
E-4
Bryde, J. (1971). Indian Students and Guidance. Guidance Monograph Series. Boston, MA: Houghton Mifflin Co.
Butler, M. E. (1995-96). Tribally Controlled Colleges Can Start a Technical Career. DiversityCareers. Vol. III, No. 7 (Winter/Spring). Publication for Technical Workforce Diversity. Springfield, NJ: Renaud Communication, Inc.
Byce, C., and Schmitt, C.M. (1992). Students at Less-Than-4-Year Institutions. Statistical AnalysisReport. (U.S. Department of Education, National Center for Education Statistics). Washington, DC: U.S. Government Printing Office.
Byce, C., Khazzoom, A., and Schmitt, C. (1993). Changes in Undergraduate Student FinancialAid: Fall 1986 to Fall 1989. Statistical Analysis Report. (U.S. Department of Education,National Center for Education Statistics). Washington, DC: U.S. Government Printing Office.
Cage, M.C. (1993). Graduation Rates of American Indians and Blacks Improve, Lag BehindOthers': NCAA Report Shows 54 Percent of 1985-86 Freshmen Graduated Within Six Years. Chronicle of Higher Education (May 26): A29.
Cahalan, M., et al. (1993). Occupational and Educational Outcomes of Recent College Graduates1 Year After Graduation: 1991. A Statistical Analysis Report. (U.S. Department of Education,National Center for Education Statistics.) Washington, DC: U.S. Government Printing Office.
Callahan, C.M., and McIntire, J.A. (1994). Identifying Outstanding Talent in American Indian andAlaska Native Students. Washington, DC: U.S. Government Printing Office.
Carnegie Foundation for the Advancement of Teaching. (1989). Tribal Colleges Shaping theFuture of Native Americans. Princeton, NJ: Author.
Carpenter, J. (1989). Completions in Institutions of Higher Education, 1986-87. E.D. TABS. (U.S.Department of Education, National Center for Education Statistics). Washington, DC: U.S.Government Printing Office.
Carter, D.J. (1991). Racial and Ethnic Trends in College Participation: 1976 to 1988. Research Briefs, Vol. 1, No. 3. Washington, DC: American Council on Education.
Carter, D.J., and Wilson, R. (1994). Minorities in Higher Education. 1993 Twelfth Annual StatusReport. Washington, DC: American Council on Education.
Carter, D.J., and Wilson, R. (1992). Minorities in Higher Education. 1991 Tenth Annual StatusReport. Washington, DC: American Council on Education.
Charleston, G., and King, G. (1991). Forward. In P. Cahape and C.B. Howley (Eds.). IndianNations At Risk Task Force: Listen to The People. Summaries of papers commissioned by theIndian Nations At Risk Task Force of the U.S. Department of Education. Charleston, WV: ERICClearinghouse on Rural Education and Small Schools.
Chavers, D. (1991). The Indian Dropout: An Annotated Bibliography, June 1991. Albuquerque,NM: Coalition for Indian Education.
E-5
Choy, S.P., and Maw, C. (1994). Characteristics of Students Who Borrow to Finance TheirPostsecondary Education. Statistical Analysis Report. (U.S. Department of Education, NationalCenter for Education Statistics). Washington DC: U.S. Government Printing Office.
Choy, S.P., Henke, R.R., and Schmitt, C.M. (1992). Parental Financial Support for UndergraduateEducation. E.D. TABS. (U.S. Department of Education, National Center for Education Statistics). Washington, DC: U.S. Government Printing Office.
Choy, S.P., Kagehiro, S.A., and Schmitt, C. (1993). Student Financing of Graduate and First-Professional Education. Statistical Analysis Report. (U.S. Department of Education, NationalCenter for Education Statistics). Washington, DC: U.S. Government Printing Office.
Cibik, M., and Chambers, S. (1991). Similarities and Differences Among Native Americans,Hispanics, Blacks and Anglos. NASPA Journal 28(2), 129-139.
College Enrollment by Racial and Ethnic Group. (1992). Chronicle of Higher Education
Colorado Commission on Higher Education. (1992). Status of Diversity in Colorado PublicHigher Education, 1986-1990. ERIC, ED351938.
Colorado Commission on Higher Education. (1992). What Must Postsecondary EducationProvide to Meet Individual Student Expectations? Colorado Commission on Higher EducationMaster Plan Background Paper. ERIC, ED351933.
Costo, R., and Henry, J. (1977). Indian Treaties: Two Centuries of Dishonor. San Francisco: TheIndian Historical Press.
Crase, D., and Hamrick, M. (1992). Distribution of Minority Doctorates in Physical Education. Physical Educator 49(4), 174-179.
Cross, W.T. (1991). Pathways to the Professorate: The American Indian Faculty Pipeline. Journal of American Indian Education (January): 13-24.
Davis, J. (1992). Factors Contributing to Post Secondary Achievement of American Indians. Tribal College (Fall): 24-30.
Development Associates, Inc. (1983). National Impact Evaluation of Title IV, Part A. Arlington,VA: Author.
Dey, E.L., et al. (1992). The American Freshman: National Norms for Fall 1992. Los Angeles,CA: Higher Education Research Institute, UCLA.
Duran, C. (1991). The Role of Libraries in American Indian Tribal College Development. College and Research Libraries. (September): 395.
Edwards, E.D., and Egbert-Edwards, M. (1990). An Effective American Indian Social WorkProgram: Recruitment, Retention and Graduation. Minorities in Higher Education. Selectedpapers from an interdisciplinary conference, March 9-11, 1989, Hofstra University,Hempstead, NY, ERIC, ED 341 741.
E-6
Evangelauf, J. (1992). Minority-Group Enrollment at Colleges Rose 10% From 1988 to 1990,Reaching Record Levels: Black Students Showed Largest Two-Year Gain Since 1980, toReach High of 1.2 Million, U.S. Reports. Chronicle of Higher Education (January 22): A33.
Fitzgerald, R., et al. (1994). Descriptive Summary of 1989-90 Beginning Postsecondary Students:Two Years Later. Statistical Analysis Report. (U.S. Department of Education, National Centerfor Education Statistics). Washington, DC: U.S. Government Printing Office.
Fonseca, J.W., and Andrews, A.C. (1993). The Atlas of American Higher Education. New York:New York University Press.
Forbes, J. (1973), Teaching Native American Values and Cultures. in J. Banks (Ed.). TeachingEthnic Studies: Concepts and Strategies. Washington, DC: National Council for the SocialStudies.
Fretas, D.L.I. (1992). Managing Smallness. Promising Fiscal Practices for Rural School DistrictAdministrators. Appalachian Educational Laboratory. Charleston, WV: ERIC Clearinghouseon Rural Education and Small Schools.
Freund, W.H. (1991). Race/Ethnicity Trends in Degrees Conferred by Institutions of HigherEducation: 1978-79 through 1988-89. E.D.TABS. (U.S. Department of Education, NationalCenter for Education Statistics). Available online at www.ed.gov/NCES.
Fuchs, E., and Havinghurst, R.J. (1972). To Live on This Earth: American Indian Education. Albuquerque: University of New Mexico Press.
Gade, E., Hurlburt, G., and McLaughlin, G. (1990). Teaching Attitudes and Study Attitudes ofAmerican Indians. Journal of American Students (May): 12-18.
Gajar, A. (1988). American Indian Personnel Preparation in Special Education: Needs,Program Components, Programs. Journal for American Indian Education 24(2), 7-15.
Gordon, H., and Brown, P.Q. (1990). Degrees Conferred by Institutions of Higher Education, byRace/Ethnicity and Sex: 1976-77 through 1986-87. Survey Report. (U.S. Department ofEducation, National Center for Education Statistics). Washington, DC: U.S. GovernmentPrinting Office.
Gose, B. (1995). Growth of Minority Enrollment Slowed to 2.6% in 1993. Chronicle of HigherEducation (March 17): A34.
Haskin, B. (Indian Education Specialist, Office of Education Programs, Bureau of IndianAffairs, U.S. Department of the Interior). Personal Communication, January 1995.
Henderson, J. (1991). Minority Student Retention. New Directions for Community Colleges, 47-55.
Hillabrant, W., et al. (1991). Native American Education at a Turning Point: CurrentDemographics and Trends. ERIC, ED343756.
Hodgkinson, H.L. (1992). The Current Condition of Native Americans. ERIC Digest.Charleston, WV: ERIC Clearinghouse on Rural Education and Small Schools.
E-7
Hodgkinson, H.L., Outtz, J.H., and Obarakpor, A.M. (1990). The Demographics of AmericanIndians: One Percent of the People; Fifty Percent of the Diversity. Washington, DC: Institute forEducation Leadership, Inc., Center for Demographic Policy.
Hoover, J., and Jacobs, C. (1992). A Survey of American Indian College Students:Perceptions Toward Their Study Skills/College Life. Journal of American Indian Education,(October): 21-29.
Horn, L., and Maw, C. (1994). Undergraduates Who Work While Enrolled in PostsecondaryEducation: 1989-90. Statistical Analysis Report. (U.S. Department of Education, NationalCenter for Education Statistics). Washington, DC: U.S. Government Printing Office.
Horn, L., and Maw, C. (1995). Minority Undergraduate Participation in Postsecondary Education. Statistical Analysis Report. (U.S. Department of Education, National Center for EducationStatistics). Washington, DC: U.S. Government Printing Office.
Horn, L.J., and Premo, M.D. (1995). Profile of Undergraduates in U.S. Postsecondary EducationInstitutions: 1992-93. Statistical Analysis Report. U.S. Department of Education, NationalCenter for Education Statistics). Washington, DC: U.S. Government Printing Office.
Hornett, D. (1989). The Role of Faculty in Cultural Awareness and Retention of AmericanIndian Colleges. Journal of American Indian Education (October): 12.
Houser, S. (1992). Underfunded Miracles: Tribal Colleges. [Summary by M.W. Burnside.] InP. Cahape and C.B. Howley (Eds.). Indian Nations At Risk: Listen to The People. Summaries ofpapers commissioned by the Indian Nations At Risk Task Force of the U.S. Department ofEducation. Charleston, WV: ERIC Clearinghouse on Rural Education and Small Schools.
Huffman, T. (1986). The Experiences, Perceptions, and Consequences of Campus RacismAmong Northern Plains Indians. Journal of American Indian Education 30(2), 25-34.
Hurlburt, G., Gade, E., and McLaughlin, G. (1990). Teaching Attitudes and Study Attitudes ofIndian Education Students. Journal of American Indian Education (May): 12-18.
Hussar, W.J., and Gerald, D.E. (1991). Projections of Education Statistics to 2002. (U.S.Department of Education, National Center for Education Statistics). Washington, DC: U.S.Government Printing Office.
Indian Nations At Risk Task Force, National Advisory Council on Indian Education. (1990).Postsecondary Education. INAR/NACIE Joint Issues Sessions. National Indian EducationAssociation (NIEA) Annual Conference. Washington, DC: U.S. Department of Education.
Indian Nations At Risk Task Force. (1991). Indian Nations at Risk: Listen to the People.Washington, DC: U.S. Government Printing Office.
James, P. (1992). Native Americans and Higher Education. College Student Affairs Journal12(1), 56-62.
Johnson, M.J. (1991). American Indians and Alaskan Natives With Disabilities. ERIC, ED341524.
Johnson, M.J., and Ramirez, B.A. (1987). American Indian Exceptional Children and Youth. ERIC Exceptional Child Education Report. Reston, VA: Council for Exceptional Children.
E-8
Kopka, T.L.C. (1992). Characteristics of Doctorate Recipients: 1979, 1984, and 1989. E.D. TABS. (U.S. Department of Education, National Center for Education Statistics). Washington, DC:U.S. Government Printing Office.
Layton, J., et al. (1990). The Recruitment and Retention of Minority Trainees in UniversityAffiliated Programs. Native American Indians. ERIC, ED328032.
Lee, C. (1991). Achieving Diversity. Issues in the Recruitment and Retention of Underrepresentedand Racial/Ethnic Students in Higher Education: A Review of the Literature. ERIC, ED338941.
Lomomwaima, K.T. (1987). They Called It Prairie Light. Oral Histories from Chilocco IndianAgricultural Boarding School 1920-1940. Unpublished Ph.D. diss., Department ofAnthropology, Stanford University.
Marfin, J. (1991). Tuition Waivers for Hawaiian Students in Higher Education. Report no. 2. ERIC, ED349926.
Meriam, L. (1928). The Problem of Indian Administration. Baltimore, MD: The John HopkinsPress.
Metoyer-Duran, C. The Tribal Community College Libraries: Perceptions of the CollegePresidents. The Journal of Academic Librarianship 17(6), 364-369.
Mingle, J.R., and Rodriguez, E.M. (1990). Building Coalitions For Minority Success. A Report ofthe SHEEO Project on Minority Achievement in Higher Education. Denver, CO: State HigherEducation Executive Officers.
Minority Post Secondary Enrollment Data. (1930). Chronicle of Higher Education, April 11.
Mooney, C.J. (1990). Universities Awarded Record Number of Doctorates Last Year; ForeignStudents Thought to Account for Much of the Increase. Chronicle of Higher Education 36(32),A1.
Morgan, F. (1992). Racial/Ethnic Trends in Degrees Conferred by Institutions of Higher Education:1980-81 through 1989-90. ELECTRONIC E.D.TABS. (U.S. Department of Education, NationalCenter for Education Statistics.) Available online at www.ed.gov/NCES.
Morgan, F. (1993). Trends in Degrees Conferred by Institutions of Higher Education: 1984-85Through 1990-91. E.D.TABS. (U.S. Department of Education, National Center for EducationStatistics). Washington, DC: U.S. Government Printing Office.
Morgan, F.B., and Broyles, S.B. (1995). Degrees and Other Awards Conferred by Institutions ofHigher Education: 1992-93. E.D.TABS. (U.S. Department of Education, National Center forEducation Statistics). Washington, DC: U.S. Government Printing Office.
Mortenson Research Letter on Public Policy Analysis of Opportunity for Postsecondary Education. July 1995, No. 37. Iowa City, IA.
Murguia, E., Padilla, R., and Pavel, M. (1991). Ethnicity and the Concept of Social Integrationin Tinto's Model of Institutional Departure. Journal of College Student Development(September): 433-439.
E-9
National Advisory Council on Indian Education. (1994). Keeping Forgotten Promises: 20thAnnual Report to Congress, Fiscal Year 1993. Washington, DC: Author.
National Advisory Council on Indian Education. (1991). Indian Education: WhoseResponsibility? 18th Annual Report to Congress, Fiscal Year 1991. Washington, DC: Author.
National Advisory Council on Indian Education. (1990). Toward the Year 2000: Listening to theVoice of Native America: 17th Annual Report to the United States Congress, Fiscal Year 1990. Washington, DC: Author.
National Advisory Council on Indian Education. (1990). Post Secondary Education. INAR/NACIE Joint Issues Sessions. Paper presented at the 22nd National Indian EducationAssociation (NIEA) Annual Conference, October 16, 1990, San Diego, CA. ERIC, ED341534.
National Association for the Advancement of Colored People. (1971). An Even Chance. NewYork: NAACP Legal Defense and Educational Fund, Inc.
National Association of State Universities and Land-Grant Colleges. Tribal Colleges WinLand-Grant Status. NASULGC Newsline 3,10:1,6.
National Science Foundation. (1993). Academic Science and Engineering: Graduate Enrollmentand Support, Fall 1991. NSF 93-309. Washington, DC: Author.
National Science Foundation. (1993). Selected Data on Science and Engineering DoctorateAwards: 1993. NSF 94-318. Arlington, VA: Author.
National Science Foundation. (1994). Federal Support to Universities, Colleges, and NonprofitInstitutions: Fiscal Year 1992. Detailed Statistical Tables. NSF 94-329. Arlington, VA: Author.
National Science Foundation. (1995). Data Brief (12): September 12.
New York State Education Department. (1991). College and University Racial/Ethnic Distributionof Enrollment: New York State. Albany: Office of Post Secondary Policy Analysis. ERIC,ED362092.
New York State Education Department. (1991). Higher Education Opportunity Program AnnualReport: 1990-91. Albany: Bureau of Higher Education Opportunity Programs.
New York State Education Department. (1992). A Comprehensive Look at College Students inNew York State for Academic Year 1990-91. Second Annual Report. Albany: Native AmericanIndian Education Unit. ERIC, ED355081.
1990 Enrollment by Race at 3,000 Institutions of Higher Education. (1992). Chronicle ofHigher Education (March 18): A36-A44.
1991 Enrollment by Race at 3,100 Institutions of Higher Education. (1993). Chronicle ofHigher Education (March 3): A31-A39.
1992 Enrollment by Race at 3,000 Institutions of Higher Education. (1994). Chronicle ofHigher Education (February 23): A31-A40.
E-10
O'Brien, E.M. (1992). American Indians in Higher Education. Washington, DC: AmericanCouncil on Education, Division of Policy Analysis and Research.
O'Brien, E.M. (1990). The Demise of Native American Education. Three-part series. BlackIssues in Higher Education: March 15, March 29, and April 12.
Oklahoma State Regents for Higher Education. (1990). A Background Report: The Distributionof Native Americans in the Oklahoma State System of Higher Education by Institution and by Tribe. Oklahoma City: Author.
Ottinger, C. (1991). College Going, Persistence, and Completion Patterns in Higher Education: What Do We Know? Research Brief. Washington, DC: American Council on Education,Division of Policy Analysis and Research.
Owings, J., McMillen, M., and Burkett, J. (1995). Making the Cut Who Meets Highly SelectiveCollege Entrance Criteria? Statistics in Brief. Washington, DC: U.S. Department of Education,National Center for Education Statistics.
Paisano, E.L., et al. (1993). We, the First Americans. (U.S. Department of Commerce, Bureau ofthe Census). Washington, DC: U.S. Government Printing Office.
Pavel, D., M., and Curtin T.R. (1997). Characteristics of American Indian and Alaska NativeEducation: Results from the 1990-91 and 1993-94 Schools and Staffing Surveys. (U.S. Departmentof Education, National Center for Education Statistics). Washington, DC: U.S. GovernmentPrinting Office.
Pavel, D.M., Curtin, T.R., Christenson, B., and Rudes, B. (1995). Characteristics of AmericanIndian and Alaska Native Education: Results from the 1990-91 Schools and Staffing Survey. (U.S.Department of Education, National Center for Education Statistics). Washington, DC: U.S.Government Printing Office.
Pavel, D., and Padilla, R. (1993). American Indian and Alaska Native PostsecondaryDeparture: An Example of Assessing a Mainstream Model Using National Longitudinal Data. Journal of American Indian Education (January): 1-23.
Pavel, D.M., and Astin, H.S. (Research in Progress). Racially and Ethnically Diverse Faculty:National Norms of College Teachers (1989-90). Los Angeles: University of California, LosAngeles, Higher Education Research Institute.
Pavel, D.M., and Dey, E. (Research in Progress). American Indians and Alaska Natives inHigher Education: Implications of Racial Ethnic Identity in the College Application Process. Pullman: Washington State University.
Pelavin Associates, Inc. (1991). Study of the Indian Education Fellowship Program. Final Report.Washington, DC: Author. ERIC, ED355083.
Pevar, S.L. (1992). The Rights of Indians and Tribes. The Basic ACLU Guide to Indian and TribalRights. 2nd ed. Carbondale and Edwardsville, IL: Southern Illinois University Press.
Professional Programs in Higher Education. Journal of American Indian Education (Fall): 21-31.
E-11
Redd, K.E. (1992). Trends in Minority College Graduates and College Educational Attainment inPennsylvania, 1980 to 1989. Harrisburg: Pennsylvania Higher Education Assistance Agency. ERIC, ED351974.
Richardson, R.C., Jr., and Pavel, D.M. (1992). Better Measures of Equity in MinorityParticipation and Enrollment. In M. Ludwig. (Ed). A Challenge of Change Public Four-YearEnrollment Lessons from the 1980s for the 1990s. Washington, DC: American Association ofState Colleges and Universities and Land-Grant Colleges.
Richardson, R.C., Jr. (1991). Promoting Fair College Outcomes: Learning from the Experience ofthe Past Decade. ERIC, ED329179.
Ries, P., and Thurgood, D.H. (1993). Summary Report 1991: Doctorate Recipients From UnitedStates Universities. Washington, DC: National Academy Press.
Ries, P., and Thurgood, D.H. (1993). Summary Report 1992: Doctorate Recipients From UnitedStates Universities. Washington, DC: National Academy Press.
Ruppert, S.S. (1994). Charting Higher Education Accountability. State Education Leader, 13(2)Insert.
Russell, S.H., et al. (1990). Faculty in Higher Education Institutions: 1988. Survey Report. (U.S.Department of Education, National Center for Education Statistics). Washington, DC: U.S.Government Printing Office.
Russell, S.H., et al. (1991). Profiles of Faculty in Higher Education Institutions, 1988. StatisticalAnalysis Report. (U.S. Department of Education, National Center for Education Statistics). Washington, DC: U.S. Government Printing Office.
Sasz, M.C. (1974, 1977). Education and the American Indian: The Road to Self-DeterminationSince 1972. Albuquerque: University of New Mexico Press.
Schantz, N.B. (1992). Trends in Racial/Ethnic Enrollment in Higher Education: Fall 1980 ThroughFall 1990. ELECTRONIC E.D.TABS. (U.S. Department of Education, National Center forEducation Statistics). Available online at www.ed.gov/NCES.
Schantz, N.B., and Brown, P.Q. (1990). Trends in Racial/Ethnic Enrollment in Higher Education:Fall 1978 Through Fall 1988. Survey Report. (U.S. Department of Education, National Centerfor Education Statistics). Washington DC: U.S. Government Printing Office.
Schmitt, C.M. (1994). Trends in Enrollment in Higher Education by Racial/Ethnic Category: Fall1982 Through Fall 1992. E.D. TABS. (U.S. Department of Education, National Center forEducation Statistics). Washington, DC: U.S. Government Printing Office.
Schmitt, C.M., and Pluta, M.J. (1993). Trends in Enrollment in Higher Education by Racial/EthnicCategory: Fall 1982 Through Fall 1991. E.D. TABS. (U.S. Department of Education, NationalCenter for Education Statistics). Washington, DC: U.S. Government Printing Office.
Shea, C. (1994). Women and Minorities Led the Way in a Year of Slow Enrollment Growth. Chronicle of Higher Education (January 26): A32.
E-12
Shepherd, J., and Malizio, A.G. (1991). National Postsecondary Student Aid Study: PreliminaryEstimates on Student Financial Aid Recipients, 1989-90. E.D. TABS. (U.S. Department ofEducation, National Center for Education Statistics). Washington, DC: U.S. GovernmentPrinting Office.
Smith, T.Y. (1992). The Big Eight/Big Ten/SUG Longitudinal Retention Survey: A Report onFindings and Implications. AIR 1992 Annual Forum Paper. ERIC, ED349863.
Spann, J, (1988). Achieving Faculty Diversity. Madison, WI: The University of WisconsinSystem.
St. Pierre, N., and Stein, W.J. (May, 1997). TCCC Brochure. Bozeman, MT.
Stein, W.J. (1992). Tribal Colleges: A Success Story. New Directions for Community Colleges,No. 80, 89-96. San Francisco: Jossey-Bass Publishers.
Stewart, M.A., and Post, P. (1990). Minority Students' Perceptions of Variables Affecting TheirSelection of a Large University. Journal of Multicultural Counseling and Development 18(October): 154-162.
Swisher, K., Pavel, D.M., Concho, C., and Hoisch, M. (1991). BIA Membership Study An Analysisof Dropout and Transfer Rates. Washington, DC: U.S. Department of the Interior, Bureau ofIndian Affairs.
Swisher, K., Hoisch, M., and Pavel, D.M. (1991). American Indian and Alaska Native DropoutStudy 1991. Washington, DC: National Education Association.
Tate, D.S., and Schwartz, C.L. (1993). Increasing the Retention of American Indian Studentsin Professional Programs in Higher Education. Journal of American Indian Education 33(1), 21-31.
Thurgood, D.H., and Clarke, J.E. (1995). Summary Report 1993. Doctorate Recipients FromUnited States Universities. Washington, DC: National Academy Press.
Tierney, W., and Wright, B. (1991). American Indians in Higher Education: A History ofCultural Conflict. Change (March/April): 11-18.
Tierney, W.G. (1992). Official Encouragement, Institutional Discouragement: Minorities inAcademe—The Native American Experience. Norwood, NJ: Ablex Publishing Corporation.
Tippeconnic, J.W., III. (1991). The Education of American Indians: Policy, Practice and FutureDirection. ERIC, ED351158.
Tuma, J., and Geis, S. (1995). Student Financing of Undergraduate Education, 1992-93. Statistical Analysis Report. (U.S. Department of Education, National Center for EducationStatistics). Washington, DC: U.S. Government Printing Office.
Turchen, M. (1991). The American Indian Experience in Communication Classrooms. Paperpresented at the Annual Meeting of the Central States Communication Association, April 11-14, Chicago, IL.
E-13
Tyler, J.D., and Suan, L.V. (1990). Mental Health Values Differences Between NativeAmerican and Caucasian American College Students. Journal of Rural Community Psychology11(2), 17-29.
U.S. Department of Commerce, Bureau of Labor Statistics. (May 1995). A CPS Supplementfor Testing Methods of Collecting Racial and Ethnic Information. Washington, DC: Author.
U.S. Department of Commerce, Bureau of the Census. (1995). Research and Evaluation ofAmerican Indian and Alaska Native Government Administrative Records. Washington, DC:Author.
U.S. Department of Commerce, Bureau of the Census. (1990). Census of Population: Educationin the United States. Washington, DC: U.S. Government Printing Office.
U.S. Department of Commerce, Bureau of the Census. (1990). Characteristics of AmericanIndians by Tribe and Selected Areas. Washington, DC: U.S. Government Printing Office.
U.S. Department of Commerce, Bureau of the Census. (1988). Statistical Profiles andCharacteristics of the American Indian Population: 1980 Census. Washington, DC: U.S.Government Printing Office.
U.S. Department of Commerce, Bureau of the Census. (1970). General PopulationCharacteristics: United States Summary. Washington, DC: U.S. Government Printing Office.
U.S. Department of Commerce, Bureau of the Census. (1960). General PopulationCharacteristics: United States Summary. Washington, DC: U.S. Government Printing Office.
U.S. Department of Commerce, Bureau of the Census. (1950). General PopulationCharacteristics: United States Summary. Washington, DC: U.S. Government Printing Office.
U.S. Department of Commerce, Bureau of the Census. (1940). General PopulationCharacteristics: United States Summary. Washington, DC: U.S. Government Printing Office.
U.S. Department of Education, National Center for Education Statistics. (1996). Degrees andOther Awards Conferred by Institutions of Higher Education: 1993-94. E.D.TABS. Washington, DC:U.S. Government Printing Office.
U.S. Department of Education, National Center for Education Statistics. (1995). Degrees andOther Awards Conferred by Institutions of Higher Education: 1992-93. E.D.TABS. Washington, DC:U.S. Government Printing Office.
U.S. Department of Education, National Center for Education Statistics. (1995). MinorityUndergraduate Participation in Postsecondary Education. Statistical Analysis Report. Washington,DC: U.S. Government Printing Office.
U.S. Department of Education, National Center for Education Statistics. (1995). StudentFinancing of Undergraduate Education, 1992-93, Statistical Analysis Report. Washington, DC: U.S. Government Printing Office.
U.S. Department of Education, National Center for Education Statistics. (1994). Characteristicsof Students Who Borrow to Finance Their Postsecondary Education. Statistical Analysis Report. Washington DC: U.S. Government Printing Office.
E-14
U.S. Department of Education, National Center for Education Statistics. (1994). Undergraduates Who Work While Enrolled in Postsecondary Education: 1989-90. StatisticalAnalysis Report. Washington, DC: U.S. Government Printing Office.
U.S. Department of Education, National Center for Education Statistics. (1993). America's HighSchool Sophomores: A Ten Year Comparison, 1980-1990. Washington, DC: U.S. GovernmentPrinting Office.
U.S. Department of Education, National Center for Education Statistics. (1993). Changes inUndergraduate Student Financial Aid: Fall 1986 to Fall 1989. Statistical Analysis Report. Washington DC: U.S. Government Printing Office.
U.S. Department of Education, National Center for Education Statistics. (1993). Occupationand Educational Outcomes of Recent College Graduates 1 Year after Graduation: 1991. StatisticalAnalysis Report. Washington, DC: U.S. Government Printing Office.
U.S. Department of Education, National Center for Education Statistics. (1993). Persistence andAttainment in Postsecondary Education for Beginning AY 1989-90 Students as of Spring 1992. E.D.TABS. Washington, DC: U.S. Government Printing Office.
U.S. Department of Education, National Center for Education Statistics. (1993). StudentFinancing of Graduate and First-Professional Education. Statistical Analysis Report. Washington,DC: U.S. Government Printing Office.
U.S. Department of Education, National Center for Education Statistics. (1993). Trends inDegrees Conferred by Institutions of Higher Education: 1984-85 Through 1990-91. E.D.TABS. Washington, DC: U.S. Government Printing Office.
U.S. Department of Education, National Center for Education Statistics. (1993). Trends inEnrollment in Higher Education by Racial/Ethnic Category: Fall 1982 Through Fall 1991. E.D. TABS.Washington, DC: U.S. Government Printing Office.
U.S. Department of Education, National Center for Education Statistics. (1992). A Profile ofAmerican Eighth Grade Mathematics and Science Instruction, NELS-1988. Washington, DC: U.S.Government Printing Office.
U.S. Department of Education, National Center for Education Statistics. (1992). Characteristicsof Doctorate Recipients: 1979, 1984, and 1989. E.D. TABS. Washington, DC: U.S. GovernmentPrinting Office.
U.S. Department of Education, National Center for Education Statistics. (1992). ParentalFinancial Support for Undergraduate Education. E.D. TABS. Washington, DC: U.S. GovernmentPrinting Office.
U.S. Department of Education, National Center for Education Statistics. (1992). Racial/EthnicTrends in Degrees Conferred by Institutions of Higher Education: 1980-81 through 1989-90. ELECTRONIC E.D.TABS. Available online at www.ed.gov/NCES.
U.S. Department of Education, National Center for Education Statistics. (1992). Students atLess-Than-4-Year Institutions. Statistical Analysis Report. Washington, DC: U.S. GovernmentPrinting Office.
E-15
U.S. Department of Education, National Center for Education Statistics. (1992). Trends inRacial/Ethnic Enrollment in Higher Education: Fall 1980 Through Fall 1990. ELECTRONICE.D.TABS. Available online at www.ed.gov/NCES.
U.S. Department of Education, National Center for Education Statistics. (1991). NationalPostsecondary Student Aid Study: Preliminary Estimates on Student Financial Aid Recipients, 1989-90. E.D. TABS. Washington, DC: U.S. Government Printing Office.
U.S. Department of Education, National Center for Education Statistics. (1991). Profiles ofFaculty in Higher Education Institutions, 1988. Statistical Analysis Report. Washington, DC: U.S.Government Printing Office.
U.S. Department of Education, National Center for Education Statistics. (1991). Race/EthnicityTrends in Degrees Conferred by Institutions of Higher Education: 1978-79 through 1988-89. E.D.TABS. Washington DC: U.S. Government Printing Office.
U.S. Department of Education, National Center for Education Statistics. (1990). Consequencesof Delay in Postsecondary Education: Degree Attainment for 1972, 1980 and 1982 High SchoolGraduates. E.D. TABS. Washington, DC: U.S. Government Printing Office.
U.S. Department of Education, National Center for Education Statistics. (1990). DegreesConferred by Institutions of Higher Education, by Race/Ethnicity and Sex: 1976-77 through 1986-87.Survey Report. Washington, DC: U.S. Government Printing Office.
U.S. Department of Education, National Center for Education Statistics. (1990). Faculty inHigher Education Institutions: 1988. Survey Report. Washington, DC: U.S. Government PrintingOffice.
U.S. Department of Education, National Center for Education Statistics. (1990). Patterns andTrends of Delayed Entry into Postsecondary Education: 1972, 1980, and 1982 High SchoolGraduates. E.D. TABS. Washington, DC: U.S. Government Printing Office.
U.S. Department of Education, National Center for Education Statistics. (1990). Patterns andTrends of Stopping Out from Postsecondary Education: 1972, 1980, and 1982 High SchoolGraduates. E.D. TABS. Washington, DC: U.S. Government Printing Office.
U.S. Department of Education, National Center for Education Statistics. (1990). Trends inRacial/Ethnic Enrollment in Higher Education: Fall 1978 Through Fall 1988. Survey Report. Washington DC: U.S. Government Printing Office.
U.S. Department of Education, National Center for Education Statistics. (1989). Completions inInstitutions of Higher Education, 1986-87. E.D. TABS. Washington, DC: U.S. GovernmentPrinting Office.
U.S. Department of Education, National Center for Education Statistics. (1988). NationalEducation Longitudinal Study of 1988: Base Year Student Survey. Washington, DC: U.S.Government Printing Office.
U.S. Department of Education, National Center for Education Statistics. (1988). Trends inMinority Enrollment in Higher Education: Fall 1976-Fall 1986. Survey Report. Washington, DC:U.S. Government Printing Office.
E-16
U.S. Department of Education, Office of Civil Rights. (1994). Elementary and Secondary SchoolCivil Rights Survey. Washington, DC: U.S. Government Printing Office.
U.S. Department of Education, Office of Education Research and Improvement. (1988). HighSchool and Beyond: A Descriptive Summary of 1980 High School Seniors. Six Years Later. Washington, DC: U.S. Government Printing Office.
U.S. Department of Education, Office of Planning, Budget, and Evaluation. (1991). Study ofthe Indian Education Fellowship Program. Final Report. Washington, DC: Author.
U.S. Department of Education, Planning and Evaluation Service, Office of the Under Secretary. (1994). Evaluation of Educational Personnel Development Projects in Indian Education. Washington, DC: Author.
U.S. Department of the Interior, Bureau of Indian Affairs. (1992). Annual Education Report. Washington, DC: Author.
U.S. Senate, Committee on Labor and Public Welfare, Subcommittee on Indian Education. (1969). Indian Education: A Tragedy--A National Challenge. Washington, DC: U.S. GovernmentPrinting Office.
U.S. Senate. (1990). Senate Select Committee on Indian Affairs. Reauthorizing the TriballyControlled Community College Assistance Act of 1978 and the Navajo Community College Act. Report To Accompany S. 2167. 101st Cong. 2nd sess.
Vasquez, J.A., and Wainstein, N. (1990). Instructional Responsibilities of College Faculty toMinority Students. Journal of Negro Education (59)4: 599.
Washington State Board for Community College Education. (1990). Vocational Outcomes inWashington Community Colleges. Baseline Report. Operations Report No. 90-2. Olympia, WA:Author. ERIC, ED325185.
Washington State Higher Education Coordinating Board. (1991). The Status of People of Color,Women, and People with Disabilities in Higher Education in the State of Washington 1991. AnAnnual Report. Olympia, WA: Author. ERIC, ED366264.
Washington State Higher Education Coordinating Board. (1992). Scholarship Guide &Bibliography: A Guide to Locating and Applying for Postsecondary Scholarships. Olympia, WA:Author. ERIC, ED367211.
Washington, V., and Harvey, W. (1989). Affirmative Rhetoric, Negative Action. AfricanAmerican and Hispanic Faculty at Predominantly White Institutions. Report No. 2. Washington,DC: The George Washington University, School of Education and Human Development.
Wechsler, M.E., et al. (1994). Evaluation of Educational Personnel Development Projects in IndianEducation. Washington, DC: U.S. Department of Education, Planning and Evaluation Service,Office of the Under Secretary.
Wells, R.N. (1990). The Native American Experience in Higher Education: Turning Aroundthe Cycle of Failure. Minorities in Higher Education. Selected papers from an interdisciplinaryconference, March 9-11, Hofstra University, Hempstead, NY, ERIC, ED 341 741.
E-17
Wells, R.N., Jr. (1990). Retention Issues and Quality of Life For Native American Students inHigher Education. Minorities in Higher Education. Selected papers from an interdisciplinaryconference, March 9-11, Hofstra University, Hempstead, NY, ERIC ED 341 741.
Wells, R.N., Jr., and White, D. (1990). Tribal Cooperation in Education Opportunities forNative Americans: Twenty Years of St. Regis Mohawk-St. Lawrence University Association. Minorities in Higher Education. Selected papers from an interdisciplinary conference, March 9-11, Hofstra University, Hempstead, NY, ERIC, ED 341 741.
Western Interstate Commission for Higher Education. (1994). Access Quality and Student Costs. WICHE Reports on Higher Education in the West. Boulder, CO: Western Interstate Commissionfor Higher Education.
Wright, B., and Head, P.W. Tribally Controlled Community Colleges: A Student OutcomesAssessment of Associate Degree Recipients. Community College Review 18(3), 28-33.
Zimbler, L.J. (1994). Faculty and Instructional Staff: Who Are They and What Do They Do? Survey Report. (U.S. Department of Education, National Center for Education Statistics). Washington, DC: U.S. Government Printing Office.