american lung association energy policy · pdf file · 2015-09-15american lung...
TRANSCRIPT

January 2015 1
American Lung Association Energy Policy Development:
Transportation Background Document
Prepared by M.J. Bradley & Associates LLC
Updated January 2015

2 January 2015
This page intentionally left blank

January 2015 3
Table of Contents
Introduction .................................................................................................................................................. 5
Transportation Overview .......................................................................................................................... 5
Comparing Transportation Modes ............................................................................................................ 6
Comparing Energy Intensity .................................................................................................................... 11
Transportation Air Emissions .................................................................................................................. 13
Environmental Justice ............................................................................................................................. 15
EPA Regulation of Pollutants from New Vehicles and Engines ............................................................... 15
Regulation of Fuel Economy & CO2 from New Vehicles and Engines ..................................................... 21
Production of Transportation Fuels ...................................................................................................... 222
Petroleum Extraction .......................................................................................................................... 25
Refining ............................................................................................................................................... 25
Transport and Storage ........................................................................................................................ 27
U.S. Production versus Imports .......................................................................................................... 28
Transportation Funding System .............................................................................................................. 28
Public Transit ....................................................................................................................................... 30
Intercity Passenger Rail ....................................................................................................................... 30
Airports ............................................................................................................................................... 31
Marine ................................................................................................................................................. 31
Recent Trends in Onroad Vehicles .......................................................................................................... 32
Alternative Fuels ................................................................................................................................. 32
Electric Vehicles .................................................................................................................................. 39
Hydrogen Fuel Cell Vehicles ................................................................................................................ 44
Major Policy Issues Associated with Transportation .................................................................................. 46
NOx, VOC, SO2 and PM Reduction from Transportation ........................................................................ 46
More Stringent Regulation of New Vehicles ....................................................................................... 46
Regulation/Control of In-Use Vehicles ................................................................................................ 49
Reducing Driving ................................................................................................................................. 55
CO2 Reduction from Transportation ....................................................................................................... 60

4 January 2015
Fuel Economy Regulation of New Vehicles ......................................................................................... 60
Switch to Non-petroleum Fuels .......................................................................................................... 62
Transportation Recommended Reading ..................................................................................................... 66
References .................................................................................................................................................. 67

January 2015 5
Introduction
In 2010, the American Lung Association convened a series of workshops to discuss issues related to
energy use and policy in the U.S., including the impacts of different energy sources on human and
especially, lung health. The goal of the workshops was to better define the American Lung Association’s
positions on key energy policy issues. The workshops were divided into three categories: 1) electricity
generation, 2) heat (e.g., heating of residential and commercial buildings), and 3) transportation.
Prepared originally for one of these workshops and now updated in late 2014, this paper focuses on
transportation, providing a primer on fuel production and use for transportation, and its environmental
impacts. This paper discusses onroad transportation sources, both light-duty (cars and light trucks used
for personal transportation) and heavy-duty (trucks, buses), as well as nonroad locomotives, marine
vessels, and aircraft used for passenger and freight movement. This paper does not specifically address
nonroad diesel equipment used for construction, mining, agriculture, and industry. However, the air
impacts and environmental policy issues related to this equipment are similar to the issues addressed
here relative to diesel trucks, locomotives, and marine vessels.
Below, we provide an overview of transportation fuel use and emissions, and then consider
transportation-related health impacts and policy issues. The paper concludes with a list of
recommended readings.
Transportation Overview
In 2013, the U.S. transportation sector consumed 27 quadrillion British thermal units (Btus) of energy –
28 percent of total energy use in the economy (DOE 2014). Ninety two percent of this energy was
derived from petroleum and was consumed primarily by vehicles in the form of gasoline and diesel fuel
(EIA 2010a). The transportation sector consumes 67 percent of all petroleum used in the U.S. (DOE
2014)
The transportation sector is comprised of both highway
vehicles (cars and trucks) and nonroad vehicles, such as
locomotives, marine vessels, and aircraft.
Transportation defined broadly also includes energy
expended to move oil, natural gas, and other fluids
through pipelines.
Highway vehicles include both light-duty vehicles – cars
and light trucks used primarily for personal
transportation – and heavy-duty trucks and buses,
which are primarily commercial vehicles and are used
for freight and passenger transportation. The vast
majority of light-duty vehicles operate on gasoline, while
virtually all heavy-duty vehicles, both highway and
Figure 1. Transportation Energy Use by
Mode

6 January 2015
nonroad, operate on diesel fuel. Aircraft, marine vessels, and locomotives also operate virtually
exclusively on diesel fuel.
Pipelines require energy to move liquid and gaseous fuel. Most oil and refined product pipelines are
operated by pumps that are driven by electric motors. Most natural gas pipelines are operated by
compressors driven by internal combustion engines powered by natural gas (Shell 2010).
Comparing Transportation Modes
See Figure 1 for a breakdown of transportation energy use by
mode. As shown, 81 percent of energy used for
transportation in 2012 was consumed by highway vehicles;
aircraft consumed 88 percent, marine vessels consumed 5
percent, pipelines consumed 44 percent and locomotives
consumed 2 percent. The percentage of total transportation
energy consumed by highway vehicles has been relatively
constant for the last 25 years.
Highway Vehicles. In 2012, there were 232 million light-duty
vehicles registered in the U.S. These vehicles traveled 2.7
trillion miles and consumed 124 billion gallons of gasoline. In
2008, the average U.S. light-duty vehicle traveled 11,432
miles and burned 557 gallons of gasoline. In 1970, light
trucks (pickups, SUVs, vans) comprised less than 14 percent
of the light-duty fleet, but their percentage has risen steadily
over time; in 2012, 52 percent of light-duty vehicles were
light trucks (DOE 2014).
In 2012, there were 11 million heavy trucks registered in the
U.S. These vehicles traveled 268 billion miles and burned 42
billion gallons of diesel fuel. In 2012, the average U.S. heavy
truck traveled 25,173 miles and consumed 3,960 gallons of
diesel fuel (DOE 2014).
Between 1985 and 2005, total fleet miles grew at an average
annual rate of 3.4 percent. In 2008, the number of miles
traveled by the U.S. highway fleet declined, compared to the
previous year, for the first time in 28 years. Since then, annual
mileage growth has been much lower than the historical
average – between 2009 and 2012, total annual fleet mileage
has increased by less than 1 percent.
Figure 2. Vehicles, Fleet Miles and Fuel Use for Highway Vehicles
January 2015 7
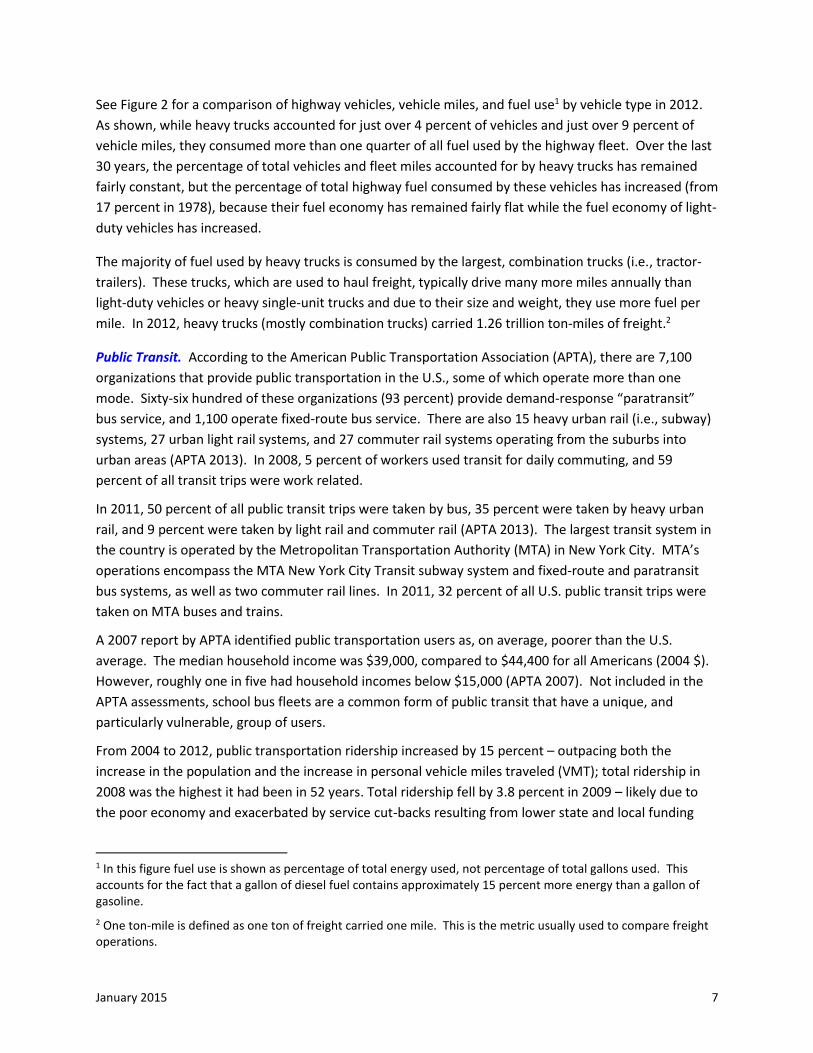
See Figure 2 for a comparison of highway vehicles, vehicle miles, and fuel use1 by vehicle type in 2012.
As shown, while heavy trucks accounted for just over 4 percent of vehicles and just over 9 percent of
vehicle miles, they consumed more than one quarter of all fuel used by the highway fleet. Over the last
30 years, the percentage of total vehicles and fleet miles accounted for by heavy trucks has remained
fairly constant, but the percentage of total highway fuel consumed by these vehicles has increased (from
17 percent in 1978), because their fuel economy has remained fairly flat while the fuel economy of light-
duty vehicles has increased.
The majority of fuel used by heavy trucks is consumed by the largest, combination trucks (i.e., tractor-
trailers). These trucks, which are used to haul freight, typically drive many more miles annually than
light-duty vehicles or heavy single-unit trucks and due to their size and weight, they use more fuel per
mile. In 2012, heavy trucks (mostly combination trucks) carried 1.26 trillion ton-miles of freight.2
Public Transit. According to the American Public Transportation Association (APTA), there are 7,100
organizations that provide public transportation in the U.S., some of which operate more than one
mode. Sixty-six hundred of these organizations (93 percent) provide demand-response “paratransit”
bus service, and 1,100 operate fixed-route bus service. There are also 15 heavy urban rail (i.e., subway)
systems, 27 urban light rail systems, and 27 commuter rail systems operating from the suburbs into
urban areas (APTA 2013). In 2008, 5 percent of workers used transit for daily commuting, and 59
percent of all transit trips were work related.
In 2011, 50 percent of all public transit trips were taken by bus, 35 percent were taken by heavy urban
rail, and 9 percent were taken by light rail and commuter rail (APTA 2013). The largest transit system in
the country is operated by the Metropolitan Transportation Authority (MTA) in New York City. MTA’s
operations encompass the MTA New York City Transit subway system and fixed-route and paratransit
bus systems, as well as two commuter rail lines. In 2011, 32 percent of all U.S. public transit trips were
taken on MTA buses and trains.
A 2007 report by APTA identified public transportation users as, on average, poorer than the U.S.
average. The median household income was $39,000, compared to $44,400 for all Americans (2004 $).
However, roughly one in five had household incomes below $15,000 (APTA 2007). Not included in the
APTA assessments, school bus fleets are a common form of public transit that have a unique, and
particularly vulnerable, group of users.
From 2004 to 2012, public transportation ridership increased by 15 percent – outpacing both the
increase in the population and the increase in personal vehicle miles traveled (VMT); total ridership in
2008 was the highest it had been in 52 years. Total ridership fell by 3.8 percent in 2009 – likely due to
the poor economy and exacerbated by service cut-backs resulting from lower state and local funding
1 In this figure fuel use is shown as percentage of total energy used, not percentage of total gallons used. This accounts for the fact that a gallon of diesel fuel contains approximately 15 percent more energy than a gallon of gasoline.
2 One ton-mile is defined as one ton of freight carried one mile. This is the metric usually used to compare freight operations.

8 January 2015
(APTA 2010). Since 2009, annual transit ridership growth has again outpaced population growth and the
growth in highway vehicle VMT. In 2011, Americans took more than 10 billion trips on public transit
totaling over 56 billion passenger miles (APTA 2013).
Aircraft. In 2013, U.S. and international major air carriers operated over 7,800 aircraft, which flew 7.7
billion revenue miles (848 billion passenger miles) and carried 33.6 billion ton-miles of freight. In 2012,
the general aviation fleet (not-for-hire aircraft with more than 20 seats, on-demand and commuter
operations, and agricultural aircraft) contained an additional 209,034 aircraft, which accumulated 24.4
million hours of flight time. Air transportation has been getting steadily more efficient in the last 20
years. The average energy intensity (Btu/passenger-mile3) of major air carriers was 43 percent lower in
2013 than it was in 1988. Part of the improvement was due to more efficient aircraft and partly due to
more efficient operations – the average passenger load factor was 83 percent in 2013 compared to 62
percent in 19884 (DOE 2014).
Marine. In 2012, there were approximately 40,500 marine vessels operating to, from, and between U.S.
ports. These vessels carried 475 billion ton-miles of freight. Water-borne freight tonnage peaked at 929
billion ton-miles in 1981 and has generally experienced negative year-to-year growth since then.
Between 2000 and 2012, annual water-borne freight tonnage dropped by 26 percent (DOE 2014).
Rail. The seven largest rail companies in the U.S., based
on annual gross revenue, are designated Class I
railroads; together, these companies operate 67 percent
of rail industry mileage and take in 94 percent of rail
industry revenue (see Table 1 and Figure 3). In 2012, the
Class I railroads operated 24,707 locomotives and
381,000 freight cars, which they used to carry 1.7 trillion
ton-miles of freight. Over the last ten years, rail freight
tonnage has been flat, while freight ton-miles have
increased at an average annual rate of 1.3 percent. This
is because the average length of haul has increased by
14 percent (DOE 2014).
In the last ten years, railroads have also gotten more
efficient. Since 2002, the energy intensity of moving
freight by rail (Btu per ton-mile) has fallen by 15 percent.
3 One passenger-mile is defined as one passenger carried one mile. This is the metric usually used to compare different passenger transit modes.
4 Passenger load factor = occupied seats ÷ available seats
Table 1. U.S. Class I Railroads
Railroad Revenue ton-miles (billions)
Burlington Northern & Santa Fe
658
Union Pacific 521
CSX Transportation 226
Norfolk Southern 186
Canadian National, Grand Trunk
56
Soo Line 37
Kansas City Southern 30

January 2015 9
Figure 3. U.S. Class I Freight Railroads
Pipelines. There are over 500,000 miles of
pipelines installed throughout the U.S. that carry
crude oil, natural gas, and refined petroleum
products from the well head to the refinery and
between regional markets. See Table 2 for a
breakdown of pipeline mileage by type and
Figure 4 for a map of major pipeline routes.
Table 2. U.S. Pipeline System
Type Miles
Crude Oil
Gathering Lines 30,000 – 40,000
Trunk Lines 55,000
Refined Products 95,000
Natural Gas
Gathering Lines 20,000
Transmission Lines 278,000
Distribution mains 1 1,800,000
Source: www.pipeline101.com
1 Distribution to houses and business within cities;
operated by local gas utilities

10 January 2015
Natural Gas Pipelines
Refined Product Pipelines
Figure 4. Major U.S. Natural Gas and Refined Products Pipeline Routes

January 2015 11
See Figure 5 for the proportion of total freight carried by
each mode in 2011. As shown, 45 percent of total ton-miles
of freight were carried by highway trucks, 29 percent were
carried by railroads, 17 percent were carried by pipeline, 9
percent were carried by water, and less than 1 percent was
carried by air (DOT 2014).
Comparing Energy Intensity
As shown in Figure 6, railroads are the most efficient way to
carry freight, followed by water transport. On average,
trucks have more than three times the energy intensity of
railroads – that is, they use three times as much energy to
carry a ton of freight one mile. By comparison, the efficiency
of passenger transportation varies, not surprisingly, with the
number of passengers that are transported relative to the size
of the vehicle – what is often referred to as the “load
factor.”
Figure 7 includes a comparison of the energy intensity of
different passenger modes. As shown, single commuters
using a personal car use the most energy per passenger-
mile, while a four-person carpool is one of the most
efficient ways to move people to work. The average
efficiency of fixed-route public transportation is highly
variable from city to city because it is dependent on how
many people use the system. The average energy intensity
of transit buses shown in Figure 7 is based on the U.S.
average passenger load of only 11 people. Transit buses
typically have 40 or more seats, so that in dense cities,
particularly during peak periods when buses are full, they
are a very efficient mode; the same is true of trains. Air
travel is less efficient than the other fixed-route “public”
modes (bus, train).
However, the most efficient mode may not always be the cleanest due to differences in emissions rates
on a grams per gallon basis (as discussed below, new cars and trucks have to meet more stringent
emissions standards than heavy diesel vehicles used for other modes of transportation (i.e., bus or rail).
To show how they can differ, Figure 7 includes estimates of the emissions intensity of NOx in grams per
passenger-mile. While a passenger in a single commuter car is less efficient on an energy (Btu) basis
than a passenger onboard an Amtrak train, the intensity of NOx emissions from the car on a passenger-
mile basis is about a quarter of the emissions intensity from the train on the same basis. That situation
Figure 6. Energy Intensity of Freight Modes
Figure 5. Percentage of Freight (ton-miles)
Moved by Mode in 2011
HighwayTrucks
Water
Pipeline
Railroad
Ton-milesAir

12 January 2015
exists because diesel locomotive engines have significantly higher emissions rates (grams of NOx per
gallon of fuel) than modern gasoline cars.
Similar to the energy intensity discussion above, variability in NOx rates within the modes is attributable
to utilization rates. For example, while diesel commuter rail trains and diesel Amtrak trains have the
same emissions rate (270 g NOx/gallon), they have different utilization rates (i.e., more passengers are
carried on commuter rails per gallon of fuel burned). This is likely due to the fact that 1) commuter rail
trains generally do not have café cars and sleeping cars, and 2) the average load factor (occupied seats
divided by available seats) is higher for commuter rail trains because they are clustered around cities
with heavy use during rush hour and do not make long distance trips across the country. The higher
utilization drives lower NOx intensity for commuter rail compared to Amtrak. Furthermore, Figure 7 is
based on U.S. averages, and there is significant variability in train fuel use and utilization depending on
where in the country they are used. For example, in the Northeast corridor, Amtrak has high utilization
and runs almost exclusively on electric power. As a result, Amtrak trains running in the Northeast
corridor would have a NOx intensity competitive with, and likely lower than, commuter rail.
Figure 7. 2006 Energy and NOx Emissions Intensity of Passenger Modes (MJB&A 2008)
0
0.5
1
1.5
2
2.5
3
3.5
4
0
1000
2000
3000
4000
5000
6000
NO
x In
ten
sity
(g
NO
x/p
asse
nge
r-m
ile)
Ener
gy In
ten
sity
(B
tu/p
asse
nge
r-m
ile)
Energy Intensity NOx Intensity

January 2015 13
Transportation Air Emissions
The most significant health impacts associated with
transportation are associated with tailpipe emissions from
the combustion of gasoline and diesel fuel in automotive
engines. As shown in Figure 8, collectively, transportation
sector emissions (including both onroad vehicles and
nonroad vehicles and equipment) make up about 13
percent of primary fine particulate matter (PM 2.5)
emissions,5 59 percent of nitrogen oxide (NOx) emissions,
and 46 percent of volatile organic compound (VOC)
emissions. The transportation sector is responsible for
about a third of carbon dioxide (CO2) emissions from the
U.S. economy. Overall, transportation sources are not a
significant source of national sulfur dioxide (SO2) or
mercury emissions, which are largely the result of electric
power generation. However, because they burn high
sulfur residual fuel, ocean-going marine vessels can be a significant local source of SO2 emissions; this is
particularly true in cities with large, active ports such as Los Angeles, New York, New Orleans, and
Houston.
Emissions from petroleum refining, transport, and storage add another 1 to 2 percent of national PM2.5
and NOx emissions, and 4 percent of VOC emissions.
Approximately one third of transportation PM emissions, half of NOx emissions, and 95 percent of VOC
emissions come from gasoline engines (mostly cars and light trucks). Approximately two thirds of
transportation PM emissions, and half of NOx emissions, come from diesel engines – highway trucks,
marine vessels, locomotives, and aircraft.6
Particulate matter (PM) refers to a mix of very tiny solid and liquid particles. Researchers categorize
particles according to size, grouping them as coarse, fine and ultrafine. They also vary in chemical
composition.
Even short-term exposure to PM can kill. Peaks or spikes in PM can last for hours to days. Deaths can
occur on the very day that particle levels are high, or within one to two months afterward. PM does not
5 In this figure total PM2.5 emissions do not include fugitive dust, such as road dust, or emissions from natural and structural fires.
6 While aircraft burn diesel fuel, most are powered by turbine (jet) engines. These external combustion engines are very different than the internal combustion “diesel engines” in trucks, locomotives, and marine vessels. Air craft jet engines are similar to the small, natural gas or diesel-fueled “peaking turbines” used to generate electricity.
EPA Concludes Fine Particle Pollution
Poses Serious Health Threats
Causes early death (both short-term
and long-term exposure)
Causes cardiovascular harm (e.g.,
heart attacks, strokes, heart disease,
congestive heart failure)
Likely to cause respiratory harm (e.g.,
worsened asthma, worsened COPD,
inflammation)
May cause cancer
May cause reproductive and
developmental harm Source: U.S. Environmental Protection Agency, Integrated
Science Assessment for Particulate Matter, December
2009. EPA 600/R-08/139F.

14 January 2015
just make people die a few days earlier than they might otherwise – these are deaths that would not
have occurred if the air were cleaner (EPA 2009e).
The Environmental Protection Agency released the most recent review of the current research on
particle pollution in December 2009 (EPA 2009e). The Agency had engaged a panel of expert scientists,
the Clean Air Scientific Advisory Committee, to help them assess the evidence, in particular research
published between 2002 and May 2009. EPA concluded in the published Integrated Science Assessment
that particle pollution caused multiple, serious threats to health. Their findings are highlighted in the
box at right.
Diesel particles have been studied separately from other ambient particles because of some distinctive
characteristics. While mostly carbon, diesel particles also carry with them dozens of hydrocarbons also
present in diesel exhaust, which are adsorbed onto the carbon core. More than 40 potential
components of diesel exhaust (for example, benzene and formaldehyde) are designated as hazardous
air pollutants by EPA; 15 of these substances are also listed by the International Agency for Research on
Cancer as known, probable, or possible human carcinogens (EPA 2002; IARC 2010). Ultrafine diesel
particles in the ambient air carry these toxins deep into the lung when inhaled. There is also growing
evidence that diesel exhaust may worsen the effect of inhaled allergens (EPA 2004).
While transportation sources only account for 8 percent of total primary PM2.5 nationally, the nature and
location of these PM emissions magnify their impact on human exposure. While most power plant and
many industrial emission sources release combustion exhaust at the top of tall exhaust stacks, virtually
all exhaust from transportation vehicles is emitted at ground level where people live, work, and breathe.
Individuals who live or work near heavily trafficked roadways, or near locations with heavy
concentrations of diesel vehicles – for example, freight truck depots, rail yards, ports, and airports –
have the greatest exposure.
These near-roadway exposures are of growing concern and may affect many more people than
previously thought. The Health Effects Institute (HEI) in 2010 published the most recent review of the
health effects from exposures to traffic-generated air pollutants. They concluded that as much as 30 to
45 percent of people in large North American cities live in areas that were impacted by traffic-related air
pollution, a zone they identified as 300 to 500 meters from the roadside. The HEI review concluded that
the evidence showed traffic-generated pollution causes asthma attacks in children and may cause the
onset of asthma, premature death, impaired lung function, and cardiovascular disease (HEI 2010).
SO2, VOC, and NOx emissions from transportation vehicles also directly impact lung health and
contribute to ground-level ozone and fine particle air pollution, as well as regional haze.
Direct impacts: NOx and SO2 can trigger asthma attacks and make breathing difficult. NOx can
increase the risk of developing infectious disease.
Ozone: Even more critical than their direct impacts are the roles of NOx and VOCs in forming
ozone. The East, Midwest, and Southeastern states have long struggled to meet the national
ozone standards, in part because of NOx and VOC emissions from transportation sources.
Ozone can trigger serious respiratory problems, including airway irritation, aggravation of

January 2015 15
asthma, increased susceptibility to respiratory illnesses like pneumonia and bronchitis, and
permanent lung damage with repeated exposures, as well as premature death.
Secondary Particle Pollution: In addition to the primary PM emitted directly from vehicle tail
pipes, SO2 and NOx emissions react in the air to form additional fine particles (secondary PM).
Fine particle air pollution can cause or contribute to asthma attacks, heart attacks, stroke, as
well as increase the risk of premature death in infants and young children and adults.
Nitrogen Deposition: NOx emissions are also associated with nitrogen deposition, which can
impair water quality by overloading a water body with nutrients.
CO2 is the most prevalent of anthropogenic greenhouse gas (GHG) emissions, although ozone is also a
potent greenhouse gas. Greenhouse gases trap heat in the atmosphere and at elevated concentrations,
lead to global climate change.
Environmental Justice Underlying the broader health impacts of transportation and the American Lung Association’s policy
positions are concerns about environmental justice. In its Interim Guidance on Considering
Environmental Justice During the Development of an Action, EPA has defined environmental justice as
“the fair treatment and meaningful involvement of all people regardless of race, color, national origin, or
income with respect to the development, implementation, and enforcement of environmental laws,
regulations, and policies” (EPA 2010f). EPA goes on to say:
Fair treatment means that no group of people should bear a disproportionate burden of
environmental harms and risks, including those resulting from the negative environmental
consequences of industrial, governmental, and commercial operations or programs and policies.
Meaningful Involvement means that: 1) potentially affected community members have an
appropriate opportunity to participate in decisions about a proposed activity that will affect
their environment and/or health; 2) the public’s contribution can influence the regulatory
agency’s decision; 3) the concerns of all participants involved will be considered in the decision-
making process; and 4) the decision-makers seek out and facilitate the involvement of those
potentially affected.
Broad, national-level policy decisions impact public health and air quality, but transportation can impact
different communities differently. For example, poor and disadvantaged communities bear a
disproportionate burden of diesel PM exposure because of the location of many major transportation
facilities (major highways, rail yards, freight depots, ports) in and near their neighborhoods. Others
include limited transportation options for access to services and employment.
EPA Regulation of Pollutants from New Vehicles and Engines
Under the Clean Air Act, EPA regulates the allowable level of exhaust emissions from new vehicles and
engines. There are four pollutants regulated for all transportation sources: PM, NOx, carbon monoxide
(CO), and VOC. Beginning with the 2012 model year, EPA also began directly regulating CO2 emissions
from new light-duty vehicles – though the Department of Transportation has been indirectly regulating
light-duty vehicle CO2 emission since the 1970s through fleet average fuel economy standards.

16 January 2015
Beginning with the 2014 model year, EPA also began regulating CO2 emissions from new medium- and
heavy-duty engines and vehicles.
EPA emission standards for cars and light trucks are expressed as allowable mass of emissions per mile
driven – grams per mile (g/mi) – and certification is based on testing of the entire vehicle. EPA uses a
different approach with heavy-duty vehicles. For all pollutants except CO2, EPA regulates emissions
from heavy-duty engines, not vehicles; emissions limits are expressed as allowable mass per unit of work
done – grams per brake horsepower-hour (g/bhp-hr). For CO2 emissions, EPA sets both g/bhp-hr limits
applicable to new engines, and separate gram per ton-mile7 limits applicable to the entire vehicle.
Heavy-duty vehicles are regulated differently from light-duty vehicles because heavy-duty vehicle
markets are much more complicated. Heavy-duty vehicles and engines come in a much broader range
of configurations and sizes. The heavy-duty vehicle industry also has a more complicated structure with
more manufacturers and greater disaggregation in the manufacturing process.
EPA imposes a separate regulatory regime (testing procedures and numerical emissions limits) for
different types of heavy-duty engines. There are separate standards for engines used in heavy-duty
highway trucks, nonroad construction and agricultural equipment, locomotives, marine vessels, and
aircraft.
Emissions limits for all types of new transportation vehicles have been tightened over the years. While
EPA first imposed emissions limits on new cars in the 1970s, emissions from heavy-duty highway engines
were first regulated in the 1988 model year, and new engines for marine vessels were not regulated
until the 2004 model year. See Figure 9 for a timeline of emissions regulation by vehicle type. The more
stringent limits have significantly cut emissions; for example, the average new car sold in 2014, and
subject to EPA Tier 2 limits, emits 88 percent less NOx and 90 percent less PM than a car sold ten years
ago (subject to Tier 1 limits). Similarly, the average new heavy-duty highway engine sold in 2010 emits
95 percent less NOx and 90 percent less PM than an engine sold ten years ago. Tier 3 vehicle
requirements will phase in from the 2017 model year to the 2025 model year.
7 A ton-mile is defined as one ton of vehicle pay-load driven one mile. CO2 limits for medium- and heavy-duty vehicles are expressed this way in acknowledgment that most of these vehicles are used to haul freight.

January 2015 17
The EPA Tier 2 light-duty vehicle standards allowed manufacturers to sell some new cars that emit more
than others. Manufacturers certified each vehicle model into one of eight “bins” with different emission
limits for each pollutant. For example, Bin 5 vehicles could emit no more than 0.07 g/mi NOx, 0.09 g/mi
non-methane organic gases (NMOG), and 0.01 g/mi PM. Bin 8 vehicles (the most lenient standard)
could be more than twice as dirty – they were allowed to emit up to 0.20 g/mi NOx, 0.125 g/mi NMOG,
and 0.02 g/mi PM. The most stringent standard is Bin 1, which is a zero emission vehicle. While
different models can be certified to more lenient standards, the sales-weighted average NOx emissions
for all vehicles sold by each manufacturer can be no more than 0.07 g/mi – equivalent to Bin 5.
Figure 9. Timeline of EPA Emission Standards for New Vehicles and Engines
NOTES: EPA Tier 2 and California LEV II light-duty standards were phased in over several model years based on fleet average requirements. Similarly EPA Tier 3 and LEV III will be phased in over several model years.
Construction equipment and coastal marine vessel standards were phased in over several model years based on engine size.
OGV = Ocean-going vessel (cruise ship, tanker, cargo vessel). These vessels have very large and unique engines that are different than the engines in smaller harbor craft (ferries, tugs, work boats), and they also burn residual fuel. EPA T1-T3 standards only apply to U.S.-flagged vessels.
Beginning in calendar year 2000, Tier 0 locomotive standards apply retroactively to locomotive engines built from 1973 – 2001 when the engine is rebuilt or remanufactured.
18 January 2015
EPA emission standards are separate from fuel economy standards, which are discussed below.
Emission standards for light-duty vehicles are expressed as a limit on allowable grams of pollutant per
mile, so getting more miles to the gallon would not necessarily significantly reduce NOx, PM, and VOC
emissions. This is especially true because vehicles meet the most stringent emission standards primarily
by treating the emissions before they leave the car (with a three-way catalyst), rather than by reducing
emissions generated by the engine.
The EPA Tier 2 and Tier 3 standards apply to all light- and medium-duty passenger vehicles up to 10,000
pounds gross vehicle weight (GVWR) no matter what fuel they use – the same numerical limits apply to
gasoline-, diesel-, natural gas-, and ethanol-fueled vehicles. The GVWR limit of 10,000 pounds includes
all cars and most pickup trucks and vans, and even the largest SUVs. The largest pickups and vans (i.e.,
Ford F350) have GVWR above 10,000 pounds and are considered medium heavy-duty trucks, subject to
heavy-duty engine standards. Many of these large pickups and vans have diesel engines.
The California Air Resources Board (CARB) sets their own emission standards for light-duty vehicles sold
in California, which have traditionally been more stringent than EPA standards. Fifteen other states
formally adopted California standards for new light-duty vehicles in lieu of EPA standards, effective
between model year 2008 and 2011, though two others adopted then rejected those standards in
2012.8 At the same time that EPA was phasing in Tier 2 standards (model year 2004 – 2010), California
phased in Low Emissions Vehicle (LEV) II standards. Under California LEV II standards, cars could be
certified into one of four categories: LEV, ultra-low emission vehicle (ULEV), super ultra-low emission
vehicle (SULEV), and partial zero emission vehicle (PZEV). Not all cars certified to California standards
are cleaner than those certified to EPA Tier 2 standards. The numerical emissions limits for a LEV-
certified vehicle are the same as EPA Tier 2/Bin 5. ULEV emission limits are the same as EPA Tier 2/Bin 3
for NMOG and CO, but less stringent for NOx. SULEV limits are the same as EPA Tier 2/Bin 2 for NMOG
and NOx, but more stringent for CO. PZEV has the same numerical limits as SULEV, but imposes a longer
emissions warranty period and tighter controls on evaporative emissions (NMOG) from the vehicle fuel
system.
Under LEV II, manufacturers could certify individual vehicles to LEV, ULEV, SULEV, or PZEV standards, but
were held to increasingly stringent sales-weighted fleet average requirements between model year
2004 and 2010 for both NMOG and NOx. In model year 2010, the California LEV II fleet average
requirements for NMOG were about twice as stringent as EPA Tier 2 fleet average requirements
(Dieselnet 2010).
In 2012, CARB adopted LEV III light-duty vehicle standards to be phased in between the 2014 and 2022
model years. LEV III added several more certification categories, combined NOx and NMOG into a single
numerical limit for both pollutants, and introduced even more stringent fleet average requirements. It
8 State (effective model year): New Jersey (2009), Connecticut (2008), Washington (2009), Vermont (2009), New York (2009), Maine (2009), Rhode Island (2009), Massachusetts (2009), Oregon (2009), Arizona (2011), Pennsylvania (2008), Maryland (2011), New Mexico (2011). Florida adopted it in 2009 and repealed it in 2012. Arizona also dropped California standards in 2012.
January 2015 19
also further tightened PM limits, increased the emission durability warranty period (to 150,000 miles),
and further tightened standards for evaporative emissions. The required LEV III fleet average standard
for NMOG + NOx in 2022 will reduce emissions of these pollutants from new cars by approximately 73
percent compared to the actual sales-weighted fleet average for new cars sold in California in 2008
(Dieselnet 2010).
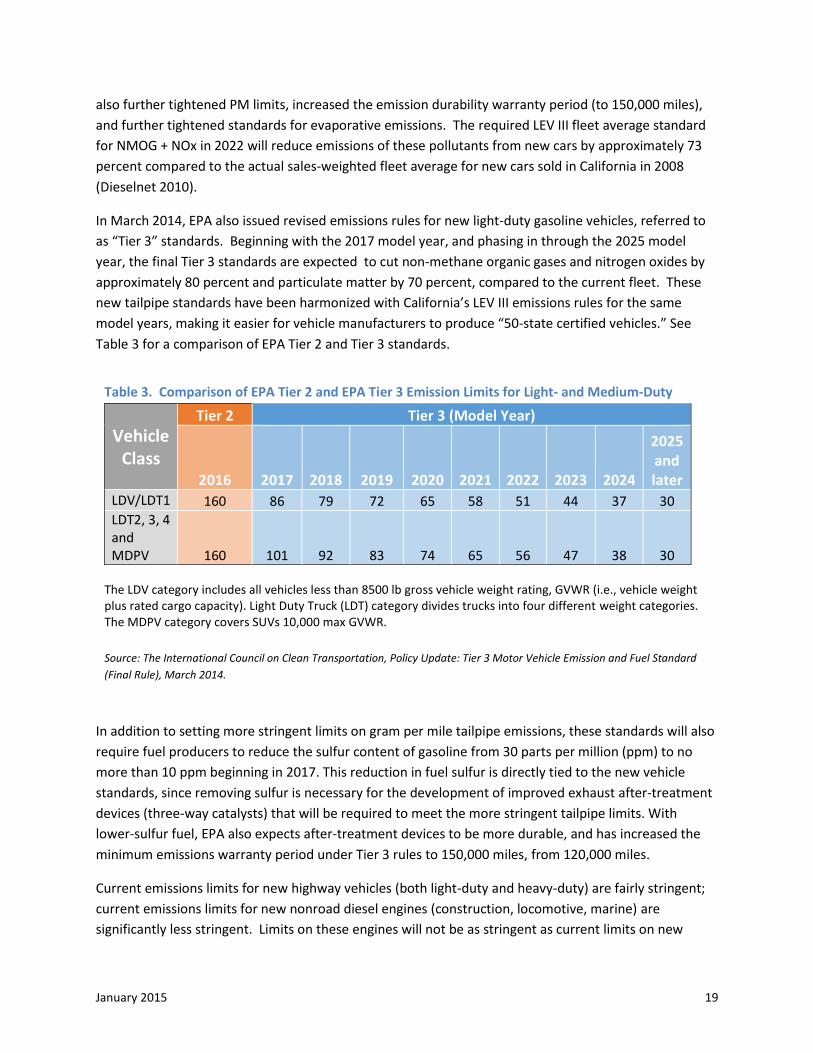
In March 2014, EPA also issued revised emissions rules for new light-duty gasoline vehicles, referred to
as “Tier 3” standards. Beginning with the 2017 model year, and phasing in through the 2025 model
year, the final Tier 3 standards are expected to cut non-methane organic gases and nitrogen oxides by
approximately 80 percent and particulate matter by 70 percent, compared to the current fleet. These
new tailpipe standards have been harmonized with California’s LEV III emissions rules for the same
model years, making it easier for vehicle manufacturers to produce “50-state certified vehicles.” See
Table 3 for a comparison of EPA Tier 2 and Tier 3 standards.
In addition to setting more stringent limits on gram per mile tailpipe emissions, these standards will also
require fuel producers to reduce the sulfur content of gasoline from 30 parts per million (ppm) to no
more than 10 ppm beginning in 2017. This reduction in fuel sulfur is directly tied to the new vehicle
standards, since removing sulfur is necessary for the development of improved exhaust after-treatment
devices (three-way catalysts) that will be required to meet the more stringent tailpipe limits. With
lower-sulfur fuel, EPA also expects after-treatment devices to be more durable, and has increased the
minimum emissions warranty period under Tier 3 rules to 150,000 miles, from 120,000 miles.
Current emissions limits for new highway vehicles (both light-duty and heavy-duty) are fairly stringent;
current emissions limits for new nonroad diesel engines (construction, locomotive, marine) are
significantly less stringent. Limits on these engines will not be as stringent as current limits on new
Table 3. Comparison of EPA Tier 2 and EPA Tier 3 Emission Limits for Light- and Medium-Duty
Vehicle Class
Tier 2 Tier 3 (Model Year)
2016 2017 2018 2019 2020 2021 2022 2023 2024
2025 and later
LDV/LDT1 160 86 79 72 65 58 51 44 37 30
LDT2, 3, 4 and MDPV 160 101 92 83 74 65 56 47 38 30
The LDV category includes all vehicles less than 8500 lb gross vehicle weight rating, GVWR (i.e., vehicle weight plus rated cargo capacity). Light Duty Truck (LDT) category divides trucks into four different weight categories. The MDPV category covers SUVs 10,000 max GVWR.
Source: The International Council on Clean Transportation, Policy Update: Tier 3 Motor Vehicle Emission and Fuel Standard
(Final Rule), March 2014.

20 January 2015
highway diesel engines until Tier 4 standards have been fully implemented in model year 2017 (see
Figure 9).
As vehicle fleets turn over to new, cleaner, vehicles, total emissions per vehicle and per mile are
significantly reduced. However, a lag in the imposition of stricter standards and slower turn-over rates
means that current diesel fleets – both highway trucks and nonroad equipment - are much “dirtier” than
the light-duty highway fleet, and will remain so for many years. When EPA proposed the light-duty Tier
2 regulations, they estimated that they would reduce NOx emissions from light-duty vehicles by 42
percent in 2010 and 61 percent in 2015, compared to a baseline projection without them (EPA 1999).
Due to slower turnover of the heavy-truck fleet, the EPA 2010 heavy-duty engine standards will take
longer to reduce diesel emissions; when EPA proposed the new rules, it estimated that it would take
until about 2025 before all highway truck miles would be operated with “clean” EPA 2010 compliant
trucks (EPA 2000). However, the national recession and slow recovery from 2008 to 2011 significantly
slowed the pace of fleet turnover compared to EPA’s projections. EPA’s original projection estimated
that by 2014, 40 percent of trucks and 70 percent of fleet miles would have turned over to clean trucks
but in fact, less than one third of heavy trucks now on the road are equipped with EPA 2010 compliant
engines (DTF 2014).
Locomotive and marine fleets will not even begin to turn over to the “cleanest” vehicles until 2015, and
will likely not turn over completely until 2045 or later.
Regulation of Aircraft
About 70 percent of aircraft engine emissions are CO2, and a little less than 30 percent are water vapor.
NOx, CO, sulfur oxides (SOx), VOC, particulates, and other trace components, including hazardous air
pollutants make up less than 1 percent each (FAA 2005). Current worldwide regulations target aircraft
emissions up to 3,000 feet (one kilometer) in the air. These regulations assume that anything emitted
above 3,000 feet would be deposited into a part of the atmosphere that has significantly smoother air,
meaning pollutants would not be affected by turbulent air that could mix them toward the ground.
Thus, even though 90 percent of aircraft fuel is burned at cruise altitudes, only those pollutants that are
emitted during takeoff and landing are regulated (MIT 2010).
As with other air pollutant emissions, aircraft emissions impact human health and contribute to
premature mortality. The adverse health impacts of aircraft emissions are primarily from fine
particulate matter. It is estimated that 8,000 global premature mortalities per year are attributable to
aircraft cruise emissions. This represents 1 percent of global air quality-related premature mortalities
from all sources (MIT 2010). In the U.S., roughly 160 annual premature mortalities are attributed to
aircraft emissions. One third of these are estimated to occur within the greater Southern California
region. Other health impacts related to particulate matter, such as chronic bronchitis, non-fatal heart
attacks, and respiratory and cardiovascular illnesses, are also associated with aircraft emissions (MIT
2009). Annual aircraft emissions in 2002 consisted of 73,153 metric tons of NOx and 1,948 metric tons
of PM 2.5, based on landing and takeoff emission inventories for the 148 commercial service airports in
U.S. nonattainment areas (MIT 2009).

January 2015 21
EPA regulates emissions from highway and nonroad engines under Title II of the Clean Air Act (42 U.S.C.
7401-7671q). EPA’s authority for setting aircraft engine emissions is contained in section 231 of Title II
(MIT 2009). In 2005, EPA published the most recent standards for NOx for new commercial aircraft
engines. These standards are equivalent to the NOx emission standards of the United Nations
International Civil Aviation Organization (ICAO), and took effect on December 19, 2005. The 2005 NOx
standards generally represent about a 16 percent reduction (or increase in stringency) from the earlier
NOx standards. These regulations apply to aircraft engines designed and certified after the effective
date on commercial aircraft, which includes small regional jets, single-aisle aircraft, twin-aisle aircraft,
and 747s and larger aircraft (EPA 2009a).
While EPA long ago required the removal of lead in gasoline used in cars and other land-based nonroad
equipment, the Agency is in the early stages of regulating the use of lead in gasoline sold for aviation.
Lead is not used in jet fuel, the fuel most commercial aircraft use. However, leaded aviation gasoline,
known as AvGas, is used in smaller piston-engine powered aircraft, which are generally used for
instructional flying, air taxi activities, and personal transportation. Lead emissions from aircraft using
AvGas make up approximately half of EPA’s national inventory of lead air emissions. EPA estimates that
between 1970 and 2007, 34,000 tons of lead were emitted by piston-engine powered aircraft.
Emissions of lead from aircraft are a health concern, particularly for populations living, working, or
attending school near airports. The health effects of lead, once inhaled or ingested, are especially
dangerous to children. Exposure to lead at an early age has been linked to effects on IQ, learning,
memory, and behavior. In 2008, EPA substantially strengthened the national ambient air quality
standards (NAAQS) for lead, finding that serious health effects occur at much lower levels of lead in
blood than previously identified (EPA 2010g).
In April 2010, EPA released an advance notice of proposed rulemaking (ANPR) on emissions of lead from
piston-engine powered aircraft. In this notice, EPA invited comment on the data available for evaluating
lead emissions, ambient concentrations, and potential exposure to lead from the use of AvGas. The
ANPR responded to a 2006 Friends of the Earth petition that urged EPA to make a finding that lead
emissions from general aviation aircraft endanger public health and welfare and issue a proposed new
emission standard (EPA 2010g). EPA granted a 60-day extension to the comment period for the ANPR
based on a request by a coalition of industry groups known as the AvGas Stakeholder Group (Lynch
2010). In June 2010, this group called on the Federal Aviation Administration (FAA) to lead a public-
private partnership for finding an unleaded replacement for AvGas based on its expected phase-out in
future EPA regulations (EEA 2010). Presently, the AvGas Stakeholders Group is working with the FAA,
EPA, and Congress on future aircraft fuels development (Lynch 2010). In addition, EPA is currently
reviewing airport-specific lead inventories for 2008.
Regulation of Fuel Economy & CO2 from New Vehicles and Engines
Since 1975, the fuel economy of new light-duty vehicles has been regulated by the National Highway
Traffic Safety Administration (NHTSA) under the Corporate Average Fuel Economy (CAFE) program.
Under CAFÉ, not all models sold need to have the same fuel economy; all new vehicle models are tested

22 January 2015
and each manufacturer has to meet a sales-weighted fleet average fuel economy target. Under this
system, manufacturers can sell cars that have worse fuel economy than the average target value as long
as they sell an equal number of cars with better fuel economy than the average.
Between 1978 and 1990, the CAFE fleet average standard for new cars was increased incrementally
from 18 miles per gallon (MPG) to 27.5 MPG – where it remained unchanged for the next twenty years
(through the 2010 model year). (DOE 2014)
In 2010, NHTSA and EPA issued a joint rulemaking that established the first regulations for both fuel
economy and GHG emissions from cars and light trucks. This new program applies to new cars and light
trucks from model year 2012 through 2016 using a mile per gallon fuel economy target and an
equivalent gram per mile CO2 emissions target. This program also extends the footprint concept to cars,
allowing larger vehicles to have lower fuel economy and correspondingly higher CO2 emissions. For
example, a typical compact car might have a footprint of 40 square feet, and the fuel economy target for
the 2016 model year would be 41.4 MPG (214 g CO2/mile), while a full-sized car might have a footprint
of 53 square feet and the fuel economy target would be 32.8 MPG (269 g CO2/mile). A large pickup or
SUV might have a footprint as large as 67 square feet – if so, the fuel economy target would be 24.7
MPG (358 g CO2/mile). Under this program, the overall light-duty fleet average fuel economy
requirement will rise to 34.1 MPG for model year 2016.
In 2012, EPA and NHTSA finalized new CAFE fuel economy and CO2 emissions targets that will apply to
model year 2017 through 2025 cars and light trucks; these standards will raise the required fleet average
fuel economy for cars and light trucks to 54.5 MPG in model year 2025 (White House, 2012).
In 2011, EPA and NHTSA also issued rules that will, for the first time, regulate the fuel economy and CO2
emissions from newly manufactured medium- and heavy-duty engines and vehicles. These “Phase 1”
standards apply to vehicles and engines in model year 2014 – 2019; EPA and NHTSA are currently
formulating “Phase 2” rules that will apply to vehicles and engines in model year 2020 and later – these
draft rules are expected to be issued in early 2015.
The efficiency standards for medium- and heavy-duty vehicles issued in 2011 are, in some ways, similar
to the 2010 joint CAFE program for light-duty vehicles that incorporated CO2 for the first time, but they
are markedly different in several key ways (EPA 2011a).
While both regulations establish fuel efficiency targets and equivalent CO2 emission targets by type of
vehicle, the metrics each use are quite different. The heavy truck standards include three main
regulatory categories: heavy-duty pickups and vans, combination trucks (truck tractors used to pull
trailers), and all other trucks, labeled as vocational trucks. The heavy-duty pickups and vans, and
combination truck, categories are each fairly homogenous, but the vocational truck category is diverse.
Vocational trucks include everything from buses to dump trucks to refuse trucks, in sizes ranging from
10,000 to more than 60,000 pounds gross vehicle weight.
Like light-duty CAFE, the heavy-duty regulations contain significant flexibility mechanisms such that not
every vehicle of the same type is required to have the same fuel economy. For heavy-duty pickups and
January 2015 23
vans, manufacturers must meet a sales-weighted fleet average, just as they do for cars and light-trucks
under CAFE. However, the combination truck and vocational truck categories do not have fleet-average
standards. For these vehicle types, flexibility is provided by an averaging, banking, and trading program
(ABT) and by various types of credit programs. This is very similar to the way EPA provides flexibility
when certifying heavy-duty engines to criteria pollutant emission standards.
As discussed above, CAFE sets “full vehicle” standards for cars and light trucks, expressed as a mile per
gallon fuel economy target and an equivalent gram per mile CO2 emissions target. Certification of
whether a vehicle does or does not meet the standard is based on laboratory-based vehicle testing in
which vehicles mounted on a chassis dynamometer are exercised over specific test cycles. This is also
how heavy-duty pickups and vans will be tested under the medium- and heavy-duty rules. However,
combination trucks and vocational trucks are treated differently – for these types of trucks, EPA and
NHTSA have established both engine and separate vehicle standards. The engine standards are
expressed as allowable fuel use and CO2 emissions per unit of engine work – gallons per 100 brake
horsepower-hour (gal/100 bhp-hr) and grams per bhp-hr. This is analogous to how EPA regulates
criteria pollutants (NOx, PM, VOC, and CO) from medium- and heavy-duty trucks, using engine rather
than vehicle standards. Certification to the engine fuel efficiency and CO2 emission standards will be
based on the same test cycles and engine test procedures used to certify engines to the criteria
pollutant standards.
The separate vehicle standards applied to combination and vocational trucks are not expressed as mile
per gallon and gram per mile standards. Rather, they are expressed as allowable fuel use and CO2
emissions per 1,000 tons of payload-driven miles (gallons/1,000 ton-mi and grams/1,000 ton-mi),
recognizing that most heavy-duty vehicles are used to haul freight. In addition, certification of these
vehicle standards will not be based on actual vehicle testing. Certification will instead be based on
modeling using a computer simulation program (GEM), which EPA developed for these regulations.
Table 3 summarizes EPA and NHTSA’s assessment of how fuel use from medium- and heavy-duty trucks
compliant with the Phase 1 standards will compare to model year 2010 trucks. As shown, the most
stringent standards apply to combination trucks, and the least stringent apply to vocational trucks.
Virtually all trucks will be required to have more efficient engines, though most of the changes will be
internal to the engine and will not be apparent to the casual observer. To meet the Phase 1 standards
many vocational trucks will also need to be equipped with low rolling resistance tires.
The changes to combination trucks will be more significant, including most importantly, improvements
to vehicle aerodynamics, as well as some limited efforts to reduce vehicle weight and implementation of
auxiliary power units to reduce overnight idling for many sleeper cab-equipped trucks.

24 January 2015
Table 3. EPA Phase 1 Fuel Efficiency Standards – Reduction in Fuel Use Compared to Model Year 2010
Vehicle Type Model Year→ 2014 2015 2016 2017 2018 2019
Heavy-duty Pickups
and Vans
Gas 1.5% 2.0% 4.0% 6.0% 10.0%
Diesel 2.3% 4.5% 6.8% 9.0% 10.0%
Vocational Trucks Engines 3% – 5% 1 5% – 9% 1
Vehicles 4% – 6% 1 6% – 9% 1
Combination Trucks Engines 3% 6%
Vehicles 7% – 21%2 10% – 23%2
1 Varies depending on engine size: light-medium, medium-heavy, or heavy-duty
2 Varies depending on cab type. The highest reductions will be from high-roof sleeper cab trucks. Lower
reductions will be needed from low-roof sleeper cab and from day cab equipped trucks.
EPA does not expect that advanced transmissions and/or hybrid-electric drive systems will be required
for any trucks to meet the Phase 1 standards, though they will give manufacturers credit under the ABT
program for selling more efficient vehicles than required, which incorporate these advanced
technologies.
Production of Transportation Fuels In 2013, petroleum-based products accounted for 92 percent of the energy consumed by the
transportation sector. As shown in Figure 10, renewables and natural gas accounted for almost 8
percent, and electricity accounted for less than one half percent of energy consumed by the sector.
About 64 percent of the petroleum was consumed in the form of gasoline, about 21 percent in the form
of distillate fuel oil (diesel fuel), and about 11 percent in the form of jet fuel. The remainder of
petroleum-based energy consumed by the transportation sector was in the form of residual fuel oil and
other petroleum products (DOE 2014).

January 2015 25
Given its dominance in the
market, this section focuses
on the impacts of petroleum-
based fuel production. The
next section discusses recent
trends in the transportation
sector, including the growth
of biofuels and the increased
focus on electric vehicles.
Petroleum Extraction
Crude oil is removed from the
ground by drilling deep wells
and pumping it up to the
surface. The crude oil is then
transported to a refinery
where it is refined into a
number of fuel products. Air
pollutants, particularly methane and other impurities in the crude, can be vented to the atmosphere
(intentionally or unintentionally) and impact air quality. Additionally, the large engines used in drilling,
production, and transportation processes burn natural gas or diesel and produce emissions that can
particularly impact local communities.
In addition to the impacts on local air quality due to petroleum extraction, site accidents can result in
significant releases of oil to the environment, threatening air and water quality, as well as sensitive
ecological areas on land. The Deepwater Horizon accident in the summer of 2010 provided a clear
example of the magnitude of the harm that can be caused by an accident at a petroleum extraction site.
The Deepwater Horizon event occurred at a time when oil industry experts and government officials
were assuring the public about the safety of deepwater oil drilling.
Refining
Petroleum refining is an energy intensive process that uses physical, thermal, and chemical processes to
separate crude oil into its major fractions, which are then processed further into finished petroleum
products. Fuels account for almost 90 percent of the petroleum products produced in the U.S., while
finished products and petrochemical feedstocks each account for about 5 percent (STAPPA 2006).
The petroleum refining industry consumes large amounts of energy from byproducts of the refining
process. About 65 percent of the energy it consumes for heat and power comes from refinery gas,
petroleum coke, and other oil-based byproducts. The combustion of these and other fossil fuels
(primarily natural gas) produces a significant amount of air pollution, including fine particulates, SO2,
NOx, and air toxics.
92%
4.60%
2.90%
0.30%
Petroleum
Rewables
Natural Gas
Electricity
Figure 10. 2012 Energy
Consumption by the Transportation Sector (DOE 2014)

26 January 2015
In addition to the emissions from onsite energy consumption, the refining process results in the release
of air pollutants. Of particular concern are air toxics released in the catalytic cracking process. These air
toxics vary by facility and process operations but may include: acetaldehyde, arsenic, antimony,
benzene, beryllium, cadmium compounds, carbonyl sulfide, carbon disulfide, chlorine, dibenzo furans,
formaldehyde, hexane, hydrogen chloride, lead compounds, mercury compounds, nickel compounds,
phenol, 2,3,7,8 tetrachlorodibenzo-p-dioxin, toluene, and xylenes (mixed) (EPA 2001). The health
effects associated with exposure to these air toxics can include cancer, respiratory irritation, and
damage to the nervous system.
Table 4 summarizes the major sources and the primary air pollutants of concern.
There are 139 refineries operating in the U.S. with 3 currently idle. These refineries have a capacity of
17.9 million barrels per day. Refineries are geographically concentrated. Texas, Louisiana, and
California are home to 45 percent of U.S. refineries and 57 percent of U.S. refining capacity (See Table
5). The next largest state by capacity is Illinois with 6 percent of capacity from four refineries (EIA 2014).
Table 4. Major Air Emissions Sources at Petroleum Refineries
Combustion Device
Description Typical Fuel Primary Emissions of
Concern
Industrial Boilers
On average smaller than boilers used for electricity generation, industrial boilers provide onsite steam and electricity to industrial facilities. Across the industrial sector, industrial boilers are the largest source of air emissions.
Petroleum Byproducts, Natural Gas
SO2, NOx, PM, Air Toxics (dependent on fuel source)
Process Heaters
A process heater is an enclosed device in which solid, liquid, or gaseous fuels are combusted for the purpose of heating a process material (e.g., crude oil).
Oil, Byproduct Refinery Gases, Natural Gas
SO2, NOx, PM, Air Toxics
Catalytic Cracking Units
Process unit that breaks down (cracks) longer chain molecules into smaller ones by heating and using catalysts.
Byproduct Refinery
Gases, Natural Gas Air Toxics, VOCs, SO2, NOx, PM
Flares
Petroleum refineries use flares to combust vapors, rather than discharging them to the atmosphere. Frequent flaring in routine, non-emergency situations or to bypass pollution control systems can produce excess emissions and violate permit conditions.
Refinery Process or Waste Gases
SO2, NOx, PM, VOCs, Air Toxics

January 2015 27
Table 5. Top Three States by Refining Capacity in the U.S. (EIA 2014)
Total
Refineries
Percent of U.S.
Refineries
Capacity (Barrels per
day)
Percent of U.S.
Capacity
Texas 27 19% 5,174,209 29%
Louisiana 19 13% 3,274,520 18%
California 18 13% 1,960,671 11%
Other States 78 55% 7,515,230 42%
U.S. Total 142 100% 17,924,630 100%
Transport and Storage
From the refinery, the majority of petroleum products are transported by pipeline to storage facilities.
From there, tanker trucks distribute gasoline and other products to consumers. The transport and
storage of petroleum products can lead to emissions of volatile organic compounds (VOC). These
emissions are broadly categorized as loading losses and breathing losses. Loading losses occur as the
product is transferred from one container to another, and organic vapors from an empty tank are
displaced by the liquid being loaded in the tank (e.g., from pipeline to storage, from storage to tanker,
from gas pump to vehicle). Breathing losses occur as tank vapor space expands and contracts in
response to daily changes in temperature and barometric pressure. Breathing losses occur in the
absence of any liquid level change in the tank.
The gasoline distribution system is a source of VOC emissions, and is listed as an area source that
contributes to urban emissions of hazardous air pollutants in EPA’s Integrated Urban Air Toxics Strategy
Assessment. EPA found that gasoline vapors contain two hazardous air pollutants: benzene and
ethylene dichloride (EDC). The benzene contributions from the gasoline distribution system are about
36 percent of national urban emissions, and the ethylene dichloride are about 2 percent of national
urban emissions. EPA subsequently concluded that ethylene dichloride emissions had been eliminated
from this source category through the removal of lead from gasoline. EDC had been added to leaded
gasoline to serve as a lead scavenger and prevent the unwanted buildup of lead deposits in engines
(Federal Register 2008).
In January 2008, EPA finalized a rule to reduce emissions of air toxics emissions for area source gasoline
distribution facilities that include the pipelines and terminals that distribute gasoline to the end user,
but also include end users such as service stations, farms, rental car agencies, and automobile
manufactures. The rules require best available seals on storage tanks and pipelines, use of submerged
fill pipes, leak testing, and best practices to prevent evaporative emissions (Federal Register 2008).
Separately, EPA finalized a rule to reduce emissions from gasoline dispensing facilities that requires
installation of vapor detection and reduction systems (Federal Register 2008a).

28 January 2015
U.S. Production versus Imports
In 2013, the U.S. imported roughly 33
percent of the crude oil and refined
petroleum products that it consumed (DOE
2014). The top five source countries of U.S.
petroleum imports are Canada, Mexico,
Venezuela, Saudi Arabia, and Nigeria. As
shown in Figure 11, in 2013, 32 percent of
petroleum used in the U.S. was imported
from Canada, and 9 percent was imported
from Mexico. The category listed as “Other”
includes Russia (5 percent), as well as
Bahrain, Iran, Iraq, Kuwait, Qatar, United
Arab Emirates, and the Neutral Zone
(between Kuwait and Saudi Arabia) (DOE 2014). In 2013, the U.S. imported about 10 million barrels of
petroleum products a day and exported about four million barrels per day (EIA 2014a).
Transportation Funding System
The United States has adhered to the “user fee principle” in financing its transportation infrastructure
for more than 50 years. Under this principle, users of highways pay for the construction and
maintenance of roads. The federal government relies heavily on a fuel tax to support the cost of its
highway system, and revenues from the tax go into the federal Highway Trust Fund (Huang et al. 2010).
The Highway Trust Fund holds taxes collected on motor fuels and truck-related taxes, including taxes on
gasoline, diesel fuel, gasohol, and other fuels; truck tires and truck sales; and heavy vehicle use. In 1983,
the fund was divided into the Highway Account and the Mass Transit Account. More than 80 percent of
the total fund is directed to the Highway Account, including a majority of the fuel taxes, as well as all
truck-related taxes (GAO 2010). Table 6 summarizes the various taxes and the distribution of each.
Periodically, Congress enacts multi-year legislation that authorizes funding for the nation’s surface
transportation programs. In 2005, the Safe, Accountable, Flexible, and Efficient Transportation Equity
Act: A Legacy for Users (SAFETEA-LU) authorized over $190 billion for a “Federal-Aid Highway Program”
for fiscal years 2005 through 2009. The Highway Trust Fund is the principal source of funding for this
authorization.
In 2012, Congress finally adopted a new law to authorize funding for these programs: the Moving Ahead
for Progress in the 21st Century Act, known as MAP-21. Congress made no change to the highway user
tax rates. (FHWA, 2013). However, the authorization for transportation included in the law dropped to
$105 billion for FY 2013 and FY 2014. In 2014, Congress passed the Highway and Transportation Funding
Act of 2014, which extended authorization under MAP-21 through to May 2015 (FHWA, 2014).
Because the Federal-Aid Highway Program operates on a user-pay system, wherein users contribute to
the building and upkeep of the system, states have taken a strong interest in the rate of return on
Figure 11. Percentage of Gross U.S. Petroleum Imports by Country, 2013
32%
9%14%8%3%
34%
Canada
Mexico
Saudi Arabia
Venezuela
Nigeria
Other

January 2015 29
contributions. The way funding has been distributed among states has been contentious. States that
receive less than the estimated contributions of their highway users are known as “donor” states.
States that receive more than the estimated contributions of their highway users are known as “donee”
states (GAO 2010).
Table 6. Federal Highway Excise Tax Rates and Related Allocations to the Accounts of the Highway Trust Fund (GAO 2010)
Motor Fuel Taxes
Type of Excise Tax Tax Rate (cents)
Distribution of Tax
Highway Account,
Highway Trust Fund
(percent)
Mass Transit Account,
Highway Trust Fund
(percent)
Leaking Underground
Storage Tank Trust
Fund (percent)
Gasoline 18.4 per gallon 83. 9 15.5 0.5
Diesel 24.4 per gallon 87.9 11.7 0.4
Gasohol 18.4 per gallon 83.9 15.5 0.5
Liquefied Petroleum
Gas 18.3 per gallon 88.4 11.6 0.0
Liquefied Natural Gas 24.3 per gallon 92.3 7.7 0.0
M85 (from natural gas) 9.25 per gallon 83.5 15.5 1.1
Compressed Natural
Gas
144.47 per
thousand cubic
feet
93.3 6.7 0.0
Truck-related Taxes — All Proceeds to Highway Account
Tires 9.45 cents for each 10 pounds of the maximum rated load capacity over 3,500 pounds
Truck and Trailer Sales 12 percent of retailers sales price for tractors and trucks over 33,000 pounds gross vehicle
weight (GVW) and trailers over 26,000 pounds GVW
Heavy-vehicle Vse Annual Tax for trucks 55,000 pounds and over GVW: $100 plus $22 for each 1,000 pounds
(or fraction thereof) in excess of 55,000 pounds. Maximum tax: $550
The Federal Highway Administration, within the Department of Transportation, administers the Federal-
Aid Highway Program and distributes most funds to the states through annual apportionments
established by statutory formulas. Once the Federal Highway Administration apportions these funds,
the money is available for states to allocate for construction, reconstruction, and improvement of
highways and bridges on eligible federal-aid highway routes, as well as for other purposes authorized in
law. The amount of federal funding made available through the Federal-Aid Highway Program ranged
from $34.4 to $43.0 billion per year for fiscal years 2005 through 2009 (GAO 2010).
The demand for new roads and the cost of expanding and maintaining the transportation system have
increased with population and economic growth. However, the current “user-fee” funding mechanism
fails to meet the nation’s current demands. In recent years, tax revenues have been unable to cover the
costs of maintaining and improving the existing system. In addition, the increased fuel efficiency of
motor vehicles has resulted in less fuel consumption per mile and thus, fewer tax dollars for the same
amount of road use.
Policymakers have dealt with funding gaps in various ways, though rarely by raising federal gasoline
taxes and other user fees. Some states have issued bonds or raised sales taxes through local referenda

30 January 2015
approved by voters. Despite growing budgetary problems, state and federal governments have reached
into their general funds to fill this gap. The federal Highway Trust Fund, after being financially
independent for more than 50 years, now relies on transfers from the general funds to stay solvent
(Huang et al. 2010).
From fiscal years 2008 through 2010, Congress transferred a total of $34.5 billion in additional general
revenues into the Highway Trust Fund. This means that, to a large extent, funding has shifted away
from the contributions of highway users, breaking the link between highway taxes paid and benefits
received by users. For many states, the share of Highway Trust Fund contributions and general revenue
contributions are different, therefore state-based contributions to all the funding in the Trust Fund have
become complicated. In addition, since March 2009, the American Recovery and Reinvestment Act of
2009 (ARRA) apportioned an additional $26.7 billion to the states for highways — a significant
augmentation of federal highway spending that was funded with general revenues (GAO 2010).
Passed in 1991, the Intermodal Surface Transportation Efficiency Act (ISTEA) attempted to integrate
public transit into the federal transportation policy framework. However, some modes of surface
transportation remain outside these federal policies. Intercity passenger rail, for example, continues to
be addressed in separate authorization bills, despite many parallels to the federal role with respect to
highways (BPC 2009).
Public Transit
The total budget for all of the nation’s public transportation systems was $55.5 billion in 2008, with
$17.5 billion for capital investment and $38 billion for operating expenses. Total fares collected for
public transit service and other agency earnings only covered 37.7 percent of annual operating
expenses. The federal government, through the Federal Transit Administration, provided 7 percent of
operating funds and 39.9 percent of capital funds required to purchase or renew rolling stock and other
infrastructure. Federal funding for public transportation comes from the Mass Transit Account of the
Highway Trust Fund (see above), and is appropriated under multi-year omnibus transportation bills
(currently MAP-21). The remaining 55.3 percent of annual operating funds and 60.1 percent of capital
funds were provided by city and state governments, generally via some type of sales tax (APTA 2010).
A survey released in April 2010 by the American Public Transportation Association indicated that U.S.
transit systems faced severe economic pressures due to declining state and local tax revenues
precipitated by the recession of 2008 and 2009. The survey indicates that since January 2009, 59
percent of public transit systems have cut service or raised fares in response to falling subsidies. An
additional 25 percent of agencies are considering cutting service or raising fares in the future. Of those
agencies that have made cuts, 56 percent have cut rush hour service, 62 percent have cut off-peak
service, and 40 percent have reduced their geographic coverage (APTA 2010).
Intercity Passenger Rail
As part of a strategy to prevent the collapse of the nation’s railroads, the federal government took over
passenger operations with the creation of Amtrak in 1971, allowing the remaining railroads to focus on
shipping freight. However, it has proved difficult for Amtrak to provide financially viable national

January 2015 31
passenger rail service or to attract sufficient resources to maintain and operate their existing system.
Amtrak has been forced to incur debt and defer maintenance on its own infrastructure, which has
resulted in a dependence on Congressional appropriations.
Despite several attempts, no effort had successfully reformed the nation’s passenger rail policy or
integrated it with broader transportation policies and objectives (BPC 2009). However, using the
Passenger Rail Investment and Improvement Act passed in 2008 and the American Recovery and
Reinvestment Act in 2009, the Obama Administration used the economic recession to begin funding
increased passenger rail. In January 2010, $8 billion in ARRA funding was allocated to the first projects,
including high-speed rail between Orlando and Tampa, Florida. On October 28, the Secretary of
Transportation announced a second phase, totaling $2.4 billion.
Airports
Every two years, the Federal Aviation Administration (FAA) is required to provide Congress with the
National Plan of Integrated Airport Systems (NPIAS), which includes a five-year estimate of funding
needed to support airport development and improvement. The NPIAS identifies nearly 3,400 existing
and proposed airports that are significant to national air transportation and thus eligible to receive
federal grants under the Airport Improvement Program (AIP). It also includes estimates of the amount
of money needed to fund infrastructure development projects that will bring these airports up to
current design standards and add capacity to congested airports.
Through the Airport Improvement Program, FAA awards grants to public agencies (and, in some cases,
to private owners and entities) for the planning and development of public-use airports. Large and
medium primary hub airports can receive funding for 75 percent of eligible costs (or 80 percent for noise
program implementation). Small primary, reliever, and general aviation airports can receive funding for
95 percent of eligible costs. Eligible projects include those improvements related to enhancing airport
safety, capacity, security, and environmental concerns. Any professional services that are necessary for
eligible projects — such as planning, surveying, and design — are eligible. Aviation demand at the
airport must justify the projects, which must also meet federal environmental and procurement
requirements. Projects related to airport operations and revenue-generating improvements are
typically not eligible for funding. Operational costs — such as salaries, equipment, and supplies — are
also not eligible for AIP grants (FAA 2010).
The Airport Improvement Program was established by the Airport and Airway Improvement Act of 1982.
Funds obligated for the program are drawn from the Airport and Airway Trust fund, which is supported
by collections related to passenger tickets, passenger flight segments, international arrivals/departures,
cargo waybills, aviation fuels, and frequent flyer mile awards from non-airline sources like credit cards
(FAA 2009).
Marine
The Maritime Administration, within the Department of Transportation, manages federal programs
designed to promote the use of waterborne transportation and its integration with other segments of
the transportation system. Among its programs are the Federal Ship Financing Program, which provides

32 January 2015
loan guarantees to ship owners and shipyards to modernize the U.S. marine fleet. Vessels eligible for
assistance generally include commercial vessels such as ferries; bulk, container, and cargo vessels;
tankers; tugs; towboats; barges; dredges; oceanographic research vessels; floating power barges;
offshore oil rigs and support vessels; and floating dry-docks. Additionally, the Maritime Administration
manages a construction reserve fund, capital construction fund, and small shipyard grant program that
provide resources to expand and improve U.S. maritime operations. Under the small shipyard grant
programs, the federal government provides funding for 75 percent of a project with 25 percent
matching funds from the shipyard. The American Recovery and Reinvestment Act included $100 million
for the program, up from $10 million in 2008 (Maritime 2009).
This year, the Department of Transportation initiated America’s Marine Highway Program, an initiative
to move more cargo on the water rather than on highways. On August 11, 2010, the Transportation
Secretary identified 18 marine corridors, eight projects, and six initiatives for further development. The
goal of the program is to identify routes where water transportation presents an opportunity to offer
relief to landside corridors that suffer from traffic congestion, excessive air emissions or other
environmental concerns, and other challenges. The Maritime Administration made available $7 million
for this program. Projects will be able to compete for this funding through a Notice of Funding
Availability (DOT 2010b).
Recent Trends in Onroad Vehicles
The vast majority of light-duty vehicles on the road today, as well as new vehicles being purchased, are
powered by conventional gasoline engines and operate on petroleum-derived gasoline fuel. Over the
past 20 years, various alternative fuels and engine/drive train technologies have been developed and
promoted for both light-duty and heavy-duty vehicles.
Some of these alternative fuels and technologies have the potential to reduce emissions of NOx, PM,
and VOCs from transportation sources, but many are more specifically targeted toward reducing CO2
emissions and reducing petroleum use. Efforts to reduce petroleum use in the transportation sector are
intended to enhance energy security by using locally produced energy sources rather than imported
petroleum.
This section discusses the current status and potential benefits of the most significant of these
alternative fuels and technologies, including natural gas, bio-derived fuels, electric vehicles, and
hydrogen fuel cell vehicles.
Alternative Fuels
With relatively minor modifications, a gasoline engine (i.e., a spark-ignited, homogenous charge internal
combustion engine) can operate on a range of volatile fuels, including natural gas, an alcohol such as
ethanol or methanol, or a blend of petroleum-derived gasoline plus an alcohol.
Alternative transportation fuels including natural gas and bio-derived fuels, such as biodiesel and E85
ethanol, have grown in use in the past decade. In 2011, they accounted for 11 percent of the fuel used
for transportation; all alternative fuels together totaled 9,990 million gasoline-equivalent gallons, 1,426

January 2015 33
million of which were non-ethanol fuels.9 That remains a small percentage compared to 90 billion
gallons of gasoline consumed. (DOE 2014).
Natural Gas
Natural gas engines can be used to power both light-duty vehicles and heavy-duty trucks. For light-duty
vehicles, natural gas engines are virtually identical to gasoline engines. A number of companies convert
gasoline cars to natural gas or bi-fuel operation by adding a natural gas fuel system and making minor
modifications to the engine (NGVAmerica 2010). Bi-fuel vehicles have both a natural gas fuel system
and a gasoline tank and can operate on either fuel.
Diesel engines are less easily converted to natural gas because the ignition systems differ. Natural gas
generally requires a spark ignition system, while diesel engines use compression ignition with no spark
plug. Purpose-built heavy-duty natural gas engines are typically based on diesel engine designs but with
a spark ignition system designed in by the manufacturer. In the last five years, there was also one
manufacturer selling new natural gas engines designed to operate with diesel pilot ignition; both natural
gas and a small amount of diesel fuel are injected into the cylinder after the intake air has been
compressed and ignition of the diesel ignites the natural gas. However, in October 2013, the
manufacturer discontinued sales of this large engine targeted to Class 8 trucks due to low demand
(HDT 2014).
There are also several manufacturers selling retrofit kits designed to convert existing onroad and
nonroad diesel engines to dual-fuel (diesel-natural gas) operation. These systems inject natural gas into
the air intake system of the engine, while reducing the amount of diesel fuel injected into the cylinder,
effectively relying on ignition of the diesel fuel to ignite the natural gas. The relative amount of natural
gas used compared to diesel depends on engine load – at idle and low load only a small amount of gas is
injected, while at higher loads, only a small amount of diesel is injected and a significant percentage of
total energy is supplied by natural gas. Depending on vehicle duty cycle, 50 to 70 percent of total fuel
use (on an energy basis) is natural gas and 30 to 50 percent is diesel (NATG 2014).
Natural gas vehicles (NGV) require a fuel storage/delivery system composed of high-pressure gas
storage cylinders, gas pressure regulator(s), and gas shut-off solenoid(s). Currently, there are two
different standards used in the U.S. for maximum fuel system pressure: 3,000 pounds per square inch
(psi) and 3,600 psi. The most significant difference between NGVs and gasoline or diesel vehicles is the
equipment and process required to fill the fuel tank. A natural gas fuel station is usually supplied with
fuel from a utility pipeline, and includes a compressor to raise the pressure of the gas from distribution
pressure to either 3,000 psi or 3,600 psi.
Recently, there has also been increased interest in the use of liquefied natural gas (LNG) for
transportation applications, including long-haul tractor-trailer trucks, locomotives, and marine vessels.
LNG is a cryogenic liquid (-260 degrees Fahrenheit) and must be stored in specially insulated containers.
9 A gasoline-equivalent gallon is an amount of fuel that contains the same amount of energy as one gallon of gasoline (approximately 115,000 Btu).

34 January 2015
Production, handing, and storage of LNG is more complicated and more costly than compressed natural
gas (CNG), but LNG has twice the energy density of CNG at 3,600 psi, so LNG vehicles can have a longer
range between fill-ups. For certain vehicle types, LNG is more practical than CNG despite its higher cost.
Most recent estimates show that that there were more than 188,200 natural gas cars, pickups, and vans
on the road in 2011 (DOE 2014). Of these vehicles, only 40 percent were dedicated natural gas vehicles,
and the rest were bi-fuel vehicles. The vast majority of these vehicles are owned by federal, state, and
local governments and by natural gas fuel providers; 60 percent of these vehicles are operated in
California, Arizona, Texas, and New York.
Refueling natural gas-powered vehicles requires access to a retail natural gas fueling station. In 2014,
there were 156,000 U.S. retail outlets selling gasoline, but only approximately 1,375 locations in the U.S.
sold fuel for natural gas vehicles. Many of those sites are private fleet fueling locations and not available
to the public. The highest concentrations of natural gas fueling stations are in California (331) and New
York (113) (DOE 2014c).
Twelve years ago, there were 18 models of light-duty dedicated natural gas and bi-fuel (gasoline/natural
gas) vehicles available from major auto manufacturers for sale in the U.S., including a number from the
Ford Motor Company (DOE 2007). After losing most models in the intervening years, until only one
remained in 2010 (the Honda Civic GX), the number has started to increase again.
For model year 2014, there are four light-duty NGVs available from a major auto manufacturer: the
Chevrolet Express 2500/3500; the GMC Savannah 2500/3500; the GMC Savannah 3500/4500 Cutaway;
and the Honda Civic. In addition, there are 16 capable or bi-fuel natural gas models, including five
pickups (DOE 2014).
All natural gas vehicles have zero evaporative emissions because the high pressure fuel system is sealed
to the atmosphere.10
Natural gas engines have approximately the same efficiency as gasoline engines but due to the lower
carbon content of natural gas, they produce approximately 25 percent lower CO2 emissions per mile.
Today, there are only three companies making and selling dedicated heavy-duty natural gas engines into
the U.S. onroad market: Cummins, Westport, and Doosan Infracore. A fourth company, Emissions
Solutions, remanufactures Navistar DT466 diesel engines to operate on natural gas (NGVAmerica 2010).
Most truck manufacturers offer Cummins natural gas engines as an option in various types of new
trucks, including transit buses, refuse trucks, and work trucks. The other engines are primarily used in
re-powers and conversions of existing diesel trucks.
10 Gasoline vehicles must have a fuel system that is “open” to the atmosphere or fuel could not be drawn from the tank. Modern cars use filters to capture and re-use gasoline vapors that evaporate from the fuel tank, but some vapors do escape, which contributes to total VOC emissions from transportation.

January 2015 35
The Department of Energy estimates that there were 18,949 natural gas trucks and 22,931 natural gas
buses in service in 2011 (EIA 2013). Of these vehicles, 64 percent were dedicated natural gas vehicles
and the rest were bi-fuel vehicles.
New model year 2010 and later heavy-duty natural gas engines are certified to the same emission
standard as new heavy-duty diesel engines (0.01 g/bhp-hr PM and 0.02 g/bhp-hr NOx) and have
approximately the same emissions per mile. New heavy-duty natural gas engines are no cleaner than
new diesel engines – both have very low emissions – but they get there in different ways. New diesel
engines achieve these low levels of emissions by employing two types of “after-treatment” – a diesel
particulate filter (DPF) to remove and destroy PM and selective catalytic reduction (SCR) to reduce NOx.
New heavy-duty natural gas engines have inherently low PM emissions, and they use an automotive
three-way catalyst (similar to those used on gasoline cars) to achieve low NOx emissions.
Heavy-duty natural gas engines are not as efficient as diesel engines, and natural gas trucks and buses
typically use more fuel energy per mile than diesel trucks and buses. Testing has shown that per-mile
CO2 emissions from natural gas buses range from 6 percent to 30 percent lower than CO2 emissions
from diesel buses (SAE 2004).
Ethanol
The U.S. is the largest producer and user of ethanol fuel in the world. Most ethanol in the U.S. today is
produced from corn. Other countries such as Brazil use sugarcane to produce ethanol. A starchy
biomass such as corn requires enzymes to convert the starch to simple sugars and yeast to ferment the
sugars to produce ethanol (NREL 2007).11 There are also many companies working to perfect processes
to produce “cellulosic ethanol” from fibrous sources such as grass or wood chips. Cellulosic biomass
also contains sugars, but they are much harder to release and ferment. Cellulosic biomass requires
more pre-treatment than starchy biomass, to allow for effective fermentation (NREL 2007).
Much of the gasoline sold in the U.S. today has up to 10 percent ethanol blended into it. This is done for
one of two reasons: 1) the ethanol acts as an oxygenate in reformulated gasoline (RFG), or 2) the
ethanol allows refiners to comply with renewable fuel mandates.
The addition of fuel-borne oxygen in gasoline helps cars to run cleaner, reducing NOx, VOC, and CO (EPA
2010a). The Clean Air Act requires counties plus the District of Columbia, in noncompliance with
ambient air quality standards for ozone, to burn “reformulated gasoline” (RFG). However, states have
opted into the program for counties, or can add counties to those required in that state.12 By law, RFG
must include 2 percent or 2.7 percent oxygen by weight (depending on location); since the use of MTBE
11 Ethanol is the alcohol that exists in alcoholic beverages. The production process for ethanol fuel is similar to the production of distilled spirits.
12 The current mandatory areas are in these states: California, Connecticut, Delaware, DC, Illinois, Indiana, Maryland, New Jersey, New York, Pennsylvania, Texas, Virginia, and Wisconsin; Opt-in: Georgia, Kentucky, Maine, Missouri, Massachusetts, New Hampshire, and Rhode Island. The current lists can be found at: http://www.epa.gov/OMS/fuels/gasolinefuels/rfg/regulations.htm.

36 January 2015
was outlawed in 2007, ethanol has become the primary oxygenate used in RFG. To achieve the 2
percent oxygen requirement, approximately 5.7 percent ethanol is required; to achieve the 2.7 percent
oxygen requirement, approximately 7.7 percent ethanol is required.
The Energy Policy Act of 2005 mandated that U.S. refiners use increasing amounts of “renewable fuels”
in motor gasoline and diesel between 2006 and 2012 in order to enhance U.S. energy security. Refiners
were required to sell four billion gallons of renewables in 2006, with the mandate increasing to 7.5
billion annual gallons in 2012 (Holt 2006). This mandate has increased the use of ethanol in gasoline
even in areas not required to use RFG.
In 1997, some manufacturers began selling “flex fuel” vehicles designed to operate on either gasoline or
an E85 blend of 85 percent ethanol and 15 percent gasoline. In the 2014 model year, there were 90
models of flex fuel E85 vehicles available from major auto manufacturers, mostly large sedans, pickups,
SUVs, and mini-vans (DOE 2014). The DOE Energy Information Administration’s website cites IHS Polk
estimates that in 2014, there were 17.4 million E85 vehicles on the road but only 800,000 of them
routinely operated on E85, with the remainder being fueled primarily by gasoline (DOE 2014d, DOE
2014e). In 2012, there were 156,000 U.S. retail outlets selling gasoline, but there were only 2,497
locations in the country where one could get E85 fuel (1.6 percent), and some of these sites are fleet
fueling locations that are not available to the public (DOE 2014c).
The use of ethanol as a transportation fuel increased from 1.95 billion gallons in 2003 to 8.7 billion
gallons in 2011. In 2011, about 2 percent of this ethanol was used in E85 blends – 98 percent was
blended into standard gasoline and RFG (DOE 2014).
Most of the E85 flex fuel vehicles on the market in 2014 were certified by EPA to achieve EPA Tier2/Bin 5
emission standards (fleet average). Virtually all these vehicle models come with various engine options,
including both larger and smaller engines, and both flex fuel and gasoline-only engines. Comparing the
flex fuel and gasoline only options for these vehicles, it is clear that the flex fuel engines do not provide
significant reductions in NOx, PM, and tail pipe VOC emissions compared to gasoline engines when
operated on E85. However, E85 is less volatile than gasoline, which results in fewer evaporative
emissions (VOC) from the vehicle fuel system. According to EPA, using E85 also reduces carbon
monoxide emissions and provides significant reductions in emissions of many harmful toxics, including
benzene, but increases emissions of acetaldehyde – another toxic pollutant. EPA is conducting
additional analysis to expand understanding of the emissions impacts of E85 (EPA 2009d).
In many cases, the flex fuel version of the vehicle and the version with the same sized (displacement)
gasoline engine are certified as having equivalent emissions. Similarly, there are gasoline versions of the
vehicle certified to be cleaner than the flex fuel version – i.e., meeting ULEV or SULEV standards –
though the cleaner version may have a slightly smaller engine (EPA 2010c).
As discussed above, the push in the U.S. toward alternative vehicle fuels has been billed as both a way to
reduce greenhouse gas emissions and improve energy security. On the greenhouse gas emissions side,
there has been increasing attention from the environmental community on the lifecycle impacts
associated with using corn as the primary feedstock for ethanol in the U.S. Skeptics of the benefits of

January 2015 37
corn-based ethanol point to the significant greenhouse gas emissions that are released as corn is
farmed, harvested, and processed into ethanol.
As a way to capture the impact of these upstream emissions, California is finalizing a Low Carbon Fuel
Standard for vehicle fuels that mandates a 10 percent reduction in the lifecycle carbon intensity of
vehicle fuels by 2020. (A group of Northeast and Mid-Atlantic states is currently considering a similar
standard.) The standard measures carbon intensity in grams of CO2 equivalent per megajoule of energy
contained in the fuel.
Using data developed in support of the California Low Carbon Fuel Standard, M.J. Bradley & Associates
estimated total lifecycle emissions on a per mile basis for a variety of different fuels/propulsion systems
for this report. The analysis used a modeled Chevrolet Tahoe Sport Utility Vehicle to determine the
amount of energy used per mile. The results of this analysis are shown in Figure 12. While an E85 blend
of ethanol and gasoline yields low greenhouse gas emissions from the vehicle tail pipe,13 the upstream
emissions associated with farming and land use significantly impact the benefits of E85 relative to other
alternatives. For the modeled scenario shown in Figure 12, the per-mile lifecycle GHG emissions of an
SUV burning E85 produced from corn are almost as high as emissions from the same SUV burning
conventional gasoline. GHG emissions from a hybrid-electric version of the same vehicle burning
conventional gasoline, or a diesel version, would be lower than from corn-based E85.
As noted in Figure 12, the intensity of greenhouse gas emissions of corn-based ethanol can vary
significantly depending on the assumptions used in the estimates; the California standard lists 13
different values for ethanol depending on where the corn is grown, the type of fuel used to mill the
corn, and whether the milling process is wet or dry. These variables result in carbon intensity values
ranging from 47 grams of CO2 equivalent per megajoule to over 90 grams of CO2 equivalent per
megajoule.14 Currently, California is deliberating over how to incorporate land use change into the
emissions analyses of ethanol. The adjusted land use value is set to take effect in mid-2011.
To reflect the variability in potential carbon intensity values for corn-based ethanol, Figure 12 includes
the lowest estimate in the California rule, with the revised carbon intensity value for land use, and the
highest estimate in the California rule, with the original carbon intensity value for land use. As shown,
the assumptions used in estimating the emissions intensity of ethanol can have a dramatic impact on its
consideration as a low carbon fuel.
13 A vehicle burning E85 would, in fact, emit significant CO2 emissions from the tail pipe. However, it is the convention to treat tail-pipe CO2 emissions from bio fuels as zero, because this CO2 is recycled back into biomass as more plants are grown to produce the bio fuel. The tail-pipe emissions shown in Figure 12 for E85 come from the 15 percent petroleum gasoline in the blend.
14 The California Low Carbon Fuel Standard Carbon Intensity Lookup Table for Gasoline and Fuels that Substitute for Gasoline is available at: http://www.arb.ca.gov/fuels/lcfs/121409lcfs_lutables.pdf.
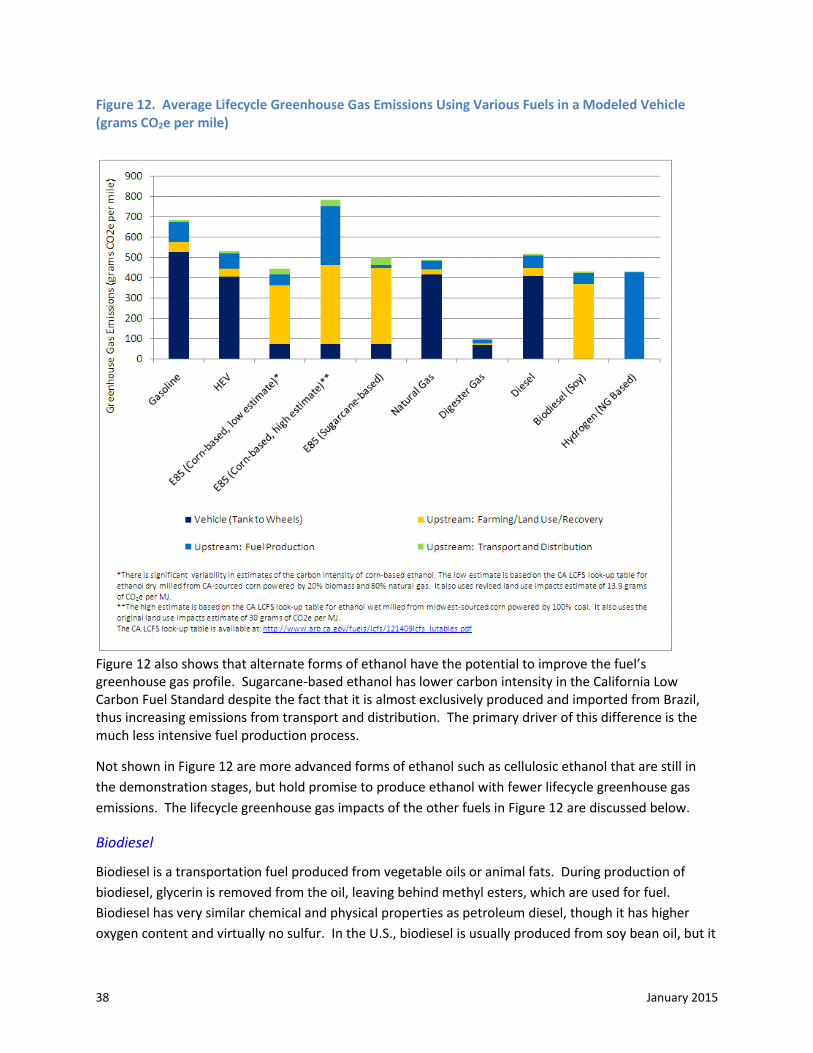
38 January 2015
Figure 12. Average Lifecycle Greenhouse Gas Emissions Using Various Fuels in a Modeled Vehicle (grams CO2e per mile)
Figure 12 also shows that alternate forms of ethanol have the potential to improve the fuel’s greenhouse gas profile. Sugarcane-based ethanol has lower carbon intensity in the California Low Carbon Fuel Standard despite the fact that it is almost exclusively produced and imported from Brazil, thus increasing emissions from transport and distribution. The primary driver of this difference is the much less intensive fuel production process.
Not shown in Figure 12 are more advanced forms of ethanol such as cellulosic ethanol that are still in
the demonstration stages, but hold promise to produce ethanol with fewer lifecycle greenhouse gas
emissions. The lifecycle greenhouse gas impacts of the other fuels in Figure 12 are discussed below.
Biodiesel
Biodiesel is a transportation fuel produced from vegetable oils or animal fats. During production of
biodiesel, glycerin is removed from the oil, leaving behind methyl esters, which are used for fuel.
Biodiesel has very similar chemical and physical properties as petroleum diesel, though it has higher
oxygen content and virtually no sulfur. In the U.S., biodiesel is usually produced from soy bean oil, but it

January 2015 39
can also be produced from a range of vegetable oils, including rapeseed oil, palm oil, and jatropha.
There is ongoing research into using algae as a potential biodiesel feedstock because it is expected to
produce high yields from a smaller area of land than vegetable oils (DOE 2010a).
Biodiesel can be used by itself to power a diesel engine, but is typically used as a blend with petroleum
diesel. In the U.S., the most common blends are B5 (5 percent biodiesel and 95 percent petroleum
diesel) and B20 (20 percent biodiesel and 80 percent petroleum diesel).
Between 2001 and 2013, annual use of biodiesel in the U.S. increased from 10 million gallons to 1404
million gallons. By 2013, total U.S. biodiesel production and domestic consumption are basically
matched around 1,400 million gallons (DOE 2014f).
B20 and lower blends of biodiesel can be used in virtually any diesel engine without modification. In
older trucks not equipped with a diesel particulate filter, the use of B20 biodiesel has been shown to
reduce direct PM emissions by approximately 10 percent (EPA 2002a). Higher level blends can reduce
PM emissions even more, but can also increase NOx emissions. Testing has shown that the use of
biodiesel does not materially reduce PM emissions from diesel engines equipped with diesel particulate
filter, as are all model year 2007 and later highway trucks (SAE 2004).
Figure 12 includes the lifecycle greenhouse gas emissions, on a per-mile basis, of soy-based biodiesel.
Soy-based biodiesel produces approximately 17 percent lower lifecycle GHG emissions per mile than
petroleum-based diesel fuel. Advanced forms of soy-based biodiesel show promise of being even less
greenhouse gas intensive, and are being marketed as “renewable” biodiesel.
Electric Vehicles
In the early 1990s, the California Air Resources Board (CARB) introduced a Zero Emission Vehicle (ZEV)
Mandate. This mandate originally required that the six largest automobile manufacturers ensure that
10 percent of the products they sold in California were “zero emission vehicles” by 2003. At the time,
the only way to achieve this goal was to create and sell battery electric vehicles (EV). This mandate led
to the creation of such EVs as the Geo Metro EV, Ford Ranger EV, Toyota RAV4 EV, and the GM EV1. The
GM EV1 was the only electric car produced, which met all of the EV America performance goals of the
Department of Energy (INL 2007). While only sold in limited numbers, primarily in California, the EV1
was generally considered to be a technical success and gained a loyal following.
CARB has relaxed the original mandated 2003 introduction date for ZEVs several times, and has made
other changes to the program, which has changed the focus of manufacturer efforts from battery
vehicles to fuel cell vehicles. In response, all major manufacturers cancelled their EV development
programs and discontinued the sale of the EV models they had produced.
The commercial success of the Toyota Prius, introduced to the U.S. market in 1999 (along with the
Honda Insight hybrid), caused auto manufacturers to focus on gasoline hybrid-electric cars. Hybrids
combine a gasoline engine with a small battery to significantly improve fuel economy. Hybrids are not
truly EVs because they get all of the energy required to drive the vehicle from an on-board gasoline
engine. Hybrids do take advantage of drive train electrification to improve overall driving efficiency,

40 January 2015
which also reduces tail pipe emissions. With the addition of a larger battery and a charging port, a
hybrid car can also be turned into a “plug-in” (i.e., charge-depleting) hybrid, which can pull some of the
energy required to drive the vehicle from the electric grid.
In the last few years, many major auto manufacturers have also turned their attention back to pure EVs
with an increasing number of EV models now available for purchase.
Hybrids
In the 2014 model year, there are more than 40 models of hybrid electric vehicles (HEV) available on the
U.S. market; virtually all major auto manufacturers offer at least one hybrid model (DOE 2014g). Hybrid
vehicles are typically $3,000 to $10,000 more expensive than the same or similar gasoline model
(manufacturer suggested retail price, MSRP) (DOE 2014a).
According to the Department of Transportation, there were 432,000 hybrid vehicles sold in the U.S. in
2012, and there have been more than 2.5 million sold since 1999 (DOT 2014a).
Many of the early hybrids were small cars (Toyota Prius, Honda Insight, Honda Civic), but now the
market includes hybrid versions of popular mid-size and large cars (Nissan Altima, Toyota Camry), as
well as luxury cars (BMW, Infinity, Lexus, Mercedes) and sport utility vehicles (Toyota Highlander, Nissan
Pathfinder, Volkswagen Touareg). For all vehicle classes larger than sub-compact, the 2014 model year
vehicles with the highest EPA fuel economy ratings (excluding EVs) are all hybrids (DOE 2014a). Model
year 2014 hybrids get between 11 percent and 47 percent better fuel economy (MPG) than best in class
gasoline vehicles of the same size, based on EPA combined (city and highway) test results (DOE 2014a).
Based on their combined fuel economy ratings, CO2 emissions from model year 2014 hybrids will be 10
percent to 32 percent lower than CO2 emissions from best in class gasoline cars.
Hybrids have a reputation as being “cleaner” than conventional gasoline cars, but not all of them are.
Many, but not all, model year 2010 HEVs are certified to SULEV emission standards, while the gasoline
version of the same model is certified to ULEV standards (i.e., these hybrids are cleaner than equivalent
gasoline cars). However, in some cases, the hybrid and gasoline version are both certified to have the
same emissions, and both are certified to be equivalent to fleet average emissions known as LEV or EPA
Tier 2/Bin 5. Six hybrid models are certified as AT PZEV vehicles, which are the cleanest cars on the
road, other than EVs or fuel cell vehicles (discussed below).
Hybrid technology has also been deployed on heavy trucks, most notably on transit buses and medium-
duty work trucks. Heavy-duty hybrids typically use a diesel engine, but there are some gasoline-hybrid
transit buses operating in California. Every major North American transit bus manufacturer offers a
diesel hybrid version of their buses. The 2013 American Public Transportation Association Transit Bus
database lists a total of 5,569 hybrid-electric buses in service in the US and another 1,137 in Canada.
Hybrid propulsion systems are also available from several different manufacturers for various types of
medium and heavy-duty trucks such as shuttle buses, school buses, delivery vans, refuse trucks, truck
tractors, and utility trucks (HTUF 2010). More than 2,400 or these vehicles are in service today.

January 2015 41
The vast majority of heavy-duty hybrid trucks currently on the road in the U.S. are equipped with Eaton
hybrid transmissions. However, in September 2014, Eaton announced that they would no longer sell
hybrid transmission in the North American onroad market due to low demand (HDT 2014a).
Plug-In Hybrids
Plug-in, or charge-depleting, hybrids are intended to fill the gap between regular (charge-sustaining)
hybrids and EVs. Plug-in hybrids have a larger battery pack than a regular hybrid, and also have a
charging port. They are designed to be able to travel a certain distance – say 20 miles – using only
energy from the battery, without turning on the gasoline engine (EV mode). After the energy in the
battery pack is depleted, the gasoline engine turns on and the vehicle acts like a regular hybrid. The
driver can plug the car into a wall socket to recharge the battery from the electric grid.
Plug-in hybrids work best for people who have relatively short daily commutes or trips. Most days, they
can commute to and from work either mostly or wholly on battery power and recharge the battery pack
at night. Yet if they need to go on a longer trip, they can do so without limiting the amount of time they
can drive between charges or needing to find places to plug in along the way.
In the 2014 model year, there are 10 plug-in hybrids commercially available from the major auto
manufacturers. Most are plug-in versions of popular hybrid models such as the Toyota Prius, Honda
Accord, and Ford CMax and Fusion. The Chevy Volt was the first purpose-built plug-in hybrid, launched
in 2011. There are also several luxury plug-in hybrids available from Cadillac, BMW, and Porsche. These
plug-ins have all-electric range between 13 and 38 miles and when operating in hybrid mode with the
gasoline engine running, they get between 37 and 50 MPG (EPA Combined rating) similar to non-plug-in
versions of the same or similar models (DOE 2014a). The purchase price of a plug-in hybrid is typically
$4,000 to $10,000 higher than the price of the same or similar hybrid (non-plug-in) vehicle (MSRP).
In 2013, approximately 49,000 plug-in hybrids were sold in the U.S. and another 42,000 were sold in the
first nine months of 2014 (Inside EVs 2014).
Electric Vehicles (EVs)
In the 2014 model year, there are 13 EVs available for sale in the U.S. from major auto manufacturers
(DOE 2014), though not all are available in every state; at least three models are only available in
California.
In 2013, approximately 48,000 EVs were sold in the U.S. and another 44,000 were sold in the first nine
months of 2014 (Inside EVs 2014). Of these sales, approximately half were the Nissan Leaf, which was
the first model to be introduced to the market.
The vast majority of EVs currently available for sale are compact or sub-compact models. Their purchase
prices (MSRP) are $4,000 to $21,000 higher than the prices for comparable gasoline cars (which range

42 January 2015
from $15,000 to $18,000). These EVs have advertised range of 62 to 87 miles per charge, and they can
generally go about three miles per kilowatt-hour of charge15.
There are only two EVs commercially available in 2014 that are not compact or subcompact cars: the
Toyota RAV4 EV (small SUV) and the Tesla Model S (mid-size Sedan). The Tesla Model S is a luxury
vehicle with a significantly higher purchase price than other EVs ($69,900 MSRP), but it also has a much
larger battery pack and longer range – up to 208 miles per charge.
In recent years, a number of manufacturers have also begun selling medium-duty electric trucks for
commercial applications – typically urban pickup and delivery. In 2014, there were five electric truck
manufacturers offering a total of eight different models with a range of body styles, from walk-in van to
box van and flatbeds (NYT-VIP 2014). Most of these vehicles are purpose-built as EVs, but one
manufacturer offers a Ford E450 chassis converted to electric operation. All of these vehicles have
manufacturer advertised maximum range between 80 and 120 miles per charge and use between 0.8
and 1.6 kWh/mi of electricity.16 The purchase price of these vehicles is $20,000 to $100,000 more than
the price of a comparable diesel truck and $44,000 to $110,000 more than the price of a comparable
gasoline truck. However, significant government purchase subsidies are available in New York,
California, and Illinois.
While EVs are advertised as zero emission vehicles that is not strictly true. While these vehicles have no
tailpipe emissions, the power plants that produce the electricity used to charge them do emit a wide
range of harmful air pollutants, including SO2, PM, NOx, mercury and other air toxics, as well as CO2.
The net air quality benefit of an electric vehicle or a plug-in hybrid depends on the method used to
produce electricity where they are used. Analyses for model year 2010 vehicles are shown in Figure 13,
which compares total NOx emissions, and Figure 14, which compares total CO2 emissions from a gasoline
car, hybrid, and electric vehicle (EV).17 As shown in this comparison, total g/mi NOx emissions from an
EV would be higher than those from a new gasoline car in virtually all states other than Washington.
NOx emissions from electricity production are lower in Washington than in any other state due to the
high percentage of power produced from nuclear and hydro sources. EVs have significantly lower total
CO2 emissions than gasoline cars in many states. The exceptions are states like Kentucky, which produce
a large percentage of their power using coal. In these states, CO2 emissions from an EV would be
15 Based on EPA combined city/highway testing. This does not account for energy required for heating in the winter or cooling in the summer. In extreme climates (either hot or cold), energy use per mile would be expected to be higher, and range between charge would be expected to be lower.
16 Some manufacturers offer their vehicles with smaller battery packs – and shorter range between charges – at a lower price.
17 This analysis summarized in Figures 13 and 14 is by M.J. Bradley & Associates for this report. In Figures 13 and 14, CO2 and NOx emissions for gasoline car and HEV are based on EPA combined MPG and emissions certification level for MY2010 Toyota Camry and MY 2010 Toyota Camry Hybrid. Calculations for EV assume the same driveline efficiency as the HEV (248 Whr/mi), assume 80 percent round-trip charging efficiency, and use EIA data on average grid emissions by state.

January 2015 43
marginally lower than those from a conventional gasoline car but higher than those from an HEV.18 This
analysis was not updated to current EV performance and current grid mix. While the numbers would
certainly change, the overall results of an updated analysis would not differ from the examples below.
Source: M.J. Bradley & Associates
Figure 13. Estimated NOx Emissions (g/mi) from Gasoline Car, Hybrid, and EV Operating in Different
States (2010)
18 Not all power produced in a given state is used in that state, nor is all the power used in a state necessarily produced there. The emissions rates for EVs shown in Figures 13 and 14 are approximate for each state. In general, a greater percentage of the electricity used in Southeast and Midwest is produced with coal than the electricity used in the Northeast, Northwest, and California.
Total Estimated NOx Emissions
0.00
0.10
0.20
0.30
0.40
0.50
0.60
Gasoline Hybrid EV - NY EV - CA EV - KY EV - WA
g/m
i N
Ox
Tail Pipe Grid
Grid mix
93% coal
Grid Mix
82% hydro
& nuclear
Grid Mix
55% NG

44 January 2015
Source: M.J. Bradley & Associates
Figure 14. Estimated CO2 Emissions (g/mi) from Gasoline Car, Hybrid, and EV Operating in Different
States (2010)
Hydrogen Fuel Cell Vehicles
A fuel cell vehicle uses a “fuel cell engine,” which directly creates electricity that powers an electric
motor to drive the vehicle’s wheels. A fuel cell vehicle is therefore an electric vehicle, but one that
creates its own electricity and does not need to be plugged in to recharge batteries. Many fuel cell
vehicles actually incorporate a hybrid electric drive system – and include a battery pack – to improve
overall efficiency.
Fuel cells are powered by pure hydrogen, which is the lightest of all gases. The necessary hydrogen is
typically carried on the vehicle in high pressure tanks, similar to the way compressed natural gas
vehicles carry their fuel.
Currently, fuel cell vehicles are in the early stages of commercialization. All of the major auto companies
have fielded concept, prototype, or demonstration fuel cell sedans and sport utility vehicles in the last
10 years – with at least 15 different models introduced since 2000. Most of these vehicles have been
operated by the companies themselves or have been fielded to government agencies and fleet
customers as part of technology development or demonstration programs. The Department of Energy
estimates that there were 527 hydrogen-fueled vehicles on the road in 2011 (DOE 2014g). Most of
these vehicles use fuel cells for power.19 These included 50 Honda FCX Clarity fuel cell vehicles leased to
19 It is also possible to burn hydrogen in an internal combustion (IC) engine similar to a gasoline engine. Over the past few years there have been several demonstration programs of vehicles powered by hydrogen IC engines.
Total Estimated CO2 Emissions
0
100
200
300
400
Gasoline Hybrid EV - NY EV - CA EV - KY EV - WA
g/m
i C
O2
Tail Pipe Grid
Grid mix
93% coal
Grid Mix
82% hydro
& nuclear
Grid Mix
55% NG

January 2015 45
select customers in California as part of a public demonstration project with government funding
support (DOE 2010b).
To date, only three major manufacturers (Toyota, Honda, and Hyundai) have announced plans to start
selling or leasing vehicles commercially to the public – but only in limited numbers in California. Of
these, the Hyundai Tucson Fuel Cell is already available for lease to California customers, with vehicles
from the other manufacturers scheduled to become available in 2015 and 2016 (Green Car Reports
2014).
Fuel cell vehicles fueled with pure hydrogen emit virtually no harmful tailpipe emissions of CO, NOx,
VOC, or PM, and they also emit no CO2 from the vehicle. Depending on the method used, production of
the hydrogen fuel can produce significant CO2 emissions, as well as other air pollutants such as NOx, PM,
and SO2.
Hydrogen is the most abundant element in our universe, but there is virtually no “free” hydrogen on
earth – all of it is combined with other elements (mostly oxygen or carbon) in other substances.
Hydrogen must be separated from these other elements to fuel a fuel cell vehicle. The hydrogen fuel
used in vehicles is either derived from water (by electrolysis) or from a gaseous or liquid hydrocarbon
fuel, usually natural gas, by reforming. The method of obtaining the fuel can have dramatic impacts on
the lifecycle emissions associated with a fuel cell vehicle.
While either method results in a clean vehicle, the upstream emissions associated with reforming
hydrocarbons to produce hydrogen fuel are significant. The net reduction in air emissions, relative to
other options, from a fuel cell vehicle fueled by hydrogen produced via electrolysis will depend on the
method used to produce the electricity used (similar to the discussion of air benefits of electric vehicles).
Even considering only GHG emissions, as shown in Figure 12, a fuel cell vehicle fueled by hydrogen
varies in lifecycle GHG emissions depending on the fuel used to produce the hydrogen.

46 January 2015
Major Policy Issues Associated with Transportation
The discussion of policy issues below is divided into two groups of policy options: those that would
directly address the reduction of major pollutant emissions (NOx, PM, SO2, VOC) from transportation
sources; and those that are more directly targeted toward reducing greenhouse gas emissions (mostly
CO2) from transportation sources or reducing the use of petroleum fuels to enhance energy security.
NOx, VOC, SO2, and PM Reduction from Transportation
There are three main ways to reduce pollutant emissions from transportation sources: 1) set more
stringent emission standards for various kinds of new vehicles, 2) regulate or control emissions from in-
use vehicles, and 3) reduce the total number of vehicle miles traveled (VMT). A number of policy
approaches in each of these categories are discussed below.
More Stringent Regulation of New Vehicles
The discussion below focuses on two categories of vehicles that could be targeted for further emissions
reduction: light-duty cars and trucks and ocean-going marine vessels.
Light-Duty Vehicle (Tier 3) Regulations
As noted above, in 2010, CARB proposed more stringent “LEV III” light-duty vehicle standards and in
2014, EPA also issued revised emissions rules for new light-duty gasoline vehicles, referred to as “Tier 3”
standards. The EPA Tier 3 standards are generally harmonized with CARB’s LEV III rules so that when
fully implemented, vehicle manufacturers will be able to produce “50-state certified vehicles.”
The CARB LEV III rules will be phased in between the 2014 and 2022 model years, and the EPA Tier 3
standards will be phased in between the 2017 and 2025 model years.
Both CARB LEV III and EPA Tier 3 add several more certification categories, combine NOx and NMOG into
a single numerical limit for both pollutants, further tighten PM limits, increase the emission durability
warranty period (to 150,000 miles), and further tighten standards for evaporative emissions. The LEV III
rules also introduce more stringent fleet average requirements for vehicles sold in California; the
required LEV III California fleet average standard for NMOG + NOx in 2022 will reduce emissions of these
pollutants from new cars by approximately 73 percent, compared to the actual sales-weighted fleet
average for new cars sold in California in 2008 (Dieselnet 2010).
EPA estimates that when fully implemented, the Tier 3 standards will cut non-methane organic gases
and nitrogen oxides by approximately 80 percent and particulate matter by 70 percent compared to the
current fleet. However, given that the light-duty fleet takes 12 years or more to turnover, the full effect
of EPA Tier 3 regulations will not be felt until 2030 or later.20
20 According to the Department of Energy’s Transportation Energy Data Book (Edition 33, Table 3.8), in 2013, 28 percent of cars on U.S. roads were older than 12 years old. This is up from 5 percent older than 12 years in 1970

January 2015 47
In addition to setting more stringent limits on gram per mile tailpipe emissions, EPA’s Tier 3 standards
will also require fuel producers to reduce the sulfur content of gasoline from 30 parts per million (ppm)
to no more than 10 ppm beginning in 2017. This reduction in fuel sulfur is directly tied to the new
vehicle standards, since removing sulfur is necessary for the development of improved exhaust after-
treatment devices (three-way catalysts) that will be required to meet the more stringent tailpipe limits.
Reducing Emissions from Marine and Ocean-Going Vessels
Coastal marine vessels (ferries, tugs, fishing vessels, work boats) typically have large diesel engines that
are very similar to diesel engines used in locomotives or large pieces of construction equipment, and
these engines burn “distillate” fuel – i.e., standard diesel. EPA has defined “Tier 4” emission standards
for new engines used in these vessels (Category 1 and 2 marine engines) to be phased in between model
years 2014 and 2017, depending on engine size. These Tier 4 regulations will reduce allowable NOx
emissions by 64 percent and allowable PM emissions by 80 percent or more, compared to the previous
Tier 2 standards. The Tier 4 marine engine standards are almost as stringent as current standards for
new diesel highway trucks that have been in place since the 2010 model year.
Large ocean-going vessels (OGV) – cruise ships, tankers, and container ships – have extremely large and
unique engines (Category 3 marine engines). These large-displacement, slow-speed engines – sized up
to 100,000 horsepower – are unlike any land-based diesel engines. These engines also burn “residual
fuel,” which is literally from the bottom of the barrel of petroleum and contains high levels of sulfur and
heavy metals. Residual fuels typically contain more than 1 percent sulfur – over 600 times more sulfur
than the diesel fuel burned by highway trucks.
EPA regulation of ocean-going vessel engines follows international standards negotiated under the
auspices of the International Maritime Organization (IMO) and codified in IMO MARPOL Annex VI. Prior
to 2004, these engines were unregulated. Engines in U.S.-flagged vessels, built beginning in 2004, were
subject to Tier 1 limits for NOx only – PM and VOC remained unregulated. Tier 1 limits were weak,
allowing at least twice as much NOx as was allowed from a highway truck engine built in 2004.
New regulations, adopted in 2008, tightened emission limits for U.S.-flagged OGVs. Beginning in model
year 2011, Tier 2 limits require NOx emissions 15 to 25 percent lower than Tier 1 limits. Beginning with
engines built in model year 2016, Tier 3 limits require NOx emissions 80 percent lower than Tier 1 limits.
Still, these standards will not result in “clean” engines: Tier 3 NOx limits for these vessels are more than
seven times higher than NOx limits for new highway trucks. Tier 3 standards will also limit carbon
monoxide and VOC emission for the first time, but PM remains unregulated.
and 25 percent in 2001. The percentage of total fleet miles driven by older cars may be less, however, since newer cars typically accumulate more miles per year than older cars.

48 January 2015
Under IMO rules, EPA jointly requested with Canada, and has been granted, designation of U.S. and
Canadian coastal waters as the North American Emissions Control Area (NAECA) for NOx and SO2 (see
Figure 15). EPA also requested, and has
been granted, designation of waters off of
the Atlantic and Caribbean coasts of Puerto
Rico and the U.S. Virgin Islands as the
Caribbean Sea Emission Control Area
(CSECA).
The NAECA extends 200 nautical miles off
the coasts of the U.S. and Canada,
including the southern coast of Alaska. It
also extends 200 nautical miles off the
coast of the major Islands of Hawaii, but
does not include waters around the Pacific
U.S. territories, the smaller Hawaiian
Islands, or Western Alaska. The CSECA
extends 200 nautical miles off the coasts of
the U.S. territories of Puerto Rico and the
U.S. Virgin Islands. The NAECA was enforceable as of August 2012; the CSECA entered into force in
January 2013, but was not enforced until January 2014.
These ECA designations mean that U.S.- and foreign-flagged vessels built after 2016 will be required to
comply with Tier 3 NOx limits while in these waters.
EPA has also imposed more stringent limits on the allowable sulfur level in marine fuels, which are being
phased in between 2012 and 2020. See Table 7 for these marine fuel sulfur limits. As shown, the limits
are lower in the NAECA and CSECA than in other U.S waters, not designated as an emission control area.
The more restrictive limits also apply to all internal U.S. waters that empty into the NAECA (called ECA
associated areas). Vessels can comply with these fuel sulfur limits by burning lower sulfur fuels, or by
employing a certified “equivalent control method” to their engines, which will achieve PM and SO2
emission levels equivalent to those achieved when using compliant fuel.
The final ECA limit of no more than 0.1 percent sulfur (1,000 ppm) is more than a 90 percent reduction
in sulfur compared to typical marine residual fuel used today, but it is still more than 60 times as much
sulfur as is allowed in highway diesel fuel. Also note that ocean-going vessels need only comply with
these limits while in the NAECA or CSECA (generally within 200 miles of the U.S. coast). While in
international waters beyond 200 miles from the U.S., coastline vessels can continue to burn higher
sulfur fuels.
EPA emission and fuel sulfur limits and recent favorable pricing for natural gas, relative to distillate fuels,
have increased interest in the use of LNG as a marine fuel, particularly for purely domestic vessels, as
well as for ocean-going vessels that operate within the NAECE and CSECA. However, high vessel
Table 1. Marine Fuel Sulfur Limits
Calendar
Years
Fuel Sulfur Limit (%)
U.S. Navigable
Waters
NAECA and
CSECA
2010-2011 4.50% 1.00% 1
2012-2015 3.50% 1.00% 1
2016-2019 3.50% 0.10%
2020 and later 0.50% 0.10%
1 Requirements specific to the North American ECA are not
enforceable until August 2012, based on the ECA approval
date by IMO.

January 2015 49
conversion costs, lack of LNG marine fueling infrastructure, and lack of transparency, with respect to
long-term LNG pricing, have so far limited the number of vessels converting to LNG (American Clean
Skies 2012). To date, only Totem Ocean Trailer Express (TOTE) and Harvey Gulf have made major
commitments to the use of LNG vessels (AOGR 2013). TOTE operates U.S.-flagged cargo ships between
Anchorage, Alaska, and Tacoma, Washington. Harvey Gulf operates off-shore supply vessels primarily
serving natural gas and oil exploration and production in the Gulf of Mexico.
Source: EPA 2009
Figure 15. North American and Caribbean Sea IMO Emission Control Areas
Regulation/Control of In-Use Vehicles
More stringent limits on emissions from new vehicles can dramatically reduce fleet-wide emissions over
time. However, they do not achieve their full potential until the fleet has completely turned over to new
vehicles, which could be many years. There are policies that can help to reduce emissions from in-use
vehicles without needing to wait for fleet turnover; these polices are addressed here.

50 January 2015
The Clean Air Act severely restricts the ability of EPA to regulate in-use vehicles, though the Agency can
develop and administer voluntary programs. Many of the policies discussed below must, out of
necessity, be left to the individual states to initiate and implement.
California Fleet Rules
In December 2008, the California Air Resources Board (CARB) adopted regulations to control emissions
from all medium- and heavy-duty trucks (Class 5-8) that operate in California, regardless of where the
trucks are registered.
As originally adopted, the rules were to take effect in two stages. First, between 2011 and 2014, fleets
would be required to phase in, on all of their trucks, the “best available control technology” (BACT) for
reducing particulate matter. This means that all medium and heavy trucks operating on California roads
would need to be equipped with a DPF by the end of 2014 (CARB 2008).21 Fleets could comply with this
requirement either by retrofitting existing trucks with DPF, or by retiring older trucks and replacing them
with new post-model year 2007 trucks that meet the most stringent EPA emission standards for PM. For
some fleets, retiring would have meant that they no longer use the trucks in California but continue to
use them in other states.
The second stage of the rules was designed to further reduce NOx emissions from medium and heavy
trucks. Between 2013 and 2022, this part of the regulation would have required fleet owners to
accelerate the retirement of engines older than 12 years old and replace them with engines built after
model year 2010, which is when EPA’s most stringent standard for allowable NOx emissions from new
engines takes effect.22 Fleets could theoretically comply with this requirement by replacing the old
engines in their trucks with new engines, but most would likely retire (from use in California) their
existing trucks and replace them with new trucks.
CARB staff estimated that the rules would apply to 220,000 medium-duty trucks (Class 5-6) and 720,000
heavy-duty trucks (Class 7-8). While 96 percent of medium-duty trucks affected by the rules are
registered in California, 68 percent of heavy trucks affected by the rule are registered in other states
(CARB 2010c). The heavy trucks potentially affected by the rules represent approximately 12 percent of
the U.S. heavy truck fleet.
In September 2010, CARB staff proposed amendments to the onroad truck and bus regulation, which
were approved by the Board in December 2010 (CARB 2010f). The amendments were proposed and
approved because “the recession has negatively affected employment and revenue for most fleets
affected by the regulations and has resulted in lower emissions,” and the proposed update offered an
21 The phase-in schedule would have required a minimum of 25 percent of any fleet’s trucks to comply by the end of 2011, 50 percent by the end of 2012, 75 percent by the end of 2013, and 100 percent by the end of 2014.
22 The EPA 2007 new engine standards reduced both allowable PM and allowable NOx emissions from new engines. The PM standard applied beginning with the 2007 engine model year, but the NOx standard was phased in between model year 2007 and model year 2010. While model year 2007-2009 engines have lower NOx emissions than engines built earlier, NOx emissions from model year 2010 and later engines will be up to 80 percent lower.

January 2015 51
opportunity to “simplify and streamline the regulation while providing fleets more flexibility in how they
reduce their emissions” (CARB 2010c).
Major proposed changes to the rules include:
Phase 1 (PM BACT): Only heavy vehicles (Class 7-8) with 1998-2006 model year engines will be
subject to PM BACT requirements. Smaller trucks (Class 5-6) and heavy trucks with older engines
will be exempt. This exempts approximately 130,000 trucks, virtually all of them registered in
California.
Fleets with vehicles subject to the amended rules will be required to phase in installation of PM
BACT between January 2012 and 2014, although additional flexibility and credit provisions could
allow a fleet to postpone achievement of full BACT until 2017. All fleets have been given one
additional year to start their retrofits and replacement, but most fleets will still be required to finish
(100 percent PM BACT) at the same time mandated in the original rule by the end of 2014.
Phase 2 (NOx BACT): Owners will be required to reduce NOx emissions from the fleet by
accelerating heavy-duty engine or vehicle replacement between January 1, 2015, and the end of
2019 for 20-year or older engines, and by January 1, 2023, for all other engines. By the end of
2023, all medium and heavy truck engines (Class 5 – 8) in use in California will be required either to
have been manufactured in 2010 or later, or be retrofitted to achieve equivalent NOx emission
reductions.
As with the PM BACT rules, the proposed amendments delay the start date of accelerated fleet
turnover (from 2013 to 2015) but keep the same end date (2023).
Voluntary Diesel Retrofit/Replacement Programs (DERA)
The Energy Policy Act of 2005 created the Diesel Emission Reduction Program (DERA), which gave EPA
authority to make grants and loans to promote reductions in diesel emissions, and authorized up to
$200 million in funding each year for fiscal years 2007 through 2011. In fiscal year 2008, Congress
appropriated $49.2 million in funds for this program. In fiscal year 2009, the American Recovery and
Reinvestment Act (ARRA) added $293 million in funding for DERA. In addition, Congress appropriated
$60 million for retrofits for fiscal years 2009 and 2010. Since then, the amount of funding provided by
Congress to DERA has declined every year: $38.6 million in FY2011, $26.5 million in FY2012, $8.1 million
in FY 2013, and $9 million in FY2014. In addition, EPA has announced $5 million in funding available
specifically for diesel reduction projects in ports and $3 million for school bus retrofit or replacement in
fiscal year 2015.
The law specifies that 70 percent of the funds be used for national competitive grants and 30 percent be
allocated to the states. Under DERA, EPA has created four different programs:
National Clean Diesel Funding Assistance Program: To provide grants for projects that
implement EPA- or ARB-verified diesel emission reduction technologies or strategies.

52 January 2015
The National Clean Diesel Emerging Technologies Program: To award competitive grants for
projects that spur innovation in reducing diesel emissions through the use, development, and
commercialization of emerging technologies.
SmartWay Clean Diesel Finance Program: To issue competitive grants to establish national low-
cost revolving loans or other innovative financing programs that help fleets reduce diesel
emissions.
State Clean Diesel Grant Program: To allocate funds to participating states to implement grant
and loan programs for clean diesel projects.
Since 2008, EPA has awarded over 600 grants for diesel reduction projects; funded projects have
included retrofits with diesel oxidation catalysts and diesel particulate filters, engine repowers, vehicle
replacements, retrofits with idle reduction equipment, and retrofits with aerodynamic aids for highway
trucks, locomotives, marine vessels, and construction equipment (EPA 2010).
Many states also operate grant programs to provide funding for the cleanup of diesel engines. Two of
the largest are the Carl Moyer Memorial Air Quality Standards Attainment Program in California (Carl
Moyer), and the Texas Emissions Reduction Plan (TERP). The Carl Moyer program started in 1998 and, in
its early years, was funded with appropriations in the state budget. Since 2005, it has been funded by a
portion of fees charged for California’s Smog Check program, as well as fees assessed on the sale of tires
(STAPPA 2006). For fiscal year 2010-2011, $67.9 million was available for the program (CARB 2010d).
TERP is funded by surcharges on the sale or lease of new and used highway and nonroad diesel vehicles,
as well as fees charged for commercial motor vehicle inspections and a portion of fees for certificates of
vehicle title (STAPPA 2006). TERP currently offers nine different grant programs: the Drayage Truck
Incentive Program, the Emissions Reduction Incentive Grants Program, the Texas Clean Fleet Program,
the New Technology Implementation Grants Program, the Clean Transportation Triangle Program and
Alternative Fueling Facilities Program, the Texas Natural Gas Vehicle Grant Program, the Light-Duty
Vehicle Purchase or Lease Incentive Program, the Rebate Grants Program, and the New Technology
Research and Development Grants Program. Some of these programs are competitive, and some are
first-come first-served rebate programs. Each program has a different focus, but they generally provide
for upgrade or replacement of diesel equipment, conversion of diesel equipment to natural gas,
installation of natural gas fueling infrastructure, and development of new technologies to reduce vehicle
emissions (TERP 2014). To date, TERP has provided $998 million in funding for 9,800 projects to reduce
emissions from diesel vehicles operating in Texas (TERP 2014).
Mandatory Retrofits for Government Contracting
In 2003, New York City adopted Local Law 77 to clean up diesel exhaust from equipment used in city
construction projects. Local Law 77 mandates retrofits on all diesel equipment greater than 50 hp to be
used on all publicly funded construction projects in New York City. On large construction projects,
equipment impacted by this requirement would include most earth moving machines (i.e., loaders,
backhoes, graders, bull-dozers, and offroad dump trucks), as well as large portable generators. In
general, only small portable equipment, such as small generators, light sets, welders, and air
compressors, as well as some personnel lifts, have engines smaller than 50 hp (MJB&A 2009). The

January 2015 53
requirements under the law were phased in between 2004 and 2005, depending on the location and
size of the project.
Local Law 77 requires the use of “best available technology” (BAT) to reduce PM emissions. Contractors
must install an EPA- or ARB-verified diesel particulate filter, unless they can prove that these devices are
not technically feasible to use on their specific piece of equipment. If so, they can install a verified diesel
oxidation catalyst.23
Other localities have taken a similar approach but generally on a project-by-project basis. For example,
the Illinois Department of Transportation required some retrofits on equipment used for the rebuilding
of the Dan Ryan Expressway, as did the Port of Seattle for construction of a new runway at Seattle’s Sea-
Tac airport (STAPPA 2006).
Light-Duty Vehicle Inspection and Maintenance
Vehicle inspection and maintenance (I & M) programs help improve air quality by identifying high-
emitting vehicles in need of repair and requiring them to be fixed, as a prerequisite to vehicle
registration. The 1990 Clean Air Act Amendments made I & M programs mandatory for several areas
across the country, based upon air quality classification (i.e., attainment status), population, and
geographic location. Thirty states have I & M programs at the state level; another three states and the
District of Columbia have programs in specific cities or counties (EPA 2003).
The specifics of these programs vary – for example, some require annual tests and others require
biennial tests. Most programs started with actual exhaust emissions testing to identify high emitters,
but most programs are moving away from instrument-based testing and toward the use of on-board
diagnostics (OBD).
Since 1990, EPA new vehicle emission standards have required engine manufacturers to program OBD
capability into all new engines. OBD uses on-board sensors and control logic to determine whether the
different components of the engine’s emissions control system are working properly. If a problem is
detected, the engine control module sets a “check engine” light on the vehicle dash and logs a fault
code. Using standardized hardware and software, a maintenance technician can download the fault
codes to determine what the problem is so that it can be fixed. Compared to tailpipe emissions tests,
OBD makes the identification of potential high emitters easier and less expensive. In addition, because
the “check engine” light signals problems as soon as they occur, vehicle owners may be motivated to
address the problem early, rather than having to wait for an annual or biennial emissions test to detect
the problem.
Under an OBD-based I & M program, registration would be denied to a vehicle with an active check
engine light because the identified emission control system fault could make the vehicle a high emitter.
Once the problem has been fixed, the vehicle would be allowed to register.
23 Diesel particulate filters are verified to reduce PM emissions by 85 percent or more. Diesel oxidation catalysts are verified to reduce PM by 20 – 25 percent.

54 January 2015
Vehicle inspection programs have been the target of budget cuts and political challenges over the past
eight years. Since inspection programs are included in state implementation programs associated with
ozone standard attainment, EPA can prevent states from stopping a program if alternative measures do
not maintain attainment. In 2005, EPA approved termination of vehicle emissions testing programs in
northern Kentucky. Kentucky successfully argued that new regulations, requiring auto body repair shops
to switch to high-efficiency paint sprayers and requiring the use of solvents with low vapor pressure for
cleaning grease from industrial metal parts, would allow the counties in question to stay in attainment
(Kentucky 2005). In 2009, EPA rejected Ohio’s attempt to end its vehicle inspection program, despite
recently re-designating 14 Ohio counties to attainment, because of concerns over backsliding and
meeting future standards (EPA 2009b).
Heavy-Duty Vehicle Inspection and Maintenance
Inspection and maintenance programs for heavy-duty diesel vehicles are currently less common than
those for light-duty vehicles. However, these programs are becoming increasingly important as
manufacturers rely more heavily on after-treatment devices (i.e., cleaning exhaust as opposed to
reducing exhaust) to comply with more stringent new engine emission standards. After-treatment
failures can result in a significant increase in emissions, and effective inspection and maintenance
programs can detect after-treatment failures and ensure that they are fixed.
Eighteen states have heavy-duty vehicle testing programs (EEA 2004). As in the case of light-duty
vehicles, the testing requirements vary from state to state. As an example of one of the more advanced
programs, California's program has three components (CARB 2010b):
Heavy-duty Vehicle Inspection Program: Requires heavy-duty trucks and buses to be inspected
for excessive smoke and tampering and engine certification label compliance. Any heavy-duty
vehicle traveling in California, including vehicles registered in other states and foreign countries,
may be tested. Tests are performed by inspection teams at border crossings, weigh stations,
fleet facilities, and randomly selected roadside locations.
Periodic Smoke Inspection Program: Requires that diesel and bus fleet owners conduct annual
smoke opacity inspections of their vehicles and repair those with excessive smoke emissions to
ensure compliance. State officials randomly audit fleets, maintenance and inspection records,
and test a representative sample of vehicles. All vehicles that do not pass the test must be
repaired and retested.
Emission Control Label: Requires that each vehicle operating in California – including those in
transit from Mexico, Canada, or any other state – must be equipped with engines that meet
California emission standards and be labeled as such.
As in California, virtually all current programs rely on the snap opacity test as the main method to
identify high emitting heavy-duty diesel vehicles. Engines with low opacity are considered to be in good
condition, while measured opacity levels above some specific threshold denote a high emitter. These
opacity tests have limited value for three reasons: 1) they do not truly represent all vehicle operating
conditions that could produce high PM, 2) it is relatively easy to cheat the test by not pushing the

January 2015 55
accelerator down quickly enough, and 3) the cut points defined for most test programs are too high to
be of use for modern engines.
EPA required on-board diagnostic (OBD) systems on 2005 and later heavy-duty vehicles with gross
vehicle weight less than 14,000 pounds. In February 2009, EPA finalized regulations requiring OBD
systems on 2010 and later heavy-duty engines used in highway vehicles over 14,000 pounds GVWR. As
with light-duty I&M, heavy-duty I&M can migrate away from opacity testing and begin to rely on OBD as
the main method to detect high emitters sometime in the future.
Reducing Driving
In the U.S., the use of cars has historically grown faster than the population. Between 1970 and 2008,
the number or vehicles on U.S. roads increased at an average annual rate of 2.3 percent, and the
number of miles those vehicles traveled annually increased at an average rate of 2.6 percent. Over that
same time period, the U.S. population grew at an average annual rate of only 1.3 percent. Between
2008 and 2011, both vehicle registrations and vehicle miles traveled fell by 3 percent – likely due to the
financial crisis and resulting recession and slow recovery, as well as a sharp spike in gasoline prices in
early 2008. In 2012, both vehicle registrations and total vehicle miles traveled began to rise again
compared to the prior year (DOE 2014).
Despite the recent reduction due to the recession, in the long term, the growth in driving is projected to
continue out of proportion to population growth. At historical rates, the Department of Energy projects
an increase in VMT of 48 percent from 2005 to 2030 (EIA 2008). Looking solely at CO2 emissions, an
Urban Land Institute report estimated that the nation would offset the available reductions in emissions
from cleaner vehicles by 2050, unless changes are made that reduce that reduce the growth in VMT (ULI
2007).
There are a number of policies that propose to get people out of their cars and onto less polluting
modes for necessary trips – walking, biking, and public transportation.

56 January 2015
Smart Growth Policies
According to data from the 2001 National Household Travel Survey, 87 percent of all trips made by
Americans were made by personal auto, while only 9 percent were made by walking and only 1 percent
were made using public transit. In addition, this survey shows that only 18 percent of trips are work-
related, with almost three quarters of trips related to recreation and social activities or personal and
family business.
Obviously, the character of community
development and land use in the U.S. has a
major impact on the transportation options
available and the mode choices that people
make. However, historically, U.S.
transportation policy decisions have
encouraged driving and limited the
availability of options for alternative
transportation.
For decades, the top priority for federal
investment has been highways. As
Transportation for America describes it, the
personal automobile has been the “priority
mode for public support,” leading to an
“expansion of surface roads and streets to
provide increased capacity for motor vehicle
travel, with an emphasis on suburban and
rural routes.” The result has been sprawl:
Although never explicitly stated, a tacit
feature of this emphasis has been federal
subsidization of suburban and exurban
settlement patterns (Transportation 2009).
One result of those policies is decentralized
communities, where access to work,
shopping, health care, even food, is built
around access to a car.
In 2009, 50 percent of all U.S. housing units were located in the suburbs and 21 percent were located in
rural areas, with only 29 percent in central cities (Census 2009).
As an Urban Land Institute analysis characterizes the situation:
From World War II until very recently, nearly all new development has been planned and built on the
assumption that people will use cars every time they travel. As a larger and larger share of our built
Figure 16. Effects of Land Use Patterns on VMT (ULI
2010)

January 2015 57
environment has become automobile dependent, car trips and distances have increased, and walking
and public transit use have declined (ULI 2007).
The Urban Land Institute recently published a summary of three major studies that evaluate the effect
of land use on driving (ULI 2010). The major conclusions from these studies include:
Compared to sprawling land use patterns, compact land use patterns result in fewer VMT.
Compact patterns reduce the number of trips and their length.
The VMT reduction from compact land use appears incrementally over time, but it is permanent
As the amount and quality of compact development increases, the reduction in VMT accelerates.
In the context of these studies, “compact development” is a land use pattern that features:
Medium to high density – concentrations of housing and employment;
A mix of uses (residential, retail, office, manufacturing);
Interconnected streets (i.e., fewer cul-de-sacs);
Pedestrian, bicycle, and transit-friendly design; and
Access and proximity to public transit options.
See Figure 16 for a summary of the effects of land use patterns on VMT from these studies. As shown,
in comparison to suburban sprawl, compact development can reduce VMT by up to 60 percent.
More compact or densely developed communities have lower average daily VMT. Residents in
sprawling cities, like Atlanta, drive roughly 25 percent more miles each day on average than residents of
more compact cities, like Boston. A meta-analysis of studies found that people who live in cities with
twice the density (and the accompanying diverse land use, interconnected streets, and greater access)
drove one third less than similar residents of cities with greater sprawl (ULI 2007).
The policies that create sprawl can also impact lung health in ways not just associated with air pollution
emissions. With improved access and funding, better-off residents left the cities and moved to the
suburbs, as did many of the services they needed, including health care. Researchers have argued that
the increased sprawl left low-income families with limited access to better paying jobs, adequate
schools, or protection from crime, as well as to health care – factors that made it more difficult for them
to move out of poverty and put them a higher risk for health problems (Funders Network 1999).
Many cities and some states are adopting policies, sometimes called “smart growth” or “compact
development,” to counter the unhealthy attributes of sprawl, including extended driving. For example,
New York adopted a state law in August 2010 requiring infrastructure investments to be examined
against “smart growth” principles (NY 2010). Others, adopting similar principles that encourage greater
density in development, include San Diego, northern Virginia, and Orlando (ULI 2007).
Transportation Funding Authorization
The last five-year surface transportation funding authorization legislation, SAFETEA-LU, expired in
September 2009. Between 2009 and 2012, highway and other transportation funding were covered by
a series of one-year funding authorizations that continued annual appropriations at essentially the same
level as was authorized by SAFETEA-LU. In July 2012, Congress passed, and the president signed, the

58 January 2015
Moving Ahead for Progress in the 21st Century Act (MAP-21), which funded surface transportation
programs at over $105 billion for fiscal years 2013 and 2014.
Since then, the president and Congress have not been able to agree on a long-term strategy to address
surface transportation spending and funding, and in particular, the imminent insolvency in the national
Highway Trust Fund, which is funded by motor fuel and other truck-related taxes. In August 2014, the
president signed another short-term (10 month), $10.8 billion extension of surface transportation
funding. This extension was paid for using a budgeting maneuver called pension smoothing, which
allows corporations to reduce their contributions to employee retirement plans. By allowing companies
to do so, the government can boost tax revenues since companies are no longer eligible for tax
deductions (The Hill 2014).
In order to keep highway projects moving and keep the Highway Trust Fund from becoming insolvent,
the president and Congress must agree on a long-term funding and spending strategy by the spring of
2015, or at the least must pass another short-term extension.
The federal surface transportation authorization funds not only highways but also transit programs,
allocating 20 percent or less of the total funding to transit. Under SAFTEA-LU, highway programs
received about $40 billion annually, while transit programs received about $9 billion. Since 1991, the
authorization has also included funding for “Congestion Mitigation and Air Quality,” programs, which
fund air pollution control efforts and alternative transportation projects, such as pedestrian and bike
paths.
In the context of developing long-term surface transportation authorization, some groups have urged a
national transportation strategy that would encourage more dense development, greater integration of
public transportation, and alternative transportation. Groups like Transportation for America have
enlisted many public health groups, including the American Public Health Association, in their coalitions.
These groups seek greater funding for public transportation and alternative transportation.
Transportation for America supports increasing transit funding to 30 percent of total funding, as well as
increased support for pedestrian and bicycle-friendly street design (Transportation 2009). The Urban
Land Institute has proposed a similar set of recommendations for future legislation, including steps that
would encourage or require states, regional, and local governments to use approaches to reduce VMT
(ULI 2007).
Another question to be resolved is how the money is raised. The user-fee approach, in particular, the
18.3 cent per gallon gasoline tax, no longer provides adequate resources. Keeping adequate funding
requires increased gasoline use to grow unless the fees are increased, which has not happened since
1993. With more stringent fuel efficiency requirements under the CAFE program and increased use of
vehicles that do not solely depend on gasoline, the funds raised from a per-gallon tax will fall further
behind, even if VMT grows.
Increasing the gasoline tax could reduce VMT as well. There is some evidence that higher gasoline
prices can reduce VMT. In 2008, a sharp spike in gasoline prices was accompanied by the first
substantial drop in VMT in some time.

January 2015 59
An alternative is a VMT-based system. Such a system would charge a fee based on the miles driven, not
the fuel consumed. Vehicles and fueling stations would need specific equipment to assess the VMT and
pay the fees. More research would be needed to put such a system in place, but Transportation for
America and others urge that it be explored as a long-term funding mechanism.
In addition, public-private partnerships are growing, as governments look to alternatives for funding
needed transportation projects. Private companies now own and operate toll roads and public
transportation, as well as other transportation infrastructure. No clear guidance exists for structuring
the relationship between the private companies and government entities to ensure that the projects
meet requirements to reduce emissions and provide access.
High-Speed Intercity Rail
The Obama Administration announced on October 28, 2010, an additional $2.4 billion in funding for
planning for a high-speed intercity passenger rail system (DOT 2010). The plan for this rail service
includes new and improved rail service intended to reach speeds from 150 to 220 mph, as well as
upgrades to existing lines. Supporters urge the expansion of a high-speed intercity rail network as the
current equivalent of the interstate highway system begun in the 1950s (FRA 2010). Groups, including
the Transportation for America and Urban Land Institute, are supporting the expansion of intercity rail
as part of an interconnected public transportation system and one way to supply future transportation
needs outside of adding highway and air transportation capacity. The state of California approved $9.95
billion in bonds for 800 miles of high-speed rail in 2008 (SDUT 2010).
However, the cost of these projects makes them strong targets for budget cuts, as seen with the
decision by New Jersey Governor Chris Christie to cut funding for a $9 billion railroad tunnel connecting
his state with New York City. The question of “taxpayer subsidies” for rail has raised opposition in
California, Wisconsin, and other locations (IBT 2010). Supporters argue that other nations’ experience
with high-speed rail systems show that they can succeed, and that both the federal highway system and
the air transportation systems are currently heavily subsidized by federal funding.

60 January 2015
Figure 17. Plan for High-Speed Rail Corridor Development, U.S. Department of Transportation
CO2 Reduction from Transportation
The policies discussed below target reducing greenhouse gases and improving U.S. energy security,
rather than reducing traditional air pollutants. These policies fall into two categories: 1) regulation of
fuel economy from new vehicles, and 2) mandating or creating incentives to switch to non-petroleum
fuels for transportation.
Fuel Economy Regulation of New Vehicles
As discussed, fuel efficiency regulations are already in place through model year 2025 for light-duty
vehicles, and through 2019 for medium- and heavy-duty vehicles. EPA is currently in the process of
developing a proposal for heavy-duty vehicle fuel economy applicable to model years after 2020. The
most significant issues that EPA must decide, with respect to the Phase 2 standards currently under
development, are: 1) what stringency level to set, 2) whether to maintain separate engine and vehicle
standards, 3) whether to move away from simulation modeling for vehicle certification toward full-
vehicle testing, and 4) whether or not to include commercial trailers in the regulation.
The stringency level that EPA sets in the Phase 2 standards will hinge on their assessment of the
technical feasibility, commercial viability, and cost-effectiveness of various technologies that could be
used to further improve vehicle efficiency. Many environmental groups are urging EPA to set Phase 2

January 2015 61
standards that would require a fleet average 40 percent reduction in fuel use from model year 2025
trucks compared to model year 2010 trucks.
Achieving this level of reduction would require additional engine and aerodynamic improvements for
combination trucks, as well as the use of low-rolling resistance single-wide dual tires, advanced
transmissions, and exhaust waste heat recovery systems. Importantly, it would also require EPA to
mandate aerodynamic improvements and reductions in rolling resistance from commercial trailers (see
below). For vocational trucks, it would require additional engine improvements and might require the
use of advanced transmissions and/or hybrid-electric drive systems for some trucks.
These changes are likely to be expensive – adding as much as 25 percent to the cost of a new
combination truck. However, modeling indicates that this cost increase would be more than made up
for in fuel savings, with payback periods of two years or less for combination trucks. Payback periods for
more expensive technologies (i.e., hybrids) would be longer for most vocational trucks because they
typically drive fewer miles and use less fuel annually than combination trucks.
To a large extent, EPA and NHTSA’s imposition of separate engine and vehicle standards for medium-
and heavy-duty trucks in Phase 1 was a compromise, which acknowledges the inherent difficulty in
regulating such a diverse and fragmented market, as well as the need for fuel efficiency regulation to be
compatible with existing criteria pollutant regulations so as not to create unintended consequences. For
example, engine optimization to meet a vehicle-based fuel efficiency standard could potentially increase
in-use NOx and PM emissions despite using engines “certified” based on engine testing.
Some vehicle manufacturers have encouraged EPA to set only vehicle standards in Phase 2, in order to
allow manufacturers to optimize engine operation for a given vehicle configuration. While this is a
laudable goal, EPA will likely decide to maintain a direct link between fuel efficiency and criteria
pollutant regulations by continuing to include both engine and vehicle standards in Phase 2.
EPA’s use of simulation modeling to certify compliance with vehicle standards under Phase 1 was
implemented in recognition of the very high cost and complexity of full-vehicle testing for heavy-duty
vehicles. The medium- and heavy-duty vehicle market is much more fragmented than the light-duty
market, with far greater range of vehicles sizes and configurations, much larger number of
manufacturers, smaller sales volumes, and more complicated manufacturing process. The use of
simulation modeling for certification both simplifies the regulatory process and significantly reduces
manufacturer costs for certification.
The trade-off is that advanced technologies, such as automated manual transmissions, hybrid-electric
drive systems, and exhaust heat recovery systems are inherently difficult to simulate in a transparent
open-architecture environment because they often rely on proprietary control algorithms. The current
GEM simulation model developed for Phase 1 cannot capture the fuel efficiency benefits of these types
of systems.
The issue of certification method is therefore linked to the issue of stringency. Some environmental
groups would like to see EPA move toward full-vehicle testing for certification in Phase 2, primarily
62 January 2015
because they believe this would open up additional pathways toward compliance and allow EPA to set
more stringent standards.
It is unlikely that EPA and NHTSA will completely abandon simulation modeling in Phase 2 – they are in
fact working to make the GEM model more flexible and capable, to be able to simulate a wider range of
technologies. However, EPA and NHTSA will also likely develop additional certification pathways, which
involve full-vehicle testing, for some advanced technologies.
Combination trucks currently burn approximately two thirds of all fuel used by medium- and heavy-duty
trucks. Commercial trailers do not have engines, and therefore do not technically use any fuel.
However, the physical characteristics of a trailer can have as great or greater effect on total fuel use
from a combination truck-trailer as the physical characteristics of the truck. The aerodynamics and
rolling resistance of the trailer affect how much work the truck’s engine must do – improvements to
trailers could therefore significantly reduce the total amount of fuel used by the heavy truck sector.
When implementing Phase 1 of the medium- and heavy-duty truck fuel efficiency standards, EPA and
NHTSA contemplated, but specifically declined, to regulate commercial trailers. They were concerned
that many trailer manufacturers are small businesses and that they are not familiar with EPA regulations
and certification requirements, because they have never been regulated before.
Most environmental groups are pushing hard for EPA to include trailers in the Phase 2 standards. In
addition, a committee convened by the National Academies, specifically to evaluate technologies and
approaches that could be used to further reduce fuel use from medium- and heavy-duty trucks in a
Phase 2 program, strongly recommended that EPA and NHTSA set fuel efficiency performance standards
for new commercial trailers, as well as trucks. If EPA and NHTSA do include trailers, it is likely they will
focus mostly on van trailers and impose only minimal requirements on other types of “specialty” trailers
(flat and low beds, grain trailers, dump trailers, and tank trailers). About 70 percent of all new trailers
registered each year are van trailers, and they are fairly homogenous in terms of their basic design.
Manufacturing of these trailers is also dominated by only three companies – none of which meet the
regulatory definition of a “small business,” so imposition of new rules for these trailers triggers fewer
concerns about business disruption.
Switch to Non-Petroleum Fuels
Six federal laws mandate various government agencies to purchase alternative fuel vehicles, and all but
three states have similar laws, which usually apply to state and/or local government fleets (DOE 2010b).
Twelve states also have laws or regulations that provide a renewable fuels mandate or requirement.
The federal government has 22 different grant programs and twelve different tax incentives that
subsidize the purchase of alternative fuel or advanced technology vehicles, the purchase of alternative
fuel infrastructure, or the purchase and use of alternative fuels by fleets and individual consumers.
Thirty three different states also operate grant programs and 39 states have state tax incentives. These
laws and incentive programs typically cover one or more of the following fuels and technologies: natural
gas, propane, ethanol, biodiesel, electric vehicles, hybrid-electric vehicles, plug-in hybrid vehicles, and
hydrogen fuel cell vehicles and infrastructure.

January 2015 63
Past approaches to moving transportation energy use away from petroleum and toward these
alternative fuels have relied heavily on voluntary incentives for private consumers, including grants and
direct subsidies, as well as tax rebates. Current mandatory requirements apply mostly to federal and
state government fleets, and generally focus more on the purchase of alternative-fuel capable vehicles,
including dual-fuel vehicles, than on purchase of the fuel itself. For example, to comply with the
alternative fuel vehicle purchase requirements of the Energy Policy Act, it is enough that a fleet
purchase flex-fuel E85 vehicles (able to operate on E85 or gasoline) or dual-fuel natural gas vehicles
(able to operate on natural gas or gasoline); there is no requirement that once purchased the vehicles
actually operate on an alternative fuel. As noted above, many of the flex-fuel and dual-fuel vehicles on
the road operate almost exclusively on gasoline.
Some states are beginning to experiment with low carbon fuel standards and mandates, which will shift
responsibility for decision making relative to alternative fuel use away from consumers and fleets and
toward fuel producers and suppliers. Other policy approaches, which have not yet been implemented in
the U.S., include the inclusion of vehicles and/or transportation fuel suppliers in an economy-wide cap
and trade scheme and the imposition of higher user fees or taxes on petroleum-based fuels, specifically
to provide an economic advantage for non-petroleum alternatives.
Renewable Fuels
The Energy Policy Act of 2005 mandated that U.S. refiners use increasing amounts of “renewable fuels”
in motor gasoline and diesel between 2006 and 2012, in order to enhance U.S. energy security. Refiners
were required to sell four billion gallons of renewables in 2006, with the mandate increasing to 7.5
billion annual gallons in 2012 (Holt 2006). This mandate has increased the use of ethanol in gasoline,
even in areas not required to use reformulated gasoline (RFG).
The current limit of 10 percent ethanol in standard gasoline and RFG is set by EPA, which has
determined that this level of ethanol will not harm in-use engines. In separate decisions announced in
October 2010 and January 2011, EPA granted a waiver request, sought by several major ethanol
producers, to increase the allowable limit of ethanol in gasoline to 15 percent but only for model year
2001 and newer cars (EPA 2011). These decisions have been controversial and have been opposed by
refiners, auto manufacturers, and some environmental groups, including the American Lung
Association. Auto manufacturers have raised a concern that higher levels of ethanol may damage the
three-way catalysts (i.e., catalytic converters) used on older cars. The American Lung Association has
testified about concerns that the air quality and public health may be harmed by the increased use of
mid-range blends of ethanol and urged more research.
Natural Gas
In the past, most alternative fuels, including natural gas, have been more expensive on an equivalent
energy basis than traditional petroleum-derived fuels (gasoline and diesel). However, the recent
fracking boom in the U.S. has significantly reduced the price of natural gas, and to a lesser extent,
propane in relation to gasoline and diesel. According to the Department of Energy, the average price of
gasoline at public fuel stations was $3.70/gallon in July 2014, while the average price of CNG was

64 January 2015
$2.17/gasoline-gallon equivalent (DOE 2014b).24 During the same timeframe, the average price of diesel
fuel at public fuel stations was $3.91/gallon, or $3.51/gasoline gallon equivalent25.
This relatively recent development has spurred a lot of interest in the use of natural gas as a
transportation fuel, though mostly for heavy-duty trucks and marine vessels. The lack of widespread
CNG fueling infrastructure still significantly limits greater adoption of light-duty natural gas vehicles.
While a lack of fueling infrastructure is also an impediment for wider adoption of heavy-duty natural gas
vehicles, this problem is minimized for local and regional fleets that return to base every night – such as
transit buses and refuse trucks.
CNG fuel storage is not practical for long-haul trucks that travel 600 miles per day or more – these
vehicles generally need to store natural gas fuel on the vehicle as LNG. While the incremental cost of a
Class 8 LNG truck can be up to $90,000, the payback period for this additional cost can be as short as
three years for vehicles that travel 100,000 miles per year, as many long-haul tractor trailers do
(Argonne 2013).
According to the Department of Energy, there are currently 64 publicly available LNG fuel stations in
operation in the U.S. Most are at highway truck stops along major truck corridors – for example, from
Los Angeles to Las Vegas and Salt Lake City; the “Texas triangle” of Dallas, Houston, and San Antonio; as
well as in the Midwest (DOE 2014c). Several private companies have publicly announced plans to open
additional LNG fueling stations along other truck corridors.
Electricity
Today, there are more EVs available for purchase than there have ever been, and driving range between
charging is approaching 100 miles, making them a practical option for the majority of daily commutes.
However, the incremental cost of these vehicles is still $4,000 to $20,000 compared to a similar gasoline
vehicle – without government subsidies, it would take the average driver more than 10 years to pay
back the incremental cost of most EVs based on fuel cost savings alone.26
Some also believe that EVs will not truly be viable for most consumers until there are publicly available
charging stations that will allow drivers to “fill up” their batteries away from home, thus relieving the
“range anxiety” of EV drivers. However, the commercial development of EV charging infrastructure is a
“chicken and egg” problem – private companies will not invest in this infrastructure without EVs to use
it, but consumers may not buy EVs unless they know the infrastructure is in place.
To fill this gap, the federal government, as well as some state governments, have started to subsidize
the installation of EV charging stations. The Department of Energy has partnered with a private
company to deploy 13,000 medium-power (Level 2) charging stations for residential and commercial
24 A gasoline gallon equivalent is an amount of natural gas with the same energy content as a gallon of gasoline.
25 Diesel fuel has approximately 10 percent more energy per gallon than gasoline.
26 Assumes $10,000 incremental cost, 12,000 miles per year, $3.70/gallon gasoline, $0.11/kWh electricity, 31 MPG gasoline car, and 0.32 kWh/mi energy use for an EV.

January 2015 65
use, as well as 200 high-power public “fast chargers” in various cities across the country. The intent of
the $230 million project is to collect and analyze data on vehicle and charging infrastructure use and
driver behavior to inform future government and private sector actions (DOE 2013). In June 2014, the
California Energy Commission also approved 15 grants, totaling more than $5 million, to install 475
electric vehicle chargers in communities throughout California.
Some private companies have also taken limited steps toward commercial development of EV charging
infrastructure. For example, in October 2013, an EV charging network startup called ChargePoint
launched a $100 million lease financing fund. Under the program, business owners can pay as little as $3
to $6 per day to lease a charging station, operated by ChargePoint, that normally costs about $6,000 to
install, or about $12,000 for a dual-charger unit. (GreenTech Media 2013)
Relevant policy questions related to EV deployment include whether, and under what conditions, the
government should continue to subsidize incremental purchase costs for individual EV owners and
further development of EV charging infrastructure. There are also questions as to how a significant roll-
out of EVs would affect peak electric generating capacity and grid reliability, and the best way to
mitigate these effects. One potential way to do this would be to develop new electric tariffs specifically
for EV charging – and/or to deploy “smart grid” technologies – that would enable and incentivize off-
peak charging.

66 January 2015
Transportation Recommended Reading
American Public Transportation Association (APTA 2010). 2010 Public Transportation Fact Book: 61st
Edition, April 2010.
http://www.apta.com/resources/statistics/Documents/FactBook/APTA_2010_Fact_Book.pdf.
American Public Transportation Association (APTA 2013). 2013 Public Transportation Fact Book: 64th
Edition, October 2013. http://www.apta.com/resources/statistics/Documents/FactBook/2013-APTA-
Fact-Book.pdf.
Argonne National Laboratory (Argonne 2013). “Case Study – Liquefied Natural Gas,” August 2013.
http://www.afdc.energy.gov/uploads/publication/lng_case_study_8_2013.pdf.
Clean Air Task Force (CATF 2005). Diesel and Health in America: The Lingering Threat, February 2005.
National Research Council (NRC 2010). Hidden Costs of Energy: Unpriced Consequences of Energy
Production and Use, 2010.
STAPPA and ALAPCO (STAPPA 2006). Controlling Fine Particulate Matter Under the Clean Air Act: A
Menu of Options, March 2006. http://www.4cleanair.org/PM25Menu-Final.pdf.
The Bipartisan Policy Center (BPC 2009). “Performance Driven: A New Vision for U.S. Transportation
Policy,” National Transportation Policy Project, June 9, 2009.
http://www.bipartisanpolicy.org/sites/default/files/NTPP%20Report.pdf.
Urban Land Institute (ULI 2010). Land Use and Driving: The Role Compact Development Can Play in
Reducing Green House Gas Emissions: Evidence from Three Recent Studies, 2010.
U.S. Department of Energy (DOE 2014). Transportation Energy Data Book: Edition 33, July 2014.
http://cta.ornl.gov/data/index.shtml .
U.S. Department of Energy (DOE 2014). Alternative Fuels & Advanced Vehicles Data Center.
http://www.afdc.energy.gov/afdc/fuels/biodiesel_statistics.html.
U.S. Environmental Protection Agency (EPA 2010). Model Year 2010 Green Vehicle Guide.
http://www.epa.gov/greenvehicles/download/all_alpha_10.pdf.
Wichars, L. et al. (Wichars 2010). “A Review of the Current State of Science for Health Effects of
Particulate Matter,” EM Magazine, Air and Waste Management Association, September 2010.

January 2015 67
References
A. Nemmar, et al. (Nemmar 2002). “Passage of Inhaled Particles into the Blood Circulation in Humans,”
Circulation, Volume 105 (2002): 411-414.
American Clean Skies Foundation (ACS 2012). “Natural Gas for Marine vessels, U.S. Market
Opportunities,” April 2012.
American Heart Association (AHA 2004). American Heart Association Scientific Statement: Air Pollution is
Serious Cardiovascular Risk, June 1, 2004.
American Oil & Gas Reporter (AOGR 2013). “LNG Emerging As Fuel Of Choice For Vessels, Ferries,” July
2013. http://www.aogr.com/web-exclusives/exclusive-story/lng-emerging-as-fuel-of-choice-for-vessels-
ferries.
American Public Transportation Association (APTA 2007). 2007 Public Transportation Fact Book: 58th
Edition, May 2007.
http://www.apta.com/resources/statistics/Documents/FactBook/APTA_2007_Fact_Book.pdf.
American Public Transportation Association (APTA 2010). 2010 Public Transportation Fact Book: 61st
Edition, April 2010.
http://www.apta.com/resources/statistics/Documents/FactBook/APTA_2010_Fact_Book.pdf.
American Public Transportation Association (APTA 2013). 2013 Public Transportation Fact Book: 64th
Edition, October 2013. http://www.apta.com/resources/statistics/Documents/FactBook/2013-APTA-
Fact-Book.pdf.
Association for Emissions Control by Catalyst (AECC 2010). International Regulatory Developments,
May-June 2010. http://www.aecc.be/en/content/pdf/AECC%20Newsletter%20May-June%202010.pdf.
Barnitt, R. and Chandler, K., (Barnitt et al. 2006). “New York City Transit (NYCT) Hybrid (125 order) and
CNG Transit Buses: Final Evaluation Report, Technical Report.” National Renewable Energy Laboratory.
NREL/TP-540-40125, November 2006; Chandler, K. and Walkowitcz, K. “King County Metro Transit
Hybrid Articulated Buses: Final Evaluation Report.” National Renewable Energy Laboratory. NREL/TP-
540-40585, December 2006.
California Air Resources Board (CARB 2008). “Staff Report: Initial Statement of Reasons for Proposed
Rulemaking,” Proposed Regulation for In-use On-road Diesel Vehicles, October 2008.
California Air Resources Board (CARB 2010a). Amendments to the Low-Emission Vehicle Program - LEV
III, October 4, 2010. http://www.arb.ca.gov/msprog/levprog/leviii/leviii.htm.
California Air Resources Board (CARB 2010b). Heavy-Duty Vehicle Inspection Programs, September 2010.
http://www.arb.ca.gov/enf/hdvip/hdvip.htm.
68 January 2015
California Air Resources Board (CARB 2010c). Fact Sheet: Draft Proposed Amendments to the Truck and
Bus Regulation, September-October 2010.
http://www.arb.ca.gov/msprog/ordiesel/documents/ordfactsep29.pdf.
California Air Resources Board (CARB 2010d). Carl Moyer Memorial Air Quality Standards Attainment
Program, October 27, 2010. http://www.arb.ca.gov/msprog/moyer/moyer.htm.
California Air Resources Board (CARB 2010e). Resolution 10-49, November 18, 2010.
http://www.arb.ca.gov/fuels/lcfs/Resolution_10_49.pdf.
California Air Resources Board (CARB 2010f). Changes to Diesel Rules Protect Public Health, Provide
Relief and Flexibility to California Businesses, December 17, 2010.
http://www.arb.ca.gov/newsrel/newsrelease.php?id=171.
Clean Air Task Force (CATF 2005). Diesel and Health in America: The Lingering Threat, February 2005.
Dieselnet (Dieselnet 2010). “Low Emission Vehicle III (LEV III) Standards.” Cars and Light-Duty Trucks:
California, October 2010. http://www.dieselnet.com/standards/us/ld_ca.php#leviii.
Diesel Technology Forum (DTF 2014). “What Happens When all 16,000 Trucks Hauling Port Freight are
Clean Diesel?”, October 1, 2014. http://www.dieselforum.org/news/what-happens-when-all-16-000-
trucks-hauling-port-freight-are-clean-diesel-.
Energy and Environmental Analysis (EEA 2004). “State Diesel Emission Inspection Programs: Trends and
Outcomes,” Prepared for Diesel Technology Forum, July 2004. http://www.dieselforum.org/news-
center/pdfs/scope-smoketest.pdf.
Experimental Aircraft Association (EEA 2010). “Stakeholders Call for FAA-led Process on AvGas
Replacement,” June 23, 2010. http://www.eaa.org/news/2010/2010-06-28_stakeholders.asp.
Federal Aviation Administration Office of Environment and Energy (FAA 2005). Aviation & Emissions: A
Primer, January 2005.
http://www.faa.gov/regulations_policies/policy_guidance/envir_policy/media/AEPRIMER.pdf.
Federal Aviation Administration (FAA 2009). Airport and Airway Trust Fund (AATF), August 5, 2009.
http://www.faa.gov/about/office_org/headquarters_offices/aep.
Federal Aviation Administration (FAA 2010). Report to Congress: National Plan of Airport Systems
(NPIAS) 2001-2015, September 27 2010.
http://www.faa.gov/airports_airtraffic/airports/planning_capacity/
Federal Railroad Administration (FRA 2010). High Speed and Intercity Passenger Rail, accessed October
31, 2010. http://www.fra.dot.gov/Page/P0060.
Federal Register (Federal Register 2008). National Emission Standards for Hazardous Air Pollutants for Source Categories: Gasoline Distribution Bulk Terminals, Bulk Plants, and Pipeline Facilities; and Gasoline

January 2015 69
Dispensing Facilities (EPA–HQ–OAR–2006–0406, FRL–8512–3). 40 CFR Part 63. Vol. 73, No. 7, Thursday, January 10, 2008. Federal Register (Federal Register 2008a). National Emission Standards for Hazardous Air Pollutants for Source Category: Gasoline Dispensing Facilities (EPA–HQ–OAR–2006–0406, FRL–8684–8). 40 CFR Part 63. Vol. 73, No. 123, Wednesday, June 25, 2008. Funders Network for Smart Growth and Livable Communities (Funders Network 1999). Opportunities for
Smarter Growth: Social Equity and the Smart Growth Movement, December 1999.
http://www.smartgrowthamerica.org/TP_Equity.pdf.
Green Car Reports (Green Car Reports 2014). “10 Questions On Hydrogen Fuel-Cell Cars To Ask Toyota,
Honda & Hyundai,” October 16, 2014. http://www.greencarreports.com/news/1094899_10-questions-
on-hydrogen-fuel-cell-cars-to-ask-toyota-honda-hyundai.
GreenTech Media (GreenTech Media 2013). “ChargePoint Launches $100M Public EV Charger Finance
Program,” October 17, 2013. http://www.greentechmedia.com/articles/read/chargepoint-launches-
100m-public-ev-charger-finance-program.
Heavy Duty Trucking, Trucking Info (HDT 2014). “Work ‘Paused’ on Cummins Natural Gas Engine,”
January 15, 2014. http://www.truckinginfo.com/channel/fuel-smarts/news/story/2014/01/work-
paused-on-isx15-gas-due-to-market-timing-uncertainty-cummins-says.aspx.
Heavy Duty Trucking, Trucking Info (HDT 2014a). “Eaton Discontinues Diesel-Electric Hybrid Trucks,”
September 4, 2014. http://www.truckinginfo.com/news/story/2014/09/eaton-confirms-it-s-
discontinued-diesel-electric-hybrid.aspx.
Health Effects Institute (HEI 2010). Traffic-Related Air Pollution: A Critical Review of the Literature on
Emissions, Exposure, and Health Effects, January 17, 2010.
http://pubs.healtheffects.org/view.php?id=334.
The Hill (The Hill 2014). The Briefing Room Blog. “Obama signs $10.8B highway bill,” August 8, 2014.
http://thehill.com/blogs/blog-briefing-room/news/214755-obama-signs-highway-bill.
Holt, M. et al. (Holt 2006). “Energy Policy Act of 2005: Summary and Analysis of Enacted Provisions,”
Congressional Research Service, March 8, 2006.
Huang, Edward, Henry Lee, Grant Lovellette, and Jose Gomez-Ibanez (Huang et al. 2010).
"Transportation Revenue Options: Infrastructure, Emissions, and Congestion," Harvard University Belfer
Center for Science and International Affairs, September 2010.
http://belfercenter.ksg.harvard.edu/publication/20389/transportation_revenue_options.html.
Hybridcars.com (Hybrid 2010). “J.D. Power: Annual U.S. Hybrid Sales Beyond 1 Million by 2015,” June 21,
2010, News Release. http://www.hybridcars.com/news/jd-power-annual-us-hybrid-sales-beyond-1-
million-2015-28126.html.

70 January 2015
Hybrid Truck Users Forum (HTUF 2010). “HTUF Vehicle Directory,” CalStart, accessed October 26, 2010.
http://www.calstart.org/htuf-vehicle-directory.aspx.
Idaho National Laboratory (INL 2007). EVAmerica Baseline Performance Testing, 1997, accessed on
October 25, 2007. http://avt.inel.gov/pdf/fsev/eva/genmot.pdf.
Inside EVs (Inside EVs 2014). Monthly Plug-in Sales Scorecard, accessed October 16, 2014.
http://insideevs.com/monthly-plug-in-sales-scorecard.
International Agency on Cancer (IARC 2010). Monograph 46, accessed October 26, 2010. http://www-
cie.iarc.fr/htdocs/monographs/vol46/46-01.htm.
International Business Times (IBT 2010). White House Strokes High-Speed Rail, October 28, 2010.
http://www.ibtimes.com/articles/76904/20101028/railroads.htm.
Kentucky Environmental and Public Protection Cabinet (Kentucky 2005). “EPA Approves Termination Of
Vehicle Emissions Testing Program In Northern Kentucky,” Press Release, September 28,
2005. http://migration.kentucky.gov/Newsroom/environment/N+KY+VET.htm.
Lynch, Kerry (Lynch 2010). “Industry Boosts Avgas Efforts,” Aviation Week, June 22, 2010.
http://www.aviationnewsreleases.com/2010/06/industry-boosts-avgas-efforts.html.
Nat G CNG Solutions. “Heavy Duty,” accessed October 15, 2010. http://www.nat-g.com/class-8-dual-
fuel-solutions.
New York Truck Voucher Incentive Program (NYT-VIP 2014). “NYSEV-VIP ‘All-Electric’ Vehicle Eligibility
List, accessed October 16, 2014. https://truck-vip.ny.gov/NYSEV-VIF-vehicle-list.php.
San Diego Union-Tribune (SDUT 2010). “High Speed Rail Folly: Feds Ignore Own Rules,” October 30,
2010. http://www.signonsandiego.com/news/2010/oct/30/high-speed-rail-folly-feds-ignore-own-rules/.
Society of Automotive Engineers (SAE 2003). Performance and Emissions Evaluation of Compressed
Natural Gas and Clean Diesel Buses at New York City’s Metropolitan Transit Authority, 2003.
Massachusetts Institute of Technology (MIT 2009). “Aircraft Impacts on Local and Regional Air Quality in
the United States,” Partnership for Air Transportation Noise and Emissions Reduction Project, October
2009. http://web.mit.edu/aeroastro/partner/reports/proj15/proj15finalreport.pdf.
Massachusetts Institute of Technology (MIT 2010). “Global Mortality Attributable to Aircraft Cruise
Emissions,” Department of Engineering, September 1, 2010.
http://pubs.acs.org/doi/full/10.1021/es101325r.
M.J. Bradley & Associates (MJB&A 2008), Updated Comparison of Energy Use & Emissions from Different
Transportation Modes, prepared for the American Bus Association, October 2008.

January 2015 71
M.J. Bradley & Associates (MJB&A 2009). Lower Manhattan Construction, Construction Equipment
Retrofit Case Study, September 2009.
National Renewable Energy Laboratory (NREL 2007). Research Advances: Cellulosic Ethanol: NREL/BR-
510-40742, March 2007.
National Research Council (NRC 2010). Hidden Costs of Energy: Unpriced Consequences of Energy
Production and Use, 2010.
NGVAmerica (NGVAmerica 2010). Guide to Available Natural Gas Vehicles and Engines, May 21, 2010.
www.ngvc.org.
New York Governor’s Office (NY 2010). Press Release: Governor David A. Paterson Acts on 90 Bills,
August 31, 2010. http://www.state.ny.us/governor/press/08311092Bills.html.
Plug-in America (Plug 2010). Plug-in Vehicle Tracker, accessed October 25, 2010.
www.pluginamerica.org/vehicles.
Shell Pipeline Company (Shell 2010). How Do Pipelines Work?, accessed October 7, 2010.
http://www.shellpipeline.com/aboutpipelines_howwork.htm.
Society of Automotive Engineers (SAE 2004). A Study of the Effects of Fuel Type and Emission Control
Systems on Regulated Gaseous Emissions from Heavy-Duty Diesel Engines, 2004.
STAPPA and ALAPCO (STAPPA 2006). Controlling Fine Particulate Matter Under the Clean Air Act: A
Menu of Options, March 2006. http://www.4cleanair.org/PM25Menu-Final.pdf.
Texas Emission Reduction Plan (TERP 2014). TERP Summary Reports, August 21, 2010,
http://www.tceq.state.tx.us/implementation/air/terp.
The Bipartisan Policy Center (BPC 2009). “Performance Driven: A New Vision for U.S. Transportation
Policy,” National Transportation Policy Project, June 9, 2009.
http://www.bipartisanpolicy.org/sites/default/files/NTPP%20Report.pdf.
The New York Times (NYT 2004). “Ford Parks Its Natural Gas Bandwagon,” September 26, 2004.
http://www.nytimes.com/2004/09/26/automobiles/26AUTO.html?partner=rssnyt&emc=rss.
Transportation for America (Transportation 2009). Platform for the National Transportation Program
Authorization, 2009. http://t4america.org/platform/.
Urban Land Institute (ULI 2007). Growing Cooler: The Evidence on Urban Development and Climate
Change, 2007.
Urban Land Institute (ULI 2010). Land Use and Driving, The Role Compact Development Can Play in
Reducing Green House Gas Emissions: Evidence from Three Recent Studies, 2010.

72 January 2015
U.S. Census Bureau (Census 2009). “National Tables: 2009, Table 1.1: Introductory Characteristics All
Housing Units,” American Housing Survey, 2009.
U.S. Department of Energy (DOE 2007). “Light-Duty Model Offerings by Fuel Type, 2007.” Alternative
Fuels and Advanced Vehicles Data Center, accessed on November 19, 2007.
U.S. Department of Energy (DOE 2010a). “Biodiesel Statistics,” Alternative Fuels & Advanced Vehicles
Data Center, accessed October 25, 2010.
http://www.afdc.energy.gov/afdc/fuels/biodiesel_statistics.html.
U.S. Department of Energy (DOE 2010b). “Federal & State Incentives and Laws,” Alternative Fuels &
Advanced Vehicles Data Center, accessed October 25, 2010.
http://www.afdc.energy.gov/afdc/laws/matrix/tech.
U.S. Department of Energy (DOE 2013). The EV Project, “Electric Vehicle Public Charging – Time vs.
Energy,” 2013. http://www.theevproject.com/cms-assets/documents/106078-254667.tvse.pdf.
U.S. Department of Energy (DOE 2014). Transportation Energy Data Book: Edition 33, July 2014.
http://cta.ornl.gov/data.
U.S. Department of Energy (DOE 2014a). Fuel Economy.gov, accessed October 15, 2014.
www.fueleconomy.gov.
U.S. Department of Energy (DOE 2014b). “Clean Cities Alternative Fuel Price Report,” July 2014.
http://www.afdc.energy.gov/uploads/publication/alternative_fuel_price_report_july_2014.pdf.
U.S. Department of Energy (DOE 2014c). “Alternative Fueling Station Locator,” Alternative Fuels Data
Center, accessed October 17, 2014.
http://www.afdc.energy.gov/locator/stations/results?utf8=%E2%9C%93&location=&filtered=true&fuel=
LNG&owner=all&payment=all&ev_level1=true&ev_level2=true&ev_dc_fast=true&radius_miles=5
U.S. Department of Energy (DOE 2014d). “Flexible Fuel Vehicles,” Alternative Fuels Data Center,
accessed October 17, 2014. http://www.afdc.energy.gov/vehicles/flexible_fuel.html.
U.S. Department of Energy (DOE 2014e). 2013 Vehicle Technologies Market Report, March 2014.
http://cta.ornl.gov/vtmarketreport/pdf/2013_vtmarketreport_full_doc.pdf.
U.S. Department of Energy (DOE 2014f). Monthly Energy Review October 2014. Accessed October 17,
2014. http://www.eia.gov/totalenergy/data/monthly/index.cfm
U.S. Department of Energy (DOE 2014g). “Availability of Hybrid and Plug-In Electric Vehicles,” Alternative
Fuels Data Center, accessed October 17, 2014.
http://www.afdc.energy.gov/vehicles/electric_availability.html.

January 2015 73
U.S. Department of Transportation (DOT 2010). DOT Awards $2.4 Billion To Continue Developing 21st
Century High-Speed Passenger Rail Corridors, October 28, 2010. http://fastlane.dot.gov/2010/10/dot-
awards-24-billion-to-continue-developing-21st-century-high-speed-passenger-rail-corridors.html.
U.S. Department of Transportation (DOT 2010a). U.S. Transportation Secretary LaHood Announces
Corridors, Projects and Initiatives Eligible for Funding as Part of America’s Marine Highway, August 11,
2010. http://www.dot.gov/affairs/2010/marad1310.html.
U.S. Department of Transportation (DOT 2014). Bureau of Transportation Statistics, National
Transportation Statistics, Table 1-50: U.S. Ton-Miles of Freight (BTS Special Tabulation) (Millions).
http://www.rita.dot.gov/bts/sites/rita.dot.gov.bts/files/publications/national_transportation_statistics/
html/table_01_50.html.
U.S. Department of Transportation (DOT 2014a). Bureau of Transportation Statistics, National
Transportation Statistics, Table 1-19: Sales of Hybrid Vehicles in the United States.
http://www.rita.dot.gov/bts/sites/rita.dot.gov.bts/files/publications/national_transportation_statistics/
html/table_01_19.html.
U.S. Department of Transportation (FHWA 2013). Federal Highway Administration. Highway Trust Fund
and Taxes, September 2013. https://www.fhwa.dot.gov/map21/factsheets/htf.cfm
U.S. Department of Transportation (FHWA 2014). Federal Highway Administration. Apportionment of
Funds for the Period Beginning on October 1, 2014, and Ending on May 31, 2015, Pursuant to the
Highway and Transportation Funding Act of 2014, Notice 4510.778. October 1, 2014.
https://www.fhwa.dot.gov/legsregs/directives/notices/n4510778.cfm
U.S. Energy Information Administration (EIA 2009). Annual Energy Outlook 2008, March 2008.
http://www.eia.doe.gov/oiaf/aeo/pdf/0383(2008).pdf.
U.S. Energy Information Administration (EIA 2009). Annual Energy Outlook 2009, March 2009.
http://www.eia.doe.gov/oiaf/aeo/pdf/0383(2009).pdf.
U.S. Energy Information Administration (EIA 2010). Annual Energy Review 2009, August 19, 2010.
http://www.eia.doe.gov/emeu/aer/contents.html.
U.S. Energy Information Administration (EIA 2010a). Annual Energy Outlook 2010 with Projections to
2035. May 11, 2010. http://www.eia.doe.gov/oiaf/aeo/nuclear_power.html.
U.S. Energy Information Administration (EIA 2010b). “Alternatives to Traditional Transportation Fuels
2008.” April 2010. http://www.eia.doe.gov/cneaf/alternate/page/atftables/afv_atf.html.
U.S. Energy Information Administration (EIA 2013). “Renewable & Alternative Fuels: Alternative Fuel
Vehicle Data.” April 2013. http://www.eia.gov/renewable/afv/index.cfm
U.S. Energy Information Administration (EIA 2014). “Refining and Processing,” Petroleum and Other
Liquids. http://www.eia.gov/dnav/pet/pet_pnp_cap1_dcu_nus_a.htm.

74 January 2015
U.S. Energy Information Administration (EIA 2014a). “Imports/exports & Movements,” Petroleum and
Other Liquids. http://www.eia.gov/dnav/pet/pet_pnp_cap1_dcu_nus_a.htm.
U.S. Environmental Protection Agency (EPA 1999). Regulatory Impact Analysis: Control of Air Pollution
from New Motor Vehicles: Tier 2 Motor Vehicle Emission Standards and Gasoline Sulfur Control
Requirements, December 1999.
U.S. Environmental Protection Agency (EPA 2000). EPA420-R-00-026, Appendix B, VMT Distribution,
2000.
U.S. Environmental Protection Agency (EPA 2001). Fact Sheet: Proposed Rule to Control Emission from
Petroleum Refineries that Occur at Catalytic Cracking (Fluid and Other) Units, Catalytic Reforming Units,
and Sulfur Plant Units, July 2001. http://www.epa.gov/ttn/atw/petuuu/petrolfs.pdf.
U.S. Environmental Protection Agency (EPA 2002). A Comprehensive Analysis of Biodiesel Impacts on
Exhaust Emissions Draft Technical Report, October 2002.
U.S. Environmental Protection Agency (EPA 2002a). “Health Assessment Document For Diesel Engine
Exhaust,” National Center for Environmental Assessment, May 2002.
U.S. Environmental Protection Agency (EPA 2003). “Major Elements of Operating I/M Programs.” Office
of Transportation and Air Quality, March 2003. http://www.epa.gov/oms/epg/420b03012.pdf
U.S. Environmental Protection Agency (EPA 2004). Particulate Matter Research Program: Five Years of
Progress, 2004.
http://www.epa.gov/airscience/pdf/pm_research_program_five_years_of_progress.pdf.
U.S. Environmental Protection Agency (EPA 2009). “2005 National Emissions Inventory Data &
Documentation: Tier Summaries,” Technology Transfer Network Clearinghouse for Inventories &
Emissions Factors, March 11, 2009. http://www.epa.gov/ttn/chief/net/2005inventory.html.
U.S. Environmental Protection Agency (EPA 2009a). Regulatory Announcement: New Emission Standards
for New Commercial Aircraft Engines, March 17, 2009. http://www.epa.gov/otaq/aviation.htm.
U.S. Environmental Protection Agency (EPA 2009b). “EPA Redesignates 14 Ohio Counties to Attainment
of Ozone Standard,” Press Release, September 15, 2009.
U.S. Environmental Protection Agency (EPA 2009c). Regulatory Impact Analysis: Control of Emissions of
Air Pollution from Category 3 Marine Diesel Engines, December 2009.
U.S. Environmental Protection Agency (EPA 2009d). E85 and Flex Fuel Vehicles, EPA-420-F-09-065,
October 2009.
U.S. Environmental Protection Agency (EPA 2009e). Integrated Science Assessment for Particulate
Matter, EPA 600/R-08/139F, December 2009.
http://cfpub.epa.gov/ncea/cfm/recordisplay.cfm?deid=216546.
January 2015 75
U.S. Environmental Protection Agency (EPA 2010). “2009 Recovery Act: National Clean Diesel Funding
Assistance Awarded Projects,” National Clean Diesel Campaign, accessed October 28, 2010.
http://www.epa.gov/cleandiesel/projnational-aara.htm.
U.S. Environmental Protection Agency (EPA 2010a). “EPA and NHTSA to Propose Greenhouse Gas and
Fuel Efficiency Standards for Heavy-duty Trucks; Begin Process for Further Light-duty Standards,” EPA-
420-F-10-038, May 2010.
U.S. Environmental Protection Agency (EPA 2010b). “EPA and NHTSA Announce a First Step in the
Process for Setting Future Greenhouse Gas and Fuel Economy Standards for Passenger Cars and Light
Trucks,” EPA-420-F-10-051, October 2010.
U.S. Environmental Protection Agency (EPA 2010c). Model Year 2010 Green Vehicle Guide, accessed
October 25, 2010. http://www.epa.gov/greenvehicles/download/all_alpha_10.pdf.
U.S. Environmental Protection Agency (EPA 2010d). “Reformulated Gas,” Office of Transportation & Air
Quality. http://www.epa.gov/otaq/rfg.htm.
U.S. Environmental Protection Agency (EPA 2010e). “Regulations and Standards,” Transportation and
Climate, accessed October 22, 2010. http://www.epa.gov/oms/climate/regulations.htm#1-1.
U.S. Environmental Protection Agency (EPA 2010f). “Environmental Justice,” Compliance and
Enforcement, http://www.epa.gov/environmentaljustice/.
U.S. Environmental Protection Agency (EPA 2010g). “Advance Notice of Proposed Rulemaking on Lead
Emissions from Piston-Engine Aircraft Using Leaded Aviation Gasoline: Regulatory Announcement,”
Nonroad Engines, Equipment, and Vehicles, April 2010.
http://www.epa.gov/nonroad/aviation/420f10013.htm.
U.S. Environmental Protection Agency (EPA 2011). “EPA announces E15 Partial Waiver Decision,”
EPA420-F-11-003, January 21, 2011.
U.S. Environmental Protection Agency (EPA 2011a). “Greenhouse Gas Emissions Standards and Fuel
Efficiency Standards for Medium- and Heavy-Duty Engines and Vehicles,” Federal Register, Volume 76,
No. 179, pg 57106, September 15, 2011.
U.S. Government Accountability Office (GAO 2010). “Highway Trust Fund,” Report to the Congressional
Requesters, June 2010. http://www.gao.gov/new.items/d10780.pdf.
U.S. Maritime Administration (Maritime 2009). Maritime Administration Information Related to the
American Recovery and Reinvestment Act of 2009, accessed October 2010.
http://www.marad.dot.gov/about_us_landing_page/marad_recovery_act/recovery.htm.
The White House Office of the Press Secretary (White House, 2012). “Obama Administration Finalizes
Historic 54.5 MPG Fuel Efficiency Standards,” August 28, 2012. Accessed at

76 January 2015
http://www.whitehouse.gov/the-press-office/2012/08/28/obama-administration-finalizes-historic-545-
mpg-fuel-efficiency-standard.
Wichars, L. et al. (Wichars 2010). “A Review of the Current State of Science for Health Effects of
Particulate Matter,” EM Magazine, Air and Waste Management Association, September 2010.
Wilson, R. and Spengler, J. (Wilson 1999). Particles in Our Air: Concentrations and Health Effects, 1999.