american realty advisors house view: h1 2021
TRANSCRIPT

American Realty Advisors
House View:H1 2021Investment Outlook

American Realty Advisors 2
U.S. Real Estate Investment Outlook H1 2021
Macroeconomic Context
• As expected, the recovery received
a double shot in the arm with the
increased availability of vaccines
and a further round of stimulus
under the Biden administration.
• We expect U.S. GDP to expand by
~6.5% for the year.
• Divergences in the labor recovery
(age, income, education level)
remain a risk; how cities seek to
solve increasing inequalities could
drive policy for decades to come.
Real Estate Markets
• Industrial fundamentals have
continued their fiery streak
unabated, as occupiers continue to
shore up their inventories.
• Except for hotels, distressed real
estate deals in other sectors have
not materialized as some capital
raisers had hoped.
• With a lower return environment
expected across asset classes,
many investors have increased
their target allocations to real
estate.
Images: (Above) Bolstered household finances from the
latest stimulus round are driving a renewed resurgence in
demand for goods. (Below) Companies are beginning to
cautiously call employees back to the office.
Invigorated by policy support and vaccine distribution, the U.S. economy is poised for growth
ARA House View H1 2021
American Realty Advisors 3
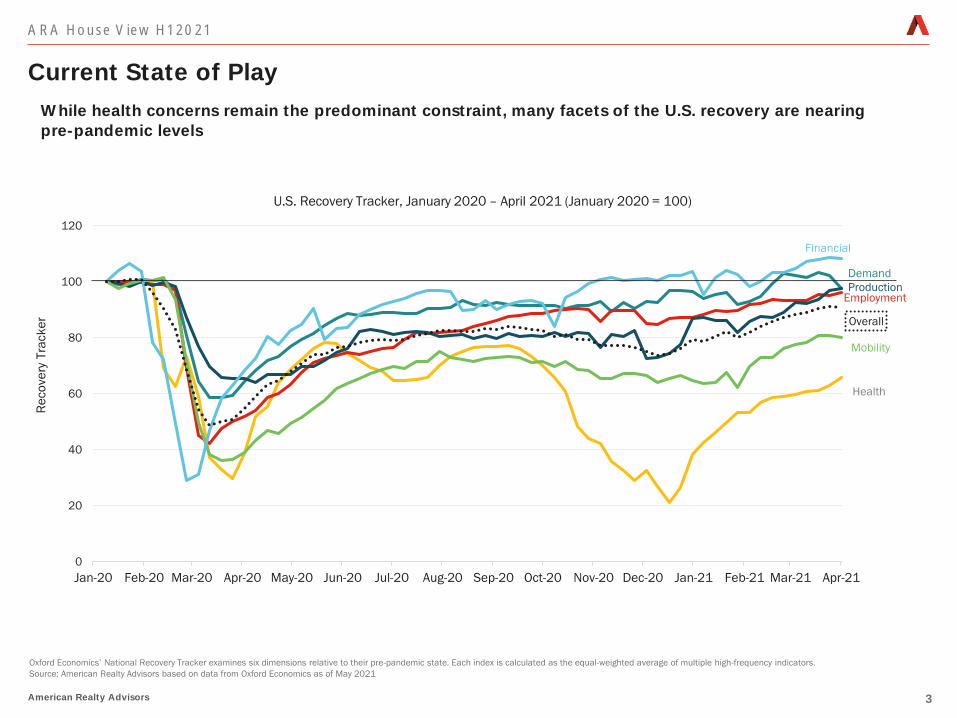
While health concerns remain the predominant constraint, many facets of the U.S. recovery are nearing pre-pandemic levels
0
20
40
60
80
100
120
Jan-20 Feb-20 Mar-20 Apr-20 May-20 Jun-20 Jul-20 Aug-20 Sep-20 Oct-20 Nov-20 Dec-20 Jan-21 Feb-21 Mar-21 Apr-21
Re
co
ve
ry T
rack
er
Current State of Play
ARA House View H1 2021
Oxford Economics’ National Recovery Tracker examines six dimensions relative to their pre-pandemic state. Each index is calculated as the equal-weighted average of multiple high-frequency indicators.
Source: American Realty Advisors based on data from Oxford Economics as of May 2021
U.S. Recovery Tracker, January 2020 – April 2021 (January 2020 = 100)
Financial
Demand
EmploymentProduction
Overall
Mobility
Health

American Realty Advisors 4
Disparity in recovery for low-wage earners suggests there remains a ways to go to achieving full employment
Employment Backdrop Strengthening, But Not For Everyone
Change in employment rates among workers by wage bracket, January 2020 – March 2021
Note: Percentages reflect employment percentage relative to January 2020 baseline. Data is not seasonally adjusted.
Source: American Realty Advisors based on data from the Opportunity Insights Economic Tracker, Earnin, Intuit, Kronos and Paychex as of April 2021
-40%
-35%
-30%
-25%
-20%
-15%
-10%
-5%
0%
5%
$60k+ $27k-$60K <$27K
• The national unemployment rate
has improved meaningfully from the
14.8% peak recorded in April 2020,
and currently stands at 6.1%.
• Yet gains have been uneven across
the income spectrum.
• Relative to January 2020,
employment among those making
$60K+ was back to pre-pandemic
levels as of March, while those
making less than $27K remained
30% below pre-pandemic levels.
• While many of these roles are
concentrated in services that are
heavily reliant on in-person contact
and thus should return as openings
progress, it will take time to absorb
the slack.
ARA House View H1 2021

American Realty Advisors 5
• Progress in mass-production technologies post-WWI created new industries & increased productivity in existing ones.
1920’s 2020’s
Technological Advancement
Investment in Infrastructure
Pent-Up Demand
New Schools of Thought
• Acceleration in advancement and adoption of next-era technologies (biopharmaceuticals, AI, clean energy/electric).
• Broader accessibility of the automobile prompted development of national highway network (~$1bn spent per year).
• Biden’s green infrastructure package is an ambitious one (to the tune of $2tn) and would hasten shift to new, cleaner energy sources, though has many hoops to jump through before becoming reality.
• WWI and Spanish Flu curtailed activities; advent of affordable consumer conveniences (vacuum cleaners, washing machines, auto) prompted significant spending.
• In aggregate, U.S. households saved ~$1.6 trillion more than they otherwise would have – early indications are that pent-up demand, particularly for services, is already beginning to materialize in travel, F&B spending.
• Greater prosperity brought about nouveau ideas and challenges to traditional norms; women gained the right to vote.
• Societal issues (racism, inequality, climate change) are at the forefront of public consciousness, prompting sweeping sociopolitical changes.
ARA House View H1 2021

Capital Markets

American Realty Advisors 7
The recent retreat in long-term Treasury yields suggests bond market investors believe the forthcoming acceleration in inflation will be relatively short-lived
0.0%
0.2%
0.4%
0.6%
0.8%
1.0%
1.2%
1.4%
1.6%
1.8%
2.0%
U.S. 10-Year bond yield, January 2020 – May 2021
Source: American Realty Advisors based on data from Macrobond and Oxford Economics as of May 2021
• The unprecedented levels of
stimulus, supply shortages and
surging demand have prompted
some to speculate the U.S. may be
entering a new inflationary period.
• Yet despite what is sure to be higher
inflation in 2021, Treasury yields
have begun to modestly unwind
from their March highs.
• It seems the persistent reinforcing
of the Fed’s new inflation policy
framework is forcing market
participants to back off expectations
of additional rate hikes between
now – 2023.
• We believe inflation to be a
temporary factor over the next 1-2
years but does not present material
downside risk to CRE.
Capital Markets - ARA House View H1 2021
Reading the Tea Leaves on Inflation

American Realty Advisors 8
.Source: American Realty Advisors based on data from CoStar as of May 2021
• Lumber prices have skyrocketed in recent months, as
strong demand + supply issues have culminated in a
perfect pricing storm.
• Two supply valves are poised to release some of the
pressure in the near- and medium-term:
1) Lumber imports from Europe and Canada are on the rise given reduced tariffs and a strong USD, and
2) Easing of domestic social distancing measures should allow mills to return to full capacity soon.
• It is these types of supply-demand lead-lag relationships
that lead us to believe many price increases today are
due to reopening adjustments that are expected to
moderate as supply is allowed to catch up.
$200
$400
$600
$800
$1,000
$1,200
$1,400
$1,600
$0.0
$0.2
$0.4
$0.6
$0.8
$1.0
$1.2
$1.4
Jan
-19
Ma
r-1
9
Ma
y-1
9
Jul-1
9
Se
p-1
9
No
v-1
9
Jan
-20
Ma
r-2
0
Ma
y-2
0
Jul-2
0
Se
p-2
0
No
v-2
0
Jan
-21
Ma
r-2
1
Lumber imports (billions, LHS) Lumber prices (RHS)
Lumber imports and prices, January 2019 – March 2021
Capital Markets - ARA House View H1 2021
Building Our Inflation Outlook: Lumber as a Proxy
Lumber costs are an oft-cited barometer of inflation given its specific impact on real estate, but pressures are expected to ease

American Realty Advisors 9
Note: Quarterly 10-Year Treasury data reflects the rate at the end of the quarter.
Source: American Realty Advisors based on data from Macrobond and NCREIF as of May 2021
Rolling quarterly U.S. cap rates by property type and 10-Year U.S. Treasury yields, Q1 2000 – Q1 2021 (Q1 2000 = 100)
• Historically there has been the belief that
when interest rates rise, real estate cap rates
increase to account for the added cost to
borrow capital; however, that has not always
been the case.
• In fact, the U.S. 10-Year has had several
bouts of short-term increases that have not
produced a corresponding increase in cap
rates.
• This is because cap rates are influenced not
just by borrowing costs, but by other factors
(capital dry powder, rising demand, reduced
supply) that occur in a rising rate
environment and keep values intact.
0
20
40
60
80
100
120
Q1
20
00
Q1
20
01
Q1
20
02
Q1
20
03
Q1
20
04
Q1
20
05
Q1
20
06
Q1
20
07
Q1
20
08
Q1
20
09
Q1
20
10
Q1
20
11
Q1
20
12
Q1
20
13
Q1
20
14
Q1
20
15
Q1
20
16
Q1
20
17
Q1
20
18
Q1
20
19
Q1
20
20
Q1
20
21
Industrial Apartment Office Retail US10Y
Capital Markets - ARA House View H1 2021
What Impact Could Transitory Inflation Have on Cap Rates?
Real estate cap rates have demonstrated an ability to absorb modest increases in the 10Y in the past

American Realty Advisors 10
Historical target allocations to real estate and fixed income, 2017-21
Source: American Realty Advisors based on data from the 2021 Institutional Investors Real Estate Trends report conducted by Kingsley and IREI as of May 2021
• With expectations of low yields being offered in other
perceived lower-risk asset classes (cash, fixed income),
investors are increasingly looking to real estate to provide
much-needed income.
8.5%
22.5%
9.8%
23.5%
9.4%
26.6%
9.5%
27.9%
9.7%
25.3%
0%
5%
10%
15%
20%
25%
30%
35%
Real Estate Fixed Income
2017 2018 2019 2020 2021
• As a result, capital appetite for U.S. core/core-plus strategies
has grown, serving as a value stabilizer throughout the recent
uncertainty.
0%
10%
20%
30%
40%
50%
60%
70%
U.S.
Core/Core
Plus
U.S. Value
Add
U.S.
Opportunistic
U.S. REITs U.S. RE Debt
2018 2019 2020 2021
Historical target allocations by real estate strategy, 2018-21
Capital Markets - ARA House View H1 2021
Appetite for Commercial Real Estate Continues to Grow
Target allocations to real estate continue to edge up, offsetting expected withdrawals from fixed income

American Realty Advisors 11
-4%
-2%
0%
2%
4%
6%
8%
10%
12%
14%
14
Q1
14
Q3
15
Q1
15
Q3
16
Q1
16
Q3
17
Q1
17
Q3
18
Q1
18
Q3
19
Q1
19
Q3
20
Q1
20
Q3
21
Q1
Apartment Industrial Office Retail
Note: Data reflects transactions of US $2.5 million and greater and includes individual, portfolio and entity-level transactions.
Source: American Realty Advisors based on data from Real Capital Analytics and Preqin as of May 2021
• After the pause in transaction volumes in Q2/Q3 2020,
volume surged in the fourth quarter as investors sought
opportunities to deploy capital.
• This has had the effect of re-accelerating the pace of
year-over-year price growth across sectors, buoying
values (a phenomenon we anticipated in our H2 2020
House View).
• Given it seems that the lion’s share of fundamental
weakness is behind us and there remains significant dry
powder earmarked for U.S. real estate ($250 billion), we
expect values to continue to rise.
Year-over-year change in RCA CPPI by sector, 1Q 2014 – 1Q 2021
Capital Markets - ARA House View H1 2021
Real Estate Price Growth Continues
Property prices continue to expand, with growth firmly re-accelerating in hardest-hit sectors

American Realty Advisors 12
-15
-10
-5
0
5
10
15
Office Retail Industrial Apartment NPI - All Office Retail Industrial Apartment NPI - All
(%)
ARA Consensus Actual
2020 total return forecasts are based on the November 2020 submission by ARA and the PREA Consensus Survey results. 2021 projections reflect the ARA submission as well as the overall consensus as of the February 2021
survey.
Source: American Realty Advisors based on data from the PREA Consensus Survey, November 2020 and February 2021
Total return forecasts, actual compared to ARA, PREA consensus 2020 and predictions for 2021
2020 2021
Capital Markets - ARA House View H1 2021
Leading With Conviction: The Outlook for Property Type Total Returns
ARA Research forecasts of total returns have been more accurate than the consensus, and suggest there is increasing reason for optimism

Property Markets
American Realty Advisors 14
-15
-10
-5
0
5
10
15
20
25
Industrial Apartment Office Retail
2/3rds of Markets Fall in This Range Index Max Min
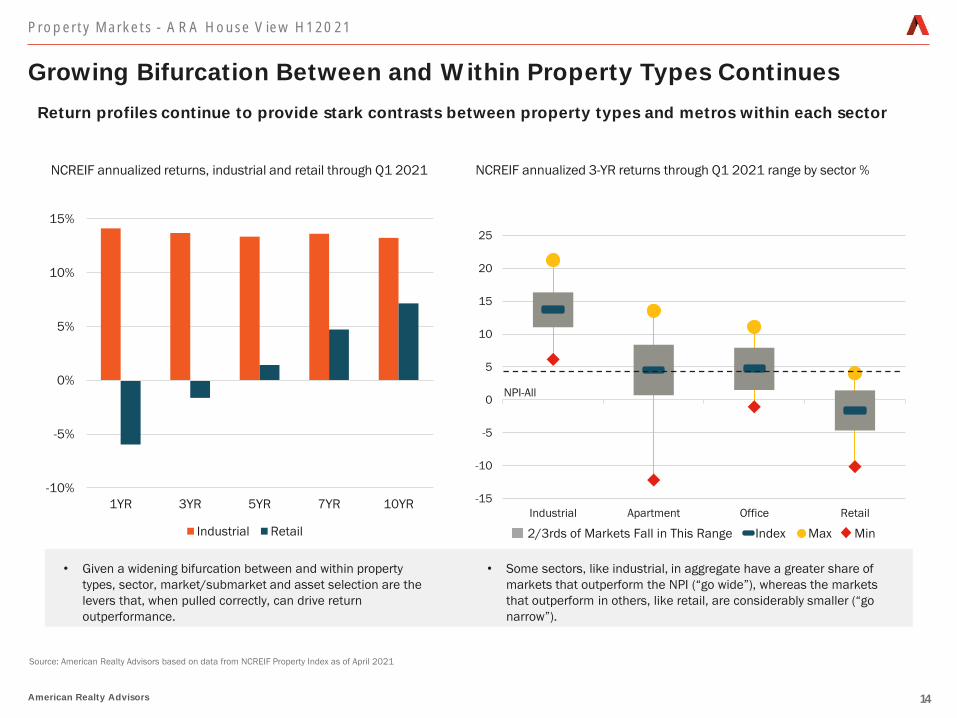
Growing Bifurcation Between and Within Property Types Continues
Source: American Realty Advisors based on data from NCREIF Property Index as of April 2021
-10%
-5%
0%
5%
10%
15%
1YR 3YR 5YR 7YR 10YR
Industrial Retail
NCREIF annualized returns, industrial and retail through Q1 2021 NCREIF annualized 3-YR returns through Q1 2021 range by sector %
• Given a widening bifurcation between and within property
types, sector, market/submarket and asset selection are the
levers that, when pulled correctly, can drive return
outperformance.
• Some sectors, like industrial, in aggregate have a greater share of
markets that outperform the NPI (“go wide”), whereas the markets
that outperform in others, like retail, are considerably smaller (“go
narrow”).
NPI-All
Property Markets - ARA House View H1 2021
Return profiles continue to provide stark contrasts between property types and metros within each sector
American Realty Advisors 15
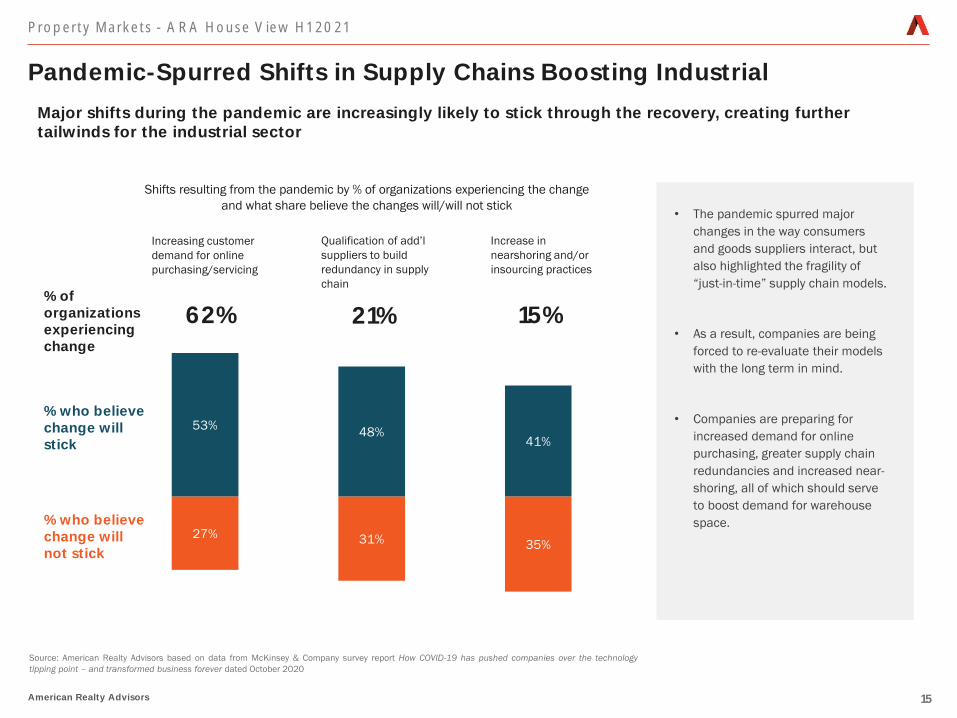
Pandemic-Spurred Shifts in Supply Chains Boosting Industrial
• The pandemic spurred major
changes in the way consumers
and goods suppliers interact, but
also highlighted the fragility of
“just-in-time” supply chain models.
• As a result, companies are being
forced to re-evaluate their models
with the long term in mind.
• Companies are preparing for
increased demand for online
purchasing, greater supply chain
redundancies and increased near-
shoring, all of which should serve
to boost demand for warehouse
space.
Shifts resulting from the pandemic by % of organizations experiencing the change
and what share believe the changes will/will not stick
Source: American Realty Advisors based on data from McKinsey & Company survey report How COVID-19 has pushed companies over the technology
tipping point – and transformed business forever dated October 2020
% of organizations experiencing change
% who believe change will stick
% who believe change will not stick
Increasing customer
demand for online
purchasing/servicing
Qualification of add’l
suppliers to build
redundancy in supply
chain
Increase in
nearshoring and/or
insourcing practices
62% 21% 15%
53%48%
41%
27% 31% 35%
Property Markets - ARA House View H1 2021
Major shifts during the pandemic are increasingly likely to stick through the recovery, creating further tailwinds for the industrial sector

American Realty Advisors 16
Property Markets - ARA House View H1 2021
Balancing Price and Growth
Estimated current market cap rate compared to ARA research 5-year rent growth forecast
Note: Estimated market cap rates are based on CBRE-EA estimates as of Q4 2020, adjusted downward by 50 bps to account for actual transaction cap rates.
Source: American Realty Advisors based on data from CBRE-EA and CoStar as of May 2021
ATL
AUS
BALT
BOS
CHT
CHI COLUM
DFWDEN
OAK
FLL
HOU
INDY
IE
KC
LA
MEM
MIA
MSP
NASH
NY
NNJOC
ORL
PHL
PHX
PORTRAL
SLC
SAN ANT
SD
SEA
SJ
STL
TAM
DC
WPB
1%
2%
3%
4%
5%
6%
7%
3.0% 3.5% 4.0% 4.5% 5.0% 5.5%
AR
A R
ese
arc
h 5
-Ye
ar
Re
nt
Gro
wth
CA
GR
Fo
reca
st
(20
21
-25
)
Estimated current market cap rate
• Industrial cap rates continue to compress
given the seemingly insatiable investor and
occupier demand.
• While the outlook for the sector remains
robust, investors should hedge going-in
pricing relative to prospects for future rental
rate growth.
• At a 3.37% rent growth CAGR, a going-in cap
rate of 4.6% in Indianapolis is relatively less
appealing than a 4.5% cap rate in Atlanta
with a 4.8% rent growth CAGR – so market
selection, even in a hot sector, is still key.
Highly infill
markets with
high rent
growth
potential
Most attractive combination of
pricing and rent growth potential
Primarily a
yield play
With industrial a key sector focus for many, pricing relative to growth continues to be a critical lens
American Realty Advisors 17
Atlanta
Austin
Charleston
Charlotte
Columbus
Dallas
Denver
Miami
Tampa
West Palm Beach
Orlando
Houston Jacksonville
Las Vegas
Nashville
Phoenix
Portland
RaleighReno
Inland Empire
Sacramento
Salt Lake City
San Antonio Seattle
1%
2%
3%
4%
5%
6%
7%
8%
9%
15% 20% 25% 30% 35% 40% 45%
5-Yr Cumulative Supply as % of Inventory
Multifamily Market Selection: Measuring Migration (and Supply)
Source: American Realty Advisors based on data from CoStar and ARA proprietary forecasts as of May 2021
• There continues to be significant capital pursuing multifamily
deals in Sun Belt/ “Smile” markets as investors follow renters
south and west; yet not all these metros are created equal.
• We prefer a strategy that is focused primarily on those markets
that have a supportive combination of both high in-migration and
relatively less supply growth (like Austin, Phoenix and Raleigh), with
a narrower focus in markets where market-level supply is expected
to be higher.
21-25 Avg. Rent Growth
<2%
2-3%
3%+
Property Markets - ARA House View H1 2021
The magnitude of in-
Cu
mu
lati
ve N
et
Mig
rati
on
20
21
-25
as %
of
Cu
rre
nt
Po
pu
lati
on

American Realty Advisors 18
Urban Exodus? More Noise than Sound!
Source: American Realty Advisors based on data from CBRE, “COVDI-19 Impact on Resident Migration Patterns” and CoStar as of May 2021
Total 2020 moves as a percent of 2019 population by distance
0%
1%
2%
3%
4%
5%
6%
Within 100 miles Further than 100 miles
• As the pandemic wore on, residents’ desire
for larger dwellings and less density,
prompted calls for the “end of the city”.
• The data, however, shows that more movers
stayed within 100 miles of the city,
suggesting a more benign shift.
• We believe this widens the investable
opportunity set in these markets, and hints
that professionals are expecting employers
to call workers back to the office imminently.
-10% -5% 0% 5% 10% 15% 20%
Greenwich (CT)
Eastern Suffolk (LI)
East Monmouth Co. (NJ)
Western Suffolk (LI)
Eastern Nassau (LI)
Rockland Co. (NJ)
Central Suffolk (LI)
Westchester Co. North
Long Island City
Lower East Side
Financial District
Midtown East
Downtown Brooklyn
Effective 12-month rent growth, Q1 2021, NY/Tri-state submarkets
Property Markets - ARA House View H1 2021
While headlines declared a mass migration from urban cores, most movers remained close to major metros
American Realty Advisors 19
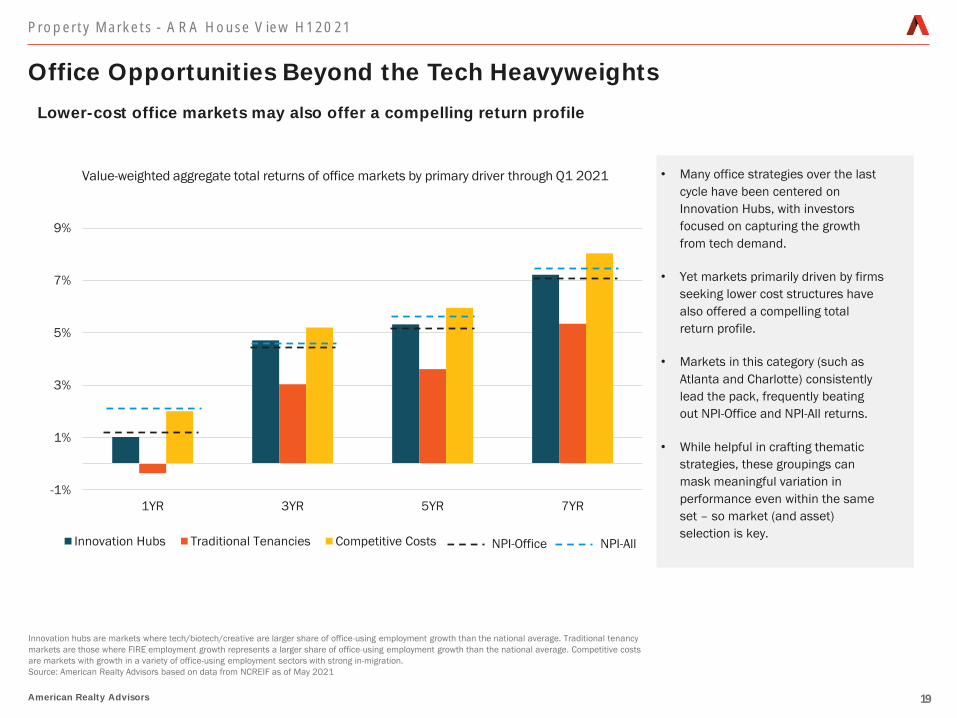
Office Opportunities Beyond the Tech Heavyweights
• Many office strategies over the last
cycle have been centered on
Innovation Hubs, with investors
focused on capturing the growth
from tech demand.
• Yet markets primarily driven by firms
seeking lower cost structures have
also offered a compelling total
return profile.
• Markets in this category (such as
Atlanta and Charlotte) consistently
lead the pack, frequently beating
out NPI-Office and NPI-All returns.
• While helpful in crafting thematic
strategies, these groupings can
mask meaningful variation in
performance even within the same
set – so market (and asset)
selection is key.
-1%
1%
3%
5%
7%
9%
1YR 3YR 5YR 7YR
Innovation Hubs Traditional Tenancies Competitive Costs
Value-weighted aggregate total returns of office markets by primary driver through Q1 2021
Innovation hubs are markets where tech/biotech/creative are larger share of office-using employment growth than the national average. Traditional tenancy
markets are those where FIRE employment growth represents a larger share of office-using employment growth than the national average. Competitive costs
are markets with growth in a variety of office-using employment sectors with strong in-migration.
Source: American Realty Advisors based on data from NCREIF as of May 2021
NPI-Office NPI-All
Property Markets - ARA House View H1 2021
Lower-cost office markets may also offer a compelling return profile

American Realty Advisors 20
Offices: The Best and the Rest
.Source: American Realty Advisors based on data from CoStar as of May 2021
• The pandemic has reinforced bifurcations in
performance between and within sectors, with the best
doing better and the rest falling further behind.
• Knowing which assets have the staying power to
continue to be “the best” then is critical to creating
outperformance.
• Office assets that are currently highly-leased historically
retain their elevated occupancy levels; however, this
same persistency in performance is also true at the
bottom, as buildings with occupancy below 75% today
have seen a sharp erosion since 2014 that looks to be
accelerating.
• Investors should aim to purchase only best-in-class
office assets, which provide steadier demand
performance, or acquire office product that lends itself
to top-tier repositioning plays.
52%
57%
62%
67%
72%
77%
82%
87%
92%
97%
20
00
20
01
20
02
20
03
20
04
20
05
20
06
20
07
20
08
20
09
20
10
20
11
20
12
20
13
20
14
20
15
20
16
20
17
20
18
20
19
20
20
95%-100% 90%-95% 85%-90%
80%-85% 75%-80% 75% & Below
Office occupancy by current occupancy profile, 2000-2020
Property Markets - ARA House View H1 2021
There seems to exist a persistency in office occupancy for best-in-slippery slope

American Realty Advisors 21
Percent of respondents – “What will be the most in-demand building attributes in the future?”
• Companies have now had a year to consider
the role offices will play in their future.
• With an even greater emphasis on spaces
that promote collaboration and culture,
tenants are requiring more of their spaces to
entice employees to return and justify the
cost.
• Buildings that offer the ability to flex into/out
of space as needed (coworking, shared
meeting rooms) are expected to be in higher
demand, as are those that maintain a high
standard of health and sanitation.
• With ample space available, tenants can be
picky.
• We believe the current environment creates
opportunities for owners of differentiated,
best-in-class office product to capture the
lion’s share of future leasing, though will
create obstacles for lower-quality buildings
that struggle to adapt.
Tenants Want More From Their Offices
Note: Data reflects the responses of 77 respondents who responded to the CBRE survey that closed September 21st, 2020, 50% of which are Fortune 500 firms.
Source: American Realty Advisors based on data from CBRE’s The Future of the Office survey dated September 2020
0% 10% 20% 30% 40% 50% 60% 70% 80% 90%
Flexible Office Space Options
Shared Meeing Space
Indoor Air Quality
Connected Technologies/Building Apps
Sustainable Building Design
Touchless Technologies
Onside Café/F&B
Public Transportation Access
Outdoor Amenities
Fitness Facilities
Property Markets - ARA House View H1 2021
The pandemic has increased focus on building offerings, creating obstacles and opportunities for owners
American Realty Advisors 22
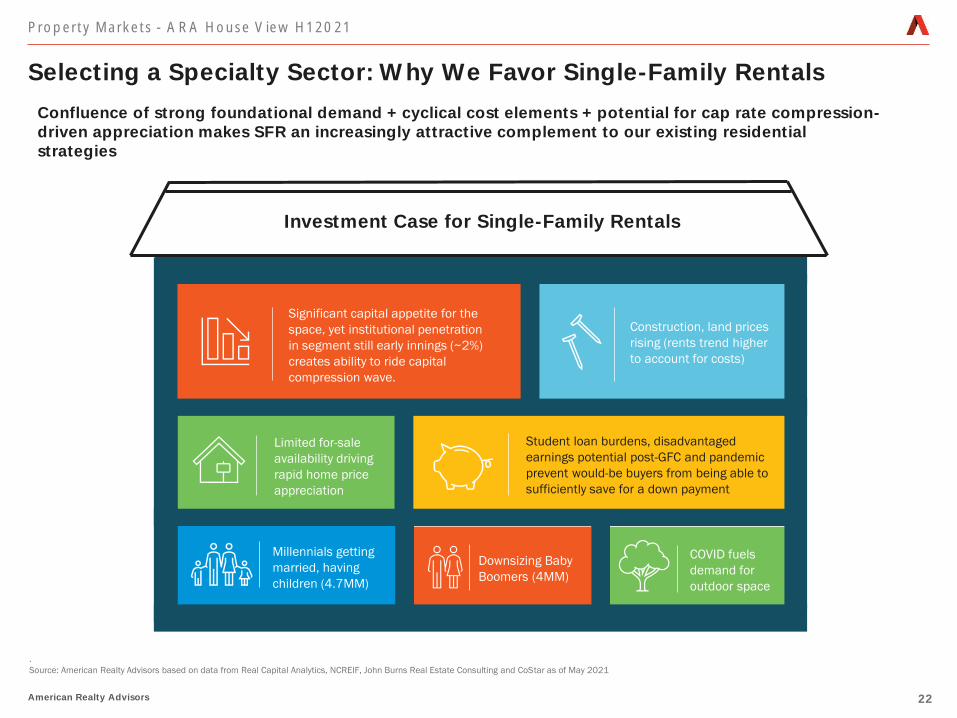
Selecting a Specialty Sector: Why We Favor Single-Family Rentals
.
Source: American Realty Advisors based on data from Real Capital Analytics, NCREIF, John Burns Real Estate Consulting and CoStar as of May 2021
Property Markets - ARA House View H1 2021
Confluence of strong foundational demand + cyclical cost elements + potential for cap rate compression-driven appreciation makes SFR an increasingly attractive complement to our existing residential strategies
Millennials getting
married, having
children (4.7MM)
Downsizing Baby
Boomers (4MM)
COVID fuels
demand for
outdoor space
Limited for-sale
availability driving
rapid home price
appreciation
Student loan burdens, disadvantaged
earnings potential post-GFC and pandemic
prevent would-be buyers from being able to
sufficiently save for a down payment
Construction, land prices
rising (rents trend higher
to account for costs)
Significant capital appetite for the
space, yet institutional penetration
in segment still early innings (~2%)
creates ability to ride capital
compression wave.
Investment Case for Single-Family Rentals
American Realty Advisors 23
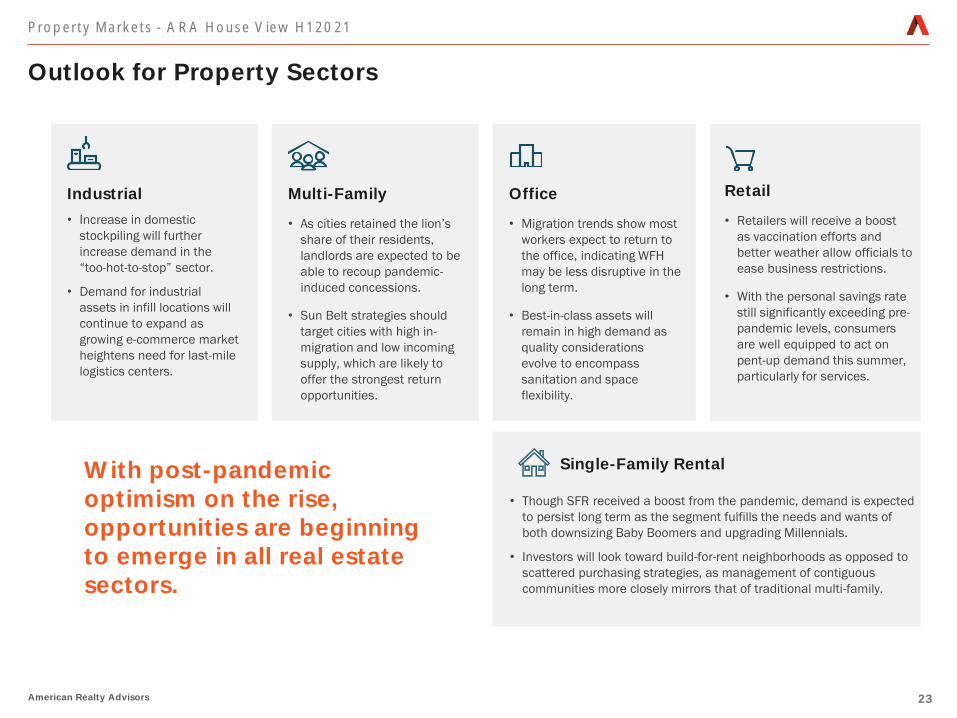
Industrial
• Increase in domestic
stockpiling will further
increase demand in the
“too-hot-to-stop” sector.
• Demand for industrial
assets in infill locations will
continue to expand as
growing e-commerce market
heightens need for last-mile
logistics centers.
Multi-Family
• As cities retained the lion’s
share of their residents,
landlords are expected to be
able to recoup pandemic-
induced concessions.
• Sun Belt strategies should
target cities with high in-
migration and low incoming
supply, which are likely to
offer the strongest return
opportunities.
Office
• Migration trends show most
workers expect to return to
the office, indicating WFH
may be less disruptive in the
long term.
• Best-in-class assets will
remain in high demand as
quality considerations
evolve to encompass
sanitation and space
flexibility.
Retail
• Retailers will receive a boost
as vaccination efforts and
better weather allow officials to
ease business restrictions.
• With the personal savings rate
still significantly exceeding pre-
pandemic levels, consumers
are well equipped to act on
pent-up demand this summer,
particularly for services.
Outlook for Property Sectors
• Though SFR received a boost from the pandemic, demand is expected
to persist long term as the segment fulfills the needs and wants of
both downsizing Baby Boomers and upgrading Millennials.
• Investors will look toward build-for-rent neighborhoods as opposed to
scattered purchasing strategies, as management of contiguous
communities more closely mirrors that of traditional multi-family.
With post-pandemic optimism on the rise, opportunities are beginning to emerge in all real estate sectors.
Single-Family Rental
Property Markets - ARA House View H1 2021

American Realty Advisors 24
Implications for Core and Value-Add Strategies
Core • Increase leasing rates in industrial and
residential to drive income growth while
continuing to “blend and extend” office
and retail tenants.
• Control operating/capital costs and
focus on re-engaging building services
and tenant amenities for occupancy
ramp up in 2H 2021.
• Timely executive renovation and
development business plans for
residential and industrial assets to meet
robust tenant demand.
• Continue to focus on leasing strategies for
office/retail to increase occupancy,
extend WALT and drive cash flow.
• Remain flexible and responsive to
disposition opportunities where high
buyer demand results in pricing premium.
• Wide market focus on outperforming
sectors, highly selective in others where
strike zone for outperformance is
narrower.
• Pivot office offerings to capture stronger
life science demand.
• Add purpose-built single-family rental
communities in high-growth markets as
diversifier in residential allocation.
• Build, lease and sell stabilized single-
family rental projects into deep capital
pool.
• Move contrarian to office uncertainty for
assets that have the potential to be
best-in-class.
• Industrial demand expected to increase
by 850 million sf by 2023, continue to
pursue development/lease-up plays.
Asset Management Portfolio Construction
Value-Add
Portfolio Implications - ARA House View H1 2021
quality photo
American Realty Advisors 25American Realty Advisors
The pandemic era
has intensified
existing trends,
reinforcing
bifurcations between
relative winners and
losers.
Summary and Strategy Implications
• The U.S. economy’s recovery in the first half of 2021 was stronger
than we originally anticipated, enhanced by an accelerated vaccine
distribution and further governmental stimulus.
• We expect full-year 2021 to be one of the strongest for GDP growth
in recent memory, with a period of above-trend growth for 1-2 more
years.
• While this should serve to boost real estate fundamentals overall,
we believe the pace of structural change has been accelerated,
widening the performance gap between and within sectors.
• Pricing and fundamentals may send opposing signals of where the
opportunities lie; which to pursue depends on strategy (core vs.
value-add) and hold period.
• Though the current backdrop is not without risks, we are focused on
orienting our assets to best capitalize on accelerating
fundamentals' momentum and identifying mispriced opportunities
that offer enhanced return potential.
American Realty Advisors 26
Disclaimer: The information in this presentation is as of June 3, 2021 unless specified otherwise and is for your informational and educational purposes only, is not intended to be relied on to make
any investment decisions, and is neither an offer to sell nor a solicitation of an offer to buy any securities or financial instruments in any jurisdiction. This presentation expresses the views of American
Realty Advisors, LLC ("ARA") as of the date indicated and such views are subject to change without notice. The information in this presentation has been obtained or derived from sources believed by
ARA to be reliable but ARA does not represent that this information is accurate or complete and has not independently verified the accuracy or completeness of such information or assumptions on
which such information is based. Models used in any analysis may be proprietary, making the results difficult for any third party to reproduce. Past performance of any kind referenced in the information
above in connection with any particular strategy should not be taken as an indicator of future results of such strategies. It is important to understand that investments of the type referenced in the
information above pose the potential for loss of capital over any time period. This presentation is proprietary to ARA and may not be copied, reproduced, republished, or posted in whole or in part, in any
form and may not be circulated or redelivered to any person without the prior written consent of ARA. Photos used in this presentation were selected based on visual appearance, are used for illustrative
purposes only, are not necessarily reflective of all the investments made by ARA or which ARA may make in the future.
Forward-Looking Statement: This presentation contains forward-looking statements within the meaning of federal securities laws. Forward-looking statements are statements that do not
represent historical facts and are based on our beliefs, assumptions made by us, and information currently available to us. Forward-looking statements in this newsletter are based on our current
expectations as of the date of this presentation, which could change or not materialize as expected. Actual results may differ materially due to a variety of uncertainties and risk factors. Except as
required by law, ARA assumes no obligation to update any such forward-looking statements.
Disclosures
ARA House View H1 2021

Jay ButterfieldExecutive Managing Director,
Head of Business Development
213.233.5743
Sabrina UngerManaging Director,
Research & Strategy
213.233.5846
Britteni LupeAnalyst,
Research & Strategy
213.233.5780
Printed in-house
Headquarters Office 515 S. Flower St.
49th Floor
Los Angeles, CA 90071
T 213.233.5700F 213.947.1480
LOS ANGELES | CHICAGO | NEW YORK | ORLANDO | PHILADELPHIA | SAN FRANCISCO
For More Information, Please Contact: