american wind en ergy association u.s. wind industry third ......market report a product of awea...
TRANSCRIPT
American Wind Energy Association U.S. Wind Industry Third Quarter 2018
Market Report
A product of AWEA Data Services
Released October 25, 2018
The U.S. wind industry installed 612 megawatts (MW) in the third quarter of 2018, bringing year-to-date installations to 1,644 MW. There are now 90,550 MW of installed wind capacity in the United States.
Project developers reported a combined 37,965 MW of wind capacity under construction or in advanced development as of the end of the third quarter, a 28% year-over-year increase. Construction activity reached a new record of 20,798 MW after construction started on 2,180 MW in the third quarter.
Project developers announced 2,467 MW of PPAs signed during the third quarter, contributing to a total of 7,550 MW contracted year-to-date in 2018. PPA activity for the year exceeds total PPA volumes in each of the past four years and marks the most active year for corporate and non-utility PPAs.

American Wind Energy Association | U.S. Wind Industry Third Quarter 2018 Market Report | Public Version 2
Table of ContentsThird Quarter Hightlights 3U.S. Wind Power Capacity Growth U.S. Annual and Cumulative Wind Power Capacity Growth 4 Quarterly U.S. Wind Power Capacity Installations 5 New Wind Power Capacity Installations in Third Quarter 2018, by State 6
2018 Wind Power Capacity Installations, Top States 7
U.S. Wind Power Cumulative Installed Capacity, by State 8
Wind Power Capacity Under Construction or in Advanced Development 9 Wind Power Capacity Under Construction 10 Wind Power Capacity Under Construction, by State Member Version Only
Wind Power Capacity in Advanced Development, by State Member Version Only
Wind Power Capacity Under Construction or in Advanced Development, Top States Member Version Only
Wind Power Capacity in Advanced Development Member Version Only
Wind Power Procurement Activity
Wind Power Capacity Offtake Status Member Version Only
Power Purchase Agreements Signed in 2018 Member Version Only
Map of Power Purchase Agreements Signed in 2018 Member Version Only
Mergers & Acquisition Activity Member Version Only
Wind Turbine Market Trends
Wind Turbine Manufacturer Market Member Version Only
Turbine Technology Trends Member Version Only
Regional Turbine Technology Trends Member Version Only
U.S. Offshore Wind Energy Activity Member Version Only
Appendices
Map of Projects Online during 2018, Under Construction, or in Advanced Development 23
Utility-Scale Wind Projects Completed during 2018 24
Utility-Scale Wind Projects Under Construction Member Version Only
Utility-Scale Wind Projects in Advanced Development Member Version Only
2018 Power Purchase Agreements Member Version Only
2018 Project Acquisition Activity Member Version Only
Electric Utility Renewable Energy Requests for Proposals (RFPs) Member Version Only
AWEA Data Services 42

American Wind Energy Association | U.S. Wind Industry Third Quarter 2018 Market Report | Public Version 3
Third Quarter Highlights
2018 Wind Project Installations• The U.S. wind industry installed 612 MW of new wind power capacity during the third quarter of 2018, a 15% increase in installations over the third quarter of
2017. Year-to-date the industry has commissioned 1,644 MW of wind power capacity.
• A total of 11 new wind projects were commissioned across seven states during the third quarter. Texas led with 216 MW installed, followed by Oklahoma (199 MW), and Ohio (108 MW).
• In addition to new capacity additions, developers completed 329 MW of partial repowerings across three projects in the third quarter.
• There are now 90,550 MW of cumulative installed wind capacity in the United States, with more than 54,000 wind turbines operating in 41 states plus Guam and Puerto Rico.
Wind Capacity Under Construction or in Advanced Development• Construction activity reached a new record of 20,798 MW at the end of the third quarter, with an additional 17,167 MW in advanced development. The combined 37,965
MW represent a 28% year-over-year increase.
• Projects totaling 2,180 MW started construction and a further 2,327 MW entered advanced development during the third quarter, a combined 4,507 MW in new announcements.
• At the regional level, 33% of combined activity is located in the Midwest, 21% in Texas, 20% in the Mountain West and 15% in the Plains states.
• Seven states now have more capacity under construction or in advanced development than currently operating.
Wind Power Procurement Activity • Project developers announced 2,467 MW of new PPAs in the third quarter, bringing year-to-date activity to 7,550 MW. PPA activity in the first three quarters
already exceeds total PPA volumes in each of the past four years.
• Utilities signed contracts for 1,522 MW of wind capacity in the third quarter, with Eversource Energy, National Grid, and Unitil procuring 800 MW from the Vineyard Wind offshore project.
• Corporate and other non-utility customers signed 38% (945 MW) of capacity contracted in the third quarter, including eight first time wind buyers. Through the first three quarters alone, 2018 is already the most active year for corporate and non-utility PPAs, surpassing the record previously set in 2015.
Turbine Technology Trends• GE Renewable Energy turbines represent 63% of the U.S. wind turbine market in the first three quarters of 2018, while Vestas represents 26% and Goldwind
represents 10%.
• The third quarter witnessed the entry of the first 4 MW onshore wind turbines in the U.S. with orders announced by both Senvion and Vestas.
• The majority of projects under construction or in advanced development have selected turbines with a nameplate capacity between 2 MW and 3 MW, while about 30% of projects where turbines have been reported are using turbines rated 3 MW or larger.
American Wind Energy Association | U.S. Wind Industry Third Quarter 2018 Market Report | Public Version 4
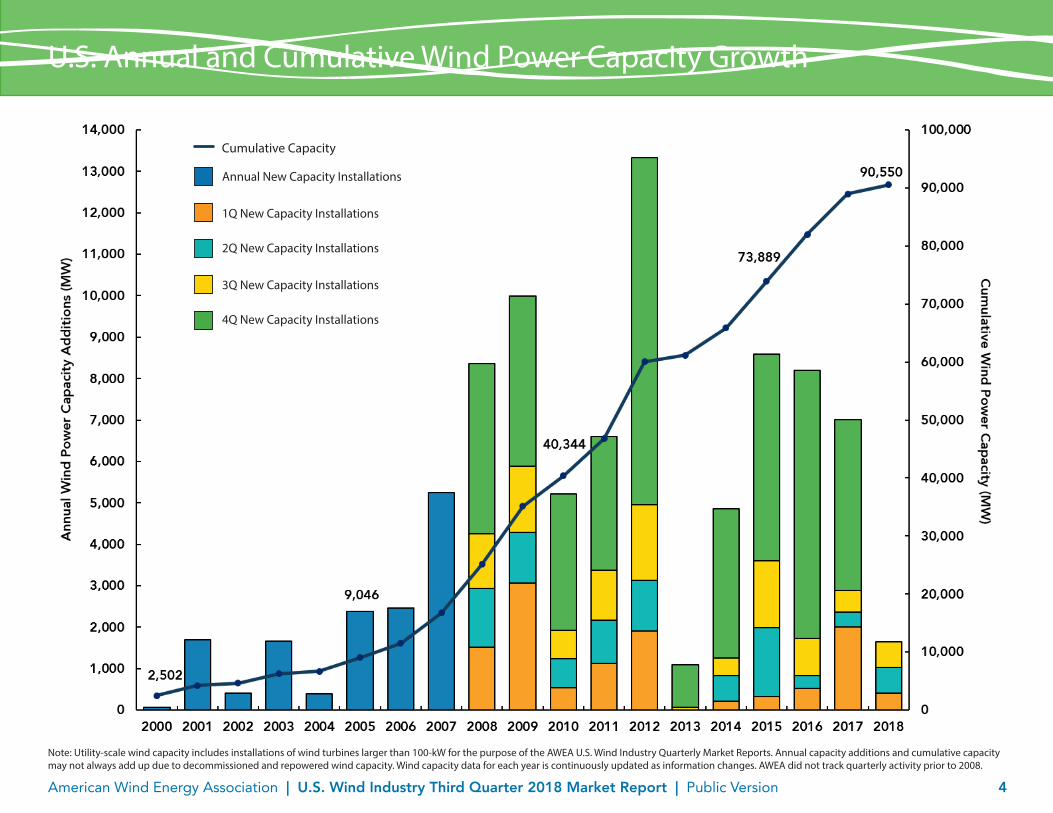
Note: Utility-scale wind capacity includes installations of wind turbines larger than 100-kW for the purpose of the AWEA U.S. Wind Industry Quarterly Market Reports. Annual capacity additions and cumulative capacity may not always add up due to decommissioned and repowered wind capacity. Wind capacity data for each year is continuously updated as information changes. AWEA did not track quarterly activity prior to 2008.
U.S. Annual and Cumulative Wind Power Capacity Growth
0
10,000
20,000
30,000
40,000
50,000
60,000
70,000
80,000
90,000
100,000
201820172016201520142013201220112010200920082007200620052004200320022001
Cumulative Capacity
Annual New Capacity Installations
1Q New Capacity Installations
2Q New Capacity Installations
3Q New Capacity Installations
4Q New Capacity Installations
4,195 4,6036,268 6,665
9,04611,512
16,765
25,135
35,128
40,344
46,777
60,065
Win
d Po
wer
Cap
acity
(MW
)
61,135
65,872
73,889
82,005
88,97390,551
Cumulative Capacity

American Wind Energy Association | U.S. Wind Industry Third Quarter 2018 Market Report | Public Version 5
Quarterly U.S. Wind Power Capacity Installations
0
1,000
2,000
3,000
4,000
5,000
6,000
7,000
8,000
9,000
2018201720162015201420132012201120102009
Win
d Po
wer
Cap
acity
(MW
)
3,072
1,221
1,589
4,116
539704 673
3,299
1,1181,050
1,207
3,230
1,912
1,213
1,834
8,382
2 0 70
1,016
217
1Q
2Q
3Q
4Q
619419
3,603
333
1,6611,603
4,998
520310
895
6,478
2,000
357534
4,125
406
626 612
• The U.S. wind industry installed 612 MW of wind power capacity during the third quarter of 2018, a 15% increase in installations over the third quarter of 2017.
• Year-to-date installations are down 43% compared to the first three quarters of 2017, but are roughly on par with 2016 installation activity.
• In addition to new capacity additions, developers completed 329 MW of partial repowerings across three projects in the third quarter.

American Wind Energy Association | U.S. Wind Industry Third Quarter 2018 Market Report | Public Version 6
New Wind Power Capacity Installations in Third Quarter 2018, by State
RI CT
MA
HI
ALMS
AR
LA
GA
KYVA
NC
SC
FL
NV
MO
IL IN
WI MI
NY78
ME
MN
KS
TX216
AZ
CA3
CO
DE
ID
MD
MT
NE7
NH
NJ
SD
OH108
OK199
PA
UT
VT
OR
WA
WV
WY
AK 1
0 to 100 MW
>100 MW to 250 MW >250 MW to 500 MW >500 MW to 1,000 MW >1,000 MW
TN
GU
IA
ND
NM
PR

American Wind Energy Association | U.S. Wind Industry Third Quarter 2018 Market Report | Public Version 7
0100 200 300 400 500 600 700 800 900
Minnesota
Alaska
Massachusetts
Iowa
Montana
Nebraska
Michigan
New York
Ohio
Illinois
California
Oklahoma
Texas
1Q 2018 Installations
Wind Power Capacity (MW)
2Q 2018 Installations
3Q 2018 Installations
464200
199
131
132
108
78
44
30
25
216
4
2
1
1
2018 Wind Power Capacity Installations, Top States
• Developers commissioned a total of 11 new wind projects totaling 621 MW across seven states during the third quarter.
• Texas led in third quarter installations with 216 MW, followed by Oklahoma (199 MW), and Ohio (108 MW). Texas and Oklahoma also lead in installations year to date in 2018.
• Alaska commissioned its first wind turbine since 2013, while New York saw the largest project built in the state since 2013.
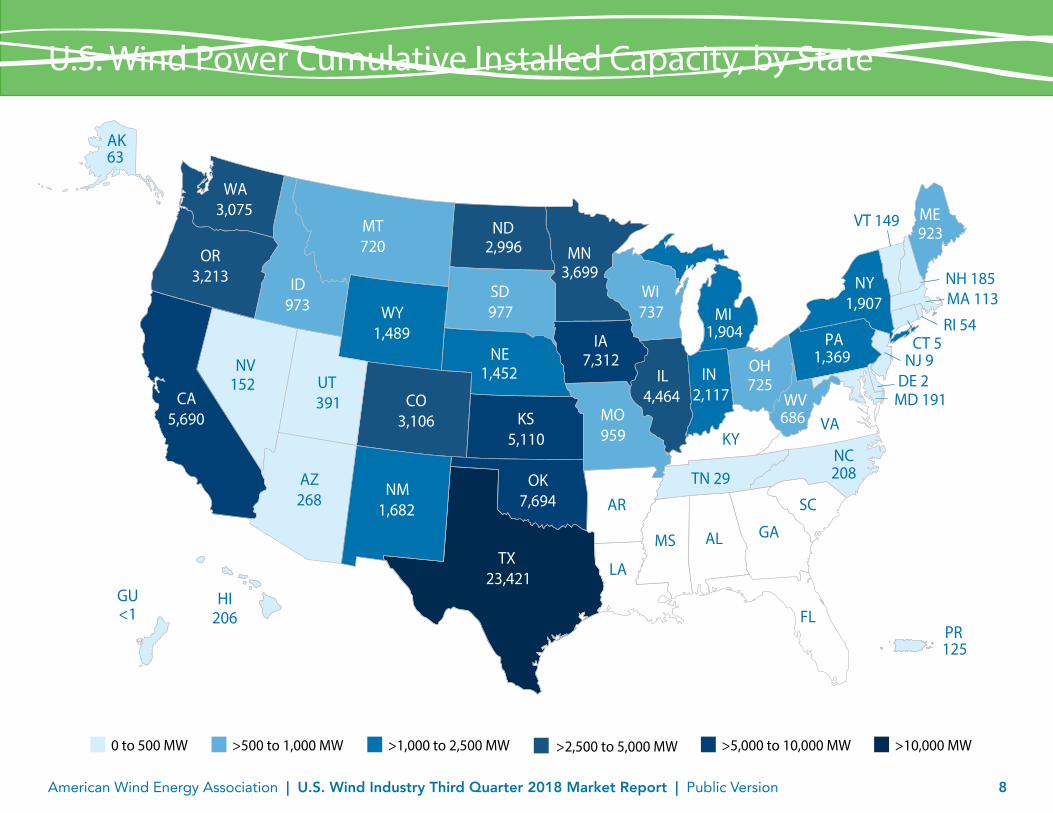
• Texas continues to lead the nation with 23,421 MW of cumulative installed capacity.
• While Oklahoma strengthened its second place ranking in the third quarter, Iowa is on track to surpass Oklahoma and reclaim the second spot by the end of the year.
StateTotal Installed Capacity (MW)
2018 Capacity Additions (MW)
Texas 23,421 880
Oklahoma 7,694 199
Iowa 7,312 4
California 5,690 135
Kansas 5,110 0
Top Five States by Cumulative Installed Wind Power Capacity
American Wind Energy Association | U.S. Wind Industry Third Quarter 2018 Market Report | Public Version 8
RI 54 CT 5
MA 113
HI206
ALMS
AR
LA
GA
KYVA
NC
SC
FL
NV152
MO959
IL4,464
IN2,117
WI737 MI
1,904
NY1,907
ME923
IA7,312
MN3,699
KS5,110
ND2,996
AZ268
CA5,690
CO3,106
DE 2
ID973
MD 191
MT720
NE1,452
NH 185
NJ 9
NM1,682
SD977
OH725
OK7,694
PA1,369
TN 29
TX23,421
UT391
VT 149
OR3,213
WA3,075
WV686
WY1,489
PR125
AK63
0 to 500 MW
>500 to 1,000 MW >1,000 to 2,500 MW >5,000 to 10,000 MW >10,000 MW
GU<1
208
>2,500 to 5,000 MW
U.S. Wind Power Cumulative Installed Capacity, by State

American Wind Energy Association | U.S. Wind Industry Third Quarter 2018 Market Report | Public Version 9
• There are now 37,965 MW of wind power capacity under construction (20,798 MW) or in advanced development (17,167 MW), a 28% year- over-year increase.
• Project developers announced 4,507 MW in combined new activity during the third quarter, with projects totaling 2,180 MW starting construction and 2,327 MW entering the advanced development phase.
• While advanced development activity trended higher than construction activity at the beginning of the year, the last two quarters saw a number of projects move into the construction phase.
• Wind projects currently under construction have been underway for an average of three quarters, while projects in advanced development have been underway for an average of one year. Nearly 50% of the 37,965 MW underway started construction or entered advanced development in 2018.
Wind Power Capacity Under Construction or in Advanced Development
Under Construction End of Quarter Advanced Development End of Quarter Combined Total
Win
d Po
wer
Cap
acity
(MW
) 25,819
23,977
21,344
23,280
18,279
15,231
29,63428,668
33,449
37,794 37,965
0
5,000
10,000
15,000
20,000
25,000
30,000
35,000
40,000
3Q182Q181Q184Q173Q172Q171Q174Q163Q162Q161Q16
Announcement Year
5,060
7,405
9,479
9,222
Current Construction and Advanced Development Pipeline by Announcement YearConstruction and Advanced Development Activity over Time
0
5,000
10,000
15,000
20,000
201820172016Pre 2016
4,507 MW in new announcements
Under Construction Advanced Development
9,222
9,069
5,470
7,4052,360
3,392
780
267
Win
d Po
wer
Cap
acity
(MW
)
American Wind Energy Association | U.S. Wind Industry Third Quarter 2018 Market Report | Public Version 10
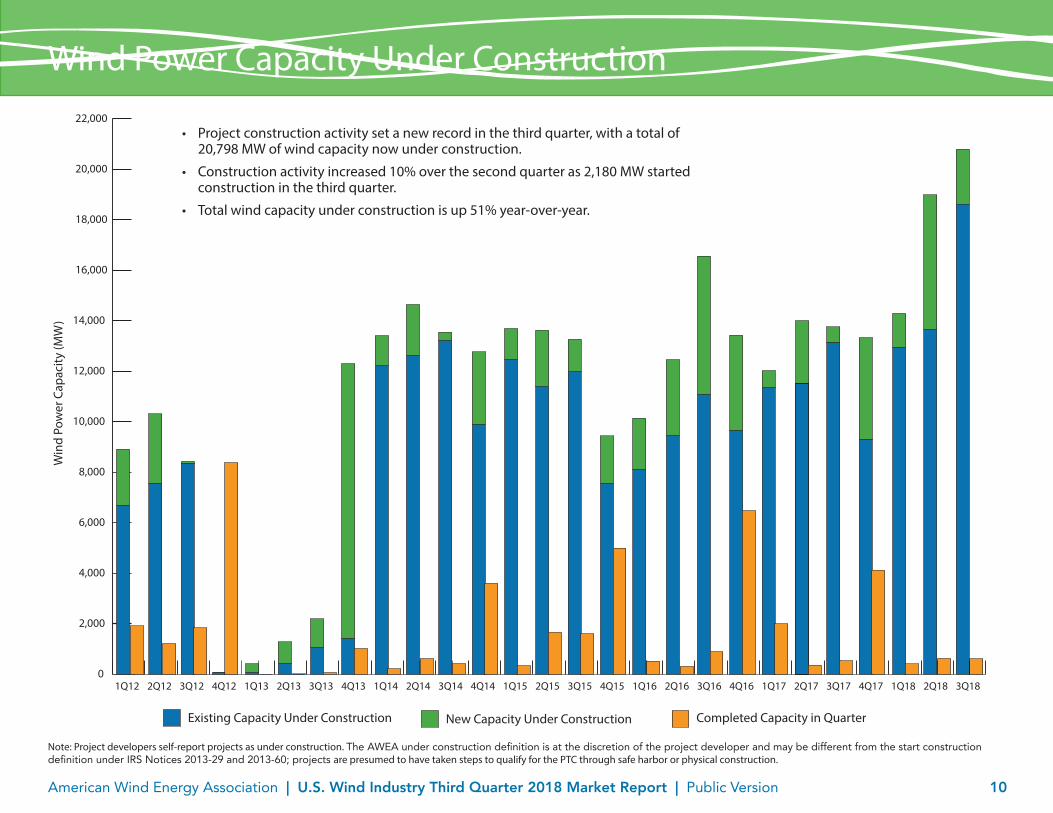
Wind Power Capacity Under Construction
Note: Project developers self-report projects as under construction. The AWEA under construction definition is at the discretion of the project developer and may be different from the start construction definition under IRS Notices 2013-29 and 2013-60; projects are presumed to have taken steps to qualify for the PTC through safe harbor or physical construction.
0
2,000
4,000
6,000
8,000
10,000
12,000
14,000
16,000
18,000
20,000
22,000
3Q182Q181Q184Q173Q172Q171Q174Q163Q162Q161Q164Q153Q152Q151Q154Q143Q142Q141Q144Q133Q132Q131Q134Q123Q122Q121Q12
Win
d Po
wer
Cap
acity
(MW
)
Existing Capacity Under Construction New Capacity Under Construction Completed Capacity in Quarter
• Project construction activity set a new record in the third quarter, with a total of 20,798 MW of wind capacity now under construction.
• Construction activity increased 10% over the second quarter as 2,180 MW started construction in the third quarter.
• Total wind capacity under construction is up 51% year-over-year.

American Wind Energy Association | U.S. Wind Industry Third Quarter 2018 Market Report | Public Version 11
Wind Power Capacity Under Construction, by State
Member Version Only

American Wind Energy Association | U.S. Wind Industry Third Quarter 2018 Market Report | Public Version 12
Wind Power Capacity in Advanced Development, by State
Note: AWEA defines a project as in advanced development if it has not yet started construction, but has either signed a PPA, announced a firm turbine order, or been announced to proceed under utility ownership.
Member Version Only
American Wind Energy Association | U.S. Wind Industry Third Quarter 2018 Market Report | Public Version 13
Wind Power Capacity Under Construction or in Advanced Development, Top States
Member Version Only

American Wind Energy Association | U.S. Wind Industry Third Quarter 2018 Market Report | Public Version 14
Wind Power Capacity in Advanced Development
Member Version Only

American Wind Energy Association | U.S. Wind Industry Third Quarter 2018 Market Report | Public Version 15
Wind Power Capacity Offtake Status
Member Version Only
American Wind Energy Association | U.S. Wind Industry Third Quarter 2018 Market Report | Public Version 16
Power Purchase Agreements Signed in 2018
Member Version Only
American Wind Energy Association | U.S. Wind Industry Third Quarter 2018 Market Report | Public Version 17
Map of Power Purchase Agreements Signed in 2018
Member Version Only

American Wind Energy Association | U.S. Wind Industry Third Quarter 2018 Market Report | Public Version 18
Mergers & Acquisitions Activity
Member Version Only

American Wind Energy Association | U.S. Wind Industry Third Quarter 2018 Market Report | Public Version 19
Wind Turbine Manufacturer Market
Member Version Only

American Wind Energy Association | U.S. Wind Industry Third Quarter 2018 Market Report | Public Version 20
Turbine Technology Trends
Member Version Only

American Wind Energy Association | U.S. Wind Industry Third Quarter 2018 Market Report | Public Version 21
Regional Turbine Technology Trends
Member Version Only

American Wind Energy Association | U.S. Wind Industry Third Quarter 2018 Market Report | Public Version 22
• Demand for offshore wind energy continued in the third quarter, with new PPAs and announcements for solicitations totaling up to 2,000 MW of offshore capacity.
• New Jersey opened a solicitation in September for 800 MW of offshore wind, the first solicition for the state to help meet its target of 3,500 MW of offshore wind by 2030.
• In the same month, Rhode Island utility Narragansett Electric issued an RFP for 400 MW renewable energy, which is open to offshore wind.
• New York also announced that the state will hold its first large-scale solicitation for 800 MW of offshore by the end of 2018.
• In August, National Grid USA, Eversource Energy, and Unitil Corp filed contracts with the Massachusetts Public Utilities commission for 800 MW of the Vineyard Wind project. The three utilities will buy energy and RECs from Vineyard Wind at a total levelized price of 6.5 cents per kilowatt hour, the lowest offshore wind PPA price in the U.S. to date. Vineyard Wind was selected as the winner of Massachusetts’ first major offshore wind solicitation earlier this year.
• Also in August, Dominion Energy filed with Virginia for approval to build the 12 MW Coastal Virginia Offshore Wind project and Ørsted signed a subcontract with Siemens Gamesa Renewable Energy for two 6-MW SWT-6.0-154 turbines for the project.
• In addition, EDF Renewables and Fishermen’s Energy of New Jersey filed an application for approval of the Nautilus Offshore Wind Project off of New Jersey from the New Jersey Board of Public Utilities.
U.S. Offshore Wind Energy Activity
State RFP Project Winners
RFP State Project NameProject Capacity
(MW) Project Developer Project Location Power Purchaser
Massachusetts Vineyard Wind 800 Avangrid Renewables; Copenhagen Infrastructure Partners Offshore Massachusetts Eversource Energy, National Grid, Unitil
Rhode Island Revolution Wind 400 Deepwater Wind Area of Mutual Interest between RI & MA National Grid
Connecticut Revolution Wind 200 Deepwater Wind Area of Mutual Interest between RI & MA Eversource Energy and United Illuminating Co
Maryland Maryland Offshore Wind Project 248 U.S. Wind Inc Offshore Maryland Maryland PSC (ORECs)
Maryland Skipjack Wind Farm 120 Deepwater Wind Offshore Delaware Maryland PSC (ORECs)

American Wind Energy Association | U.S. Wind Industry Third Quarter 2018 Market Report | Public Version 23
Map of Projects Online during 2018, Under Construction, or in Advanced Development
Projects Online 2Q 2018
Projects Under Construction or in Advanced Development
Projects Online 1Q 2018 Projects Online 3Q 2018
HI
AK

American Wind Energy Association | U.S. Wind Industry Third Quarter 2018 Market Report | Public Version 24
Utility-Scale Wind Projects Completed during 2018
State Project Phase Name
Project Capacity (MW) Turbine OEM Turbine Model Project Developer Project Owner Power Purchaser
First Quarter 2018
CA Tule 131.10 GE Renewable Energy 2.3-107 Avangrid Renewables Avangrid Renewables Southern California Edison
IA Prairie II 4.00 (of 168.00) Vestas V110-2.0 RPM Access Wind Development;
MidAmerican Energy MidAmerican Energy MidAmerican Energy Co
MA Otis Wind Energy Project 1.50 VENSYS VENSYS 82 SunCommon; Town of Otis Town of Otis Town of Otis, Excess to Eversource Energy
MI Cross Winds Energy Park II 43.70 GE Renewable Energy 2.3-116 Consumers Energy Consumers Energy Consumers Energy
MN White Earth Tribe 0.75 Refurbished Zond White Earth Nation White Earth Nation Minnkota Power Coop
MT Big Timber 25.00 GE Renewable Energy 1.7-100 BayWa r.e. Wind LLC BayWa r.e. Wind LLC NorthWestern Energy
TX Flat Top 200.00 Vestas V110-2.0 Innergex Renewable Energy Innergex Renewable Energy; BlackRock
Merchant Hedge Contract (ERCOT) (170 MW); Merchant Hedge Contract, Resold to QTS Realty Trust (30 MW)
Second Quarter 2018
IL Bishop Hill III 132.00 GE Renewable Energy 2.3-116; 2.5-116 Invenergy Invenergy WPPI Energy
NE Kimball Wind Farm 30.00 GE Renewable Energy 2.5-116 Aspenall Energies Aspenall Energies Municipal Energy Agency of NE
TX Rattlesnake Wind 160.00 Goldwind GW109/2500 Goldwind Americas;RES Americas Goldwind Americas Merchant Hedge Contract (ERCOT)
TX Santa Rita 300.00 GE Renewable Energy 2.5-116 Invenergy BHE Renewables Kimberly-Clark (125 MW);City of Denton, TX (175 MW)
TX UL Advanced Wind Turbine Test Facility 3.57 Goldwind GW 3MW(S) Goldwind Americas West Texas A&M University Xcel Energy
Third Quarter 2018
AK Bethel Wind Turbine 0.90 EWT Americas DW-52-900 Alaska Village Electric Coop Alaska Village Electric Coop Alaska Village Electric Coop
CA Correctional Training Facility 1.7 GE Renewable Energy 1.7-100 Foundation Windpower Foundation Windpower Correctional Training Facility,
Excess to Pacific Gas & Electric
CA Salinas Valley State Prison 1.7 GE Renewable Energy 1.7-100 Foundation Windpower Foundation Windpower Salinas Valley State Prison, Excess to Pacific Gas & Electric
NE Perennial Wind 6.90 GE Renewable Energy 2.3-116 Bluestem Energy Solutions Bluestem Energy Solutions Perennial Public Power Dist
NY Arkwright Summit 78.40 Vestas V110-2.0 EDP Renewables North America LLC
EDP Renewables North America LLC
Bloomberg (20 MW); Merchant (NYSERDA) (58.4 MW)
OH Northwest Ohio 105.00 GE Renewable Energy 2.5-116 Trishe Resources, Inc.; Starwood Energy Starwood Energy General Motors
American Wind Energy Association | U.S. Wind Industry Third Quarter 2018 Market Report | Public Version 25
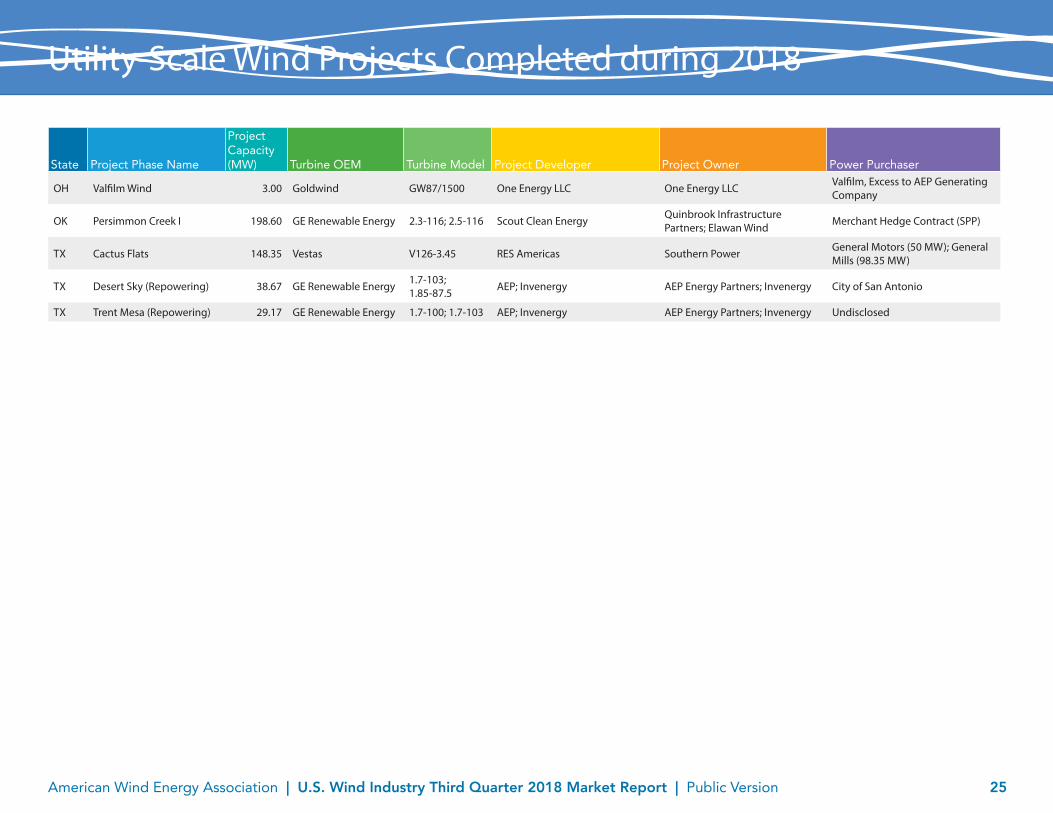
Utility-Scale Wind Projects Completed during 2018
State Project Phase Name
Project Capacity (MW) Turbine OEM Turbine Model Project Developer Project Owner Power Purchaser
OH Valfilm Wind 3.00 Goldwind GW87/1500 One Energy LLC One Energy LLC Valfilm, Excess to AEP Generating Company
OK Persimmon Creek I 198.60 GE Renewable Energy 2.3-116; 2.5-116 Scout Clean Energy Quinbrook Infrastructure Partners; Elawan Wind Merchant Hedge Contract (SPP)
TX Cactus Flats 148.35 Vestas V126-3.45 RES Americas Southern Power General Motors (50 MW); General Mills (98.35 MW)
TX Desert Sky (Repowering) 38.67 GE Renewable Energy 1.7-103; 1.85-87.5 AEP; Invenergy AEP Energy Partners; Invenergy City of San Antonio
TX Trent Mesa (Repowering) 29.17 GE Renewable Energy 1.7-100; 1.7-103 AEP; Invenergy AEP Energy Partners; Invenergy Undisclosed

American Wind Energy Association | U.S. Wind Industry Third Quarter 2018 Market Report | Public Version 26
Utility-Scale Wind Power Projects Under Construction
Member Version Only

American Wind Energy Association | U.S. Wind Industry Third Quarter 2018 Market Report | Public Version 27
Utility-Scale Wind Power Projects Under Construction
Member Version Only
American Wind Energy Association | U.S. Wind Industry Third Quarter 2018 Market Report | Public Version 28
Utility-Scale Wind Power Projects Under Construction
Member Version Only
American Wind Energy Association | U.S. Wind Industry Third Quarter 2018 Market Report | Public Version 29
Utility-Scale Wind Power Projects Under Construction
Member Version Only
American Wind Energy Association | U.S. Wind Industry Third Quarter 2018 Market Report | Public Version 30
Utility-Scale Wind Power Projects Under Construction
Member Version Only

American Wind Energy Association | U.S. Wind Industry Third Quarter 2018 Market Report | Public Version 31
Utility-Scale Wind Power Projects in Advanced Development
Member Version Only

American Wind Energy Association | U.S. Wind Industry Third Quarter 2018 Market Report | Public Version 32
Utility-Scale Wind Power Projects in Advanced Development
Member Version Only
American Wind Energy Association | U.S. Wind Industry Third Quarter 2018 Market Report | Public Version 33
Utility-Scale Wind Power Projects in Advanced Development
Member Version Only
American Wind Energy Association | U.S. Wind Industry Third Quarter 2018 Market Report | Public Version 34
Utility-Scale Wind Power Projects in Advanced Development
Member Version Only
American Wind Energy Association | U.S. Wind Industry Third Quarter 2018 Market Report | Public Version 35
2018 Power Purchase Agreements
Member Version Only
American Wind Energy Association | U.S. Wind Industry Third Quarter 2018 Market Report | Public Version 36
2018 Power Purchase Agreements
Member Version Only
American Wind Energy Association | U.S. Wind Industry Third Quarter 2018 Market Report | Public Version 37
2018 Project Acquisition Activity
Member Version Only
American Wind Energy Association | U.S. Wind Industry Third Quarter 2018 Market Report | Public Version 38
2018 Project Acquisition Activity
Member Version Only

American Wind Energy Association | U.S. Wind Industry Third Quarter 2018 Market Report | Public Version 39
2018 Project Acquisition Activity
Member Version Only
American Wind Energy Association | U.S. Wind Industry Third Quarter 2018 Market Report | Public Version 40
2018 Project Acquisition Activity
Member Version Only
American Wind Energy Association | U.S. Wind Industry Third Quarter 2018 Market Report | Public Version 41
Electric Utility Renewable Energy Requests for Proposals (RFPs)
Member Version Only
American Wind Energy Association | U.S. Wind Industry Third Quarter 2018 Market Report | Public Version 42
This Report is Powered by WindIQ
WindIQ is your comprehensive database of all online, under construction, and advanced development wind projects and wind-related manufacturing facilities in the United States, with interactive web
mapping features.
All current AWEA Business and Utility members can access WindIQ at www.awea.org/windiq or www.windiq.awea.org.
For additional AWEA industry data & analysis, please visit www.awea.org/marketreports where you can download previous versions of the Quarterly Market Reports and the latest Annual Market Report.
The AWEA U.S. Wind Industry Third Quarter 2018 Market Report can be accessed at www.awea.org/2018marketreports.
AWEA Data Services