americas capital markets - … morgan and goldman sachs ranked second and third with 11.21% and...
TRANSCRIPT

AMERICAS CAPITAL MARKETS LEAGUE TABLES Q1 2018

The Bloomberg Capital Markets Tables represent the top arrangers, bookrunners and advisors across a broad array of deal types including loans, bonds, equity and M&A transactions; according to Bloomberg standards.
LEAG<GO> for a full range of league tables
MA<GO> for a full range of merger & acquisition tables
NI LEAG CRL<GO> or http://www.bloomberg.com/ for a full range of market-specific league table publications
Due to the dynamic nature of the Professional Service product, league table rankings may vary between this release and data found on the Bloomberg Professional Service.
MANAGER RANKINGS
AMERICAS CAPITAL MARKETS
DATA SUBMISSIONS AND QUERIES
Equities
Fixed Income
Loans
Contact Email Phone
Q1 2018
© 2018 Bloomberg Finance L.P. All rights reserved.
Irina Arefyeva
Dean Psomaras
Paul Bandong
+1 646 324 4663 [email protected]
+1 609 279 3449 [email protected]
+1 609 279 5187 [email protected]

Bloomberg AmericasCapitalMarkets|Q12018
BloombergLeagueTableReports Page1
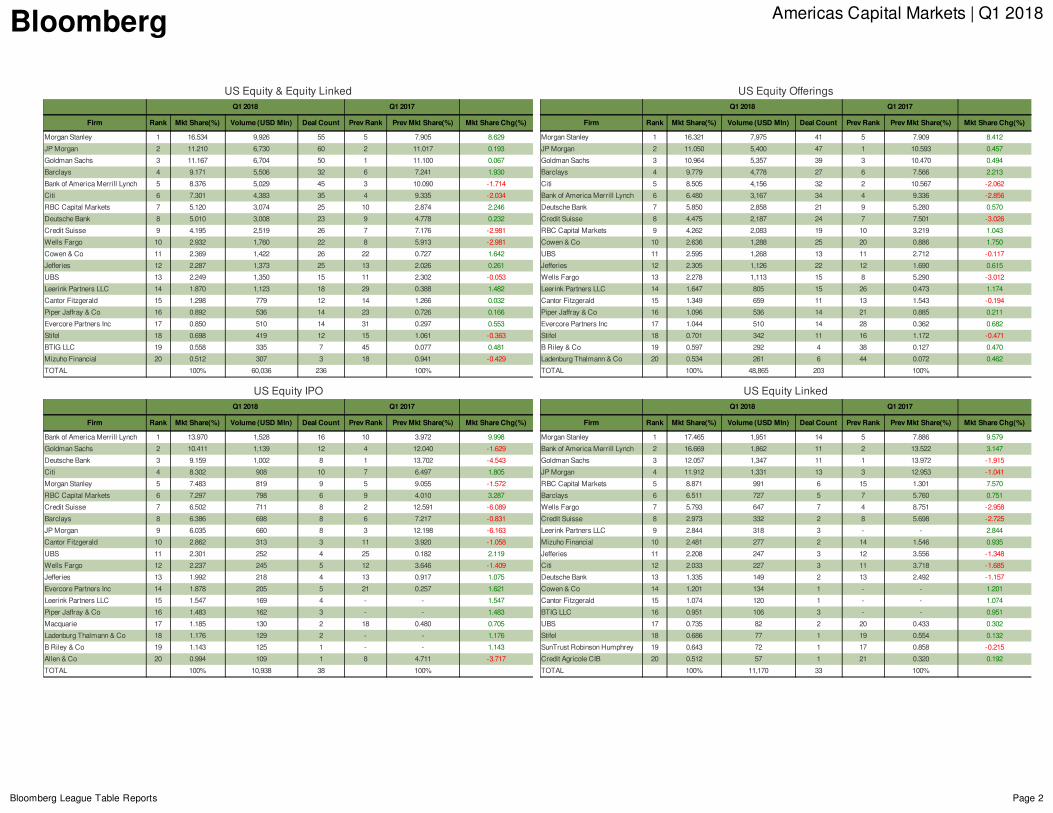
USEquityReviewQ12018creditedUSEquity&EquityLinkedvolumedecreased7.85%toUSD60.0Blnwhiledealcountdecreased8.17%to236offeringsyear-on-year.USEquityIPOvolumedecreased14.25%year-on-yeartoUSD10.9Blnwhilethedealcountincreased26.67%to38.USEquityLinkedvolumedecreased4.71%year-on-yeartoUSD11.2Blnover33deals.MorganStanleyrankedasthetopUSEquity&EquityLinkedunderwriterforQ12018with16.53%marketshare.Thebankunderwrote55dealsovertheperiod.JPMorganandGoldmanSachsrankedsecondandthirdwith11.21%and11.17%marketshare,respectively.
USEquity&EquityLinked:HighlightsofQ12018
USEquity&EquityLinked:QuarterlyVolume
Q12014
Q12014
Q12015
Q12015
Q12016
Q12016
Q12017
Q12017
QuartersQuarters
Q12013
Q12013
Q12018
Q12018
2020
4040
6060
8080
USDBln
USDBln
00
100100
100100
200200
300300
DealC
ountDealC
ount
00
400400
DealCount Equity-Linked Add'l IPO
TopUnderwriterMorganStanley
Numberofdeals 55
Volume(USDMln) 9,926
AvgDealsize(USDMln) 180.5
MarketSummaryNumberofdeals 236
Volume(USDMln) 60,036
AvgDealsize(USDMln) 254.4
Issuer Industry Volume(USDMln) Date
SempraEnergy Utilities 2,500 01/04/2018
DukeEnergyCorp Utilities 1,596 03/06/2018
GeneralMotorsCo ConsumerDiscretionary 1,592 02/27/2018
ADTInc Industrials 1,470 01/18/2018
VICIPropertiesInc Financials 1,392 01/31/2018
DominionEnergyInc Utilities 1,357 03/27/2018
TransUnion Technology 1,150 03/05/2018
WesternDigitalCorp Technology 1,100 01/31/2018
NorwegianCruiseLineHoldingsLtd ConsumerDiscretionary 1,092 02/27/2018
ONEOKInc Energy 1,036 01/04/2018
Financials21%
HealthCare20%
ConsumerDiscretionary14%
Technology14%
Utilities9%
Energy8%
Industrials8%
Others7%
USEquity&EquityLinked:IndustryBreakdown
USEquity&EquityLinked:IndustryBreakdown
Industry Volume(USDMln) %OfTotal %YOYChange
Financials 12,735 20.6% -38.9%
HealthCare 12,406 20.1% 150.6%
ConsumerDiscretionary 8,608 13.9% 27.9%
Technology 8,391 13.6% -6.2%
Utilities 5,546 9.0%
USEquity&EquityLinked:OfferingBreakdown
OfferingType Volume(USDMln) %OfTotal %YOYChange
AdditionalOfferings 38,566 62.4% -5.8%
Equity-Linked 12,277 19.9% -11.3%
IPO 10,938 17.7% -14.3%
21%
20%
14%
14%
9%
8%
8%
7%
Bloomberg AmericasCapitalMarkets|Q12018
BloombergLeagueTableReports Page2
USEquity&EquityLinkedQ12018 Q12017
Firm Rank MktShare(%) Volume(USDMln) DealCount PrevRank PrevMktShare(%) MktShareChg(%)
MorganStanley 1 16.534 9,926 55 5 7.905 8.629
JPMorgan 2 11.210 6,730 60 2 11.017 0.193
GoldmanSachs 3 11.167 6,704 50 1 11.100 0.067
Barclays 4 9.171 5,506 32 6 7.241 1.930
BankofAmericaMerrillLynch 5 8.376 5,029 45 3 10.090 -1.714
Citi 6 7.301 4,383 35 4 9.335 -2.034
RBCCapitalMarkets 7 5.120 3,074 25 10 2.874 2.246
DeutscheBank 8 5.010 3,008 23 9 4.778 0.232
CreditSuisse 9 4.195 2,519 26 7 7.176 -2.981
WellsFargo 10 2.932 1,760 22 8 5.913 -2.981
Cowen&Co 11 2.369 1,422 26 22 0.727 1.642
Jefferies 12 2.287 1,373 25 13 2.026 0.261
UBS 13 2.249 1,350 15 11 2.302 -0.053
LeerinkPartnersLLC 14 1.870 1,123 18 29 0.388 1.482
CantorFitzgerald 15 1.298 779 12 14 1.266 0.032
PiperJaffray&Co 16 0.892 536 14 23 0.726 0.166
EvercorePartnersInc 17 0.850 510 14 31 0.297 0.553
Stifel 18 0.698 419 12 15 1.061 -0.363
BTIGLLC 19 0.558 335 7 45 0.077 0.481
MizuhoFinancial 20 0.512 307 3 18 0.941 -0.429
TOTAL 100% 60,036 236 100%
USEquityOfferingsQ12018 Q12017
Firm Rank MktShare(%) Volume(USDMln) DealCount PrevRank PrevMktShare(%) MktShareChg(%)
MorganStanley 1 16.321 7,975 41 5 7.909 8.412
JPMorgan 2 11.050 5,400 47 1 10.593 0.457
GoldmanSachs 3 10.964 5,357 39 3 10.470 0.494
Barclays 4 9.779 4,778 27 6 7.566 2.213
Citi 5 8.505 4,156 32 2 10.567 -2.062
BankofAmericaMerrillLynch 6 6.480 3,167 34 4 9.336 -2.856
DeutscheBank 7 5.850 2,858 21 9 5.280 0.570
CreditSuisse 8 4.475 2,187 24 7 7.501 -3.026
RBCCapitalMarkets 9 4.262 2,083 19 10 3.219 1.043
Cowen&Co 10 2.636 1,288 25 20 0.886 1.750
UBS 11 2.595 1,268 13 11 2.712 -0.117
Jefferies 12 2.305 1,126 22 12 1.690 0.615
WellsFargo 13 2.278 1,113 15 8 5.290 -3.012
LeerinkPartnersLLC 14 1.647 805 15 26 0.473 1.174
CantorFitzgerald 15 1.349 659 11 13 1.543 -0.194
PiperJaffray&Co 16 1.096 536 14 21 0.885 0.211
EvercorePartnersInc 17 1.044 510 14 28 0.362 0.682
Stifel 18 0.701 342 11 16 1.172 -0.471
BRiley&Co 19 0.597 292 4 38 0.127 0.470
LadenburgThalmann&Co 20 0.534 261 6 44 0.072 0.462
TOTAL 100% 48,865 203 100%
USEquityIPOQ12018 Q12017
Firm Rank MktShare(%) Volume(USDMln) DealCount PrevRank PrevMktShare(%) MktShareChg(%)
BankofAmericaMerrillLynch 1 13.970 1,528 16 10 3.972 9.998
GoldmanSachs 2 10.411 1,139 12 4 12.040 -1.629
DeutscheBank 3 9.159 1,002 8 1 13.702 -4.543
Citi 4 8.302 908 10 7 6.497 1.805
MorganStanley 5 7.483 819 9 5 9.055 -1.572
RBCCapitalMarkets 6 7.297 798 6 9 4.010 3.287
CreditSuisse 7 6.502 711 8 2 12.591 -6.089
Barclays 8 6.386 698 8 6 7.217 -0.831
JPMorgan 9 6.035 660 8 3 12.198 -6.163
CantorFitzgerald 10 2.862 313 3 11 3.920 -1.058
UBS 11 2.301 252 4 25 0.182 2.119
WellsFargo 12 2.237 245 5 12 3.646 -1.409
Jefferies 13 1.992 218 4 13 0.917 1.075
EvercorePartnersInc 14 1.878 205 5 21 0.257 1.621
LeerinkPartnersLLC 15 1.547 169 4 - - 1.547
PiperJaffray&Co 16 1.483 162 3 - - 1.483
Macquarie 17 1.185 130 2 18 0.480 0.705
LadenburgThalmann&Co 18 1.176 129 2 - - 1.176
BRiley&Co 19 1.143 125 1 - - 1.143
Allen&Co 20 0.994 109 1 8 4.711 -3.717
TOTAL 100% 10,938 38 100%
USEquityLinkedQ12018 Q12017
Firm Rank MktShare(%) Volume(USDMln) DealCount PrevRank PrevMktShare(%) MktShareChg(%)
MorganStanley 1 17.465 1,951 14 5 7.886 9.579
BankofAmericaMerrillLynch 2 16.669 1,862 11 2 13.522 3.147
GoldmanSachs 3 12.057 1,347 11 1 13.972 -1.915
JPMorgan 4 11.912 1,331 13 3 12.953 -1.041
RBCCapitalMarkets 5 8.871 991 6 15 1.301 7.570
Barclays 6 6.511 727 5 7 5.760 0.751
WellsFargo 7 5.793 647 7 4 8.751 -2.958
CreditSuisse 8 2.973 332 2 8 5.698 -2.725
LeerinkPartnersLLC 9 2.844 318 3 - - 2.844
MizuhoFinancial 10 2.481 277 2 14 1.546 0.935
Jefferies 11 2.208 247 3 12 3.556 -1.348
Citi 12 2.033 227 3 11 3.718 -1.685
DeutscheBank 13 1.335 149 2 13 2.492 -1.157
Cowen&Co 14 1.201 134 1 - - 1.201
CantorFitzgerald 15 1.074 120 1 - - 1.074
BTIGLLC 16 0.951 106 3 - - 0.951
UBS 17 0.735 82 2 20 0.433 0.302
Stifel 18 0.686 77 1 19 0.554 0.132
SunTrustRobinsonHumphrey 19 0.643 72 1 17 0.858 -0.215
CreditAgricoleCIB 20 0.512 57 1 21 0.320 0.192
TOTAL 100% 11,170 33 100%
Bloomberg AmericasCapitalMarkets|Q12018
BloombergLeagueTableReports Page3
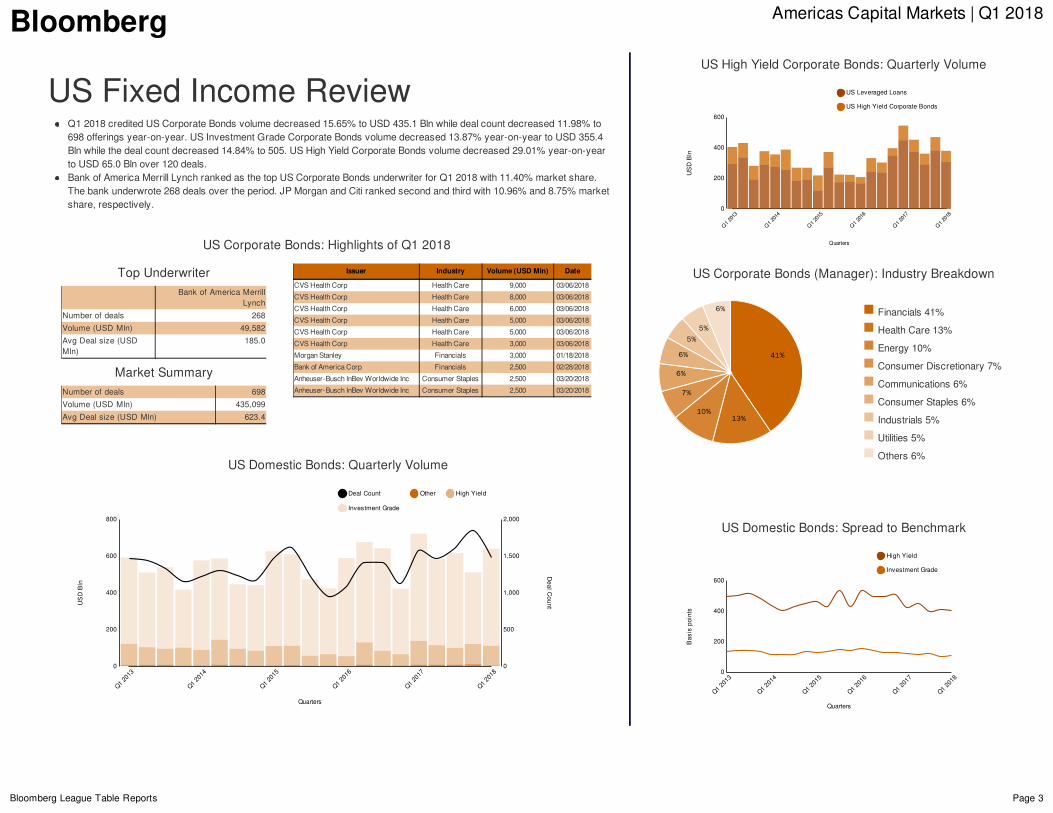
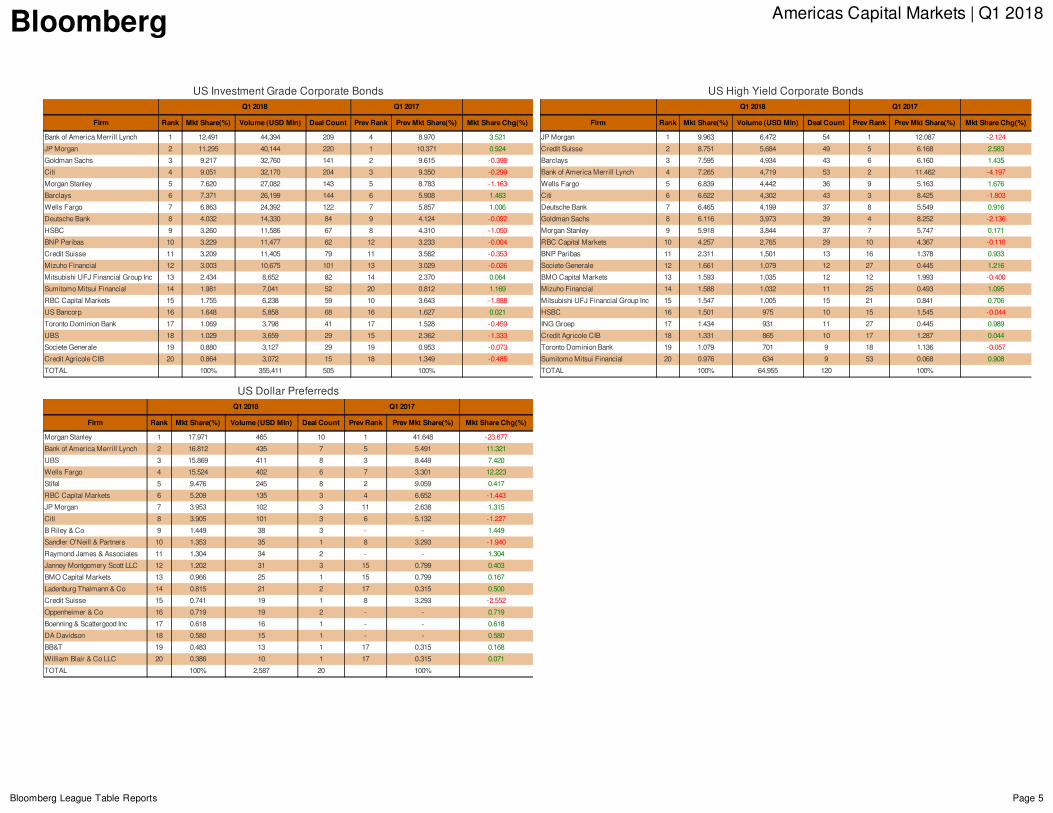
USFixedIncomeReviewQ12018creditedUSCorporateBondsvolumedecreased15.65%toUSD435.1Blnwhiledealcountdecreased11.98%to698offeringsyear-on-year.USInvestmentGradeCorporateBondsvolumedecreased13.87%year-on-yeartoUSD355.4Blnwhilethedealcountdecreased14.84%to505.USHighYieldCorporateBondsvolumedecreased29.01%year-on-yeartoUSD65.0Blnover120deals.BankofAmericaMerrillLynchrankedasthetopUSCorporateBondsunderwriterforQ12018with11.40%marketshare.Thebankunderwrote268dealsovertheperiod.JPMorganandCitirankedsecondandthirdwith10.96%and8.75%marketshare,respectively.
USCorporateBonds:HighlightsofQ12018
USDomesticBonds:QuarterlyVolume
Q12014
Q12014
Q12015
Q12015
Q12016
Q12016
Q12017
Q12017
QuartersQuarters
Q12013
Q12013
Q12018
Q12018
200200
400400
600600
USDBln
USDBln
00
800800
500500
1,0001,000
1,5001,500
DealC
ountDealC
ount
00
2,0002,000
DealCount Other HighYield
InvestmentGrade
TopUnderwriterBankofAmericaMerrill
Lynch
Numberofdeals 268
Volume(USDMln) 49,582
AvgDealsize(USDMln)
185.0
MarketSummaryNumberofdeals 698
Volume(USDMln) 435,099
AvgDealsize(USDMln) 623.4
Issuer Industry Volume(USDMln) Date
CVSHealthCorp HealthCare 9,000 03/06/2018
CVSHealthCorp HealthCare 8,000 03/06/2018
CVSHealthCorp HealthCare 6,000 03/06/2018
CVSHealthCorp HealthCare 5,000 03/06/2018
CVSHealthCorp HealthCare 5,000 03/06/2018
CVSHealthCorp HealthCare 3,000 03/06/2018
MorganStanley Financials 3,000 01/18/2018
BankofAmericaCorp Financials 2,500 02/28/2018
Anheuser-BuschInBevWorldwideInc ConsumerStaples 2,500 03/20/2018
Anheuser-BuschInBevWorldwideInc ConsumerStaples 2,500 03/20/2018
Financials41%
HealthCare13%
Energy10%
ConsumerDiscretionary7%
Communications6%
ConsumerStaples6%
Industrials5%
Utilities5%
Others6%
USHighYieldCorporateBonds:QuarterlyVolume
Q12014
Q12014
Q12015
Q12015
Q12016
Q12016
Q12017
Q12017
QuartersQuarters
Q12013
Q12013
Q12018
Q12018
200200
400400
USDBln
USDBln
00
600600
USLeveragedLoans
USHighYieldCorporateBonds
USCorporateBonds(Manager):IndustryBreakdown
USDomesticBonds:SpreadtoBenchmark
Q12014
Q12014
Q12015
Q12015
Q12016
Q12016
Q12017
Q12017
QuartersQuarters
Q12013
Q12013
Q12018
Q12018
200200
400400
Basispoints
Basispoints
00
600600
HighYield
InvestmentGrade
41%
13%10%
7%
6%
6%
5%5%
6%

Bloomberg AmericasCapitalMarkets|Q12018
BloombergLeagueTableReports Page4
USDomesticBondsQ12018 Q12017
Firm Rank MktShare(%) Volume(USDMln) DealCount PrevRank PrevMktShare(%) MktShareChg(%)
BankofAmericaMerrillLynch 1 10.071 62,602 333 4 8.089 1.982
Citi 2 9.983 62,057 333 2 10.344 -0.361
JPMorgan 3 9.727 60,466 322 1 10.466 -0.739
Barclays 4 7.562 47,005 222 6 6.559 1.003
GoldmanSachs 5 7.386 45,915 201 3 8.269 -0.883
MorganStanley 6 6.302 39,176 318 5 7.394 -1.092
WellsFargo 7 5.899 36,671 265 8 4.766 1.133
DeutscheBank 8 4.693 29,172 165 7 4.907 -0.214
HSBC 9 4.642 28,858 134 9 4.529 0.113
CreditSuisse 10 2.962 18,411 131 11 3.047 -0.085
BNPParibas 11 2.862 17,791 87 12 2.867 -0.005
RBCCapitalMarkets 12 2.545 15,822 104 10 3.062 -0.517
TorontoDominionBank 13 2.476 15,390 96 13 2.745 -0.269
MizuhoFinancial 14 2.274 14,134 162 14 2.012 0.262
MitsubishiUFJFinancialGroupInc 15 1.623 10,090 101 16 1.549 0.074
Nomura 16 1.621 10,077 76 18 1.352 0.269
SumitomoMitsuiFinancial 17 1.435 8,921 63 28 0.482 0.953
BMOCapitalMarkets 18 1.081 6,718 31 17 1.415 -0.334
USBancorp 19 0.946 5,880 69 20 1.000 -0.054
SocieteGenerale 20 0.855 5,314 46 23 0.713 0.142
TOTAL 100% 621,628 1,368 100%
USAgencyBondsQ12018 Q12017
Firm Rank MktShare(%) Volume(USDMln) DealCount PrevRank PrevMktShare(%) MktShareChg(%)
WellsFargo 1 12.426 8,814 174 4 7.319 5.107
Barclays 2 11.832 8,393 25 1 13.537 -1.705
Nomura 3 9.450 6,704 72 3 9.300 0.150
Citi 4 7.726 5,480 41 2 11.534 -3.808
TorontoDominionBank 5 6.304 4,472 41 5 5.977 0.327
BankofAmericaMerrillLynch 6 4.832 3,428 55 13 2.513 2.319
Jefferies 7 4.183 2,967 54 11 3.039 1.144
HSBC 8 3.678 2,609 27 18 1.600 2.078
FTNFinancial 9 3.628 2,574 113 10 3.088 0.540
MorganStanley 10 3.410 2,419 159 6 4.578 -1.168
MizuhoFinancial 11 3.297 2,338 69 17 1.800 1.497
DaiwaSecurities 12 2.774 1,968 41 8 3.667 -0.893
JPMorgan 13 2.757 1,956 52 9 3.421 -0.664
DeutscheBank 14 2.720 1,930 35 22 1.154 1.566
LoopCapitalMarketsLLC 15 2.177 1,544 27 15 2.153 0.024
RaymondJames&Associates 16 1.950 1,383 95 21 1.214 0.736
INTLFCStoneInc 17 1.831 1,299 77 14 2.226 -0.395
Incapital 18 1.764 1,251 115 12 2.650 -0.886
BankofNewYorkMellon 19 1.421 1,008 53 19 1.450 -0.029
ViningSparks 20 1.404 996 93 20 1.421 -0.017
TOTAL 100% 70,934 1,068 100%
USCorporateBondsQ12018 Q12017
Firm Rank MktShare(%) Volume(USDMln) DealCount PrevRank PrevMktShare(%) MktShareChg(%)
BankofAmericaMerrillLynch 1 11.395 49,582 268 3 9.252 2.143
JPMorgan 2 10.959 47,684 284 1 10.640 0.319
Citi 3 8.752 38,080 260 2 9.326 -0.574
GoldmanSachs 4 8.535 37,137 183 4 9.088 -0.553
MorganStanley 5 7.295 31,740 192 5 8.308 -1.013
Barclays 6 7.200 31,329 186 6 5.808 1.392
WellsFargo 7 6.610 28,760 158 7 5.585 1.025
DeutscheBank 8 4.235 18,425 119 8 4.318 -0.083
CreditSuisse 9 3.925 17,077 129 9 3.970 -0.045
BNPParibas 10 3.109 13,528 78 12 2.842 0.267
HSBC 11 3.018 13,132 81 10 3.858 -0.840
MizuhoFinancial 12 2.782 12,106 114 13 2.511 0.271
MitsubishiUFJFinancialGroupInc 13 2.235 9,723 98 15 2.045 0.190
RBCCapitalMarkets 14 2.130 9,267 89 11 3.741 -1.611
SumitomoMitsuiFinancial 15 1.752 7,621 60 23 0.662 1.090
USBancorp 16 1.352 5,880 69 17 1.373 -0.021
UBS 17 1.036 4,505 42 14 2.233 -1.197
TorontoDominionBank 18 1.034 4,499 50 16 1.423 -0.389
SocieteGenerale 19 1.030 4,481 44 19 0.858 0.172
CreditAgricoleCIB 20 0.981 4,270 26 18 1.308 -0.327
TOTAL 100% 435,099 698 100%
USDollarForeignIssuerBondsQ12018 Q12017
Firm Rank MktShare(%) Volume(USDMln) DealCount PrevRank PrevMktShare(%) MktShareChg(%)
Citi 1 10.406 40,079 201 2 8.549 1.857
HSBC 2 7.756 29,875 152 3 8.180 -0.424
BankofAmericaMerrillLynch 3 7.516 28,947 144 5 5.339 2.177
JPMorgan 4 7.470 28,772 148 1 9.538 -2.068
DeutscheBank 5 5.302 20,420 82 6 5.189 0.113
Barclays 6 5.280 20,337 98 7 4.973 0.307
GoldmanSachs 7 5.108 19,672 87 4 5.821 -0.713
BNPParibas 8 4.461 17,184 87 9 3.858 0.603
MorganStanley 9 4.143 15,959 107 8 4.925 -0.782
StandardCharteredBank 10 2.744 10,569 83 12 2.730 0.014
CreditSuisse 11 2.626 10,116 67 11 3.190 -0.564
RBCCapitalMarkets 12 2.495 9,611 40 13 2.641 -0.146
TorontoDominionBank 13 2.280 8,783 32 10 3.309 -1.029
BMOCapitalMarkets 14 1.872 7,212 25 15 2.051 -0.179
Nomura 15 1.642 6,325 28 17 1.186 0.456
SumitomoMitsuiFinancial 16 1.630 6,278 34 42 0.318 1.312
CreditAgricoleCIB 17 1.591 6,127 53 16 1.528 0.063
UBS 18 1.548 5,964 38 14 2.178 -0.630
MizuhoFinancial 19 1.439 5,542 58 20 1.017 0.422
VTBCapital 20 1.250 4,815 14 65 0.159 1.091
TOTAL 100% 385,166 734 100%
Bloomberg AmericasCapitalMarkets|Q12018
BloombergLeagueTableReports Page5
USInvestmentGradeCorporateBondsQ12018 Q12017
Firm Rank MktShare(%) Volume(USDMln) DealCount PrevRank PrevMktShare(%) MktShareChg(%)
BankofAmericaMerrillLynch 1 12.491 44,394 209 4 8.970 3.521
JPMorgan 2 11.295 40,144 220 1 10.371 0.924
GoldmanSachs 3 9.217 32,760 141 2 9.615 -0.398
Citi 4 9.051 32,170 204 3 9.350 -0.299
MorganStanley 5 7.620 27,082 143 5 8.783 -1.163
Barclays 6 7.371 26,199 144 6 5.908 1.463
WellsFargo 7 6.863 24,392 122 7 5.857 1.006
DeutscheBank 8 4.032 14,330 84 9 4.124 -0.092
HSBC 9 3.260 11,586 67 8 4.310 -1.050
BNPParibas 10 3.229 11,477 62 12 3.233 -0.004
CreditSuisse 11 3.209 11,405 79 11 3.562 -0.353
MizuhoFinancial 12 3.003 10,675 101 13 3.029 -0.026
MitsubishiUFJFinancialGroupInc 13 2.434 8,652 82 14 2.370 0.064
SumitomoMitsuiFinancial 14 1.981 7,041 52 20 0.812 1.169
RBCCapitalMarkets 15 1.755 6,238 59 10 3.643 -1.888
USBancorp 16 1.648 5,858 68 16 1.627 0.021
TorontoDominionBank 17 1.069 3,798 41 17 1.528 -0.459
UBS 18 1.029 3,659 29 15 2.362 -1.333
SocieteGenerale 19 0.880 3,127 29 19 0.953 -0.073
CreditAgricoleCIB 20 0.864 3,072 15 18 1.349 -0.485
TOTAL 100% 355,411 505 100%
USHighYieldCorporateBondsQ12018 Q12017
Firm Rank MktShare(%) Volume(USDMln) DealCount PrevRank PrevMktShare(%) MktShareChg(%)
JPMorgan 1 9.963 6,472 54 1 12.087 -2.124
CreditSuisse 2 8.751 5,684 49 5 6.168 2.583
Barclays 3 7.595 4,934 43 6 6.160 1.435
BankofAmericaMerrillLynch 4 7.265 4,719 53 2 11.462 -4.197
WellsFargo 5 6.839 4,442 36 9 5.163 1.676
Citi 6 6.622 4,302 43 3 8.425 -1.803
DeutscheBank 7 6.465 4,199 37 8 5.549 0.916
GoldmanSachs 8 6.116 3,973 39 4 8.252 -2.136
MorganStanley 9 5.918 3,844 37 7 5.747 0.171
RBCCapitalMarkets 10 4.257 2,765 29 10 4.367 -0.110
BNPParibas 11 2.311 1,501 13 16 1.378 0.933
SocieteGenerale 12 1.661 1,079 12 27 0.445 1.216
BMOCapitalMarkets 13 1.593 1,035 12 12 1.993 -0.400
MizuhoFinancial 14 1.588 1,032 11 25 0.493 1.095
MitsubishiUFJFinancialGroupInc 15 1.547 1,005 15 21 0.841 0.706
HSBC 16 1.501 975 10 15 1.545 -0.044
INGGroep 17 1.434 931 11 27 0.445 0.989
CreditAgricoleCIB 18 1.331 865 10 17 1.287 0.044
TorontoDominionBank 19 1.079 701 9 18 1.136 -0.057
SumitomoMitsuiFinancial 20 0.976 634 9 53 0.068 0.908
TOTAL 100% 64,955 120 100%
USDollarPreferredsQ12018 Q12017
Firm Rank MktShare(%) Volume(USDMln) DealCount PrevRank PrevMktShare(%) MktShareChg(%)
MorganStanley 1 17.971 465 10 1 41.648 -23.677
BankofAmericaMerrillLynch 2 16.812 435 7 5 5.491 11.321
UBS 3 15.869 411 8 3 8.449 7.420
WellsFargo 4 15.524 402 6 7 3.301 12.223
Stifel 5 9.476 245 8 2 9.059 0.417
RBCCapitalMarkets 6 5.209 135 3 4 6.652 -1.443
JPMorgan 7 3.953 102 3 11 2.638 1.315
Citi 8 3.905 101 3 6 5.132 -1.227
BRiley&Co 9 1.449 38 3 - - 1.449
SandlerO'Neill&Partners 10 1.353 35 1 8 3.293 -1.940
RaymondJames&Associates 11 1.304 34 2 - - 1.304
JanneyMontgomeryScottLLC 12 1.202 31 3 15 0.799 0.403
BMOCapitalMarkets 13 0.966 25 1 15 0.799 0.167
LadenburgThalmann&Co 14 0.815 21 2 17 0.315 0.500
CreditSuisse 15 0.741 19 1 8 3.293 -2.552
Oppenheimer&Co 16 0.719 19 2 - - 0.719
Boenning&ScattergoodInc 17 0.618 16 1 - - 0.618
DADavidson 18 0.580 15 1 - - 0.580
BB&T 19 0.483 13 1 17 0.315 0.168
WilliamBlair&CoLLC 20 0.386 10 1 17 0.315 0.071
TOTAL 100% 2,587 20 100%

Bloomberg AmericasCapitalMarkets|Q12018
BloombergLeagueTableReports Page6
USMunicipalsReview
USMunicipalLongTerm
Q12018 Q12017
Firm RankMkt
Share(%)Volume(USD
Mln)Deal
CountPrevRank
PrevMktShare(%)
MktShareChg(%)
BankofAmericaMerrillLynch 1 20.975 12,802 74 2 12.294 8.681
MorganStanley 2 10.833 6,612 44 5 7.161 3.672
Citi 3 8.571 5,231 62 1 15.911 -7.340
RBCCapitalMarkets 4 8.373 5,111 81 4 8.353 0.020
GoldmanSachs 5 7.482 4,567 15 6 6.221 1.261
JPMorgan 6 5.608 3,423 39 3 8.706 -3.098
Jefferies 7 4.977 3,038 9 9 4.044 0.933
WellsFargo 8 4.056 2,476 30 8 4.910 -0.854
Stifel 9 3.357 2,049 110 7 4.989 -1.632
RaymondJames&Associates 10 2.965 1,810 104 11 3.558 -0.593
RobertWBaird&Co 11 2.916 1,780 141 13 2.498 0.418
PiperJaffray&Co 12 2.727 1,665 55 10 4.040 -1.313
Barclays 13 1.569 958 9 12 2.984 -1.415
LoopCapitalMarketsLLC 14 1.309 799 6 18 0.674 0.635
UBS 15 1.005 614 18 47 0.130 0.875
JanneyMontgomeryScottLLC 16 0.987 602 31 20 0.630 0.357
DADavidson 17 0.835 509 46 16 0.783 0.052
SiebertCisnerosShank&CoLLC
18 0.831 507 5 15 0.911 -0.080
SamuelARamirez&CoInc 19 0.747 456 7 19 0.635 0.112
KeyBancCapitalMarkets 20 0.677 413 7 26 0.366 0.311
TOTAL 100% 61,037 1,447 100%
Thistableconsistsofalllong-termissuance(fixedrate&adjustablerate)fortheUSMunicipalMarketinUSDollars.Remarketeddealsandprivateplacementsarenotincluded.
GeneralObligation22%
SCD18%
Others60%
MarketShareChange
MunicipalIndustryDistribution
22%
18%60%
BankofAmericaMerrillLynch
MorganStanley Ci
ti
RBCCapitalMarkets
GoldmanSachs
JPMorgan
5
10
15
20
MarketShare(%
)
0
25
2018 2017 2016
Bloomberg AmericasCapitalMarkets|Q12018
BloombergLeagueTableReports Page7
USMunicipalLongTermQ12018 Q12017
Firm Rank MktShare(%) Volume(USDMln) DealCount PrevRank PrevMktShare(%) MktShareChg(%)
BankofAmericaMerrillLynch 1 20.975 12,802 74 2 12.294 8.681
MorganStanley 2 10.833 6,612 44 5 7.161 3.672
Citi 3 8.571 5,231 62 1 15.911 -7.340
RBCCapitalMarkets 4 8.373 5,111 81 4 8.353 0.020
GoldmanSachs 5 7.482 4,567 15 6 6.221 1.261
JPMorgan 6 5.608 3,423 39 3 8.706 -3.098
Jefferies 7 4.977 3,038 9 9 4.044 0.933
WellsFargo 8 4.056 2,476 30 8 4.910 -0.854
Stifel 9 3.357 2,049 110 7 4.989 -1.632
RaymondJames&Associates 10 2.965 1,810 104 11 3.558 -0.593
RobertWBaird&Co 11 2.916 1,780 141 13 2.498 0.418
PiperJaffray&Co 12 2.727 1,665 55 10 4.040 -1.313
Barclays 13 1.569 958 9 12 2.984 -1.415
LoopCapitalMarketsLLC 14 1.309 799 6 18 0.674 0.635
UBS 15 1.005 614 18 47 0.130 0.875
JanneyMontgomeryScottLLC 16 0.987 602 31 20 0.630 0.357
DADavidson 17 0.835 509 46 16 0.783 0.052
SiebertCisnerosShank&CoLLC 18 0.831 507 5 15 0.911 -0.080
SamuelARamirez&CoInc 19 0.747 456 7 19 0.635 0.112
KeyBancCapitalMarkets 20 0.677 413 7 26 0.366 0.311
TOTAL 100% 61,037 1,447 100%
USMunicipalLongTermNegotiatedQ12018 Q12017
Firm Rank MktShare(%) Volume(USDMln) DealCount PrevRank PrevMktShare(%) MktShareChg(%)
BankofAmericaMerrillLynch 1 19.777 8,539 40 3 9.423 10.354
RBCCapitalMarkets 2 11.091 4,789 67 2 11.000 0.091
MorganStanley 3 10.928 4,718 26 7 5.887 5.041
GoldmanSachs 4 9.568 4,131 13 4 8.247 1.321
Jefferies 5 6.184 2,670 6 8 4.746 1.438
Citi 6 6.013 2,596 29 1 15.532 -9.519
JPMorgan 7 5.224 2,256 23 5 7.852 -2.628
Stifel 8 4.584 1,979 99 6 6.505 -1.921
WellsFargo 9 3.491 1,507 17 12 3.407 0.084
RaymondJames&Associates 10 3.009 1,299 61 11 3.840 -0.831
PiperJaffray&Co 11 2.939 1,269 31 9 4.572 -1.633
Barclays 12 2.219 958 9 10 3.956 -1.737
LoopCapitalMarketsLLC 13 1.850 799 6 18 0.893 0.957
RobertWBaird&Co 14 1.258 543 38 17 0.921 0.337
SiebertCisnerosShank&CoLLC 15 1.174 507 5 14 1.208 -0.034
DADavidson 16 1.136 491 42 15 0.977 0.159
SamuelARamirez&CoInc 17 1.056 456 7 19 0.842 0.214
KeyBancCapitalMarkets 18 0.958 413 7 20 0.452 0.506
GeorgeKBaum&Co 19 0.591 255 24 13 1.343 -0.752
FifthThirdBancorp 20 0.485 209 12 26 0.362 0.123
TOTAL 100% 43,176 783 100%
USMunicipalLongTermCompetitiveQ12018 Q12017
Firm Rank MktShare(%) Volume(USDMln) DealCount PrevRank PrevMktShare(%) MktShareChg(%)
BankofAmericaMerrillLynch 1 23.869 4,263 34 1 21.107 2.762
Citi 2 14.752 2,635 33 2 17.076 -2.324
MorganStanley 3 10.603 1,894 18 4 11.075 -0.472
RobertWBaird&Co 4 6.924 1,237 103 6 7.341 -0.417
JPMorgan 5 6.534 1,167 16 3 11.327 -4.793
WellsFargo 6 5.421 968 13 5 9.527 -4.106
UBS 7 3.435 614 18 19 0.527 2.908
JanneyMontgomeryScottLLC 8 3.124 558 27 10 1.776 1.348
RaymondJames&Associates 9 2.859 511 43 7 2.692 0.167
GoldmanSachs 10 2.437 435 2 - - 2.437
PiperJaffray&Co 11 2.217 396 24 8 2.407 -0.190
Jefferies 12 2.060 368 4 9 1.887 0.173
RBCCapitalMarkets 13 1.802 322 14 26 0.227 1.575
FTNFinancial 14 1.348 241 27 13 1.350 -0.002
Roosevelt&CrossInc 15 1.130 202 31 12 1.415 -0.285
BOKFinancialCorp 16 1.125 201 37 22 0.374 0.751
TorontoDominionBank 17 1.120 200 1 - - 1.120
FifthThirdBancorp 18 1.029 184 17 27 0.224 0.805
JJBHilliardWLLyonsLLC 19 0.969 173 22 24 0.293 0.676
HutchinsonShockeyErley&Co 20 0.910 163 16 16 1.119 -0.209
TOTAL 100% 17,861 666 100%
USMunicipalLongTermFixedRateQ12018 Q12017
Firm Rank MktShare(%) Volume(USDMln) DealCount PrevRank PrevMktShare(%) MktShareChg(%)
BankofAmericaMerrillLynch 1 21.623 12,283 72 2 12.163 9.460
MorganStanley 2 10.204 5,796 44 5 7.195 3.009
Citi 3 9.078 5,157 60 1 15.877 -6.799
GoldmanSachs 4 6.732 3,824 13 6 6.428 0.304
RBCCapitalMarkets 5 6.445 3,661 74 4 7.937 -1.492
JPMorgan 6 5.541 3,148 36 3 8.490 -2.949
Jefferies 7 5.348 3,038 9 10 3.879 1.469
WellsFargo 8 4.306 2,446 29 7 5.074 -0.768
Stifel 9 3.455 1,962 107 8 5.056 -1.601
RaymondJames&Associates 10 3.165 1,798 103 11 3.671 -0.506
RobertWBaird&Co 11 3.134 1,780 141 13 2.581 0.553
PiperJaffray&Co 12 2.931 1,665 55 9 4.175 -1.244
Barclays 13 1.537 873 7 12 3.084 -1.547
LoopCapitalMarketsLLC 14 1.406 799 6 18 0.696 0.710
UBS 15 1.080 614 18 45 0.134 0.946
JanneyMontgomeryScottLLC 16 1.060 602 31 20 0.651 0.409
DADavidson 17 0.897 509 46 16 0.803 0.094
SiebertCisnerosShank&CoLLC 18 0.893 507 5 15 0.942 -0.049
SamuelARamirez&CoInc 19 0.803 456 7 19 0.656 0.147
KeyBancCapitalMarkets 20 0.728 413 7 26 0.366 0.362
TOTAL 100% 56,803 1,418 100%

Bloomberg AmericasCapitalMarkets|Q12018
BloombergLeagueTableReports Page8
USMunicipalShortTermNotesQ12018 Q12017
Firm Rank MktShare(%) Volume(USDMln) DealCount PrevRank PrevMktShare(%) MktShareChg(%)
Jefferies 1 16.575 759 68 3 15.623 0.952
Citi 2 16.546 758 5 8 3.701 12.845
MorganStanley 3 13.161 603 8 4 10.090 3.071
TorontoDominionBank 4 12.541 574 38 5 7.834 4.707
JPMorgan 5 9.061 415 15 1 16.534 -7.473
BankofAmericaMerrillLynch 6 8.900 408 4 2 15.667 -6.767
Oppenheimer&Co 7 7.189 329 55 6 7.700 -0.511
WellsFargo 8 5.460 250 1 7 7.341 -1.881
GoldmanSachs 9 2.157 99 2 17 0.578 1.579
RaymondJames&Associates 10 1.324 61 4 15 0.842 0.482
EasternBankCorp 11 1.307 60 13 10 1.543 -0.236
RBCCapitalMarkets 12 1.288 59 6 9 2.388 -1.100
FifthThirdBancorp 13 0.959 44 9 13 1.097 -0.138
KeyBancCapitalMarkets 14 0.894 41 5 16 0.679 0.215
Stifel 15 0.871 40 6 11 1.438 -0.567
Roosevelt&CrossInc 16 0.619 28 9 22 0.389 0.230
PNCFinancialServicesGroupInc 17 0.433 20 3 32 0.076 0.357
RossSinclaire&AssociatesInc 18 0.171 8 3 28 0.154 0.017
AmeritasInvestmentCorp 19 0.122 6 4 30 0.135 -0.013
PioneerCommercialBank 20 0.079 4 1 27 0.200 -0.121
TOTAL 100% 4,579 263 100%
USMunicipalLong&ShortTermQ12018 Q12017
Firm Rank MktShare(%) Volume(USDMln) DealCount PrevRank PrevMktShare(%) MktShareChg(%)
BankofAmericaMerrillLynch 1 20.143 13,220 76 2 12.455 7.688
MorganStanley 2 10.993 7,215 52 5 7.301 3.692
Citi 3 9.126 5,989 65 1 15.327 -6.201
RBCCapitalMarkets 4 7.877 5,170 86 4 8.068 -0.191
GoldmanSachs 5 7.109 4,665 16 6 5.951 1.158
JPMorgan 6 5.848 3,838 53 3 9.080 -3.232
Jefferies 7 5.786 3,797 77 9 4.597 1.189
WellsFargo 8 4.153 2,726 31 7 5.026 -0.873
Stifel 9 3.183 2,089 116 8 4.821 -1.638
RaymondJames&Associates 10 2.850 1,871 107 11 3.428 -0.578
RobertWBaird&Co 11 2.712 1,780 141 13 2.395 0.317
PiperJaffray&Co 12 2.538 1,666 55 10 3.854 -1.316
Barclays 13 1.460 958 9 12 2.869 -1.409
TorontoDominionBank 14 1.264 830 41 28 0.375 0.889
LoopCapitalMarketsLLC 15 1.217 799 6 19 0.642 0.575
UBS 16 0.935 614 18 48 0.123 0.812
JanneyMontgomeryScottLLC 17 0.918 602 31 20 0.600 0.318
DADavidson 18 0.777 510 47 16 0.746 0.031
SiebertCisnerosShank&CoLLC 19 0.773 507 5 15 0.868 -0.095
Oppenheimer&Co 20 0.772 506 61 21 0.522 0.250
TOTAL 100% 65,628 1,671 100%

Bloomberg AmericasCapitalMarkets|Q12018
BloombergLeagueTableReports Page9
USLoansReviewQ12018creditedbookrunnerUSLoansvolumedecreased23.09%toUSD480.1Blnwhilethenumberofdealsdecreased20.13%to734dealsyear-on-year.USLeveragedLoansvolumedecreased29.93%year-on-yeartoUSD303.8Blnwhilethenumberofdealsdecreased17.96%to539.BankofAmericaMerrillLynchrankedasthetopbookrunnerUSLoansunderwriterforQ12018with15.01%marketshare.Thebankactedasbookrunneron258dealsovertheperiod.JPMorganandWellsFargorankedsecondandthirdwith12.80%and8.19%marketshare,respectively.
USLoans(Bookrunner)
Q12018 Q12017
Firm Rank MktShare(%) Volume(USDMln) DealCount PrevRank PrevMktShare(%) MktShareChg(%)
BankofAmericaMerrillLynch 1 15.008 72,053 258 1 13.222 1.786
JPMorgan 2 12.804 61,472 226 2 11.522 1.282
WellsFargo 3 8.190 39,322 158 3 7.570 0.620
Citi 4 5.501 26,408 104 5 5.859 -0.358
GoldmanSachs 5 5.331 25,593 114 6 5.680 -0.349
Barclays 6 4.854 23,302 106 4 6.117 -1.263
CreditSuisse 7 4.516 21,680 108 8 4.567 -0.051
DeutscheBank 8 3.945 18,941 90 7 5.384 -1.439
RBCCapitalMarkets 9 3.472 16,669 78 10 3.607 -0.135
MorganStanley 10 3.325 15,964 91 9 4.260 -0.935
TOTAL 100% 480,103 734 100%
USLoans:QuarterlyVolume
Q12014
Q12014
Q12015
Q12015
Q12016
Q12016
Q12017
Q12017
QuartersQuarters
Q12013
Q12013
Q12018
Q12018
100100
200200
300300
400400
500500
600600
USDBln
USDBln
00
700700
200200
400400
600600
800800
1,0001,000
1,2001,200
DealC
ountDealC
ount
00
1,4001,400
DealCount Amount
Financials18%
ConsumerDiscretionary16%
Industrials12%
Technology12%
Energy8%
HealthCare8%
Communications8%
Materials7%
ConsumerStaples6%
Others5%
USHighYieldCorporateBonds:QuarterlyVolume
Q12014
Q12014
Q12015
Q12015
Q12016
Q12016
Q12017
Q12017
QuartersQuarters
Q12013
Q12013
Q12018
Q12018
200200
400400
USDBln
USDBln
00
600600
USLeveragedLoans
USHighYieldCorporateBonds
USLoans:IndustryBreakdown
USLoans:IndustryBreakdown
Industry Volume(USDMln) %OfTotal %YOYChange
Financials 89,718 18.1% -22.5%
ConsumerDiscretionary 78,968 16.0% -32.1%
Industrials 60,803 12.3% 24.6%
Technology 59,132 12.0% -14.7%
Energy 41,087 8.3% 2.6%
HealthCare 39,384 8.0% -28.3%
Communications 38,098 7.7% -48.2%
Materials 32,147 6.5% -23.9%
ConsumerStaples 31,990 6.5% -31.0%
Utilities 23,184 4.7% -39.5%
18%
16%
12%12%
8%
8%
8%
7%
6%
5%

Bloomberg AmericasCapitalMarkets|Q12018
BloombergLeagueTableReports Page10
USLoans(Bookrunner)Q12018 Q12017
Firm Rank MktShare(%) Volume(USDMln) DealCount PrevRank PrevMktShare(%) MktShareChg(%)
BankofAmericaMerrillLynch 1 15.008 72,053 258 1 13.222 1.786
JPMorgan 2 12.804 61,472 226 2 11.522 1.282
WellsFargo 3 8.190 39,322 158 3 7.570 0.620
Citi 4 5.501 26,408 104 5 5.859 -0.358
GoldmanSachs 5 5.331 25,593 114 6 5.680 -0.349
Barclays 6 4.854 23,302 106 4 6.117 -1.263
CreditSuisse 7 4.516 21,680 108 8 4.567 -0.051
DeutscheBank 8 3.945 18,941 90 7 5.384 -1.439
RBCCapitalMarkets 9 3.472 16,669 78 10 3.607 -0.135
MorganStanley 10 3.325 15,964 91 9 4.260 -0.935
SunTrustRobinsonHumphrey 11 2.599 12,478 79 12 1.999 0.600
MitsubishiUFJFinancialGroupInc 12 2.318 11,127 41 11 2.196 0.122
Jefferies 13 2.118 10,170 66 16 1.758 0.360
MizuhoFinancial 14 2.116 10,161 39 21 1.359 0.757
BNPParibas 15 1.850 8,883 24 14 1.780 0.070
HSBC 16 1.685 8,091 34 15 1.780 -0.095
KeyBancCapitalMarkets 17 1.537 7,380 44 25 0.871 0.666
PNCFinancialServicesGroupInc 18 1.457 6,995 47 19 1.517 -0.060
USBancorp 19 1.317 6,321 42 17 1.683 -0.366
UBS 20 1.157 5,553 38 18 1.579 -0.422
TOTAL 100% 480,103 734 100%
USLoans(MandatedLeadArranger)Q12018 Q12017
Firm Rank MktShare(%) Volume(USDMln) DealCount PrevRank PrevMktShare(%) MktShareChg(%)
BankofAmericaMerrillLynch 1 13.637 66,468 263 1 12.116 1.521
JPMorgan 2 12.297 59,933 227 2 11.001 1.296
WellsFargo 3 7.839 38,208 161 3 7.536 0.303
Citi 4 6.263 30,524 107 5 6.092 0.171
GoldmanSachs 5 5.379 26,217 115 6 5.545 -0.166
CreditSuisse 6 5.101 24,863 109 8 4.386 0.715
Barclays 7 4.533 22,093 103 4 6.264 -1.731
DeutscheBank 8 3.851 18,771 90 7 5.242 -1.391
RBCCapitalMarkets 9 3.156 15,382 78 10 3.854 -0.698
MorganStanley 10 3.108 15,148 91 9 4.232 -1.124
SunTrustRobinsonHumphrey 11 2.389 11,643 79 12 2.073 0.316
MitsubishiUFJFinancialGroupInc 12 2.295 11,184 46 11 2.233 0.062
MizuhoFinancial 13 2.246 10,949 43 19 1.559 0.687
BNPParibas 14 2.186 10,653 30 13 2.042 0.144
PNCFinancialServicesGroupInc 15 2.105 10,261 61 17 1.624 0.481
Jefferies 16 2.069 10,085 65 15 1.886 0.183
USBancorp 17 1.765 8,604 53 16 1.826 -0.061
KeyBancCapitalMarkets 18 1.596 7,777 56 23 0.925 0.671
HSBC 19 1.560 7,604 32 20 1.455 0.105
BMOCapitalMarkets 20 1.246 6,071 57 18 1.616 -0.370
TOTAL 100% 487,398 758 100%
USInvestmentGradeLoans(Bookrunner)Q12018 Q12017
Firm Rank MktShare(%) Volume(USDMln) DealCount PrevRank PrevMktShare(%) MktShareChg(%)
BankofAmericaMerrillLynch 1 19.779 27,948 70 1 20.439 -0.660
JPMorgan 2 17.093 24,153 67 2 17.172 -0.079
WellsFargo 3 12.887 18,210 55 4 7.983 4.904
Citi 4 7.165 10,125 31 3 9.020 -1.855
MizuhoFinancial 5 5.368 7,585 24 8 3.296 2.072
MitsubishiUFJFinancialGroupInc 6 4.583 6,476 23 5 5.445 -0.862
Barclays 7 4.236 5,985 14 6 5.399 -1.163
BNPParibas 8 3.624 5,121 8 7 4.118 -0.494
GoldmanSachs 9 2.368 3,346 5 20 1.125 1.243
PNCFinancialServicesGroupInc 10 2.238 3,163 14 13 1.476 0.762
Scotiabank 11 2.195 3,102 8 18 1.145 1.050
RBCCapitalMarkets 12 2.122 2,998 8 9 2.916 -0.794
USBancorp 13 2.063 2,914 15 12 2.398 -0.335
HSBC 14 2.010 2,840 11 10 2.544 -0.534
DeutscheBank 15 1.958 2,767 6 11 2.444 -0.486
SunTrustRobinsonHumphrey 16 1.826 2,580 9 23 0.965 0.861
TorontoDominionBank 17 1.062 1,501 7 19 1.129 -0.067
SocieteGenerale 18 0.973 1,375 2 16 1.197 -0.224
KeyBancCapitalMarkets 19 0.799 1,129 6 25 0.411 0.388
MorganStanley 20 0.775 1,094 6 24 0.577 0.198
TOTAL 100% 141,304 121 100%
USInvestmentGradeLoans(MandatedLeadArranger)Q12018 Q12017
Firm Rank MktShare(%) Volume(USDMln) DealCount PrevRank PrevMktShare(%) MktShareChg(%)
BankofAmericaMerrillLynch 1 17.412 25,639 72 1 18.074 -0.662
JPMorgan 2 16.186 23,834 69 2 16.049 0.137
WellsFargo 3 11.966 17,621 57 4 8.310 3.656
Citi 4 7.725 11,375 33 3 9.690 -1.965
MizuhoFinancial 5 5.534 8,149 26 8 4.299 1.235
BNPParibas 6 4.540 6,685 11 7 4.312 0.228
MitsubishiUFJFinancialGroupInc 7 4.466 6,576 24 5 5.864 -1.398
Barclays 8 3.577 5,268 13 6 5.576 -1.999
USBancorp 9 3.091 4,552 23 9 2.984 0.107
DeutscheBank 10 2.558 3,767 7 10 2.659 -0.101
PNCFinancialServicesGroupInc 11 2.532 3,728 20 13 1.641 0.891
GoldmanSachs 12 2.272 3,346 5 18 1.111 1.161
Scotiabank 13 2.106 3,102 8 15 1.269 0.837
RBCCapitalMarkets 14 2.036 2,998 8 11 2.602 -0.566
HSBC 15 1.929 2,840 11 12 1.834 0.095
SunTrustRobinsonHumphrey 16 1.686 2,482 10 21 0.953 0.733
SocieteGenerale 17 1.171 1,725 3 19 1.060 0.111
KeyBancCapitalMarkets 18 1.041 1,533 8 33 0.246 0.795
TorontoDominionBank 19 1.019 1,501 7 17 1.152 -0.133
MorganStanley 20 0.879 1,294 7 23 0.607 0.272
TOTAL 100% 147,249 125 100%

Bloomberg AmericasCapitalMarkets|Q12018
BloombergLeagueTableReports Page11
USLeveragedLoans(Bookrunner)Q12018 Q12017
Firm Rank MktShare(%) Volume(USDMln) DealCount PrevRank PrevMktShare(%) MktShareChg(%)
BankofAmericaMerrillLynch 1 12.311 37,399 166 1 10.184 2.127
JPMorgan 2 10.213 31,026 137 2 9.361 0.852
GoldmanSachs 3 7.317 22,229 108 3 7.715 -0.398
CreditSuisse 4 6.534 19,851 105 6 6.079 0.455
Barclays 5 5.420 16,467 91 4 6.982 -1.562
WellsFargo 6 5.260 15,978 84 7 5.800 -0.540
DeutscheBank 7 5.147 15,635 82 5 6.854 -1.707
MorganStanley 8 4.895 14,870 85 8 5.709 -0.814
Citi 9 4.782 14,528 69 9 4.965 -0.183
RBCCapitalMarkets 10 4.412 13,403 67 10 4.147 0.265
Jefferies 11 3.342 10,152 65 12 2.531 0.811
SunTrustRobinsonHumphrey 12 3.038 9,230 66 13 2.486 0.552
UBS 13 1.828 5,553 38 14 1.904 -0.076
KohlbergKravisRoberts&Co 14 1.730 5,257 28 11 2.832 -1.102
KeyBancCapitalMarkets 15 1.703 5,173 31 24 0.931 0.772
BMOCapitalMarkets 16 1.699 5,161 45 15 1.784 -0.085
HSBC 17 1.405 4,268 20 17 1.620 -0.215
Nomura 18 1.394 4,234 25 16 1.751 -0.357
CitizensFinancialGroupInc 19 1.348 4,096 34 21 1.061 0.287
Macquarie 20 1.314 3,992 30 18 1.334 -0.020
TOTAL 100% 303,795 539 100%
USLeveragedLoans(MandatedLeadArranger)Q12018 Q12017
Firm Rank MktShare(%) Volume(USDMln) DealCount PrevRank PrevMktShare(%) MktShareChg(%)
BankofAmericaMerrillLynch 1 11.352 34,512 169 1 9.361 1.991
JPMorgan 2 10.031 30,495 137 2 9.241 0.790
CreditSuisse 3 7.750 23,560 107 6 5.866 1.884
GoldmanSachs 4 7.523 22,871 110 3 7.577 -0.054
Citi 5 5.721 17,393 70 9 4.967 0.754
Barclays 6 5.255 15,975 89 4 7.130 -1.875
WellsFargo 7 4.983 15,148 83 7 5.806 -0.823
DeutscheBank 8 4.894 14,879 83 5 6.634 -1.740
MorganStanley 9 4.557 13,853 84 8 5.612 -1.055
RBCCapitalMarkets 10 3.983 12,109 67 10 4.548 -0.565
Jefferies 11 3.317 10,085 65 12 2.724 0.593
SunTrustRobinsonHumphrey 12 2.766 8,408 64 13 2.530 0.236
BMOCapitalMarkets 13 1.886 5,733 53 15 1.916 -0.030
UBS 14 1.743 5,298 37 14 1.928 -0.185
KohlbergKravisRoberts&Co 15 1.733 5,269 29 11 2.834 -1.101
KeyBancCapitalMarkets 16 1.685 5,121 37 22 1.024 0.661
Nomura 17 1.435 4,363 26 16 1.688 -0.253
FifthThirdBancorp 18 1.355 4,121 31 25 0.922 0.433
CitizensFinancialGroupInc 19 1.334 4,055 34 21 1.037 0.297
HSBC 20 1.326 4,031 18 18 1.353 -0.027
TOTAL 100% 304,010 551 100%
USInstitutionalLoans(Bookrunner)Q12018 Q12017
Firm Rank MktShare(%) Volume(USDMln) DealCount PrevRank PrevMktShare(%) MktShareChg(%)
BankofAmericaMerrillLynch 1 9.237 19,811 89 2 8.593 0.644
GoldmanSachs 2 8.976 19,252 94 1 8.919 0.057
CreditSuisse 3 8.484 18,195 89 6 7.056 1.428
JPMorgan 4 7.992 17,140 78 3 8.449 -0.457
MorganStanley 5 6.510 13,962 76 7 6.574 -0.064
Barclays 6 6.497 13,934 76 4 8.018 -1.521
DeutscheBank 7 6.116 13,117 72 5 7.573 -1.457
Citi 8 5.364 11,504 53 8 4.950 0.414
Jefferies 9 4.513 9,680 59 12 3.168 1.345
RBCCapitalMarkets 10 4.245 9,105 52 9 4.417 -0.172
WellsFargo 11 2.796 5,997 37 11 3.527 -0.731
SunTrustRobinsonHumphrey 12 2.519 5,402 43 14 2.235 0.284
KohlbergKravisRoberts&Co 13 2.369 5,081 26 10 3.600 -1.231
UBS 14 2.362 5,066 31 13 2.258 0.104
Nomura 15 1.914 4,105 22 15 2.211 -0.297
Macquarie 16 1.810 3,883 29 17 1.640 0.170
AntaresCapitalLP 17 1.645 3,528 45 25 0.764 0.881
BMOCapitalMarkets 18 1.628 3,491 31 18 1.416 0.212
HSBC 19 1.586 3,401 17 16 1.707 -0.121
CitizensFinancialGroupInc 20 1.201 2,576 21 22 0.907 0.294
TOTAL 100% 214,477 373 100%
USInstitutionalLoans(MandatedLeadArranger)Q12018 Q12017
Firm Rank MktShare(%) Volume(USDMln) DealCount PrevRank PrevMktShare(%) MktShareChg(%)
CreditSuisse 1 9.945 21,539 90 6 6.778 3.167
GoldmanSachs 2 9.081 19,670 93 1 8.763 0.318
JPMorgan 3 8.343 18,070 76 2 8.490 -0.147
BankofAmericaMerrillLynch 4 8.284 17,942 89 4 7.890 0.394
Citi 5 6.559 14,207 52 8 4.914 1.645
Barclays 6 6.188 13,403 73 3 8.173 -1.985
MorganStanley 7 5.967 12,924 73 7 6.460 -0.493
DeutscheBank 8 5.562 12,046 68 5 7.290 -1.728
Jefferies 9 4.438 9,612 59 12 3.433 1.005
RBCCapitalMarkets 10 4.016 8,698 51 9 4.887 -0.871
WellsFargo 11 2.515 5,446 35 11 3.547 -1.032
SunTrustRobinsonHumphrey 12 2.364 5,119 42 14 2.251 0.113
KohlbergKravisRoberts&Co 13 2.339 5,065 26 10 3.621 -1.282
UBS 14 2.202 4,769 30 13 2.296 -0.094
Nomura 15 1.955 4,233 23 15 2.148 -0.193
BMOCapitalMarkets 16 1.850 4,007 38 16 1.556 0.294
Macquarie 17 1.750 3,790 29 17 1.548 0.202
AntaresCapitalLP 18 1.587 3,438 45 23 0.840 0.747
HSBC 19 1.461 3,164 15 19 1.334 0.127
BNPParibas 20 1.228 2,661 16 18 1.361 -0.133
TOTAL 100% 216,595 385 100%

Bloomberg AmericasCapitalMarkets|Q12018
BloombergLeagueTableReports Page12
USLBOLoans(Bookrunner)Q12018 Q12017
Firm Rank MktShare(%) Volume(USDMln) DealCount PrevRank PrevMktShare(%) MktShareChg(%)
Jefferies 1 12.467 3,716 29 6 5.876 6.591
GoldmanSachs 2 10.526 3,138 21 9 4.414 6.112
DeutscheBank 3 7.579 2,259 19 4 6.514 1.065
UBS 4 7.133 2,126 14 13 2.902 4.231
Barclays 5 6.684 1,993 16 3 6.983 -0.299
CreditSuisse 6 6.556 1,954 23 1 11.265 -4.709
MorganStanley 7 4.309 1,285 13 8 4.839 -0.530
BankofAmericaMerrillLynch 8 4.002 1,193 12 5 6.032 -2.030
AntaresCapitalLP 9 3.946 1,176 16 7 5.349 -1.403
RBCCapitalMarkets 10 3.541 1,056 18 2 7.277 -3.736
KohlbergKravisRoberts&Co 11 3.074 916 7 19 1.760 1.314
BMOCapitalMarkets 12 2.755 821 8 18 1.767 0.988
Nomura 13 2.548 760 8 10 4.385 -1.837
SunTrustRobinsonHumphrey 14 2.338 697 11 16 1.993 0.345
KeyBancCapitalMarkets 15 2.172 648 5 17 1.951 0.221
Citi 16 2.064 615 8 15 2.347 -0.283
Macquarie 17 1.943 579 7 12 3.193 -1.250
AllyFinancialInc 18 1.854 553 3 33 0.466 1.388
HSBC 19 1.729 515 5 21 1.540 0.189
CitizensFinancialGroupInc 20 1.242 370 6 14 2.753 -1.511
TOTAL 100% 29,810 98 100%
USLBOLoans(MandatedLeadArranger)Q12018 Q12017
Firm Rank MktShare(%) Volume(USDMln) DealCount PrevRank PrevMktShare(%) MktShareChg(%)
Jefferies 1 12.439 3,716 29 6 5.959 6.480
GoldmanSachs 2 10.450 3,122 21 9 4.476 5.974
DeutscheBank 3 7.664 2,290 20 5 6.098 1.566
UBS 4 6.961 2,080 13 13 2.943 4.018
Barclays 5 6.613 1,976 16 3 7.192 -0.579
CreditSuisse 6 6.488 1,939 23 1 8.442 -1.954
MorganStanley 7 4.300 1,285 13 8 4.907 -0.607
BankofAmericaMerrillLynch 8 3.993 1,193 12 7 5.610 -1.617
AntaresCapitalLP 9 3.770 1,126 16 4 6.109 -2.339
RBCCapitalMarkets 10 3.480 1,040 18 2 7.444 -3.964
KohlbergKravisRoberts&Co 11 3.014 901 7 18 1.785 1.229
BMOCapitalMarkets 12 2.957 883 10 16 2.209 0.748
Nomura 13 2.543 760 8 10 4.447 -1.904
SunTrustRobinsonHumphrey 14 2.333 697 11 17 1.957 0.376
KeyBancCapitalMarkets 15 2.167 648 5 21 1.617 0.550
Citi 16 2.060 615 8 15 2.554 -0.494
Macquarie 17 1.939 579 7 12 3.238 -1.299
AllyFinancialInc 18 1.850 553 3 32 0.473 1.377
HSBC 19 1.672 500 5 19 1.735 -0.063
CitizensFinancialGroupInc 20 1.240 370 6 14 2.792 -1.552
TOTAL 100% 29,876 99 100%
Bloomberg AmericasCapitalMarkets|Q12018
BloombergLeagueTableReports Page13
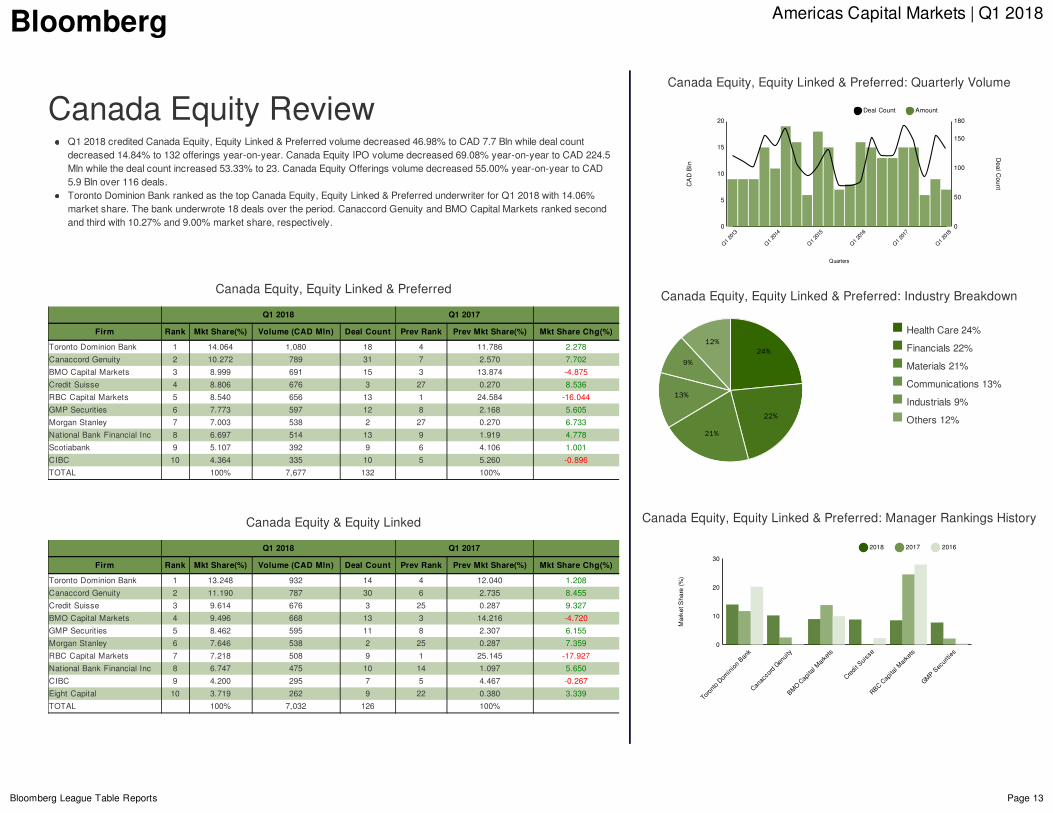
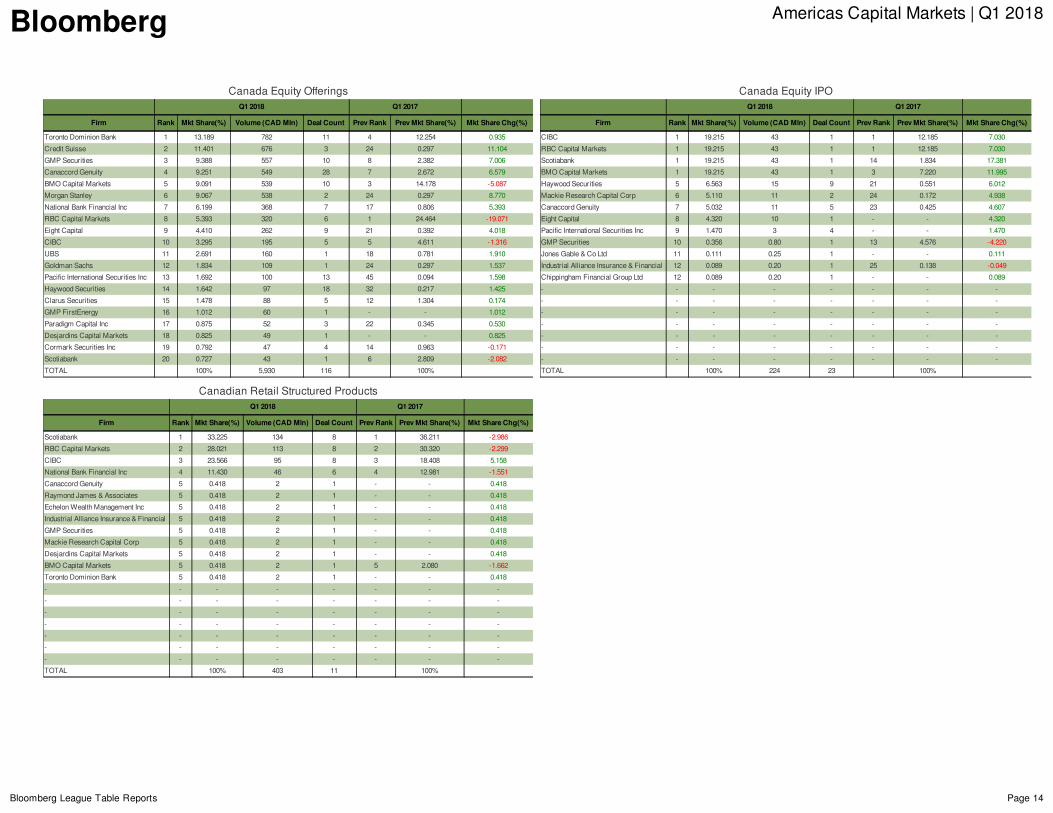
CanadaEquityReviewQ12018creditedCanadaEquity,EquityLinked&Preferredvolumedecreased46.98%toCAD7.7Blnwhiledealcountdecreased14.84%to132offeringsyear-on-year.CanadaEquityIPOvolumedecreased69.08%year-on-yeartoCAD224.5Mlnwhilethedealcountincreased53.33%to23.CanadaEquityOfferingsvolumedecreased55.00%year-on-yeartoCAD5.9Blnover116deals.TorontoDominionBankrankedasthetopCanadaEquity,EquityLinked&PreferredunderwriterforQ12018with14.06%marketshare.Thebankunderwrote18dealsovertheperiod.CanaccordGenuityandBMOCapitalMarketsrankedsecondandthirdwith10.27%and9.00%marketshare,respectively.
CanadaEquity,EquityLinked&Preferred
Q12018 Q12017
Firm Rank MktShare(%) Volume(CADMln) DealCount PrevRank PrevMktShare(%) MktShareChg(%)
TorontoDominionBank 1 14.064 1,080 18 4 11.786 2.278
CanaccordGenuity 2 10.272 789 31 7 2.570 7.702
BMOCapitalMarkets 3 8.999 691 15 3 13.874 -4.875
CreditSuisse 4 8.806 676 3 27 0.270 8.536
RBCCapitalMarkets 5 8.540 656 13 1 24.584 -16.044
GMPSecurities 6 7.773 597 12 8 2.168 5.605
MorganStanley 7 7.003 538 2 27 0.270 6.733
NationalBankFinancialInc 8 6.697 514 13 9 1.919 4.778
Scotiabank 9 5.107 392 9 6 4.106 1.001
CIBC 10 4.364 335 10 5 5.260 -0.896
TOTAL 100% 7,677 132 100%
CanadaEquity&EquityLinked
Q12018 Q12017
Firm Rank MktShare(%) Volume(CADMln) DealCount PrevRank PrevMktShare(%) MktShareChg(%)
TorontoDominionBank 1 13.248 932 14 4 12.040 1.208
CanaccordGenuity 2 11.190 787 30 6 2.735 8.455
CreditSuisse 3 9.614 676 3 25 0.287 9.327
BMOCapitalMarkets 4 9.496 668 13 3 14.216 -4.720
GMPSecurities 5 8.462 595 11 8 2.307 6.155
MorganStanley 6 7.646 538 2 25 0.287 7.359
RBCCapitalMarkets 7 7.218 508 9 1 25.145 -17.927
NationalBankFinancialInc 8 6.747 475 10 14 1.097 5.650
CIBC 9 4.200 295 7 5 4.467 -0.267
EightCapital 10 3.719 262 9 22 0.380 3.339
TOTAL 100% 7,032 126 100%
HealthCare24%
Financials22%
Materials21%
Communications13%
Industrials9%
Others12%
CanadaEquity,EquityLinked&Preferred:QuarterlyVolume
Q12014
Q12014
Q12015
Q12015
Q12016
Q12016
Q12017
Q12017
QuartersQuarters
Q12013
Q12013
Q12018
Q12018
55
1010
1515
CADBln
CADBln
00
2020
5050
100100
150150
DealC
ountDealC
ount
00
180180
DealCount Amount
CanadaEquity,EquityLinked&Preferred:IndustryBreakdown
24%
22%
21%
13%
9%
12%
CanadaEquity,EquityLinked&Preferred:ManagerRankingsHistory
TorontoDominionBank
CanaccordGenuity
BMOCapitalMarkets
CreditSuisse
RBCCapitalMarkets
GMPSecurities
10
20
MarketShare(%
)
0
30
2018 2017 2016
Bloomberg AmericasCapitalMarkets|Q12018
BloombergLeagueTableReports Page14
CanadaEquityOfferingsQ12018 Q12017
Firm Rank MktShare(%) Volume(CADMln) DealCount PrevRank PrevMktShare(%) MktShareChg(%)
TorontoDominionBank 1 13.189 782 11 4 12.254 0.935
CreditSuisse 2 11.401 676 3 24 0.297 11.104
GMPSecurities 3 9.388 557 10 8 2.382 7.006
CanaccordGenuity 4 9.251 549 28 7 2.672 6.579
BMOCapitalMarkets 5 9.091 539 10 3 14.178 -5.087
MorganStanley 6 9.067 538 2 24 0.297 8.770
NationalBankFinancialInc 7 6.199 368 7 17 0.806 5.393
RBCCapitalMarkets 8 5.393 320 6 1 24.464 -19.071
EightCapital 9 4.410 262 9 21 0.392 4.018
CIBC 10 3.295 195 5 5 4.611 -1.316
UBS 11 2.691 160 1 18 0.781 1.910
GoldmanSachs 12 1.834 109 1 24 0.297 1.537
PacificInternationalSecuritiesInc 13 1.692 100 13 45 0.094 1.598
HaywoodSecurities 14 1.642 97 18 32 0.217 1.425
ClarusSecurities 15 1.478 88 5 12 1.304 0.174
GMPFirstEnergy 16 1.012 60 1 - - 1.012
ParadigmCapitalInc 17 0.875 52 3 22 0.345 0.530
DesjardinsCapitalMarkets 18 0.825 49 1 - - 0.825
CormarkSecuritiesInc 19 0.792 47 4 14 0.963 -0.171
Scotiabank 20 0.727 43 1 6 2.809 -2.082
TOTAL 100% 5,930 116 100%
CanadaEquityIPOQ12018 Q12017
Firm Rank MktShare(%) Volume(CADMln) DealCount PrevRank PrevMktShare(%) MktShareChg(%)
CIBC 1 19.215 43 1 1 12.185 7.030
RBCCapitalMarkets 1 19.215 43 1 1 12.185 7.030
Scotiabank 1 19.215 43 1 14 1.834 17.381
BMOCapitalMarkets 1 19.215 43 1 3 7.220 11.995
HaywoodSecurities 5 6.563 15 9 21 0.551 6.012
MackieResearchCapitalCorp 6 5.110 11 2 24 0.172 4.938
CanaccordGenuity 7 5.032 11 5 23 0.425 4.607
EightCapital 8 4.320 10 1 - - 4.320
PacificInternationalSecuritiesInc 9 1.470 3 4 - - 1.470
GMPSecurities 10 0.356 0.80 1 13 4.576 -4.220
JonesGable&CoLtd 11 0.111 0.25 1 - - 0.111
IndustrialAllianceInsurance&Financial 12 0.089 0.20 1 25 0.138 -0.049
ChippinghamFinancialGroupLtd 12 0.089 0.20 1 - - 0.089
- - - - - - - -
- - - - - - - -
- - - - - - - -
- - - - - - - -
- - - - - - - -
- - - - - - - -
- - - - - - - -
TOTAL 100% 224 23 100%
CanadianRetailStructuredProductsQ12018 Q12017
Firm Rank MktShare(%) Volume(CADMln) DealCount PrevRank PrevMktShare(%) MktShareChg(%)
Scotiabank 1 33.225 134 8 1 36.211 -2.986
RBCCapitalMarkets 2 28.021 113 8 2 30.320 -2.299
CIBC 3 23.566 95 8 3 18.408 5.158
NationalBankFinancialInc 4 11.430 46 6 4 12.981 -1.551
CanaccordGenuity 5 0.418 2 1 - - 0.418
RaymondJames&Associates 5 0.418 2 1 - - 0.418
EchelonWealthManagementInc 5 0.418 2 1 - - 0.418
IndustrialAllianceInsurance&Financial 5 0.418 2 1 - - 0.418
GMPSecurities 5 0.418 2 1 - - 0.418
MackieResearchCapitalCorp 5 0.418 2 1 - - 0.418
DesjardinsCapitalMarkets 5 0.418 2 1 - - 0.418
BMOCapitalMarkets 5 0.418 2 1 5 2.080 -1.662
TorontoDominionBank 5 0.418 2 1 - - 0.418
- - - - - - - -
- - - - - - - -
- - - - - - - -
- - - - - - - -
- - - - - - - -
- - - - - - - -
- - - - - - - -
TOTAL 100% 403 11 100%

Bloomberg AmericasCapitalMarkets|Q12018
BloombergLeagueTableReports Page15
CanadianFixedIncomeReviewQ12018creditedCanadianGovernmentBondsCanadianCorporateBondsvolumeincreased28.25%toCAD32.1Blnwhiledealcountincreased20.00%to66offeringsyear-on-year.CanadianGovernmentBondsvolumedecreased20.68%year-on-yeartoCAD20.7Blnwhilethedealcountincreased1.32%to77.BMOCapitalMarketsrankedasthetopCanadianCorporateBondsunderwriterforQ12018with22.39%marketshare.Thebankunderwrote28dealsovertheperiod.TorontoDominionBankandScotiabankrankedsecondandthirdwith19.49%and16.78%marketshare,respectively.
CanadianCorporateBonds
Q12018 Q12017
Firm Rank MktShare(%) Volume(CADMln) DealCount PrevRank PrevMktShare(%) MktShareChg(%)
BMOCapitalMarkets 1 22.387 7,180 28 4 15.567 6.820
TorontoDominionBank 2 19.489 6,250 29 3 19.560 -0.071
Scotiabank 3 16.782 5,382 22 5 10.434 6.348
CIBC 4 15.771 5,058 25 2 19.928 -4.157
RBCCapitalMarkets 5 13.486 4,325 33 1 20.598 -7.112
NationalBankFinancialInc 6 4.886 1,567 7 6 7.231 -2.345
HSBC 7 1.793 575 6 10 0.750 1.043
LaurentianBankofCanada 8 1.715 550 1 - - 1.715
MorganStanley 9 1.559 500 1 7 3.799 -2.240
BankofAmericaMerrillLynch 10 1.429 458 3 9 0.800 0.629
TOTAL 100% 32,070 66 100%
CanadianGovernmentBonds
Q12018 Q12017
Firm Rank MktShare(%) Volume(CADMln) DealCount PrevRank PrevMktShare(%) MktShareChg(%)
TorontoDominionBank 1 23.352 4,825 10 2 20.497 2.855
NationalBankFinancialInc 2 19.013 3,928 19 1 26.170 -7.157
BMOCapitalMarkets 3 16.213 3,350 9 4 10.783 5.430
RBCCapitalMarkets 4 14.640 3,025 10 3 20.249 -5.609
Scotiabank 5 13.477 2,785 12 5 9.962 3.515
CIBC 6 9.794 2,024 38 6 9.871 -0.077
HSBC 7 1.573 325 2 7 1.561 0.012
BankofAmericaMerrillLynch 8 0.968 200 1 8 0.768 0.200
DesjardinsCapitalMarkets 9 0.669 138 7 - - 0.669
Casgrain&Co 10 0.302 63 2 10 0.019 0.283
TOTAL 100% 20,662 77 100%
Financials68%
ConsumerDiscretionary11%
Industrials6%
Others15%
CanadianCorporateBonds:QuarterlyVolume
Q12014
Q12014
Q12015
Q12015
Q12016
Q12016
Q12017
Q12017
QuartersQuarters
Q12013
Q12013
Q12018
Q12018
1010
2020
3030
USDBln
USDBln
00
4040
2020
4040
6060
8080
DealC
ountDealC
ount
00
9090
DealCount Amount
CanadianCorporateBonds:QuarterlyVolume
68%
11%
6%
15%
CanadianCorporateBonds:ManagerRankingsHistory
BMOCapitalMarkets
TorontoDominionBank
Scotiabank
CIBC
RBCCapitalMarkets
NationalBankFinancialInc
10
20
30
MarketShare(%
)
0
35
2018 2017 2016

Bloomberg AmericasCapitalMarkets|Q12018
BloombergLeagueTableReports Page16
CanadaLoansReviewQ12018creditedbookrunnerCanadaLoansvolumeincreased22.91%toCAD59.9Blnwhilethenumberofdealsdecreased27.36%to77offeringsyear-on-year.CanadaLoans-NewMoneyvolumedecreased6.44%year-on-yeartoCAD15.5Blnwhilethenumberoftranchesdecreased22.73%to51.CIBCrankedasthetopCanadaLoansbookrunnerforQ12018with23.33%marketshare.Thebankactedasbookrunneron23dealsovertheperiod.BMOCapitalMarketsandScotiabankrankedsecondandthirdwith18.55%and16.90%marketshare,respectively.
CanadaLoans(Bookrunner)
Q12018 Q12017
Firm Rank MktShare(%) Volume(CADMln) DealCount PrevRank PrevMktShare(%) MktShareChg(%)
CIBC 1 23.327 13,969 23 2 19.724 3.603
BMOCapitalMarkets 2 18.554 11,111 27 1 20.350 -1.796
Scotiabank 3 16.896 10,118 20 4 13.700 3.196
RBCCapitalMarkets 4 15.391 9,217 17 5 12.354 3.037
TorontoDominionBank 5 10.188 6,101 15 3 17.276 -7.088
NationalBankFinancialInc 6 3.605 2,159 15 6 4.932 -1.327
HSBC 7 3.493 2,092 6 7 3.071 0.422
JPMorgan 8 2.719 1,628 3 10 1.026 1.693
Citi 9 1.387 830 3 8 1.431 -0.044
BNPParibas 10 1.288 771 3 15 0.437 0.851
TOTAL 100% 59,884 77 100%
CanadaLoans-NewMoney(Bookrunner)
Q12018 Q12017
Firm Rank MktShare(%) Volume(CADMln) DealCount PrevRank PrevMktShare(%) MktShareChg(%)
BMOCapitalMarkets 1 30.390 4,718 21 1 28.690 1.700
Scotiabank 2 20.051 3,113 14 3 11.272 8.779
CIBC 3 14.044 2,180 11 2 25.768 -11.724
RBCCapitalMarkets 4 12.380 1,922 9 4 10.372 2.008
TorontoDominionBank 5 7.956 1,235 9 5 9.988 -2.032
NationalBankFinancialInc 6 4.557 707 10 6 6.582 -2.025
HSBC 7 2.300 357 2 10 0.894 1.406
CreditAgricoleCIB 8 1.784 277 1 - - 1.784
BNPParibas 8 1.784 277 1 - - 1.784
USBancorp 10 1.396 217 1 - - 1.396
TOTAL 100% 15,525 51 100%
Industrials23%
Energy22%
Financials16%
ConsumerDiscretionary15%
Government11%
Materials9%
Others4%
CanadaLoans:QuarterlyVolume
Q12014
Q12014
Q12015
Q12015
Q12016
Q12016
Q12017
Q12017
QuartersQuarters
Q12013
Q12013
Q12018
Q12018
5050
100100
CADBln
CADBln
00
120120
5050
100100
150150
DealC
ountDealC
ount
00
200200
DealCount Amount
CanadaLoans:IndustryBreakdown
23%
22%
16%
15%
11%
9%
4%
CanadaLoans:BookrunnerRankingsHistory
CIBC
BMOCapitalMarkets
Scotiabank
RBCCapitalMarkets
TorontoDominionBank
NationalBankFinancialInc
10
20
MarketShare(%
)
0
25
2018 2017 2016

Bloomberg AmericasCapitalMarkets|Q12018
BloombergLeagueTableReports Page17
CanadaLoans(MandatedLeadArranger)Q12018 Q12017
Firm Rank MktShare(%) Volume(CADMln) DealCount PrevRank PrevMktShare(%) MktShareChg(%)
CIBC 1 20.659 12,372 24 3 15.646 5.013
BMOCapitalMarkets 2 19.073 11,422 30 1 19.825 -0.752
RBCCapitalMarkets 3 18.373 11,002 21 4 13.793 4.580
Scotiabank 4 15.226 9,118 19 5 13.575 1.651
TorontoDominionBank 5 9.854 5,901 15 2 17.396 -7.542
HSBC 6 5.187 3,106 7 6 5.705 -0.518
NationalBankFinancialInc 7 3.950 2,365 15 7 4.622 -0.672
JPMorgan 8 2.209 1,323 3 20 0.105 2.104
Citi 9 1.615 967 3 8 1.713 -0.098
BNPParibas 10 1.061 635 2 - - 1.061
BankofChina 11 0.572 342 1 13 0.843 -0.271
MorganStanley 12 0.502 300 2 22 0.043 0.459
CreditAgricoleCIB 13 0.482 289 1 - - 0.482
USBancorp 14 0.362 217 1 - - 0.362
BankofAmericaMerrillLynch 15 0.266 159 3 15 0.511 -0.245
SumitomoMitsuiFinancial 16 0.189 113 1 - - 0.189
ATBFinancial 16 0.189 113 1 21 0.082 0.107
SunTrustRobinsonHumphrey 18 0.084 50 2 22 0.043 0.041
WellsFargo 19 0.042 25 1 10 0.914 -0.872
Macquarie 20 0.042 25 1 22 0.043 -0.001
TOTAL 100% 59,884 77 100%
CanadaLoans-NewMoney(Bookrunner)Q12018 Q12017
Firm Rank MktShare(%) Volume(CADMln) DealCount PrevRank PrevMktShare(%) MktShareChg(%)
BMOCapitalMarkets 1 30.390 4,718 21 1 28.690 1.700
Scotiabank 2 20.051 3,113 14 3 11.272 8.779
CIBC 3 14.044 2,180 11 2 25.768 -11.724
RBCCapitalMarkets 4 12.380 1,922 9 4 10.372 2.008
TorontoDominionBank 5 7.956 1,235 9 5 9.988 -2.032
NationalBankFinancialInc 6 4.557 707 10 6 6.582 -2.025
HSBC 7 2.300 357 2 10 0.894 1.406
CreditAgricoleCIB 8 1.784 277 1 - - 1.784
BNPParibas 8 1.784 277 1 - - 1.784
USBancorp 10 1.396 217 1 - - 1.396
Citi 11 1.186 184 2 12 0.309 0.877
SumitomoMitsuiFinancial 12 0.727 113 1 - - 0.727
ATBFinancial 12 0.727 113 1 - - 0.727
SunTrustRobinsonHumphrey 14 0.140 22 2 16 0.065 0.075
BankofAmericaMerrillLynch 15 0.133 21 2 8 1.509 -1.376
WellsFargo 16 0.113 18 1 12 0.309 -0.196
JPMorgan 16 0.113 18 1 12 0.309 -0.196
DesjardinsCapitalMarkets 18 0.089 14 1 15 0.104 -0.015
AntaresHoldingsLP 19 0.028 4 1 - - 0.028
BaringsLLC 19 0.028 4 1 - - 0.028
TOTAL 100% 15,525 51 100%
CanadaLoans-NewMoney(MandatedLeadArranger)Q12018 Q12017
Firm Rank MktShare(%) Volume(CADMln) DealCount PrevRank PrevMktShare(%) MktShareChg(%)
BMOCapitalMarkets 1 34.244 5,317 23 1 21.358 12.886
CIBC 2 15.349 2,383 12 3 16.868 -1.519
RBCCapitalMarkets 3 14.366 2,230 11 2 17.469 -3.103
Scotiabank 4 13.610 2,113 13 4 11.153 2.457
TorontoDominionBank 5 7.956 1,235 9 5 10.028 -2.072
NationalBankFinancialInc 6 5.003 777 10 7 6.201 -1.198
HSBC 7 2.488 386 2 6 7.881 -5.393
BNPParibas 8 2.231 346 1 - - 2.231
USBancorp 9 1.396 217 1 - - 1.396
Citi 10 1.186 184 2 15 0.306 0.880
SumitomoMitsuiFinancial 11 0.727 113 1 - - 0.727
ATBFinancial 11 0.727 113 1 - - 0.727
SunTrustRobinsonHumphrey 13 0.140 22 2 20 0.065 0.075
BankofAmericaMerrillLynch 14 0.133 21 2 9 1.493 -1.360
WellsFargo 15 0.113 18 1 14 0.567 -0.454
JPMorgan 15 0.113 18 1 15 0.306 -0.193
DesjardinsCapitalMarkets 17 0.089 14 1 12 0.635 -0.546
AntaresHoldingsLP 18 0.028 4 1 - - 0.028
BaringsLLC 18 0.028 4 1 - - 0.028
MorganStanley 20 0.027 4 1 20 0.065 -0.038
TOTAL 100% 15,525 51 100%
CanadaLoans(AdministrativeAgent)Q12018 Q12017
Firm Rank MktShare(%) Volume(CADMln) DealCount PrevRank PrevMktShare(%) MktShareChg(%)
CIBC 1 24.961 14,948 13 1 32.377 -7.416
RBCCapitalMarkets 2 23.138 13,856 11 5 7.320 15.818
BMOCapitalMarkets 3 21.173 12,680 18 2 16.507 4.666
Scotiabank 4 17.801 10,660 13 4 13.941 3.860
TorontoDominionBank 5 4.559 2,730 7 3 15.778 -11.219
NationalBankFinancialInc 6 3.689 2,209 7 6 6.128 -2.439
HSBC 7 3.489 2,089 3 8 1.806 1.683
SumitomoMitsuiFinancial 8 0.566 339 1 - - 0.566
USBancorp 9 0.362 217 1 - - 0.362
WellsFargo 10 0.209 125 1 14 0.260 -0.051
AntaresHoldingsLP 11 0.038 23 1 - - 0.038
BankofAmericaMerrillLynch 12 0.016 9 1 10 0.923 -0.907
- - - - - - - -
- - - - - - - -
- - - - - - - -
- - - - - - - -
- - - - - - - -
- - - - - - - -
- - - - - - - -
- - - - - - - -
TOTAL 100% 59,884 77 100%

Bloomberg AmericasCapitalMarkets|Q12018
BloombergLeagueTableReports Page18
LatinAmericaEquityReview[{\"displayName\":\"Q12018creditedLatinAmericaEquityOfferingsvolumeincreased50.87%toUSD6.7Blnwhiledealcountdecreased25.00%to12offeringsyear-on-year.\\nJPMorganrankedasthetopLatinAmericaEquityOfferingsunderwriterforQ12018with12.08%marketshare.Thebankunderwrote5dealsovertheperiod.BankofAmericaMerrillLynchandGoldmanSachsrankedsecondandthirdwith10.35%and8.52%marketshare,respectively.\"}]"}]
LatinAmericaEquityOfferings
Q12018 Q12017
Firm Rank MktShare(%) Volume(USDMln) DealCount PrevRank PrevMktShare(%) MktShareChg(%)
JPMorgan 1 12.083 815 5 1 15.907 -3.824
BankofAmericaMerrillLynch 2 10.350 698 4 5 9.697 0.653
GoldmanSachs 3 8.517 574 3 - - 8.517
MorganStanley 4 8.196 553 3 8 6.750 1.446
CreditSuisse 5 7.957 536 2 9 6.525 1.432
BancoSantander 6 5.011 338 2 2 12.852 -7.841
BancoBilbaoVizcayaArgentaria 6 5.011 338 2 16 0.241 4.770
Citi 8 4.927 332 2 - - 4.927
BancoItauBBA 9 4.831 326 1 3 11.290 -6.459
BradescoBBISA 9 4.831 326 1 6 8.308 -3.477
TOTAL 100% 6,742 12 100%
BrazilEquityOfferings
Q12018 Q12017
Firm Rank MktShare(%) Volume(BRLMln) DealCount PrevRank PrevMktShare(%) MktShareChg(%)
JPMorgan 1 16.874 1,499 2 4 12.045 4.829
MorganStanley 2 11.875 1,055 1 9 2.622 9.253
BancoItauBBA 2 11.875 1,055 1 1 15.230 -3.355
BradescoBBISA 2 11.875 1,055 1 3 12.974 -1.099
GoldmanSachs 2 11.875 1,055 1 - - 11.875
BankofAmericaMerrillLynch 2 11.875 1,055 1 2 15.087 -3.212
CreditSuisse 2 11.875 1,055 1 8 7.269 4.606
DeutscheBank 2 11.875 1,055 1 - - 11.875
- - - - - - - -
- - - - - - - -
TOTAL 100% 8,886 2 100%
Financials55%
Industrials29%
ConsumerStaples10%
Utilities6%
LatinAmericaEquityOfferings:QuarterlyVolume
Q12014
Q12014
Q12015
Q12015
Q12016
Q12016
Q12017
Q12017
QuartersQuarters
Q12013
Q12013
Q12018
Q12018
55
1010
1515
USDBln
USDBln
00
2020
1010
2020 DealC
ountDealC
ount
00
3030
DealCount Amount
LatinAmericaEquityOfferings:IndustryBreakdown
55%29%
10%6%
LatinAmericaEquityOfferings:ManagerRankingsHistory
JPMorgan
BankofAmericaMerrillLynch
GoldmanSachs
MorganStanley
CreditSuisse
BancoSantander
BancoBilbaoVizcayaArgentaria
20
40
MarketShare(%
)
0
45
2018 2017 2016
Bloomberg AmericasCapitalMarkets|Q12018
BloombergLeagueTableReports Page19
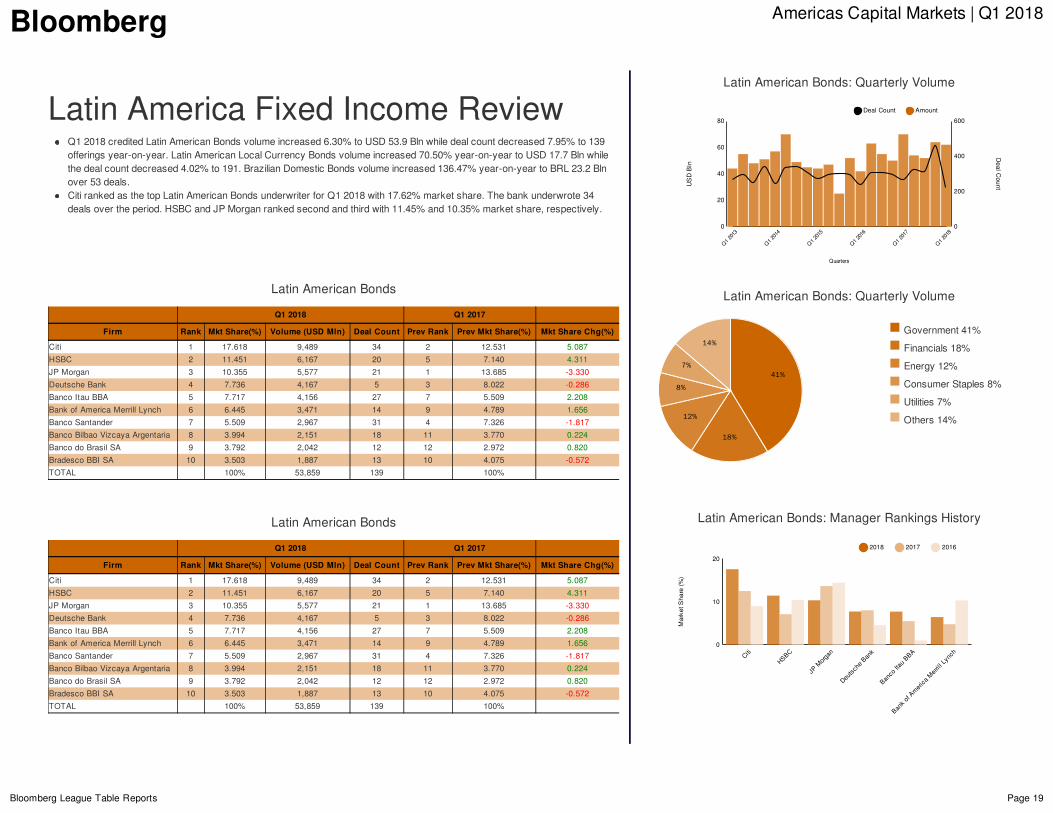
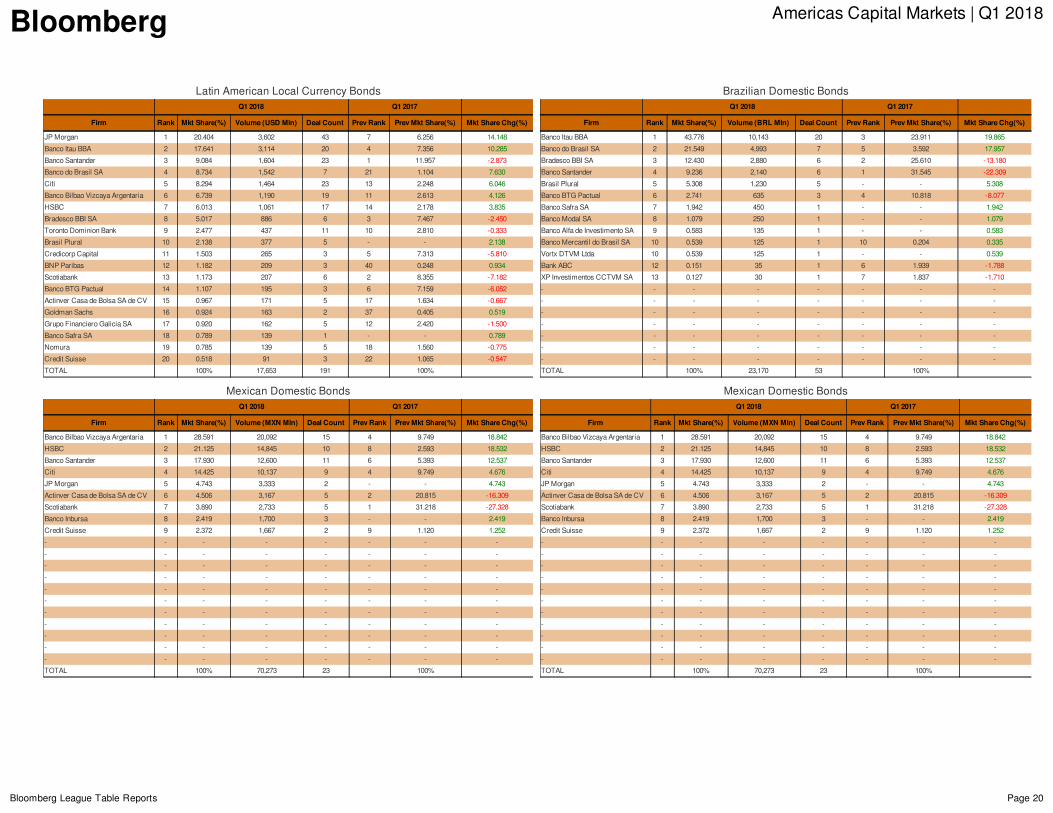
LatinAmericaFixedIncomeReviewQ12018creditedLatinAmericanBondsvolumeincreased6.30%toUSD53.9Blnwhiledealcountdecreased7.95%to139offeringsyear-on-year.LatinAmericanLocalCurrencyBondsvolumeincreased70.50%year-on-yeartoUSD17.7Blnwhilethedealcountdecreased4.02%to191.BrazilianDomesticBondsvolumeincreased136.47%year-on-yeartoBRL23.2Blnover53deals.CitirankedasthetopLatinAmericanBondsunderwriterforQ12018with17.62%marketshare.Thebankunderwrote34dealsovertheperiod.HSBCandJPMorganrankedsecondandthirdwith11.45%and10.35%marketshare,respectively.
LatinAmericanBonds
Q12018 Q12017
Firm Rank MktShare(%) Volume(USDMln) DealCount PrevRank PrevMktShare(%) MktShareChg(%)
Citi 1 17.618 9,489 34 2 12.531 5.087
HSBC 2 11.451 6,167 20 5 7.140 4.311
JPMorgan 3 10.355 5,577 21 1 13.685 -3.330
DeutscheBank 4 7.736 4,167 5 3 8.022 -0.286
BancoItauBBA 5 7.717 4,156 27 7 5.509 2.208
BankofAmericaMerrillLynch 6 6.445 3,471 14 9 4.789 1.656
BancoSantander 7 5.509 2,967 31 4 7.326 -1.817
BancoBilbaoVizcayaArgentaria 8 3.994 2,151 18 11 3.770 0.224
BancodoBrasilSA 9 3.792 2,042 12 12 2.972 0.820
BradescoBBISA 10 3.503 1,887 13 10 4.075 -0.572
TOTAL 100% 53,859 139 100%
Government41%
Financials18%
Energy12%
ConsumerStaples8%
Utilities7%
Others14%
LatinAmericanBonds:QuarterlyVolume
Q12014
Q12014
Q12015
Q12015
Q12016
Q12016
Q12017
Q12017
QuartersQuarters
Q12013
Q12013
Q12018
Q12018
2020
4040
6060
USDBln
USDBln
00
8080
200200
400400 DealC
ountDealC
ount
00
600600
DealCount Amount
LatinAmericanBonds:QuarterlyVolume
41%
18%
12%
8%
7%
14%
LatinAmericanBonds:ManagerRankingsHistory
Citi
HSBC
JPMorgan
DeutscheBank
BancoItauBBA
BankofAmericaMerrillLynch
10
MarketShare(%
)
0
20
2018 2017 2016
Bloomberg AmericasCapitalMarkets|Q12018
BloombergLeagueTableReports Page20
LatinAmericanLocalCurrencyBondsQ12018 Q12017
Firm Rank MktShare(%) Volume(USDMln) DealCount PrevRank PrevMktShare(%) MktShareChg(%)
JPMorgan 1 20.404 3,602 43 7 6.256 14.148
BancoItauBBA 2 17.641 3,114 20 4 7.356 10.285
BancoSantander 3 9.084 1,604 23 1 11.957 -2.873
BancodoBrasilSA 4 8.734 1,542 7 21 1.104 7.630
Citi 5 8.294 1,464 23 13 2.248 6.046
BancoBilbaoVizcayaArgentaria 6 6.739 1,190 19 11 2.613 4.126
HSBC 7 6.013 1,061 17 14 2.178 3.835
BradescoBBISA 8 5.017 886 6 3 7.467 -2.450
TorontoDominionBank 9 2.477 437 11 10 2.810 -0.333
BrasilPlural 10 2.138 377 5 - - 2.138
CredicorpCapital 11 1.503 265 3 5 7.313 -5.810
BNPParibas 12 1.182 209 3 40 0.248 0.934
Scotiabank 13 1.173 207 6 2 8.355 -7.182
BancoBTGPactual 14 1.107 195 3 6 7.159 -6.052
ActinverCasadeBolsaSAdeCV 15 0.967 171 5 17 1.634 -0.667
GoldmanSachs 16 0.924 163 2 37 0.405 0.519
GrupoFinancieroGaliciaSA 17 0.920 162 5 12 2.420 -1.500
BancoSafraSA 18 0.789 139 1 - - 0.789
Nomura 19 0.785 139 5 18 1.560 -0.775
CreditSuisse 20 0.518 91 3 22 1.065 -0.547
TOTAL 100% 17,653 191 100%
BrazilianDomesticBondsQ12018 Q12017
Firm Rank MktShare(%) Volume(BRLMln) DealCount PrevRank PrevMktShare(%) MktShareChg(%)
BancoItauBBA 1 43.776 10,143 20 3 23.911 19.865
BancodoBrasilSA 2 21.549 4,993 7 5 3.592 17.957
BradescoBBISA 3 12.430 2,880 6 2 25.610 -13.180
BancoSantander 4 9.236 2,140 6 1 31.545 -22.309
BrasilPlural 5 5.308 1,230 5 - - 5.308
BancoBTGPactual 6 2.741 635 3 4 10.818 -8.077
BancoSafraSA 7 1.942 450 1 - - 1.942
BancoModalSA 8 1.079 250 1 - - 1.079
BancoAlfadeInvestimentoSA 9 0.583 135 1 - - 0.583
BancoMercantildoBrasilSA 10 0.539 125 1 10 0.204 0.335
VortxDTVMLtda 10 0.539 125 1 - - 0.539
BankABC 12 0.151 35 1 6 1.939 -1.788
XPInvestimentosCCTVMSA 13 0.127 30 1 7 1.837 -1.710
- - - - - - - -
- - - - - - - -
- - - - - - - -
- - - - - - - -
- - - - - - - -
- - - - - - - -
- - - - - - - -
TOTAL 100% 23,170 53 100%
MexicanDomesticBondsQ12018 Q12017
Firm Rank MktShare(%) Volume(MXNMln) DealCount PrevRank PrevMktShare(%) MktShareChg(%)
BancoBilbaoVizcayaArgentaria 1 28.591 20,092 15 4 9.749 18.842
HSBC 2 21.125 14,845 10 8 2.593 18.532
BancoSantander 3 17.930 12,600 11 6 5.393 12.537
Citi 4 14.425 10,137 9 4 9.749 4.676
JPMorgan 5 4.743 3,333 2 - - 4.743
ActinverCasadeBolsaSAdeCV 6 4.506 3,167 5 2 20.815 -16.309
Scotiabank 7 3.890 2,733 5 1 31.218 -27.328
BancoInbursa 8 2.419 1,700 3 - - 2.419
CreditSuisse 9 2.372 1,667 2 9 1.120 1.252
- - - - - - - -
- - - - - - - -
- - - - - - - -
- - - - - - - -
- - - - - - - -
- - - - - - - -
- - - - - - - -
- - - - - - - -
- - - - - - - -
- - - - - - - -
- - - - - - - -
TOTAL 100% 70,273 23 100%

Bloomberg AmericasCapitalMarkets|Q12018
BloombergLeagueTableReports Page21
LatinAmericaLoansReviewQ12018creditedbookrunnerLatinAmericaLoansvolumeincreased147.81%toUSD13.6Blnwhilethenumberofdealsincreased75.00%to21offeringsyear-on-year.CitirankedasthetopLatinAmericaLoansbookrunnerforQ12018with14.96%marketshare.Thebankactedasbookrunner8dealsovertheperiod.CreditAgricoleCIBandBNPParibasrankedsecondandthirdwith11.42%and9.19%marketshare,respectively.
LatinAmericaLoans(Bookrunner)
Q12018 Q12017
Firm Rank MktShare(%) Volume(USDMln) DealCount PrevRank PrevMktShare(%) MktShareChg(%)
Citi 1 14.961 2,038 8 9 2.728 12.233
CreditAgricoleCIB 2 11.419 1,556 5 - - 11.419
BNPParibas 3 9.192 1,252 4 7 4.208 4.984
BancoBilbaoVizcayaArgentaria 4 8.394 1,144 5 4 4.760 3.634
MizuhoFinancial 5 8.381 1,142 2 2 6.593 1.788
HSBC 6 7.274 991 5 - - 7.274
JPMorgan 7 5.946 810 5 17 0.788 5.158
Scotiabank 8 5.180 706 3 5 4.547 0.633
BancoSantander 9 4.344 592 4 6 4.279 0.065
BancoNacionaldeMexicoSA 10 4.037 550 2 - - 4.037
TOTAL 100% 13,623 21 100%
LatinAmericaLoans(MandatedLeadArranger)
Q12018 Q12017
Firm Rank MktShare(%) Volume(USDMln) DealCount PrevRank PrevMktShare(%) MktShareChg(%)
Citi 1 9.639 1,313 8 6 3.711 5.928
JPMorgan 2 8.644 1,178 7 14 1.565 7.079
BancoSantander 3 7.545 1,028 6 5 3.914 3.631
HSBC 4 7.049 960 5 - - 7.049
Scotiabank 5 6.801 927 4 8 3.090 3.711
BancoBilbaoVizcayaArgentaria 6 6.391 871 2 4 4.355 2.036
BancoNacionaldeMexicoSA 7 5.872 800 2 - - 5.872
SumitomoMitsuiFinancial 8 5.456 743 3 11 2.417 3.039
MorganStanley 9 4.991 680 3 24 0.139 4.852
MitsubishiUFJFinancialGroupInc 10 4.961 676 3 3 5.121 -0.160
TOTAL 100% 13,623 21 100%
ConsumerStaples96%
Others4%
LatinAmericaLoans:QuarterlyVolume
Q12014
Q12014
Q12015
Q12015
Q12016
Q12016
Q12017
Q12017
QuartersQuarters
Q12013
Q12013
Q12018
Q12018
100100
200200
300300
USDBln
USDBln
00
400400
1010
2020
3030
DealC
ountDealC
ount
00
4040
DealCount Amount
LatinAmericaLoans:IndustryBreakdown
96%
4%
LatinAmericaLoans:BookrunnerRankingsHistory
Citi
CreditAgricoleCIB
BNPParibas
BancoBilbaoVizcayaArgentaria
MizuhoFinancial
HSBC
10
MarketShare(%
)
0
20
2018 2017 2016

Bloomberg – League Tables Criteria
Bloomberg L.P. reserves the right of final decision concerning league eligibility and requires adequate documentation for the same. Bloomberg L.P. and its suppliers believe the information herein was obtained from reliable sources, but they do not guarantee its accuracy. Neither the information nor the opinion expressed constitutes a solicitation of the purchase or sale of securities or commodities. Due to the dynamic nature of the Professional Service product, League Table rankings may vary between the quarterly/year-end publications and data found on the Bloomberg Professional Service.
General Guidelines
Credit is based on the total amount of the offering sold to the public. Full credit is awarded to the sole bookrunning manager or split equally among joint bookrunning managers; unless full, explicit breakdown of bookrunning is provided by an involved party. Regional and local tables are identified based on factors such as currency, market of issuer and/or country of risk/incorporation.
Fixed Income
All transactions must have a maturity/call/put option of minimum 18 months. Make-whole call and provisional call/put are exempted from this rule. Note: Criteria may vary for some local and/or regional tables. USD denominated 144A/REG S issues are credited 100% to the 144A tranche and 0% to the REG S tranche. Non-USD denominated 144A/REG S issues are credited 100% to the REG S tranche and 0% to the 144A tranche. Self-led transactions are included. New money portions of exchange offers are eligible for credit.
Exclusions: Accredited investor tranches, asset-backed issues, auction note agencies, collateralized bond obligations, collateralized loan obligations, commercial paper, municipal bonds, mortgage-backed issues, remarketed issues, repackaged bonds, government borrowing scheme retained bonds, variable principal redemption issues, variable interest equity-linked issues, and credit linked notes, selling group agency issues, strips, units, warrants, self-led under USD 50 million. Note: Criteria may vary for some local and/or regional tables.
Equities-Linked
Equity-linked transactions: Convertible bonds, convertible preferred stock and exchangeable bonds. Only issues that mature and are callable/puttable in 12 months or longer are included. Make-whole call, provisional call and provisional put are exempted from this rule. Convertible bonds with attached warrants are included. These are defined as synthetic convertibles with the combination of a fixed income instrument and warrants which can be converted into shares. The embedded warrant can be detachable or non-detachable but the bond and the warrant must be sold as a unit, i.e. there cannot be separate book building for the warrant and the bond.
Exclusions: Redemption-linked instruments, reverse convertibles or similar instruments, synthetics convertibles, issues convertible into participation in an underlying fund or investment trust, pre-IPO convertible instruments, certain lower hierarchy titles, i.e. Jr Bookrunner.
Equities
Equity market transactions: Initial public offerings, additional offerings of common stocks, units, and depositary receipts (ADRs, GDRs, etc) and rights offerings.
Exclusions: Non-underwritten/best efforts, privately placed transactions, funds, self-led, preferred offerings, pre-negotiated offerings, certain lower hierarchy titles, i.e. Jr Bookrunner. Note: Criteria may vary for some local and/or regional tables.

Bloomberg – League Tables Criteria
Bloomberg L.P. reserves the right of final decision concerning league eligibility and requires adequate documentation for the same. Bloomberg L.P. and its suppliers believe the information herein was obtained from reliable sources, but they do not guarantee its accuracy. Neither the information nor the opinion expressed constitutes a solicitation of the purchase or sale of securities or commodities. Due to the dynamic nature of the Professional Service product, League Table rankings may vary between the quarterly/year-end publications and data found on the Bloomberg Professional Service.
Loans
Includes executed syndicated loans transactions. Full credit is awarded to the banks satisfying the highest of the titles. Full credit is awarded to the sole bookrunning manager or split equally among joint bookrunning managers. Credit is allocated to amended or amended and restated transactions, where each modification is 100% at the lender’s option and not as a result of events already built into the original credit agreement. Credit is awarded for the following structural changes only: maturity extensions of three months or more, incremental basis for increased in deal size, reduction in pricing, full release of security.
Exclusions: Bilateral transactions, transactions with a maturity of less than three months, loans withdrawn prior to signing, amended or restated securitizations, receivable and guarantee facilities.
US Municipals
Standard published tables will award deal credit based on true economic credit as reported by the issuer or the bookrunner. In absence of reported economic credit, 100% will be assigned to the bookrunner.
Dollar value of credit will be assigned based on the percentage allocation reported for economic credit (or designated by the user in a custom table) and applied against the total par value of the bonds issued. Zero coupon bonds (CABS) or intermediate appreciation bonds (convertible CABs) will be included at the market value (accreted value) on the interest accrual date.
All debt issued by municipal issuers will be eligible for league credit. Taxable and tax-exempt debt is eligible for league credit unless a table includes specific tax type criteria. “Tax-exempt” is defined as federally tax-exempt and includes bonds subject to AMT and bonds designated as Bank Qualified.
Each table is provided in three formats. “Economic Credit” displays rankings based on true economic credit allocations of applicable deals. “Left Lead” assigns 100% credit to the bookrunner and 0% to all other syndicate participants. “Deal Count” displays rankings based on deal quantity rather than aggregate economic credit amounts. A “deal” refers to the aggregate series within an issuance led by a particular underwriter or syndicate. For example: a $50 million issuance is split into three series- a $10 million Series A, a $20 million Series B, and a $20 million Series C. Bank 1 is the underwriter of Series A & B, while Bank 2 is the underwriter of Series C. Bank 1 would have one “deal” worth $30 million, and Bank 2 would have one “deal” worth $20 million.
Exclusions: Derivatives, private placements, variable rate preferred securities, municipal commercial paper, and remarketings are excluded from municipal league table eligibility.
The full version of Bloomberg’s League table Standards & Guidelines can be accessed and subscribed to on the Reports tab on
LEAG<GO>.