america’s high-tech economy - milken...
TRANSCRIPT
America’sHigh-TechEconomy
Growth, Development,and Risks for
Metropolitan Areas
By Ross C. DeVolSenior Contributor: Perry Wong
Contributors: John Catapano and Greg Robitshek
July 13, 1999

Copyright © 1999 by the Milken Institute
Milken Institute
1250 Fourth Street
Santa Monica, California 90401-1353
Additional copies may be ordered online or by sending payment
(check, bank draft, or credit card information) to the above address.
For complete ordering information for this and all Milken Institute publications,
please see our Web site at www.milken-inst.org or contact us by email
telephone (310.998.2600), or in writing.
Price: US$15.00 (includes shipping and handling)

Contents
Executive Summary ........................................................................................1
Introduction....................................................................................................17
Section 1 - Technology and U.S. Growth Potential ................................19Technology and Growth Theory ..................................................................21
Historical Evidence of Technology and Growth........................................22
IT Pessimists....................................................................................................23
IT Optimists ....................................................................................................24
What to Conclude? ........................................................................................28
Section 2 - National High-Tech Industry Performance..........................31The Impact of Technology on Economic Growth......................................31
High-Tech Industries Included ....................................................................34
Section 3 - Technology and Metropolitan Economic Performance ....38Economic Geography: Theoretical Underpinnings ..................................39
Applications to High-Tech Industries ........................................................43
High Technology Production Spatial Patterns ..........................................47
Technology’s Importance in Metro Growth Patterns................................48
High-Technology Spatial Concentration ....................................................54
High-Technology Spatial Growth ................................................................68
The Forces of Concentration and Dispersion: Who’s Winning? ............73
Section 4 - High-Tech Industries and Economic Risks..........................79Is the Business Cycle Still Relevant?............................................................81
High-Tech Industries and the Business Cycle............................................83
Recession Risk: High-Tech Industries and Metros....................................88
Section 5 - Key Economic Development and Business PlanningImplications....................................................................................................95Economic Policy and High-Tech Clustering ..............................................97
Implications for Business Planning ..........................................................104
Appendix - High-Tech Industry Profiles................................................106
References ....................................................................................................124
iii

1
Executive Summary
Section 1: Technology and U.S. Growth Potential
Technology is ubiquitous, directly or indirectly invading nearly all sectorsof the U.S. economy. Moreover, a compelling case can be made that thehigh-tech sector is boosting the long-term potential growth path of the U.S.economy and determining the relative economic success of metropolitanareas around the country. “Information technology” (IT) describes theinfrastructure and knowledge that is necessary to make informationavailable rapidly. IT is increasingly the software and communicationservices that patch equipment together. Advances in technology in recentyears have created entirely new growth industries including e-commerce,online information services, mobile communications, and greater advancesin medical research. IT has spurred rapid, seemingly continuousinnovation by creating networks that generate value through productiveinteractive relationships or collaboration.
Firms have been investing in IT in an effort to boost productionefficiencies, improve communication flows, and enhance overall businessoperations. Firms believe that these investments yield rewards such as
Advances intechnology inrecent years havecreated entirely newgrowth industries,including e-commerce,online informationservices, mobilecommunications, andgreater advances inmedical research.
Figure 1High Tech Surges in the 1990sHigh-Tech vs. Total Real GDP
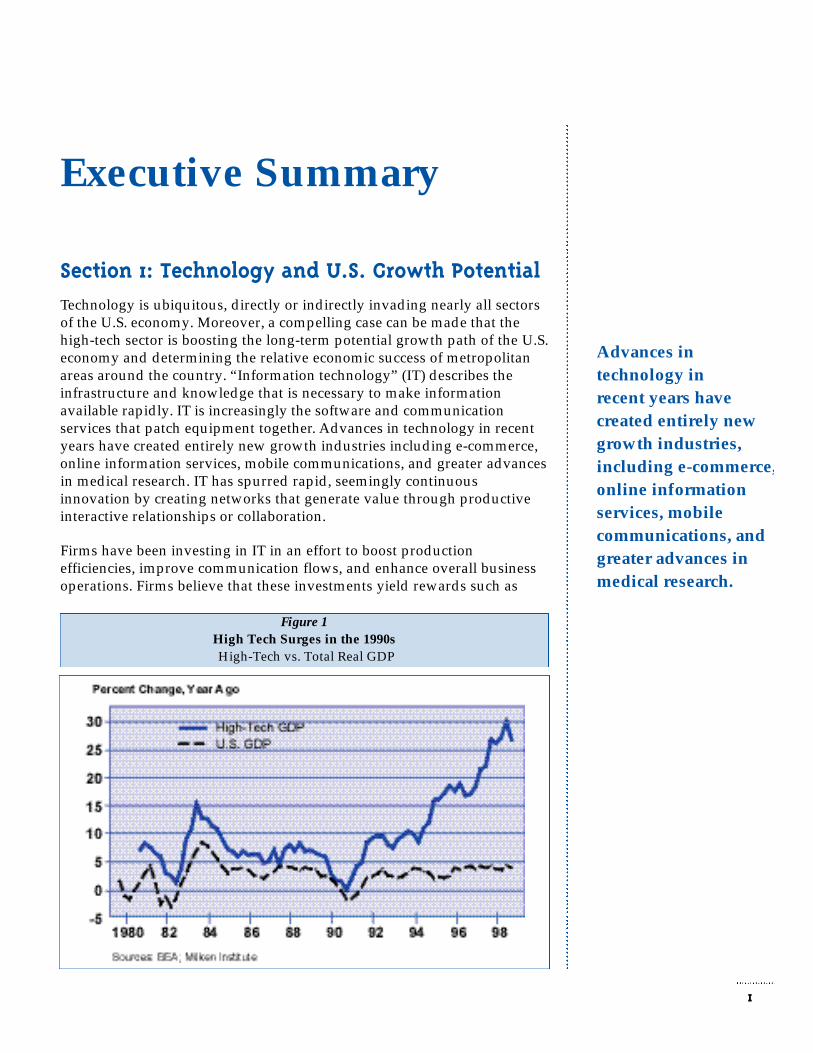
higher profitability by increasing productivity and hence reducing thegrowth of unit labor costs. Our standard of living is directly tied toproductivity growth. The Milken Institute has constructed an end-usedemand measure of high-technology products and services in an attemptto calibrate their rising contribution to economic growth. Its result isdisplayed in Figure 1. Since the 1990-91 recession, growth in the high-technology (high-tech) sector has been four times as large as in theaggregate economy. During the 1980s, the high-tech sector grewapproximately twice as fast as the economy. Over the past three years,growth in high-tech products and services averaged over 20 percent,directly elevating real GDP growth by 1.5 percentage point.
Information technology and it application has spawned much debateamong economists in recent years. IT pessimists point out that despite amassive investment in these technologies, productivity growth has fallenover the past 20 years. Furthermore, they assert that IT investments couldnot have improved productivity growth because they comprise too small ashare of the capital stock and have merely been substituted for moreexpensive inputs, such as labor and other forms of capital. IT optimists,however, make a compelling case that output growth in services is beingunderstated, and that the reported productivity growth is biaseddownward. IT optimists also claim that new technological innovationsrequire a substantial time period before being absorbed throughout theeconomy. As evidence that something is indeed happening, they arguethat productivity growth in the durable goods industries has risen in the1990s, and that over the past three years, productivity growth in the entireeconomy has accelerated.
What can we conclude concerning the role of technology in promotinglong-term economic growth? Some New Economy proponents areoverzealous in the advocacy of their position. Concluding, based on onlythree years of supporting data, that sustainable productivity growth hasimproved from 1 percent of the past 25 years to 2 percent would bepremature. We consider ourselves to be cautious optimists. Moderntechnology is altering production processes throughout the economy andenabling truly globally integrated firms. With the exponential growth ofthe Internet, many efficiency gains and lower costs will be realized.Technological innovation has boosted productivity growth to the 1.5-2.0percent range, with more growth possible. This will increase long-termeconomic growth to between 2.5 and 3.0 percent in our view.
Section 2: National High-Tech IndustryPerformance
One of the most omnipresent influences of high technology has been inbusiness investment patterns. IT hardware has accounted for a growingshare of total business investment across a broad array of industries. In
America’s High-Tech Economy Milken Institute - July 13, 1999
2
• • •
Growth in thehigh-tech sectorhas averagedfour times thatof the overalleconomy duringthe 1990s.
• • •
Technologicalinnovation hasimprovedproductivity growthand boosted U.S.long-term economicgrowth.
• • •
1970, information processing equipment and related sectors represented 7percent of real business equipment investment; however, last year it wasresponsible for over 50 percent of all capital spending.
One of the most difficult tasks in analyzing high-technology industries isdefining which set of industries to include in the definition. The definitionwill vary depending upon the research interests and data availabilityacross a number of dimensions. Our primary research interests are indetermining the individual contributions of high-tech industries to therelative economic performance of metropolitan areas. For these reasons,we are focusing on the value of output for industries that may beconsidered high technology. Manufacturing industries such as drugs,computers and equipment, communications equipment, and electroniccomponents are included, as are service industries such ascommunications services, computer and data processing services, andresearch and testing services.
These industries are among the fastest growing in the United States. Thethree industries with the most rapid growth — electronic components andaccessories, computer and office equipment, and computer and dataprocessing services — are all vital information technology industries. Overthe past 20 years, high-tech industries have almost doubled their share ofindustry output in the United States to nearly 11 percent. Technologyservices, at 5.8 percent of national output, are larger than technologymanufacturing.
Section 3: Technology and MetropolitanEconomic Performance
Technology is having a pervasive influence on the spatial distribution ofeconomic activity and, more importantly, the relative rate of growthamong metropolitan areas within the United States. Prowess intechnological innovation and assimilation will likely determine the relativesuccess of nations in the future; it already is having profound impacts onthe regional economic landscape of the United States. Ironically, just whenglobalization seemed to be forcing convergence among national economiesand cheap, versatile communications seemed to be undermining theinherent advantages of doing business in one place rather than another,localities are emerging as important factors to the economic success ofindividual nations. Perhaps the best indicator of the ascendance ofregionalism is that policymakers from Kuala Lumpur to Jerusalem arebusy trying to clone Silicon Valley. Geographic clustering is becomingcentral to the creation and understanding of what economists call“comparative advantage” in trade — even in an information-age economy.
It is plain that economic geography — a discipline that studies whereproduction occurs — has been neglected by the mainstream. But since the
Milken Institute - July 13, 1999 America’s High-Tech Economy
3
• • •
Informationprocessing equipmentaccounts for over 50percent of all capitalspending.
• • •
High tech hasdoubled its share ofthe U.S. economy overthe past 20 years.
• • •
Policy makersfrom Kuala Lumparto Jerusalemare busy tryingto cloneSilicon Valley.

late 1980s, there has been an intellectual boomlet in the subject. Thisresurgence has been dubbed “new economic geography” and provides thefoundation for analyzing highly specialized economic activity withinregions. In essence, new economic geography attempts to provide thetheoretical underpinnings to explain the agglomeration processes thatresult in highly specialized economic activity within regions. The centralcomponent of this theory is based upon the Marshallian notion thatincreasing returns — as in, “the more that’s made, the cheaper it is tomake” — lead to competitive advantages.
Economic geography posits two main opposing forces: concentration anddispersion. Agglomeration forces, because of increasing returns, causeeconomic activity to cluster, whereas centrifugal (or congestion) forcespush economic activity outward. The opposing forces are in constantcompetition as they seek a spatial equilibrium. The relative dominance ofone over the other creates a landscape of economic activity, but itultimately leads the countervailing force to exert a stronger influence,causing the geographic landscape to change. Such “externalities” play aparticularly important role in the case of high-technology industries.
Much of standard location theory is applicable to studying where high-tech industries locate and whether sufficient critical mass is achieved todevelop clustering. Many factors interact in a complex, dynamicenvironment that ultimately determine the geographic evolution oftechnology industries. The relative importance of the factors alters overthe stages of development. The relative weights placed upon the array oflocation factors will differ according to the specific high-tech industry —the major divide being whether it is a manufacturing or service industry.
A historical accident or exogenous force can provide a critical advantagefor one location. Many of the traditional location factors that have alwaysattracted industries also are important to high-tech firms. These factors aregenerally referred to as “cost-of-doing-business measures”: tax rates orincentives, compensation costs, land and office space costs, energy costs,capital costs, and firms’ perception of the general business climate.However, other factors appear to contribute the most to high-tech firms’location decisions. They include: access to a trained/educated workforce,close proximity to excellent educational facilities and research institutions,an existing network of suppliers, availability of venture capital, climateand other quality-of-life factors, and the general cost of living.
We applied a series of econometric approaches to examine the importanceof high-tech industries in explaining the relative economic growth ofmetros. The strength of the explanatory power of high-tech industries indetermining the relative economic growth of metros is high, and therelationship is robust across most dimensions in these regressions. In oneapproach, we created a series of metro growth indices relative to thenational growth pattern. In the case of high-tech output, the relative metro
America’s High-Tech Economy Milken Institute - July 13, 1999
4
Economicgeography positstwo mainopposing forces:concentrationand dispersion.
• • •
High-tech firmswant access to atrained workforce,close proximityto researchinstitutions, anetwork ofsuppliers, accessto venture capital, anda good qualityof life.

Milken Institute - July 13, 1999 America’s High-Tech Economy
growth index is created by comparing growth in metros relative to thenational average from 1990 to 1998. We chose the 1990s as the period ofanalysis because this is the period during which high-tech became vital indetermining performance between metros.
The variable we were attempting to explain was the relative total real-output growth index for each of the 315 metros based upon two factors:movements in the relative metro real high-tech output growth index andan index of concentration (location quotient) in high-tech activity in 1990.Standardizing the relationship by the concentration of high-tech industriesin a metro is important because if a metro had a low initial high-techdensity, a given percentage gain in high-tech growth would not providethe same incremental stimulus as in a metro with a large initial high-techdensity. Based upon this equation, we found that 65 percent of the totaloutput growth differential between metros could be explained on the basisof their relative growth in high-tech and the initial high-tech density (seeFigure 2).
High-tech industries have a large direct economic impact on metroeconomies, but the indirect and induced effects are critical tounderstanding their role in promoting growth. Because of the high-valueadded production in high-tech industries, and the greater demand forhigh-skilled labor, these industries compensate their employees well. Forexample, extensive use of stock options in high-tech industries’ totalcompensation mix is a powerful incentive — sometimes enabling evenclerical personnel to become millionaires. The indirect effect (or the
5
Figure 2Metro Growth Explained by High Tech
Actual vs. Predicted (Cross-sectional)
High- tech activitycan explain65 percent of thegrowth differentialbetween metros in the1990s.
• • •
The high-techsectorstimulates thenon-high-techsectors of a metroeconomy...the multiplierimpact.
America’s High-Tech Economy Milken Institute - July 13, 1999
incremental stimulus to non—high-tech industries) from high-technologyindustries on metro economies is substantial. The induced effects stemfrom non—high-tech firms and their employees purchasing more localgoods and services due to high sales by businesses and greater personalincome increases.
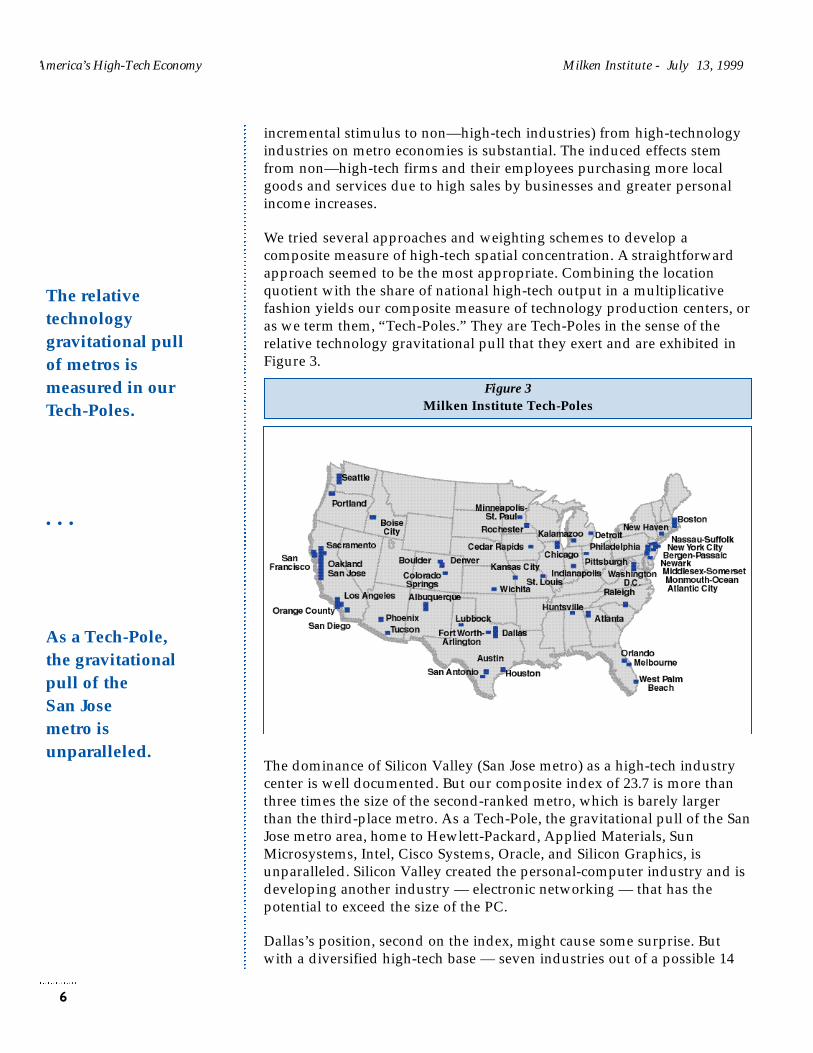
We tried several approaches and weighting schemes to develop acomposite measure of high-tech spatial concentration. A straightforwardapproach seemed to be the most appropriate. Combining the locationquotient with the share of national high-tech output in a multiplicativefashion yields our composite measure of technology production centers, oras we term them, “Tech-Poles.” They are Tech-Poles in the sense of therelative technology gravitational pull that they exert and are exhibited inFigure 3.
The dominance of Silicon Valley (San Jose metro) as a high-tech industrycenter is well documented. But our composite index of 23.7 is more thanthree times the size of the second-ranked metro, which is barely largerthan the third-place metro. As a Tech-Pole, the gravitational pull of the SanJose metro area, home to Hewlett-Packard, Applied Materials, SunMicrosystems, Intel, Cisco Systems, Oracle, and Silicon Graphics, isunparalleled. Silicon Valley created the personal-computer industry and isdeveloping another industry — electronic networking — that has thepotential to exceed the size of the PC.
Dallas’s position, second on the index, might cause some surprise. Butwith a diversified high-tech base — seven industries out of a possible 14
6
The relativetechnologygravitational pullof metros ismeasured in ourTech-Poles.
• • •
As a Tech-Pole,the gravitationalpull of theSan Jose metro isunparalleled.
Figure 3Milken Institute Tech-Poles

are more concentrated than the national average — it deserves to be highon the list. The Dallas metro area includes six of the nation’s 20 largesttelecommunication services companies. GTE’s global headquarters isbased in Dallas, while Nortel, Ericsson, Fujitsu, and Alcatel have U.S.headquarters there. Austin is thought by many to be the center of Texas’electronic components industry, but Dallas produces over 20 percent morein terms of value of output and employs 4,200 more people.
Despite the loss of defense-related high-tech firms in the early 1990s, LosAngeles ranks third on the index. The ranking is somewhat inflated,perhaps, by the inclusion of non-high-tech portions of motion pictureproduction and services. But even if the entire entertainment industrywere excluded, Los Angeles would rank seventh.
Boston places fourth, with an above-average concentration in 11 high-techindustries. It is home to some of the leading universities and researchcenters in the nation. Although the joint impact of defense downsizing andheavy dependence on the lagging mainframe computer industry has beensizable, it is enjoying renewed vigor due to its Internet-related prowess.Internet portal giant Lycos is headquartered in Waltham, while many otherstartups are emerging on Route 128.
Thanks to Boeing, aircraft is still a major industry in Seattle. But software’srapid growth has made computer and data processing services a vital partof the region’s economy. Seattle ranks fifth on the index. Microsoft, ofcourse, is at the nucleus of the Seattle software cluster.
From here on down, the rankings are full of surprises. On a compositeranking of high-tech services, Washington, DC, places first in the country,and sixth overall in high technology. Virtually unnoticed, Washington hasbecome a communications hub. Its Virginia suburb of Fairfax County ishome to America Online, UUNET, and PSINet. Over one-half of thenation’s Internet traffic passes through local firms. Software and dataprocessing are major sectors of the local economy as well.
Albuquerque’s high ranking derives from its success in attractingelectronic component manufacturers. Chicago is an important center ofcommunications equipment, courtesy of Motorola. The windy city also hasan above-average concentration in drugs and in research and testingservices. New York’s ninth-place rank is in part due to its major presencein telecommunications services. The city has very little high-techmanufacturing, which brings into question how much silicon is really inSilicon Alley.
Atlanta is the undisputed high-tech capital of the Southeast, with afoothold in telecommunication services, computer and data processingservices. Oakland’s 14th position places it just behind Orange County,California — a fact that may surprise those accustomed to thinking of it as
Milken Institute - July 13, 1999 America’s High-Tech Economy
7
Dallas, thoughit might surprisesome, is thesecond most-powerfulTech-Pole.
• • •
L.A., Boston,Seattle,Washington D.C.,Albuquerque,Chicago,New York, andAtlanta roundout the top 10Tech-Pole list.

an aging seaport and home to a struggling underclass. San Diego, with ithighly diversified high-tech economy, ranks 17th. Raleigh-Durham-ChapelHill, Denver, Austin, San Francisco, Houston, and Boise round out the top25.
Spatial concentration is important, but it does not guarantee continuinghigh-tech growth. And here, with smaller clusters in the midst of rapidexpansion, the rankings are quite different (see Figure 4). Albuquerque isat the top, recording a compound annual growth rate of 12.7 percent inhigh-tech output during the 1990s. This is almost entirely attributable toIntel’s investments in electronic components and accessories production.
Pocatello and Boise are second and third, respectively. (Boise is home toHewlett-Packard’s laser-jet printer division as well as to MicronTechnologies.) Cedar Rapids and Harrisburg, rapidly growing centers ofelectronic component manufacturing, are fourth and fifth. Columbus, GA,ranks sixth due to computer and data processing services. Merced, CA,recorded strong growth in pharmaceuticals, albeit on a very small high-tech base. The Richland, WA, metro area witnessed increases inengineering and architectural services. Austin, a center of computer andelectronics production, ranked 10th on the index.
Eugene-Springfield, OR, has witnessed large percentage gains incomputers and office equipment, communications equipment, andcomputer and data processing services. Albany, GA, experienced solidincreases in pharmaceuticals as well as aircraft. Flint, MI, ranks high in the
America’s High-Tech Economy Milken Institute - July 13, 1999
8
Figure 4Relative High-Tech Real Output Growth, 1990–1998
Smaller high-techclusters are in themidst of rapidexpansion.
• • •
Albuquerquerecorded thefastest high-techgrowth inthe 1990s...
• • •
...followed byPocatello, Boise,Cedar Rapids,Harrisburg,Columbus, GA,Merced, Richland,and Austin.

1990s due to strong growth in computer and data processing services,while Portland, OR, is becoming a center of semiconductor chip and waferproduction. Houston was built on energy, but its future will have a high-tech component. Indeed, the city has the distinction of being the largestmetro in the top 50. Compaq, the largest supplier of PCs to the U.S.market, is based there.
Is high-tech production becoming more spatially concentrated or moredispersed? This is a complex issue and must be analyzed from severalperspectives. There is evidence that high-tech manufacturing is becomingless spatially concentrated, but that high-tech services seem to exhibitstrong agglomeration processes. Even though manufacturing seems to bedispersing to periphery regions, it remains highly geographicallyconcentrated and clearly shows that agglomeration forces are exerting acontinuing influence.
Despite some evidence of rising spatial dispersion in high-techmanufacturing, it is remarkable how concentrated it remains.Agglomeration forces have an amazing ability to sustain themselves, onlyto be thwarted at some point by very high congestion-related costs. Acombination of high costs and either obsolete technology or firms is almostrequired before high-tech activity begins to decline.
As we enter the age of human capital, where firms merely leaseknowledge-assets, firms’ location decisions will be increasingly basedupon quality-of-life factors that are important to attracting and retainingthis most vital economic asset. In high-tech services, strict business-costmeasures will be less important to growing and sustaining technologyclusters in metro economies. Locations that are attractive to knowledge-assets will play a vital role in determining the economic success of regions.
Section 4: High-Tech Industries andEconomic Risk
On balance, the benefits to the economy from technology far exceed theless-noticed negative aspects of technology-driven economic development.However, there are risks emanating from the technology industry’s inheritvolatility, its growing importance in the overall economy, and the closerrelationship between it and the business cycle of the U.S. economy. Willthese risks prove to be severe for metropolitan areas that have developedhigh-tech clusters that are prone either to technology cycles or tofluctuations emanating from the broader economy, or is high tech immuneto the business cycle?
Because high-tech industries account for so large a share of nationaloutput today, the economy is more vulnerable to a high-tech contractionthan ever before. A synchronous shock spread across a number of related
Milken Institute - July 13, 1999 America’s High-Tech Economy
9
High-techmanufacturing isbecoming lessspatially concentrated,but high-tech servicesmay be becomingmore concentrated.
• • •
As we enter the age ofhuman capital, firms’location decisions willincreasingly be basedon quality-of-lifefactors.
• • •
Is high-tech immuneto the business cycle?

technology industries, such as computers and semiconductors, incombination with some other inauspicious development could cause arecession in the entire economy.
Application of information technology likely will dampen business cyclesin the future. IT is improving businesses’ ability to manage inventoriesand reduce a key source of contractions in the broad economy. Changes ininventory investment are responsible for a very large proportion of thechange in total business investment over the business cycle. Futurebusiness cycles will be less severe, but not extinct.
We analyzed the behavior of high-tech industries over the business cycle,applying several quantitative approaches. We isolated the cyclicalcomponent from the trend and irregular (random) component of eachhigh-tech industry output series, compared the standardized cyclicalcomponent of each industry to the economy overall, and ran regressions todetermine their relative cyclicality. Lastly, we tested to see if therelationship with the business cycle is becoming stronger over time.
We determined that high-tech manufacturing industries are among themost volatile in the economy. A few high-tech industries lagged thecyclical movement in the overall economy, but many moved coincidentwith it. Several high-tech industries that were not highly correlated withthe overall economy between 1965 and 1985 did show a relationship after1985. Computers and office equipment has been cycling much moreclosely with the overall economy since 1985 (see Figure 5). The cyclicalmovement in computers approximately matched that of the overall
America’s High-Tech Economy Milken Institute - July 13, 1999
10
Figure 5Computers Align with the Business Cycle
Cyclical Component Divided by its Standard Deviation
Future business cycleswill be less severe -but not extinct.
• • •
High-techmanufacturingindustries are amongthe most volatile inthe economy.
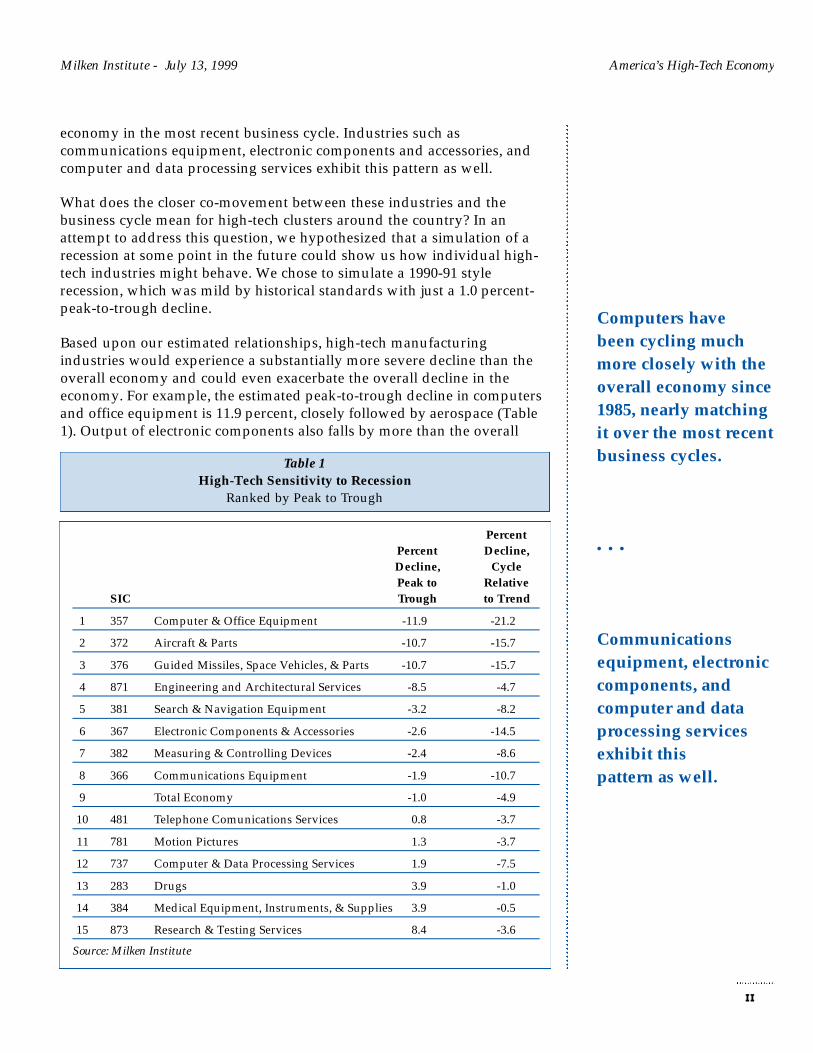
economy in the most recent business cycle. Industries such ascommunications equipment, electronic components and accessories, andcomputer and data processing services exhibit this pattern as well.
What does the closer co-movement between these industries and thebusiness cycle mean for high-tech clusters around the country? In anattempt to address this question, we hypothesized that a simulation of arecession at some point in the future could show us how individual high-tech industries might behave. We chose to simulate a 1990-91 stylerecession, which was mild by historical standards with just a 1.0 percent-peak-to-trough decline.
Based upon our estimated relationships, high-tech manufacturingindustries would experience a substantially more severe decline than theoverall economy and could even exacerbate the overall decline in theeconomy. For example, the estimated peak-to-trough decline in computersand office equipment is 11.9 percent, closely followed by aerospace (Table1). Output of electronic components also falls by more than the overall
Milken Institute - July 13, 1999 America’s High-Tech Economy
11
Table 1High-Tech Sensitivity to Recession
Ranked by Peak to Trough
Computers havebeen cycling muchmore closely with theoverall economy since1985, nearly matchingit over the most recentbusiness cycles.
• • •
Communicationsequipment, electroniccomponents, andcomputer and dataprocessing servicesexhibit thispattern as well.
Percent Percent Decline,Decline, Cycle Peak to Relative
SIC Trough to Trend
1 357 Computer & Office Equipment -11.9 -21.2
2 372 Aircraft & Parts -10.7 -15.7
3 376 Guided Missiles, Space Vehicles, & Parts -10.7 -15.7
4 871 Engineering and Architectural Services -8.5 -4.7
5 381 Search & Navigation Equipment -3.2 -8.2
6 367 Electronic Components & Accessories -2.6 -14.5
7 382 Measuring & Controlling Devices -2.4 -8.6
8 366 Communications Equipment -1.9 -10.7
9 Total Economy -1.0 -4.9
10 481 Telephone Comunications Services 0.8 -3.7
11 781 Motion Pictures 1.3 -3.7
12 737 Computer & Data Processing Services 1.9 -7.5
13 283 Drugs 3.9 -1.0
14 384 Medical Equipment, Instruments, & Supplies 3.9 -0.5
15 873 Research & Testing Services 8.4 -3.6
Source: Milken Institute

America’s High-Tech Economy Milken Institute - July 13, 1999
economy. Drugs and medical equipment are the only manufacturingindustries that continue to grow during the recession. Engineering andarchitectural services experience a peak-to-trough decline of 8.5 percent inthis simulation. Output continues to grow in the other four high-techservice industries, but growth slows substantially.
The most severely impacted metros have dense concentrations ofcomputers and office equipment, aircraft, communications equipment, andelectronic components. Metros with a heavy reliance on high-tech servicesare generally not affected, but because of high-tech services’ growingsusceptibility to the business cycle, they will be more exposed in thefuture.
This analysis suggests that metros that have experienced a high degree ofsuccess in developing clusters of computer, semiconductor, and otherhigh-tech manufacturing industries should be more aware of the potentialrisks that a recession could pose to their local economies. Most economicdevelopment and government officials have encouraged these industriesto locate within their borders, hoping that this might help insolate themfrom future business cycles. While high-tech industries will assist cities’long-term relative performance, they are unlikely to shield them fromfluctuations in the aggregate economy.
Section 5: Key Economic Development andBusiness Planning Implications
In light of the tremendous opportunity for employment creation andincome gains, as well as the potential risks of national and regionaleconomic downturns, a technology-based economic development strategymust be carefully formulated.
Table 2 lists a set of variables that influence the development of regionalhigh-tech industries. We divide those factors into three groups: publicpolicy, comparative location benchmarking, and social infrastructuredevelopment. We rated each factor based upon its effectiveness in helpingto establish a regional high-tech cluster in the different stages of regionaleconomic development. All factors in the table are interrelated; theirintegral nature lends importance to the role of local government in thedevelopment process.
State and local governments, public policies, and the interaction betweenprivate and public sectors are crucial for the genesis, expansion, andfortification phases of high-tech development. Nonetheless, due to theunique characteristics of high-tech industries, government’s role also islimited. Overly active government intervention and public policy may becounterproductive and even harmful to the long-term development ofhigh-tech industries.
12
In future recessions,metros with denseconcentrations ofcomputers, aircraft,communicationsequipment, andelectronic componentswill be the mostimpacted.
• • •
A technology-basedeconomicdevelopment strategymust be carefullyformulated.
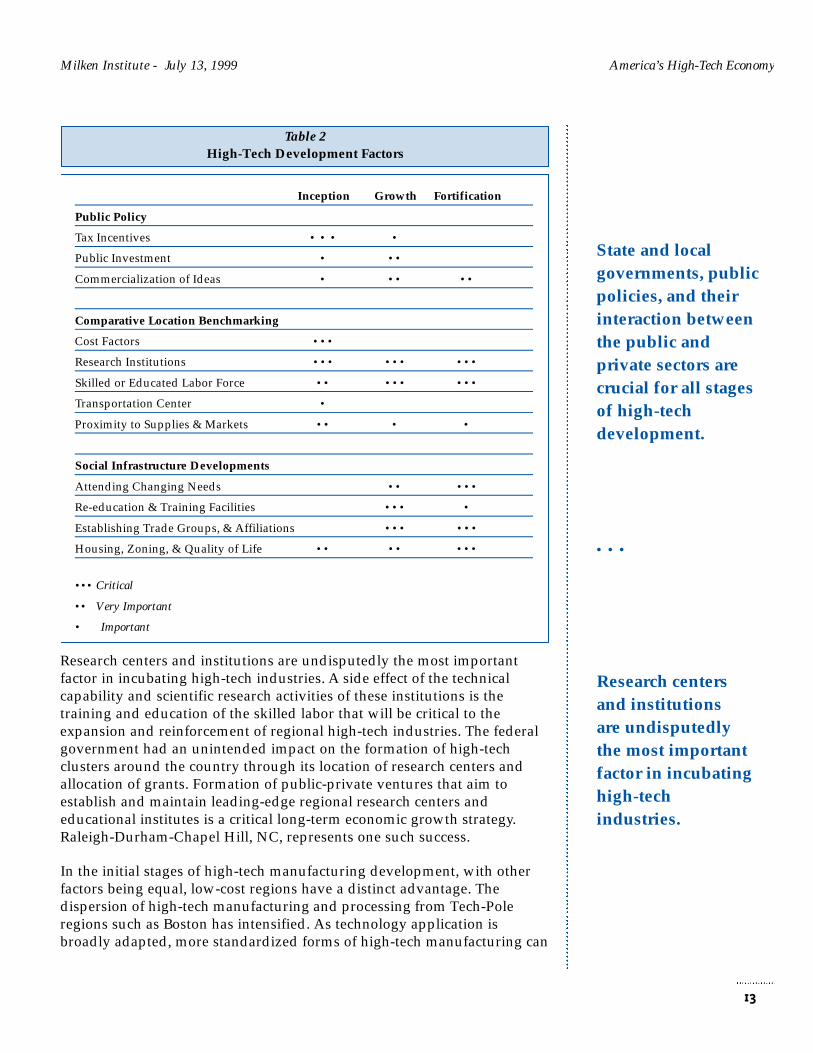
Research centers and institutions are undisputedly the most importantfactor in incubating high-tech industries. A side effect of the technicalcapability and scientific research activities of these institutions is thetraining and education of the skilled labor that will be critical to theexpansion and reinforcement of regional high-tech industries. The federalgovernment had an unintended impact on the formation of high-techclusters around the country through its location of research centers andallocation of grants. Formation of public-private ventures that aim toestablish and maintain leading-edge regional research centers andeducational institutes is a critical long-term economic growth strategy.Raleigh-Durham-Chapel Hill, NC, represents one such success.
In the initial stages of high-tech manufacturing development, with otherfactors being equal, low-cost regions have a distinct advantage. Thedispersion of high-tech manufacturing and processing from Tech-Poleregions such as Boston has intensified. As technology application isbroadly adapted, more standardized forms of high-tech manufacturing can
Milken Institute - July 13, 1999 America’s High-Tech Economy
13
Table 2High-Tech Development Factors
State and localgovernments, publicpolicies, and theirinteraction betweenthe public andprivate sectors arecrucial for all stagesof high-techdevelopment.
• • •
Research centersand institutionsare undisputedlythe most importantfactor in incubatinghigh-techindustries.
Inception Growth Fortification
Public Policy
Tax Incentives • • • •
Public Investment • ••
Commercialization of Ideas • •• ••
Comparative Location Benchmarking
Cost Factors •••
Research Institutions ••• ••• •••
Skilled or Educated Labor Force •• ••• •••
Transportation Center •
Proximity to Supplies & Markets •• • •
Social Infrastructure Developments
Attending Changing Needs •• •••
Re-education & Training Facilities ••• •
Establishing Trade Groups, & Affiliations ••• •••
Housing, Zoning, & Quality of Life •• •• •••
••• Critical
•• Very Important
• Important

be moved to low-cost locations. Proximity to suppliers and markets isbecoming less relevant today as communication and shipping costs fall. Ifinitial low-cost regions cannot establish agglomeration as their locationcosts rise, they can easily be superceded by other locations. So, whileimportant initially, low cost is not a sustainable comparative advantage inhigh-tech industries. Since the new high-tech economy is globally basedand hence has great mobility, a high-tech company can move from oneregion or country to another in a relatively short period of time.
The San Francisco Bay Area is the most expensive location in the country,yet the Bay Area remains the most concentrated Tech-Pole in the country.One cannot rule out the possibility that the success of high-profilemetropolitan areas is based at least partially on the high cost of doingbusiness in those regions. High costs can become the catalyst for theexisting firms in the region to pursue higher revenues through inventingnew concepts and products. High costs also force out marginal or olderproducts, an evolutionary step that is both necessary and essential for thehigh tech cluster to remain at the leading edge of technology innovation.
Tax rebates and incentives can be a good tool in laying the foundation forcorporate placement and particularly can help smaller entrepreneurs setup basic operations. Government entities should be cautious indistinguishing and recognizing the orientation of such policy, however.Government’s function should be, at most, to jump-start the process.Providing a readily available labor pool is probably the best investmentthat state and local governments can make.
The process of establishing a high-tech economy is complex andmultifaceted. Its evolution is totally dynamic and in many aspects self-guiding. Developing a regional culture that is amenable to change andgrowth and building a society that is open to new ideas are probably thebest strategies and principles government can have to both attract andexpand high-tech industry.
Just as we have changed our view about the contents of technology from arelatively pure form of products to a more complex combination of ideas,creativity, and entrepreneurial activities, economic development policyshould adjust to being about the building of cultural and socialenvironment as well as physical infrastructure. Establishing local publicand private trade groups and affiliations is a sound policy in promotingthe exchange of ideas, trade information, and public awareness of thedevelopment. Attending to the needs of local firms and newcomers alikewill help the region in attracting the desired skilled labor.
The opportunity is tremendous for growth-oriented firms and business totap into the next rising tech-cluster regions, where the customer base iswidening and their needs are customized. More important, operating inthe high-tech region and among firms that gain the first experience and
America’s High-Tech Economy Milken Institute - July 13, 1999
14
Although initiallyimportant, low cost isnot a sustainablecomparativeadvantage in high-tech industries.
• • •
Government’sfunction should be to jump-startthe developmentprocess.
• • •
Growth-orientedfirms should tap intothe next rising tech-cluster regions.
Milken Institute - July 13, 1999 America’s High-Tech Economy
knowledge of the next wave of change is a supreme competitiveadvantage.
There is nothing more dramatic than the impacts of the high-tech serviceboom upon the commercial and office construction markets. MushroomingInternet Web-service firms and graphic design studios change the conceptof space planning and building. A growing high-tech region rapidlytransforms the local community. New tech clustering and rapidaccumulation of wealth in a regional market creates business opportunityranging from home building to retail. Professional service providersshould be equally vigilant about the high-tech frontier development. Thesenew and relatively smaller enterprises tend to utilize their limited andprecious capital to create new ideas and products.
Conclusions
The application of IT is improving productivity growth and boosting thelong-term growth path of the U.S. economy. Advances in technology havecreated entirely new growth industries, such as e-commerce, and enabledtruly globally integrated firms. Although remnants of the old economyremain, the New Economy is here. Core information technology industries— electronic components and accessories, computer and office equipment,and computer and data processing services — are the fastest-growing inthe U.S economy.
High-tech industries are critical in gauging the health of the U.S. economy.They are determining which metropolitan areas are succeeding or failing.Without growth in high-tech sectors, metros will be left behind. In order tofoster high-tech growth, metropolitan areas must understand whatlocation factors are most important to high-tech firms. That high-techclusters are perceived as important is clear from the worldwide attemptsto repeat the success of Silicon Valley. Cloning Silicon Valley will beimpossible, however, because the proper DNA sequence is locked awaysomewhere on Sand Hill Road. Those regions that come closest toduplicating Silicon Valley, however, will be the leading technology centersin the early stages of the 21st century.
The high-tech economy does pose risks for metropolitan areas.Technology-driven economic development is causing a widening ofincome disparity along educational attainment levels, reducing jobsecurity and job tenure, and resulting in greater risk of unemploymentamong workers in their 50s. Further, high-tech manufacturing industriesare becoming more sensitive to the business cycle. Nevertheless, it isimperative for local government and economic development officials topromote high-tech expansion, or they risk substandard economic growthin the future. Although high tech is not the only development strategy topursue, it will be the key distinguishing feature of metropolitan vitality aswe enter the new century.
15
New techclustering and rapidaccumulation ofwealth createsbusinessopportunityranging from homebuilding to retail.
• • •
Cloning SiliconValley will beimpossible becausethe proper DNAsequence is lockedaway somewhere onSand Hill Road.
• • •
It is imperative forlocal governmentand economicdevelopment officialsto promote high-techexpansion.


Introduction
For some years observers have assumed that it is technologicalinnovation that is powering the Great American Prosperity Machine andsustaining America’s preeminence in industries ranging frompharmaceuticals to entertainment to software. Only very recently haveeconomists been able to piece together evidence to quantify thattechnology really is translating into higher productivity nationwide. Andonly now can we see how it is driving success (and failure) in localeconomies.
Technology and high-technology (high-tech) industries are central tounderstanding the economic well-being of nations, regions, firms, andindividuals as we enter the 21st century. Many terms are used to describetechnology’s impact on the economy and future. Some refer to theapplication of technology as the “New Economy”; others believe that weare entering the age of “knowledge-based capital,” whether physical orhuman. The term “high-tech” is probably oversubscribed, but we believethat the U.S. economy is currently in the midst of the most dramatictechnology-driven development in its history.
This study’s main focus is to examine technology’s importance indetermining the relative economic performance of metropolitan areas andwhat lessons can be applied to the future. To do so, we first establishtechnology’s role in promoting economic growth in the aggregate U.S.economy. We also examine the sensitivity of high-tech industries to futurebusiness cycles and the likely impact on metropolitan economies. Lastly,we offer some implications and suggestions for economic developmentofficials and business firms. The study is divided into five sections. Anappendix describes each of the industries that are included in ourdefinition of high technology and discusses developments in them.
In Section 1, “Technology and U.S. Growth Potential,” we establish whatrole the application of technology is playing in promoting long-termeconomic growth. Theory and evidence of how information technologyaids micro and macro performance of the U.S. economy is examined. Inwhat ways should investment in technology boost long-term economicgrowth? Are information technology and related knowledge-basedservices improving productivity growth in the U.S. economy? Is thereevidence to support the proponents of a “New Economy?”
Section 2, “National High-Tech Industry Performance,” catalogs manymeasures of technology’s growing assimilation throughout the economy.Further, it defines and reviews the industries in our study. How dependent
17
Now we can see howtechnology is drivingsuccess (and failure)in local economies.
• • •
This study’s mainfocus is to examinetechnology’simportance indetermining therelative economicperformance ofmetropolitan areas.
America’s High-Tech Economy Milken Institute - July 13, 1999
is the U.S. economy on information technology in its investment patterns?How have technology workers’ wages performed relative to those of non-technology workers — is the gap growing larger? How large is high techin the United States and how important is it in determining overallgrowth? Which high-tech industries are experiencing the most growth?
Section 3 is the focal point of our study, entitled, “Technology andMetropolitan Economic Performance.” It examines many spatialdimensions of high-tech economic activity and highlights the theoreticalunderpinnings of economic geography and, more particularly, theagglomeration processes as they pertain to technology industries. Howimportant is geographic clustering of high-tech industries in determiningthe relative economic growth of metropolitan areas (metros) in the 1990sand can this be measured quantitatively? Which metros lead in technologyindustry vertical density and horizontal depth, and are true technology-production centers? What factors determine where high tech isconcentrated and where the greatest growth is occurring? How can high-tech industries promote growth in local non-high-tech sectors? Areagglomeration (centripetal) forces causing high tech to be moreconcentrated or are countervailing centrifugal forces causing a dispersionof high-tech industries?
Section 4, “High-Tech Industries and Economic Risks,” analyzes risksemanating from high tech as they relate to the industry’s inherit volatility,its growing importance in the overall economy, and the closer relationshipbetween it and the business cycle of the U.S. economy. Will theassimilation of technology into virtually all economic sectors leave high-tech industries more exposed to fluctuations in the broad economy thanever before? Have high-tech industries become more sensitive to thebusiness cycle over time? What might be the impact for metros with alarge concentration of high-tech industries?
Lastly, in Section 5, “Key Economic Development and Business PlanningImplications,” we highlight economic development issues as they pertainto high-technology industries. Further, we translate the findings of thestudy into implications for established firms and new business formationsin terms of expansion plans or location analysis. What type of economicenvironment helps create and foster superior development? Can economicpolicy induce high-tech industry formation and augment clustering in aregion? If they can be duplicated, what kind of public policy and economicdevelopment strategies can expedite and fortify development in thefuture? What non-high-tech businesses can benefit most by monitoringnewly emerging technology centers?
The Appendix, “High-Tech Industry Profiles, contains a review of theindustry structure, changes in the industry, measures of industry size andperformance, and issues relating to future developments of high-techindustries as classified in this study.
18
Some of the questionswe ask are: Howimportant is thegeographic clusteringof high-techindustries to therelative economicgrowth ofmetropolitan areas?
• • •
What type ofeconomicenvironmenthelps create andfoster superiordevelopment?

SE C T I O N 1
Technology and U.S.Growth Potential
High-technology industries are critical in gauging the performance ofthe U.S. economy. They comprise an ever-increasing proportion ofeconomic output and therefore are more important for monitoringbusiness-cycle developments. A compelling case also can be made that thehigh-tech sector is boosting the long-term potential growth path of the U.S.economy. Technological advancement embodied in both new and moreefficient traditional capital goods, and innovative implementation of themin the business sector, are prime determinants of economic growth (Jarboeand Atkinson 1998).
Due to acceleration in technological advances and innovation incomputers, communications equipment, other high-tech products and theassociated knowledge-based services, demand in these sectors during the1990s has been rising at an increasing pace. As stated by Joel Mokyr, aneconomic historian at Northwestern University consulted by BusinessWeek,“We’ve never had a period in which innovation has so permeated our livesas in the 1990s.”
Information technology is ubiquitous, directly or indirectly invadingnearly all sectors of the U.S. economy. Information technology istransforming the mix of economic activity away from traditional sources,such as consumer durables and business investment in structures, while atthe same time augmenting the level of aggregate output. “Informationtechnology” (IT) is the term used to describe the infrastructure andknowledge that is necessary to make information available rapidly. ITincreasingly comprises the software and communication services thatpatch equipment together. Advances in IT in recent years have createdentirely new growth industries including e-commerce, online informationservices, mobile communications, and rapid advances in medical research.IT has spurred rapid, seemingly continuous innovation by creatingnetworks that generate value through productive interactive relationshipsor collaboration. In the past, innovation transpired predominately by morediscrete advances in research and development. We are still witnessing theearly stages of the impact of IT and other newly emerging technologies onthe potential growth of the U.S. economy.
19
Technologicaladvancementembodied in bothnew and moreefficient traditionalcapital goods, andinnovativeimplementation ofthem in the businesssector, are primedeterminants ofeconomic growth.
• • •
IT has spurred rapid,seemingly continuousinnovation bycreating networks thatgenerate valuethrough productiveinteractiverelationships.
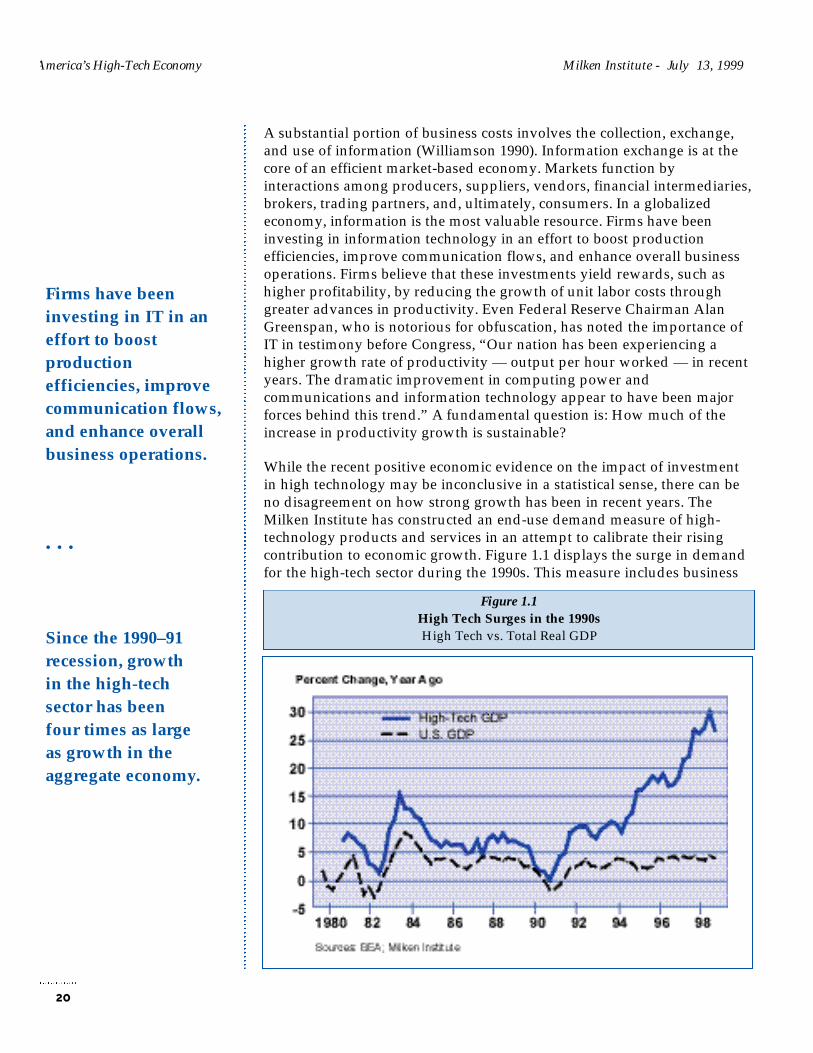
A substantial portion of business costs involves the collection, exchange,and use of information (Williamson 1990). Information exchange is at thecore of an efficient market-based economy. Markets function byinteractions among producers, suppliers, vendors, financial intermediaries,brokers, trading partners, and, ultimately, consumers. In a globalizedeconomy, information is the most valuable resource. Firms have beeninvesting in information technology in an effort to boost productionefficiencies, improve communication flows, and enhance overall businessoperations. Firms believe that these investments yield rewards, such ashigher profitability, by reducing the growth of unit labor costs throughgreater advances in productivity. Even Federal Reserve Chairman AlanGreenspan, who is notorious for obfuscation, has noted the importance ofIT in testimony before Congress, “Our nation has been experiencing ahigher growth rate of productivity — output per hour worked — in recentyears. The dramatic improvement in computing power andcommunications and information technology appear to have been majorforces behind this trend.” A fundamental question is: How much of theincrease in productivity growth is sustainable?
While the recent positive economic evidence on the impact of investmentin high technology may be inconclusive in a statistical sense, there can beno disagreement on how strong growth has been in recent years. TheMilken Institute has constructed an end-use demand measure of high-technology products and services in an attempt to calibrate their risingcontribution to economic growth. Figure 1.1 displays the surge in demandfor the high-tech sector during the 1990s. This measure includes business
America’s High-Tech Economy Milken Institute - July 13, 1999
20
Firms have beeninvesting in IT in aneffort to boostproductionefficiencies, improvecommunication flows,and enhance overallbusiness operations.
• • •
Since the 1990–91recession, growthin the high-techsector has beenfour times as largeas growth in theaggregate economy.
Figure 1.1High Tech Surges in the 1990sHigh Tech vs. Total Real GDP

and consumer purchases of computers and related equipment,communication equipment, scientific and engineering equipment, drugs,telecommunication services, pre-packaged software, cable TV, and otherrelated sectors. Since the 1990-91 recession, growth in the high-tech sectorhas been four times as large as growth in the aggregate economy. Duringthe 1980s, the high-tech sector grew approximately twice as fast as theeconomy. Over the past three years, growth in high-tech products andservices averaged over 20 percent, directly elevating real GDP growth by1.5 percentage points.
Technology and Growth Theory
The contribution of technology to economic growth has been debatedsince the time of the classical economists. Today, growth theoristsgenerally agree that technological change is a major determinant of long-run economic growth. However, they disagree substantially on thecontribution of technology relative to other factor inputs and the amountof technological change that is due to physical capital as opposed tohuman capital. Technological advances improve the degree to whichinputs of physical and human capital are translated into output growth. Tothe degree that output grows more rapidly than the weighted-factorinputs, productivity growth is enhanced. Productivity growth (the rate ofgrowth in output per unit of input, usually expressed in output per man-hour) is a key determinant of the long-run aggregate supply in the U.S.economy. Our standard of living is directly tied to productivity growth.
The theory of an aggregate or economywide production function has beenused for several decades to evaluate the productivity of various factorinputs such as capital, labor, and R&D expenditures. Basically, theproduction function postulates that differing combinations of inputs canbe utilized to produce a given level of output. Many have contributed tothe literature in this area, but Robert Solow has long been a major figure inthe advancement of growth theory, winning a Nobel Prize for his efforts.His pioneering work in the development of the neoclassical growth modelwas the foundation for modern growth theory (Solow 1957). Solow’stheoretical framework, which decomposed contributions to output fromcapital and labor on the basis of a constant-returns-to-scale productionfunction, helped establish a temporary consensus in the 1970s on growththeory. The neoclassical model allowed the substitution of capital for labor.Solow found that a small fraction of economic growth could be assigned tolabor, and that capital formation accounted for approximately one-third ofgrowth. This leaves a large residual that is assigned to technologicalprogress. In Solow’s model, technological progress was exogenously(outside the system) determined, dubbed the “Solow residual.”
Assigning such a large portion of output growth to exogenouslydetermined technological progress was a troubling concept for
Milken Institute - July 13, 1999 America’s High-Tech Economy
21
Standard of living isdirectly tied toproductivity growth.
• • •
The productionfunction postulatesthat differingcombinations ofinputs can be used toproduce a given levelof output.
America’s High-Tech Economy Milken Institute - July 13, 1999
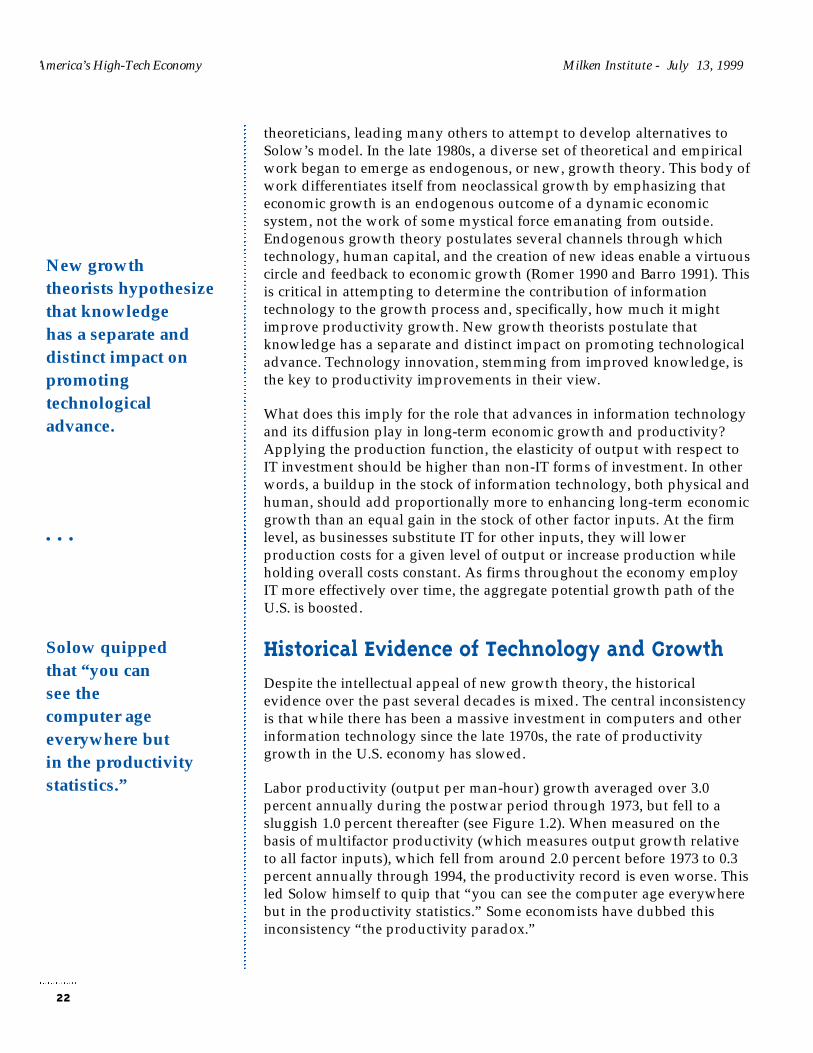
theoreticians, leading many others to attempt to develop alternatives toSolow’s model. In the late 1980s, a diverse set of theoretical and empiricalwork began to emerge as endogenous, or new, growth theory. This body ofwork differentiates itself from neoclassical growth by emphasizing thateconomic growth is an endogenous outcome of a dynamic economicsystem, not the work of some mystical force emanating from outside.Endogenous growth theory postulates several channels through whichtechnology, human capital, and the creation of new ideas enable a virtuouscircle and feedback to economic growth (Romer 1990 and Barro 1991). Thisis critical in attempting to determine the contribution of informationtechnology to the growth process and, specifically, how much it mightimprove productivity growth. New growth theorists postulate thatknowledge has a separate and distinct impact on promoting technologicaladvance. Technology innovation, stemming from improved knowledge, isthe key to productivity improvements in their view.
What does this imply for the role that advances in information technologyand its diffusion play in long-term economic growth and productivity?Applying the production function, the elasticity of output with respect toIT investment should be higher than non-IT forms of investment. In otherwords, a buildup in the stock of information technology, both physical andhuman, should add proportionally more to enhancing long-term economicgrowth than an equal gain in the stock of other factor inputs. At the firmlevel, as businesses substitute IT for other inputs, they will lowerproduction costs for a given level of output or increase production whileholding overall costs constant. As firms throughout the economy employIT more effectively over time, the aggregate potential growth path of theU.S. is boosted.
Historical Evidence of Technology and Growth
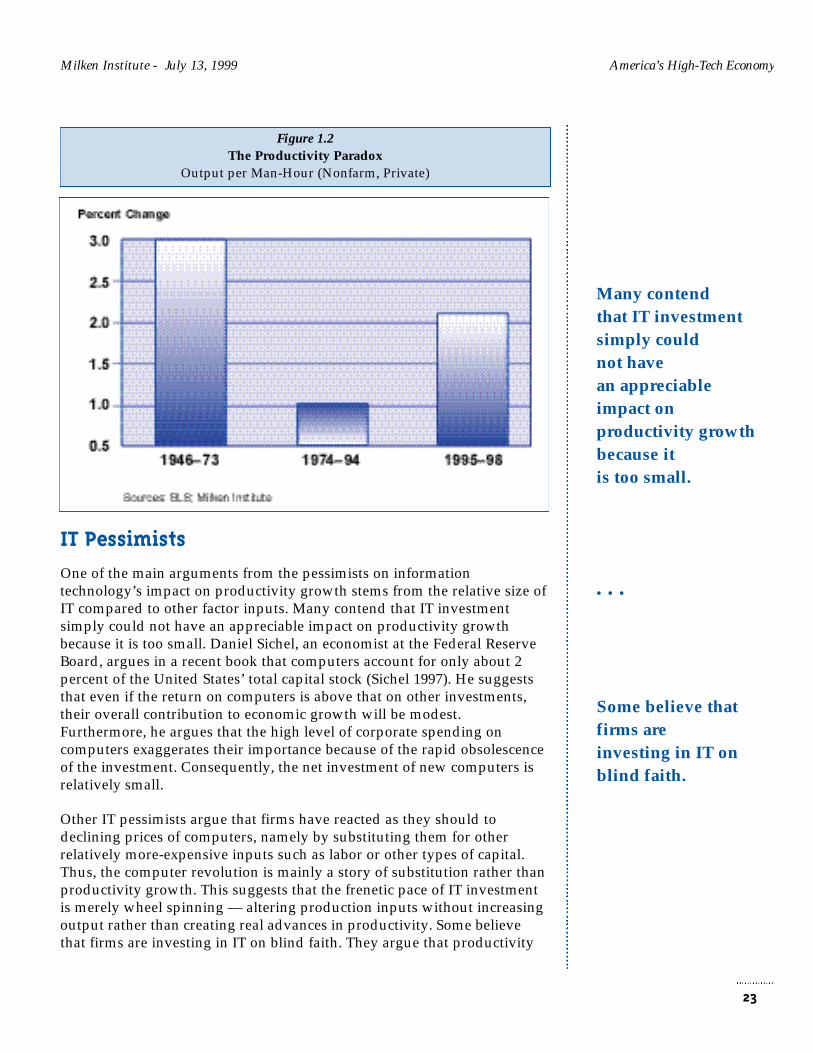
Despite the intellectual appeal of new growth theory, the historicalevidence over the past several decades is mixed. The central inconsistencyis that while there has been a massive investment in computers and otherinformation technology since the late 1970s, the rate of productivitygrowth in the U.S. economy has slowed.
Labor productivity (output per man-hour) growth averaged over 3.0percent annually during the postwar period through 1973, but fell to asluggish 1.0 percent thereafter (see Figure 1.2). When measured on thebasis of multifactor productivity (which measures output growth relativeto all factor inputs), which fell from around 2.0 percent before 1973 to 0.3percent annually through 1994, the productivity record is even worse. Thisled Solow himself to quip that “you can see the computer age everywherebut in the productivity statistics.” Some economists have dubbed thisinconsistency “the productivity paradox.”
22
New growththeorists hypothesizethat knowledgehas a separate anddistinct impact onpromotingtechnologicaladvance.
• • •
Solow quippedthat “you cansee thecomputer ageeverywhere butin the productivitystatistics.”
IT Pessimists
One of the main arguments from the pessimists on informationtechnology’s impact on productivity growth stems from the relative size ofIT compared to other factor inputs. Many contend that IT investmentsimply could not have an appreciable impact on productivity growthbecause it is too small. Daniel Sichel, an economist at the Federal ReserveBoard, argues in a recent book that computers account for only about 2percent of the United States’ total capital stock (Sichel 1997). He suggeststhat even if the return on computers is above that on other investments,their overall contribution to economic growth will be modest.Furthermore, he argues that the high level of corporate spending oncomputers exaggerates their importance because of the rapid obsolescenceof the investment. Consequently, the net investment of new computers isrelatively small.
Other IT pessimists argue that firms have reacted as they should todeclining prices of computers, namely by substituting them for otherrelatively more-expensive inputs such as labor or other types of capital.Thus, the computer revolution is mainly a story of substitution rather thanproductivity growth. This suggests that the frenetic pace of IT investmentis merely wheel spinning — altering production inputs without increasingoutput rather than creating real advances in productivity. Some believethat firms are investing in IT on blind faith. They argue that productivity
Milken Institute - July 13, 1999 America’s High-Tech Economy
23
Many contendthat IT investmentsimply couldnot havean appreciableimpact onproductivity growthbecause itis too small.
• • •
Some believe thatfirms areinvesting in IT onblind faith.
Figure 1.2The Productivity Paradox
Output per Man-Hour (Nonfarm, Private)

gains were realized from the investments made in the 1960s on large,transaction-heavy mainframe computers because a coherent, well-executedplan was implemented. By contrast, investment in today’s decentralizedpersonal computer world has not been thought out as well. The computersystems that have been purchased were not subjected to the properinvestment appraisal process. It is even suggested by some that thesefunds could have been better invested in research and development,employee training, and managerial advances. They point to studiesdisplaying no correlation between spending on information technologyand profitability by industry.
IT Optimists
The IT optimists offer counterarguments. The first one is themeasurement-error problem. Measuring output is problematic, especiallyin the service sector, which is not only a growing segment of the economybut an area where IT should contribute significantly to productivitygrowth. Baily and Gordon (1988) attribute much of the dramaticslowdown in productivity growth in the United States after 1973 toimproper measurement of quality-adjusted output. They note thatproductivity in computer manufacturing has increased dramatically in theofficial data, but productivity resulting from computer use is not apparent.The use of a hedonic price index (which measures computer-processingpower in the computer industry) is a key reason for this. The hedonicindex adjusts the price to reflect the increase in the quality of computersby focusing on the cost of performing a calculation in a constant timeperiod. They conclude that IT is providing valuable customer services thatare not reflected in the official output data. An increasing number ofconsumer services offers improved convenience as a result of ITinvestment, but it is unlikely to be measured accurately.
The best example of improved convenience is seen in the financial servicesindustry. Information technology allows firms to provide sophisticatedcash management accounts, almost costless portfolio diversificationthrough no-load mutual funds, 24-hour money access machines, bankingby phone, and, now, Internet banking. Nevertheless, in the banking, creditagencies, and securities industries, the Bureau of Economic Analysis (BEA)uses labor input to extrapolate real output changes. The only way the BEAcould report an increase in overall productivity in the financial servicesindustry is through a change in the composition of industry output. Whenother measures of output are utilized, such as total trades per employee inthe stock brokerage industry, or number of checks processed per employeein the banking sector, strong productivity growth is witnessed.
The second major argument is the technology diffusion argument. Thissays that a new technological innovation such as IT may require asubstantial time period before being absorbed throughout the economy. In
America’s High-Tech Economy Milken Institute - July 13, 1999
24
IT optimists counterthat measurementerror may be hidingIT’s contributions.
• • •
When measures otherthan the BEA’sstandards are used,strong productivitygrowth often iswitnessed.

Milken Institute - July 13, 1999 America’s High-Tech Economy
this view, IT has not yet been exploited fully. The optimists say that thereare three phases of technology improvement: invention, innovation, anddiffusion. The invention of a technology may occur far in advance ofdeveloping a way to incorporate it into a new production process as aninnovation. Even if this results in rapid productivity improvements for thefirm that developed the innovation, it may take years before other firmsobserve and copy it. Optimists point to the innovation of the dynamo, thefundamental electromechanical conversion device, which was notimmediately apparent in the productivity statistics, either. Several decadespassed before industries began to apply this technology. The slowdiffusion of the dynamo (electrification) delayed any significant impact onproductivity growth until the 1920s. Optimists believe that in the case ofIT, a combination of formal education and applications-oriented humancapital will lead to the successful transformation of the IT revolution intosustained productivity gains. As more firms employ IT to innovate and arecopied, aggregate productivity gains will become more apparent.
If the optimists are correct and diffusion is the key to realizingproductivity growth from IT investment, there should be some indicationof this in the sectors of the economy that deployed an innovation first. Themost encouraging evidence of IT boosting productivity growth is found indurable manufacturing. Output per man-hour in the durablemanufacturing sector has grown at an average annual rate of 5.0 percentsince 1990 (see Figure 1.3). During the 1980s, that sector’s productivitygrew at an average rate of 3.2 percent. Output growth in the
25
IT optimists observethree phases oftechnologyimprovement —invention, innovation,and diffusion - noneof which may occursimultaneously.
• • •
In the durablemanufacturing sector,output per man-hourhas grown at anaverage annual rate of5.0 percent since 1990.
Figure 1.3Productivity Increases Durable Goods
Output per Hour of all Persons

America’s High-Tech Economy Milken Institute - July 13, 1999
manufacturing sector is easier to define and accurately measure thangrowth in other sectors. The price deflators for most manufacturingindustries better reflect the quality improvements in the finished product,increasing the reported real or inflation-adjusted output. This evidencesupports the optimists’ contention that measurement error is a problembecause much of IT investment has been concentrated in service sectors,where new forms of output attributable to IT innovations are difficult toquantify.
Another way to examine if IT investment is having a productivity payoff isto analyze micro evidence. Several recent studies at the firm level havedocumented gains in productivity from IT investment. Brynjolfsson andHitt (1996) performed one of the most compelling studies; they foundstrong evidence of firm-specific returns to IT investment. They collecteddata on firm investments in IT hardware and IT labor and combined themto create an overall measure of “IT Stock.” They then applied a productionfunction approach by relating three factor inputs (IT Stock, Non-ComputerCapital, and Labor) to firm Value Added. Their results indicate that theoutput elasticity with respect to IT capital stock was very high and thatproductivity was much higher in firms with larger IT capital stocks. Theyestimated that the gross rate of return on IT investment was near 50percent, compared to 15 to 20 percent for other investments. Theyconcluded that the productivity paradox at the firm level has disappearedsince 1991.
Other organization-level evidence supports their findings. Lichtenberg(1995) analyzed data for hundreds of companies for the period 1988-92.His results displayed that the organization-level rate of return oninformation technology investment was more than three times the rate ofreturn on investment in other non-IT equipment or structures. Further, hisresults indicated that information systems employment made a largercontribution to output growth than any other type of employment. Thereis a substantial body of firm-level literature that strongly supports higherrates of return and productivity from information technology investment.This lends support to the IT optimists’ position that there is anunderreporting of output growth, causing a downward bias in the officialaggregate productivity statistics.
Many economists are encouraged by the exemplary performance of theU.S. economy since the 1990-91 recession. By many measures, the 1990shave exhibited unanticipated prosperity. The dynamic nature of ITspending and its rising importance in total investment in the economyhave caused some to herald the dawn of a New Economy, which wouldfoster economic growth at a rate closer to that which prevailed during the1950s and 1960s. New Economy proponents believe that the U.S. economyis able to sustain faster growth, with labor and capital more heavilyutilized, than was previously believed possible without triggering higherinflation. In essence, the sustainable, noninflationary growth potential ofthe U.S. economy is higher.
26
Several recent studiesat the firm level havedocumented gains inproductivity from ITinvestment.
• • •
New Economyproponents believethat the U.S. economycan sustain fastergrowth, with laborand capital moreheavily utilized, thanwas previouslybelieved possiblewithout triggeringinflation.

A central piece of their supporting evidence is the benign behavior ofinflation in the face of tight labor markets during the 1990s expansion.Most economists believed that the nonaccelerating inflation rate ofunemployment (NAIRU), or the rate of unemployment that would causeinflation neither to accelerate nor decelerate, was between 6 percent and6.5 percent. With the unemployment rate below 5.5 percent for over twoyears, core inflation has been benign (see Figure 1.4). Temporaryauspicious developments such as plunging oil and commodity prices andmoderating health care costs have helped restrain inflationary pressures.Nevertheless, most economists acknowledge that the NAIRU is lower thanpreviously anticipated. New Economy proponents contend that innovativeimplementation of information technology is playing a large role in thisimproved inflation performance.
Another key piece of corroborating evidence from New Economyproponents is the improved productivity performance over the past threeyears. Output per man-hour in the nonfarm business sector rose by anaverage of 2.1 percent from 1996 through 1998. What is encouraging aboutthis development is that it is occurring at a mature stage of an expansion,typically the time when productivity growth begins to wane, hinting at apossible long-term productivity improvement. Drawing conclusions on thebasis of only three years of data is precarious; nevertheless, theseobservations suggest that something real might be happening. Some NewEconomy proponents believe that the long-term real GDP growth rate hasrisen to 3 percent, based upon 2 percent productivity growth and laborforce growth of 1 percent.
Milken Institute - July 13, 1999 America’s High-Tech Economy
27
With theunemployment ratebelow 5.5 percent forover two years, coreinflation has beenbenign.
• • •
Output per man-hourin the nonfarmbusiness sector roseby an average of2.1 percent during1996-98.
Figure 1.4NAIRU Falling
Unemployment Rate and CPI

What to Conclude?
What should be concluded concerning the role of technology in promotinglong-term economic growth? On the basis of macroeconomic evidence asofficially reported by government agencies, it is difficult to statisticallyprove that the massive investment in information technology has caused arise in long-term economic growth in the United States. This does notmean, however, that IT investment is not improving economicperformance. Real output growth is understated in much of the servicesector, partly because government statistical agencies have not beenadequately funded to develop appropriate ways to measure aninformation-age economy. Nontraditional ways of measuring output inservice industries show that these industries are displaying more rapidgrowth and, therefore, greater advances in productivity. If thisunderreporting of output growth were aggregated across all industries, theeconomywide performance of the United States would look much better.
Another way to gauge if some structural change is occurring in theeconomy is through the estimation of a potential GDP equation usingproduction function methodology. If a standard production functionapproach, which does not differentiate between IT capital and non–ITcapital, severely understates the current level of economic activity, itwould support the notion that there has been some structural break inlong-term economic growth. We estimated a potential GDP equation forthe U.S. economy using a Cobb-Douglas production function. The size of
America’s High-Tech Economy Milken Institute - July 13, 1999
28
Real output growth isunderstated in muchof the service sector,partly becausegovernment agencieshave not beenadequately funded todevelop appropriateways to measure aninformation-ageeconomy.
• • •Figure 1.5
Actual GDP Above PotentialGDP Gap, Actual vs. Potential
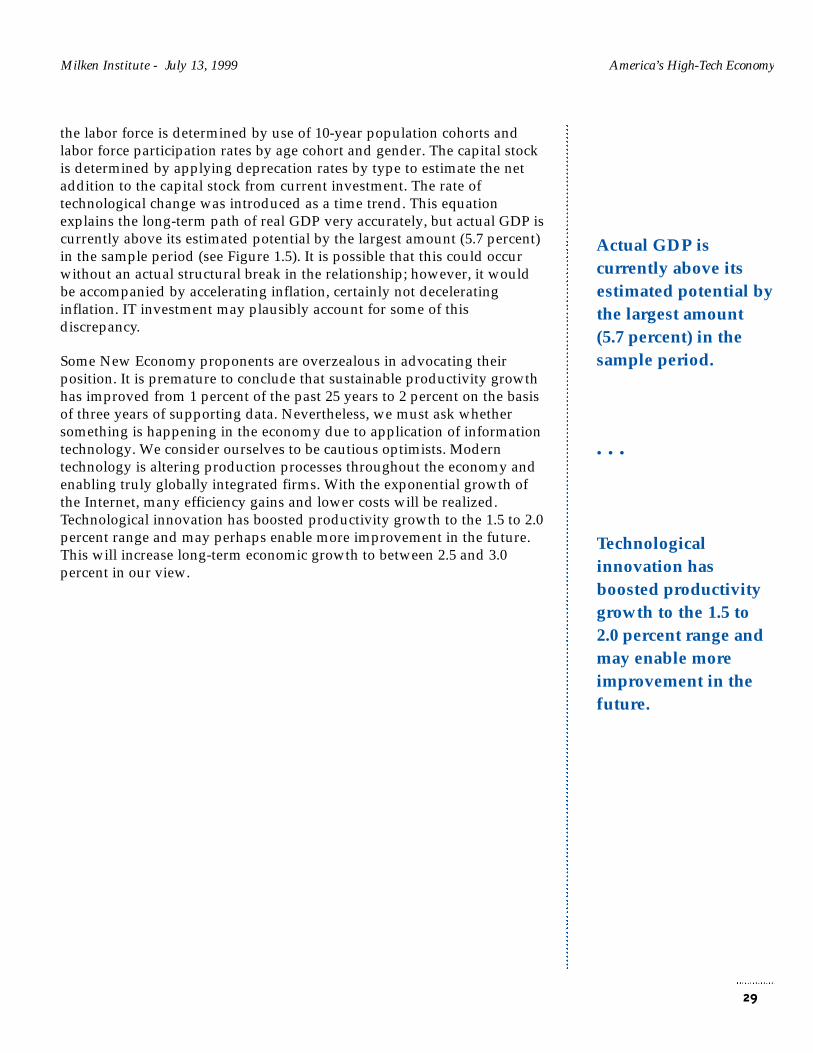
the labor force is determined by use of 10-year population cohorts andlabor force participation rates by age cohort and gender. The capital stockis determined by applying deprecation rates by type to estimate the netaddition to the capital stock from current investment. The rate oftechnological change was introduced as a time trend. This equationexplains the long-term path of real GDP very accurately, but actual GDP iscurrently above its estimated potential by the largest amount (5.7 percent)in the sample period (see Figure 1.5). It is possible that this could occurwithout an actual structural break in the relationship; however, it wouldbe accompanied by accelerating inflation, certainly not deceleratinginflation. IT investment may plausibly account for some of thisdiscrepancy.
Some New Economy proponents are overzealous in advocating theirposition. It is premature to conclude that sustainable productivity growthhas improved from 1 percent of the past 25 years to 2 percent on the basisof three years of supporting data. Nevertheless, we must ask whethersomething is happening in the economy due to application of informationtechnology. We consider ourselves to be cautious optimists. Moderntechnology is altering production processes throughout the economy andenabling truly globally integrated firms. With the exponential growth ofthe Internet, many efficiency gains and lower costs will be realized.Technological innovation has boosted productivity growth to the 1.5 to 2.0percent range and may perhaps enable more improvement in the future.This will increase long-term economic growth to between 2.5 and 3.0percent in our view.
Milken Institute - July 13, 1999 America’s High-Tech Economy
29
Actual GDP iscurrently above itsestimated potential bythe largest amount(5.7 percent) in thesample period.
• • •
Technologicalinnovation hasboosted productivitygrowth to the 1.5 to2.0 percent range andmay enable moreimprovement in thefuture.


SECTION 2
National High-Te c hIndustry Performance
The U.S. economy is a dynamic living and breathing organism, constantlyadapting itself to changes in its environmental conditions. Rapid epochs oftechnological change have occurred in the past, the industrial revolutionand electrification beginning in the 1990s to name two, but currently theU.S. economy arguably is undergoing the most dramatic technologydevelopments in its history. New technology industries should be amongthe top growth performers as they are diffused throughout the economy.History has demonstrated this to be the case. High-tech industries,however, are transforming the structure of the U.S. economy in anunparalleled dimension. Whether or not high-technology investments aresubstantially enhancing long-run economic growth, high-technologyindustries comprise a much larger share of the overall economy and, moreimportantly, account for a disproportionate share of economic growth inthe United States.
The Impact of Technology on Economic Growth
One of the most omnipresent influences of high technology has been inbusiness investment patterns. Information technology hardware hasaccounted for a growing share of total business investment across a broadarray of industries. In 1970, information processing equipment and relatedsectors represented 7 percent of real business equipment investment;however, last year it was responsible for over 50 percent of all capitalspending. Most of this surge has occurred since 1980 as displayed inFigure 2.1. From 1995 through 1998, growth in real business investment ininformation-processing equipment averaged 25 percent, directlyaccounting for nearly 27 percent of total economic growth. This is anarrow definition of information technology investment that does notinclude a sophisticated, digitally controlled machine tool.
The U.S. Bureau of Economic Analysis compiles a data set on net capitalstock by industry. As part of this data collection effort, the BEA producesan estimate of the net information-technology capital stock. One weaknessof this data set is that it is available only through 1994. Nevertheless, itdoes provide us with some perspective on IT equipment’s importancerelative to other equipment for many industries. In the
31
High-tech industriesare transforming thestructure of the U.S.economy in anunparalleleddimension.
• • •
From 1995 through1998, growth in realbusiness investmentin informationprocessing equipmentaveraged 25 percent,directly accountingfor nearly 27 percentof total economicgrowth.

telecommunications industry, IT equipment accounted for over 86 percentof the capital stock in 1994; this percentage is probably even larger today.In the insurance and security brokers industries, IT accounted for over 80percent of the capital stock. Industries such as motion pictures, wholesaletrade, legal services, and health services all have IT capital stocks thataccount for more than 50 percent of their total equipment stock.
Due to rapid technological advances in computers, semiconductors, andother electronic components, prices of information technology equipmenthave been falling at an accelerated rate over the past several years.Because of the tremendous improvement in processing performance, theBEA adopted a quality-adjusted price index for information processingequipment in 1996. IT equipment prices adjusted for quality fell anaverage of 3 percent per year from 1985 through 1994. Price declines in ITequipment have accelerated over the past few years, averaging 8 percentsince 1995. Prices fell by over 12 percent in 1998 for IT equipment.Declining prices in information processing equipment are restrainingoverall inflation in the U.S. economy. During 1997 and 1998, falling pricesfor IT equipment directly reduced overall inflation by over 1.0 percentagepoint. Technology is allowing cheaper production and processing acrossthe entire economy.
Rapid growth in demand for knowledge-intensive workers, and thelimited supply of workers with these skills, caused wages of IT workers torise relative to non–IT workers in the 1990s (see Figure 2.2). Lower
America’s High-Tech Economy Milken Institute - July 13, 1999
32
• • •
Technology isallowing cheaperproduction andprocessing across theentire economy.
Figure 2.1IT Dominates Capital Spending
Information Processing as a Percentage of Total Fixed Capital Spending
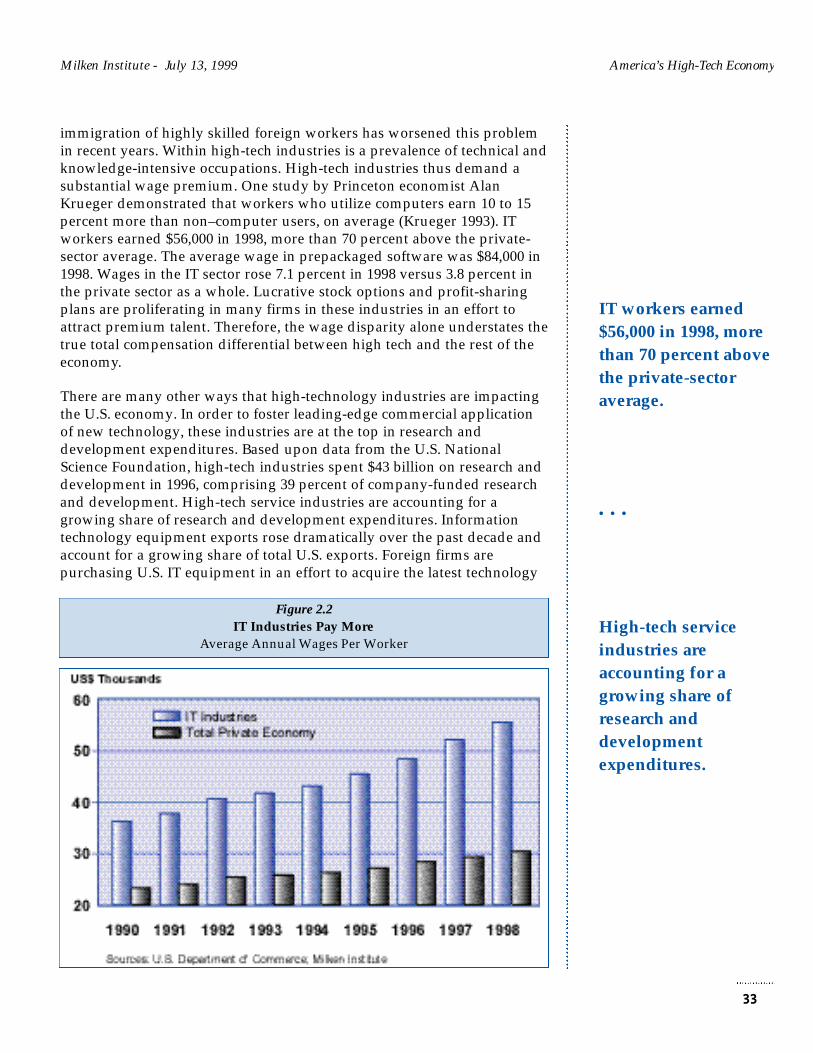
immigration of highly skilled foreign workers has worsened this problemin recent years. Within high-tech industries is a prevalence of technical andknowledge-intensive occupations. High-tech industries thus demand asubstantial wage premium. One study by Princeton economist AlanKrueger demonstrated that workers who utilize computers earn 10 to 15percent more than non–computer users, on average (Krueger 1993). ITworkers earned $56,000 in 1998, more than 70 percent above the private-sector average. The average wage in prepackaged software was $84,000 in1998. Wages in the IT sector rose 7.1 percent in 1998 versus 3.8 percent inthe private sector as a whole. Lucrative stock options and profit-sharingplans are proliferating in many firms in these industries in an effort toattract premium talent. Therefore, the wage disparity alone understates thetrue total compensation differential between high tech and the rest of theeconomy.
There are many other ways that high-technology industries are impactingthe U.S. economy. In order to foster leading-edge commercial applicationof new technology, these industries are at the top in research anddevelopment expenditures. Based upon data from the U.S. NationalScience Foundation, high-tech industries spent $43 billion on research anddevelopment in 1996, comprising 39 percent of company-funded researchand development. High-tech service industries are accounting for agrowing share of research and development expenditures. Informationtechnology equipment exports rose dramatically over the past decade andaccount for a growing share of total U.S. exports. Foreign firms arepurchasing U.S. IT equipment in an effort to acquire the latest technology
Milken Institute - July 13, 1999 America’s High-Tech Economy
33
IT workers earned$56,000 in 1998, morethan 70 percent abovethe private-sectoraverage.
• • •
High-tech serviceindustries areaccounting for agrowing share ofresearch anddevelopmentexpenditures.
Figure 2.2IT Industries Pay More
Average Annual Wages Per Worker
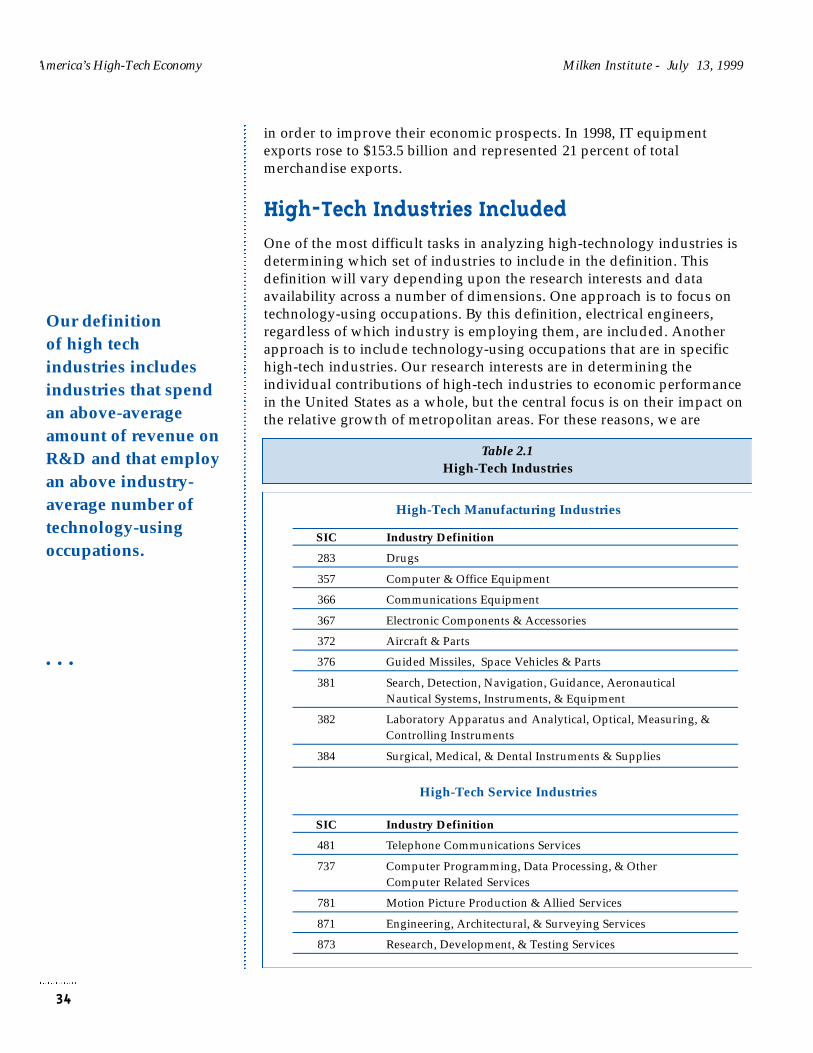
in order to improve their economic prospects. In 1998, IT equipmentexports rose to $153.5 billion and represented 21 percent of totalmerchandise exports.
High-Tech Industries Included
One of the most difficult tasks in analyzing high-technology industries isdetermining which set of industries to include in the definition. Thisdefinition will vary depending upon the research interests and dataavailability across a number of dimensions. One approach is to focus ontechnology-using occupations. By this definition, electrical engineers,regardless of which industry is employing them, are included. Anotherapproach is to include technology-using occupations that are in specifichigh-tech industries. Our research interests are in determining theindividual contributions of high-tech industries to economic performancein the United States as a whole, but the central focus is on their impact onthe relative growth of metropolitan areas. For these reasons, we are
America’s High-Tech Economy Milken Institute - July 13, 1999
34
Our definitionof high techindustries includesindustries that spendan above-averageamount of revenue onR&D and that employan above industry-average number oftechnology-usingoccupations.
• • •
Table 2.1High-Tech Industries
High-Tech Manufacturing Industries
SIC Industry Definition
283 Drugs
357 Computer & Office Equipment
366 Communications Equipment
367 Electronic Components & Accessories
372 Aircraft & Parts
376 Guided Missiles, Space Vehicles & Parts
381 Search, Detection, Navigation, Guidance, Aeronautical Nautical Systems, Instruments, & Equipment
382 Laboratory Apparatus and Analytical, Optical, Measuring, & Controlling Instruments
384 Surgical, Medical, & Dental Instruments & Supplies
High-Tech Service Industries
SIC Industry Definition
481 Telephone Communications Services
737 Computer Programming, Data Processing, & OtherComputer Related Services
781 Motion Picture Production & Allied Services
871 Engineering, Architectural, & Surveying Services
873 Research, Development, & Testing Services
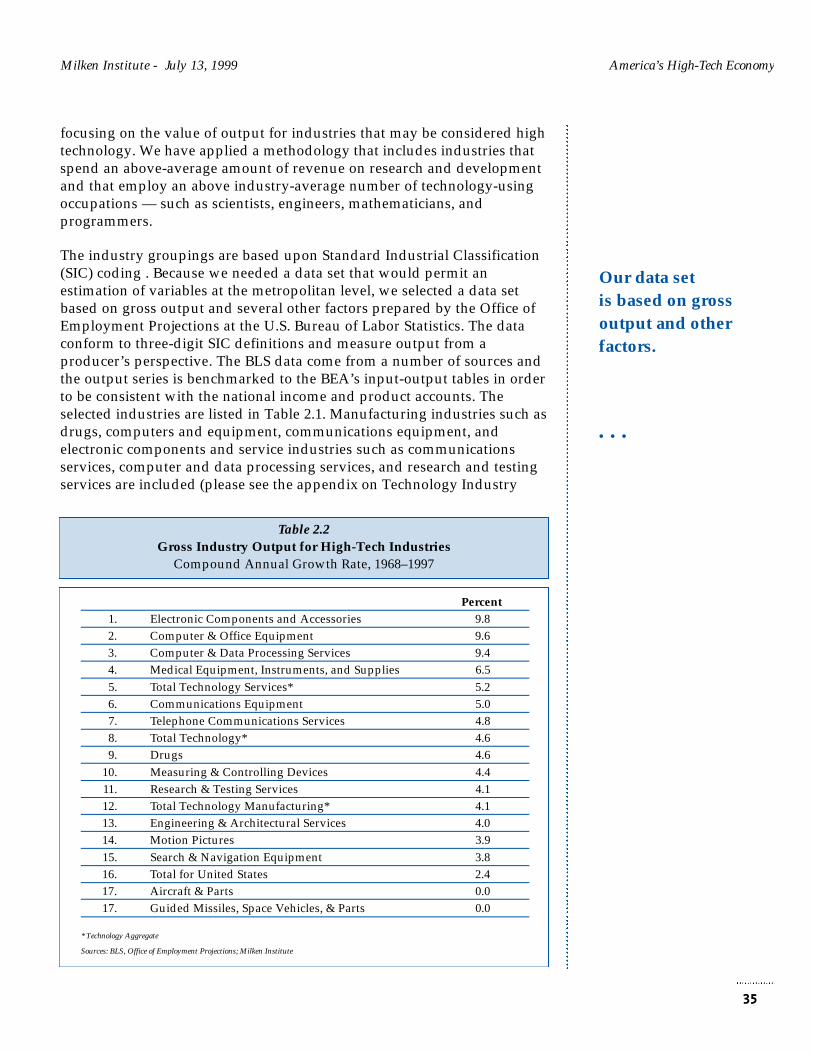
focusing on the value of output for industries that may be considered hightechnology. We have applied a methodology that includes industries thatspend an above-average amount of revenue on research and developmentand that employ an above industry-average number of technology-usingoccupations — such as scientists, engineers, mathematicians, andprogrammers.
The industry groupings are based upon Standard Industrial Classification(SIC) coding . Because we needed a data set that would permit anestimation of variables at the metropolitan level, we selected a data setbased on gross output and several other factors prepared by the Office ofEmployment Projections at the U.S. Bureau of Labor Statistics. The dataconform to three-digit SIC definitions and measure output from aproducer’s perspective. The BLS data come from a number of sources andthe output series is benchmarked to the BEA’s input-output tables in orderto be consistent with the national income and product accounts. Theselected industries are listed in Table 2.1. Manufacturing industries such asdrugs, computers and equipment, communications equipment, andelectronic components and service industries such as communicationsservices, computer and data processing services, and research and testingservices are included (please see the appendix on Technology Industry
Milken Institute - July 13, 1999 America’s High-Tech Economy
35
Our data setis based on grossoutput and otherfactors.
• • •
Table 2.2Gross Industry Output for High-Tech Industries
Compound Annual Growth Rate, 1968–1997
Percent
1. Electronic Components and Accessories 9.8
2. Computer & Office Equipment 9.6
3. Computer & Data Processing Services 9.4
4. Medical Equipment, Instruments, and Supplies 6.5
5. Total Technology Services* 5.2
6. Communications Equipment 5.0
7. Telephone Communications Services 4.8
8. Total Technology* 4.6
9. Drugs 4.6
10. Measuring & Controlling Devices 4.4
11. Research & Testing Services 4.1
12. Total Technology Manufacturing* 4.1
13. Engineering & Architectural Services 4.0
14. Motion Pictures 3.9
15. Search & Navigation Equipment 3.8
16. Total for United States 2.4
17. Aircraft & Parts 0.0
17. Guided Missiles, Space Vehicles, & Parts 0.0
* Technology Aggregate
Sources: BLS, Office of Employment Projections; Milken Institute

Profiles for a more thorough discussion).
These industries are among the fastest growing in the United States, asdisplayed in Table 2.2. The three industries with the most rapid growth —electronic components and accessories, computer and office equipment,and computer and data processing services — are all vital informationtechnology industries. Computers and peripheral equipment are at thecore of the information processing revolution. Rapid technologyimprovements in processing capabilities promise to sustain a high rate ofgrowth. Electronic components provide the building blocks for the entireinformation technology industry. These devices comprise the vitalcomponents in computers, telecommunications, instrumentation, medical,and transportation equipment. Computer and data processing servicesinclude software, data management consulting, programming consulting,computer integrated systems design, and Internet-related activity andoffer immense prospects for future growth. Communications equipment isundergoing a virtual explosion in demand for its products, led by satellitecommunications, wireless services, digital technology, and fiber optics. Ifcomputers are the vehicles by which we travel the informationsuperhighway, communications equipment is the pavement that links thesystem together. Telecommunication services is experiencing stellargrowth as the demand for wireless services and the Internet explodes.
Information technology also is playing an increasingly important role inkeeping us alive and in good health. Medical devices, used to performdiagnoses and complex and delicate surgeries such as “minimallyinvasive” procedures, employ many of the same technologies ascomputers. The discovery and commercial development of many life-saving medications from company-funded research labs have createdenormous demand for pharmaceuticals. Whether to stimulate infection-fighting cells or block a destructive internal process, bioengineeredproteins can be injected into the body to induce desired reactions.Biotechnology offers the potential to produce breakthrough treatments inthe future. Measuring and controlling devices are increasingly technical innature, including laboratory, scientific, and optical apparatuses used formedical and biotechnology research, environmental testing, andtelecommunications.
Research and testing services include physical and biological research,market research, clinical laboratory testing, and economic think tanks.Engineering services have suffered from defense cutbacks but have grownfaster than the aggregate economy over the past 30 years. One might notbelieve motion picture production and services to be a high-technologyindustry, but technology drives the industry in terms of production(special effects, digital photography, sound effects, and editing) and offersnew venues for film marketing (multimedia, such as video and computergames, DVD, and satellite). Search and navigation equipment includes
America’s High-Tech Economy Milken Institute - July 13, 1999
36
The three industrieswith the most rapidgrowth - electroniccomponents andaccessories, computerand office equipment,and computer anddata processingservices - are all vitalIT industries.
• • •
IT also is playing anincreasinglyimportant role inkeeping us alive andin good health.

radar and sonar systems, control equipment for aircraft and missiles, flightand navigation products, gyroscopes, and instruments. These devicesemploy the latest in computer and electronic hardware and software. Theaerospace industry is one of the oldest high-technology sectors in the U.S.economy. For the purposes of this study it includes aircraft and parts, aswell as guided missiles, space vehicles, and parts. Defense downsizing hasdevastated this industry, but it is rapidly reconfiguring itself forcommercial applications.
Over the past 20 years, these industries have almost doubled their share ofvalue of industry output in the United States to nearly 11 percent asdisplayed in Table 3. Technology services, at 5.8 percent of national output,is a larger sector than technology manufacturing.
Milken Institute - July 13, 1999 America’s High-Tech Economy
37
Table 2.3Gross Industry Output for High-Tech Industries
As a Percentage of Total, 1977, 1987, and 1997
Over the past20 years, high-techindustries havealmost doubledtheir share ofvalue of U.S.industry output tonearly 11 percent.
• • •
Rank Industry 1977 1987 1997
1. Total Technology 5.7 8.6 10.8
2. Total Technology Services 3.1 4.4 5.8
3. Total Technology Manufacturing 2.6 4.2 5.0
4. Telephone Communications Services 1.9 2.2 2.6
5. Computer & Data Processing Services 0.2 0.7 1.5
6. Electronic Components & Accessories 0.2 0.5 1.2
7. Aircraft & Parts 0.9 1.2 0.9
7. Guided Missiles, Space Vehicles, & Parts 0.9 1.2 0.9
8. Computer & Office Equipment 0.2 0.6 0.8
9. Engineering & Architectural Services 0.5 0.8 0.7
10. Communications Equipment 0.2 0.4 0.6
11. Drugs 0.5 0.5 0.6
12. Research & Testing Services 0.2 0.3 0.5
13. Medical Equipment, Instruments, & Supplies 0.2 0.3 0.4
14. Measuring & Controlling Devices 0.3 0.3 0.4
15. Motion Pictures 0.3 0.4 0.4
16. Search & Navigation Equipment 0.1 0.4 0.2
Sources: BLS, Office of Employment Projections; Milken Institute
Section 3Technology andMetropolitan EconomicPerformance
Technology is having a pervasive influence on the spatial distribution ofeconomic activity, and, more importantly, the relative rate of growthamong metropolitan areas within the United States. As prowess intechnological innovation and assimilation will likely determine the relativesuccess of nations in the future, it is already having profound impacts onthe regional economic landscape of the United States. Regional high-techclusters may be more important in fostering innovative economic activitythan the large multinational corporations that engage in promoting it(Audretsch 1998). Many multinationals used to view regions as merelylow-cost platforms for exporting. These same corporations now attempt togain a competitive advantage by investing in regions not only for lowercosts or for market potential but for their labor skills, supplier networks,and technologies.
At a time when globalization was thought to be the preeminent economictheme — promising to make us more similar — it is somewhatparadoxical that the study of the region is emerging as an important areafor understanding the success of nations. Perhaps the best indicator of theregion’s ascendance is that policymakers from Kuala Lumpur to Jerusalemare busy attempting to clone the next Silicon Valley. Geographic clusteringis becoming central to the creation and understanding of internationalcomparative advantage in an information-age economy.
Spatial distribution of economic activity is being impacted by technologythrough three primary channels.
First, metropolitan areas housing a disproportionate share of industriesor firms proficient at deploying information technology results incompetitive advantage; regions are experiencing superior economicperformance, ceteris paribus.
Second, information technology itself is allowing some metropolitanareas to exploit a key locational advantage, such as lower business
38
■
■
As prowess intechnologicalinnovation andassimilation willlikely determine therelative success ofnations in the future,it is already havingprofound impacts onthe regional economiclandscape of theUnited States.
• • •
Geographic clusteringis becoming central tothe creation andunderstanding ofinternationalcomparativeadvantage in aninformation-ageeconomy.

costs or some quality-of-life attribute, by permitting some forms ofeconomic activity to be performed from more remote locations.
Third, and central to our assertion, metropolitan areas that areexperiencing the highest rate of economic growth are those that havedemonstrated an ability to attract, nurture, and expand high-technology-based industry clusters.
In this section, we examine a number of important dimensions oftechnology industries as they relate to metropolitan economicdevelopment. The primary focus, however, will be to demonstrate howimportant geographic clustering of high-tech industries has become indetermining the relative economic success of metropolitan areas–particularly in the 1990s, as technology accounts for an increasingproportion of national output. We analyze data on over 300 metropolitanareas in the United States in order to determine which ones lead intechnology industry vertical density (concentration) and horizontal depth(breadth) and develop a composite measure of technology-productioncenters (Tech-Poles). Key questions we explore include:
What factors determine where high tech is concentrated and where thegreatest growth is occurring?
Is there a difference between high-tech manufacturing and services?
How large is the multiplier impact from technology industries inpromoting growth in local non-high-tech sectors?
Are agglomeration (centripetal) forces causing high-tech industries tobe more concentrated in a few metropolitan areas or are countervailingdisagglomeration (centrifugal) forces resulting in a dispersion of high-tech industries?
Economic Geography: TheoreticalUnderpinnings
Standard macroeconomic analysis of the U.S. economy would lead us tobelieve that economic activity occurs on a homogenous, continuousgeographic plane. The reality is quite different: space is central tounderstanding how our economy works. Without a spatial dimension,there is no economic activity. A remarkable feature of the geographicdistribution of economic activity in the United States is that the bulk of itis concentrated in a few clusters of metropolitan areas. In many respects,the U.S. economy is really a collection of regional economies linked to anational system. The structure of regional economies has more dis-similarities than similarities to that of the nation as a whole (DeVol 1997).
Milken Institute - July 13, 1999 America’s High-Tech Economy
39
■
■
■
■
■
We analyze over 300U.S. metropolitanareas to determinewhich ones lead intechnology industryvertical density(concentration) andhorizontal depth(breadth) and developa composite measureof technology-production centers(Tech-Poles).
• • •
Analysis ofspatial activitiesare centralto understandinghow our economyworks.

America’s High-Tech Economy Milken Institute - July 13, 1999
In the field of economic analysis, economic geography — or the study ofthe location of production in space — has been notably neglected. Much ofthe scant analysis of spatial economics goes back to German roots,particularly Johann von Thuenen, Walter Christaller, and Alfred Webber.These researchers attempted to address the question of how the economyfits into space. Standard location theory, or the study of what factorsdetermine where businesses locate, has been an important component ofthe literature. Central-place theory, or the idea that there should be ahierarchy of central places, with nested market areas, has had an influencein economic thought. Walter Isard championed a new field of regionalscience in the late 1950s by expanding on the work of the early Germans,but after some initial accomplishment, his influence on the literature haswaned. On balance, however, the field of economic geography canaccurately be said to have played a marginal part in the development ofeconomic theory over time.
Beginning in the late 1980s, interest in the spatial dimension of economicsbegan to reemerge. This resurgence has been termed “new economicgeography” and has important applications for the study of high-techindustry concentrations. In essence, new economic geography attempts toprovide the theoretical underpinnings to explain the agglomerationprocesses that result in highly specialized economic activity withinregions. A growing recognition of the similarities between the study ofinternational economics and regional (sub-national) economics helped inthe resurgence of interest in this area. Nevertheless, perhaps the mostcompelling reason for the rediscovery of economic geography is the richand vast empirical data laboratory that it furnishes. The central componentof this theory is based upon the Marshallian notion of increasing returns.
This renewed interest was assisted by the prominence of the economiststhat initiated much of the research in spatial economics. This list includesRobert Barro, Barry Eichengreen, Michael Porter, Oliver Blanchard,Lawrence Katz, and Paul Krugman. Krugman has devoted much of hisresearch over the past decade to new economic geography and deservesmuch of the credit for its popularization. He is seeking to construct atheory that explains spatial agglomeration of economic activity centeredon increasing returns and positive externalities (Krugman 1991). Porterhypothesizes that the extent of spatial clustering of industries within acountry is a principal determinant of that country’s internationalcompetitive position (Porter 1996). Porter is almost evangelical in hispromotion of the importance of economic geography in the discipline ofeconomics. Others have applied elements of “endogenous growth theory”that emphasize intra-regional transfers of human capital or localizedtechnology innovation as the key components of spatial concentration ofeconomic activity.
Krugman and other proponents of new economic geography mightdescribe the individual determinants of how specialized economic activity
40
New economicgeography attempts toprovide thetheoreticalunderpinnings toexplain the processesthat result in highlyspecialized economicactivity.
• • •
Paul Krugman is thebest-knownproponent andresearcher of neweconomic geography.

concentrates in space differently, but they would be in agreement on thecentral questions that must be answered: (1) Why is geographicagglomeration so commonly observed, and (2) What factors mightultimately limit the extent of this process and cause some degree ofconvergence in regional growth rates? Agglomeration results from theprocess of economic agents seeking geographic proximity with othersengaged in a similar or related activity. Increasing returns lead to somecompetitive or market advantage for the economic agents. Agglomerationeconomies result from localized external effects arising from three mainsources (labor-force pooling, supplier networks, and technologyspillovers.) Industry clusters are formed by these agglomerationeconomies. Industry clusters are geographic concentrations of sometimescompeting, sometimes collaborating firms, and the related supplier-network (DeVol 1997b).
An exogenous force (such as a government research center locatingnearby) may precipitate an endogenous process of agglomeration, asagents might then act to achieve agglomeration economies by closegeographic proximity. Since the location of particular activities may behighly flexible, an initial historical accident can have enduring “lock-in”effects that can sustain growth even when there is a major change in thefactors that might determine the optimal location of that activity. Theprocess (cumulative agglomeration phenomenon) is endogenous in thesense that once initiated, it develops the capacity to grow without furtherexternal propagation (Baumont, Beguin, and Huriot 1998). As additionalfirms enter a location, they make the location more attractive forsubsequent firms. In other words, agglomeration begets agglomerationthrough a snowball effect.
Industry clustering permits a pooled labor force of workers that possessindustry-specific skills. As labor migrates from other regions into a localgeographic cluster, it reinforces the initial advantages that the migration-destination enjoyed, stimulating further localized growth to the detrimentof the migrant-originating region. In a local high-velocity labor market,workers benefit by having the opportunity to move next door to anotherposition. Firms benefit by attracting local human capital that possesses theindustry-specific skills that they require and reduce the firms’ recruitingcosts.
Technology spillovers can result from a local high-velocity labor market.New process and product innovations within a cluster can be sharedthrough informal relationships. As labor moves between firms, labor-market network relationships are formed by ex-colleagues remaining ininformal contact. Sharing technology or knowledge might be perceived bysome member firms to be a negative externality at times, but it usuallygenerates a competitive advantage that helps keep the cluster’s membersahead of other competing geographic clusters. The formation of localized
Milken Institute - July 13, 1999 America’s High-Tech Economy
41
Industry clusters aregeographicconcentrations ofsometimes competing,sometimescollaborating firmsand the relatedsupplier-network.
• • •
Industry clusteringpermits a pooledlabor force of workersthat possess industry-specific skills.

supplier networks is key to success of industry clusters and to fosteringsustained agglomeration processes. As the breadth and depth of industrysuppliers and services increase, industry-specific efficiencies that reinforcethe initial strengths of the cluster are created. For example, as localfinancial services develop skills relevant to the unique characteristics ofthe industry cluster they serve, they enhance the cluster’s position relativeto others.
In summary, the centripetal forces causing agglomeration relate to thepresence of beneficial externalities — whether pecuniary or technological— between firms. In the case of technology industries, these externalitiesappear to play a particularly acute role in determining geographicconcentration. An important externality may stem from the initial presenceof a research facility that leads to other facilities being established in closegeographic proximity and, ultimately, to agglomeration of firms as theirresearch receives commercial application. A sizable local market creates so-called “backward linkages” — sites with preferential access to largemarkets for the production of goods that benefit from economies of scale(Holmes 1999). Large local markets provide enough critical mass tosupport a network of local suppliers, a highly specialized local labormarket, and benefit from deep information spillovers, termed “forwardlinkages.”
There are countervailing forces to agglomeration, otherwise all economicactivity would ultimately be pulled into a few immense geographicclusters. For example, financial services are highly concentrated in NewYork, London, and Hong Kong, but most financial-service activities aredelivered from locations outside of those three cities. Silicon Valley is thepreeminent high-technology industry cluster in the world but accounts forslightly less than 6 percent of the value of all U.S. high-tech output, asshown later.
America’s High-Tech Economy Milken Institute - July 13, 1999
42
“Externalities” play aparticularly acute rolein determining thegeographicconcentration oftechnology industries.
• • •
There arecountervailing forcesto agglomeration,otherwise alleconomic activitywould ultimately bepulled into a fewimmense geographicclusters.
Table 3.1Agglomeration and Dispersion Forces in Competition
Agglomeration or Centripetal Forces
• Labor-Force Pooling
• Supplier Networks
• Technology Spillovers
Dispersion or Centrifugal Forces
• Immobile Factors
• Supply-Side Factors
• Demand-Side Factors
Milken Institute - July 13, 1999 America’s High-Tech Economy
These countervailing or centrifugal forces (causing location dispersion)stem from product-market and factor-market competition (see Table 3.1).Immobile factors, including land, natural resources, and internationalmigration, oppose the forces of concentration of production (Krugman1998). A supply-side factor may play a role since some intermediate goodsand services must come from outside the region, and, if supplier costs arelower elsewhere, production might ultimately disperse to peripheralregions. Demand-side factors will influence the degree of dispersionforces, as some production must be close to where consumption isconcentrated. As economic activity concentrates, land rents are bid up.This forces firms to pay more for space and workers to pay more forhousing. If firms cannot increase productivity sufficiently to offset thehigher wages that workers will demand to locate there in order to offsethigher housing costs, labor will be less likely to migrate to the region. Thisalso creates a barrier to new firms entering the local market, and may leadto the optimal location being somewhere else.
Denser concentrations of economic activity can ultimately create negativeexternalities, such as congestion. Close proximity can increase productivityof economic agents, but as the frictional forces rise, they can initiate adispersion process. Congestion can arise in many forms, but a criticalmanifestation is in transportation. As congestion increases, the demand fortransportation services can grow nearly geometrically, ultimatelystretching beyond the capacity of the existing infrastructure. Even ifinfrastructure improvements can help alleviate the congestion, assumingthat the funding is available, the long lag between its planning andcompletion will not mitigate the congestion rapidly enough. Knowledgeworkers are highly remunerated; therefore, when their commuting timesincrease, the lost productivity and the opportunity cost of their time aresubstantial.
In economic geography, there are two main opposing forces at work: thosethat promote concentration and those that promote dispersion.Agglomeration forces cause economic activity to cluster because ofincreasing returns, and centrifugal (or congestion) forces push economicactivity outward. The opposing forces are in constant competitionattempting to determine a spatial equilibrium. The relative dominance ofone over the other creates a landscape of economic activity, but ultimatelyleads to the countervailing force exerting a stronger influence, causing thegeographic landscape to change.
Applications to High-Tech Industries
How does this translate into the real economic landscape of high-technology industries? The new economic-geography theory hasimportant applications for the development of high-technology industriesand their spatial patterns. Much of standard location theory is applicableto where high-tech industries locate and whether sufficient critical mass is
43
As economic activityconcentrates, landrents are bid up.
• • •
Denser concentrationsof economic activitycan ultimately createnegative externalities,such as congestion.
• • •
Agglomeration forcescause economicactivity to clusterbecause of increasingreturns, andcentrifugal (orcongestion) forcespush economicactivity outward.
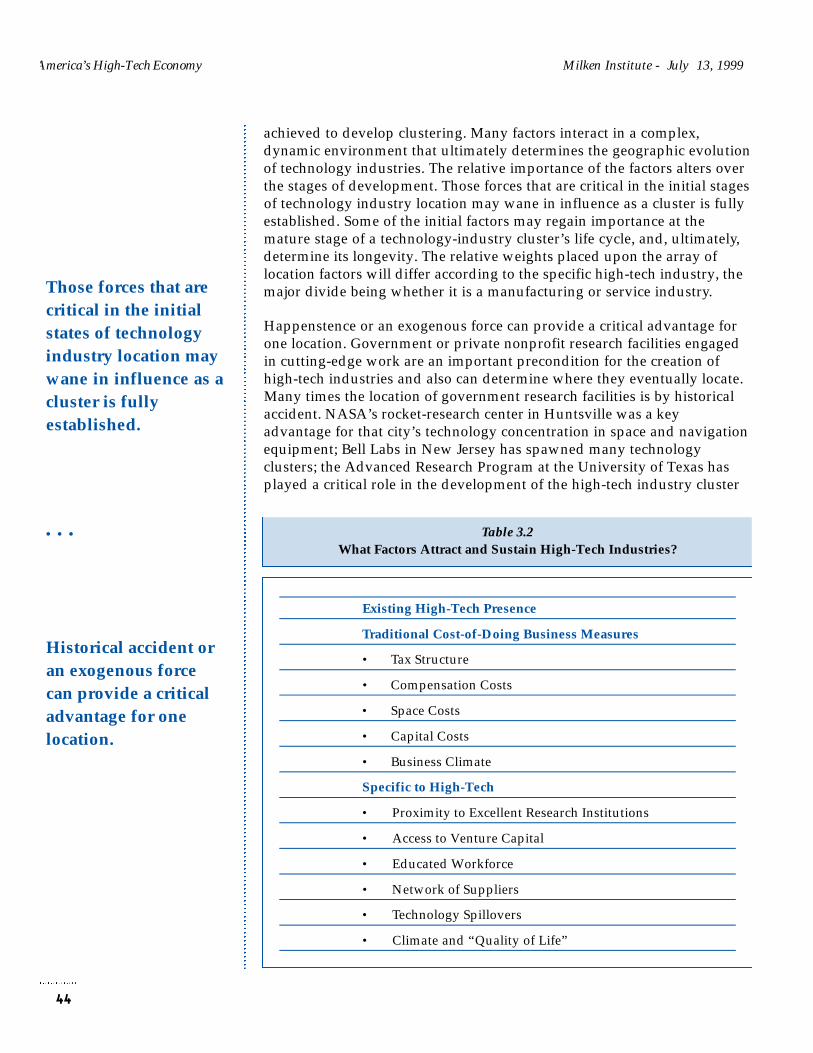
achieved to develop clustering. Many factors interact in a complex,dynamic environment that ultimately determines the geographic evolutionof technology industries. The relative importance of the factors alters overthe stages of development. Those forces that are critical in the initial stagesof technology industry location may wane in influence as a cluster is fullyestablished. Some of the initial factors may regain importance at themature stage of a technology-industry cluster’s life cycle, and, ultimately,determine its longevity. The relative weights placed upon the array oflocation factors will differ according to the specific high-tech industry, themajor divide being whether it is a manufacturing or service industry.
Happenstence or an exogenous force can provide a critical advantage forone location. Government or private nonprofit research facilities engagedin cutting-edge work are an important precondition for the creation ofhigh-tech industries and also can determine where they eventually locate.Many times the location of government research facilities is by historicalaccident. NASA’s rocket-research center in Huntsville was a keyadvantage for that city’s technology concentration in space and navigationequipment; Bell Labs in New Jersey has spawned many technologyclusters; the Advanced Research Program at the University of Texas hasplayed a critical role in the development of the high-tech industry cluster
America’s High-Tech Economy Milken Institute - July 13, 1999
44
Those forces that arecritical in the initialstates of technologyindustry location maywane in influence as acluster is fullyestablished.
• • •
Historical accident oran exogenous forcecan provide a criticaladvantage for onelocation.
Table 3.2What Factors Attract and Sustain High-Tech Industries?
Existing High-Tech Presence
Traditional Cost-of-Doing Business Measures
• Tax Structure
• Compensation Costs
• Space Costs
• Capital Costs
• Business Climate
Specific to High-Tech
• Proximity to Excellent Research Institutions
• Access to Venture Capital
• Educated Workforce
• Network of Suppliers
• Technology Spillovers
• Climate and “Quality of Life”

in Austin. Boston has the highest concentration of research centers in thecountry, and despite the relative decline in high-tech industries from themid-1980s to mid-1990s, it still is a major tech center. A skilled labor poolleft from a previous high-tech presence can be an impetus to a newsuccess. For example, Boston had a high concentration of engineers,scientists, and researchers left over from its past mini-computer and searchand navigation equipment strength. This knowledge-intensive humancapital is helping the region achieve mastery in new forms of informationtechnology and Internet-related activity. High-tech regional clusters suchas Silicon Valley and the Research Triangle owe much of their prosperityto research centers and universities. They enable cutting-edge research tobe combined with locally produced knowledge-intensive graduates toform new innovative firms.
Many of the traditional location factors that attract any industry are alsoimportant to high-tech firms. These factors are generally referred to as“cost-of-doing-business measures”: tax rates or incentives, compensationcosts, land and office space costs, energy costs, capital costs, and firms’perception of the general business climate. In a study of four-digitmanufacturing industries, Ellison and Glaeser (1999) determined thatindustry locations were related to resource or labor market advantagesbetween regions. They attribute approximately one-fifth of the observableconcentration of industries at the state level to natural or cost-of-doing-business measures. There are other factors that appear to be the mostimportant to high-tech firms’ location decisions. They include access to atrained/educated workforce, close proximity to excellent educationalfacilities and research institutions, an existing network of suppliers,availability of venture capital, climate and other quality-of-life factors, andthe general cost of living (see Table 3.2 for a summary listing). Maturehigh-tech manufacturers will place a higher weight on the traditional cost-of-doing-business measures than high-tech service firms in determiningtheir location. Silicon Valley is evolving toward a high-tech serviceindustry cluster and is flourishing despite very low scores on traditionalcost-of-doing-business measures.
One of factors critical to incubating and sustaining an entrepreneurial-based high-tech cluster is access to venture capital. This is generallyunderstood, but financial risk taking and venture capital’s importance arenot fully recognized in technology industries. Many new ideas forinnovative products or services can be funded and developed internally atexisting firms, but senior management may not share the same passion forthe innovator’s ideas. As these innovators attempt to embark on their ownpath, traditional sources of financing can be difficult to attain. This iswhere risk or venture capital plays a vital role. By financing new ideas,venture capitalists are instrumental catalysts in maintaining or enhancinga cluster’s dynamism: they provide the means for new firms to be formed.
Milken Institute - July 13, 1999 America’s High-Tech Economy
45
High-tech regionalclusters such asSilicon Valley and theResearch Triangle owemuch of theirprosperity to researchcenters anduniversities.
• • •
Factors mostimportant to high-techfirms’ locationdecisions are: accessto a trained / educatedworkforce, closeproximity to excellenteducational facilitiesand researchinstitutions, anetwork of suppliers,availability of venturecapital, and climateand other quality-of-life factors.
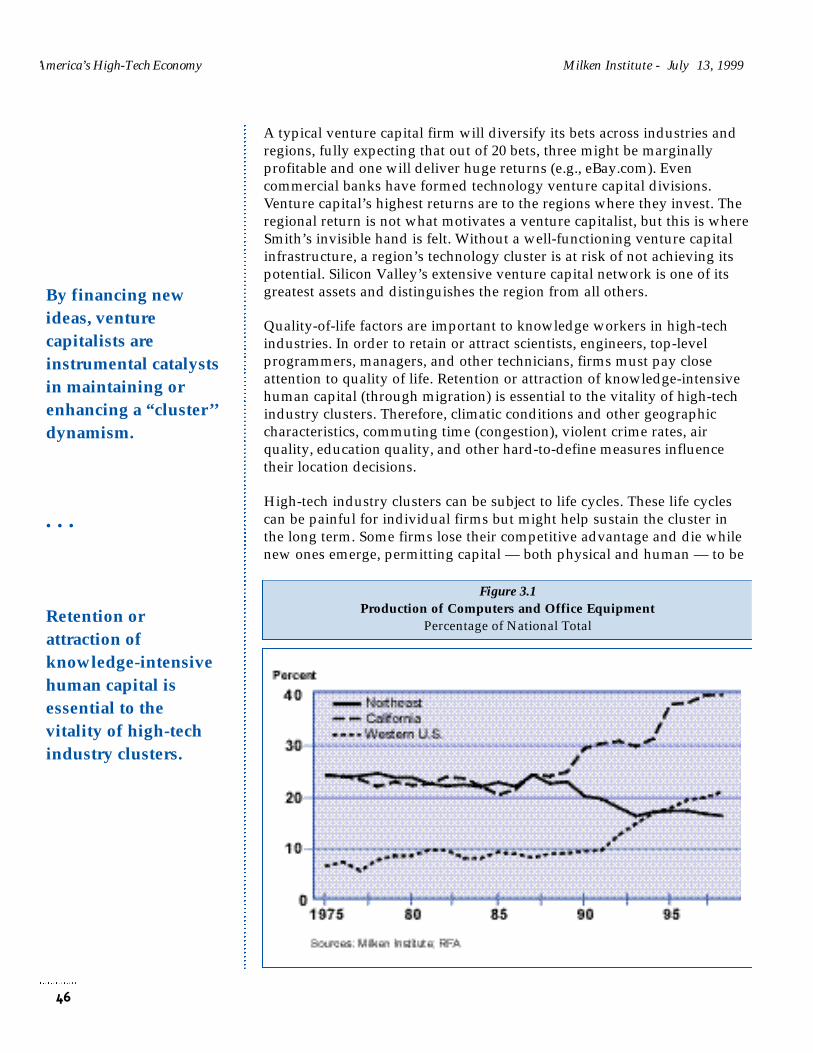
A typical venture capital firm will diversify its bets across industries andregions, fully expecting that out of 20 bets, three might be marginallyprofitable and one will deliver huge returns (e.g., eBay.com). Evencommercial banks have formed technology venture capital divisions.Venture capital’s highest returns are to the regions where they invest. Theregional return is not what motivates a venture capitalist, but this is whereSmith’s invisible hand is felt. Without a well-functioning venture capitalinfrastructure, a region’s technology cluster is at risk of not achieving itspotential. Silicon Valley’s extensive venture capital network is one of itsgreatest assets and distinguishes the region from all others.
Quality-of-life factors are important to knowledge workers in high-techindustries. In order to retain or attract scientists, engineers, top-levelprogrammers, managers, and other technicians, firms must pay closeattention to quality of life. Retention or attraction of knowledge-intensivehuman capital (through migration) is essential to the vitality of high-techindustry clusters. Therefore, climatic conditions and other geographiccharacteristics, commuting time (congestion), violent crime rates, airquality, education quality, and other hard-to-define measures influencetheir location decisions.
High-tech industry clusters can be subject to life cycles. These life cyclescan be painful for individual firms but might help sustain the cluster inthe long term. Some firms lose their competitive advantage and die whilenew ones emerge, permitting capital — both physical and human — to be
America’s High-Tech Economy Milken Institute - July 13, 1999
46
By financing newideas, venturecapitalists areinstrumental catalystsin maintaining orenhancing a “cluster’’dynamism.
• • •
Retention orattraction ofknowledge-intensivehuman capital isessential to thevitality of high-techindustry clusters.
Figure 3.1Production of Computers and Office Equipment
Percentage of National Total

Milken Institute - July 13, 1999 America’s High-Tech Economy
re-deployed. Turnover of personnel and businesses may even be a sign ofinnovation-driven vitality. Some clusters do not adjust quickly enough torapidly changing technology in their industry. Clusters can lose their spiritof innovation and not continue to invest in research and development.Overly centralized control can impede innovative activities in firms.Technological lock-in can preclude a cluster from developing new ideas.Prime examples of this are computer firms Digital, DEC, and IBM, alllocated in the Northeast. A type of intellectual lock-in caused them tofocus on mainframes and completely miss the shift to mini-computers (seeFigure 3.1). Some argue that Northeastern firms’ intellectual myopia was akey reason for the California dominance of the personal computerindustry. There is evidence that high-tech clusters, like individual firms,are susceptible to a form of technology lock-in, leading to their demise;new ideas may need new geography.
Some clusters develop a culture that is accepting of new ideas. Forexample, in her study of Silicon Valley, Analee Saxenian (1994) argues thata culture of greater integration and information exchange in the region iscentral to its exceptional innovative position relative to Boston’s Route 128corridor, or to any other region’s. An extended association of regionalinstitutions forms a key support infrastructure for a region’s high-techindustry clusters. Trade associations, local business organizations(including public-private partnerships), highly specialized consultingfirms, research institutions, and venture capital firms all contribute to theformal and informal flow of communications between economic agents.Various types of forums provide the opportunity for relationships to beestablished and maintained, technology ideas to be exchanged, and newenterprises chartered.
While these factors are listed as individual elements of the regional high-tech industry clustering and growth process, they interact and feed on oneanother to develop a dynamic and self-sustaining process of growth anddecline. The initial location advantages of a region may be thwarted by itseventual growth. Regional cost advantages that were the impetus to aconcentration of high-tech manufacturing industries may eventually bereversed by its rapid growth, diminishing the attractiveness of the region.A regional high-tech cluster that is dominated by a few large firms may bea key competitive advantage for a period of time, but lead to its relativedecline as technology changes and its large firms do not adapt. In theevolution of the spatial distribution of high-tech industry clusters,economic geography’s two main opposing forces, concentration anddispersion, are in constant competition.
High-Technology Production Spatial Patterns
Our analysis of the spatial distribution of high-tech production is basedupon the Census Bureau’s definition of Metropolitan Statistical Areas(MSAs). Industry clusters are not the geographic phenomenon of states
47
Turnover ofpersonnel andbusinesses mayeven be a signof innovation-drivenvitality.
• • •
Some clusters developa culture that isaccepting of newideas.
• • •
A regional high-techcluster that isdominated by a fewlarge firms may be akey competitiveadvantage for a timebut ultimately maylead to relativedecline if firms fail toadapt to changingtechnology.
but of more compact concentrations of geography. It can be argued that ananalysis of individual high-tech industry clusters should be based upon aspatial definition smaller than a metro area. In our opinion, metros are theappropriate geography for analyzing high-tech industry clusters becauseof the broader regional linkages that are essential for cluster vitality. State-level policies play an instrumental role in supporting high-techdevelopment at the metro level, but they are not the primary determinantsof a metro area’s success in fostering the formation of technology-industryclusters. Agglomeration economies result from spatial proximity ofeconomic agents, and this happens at the metro or sub-metro area. Despitethe attention that high-tech industry clusters receive in discussions ofmetro economies, there is a dearth of research analyzing them acrossmetros and on the economic stimulus they provide.
We have compiled a comprehensive data set on high-tech industries at themetropolitan level. It is based upon national information from the BLS andBEA and metro data created by Regional Financial Associates (RFA). Wehave augmented the RFA data by benchmarking it back to BLS’s andBEA’s national data set. The resulting data set includes nominal and real(1992 dollars) value of output, employment, and productivity, by industry,for 315 metropolitan areas. This allows us to examine high-tech industriesalong a number of dimensions. Most studies of high-tech industries at themetro level are based upon employment. This is clearly an importantcomponent but does not allow for variation in productivity within thesame industry between regions. When analyzing the economic stimulusthat high-tech industries provide, the value of output is a better overallindicator than employment.
Technology’s Importance in Metro GrowthPatterns
How important is geographic clustering of high-tech industries indetermining the relative success of metropolitan areas, and how can thisbe quantified? We assert that achievement in high-tech is a criticaldeterminant of overall growth patterns in metros. Because of the growingrole of high-tech industries in the national economy, metros that do notachieve some level of attainment in these critical industries will likelyexperience substandard economic growth in the future. We are notsuggesting that high-tech is the only development strategy to pursue, butit will be the key distinguishing feature of metropolitan vitality.
We have applied a series of econometric approaches to examine theimportance of high-tech industries in determining the relative economicgrowth of metros. We altered the time period and the dependent variablein the equations in order to check the robustness of the relationships. Ifsimilar results are observed after making these adjustments, we can be
America’s High-Tech Economy Milken Institute - July 13, 1999
48
Metros are moreappropriate than citiesfor analyzing techindustry clustersbecause of thebroader regionallinkages that areessential to high-technology clusters.
• • •
When analyzing theeconomic stimulusthat high-techindustries provide,the value of output isa better overallindicator thanemployment.
more confident that the relationships are both consistent and strong andare not spurious — in other words, we can ensure that the results aremeaningful and interpreted properly. The strength of the explanatorypower of high-tech industries in determining the relative economic growthof metros is high and the relationship is robust across most dimensions inthese regressions.
In regression analysis, one evaluates how closely changes in one or moreindependent variables can explain the movement of a dependent variable(the variable we are attempting to explain) and whether the relationship isstatistically significant. The first econometric approach we applied was apooled, time-series cross-sectional method. It is pooled in the sense thateconomic growth across 315 metros is evaluated over the period 1975 to1998. This yields over 7,200 observations on which to test the relationship.
POOLED, TIME-SERIES CROSS-SECTIONAL RESULTS
In the first specification, real non-high-tech gross metro output was thedependent variable. The first independent variable was real high-techmetro output. In the case of computers and office equipment andelectronic components, we used nominal output as the measure. We didthis in order to adjust for the rapidly declining price deflators due toactual price declines and quality adjustments that are reflected in thedeflator. When attempting to measure the impact of rising output in thesetwo industries on metro growth, nominal values are an appropriate base.The second independent variable was a trailing moving average of thehigh-tech industry location quotient for the metros. A location quotientmeasures the concentration of an industry in a geographic location relativeto its national concentration. For example, a high-tech industry locationquotient of 1.0 for a metro says that high-tech activity has the sameconcentration as the U.S. average. A location quotient of 2.0 means thathigh tech is twice as concentrated in a metro relative to the U.S. average,while a location quotient of 0.5 means that it is one-half as important. Theinclusion of the location quotient terms attempts to adjust for theimportance of high-tech industries to the local economy. Stated anotherway, if high-tech output is twice as important to one metro relative toanother, it should generate more relative economic growth.
In this specification we explained 44 percent of the change (R-Squared) innon-high-tech metro output on the basis of movement in high-tech outputand the relative importance of high-tech to a metro. If the dependentvariable is total gross metro output, the explained variation rises to 51percent. This overall relationship is highly significant in a statistical senseand would occur only one in 10 thousand times if it were not the truerelationship. Figure 3.2 shows the percentage change in the actual versuspredicted values from the equation for Dallas. When using otherindustries, such as wholesale trade or non-high-tech services, to explain
Milken Institute - July 13, 1999 America’s High-Tech Economy
49
The strength of theexplanatory power ofhigh-tech industriesin determining therelative economicgrowth of metros ishigh and therelationship is robust.
• • •
A location quotientmeasures theconcentration of anindustry in ageographic locationrelative to its nationalconcentration.
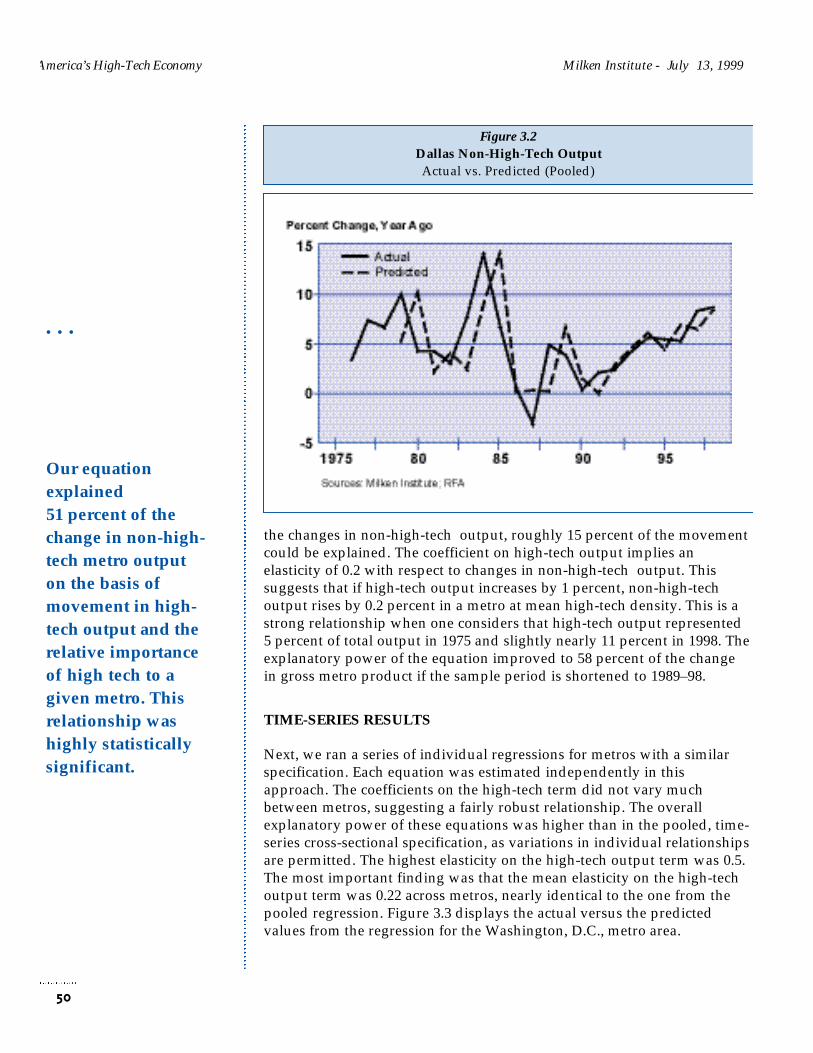
the changes in non-high-tech output, roughly 15 percent of the movementcould be explained. The coefficient on high-tech output implies anelasticity of 0.2 with respect to changes in non-high-tech output. Thissuggests that if high-tech output increases by 1 percent, non-high-techoutput rises by 0.2 percent in a metro at mean high-tech density. This is astrong relationship when one considers that high-tech output represented5 percent of total output in 1975 and slightly nearly 11 percent in 1998. Theexplanatory power of the equation improved to 58 percent of the changein gross metro product if the sample period is shortened to 1989–98.
TIME-SERIES RESULTS
Next, we ran a series of individual regressions for metros with a similarspecification. Each equation was estimated independently in thisapproach. The coefficients on the high-tech term did not vary muchbetween metros, suggesting a fairly robust relationship. The overallexplanatory power of these equations was higher than in the pooled, time-series cross-sectional specification, as variations in individual relationshipsare permitted. The highest elasticity on the high-tech output term was 0.5.The most important finding was that the mean elasticity on the high-techoutput term was 0.22 across metros, nearly identical to the one from thepooled regression. Figure 3.3 displays the actual versus the predictedvalues from the regression for the Washington, D.C., metro area.
America’s High-Tech Economy Milken Institute - July 13, 1999
50
• • •
Our equationexplained51 percent of thechange in non-high-tech metro outputon the basis ofmovement in high-tech output and therelative importanceof high tech to agiven metro. Thisrelationship washighly statisticallysignificant.
Figure 3.2Dallas Non-High-Tech OutputActual vs. Predicted (Pooled)

CROSS-SECTIONAL RESULTS
The last specification employed was a cross-sectional technique. By cross-sectional we mean that it is not based on a historical time series. Thismethod attempts to explain economic performance between metros. Wecreated a series of metro growth indices relative to the national growthpattern. In the case of high-tech output, the relative metro growth index iscreated by comparing growth in metros relative to the national averagefrom 1990 to 1998. We chose the 1990s as the period of analysis becausethis is the period during which high tech became vital in determiningperformance between metros. For example, if a metro matched thenational growth in high-tech output between 1990 and 1998, it would havea value of 100. If its relative high-tech output growth index was 120, thenit exceeded national performance by 20 percent, but if its value was 80, itsgrowth was 20 percent less than the national average. The same approachwas applied to total gross metro output and non-high-tech metro output.In many respects, the interpretations of the results from this approach aremore straightforward than from the first two that we utilized, as well ascomputationally less demanding.
We ran a series of regressions by altering the dependent variable and thetime period for which the relative growth indices were calculated. In thefirst equation, the dependent variable was the relative total real-outputgrowth index for the 315 metros. The first explanatory variable was therelative metro high-tech output growth index. The second explanatory
Milken Institute - July 13, 1999 America’s High-Tech Economy
51
The most importantfinding was that themean elasticity on thehigh-tech output termwas 0.22 acrossmetros.
• • •
In the case of high-tech output, therelative metro growthindex is created bycomparing growth inmetros relative to thenational average from1990 to 1998.
Figure 3.3Washington D.C. Non-High-Tech Output
Actual vs. Predicted (Time Series)
variable was the initial high-tech output industry location quotient in 1990.It is important to standardize the relationship by the concentration of high-tech industries in a metro because if a metro had a low initial high-techdensity, a given percentage gain in high-tech growth would not providethe same incremental stimulus as in a metro with a large initial high-techdensity.
Based upon this equation, we found that 65 percent of the total outputgrowth differential between metros was explained on the basis of theirrelative growth in high-tech and the initial high-tech density. Thisrelationship is very strong; it would happen only in one out of tenthousand times if it were not the true relationship. Figure 3.4 displays theactual versus predicted values from this equation. The x-axis shows the315 metros ranked in descending order by the actual values of their totalrelative output growth index. The y-axis compares the actual relative totalindustry output growth index with that predicted from the equation. Thischart visually depicts the close relationship between high-tech growth andrelative economic performance in the 1990s. When the dependent variablewas non-high-tech output rather than total output, the explanatory powerfell to 54 percent of the variation between metros.
The equation results indicate that at mean high-tech density, a high-techoutput growth rate 5 percentage points above the U.S. average translatesinto a 1.0 percentage point advantage in total real output growth relativeto the U.S. average. The interpretation of this result is nearly identical tothe first two approaches, highlighting its robustness. The coefficient on the
America’s High-Tech Economy Milken Institute - July 13, 1999
52
We found that 65percent of the totaloutput growthdifferential betweenmetros was explainedon the basis of theirrelative growth inhigh-tech and theinitial high-techdensity.
• • •
The x-axis shows the315 metros ranked indescending order bythe actual values oftheir total relativeoutput growth index.
Figure 3.4Metro Growth Explained by High-Tech
Actual vs. Predicted (Cross-sectional)
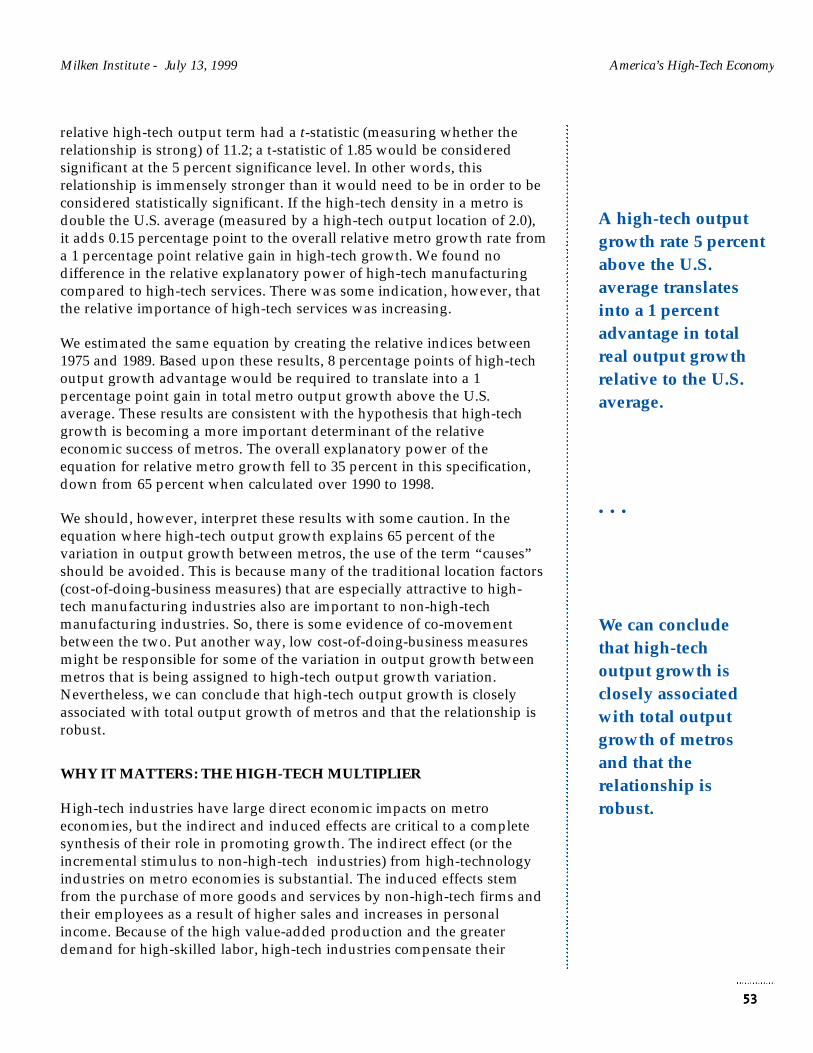
Milken Institute - July 13, 1999 America’s High-Tech Economy
relative high-tech output term had a t-statistic (measuring whether therelationship is strong) of 11.2; a t-statistic of 1.85 would be consideredsignificant at the 5 percent significance level. In other words, thisrelationship is immensely stronger than it would need to be in order to beconsidered statistically significant. If the high-tech density in a metro isdouble the U.S. average (measured by a high-tech output location of 2.0),it adds 0.15 percentage point to the overall relative metro growth rate froma 1 percentage point relative gain in high-tech growth. We found nodifference in the relative explanatory power of high-tech manufacturingcompared to high-tech services. There was some indication, however, thatthe relative importance of high-tech services was increasing.
We estimated the same equation by creating the relative indices between1975 and 1989. Based upon these results, 8 percentage points of high-techoutput growth advantage would be required to translate into a 1percentage point gain in total metro output growth above the U.S.average. These results are consistent with the hypothesis that high-techgrowth is becoming a more important determinant of the relativeeconomic success of metros. The overall explanatory power of theequation for relative metro growth fell to 35 percent in this specification,down from 65 percent when calculated over 1990 to 1998.
We should, however, interpret these results with some caution. In theequation where high-tech output growth explains 65 percent of thevariation in output growth between metros, the use of the term “causes”should be avoided. This is because many of the traditional location factors(cost-of-doing-business measures) that are especially attractive to high-tech manufacturing industries also are important to non-high-techmanufacturing industries. So, there is some evidence of co-movementbetween the two. Put another way, low cost-of-doing-business measuresmight be responsible for some of the variation in output growth betweenmetros that is being assigned to high-tech output growth variation.Nevertheless, we can conclude that high-tech output growth is closelyassociated with total output growth of metros and that the relationship isrobust.
WHY IT MATTERS: THE HIGH-TECH MULTIPLIER
High-tech industries have large direct economic impacts on metroeconomies, but the indirect and induced effects are critical to a completesynthesis of their role in promoting growth. The indirect effect (or theincremental stimulus to non-high-tech industries) from high-technologyindustries on metro economies is substantial. The induced effects stemfrom the purchase of more goods and services by non-high-tech firms andtheir employees as a result of higher sales and increases in personalincome. Because of the high value-added production and the greaterdemand for high-skilled labor, high-tech industries compensate their
53
A high-tech outputgrowth rate 5 percentabove the U.S.average translatesinto a 1 percentadvantage in totalreal output growthrelative to the U.S.average.
• • •
We can concludethat high-techoutput growth isclosely associatedwith total outputgrowth of metrosand that therelationship isrobust.

America’s High-Tech Economy Milken Institute - July 13, 1999
employees well. Additionally, technology firms use stock options moreextensively in their total compensation mix, which can result in evenclerical staff becoming millionaires!
As high-technology industries grow and clusters develop, a vast supplier-network infrastructure is formed. The demand for locally producedprofessional services expands. The demand for legal services withexpertise in technology-specific industries rises. Other professionalservices such as accounting, auditing, engineering and testing services,management consulting, and finance grows in the local economy. Theseare highly compensated occupations that further stimulate localeconomies. Other services benefit, including telephone communications,air transportation, hotel and other related travel services, and evenelectricity services. High-tech manufacturing firms foster gains inmanufacturers that supply inputs to them. Many high-tech services suchas software development have larger multipliers than high-techmanufacturing because more of their inputs are purchased locally andlabor represents a greater share of their total purchased inputs. High-techservice firms do not purchase components from non-local sources, eitherdomestic or foreign; therefore, there is less linkage external to the metroeconomy. Another important channel through which high-tech industriespromote growth locally is the in-migration of knowledge workers, otherlabor, and their families.
The impact on construction markets can be large. Residential constructionis stimulated from high rates of in-migration resulting in greater buildingof single-family homes, condominiums, and apartments. The constructionof new high-tech manufacturing facilities is a massive investment. A newsemiconductor plant can cost $3 billion to construct. High-tech plantsunder construction purchase large quantities of local building materialsand provide employment to many construction workers. High-tech servicefirms can absorb an immense amount of office space leading to a declinein vacancy rates and, ultimately, new construction. Retail trade benefitsindirectly from high-tech growth because of the greater purchasing powerof tech workers and the stimulus to personal income throughout the metroarea.
These impacts are dynamic and can lead to a virtuous circle of positivefeedback on the local economy. It may be impossible to trace all of thelinkages throughout a metro economy, but the total multiplier can be verylarge. We believe that the multiplier impact stemming from high-technology industry clusters is a key determinant of the relative metroeconomic growth differential observed in the United States.
High-Technology Spatial Concentration
The extent of high-technology industry concentration in metros and theranking of metros by various categories can be examined using many
54
As high-techindustries grow andclusters develop,a vast supplier-networkinfrastructureis formed.
• • •
The impacts ofhigh-techclustering aredynamic andcan lead to virtuous circleof positive feedbackon the localeconomy.

methods. We approach the issue from several perspectives. First, weanalyze metro high-tech concentration, or vertical density, by the relativesize of high tech in the local economy compared to the U.S. average. Asecond method examines what proportion high-tech output in a metrorepresents of the total for the nation. This represents a measure ofhorizontal depth or breadth of high-tech activity. Lastly, we compile acomposite measure of technology production centers that incorporates thetwo components. From this, we analyze the metros that are the leading“Tech-Poles.”
The concentration of high-tech industry output in metros is based uponlocation quotients (LQ). Location quotients compare the value of high-techoutput as a share of total output in a metro relative to the same calculationfor the United States. Location quotients are an effective method fordisplaying the relative importance of an industry to a metro economy. Thedisadvantage of location quotients is that they do not adjust for the size ofa metro area relative to others. For example, in a small metro, one or twolarge high-tech manufacturing plants can yield a large location quotient.Analysis by location quotient showed a high degree of spatial disparity inU.S. high-tech output concentration. In a study of agglomeration in capitalgoods industries, Black and Henderson (1999) found that high-tech capitalgoods industries were the most concentrated of any in the United StatesThere is evidence, however, that high-tech production activity is becomingmore geographically dispersed.
Table 3.3 lists the top 50 out of 315 metros on the basis of the high-techoutput location quotient for 1998 along with some other key measures.Tables 3.4 and 3.5 break out high-tech manufacturing and servicesseparately, and Table 3.6 displays the top 10 metros for each of the 14 high-tech industries. At the top of Table 3.3 is a somewhat surprising metro,Rochester, MN, with a high-tech LQ of 5.6, indicating that high tech is 5.6times more concentrated than the U.S. average. Rochester is first mainlybecause of its computer and office equipment, with an LQ that is almostoff the scale at 143.0. This is due to the presence of IBM and data-storagedevices manufacturer Western Digital. In total, 6,900 workers areemployed in the industry locally. Rochester also has a medical research-related cluster centered around the Mayo Clinic.
The preeminent high-tech cluster in the world, Silicon Valley, places SanJose second on the list, with an LQ of 4.1. High-tech output represents 37.2percent of San Jose’s gross metro product. It is the breadth of technologyindustries that distinguishes San Jose. It contains 10 high-tech industrieswith LQs over 1.0, of a possible 14 high-tech industries. Albuquerque, NM,is next on the list with a high-tech LQ of 3.6. Electronics firms such as Intelhave built new facilities there, resulting in an LQ of 37.6 for the industry inthe metro. Sandia National Laboratory has helped foster this expansion asit works closely with a consortium of electronic firms. This is the main
Milken Institute - July 13, 1999 America’s High-Tech Economy
55
Locationquotientsdisplay the relativeimportanceof an industryto a metroeconomy.
• • •
Rochester, MN,has the highestlocationquotient (5.6)of all metrosstudied.
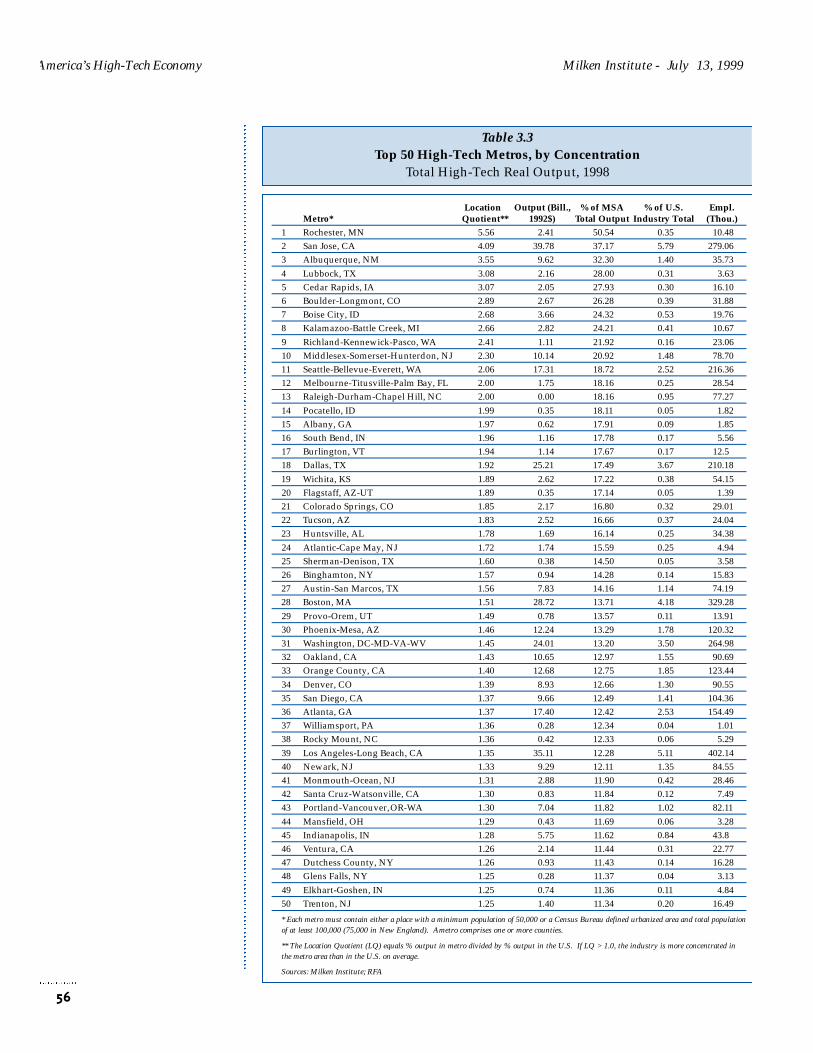
America’s High-Tech Economy Milken Institute - July 13, 1999
56
Table 3.3Top 50 High-Tech Metros, by Concentration
Total High-Tech Real Output, 1998
Location Output (Bill., % of MSA % of U.S. Empl.Metro* Quotient** 1992$) Total Output Industry Total (Thou.)
1 Rochester, MN 5.56 2.41 50.54 0.35 10.48
2 San Jose, CA 4.09 39.78 37.17 5.79 279.06
3 Albuquerque, NM 3.55 9.62 32.30 1.40 35.73
4 Lubbock, TX 3.08 2.16 28.00 0.31 3.63
5 Cedar Rapids, IA 3.07 2.05 27.93 0.30 16.10
6 Boulder-Longmont, CO 2.89 2.67 26.28 0.39 31.88
7 Boise City, ID 2.68 3.66 24.32 0.53 19.76
8 Kalamazoo-Battle Creek, MI 2.66 2.82 24.21 0.41 10.67
9 Richland-Kennewick-Pasco, WA 2.41 1.11 21.92 0.16 23.06
10 Middlesex-Somerset-Hunterdon, NJ 2.30 10.14 20.92 1.48 78.70
11 Seattle-Bellevue-Everett, WA 2.06 17.31 18.72 2.52 216.36
12 Melbourne-Titusville-Palm Bay, FL 2.00 1.75 18.16 0.25 28.54
13 Raleigh-Durham-Chapel Hill, NC 2.00 0.00 18.16 0.95 77.27
14 Pocatello, ID 1.99 0.35 18.11 0.05 1.82
15 Albany, GA 1.97 0.62 17.91 0.09 1.85
16 South Bend, IN 1.96 1.16 17.78 0.17 5.56
17 Burlington, VT 1.94 1.14 17.67 0.17 12.5
18 Dallas, TX 1.92 25.21 17.49 3.67 210.18
19 Wichita, KS 1.89 2.62 17.22 0.38 54.15
20 Flagstaff, AZ-UT 1.89 0.35 17.14 0.05 1.39
21 Colorado Springs, CO 1.85 2.17 16.80 0.32 29.01
22 Tucson, AZ 1.83 2.52 16.66 0.37 24.04
23 Huntsville, AL 1.78 1.69 16.14 0.25 34.38
24 Atlantic-Cape May, NJ 1.72 1.74 15.59 0.25 4.94
25 Sherman-Denison, TX 1.60 0.38 14.50 0.05 3.58
26 Binghamton, NY 1.57 0.94 14.28 0.14 15.83
27 Austin-San Marcos, TX 1.56 7.83 14.16 1.14 74.19
28 Boston, MA 1.51 28.72 13.71 4.18 329.28
29 Provo-Orem, UT 1.49 0.78 13.57 0.11 13.91
30 Phoenix-Mesa, AZ 1.46 12.24 13.29 1.78 120.32
31 Washington, DC-MD-VA-WV 1.45 24.01 13.20 3.50 264.98
32 Oakland, CA 1.43 10.65 12.97 1.55 90.69
33 Orange County, CA 1.40 12.68 12.75 1.85 123.44
34 Denver, CO 1.39 8.93 12.66 1.30 90.55
35 San Diego, CA 1.37 9.66 12.49 1.41 104.36
36 Atlanta, GA 1.37 17.40 12.42 2.53 154.49
37 Williamsport, PA 1.36 0.28 12.34 0.04 1.01
38 Rocky Mount, NC 1.36 0.42 12.33 0.06 5.29
39 Los Angeles-Long Beach, CA 1.35 35.11 12.28 5.11 402.14
40 Newark, NJ 1.33 9.29 12.11 1.35 84.55
41 Monmouth-Ocean, NJ 1.31 2.88 11.90 0.42 28.46
42 Santa Cruz-Watsonville, CA 1.30 0.83 11.84 0.12 7.49
43 Portland-Vancouver, OR-WA 1.30 7.04 11.82 1.02 82.11
44 Mansfield, OH 1.29 0.43 11.69 0.06 3.28
45 Indianapolis, IN 1.28 5.75 11.62 0.84 43.8
46 Ventura, CA 1.26 2.14 11.44 0.31 22.77
47 Dutchess County, NY 1.26 0.93 11.43 0.14 16.28
48 Glens Falls, NY 1.25 0.28 11.37 0.04 3.13
49 Elkhart-Goshen, IN 1.25 0.74 11.36 0.11 4.84
50 Trenton, NJ 1.25 1.40 11.34 0.20 16.49
* Each metro must contain either a place with a minimum population of 50,000 or a Census Bureau defined urbanized area and total populationof at least 100,000 (75,000 in New England). Ametro comprises one or more counties.
** The Location Quotient (LQ) equals % output in metro divided by % output in the U.S. If LQ > 1.0, the industry is more concentrated inthe metro area than in the U.S. on average.
Sources: Milken Institute; RFA
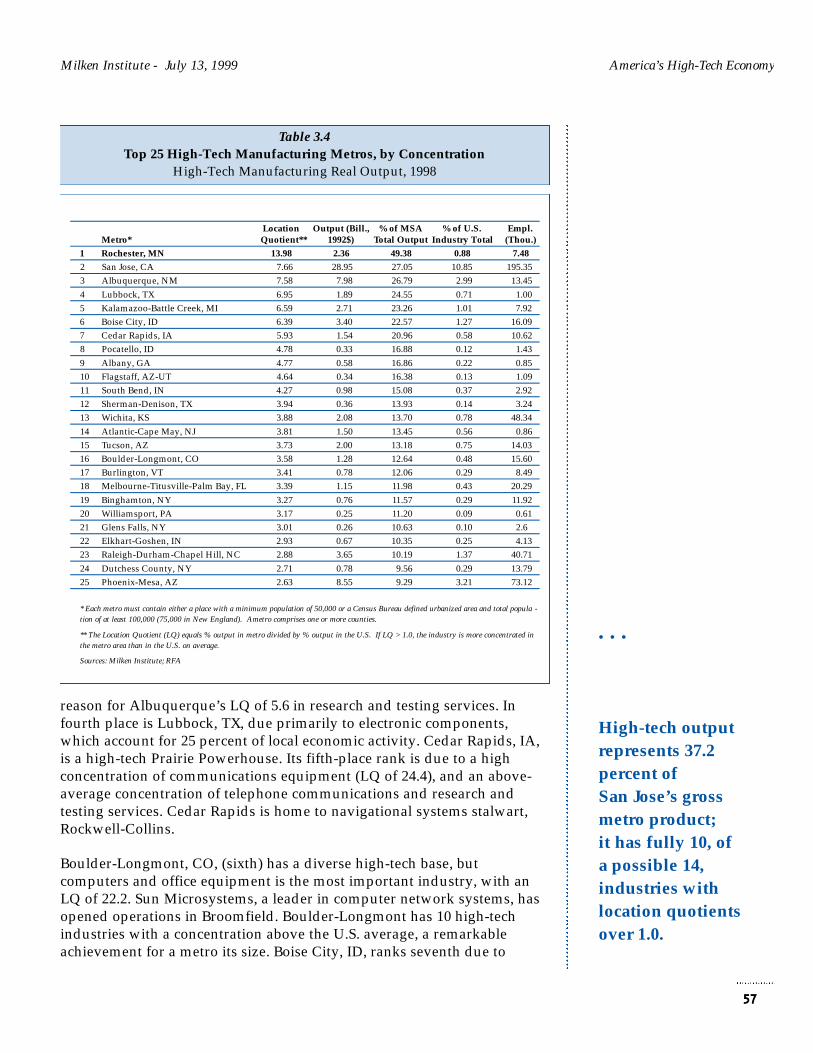
reason for Albuquerque’s LQ of 5.6 in research and testing services. Infourth place is Lubbock, TX, due primarily to electronic components,which account for 25 percent of local economic activity. Cedar Rapids, IA,is a high-tech Prairie Powerhouse. Its fifth-place rank is due to a highconcentration of communications equipment (LQ of 24.4), and an above-average concentration of telephone communications and research andtesting services. Cedar Rapids is home to navigational systems stalwart,Rockwell-Collins.
Boulder-Longmont, CO, (sixth) has a diverse high-tech base, butcomputers and office equipment is the most important industry, with anLQ of 22.2. Sun Microsystems, a leader in computer network systems, hasopened operations in Broomfield. Boulder-Longmont has 10 high-techindustries with a concentration above the U.S. average, a remarkableachievement for a metro its size. Boise City, ID, ranks seventh due to
Milken Institute - July 13, 1999 America’s High-Tech Economy
57
• • •
High-tech outputrepresents 37.2percent ofSan Jose’s grossmetro product;it has fully 10, ofa possible 14,industries withlocation quotientsover 1.0.
Table 3.4Top 25 High-Tech Manufacturing Metros, by Concentration
High-Tech Manufacturing Real Output, 1998
Location Output (Bill., % of MSA % of U.S. Empl.Metro* Quotient** 1992$) Total Output Industry Total (Thou.)
1 Rochester, MN 13.98 2.36 49.38 0.88 7.48
2 San Jose, CA 7.66 28.95 27.05 10.85 195.35
3 Albuquerque, NM 7.58 7.98 26.79 2.99 13.45
4 Lubbock, TX 6.95 1.89 24.55 0.71 1.00
5 Kalamazoo-Battle Creek, MI 6.59 2.71 23.26 1.01 7.92
6 Boise City, ID 6.39 3.40 22.57 1.27 16.09
7 Cedar Rapids, IA 5.93 1.54 20.96 0.58 10.62
8 Pocatello, ID 4.78 0.33 16.88 0.12 1.43
9 Albany, GA 4.77 0.58 16.86 0.22 0.85
10 Flagstaff, AZ-UT 4.64 0.34 16.38 0.13 1.09
11 South Bend, IN 4.27 0.98 15.08 0.37 2.92
12 Sherman-Denison, TX 3.94 0.36 13.93 0.14 3.24
13 Wichita, KS 3.88 2.08 13.70 0.78 48.34
14 Atlantic-Cape May, NJ 3.81 1.50 13.45 0.56 0.86
15 Tucson, AZ 3.73 2.00 13.18 0.75 14.03
16 Boulder-Longmont, CO 3.58 1.28 12.64 0.48 15.60
17 Burlington, VT 3.41 0.78 12.06 0.29 8.49
18 Melbourne-Titusville-Palm Bay, FL 3.39 1.15 11.98 0.43 20.29
19 Binghamton, NY 3.27 0.76 11.57 0.29 11.92
20 Williamsport, PA 3.17 0.25 11.20 0.09 0.61
21 Glens Falls, NY 3.01 0.26 10.63 0.10 2.6
22 Elkhart-Goshen, IN 2.93 0.67 10.35 0.25 4.13
23 Raleigh-Durham-Chapel Hill, NC 2.88 3.65 10.19 1.37 40.71
24 Dutchess County, NY 2.71 0.78 9.56 0.29 13.79
25 Phoenix-Mesa, AZ 2.63 8.55 9.29 3.21 73.12
* Each metro must contain either a place with a minimum population of 50,000 or a Census Bureau defined urbanized area and total popula -tion of at least 100,000 (75,000 in New England). Ametro comprises one or more counties.
** The Location Quotient (LQ) equals % output in metro divided by % output in the U.S. If LQ > 1.0, the industry is more concentrated inthe metro area than in the U.S. on average.
Sources: Milken Institute; RFA
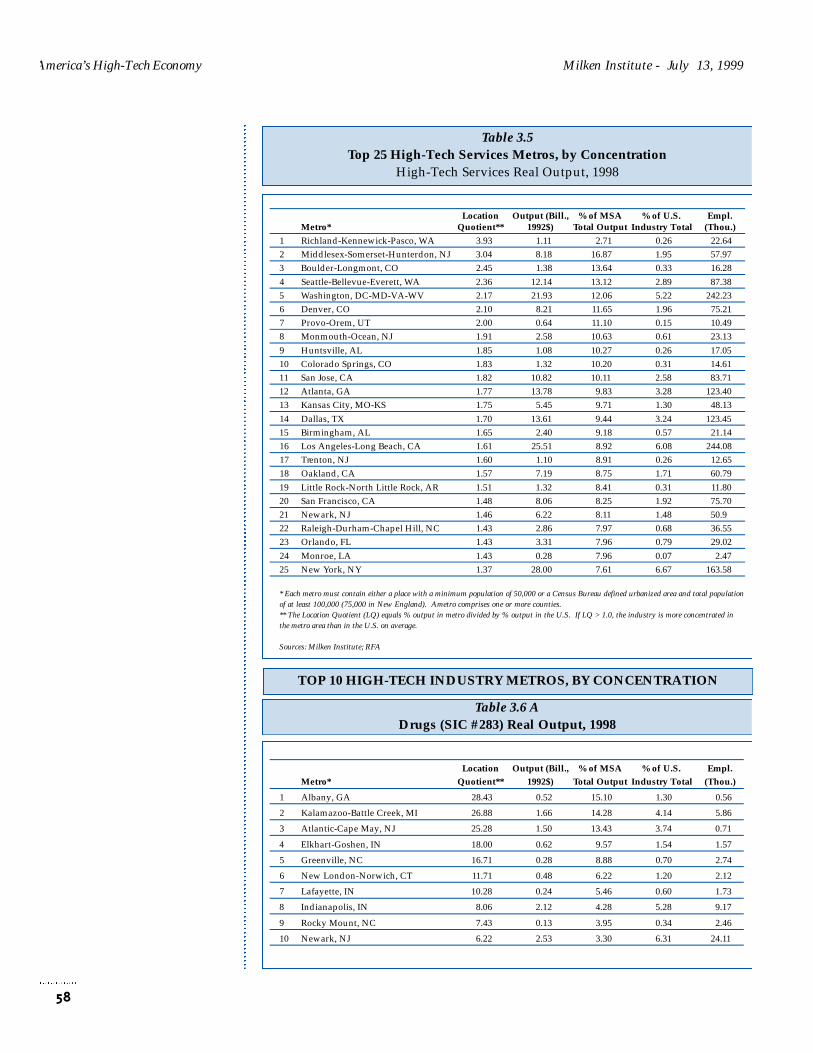
America’s High-Tech Economy Milken Institute - July 13, 1999
58
Table 3.5Top 25 High-Tech Services Metros, by Concentration
High-Tech Services Real Output, 1998
Table 3.6 ADrugs (SIC #283) Real Output, 1998
TOP 10 HIGH-TECH INDUSTRY METROS, BY CONCENTRATION
Location Output (Bill., % of MSA % of U.S. Empl.Metro* Quotient** 1992$) Total Output Industry Total (Thou.)
1 Richland-Kennewick-Pasco, WA 3.93 1.11 2.71 0.26 22.64
2 Middlesex-Somerset-Hunterdon, NJ 3.04 8.18 16.87 1.95 57.97
3 Boulder-Longmont, CO 2.45 1.38 13.64 0.33 16.28
4 Seattle-Bellevue-Everett, WA 2.36 12.14 13.12 2.89 87.38
5 Washington, DC-MD-VA-WV 2.17 21.93 12.06 5.22 242.23
6 Denver, CO 2.10 8.21 11.65 1.96 75.21
7 Provo-Orem, UT 2.00 0.64 11.10 0.15 10.49
8 Monmouth-Ocean, NJ 1.91 2.58 10.63 0.61 23.13
9 Huntsville, AL 1.85 1.08 10.27 0.26 17.05
10 Colorado Springs, CO 1.83 1.32 10.20 0.31 14.61
11 San Jose, CA 1.82 10.82 10.11 2.58 83.71
12 Atlanta, GA 1.77 13.78 9.83 3.28 123.40
13 Kansas City, MO-KS 1.75 5.45 9.71 1.30 48.13
14 Dallas, TX 1.70 13.61 9.44 3.24 123.45
15 Birmingham, AL 1.65 2.40 9.18 0.57 21.14
16 Los Angeles-Long Beach, CA 1.61 25.51 8.92 6.08 244.08
17 Trenton, NJ 1.60 1.10 8.91 0.26 12.65
18 Oakland, CA 1.57 7.19 8.75 1.71 60.79
19 Little Rock-North Little Rock, AR 1.51 1.32 8.41 0.31 11.80
20 San Francisco, CA 1.48 8.06 8.25 1.92 75.70
21 Newark, NJ 1.46 6.22 8.11 1.48 50.9
22 Raleigh-Durham-Chapel Hill, NC 1.43 2.86 7.97 0.68 36.55
23 Orlando, FL 1.43 3.31 7.96 0.79 29.02
24 Monroe, LA 1.43 0.28 7.96 0.07 2.47
25 New York, NY 1.37 28.00 7.61 6.67 163.58
* Each metro must contain either a place with a minimum population of 50,000 or a Census Bureau defined urbanized area and total populationof at least 100,000 (75,000 in New England). Ametro comprises one or more counties.** The Location Quotient (LQ) equals % output in metro divided by % output in the U.S. If LQ > 1.0, the industry is more concentrated inthe metro area than in the U.S. on average.
Sources: Milken Institute; RFA
Location Output (Bill., % of MSA % of U.S. Empl.
Metro* Quotient** 1992$) Total Output Industry Total (Thou.)
1 Albany, GA 28.43 0.52 15.10 1.30 0.56
2 Kalamazoo-Battle Creek, MI 26.88 1.66 14.28 4.14 5.86
3 Atlantic-Cape May, NJ 25.28 1.50 13.43 3.74 0.71
4 Elkhart-Goshen, IN 18.00 0.62 9.57 1.54 1.57
5 Greenville, NC 16.71 0.28 8.88 0.70 2.74
6 New London-Norwich, CT 11.71 0.48 6.22 1.20 2.12
7 Lafayette, IN 10.28 0.24 5.46 0.60 1.73
8 Indianapolis, IN 8.06 2.12 4.28 5.28 9.17
9 Rocky Mount, NC 7.43 0.13 3.95 0.34 2.46
10 Newark, NJ 6.22 2.53 3.30 6.31 24.11

Milken Institute - July 13, 1999 America’s High-Tech Economy
59
Table 3.6 DElectronic Components & Accessories (SIC #367) Real Output, 1998
Table 3.6 CCommunications Equipment (SIC #366) Real Output, 1998
Table 3.6 BComputers & Office Equipment (SIC #357) Real Output, 1998
Location Output (Bill., % of MSA % of U.S. Empl.
Metro* Quotient** 1992$) Total Output Industry Total (Thou.)
1 Rochester, MN 143.01 2.35 55.41 7.15 6.90
2 Boulder-Longmont, CO 22.22 0.94 8.61 2.86 7.20
3 San Jose, CA 21.17 8.47 8.20 25.72 47.73
4 Raleigh-Durham-Chapel Hill, NC 16.34 2.48 6.33 7.55 19.80
5 Boise City, ID 15.20 0.84 5.89 2.54 6.09
6 Eau Claire, WI 14.22 0.21 5.51 0.63 4.10
7 Dutchess County, NY 11.30 0.37 4.38 1.11 8.40
8 Austin-San Marcos, TX 10.56 1.63 4.09 4.95 14.22
9 Binghamton, NY 7.24 0.20 2.81 0.61 3.23
10 Fort Collins-Loveland, CO 6.81 0.17 2.64 0.52 1.37
Location Output (Bill., % of MSA % of U.S. Empl.
Metro* Quotient** 1992$) Total Output Industry Total (Thou.)
1 Cedar Rapids, IA 24.43 1.50 20.44 2.37 9.79
2 Melbourne-Titusville-Palm Bay, FL 9.51 0.77 7.96 1.21 6.86
3 San Jose, CA 8.46 7.58 7.08 11.99 20.26
4 Omaha, NE-IA 4.81 0.93 4.02 1.47 2.98
5 Lynchburg, VA 3.89 0.15 3.26 0.24 1.54
6 Lawrence, KS 3.27 0.05 2.74 0.08 1.13
7 Dallas, TX 3.16 3.81 2.64 6.03 23.38
8 Chicago, IL 2.59 6.17 2.17 9.76 32.71
9 Santa Rosa, CA 2.58 0.24 2.16 0.38 1.12
10 Longview-Marshall, TX 2.34 0.11 1.96 0.17 1.22
Location Output (Bill., % of MSA % of U.S. Empl.
Metro* Quotient** 1992$) Total Output Industry Total (Thou.)
1 Albuquerque, NM 37.59 7.85 29.33 11.85 9.69
2 Lubbock, TX 34.51 1.89 26.93 2.85 0.94
3 Boise City, ID 23.05 2.55 17.98 3.85 9.85
4 Pocatello, ID 22.69 0.33 17.71 0.49 1.41
5 Burlington, VT 14.51 0.75 11.32 1.14 7.91
6 Sherman-Denison, TX 12.54 0.28 9.78 0.42 2.60
7 San Jose, CA 10.64 8.57 8.30 12.93 66.95
8 Glens Fall, NY 10.54 0.21 8.22 0.32 0.29
9 Phoenix-Mesa, AZ 9.60 7.35 7.49 11.08 42.83
10 Austin-San Marcos, TX 9.52 2.96 7.43 4.47 23.29
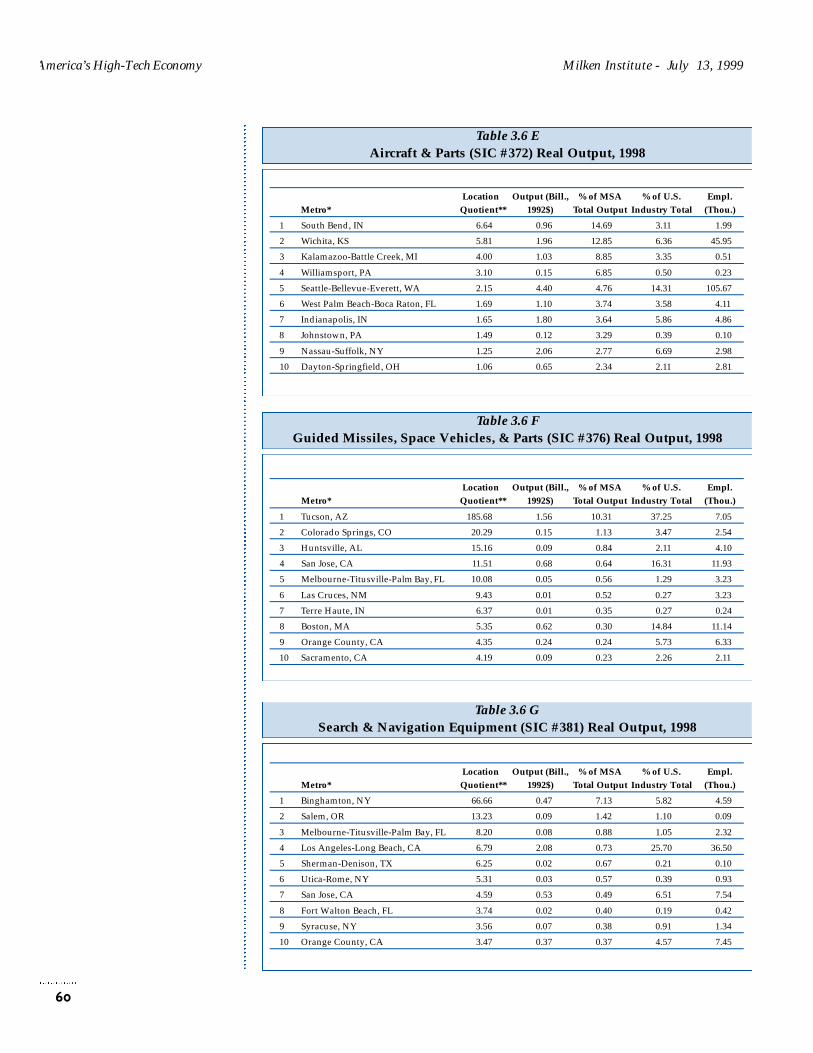
America’s High-Tech Economy Milken Institute - July 13, 1999
60
Table 3.6 GSearch & Navigation Equipment (SIC #381) Real Output, 1998
Table 3.6 FGuided Missiles, Space Vehicles, & Parts (SIC #376) Real Output, 1998
Table 3.6 EAircraft & Parts (SIC #372) Real Output, 1998
Location Output (Bill., % of MSA % of U.S. Empl.
Metro* Quotient** 1992$) Total Output Industry Total (Thou.)
1 South Bend, IN 6.64 0.96 14.69 3.11 1.99
2 Wichita, KS 5.81 1.96 12.85 6.36 45.95
3 Kalamazoo-Battle Creek, MI 4.00 1.03 8.85 3.35 0.51
4 Williamsport, PA 3.10 0.15 6.85 0.50 0.23
5 Seattle-Bellevue-Everett, WA 2.15 4.40 4.76 14.31 105.67
6 West Palm Beach-Boca Raton, FL 1.69 1.10 3.74 3.58 4.11
7 Indianapolis, IN 1.65 1.80 3.64 5.86 4.86
8 Johnstown, PA 1.49 0.12 3.29 0.39 0.10
9 Nassau-Suffolk, NY 1.25 2.06 2.77 6.69 2.98
10 Dayton-Springfield, OH 1.06 0.65 2.34 2.11 2.81
Location Output (Bill., % of MSA % of U.S. Empl.
Metro* Quotient** 1992$) Total Output Industry Total (Thou.)
1 Tucson, AZ 185.68 1.56 10.31 37.25 7.05
2 Colorado Springs, CO 20.29 0.15 1.13 3.47 2.54
3 Huntsville, AL 15.16 0.09 0.84 2.11 4.10
4 San Jose, CA 11.51 0.68 0.64 16.31 11.93
5 Melbourne-Titusville-Palm Bay, FL 10.08 0.05 0.56 1.29 3.23
6 Las Cruces, NM 9.43 0.01 0.52 0.27 3.23
7 Terre Haute, IN 6.37 0.01 0.35 0.27 0.24
8 Boston, MA 5.35 0.62 0.30 14.84 11.14
9 Orange County, CA 4.35 0.24 0.24 5.73 6.33
10 Sacramento, CA 4.19 0.09 0.23 2.26 2.11
Location Output (Bill., % of MSA % of U.S. Empl.
Metro* Quotient** 1992$) Total Output Industry Total (Thou.)
1 Binghamton, NY 66.66 0.47 7.13 5.82 4.59
2 Salem, OR 13.23 0.09 1.42 1.10 0.09
3 Melbourne-Titusville-Palm Bay, FL 8.20 0.08 0.88 1.05 2.32
4 Los Angeles-Long Beach, CA 6.79 2.08 0.73 25.70 36.50
5 Sherman-Denison, TX 6.25 0.02 0.67 0.21 0.10
6 Utica-Rome, NY 5.31 0.03 0.57 0.39 0.93
7 San Jose, CA 4.59 0.53 0.49 6.51 7.54
8 Fort Walton Beach, FL 3.74 0.02 0.40 0.19 0.42
9 Syracuse, NY 3.56 0.07 0.38 0.91 1.34
10 Orange County, CA 3.47 0.37 0.37 4.57 7.45
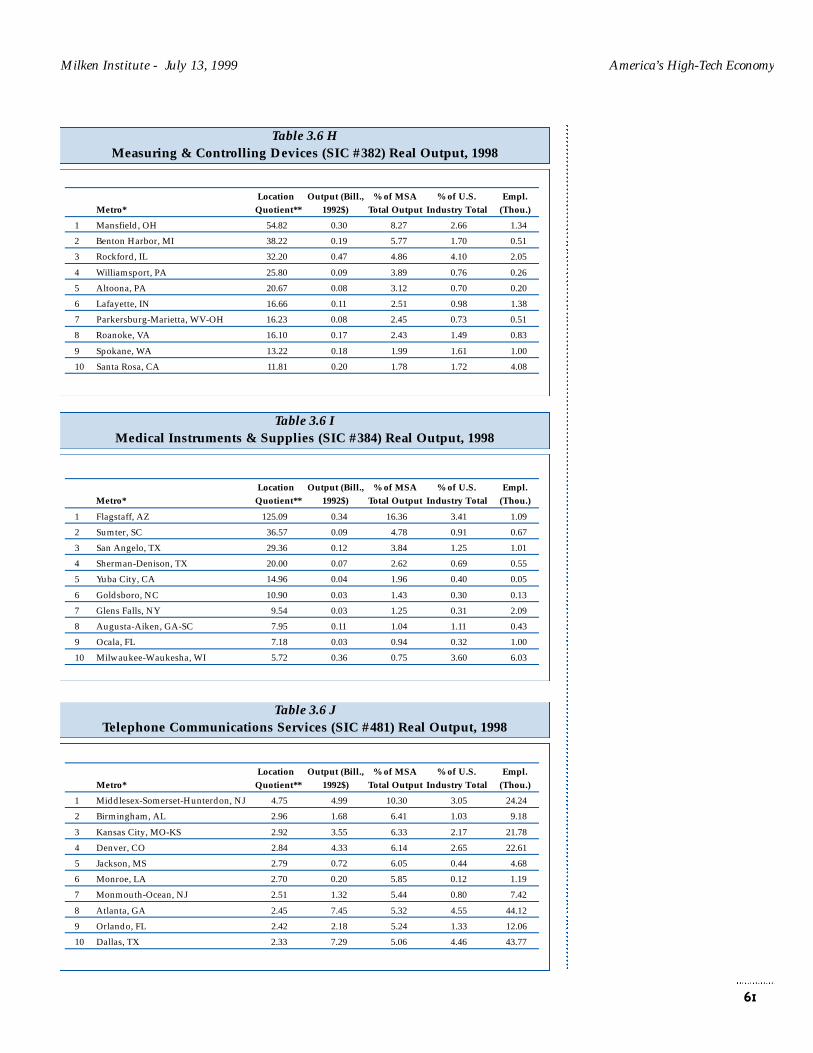
Milken Institute - July 13, 1999 America’s High-Tech Economy
61
Table 3.6 JTelephone Communications Services (SIC #481) Real Output, 1998
Table 3.6 IMedical Instruments & Supplies (SIC #384) Real Output, 1998
Table 3.6 HMeasuring & Controlling Devices (SIC #382) Real Output, 1998
Location Output (Bill., % of MSA % of U.S. Empl.
Metro* Quotient** 1992$) Total Output Industry Total (Thou.)
1 Mansfield, OH 54.82 0.30 8.27 2.66 1.34
2 Benton Harbor, MI 38.22 0.19 5.77 1.70 0.51
3 Rockford, IL 32.20 0.47 4.86 4.10 2.05
4 Williamsport, PA 25.80 0.09 3.89 0.76 0.26
5 Altoona, PA 20.67 0.08 3.12 0.70 0.20
6 Lafayette, IN 16.66 0.11 2.51 0.98 1.38
7 Parkersburg-Marietta, WV-OH 16.23 0.08 2.45 0.73 0.51
8 Roanoke, VA 16.10 0.17 2.43 1.49 0.83
9 Spokane, WA 13.22 0.18 1.99 1.61 1.00
10 Santa Rosa, CA 11.81 0.20 1.78 1.72 4.08
Location Output (Bill., % of MSA % of U.S. Empl.
Metro* Quotient** 1992$) Total Output Industry Total (Thou.)
1 Flagstaff, AZ 125.09 0.34 16.36 3.41 1.09
2 Sumter, SC 36.57 0.09 4.78 0.91 0.67
3 San Angelo, TX 29.36 0.12 3.84 1.25 1.01
4 Sherman-Denison, TX 20.00 0.07 2.62 0.69 0.55
5 Yuba City, CA 14.96 0.04 1.96 0.40 0.05
6 Goldsboro, NC 10.90 0.03 1.43 0.30 0.13
7 Glens Falls, NY 9.54 0.03 1.25 0.31 2.09
8 Augusta-Aiken, GA-SC 7.95 0.11 1.04 1.11 0.43
9 Ocala, FL 7.18 0.03 0.94 0.32 1.00
10 Milwaukee-Waukesha, WI 5.72 0.36 0.75 3.60 6.03
Location Output (Bill., % of MSA % of U.S. Empl.
Metro* Quotient** 1992$) Total Output Industry Total (Thou.)
1 Middlesex-Somerset-Hunterdon, NJ 4.75 4.99 10.30 3.05 24.24
2 Birmingham, AL 2.96 1.68 6.41 1.03 9.18
3 Kansas City, MO-KS 2.92 3.55 6.33 2.17 21.78
4 Denver, CO 2.84 4.33 6.14 2.65 22.61
5 Jackson, MS 2.79 0.72 6.05 0.44 4.68
6 Monroe, LA 2.70 0.20 5.85 0.12 1.19
7 Monmouth-Ocean, NJ 2.51 1.32 5.44 0.80 7.42
8 Atlanta, GA 2.45 7.45 5.32 4.55 44.12
9 Orlando, FL 2.42 2.18 5.24 1.33 12.06
10 Dallas, TX 2.33 7.29 5.06 4.46 43.77

America’s High-Tech Economy Milken Institute - July 13, 1999
62
Table 3.6 MEngineering and Architectural Services (SIC #871) Real Output, 1998
Table 3.6 LMotion Picture Production & Services (SIC #781) Real Output, 1998
Table 3.6 KComputer & Data Processing Services (SIC #737) Real Output, 1998
Location Output (Bill., % of MSA % of U.S. Empl.
Metro* Quotient** 1992$) Total Output Industry Total (Thou.)
1 Provo-Orem, UT 5.51 0.54 9.30 0.42 8.08
2 Boulder-Longmont, CO 4.84 0.83 8.16 0.65 10.24
3 Seattle-Bellevue-Everett, WA 4.10 6.39 6.91 5.02 44.72
4 San Jose, CA 4.08 7.37 6.89 5.79 50.62
5 Washington, DC-MD-VA-WV 3.01 9.24 5.08 7.25 122.30
6 San Francisco, CA 2.76 4.54 4.65 3.57 40.73
7 Huntsville, AL 2.44 0.43 4.11 0.34 7.02
8 Santa Cruz-Watsonville, CA 2.42 0.29 4.09 0.22 2.85
9 Columbus, GA-AL 2.22 0.23 3.75 0.18 5.75
10 Middlesex-Somerset-Hunterdon, NJ 2.18 1.78 3.67 1.40 17.16
Location Output (Bill., % of MSA % of U.S. Empl.
Metro* Quotient** 1992$) Total Output Industry Total (Thou.)
1 Los Angeles-Long Beach, CA 14.69 11.30 3.95 55.61 121.83
2 Tyler, TX 10.98 0.14 2.95 0.67 0.16
3 New York, NY 3.75 3.71 1.01 18.26 38.98
4 Tallahassee, FL 3.50 0.06 0.94 0.30 0.07
5 Lubbock, TX 2.49 0.05 0.67 0.25 0.06
6 Provo-Orem, UT 2.45 0.04 0.66 0.19 0.98
7 Ventura, CA 2.00 0.10 0.54 0.50 1.70
8 San Francisco, CA 1.60 0.42 0.43 2.07 3.87
9 Grand Rapids-Muskegon-Holland, MI 1.55 0.13 0.42 0.63 0.46
10 Middlesex-Somerset-Hunterdon, NJ 1.36 0.18 0.37 0.87 0.36
Location Output (Bill., % of MSA % of U.S. Empl.
Metro* Quotient** 1992$) Total Output Industry Total (Thou.)M.
1 Richland-Kennewick-Pasco, WA 16.03 0.69 13.65 1.07 10.65
2 Huntsville, AL 4.50 0.40 3.83 0.62 6.66
3 Melbourne-Titusville-Palm Bay, FL 3.92 0.32 3.33 0.50 5.08
4 Santa Fe, NM 3.17 0.10 2.70 0.15 1.88
5 Houston, TX 2.82 3.78 2.40 5.89 42.75
6 Baton Rouge, LA 2.51 0.38 2.14 0.59 4.08
7 Ventura, CA 2.40 0.38 2.04 0.59 3.31
8 Detroit, MI 2.35 2.74 2.00 4.26 38.17
9 Beaumont-Port Arthur, TX 2.34 0.20 2.00 0.31 2.54
10 Lawrence, KS 2.31 0.04 1.96 0.06 0.71
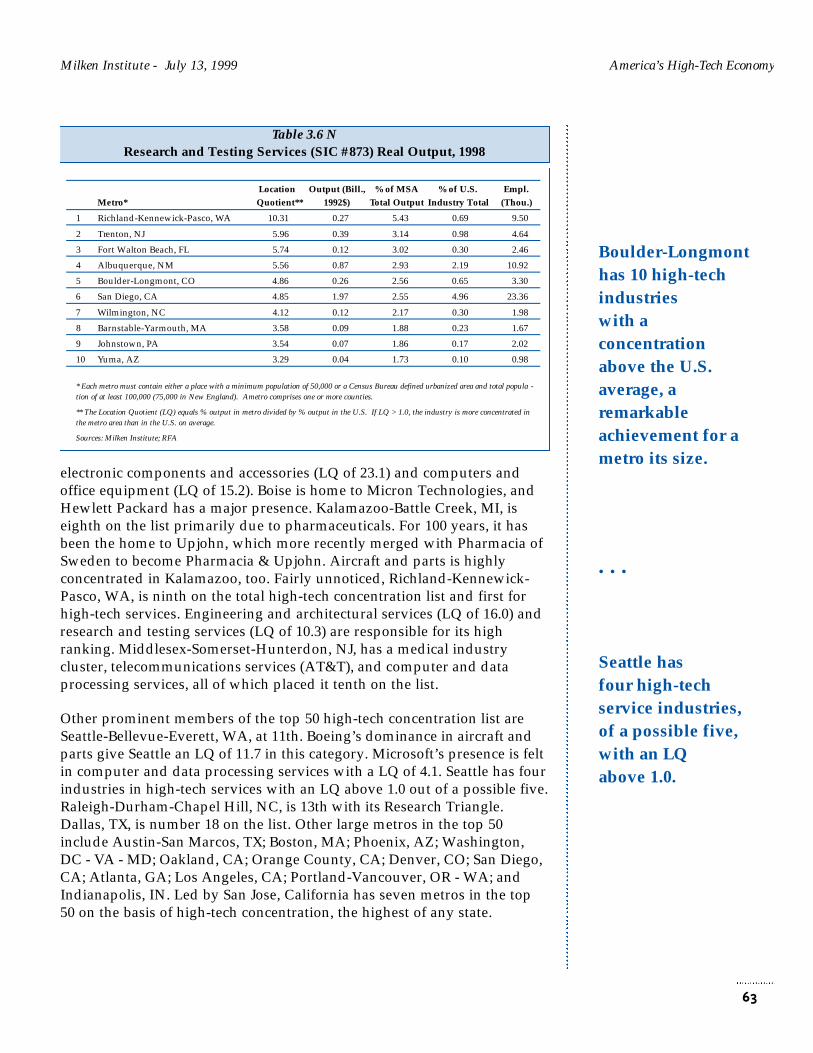
Milken Institute - July 13, 1999 America’s High-Tech Economy
63
electronic components and accessories (LQ of 23.1) and computers andoffice equipment (LQ of 15.2). Boise is home to Micron Technologies, andHewlett Packard has a major presence. Kalamazoo-Battle Creek, MI, iseighth on the list primarily due to pharmaceuticals. For 100 years, it hasbeen the home to Upjohn, which more recently merged with Pharmacia ofSweden to become Pharmacia & Upjohn. Aircraft and parts is highlyconcentrated in Kalamazoo, too. Fairly unnoticed, Richland-Kennewick-Pasco, WA, is ninth on the total high-tech concentration list and first forhigh-tech services. Engineering and architectural services (LQ of 16.0) andresearch and testing services (LQ of 10.3) are responsible for its highranking. Middlesex-Somerset-Hunterdon, NJ, has a medical industrycluster, telecommunications services (AT&T), and computer and dataprocessing services, all of which placed it tenth on the list.
Other prominent members of the top 50 high-tech concentration list areSeattle-Bellevue-Everett, WA, at 11th. Boeing’s dominance in aircraft andparts give Seattle an LQ of 11.7 in this category. Microsoft’s presence is feltin computer and data processing services with a LQ of 4.1. Seattle has fourindustries in high-tech services with an LQ above 1.0 out of a possible five.Raleigh-Durham-Chapel Hill, NC, is 13th with its Research Triangle.Dallas, TX, is number 18 on the list. Other large metros in the top 50include Austin-San Marcos, TX; Boston, MA; Phoenix, AZ; Washington,DC - VA - MD; Oakland, CA; Orange County, CA; Denver, CO; San Diego,CA; Atlanta, GA; Los Angeles, CA; Portland-Vancouver, OR - WA; andIndianapolis, IN. Led by San Jose, California has seven metros in the top50 on the basis of high-tech concentration, the highest of any state.
Boulder-Longmonthas 10 high-techindustrieswith aconcentrationabove the U.S.average, aremarkableachievement for ametro its size.
• • •
Seattle hasfour high-techservice industries,of a possible five,with an LQabove 1.0.
Table 3.6 NResearch and Testing Services (SIC #873) Real Output, 1998
Location Output (Bill., % of MSA % of U.S. Empl.
Metro* Quotient** 1992$) Total Output Industry Total (Thou.)
1 Richland-Kennewick-Pasco, WA 10.31 0.27 5.43 0.69 9.50
2 Trenton, NJ 5.96 0.39 3.14 0.98 4.64
3 Fort Walton Beach, FL 5.74 0.12 3.02 0.30 2.46
4 Albuquerque, NM 5.56 0.87 2.93 2.19 10.92
5 Boulder-Longmont, CO 4.86 0.26 2.56 0.65 3.30
6 San Diego, CA 4.85 1.97 2.55 4.96 23.36
7 Wilmington, NC 4.12 0.12 2.17 0.30 1.98
8 Barnstable-Yarmouth, MA 3.58 0.09 1.88 0.23 1.67
9 Johnstown, PA 3.54 0.07 1.86 0.17 2.02
10 Yuma, AZ 3.29 0.04 1.73 0.10 0.98
* Each metro must contain either a place with a minimum population of 50,000 or a Census Bureau defined urbanized area and total popula -tion of at least 100,000 (75,000 in New England). Ametro comprises one or more counties.
** The Location Quotient (LQ) equals % output in metro divided by % output in the U.S. If LQ > 1.0, the industry is more concentrated inthe metro area than in the U.S. on average.
Sources: Milken Institute; RFA
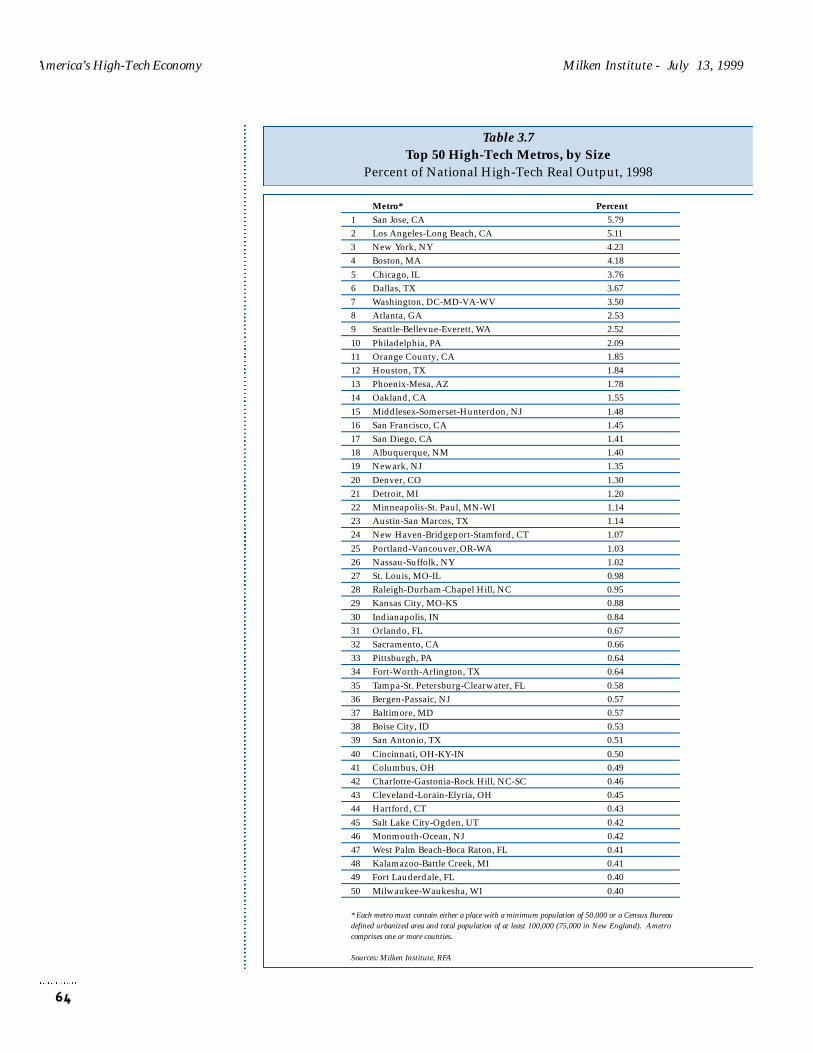
America’s High-Tech Economy Milken Institute - July 13, 1999
64
Table 3.7Top 50 High-Tech Metros, by Size
Percent of National High-Tech Real Output, 1998
Metro* Percent
1 San Jose, CA 5.79
2 Los Angeles-Long Beach, CA 5.11
3 New York, NY 4.23
4 Boston, MA 4.18
5 Chicago, IL 3.76
6 Dallas, TX 3.67
7 Washington, DC-MD-VA-WV 3.50
8 Atlanta, GA 2.53
9 Seattle-Bellevue-Everett, WA 2.52
10 Philadelphia, PA 2.09
11 Orange County, CA 1.85
12 Houston, TX 1.84
13 Phoenix-Mesa, AZ 1.78
14 Oakland, CA 1.55
15 Middlesex-Somerset-Hunterdon, NJ 1.48
16 San Francisco, CA 1.45
17 San Diego, CA 1.41
18 Albuquerque, NM 1.40
19 Newark, NJ 1.35
20 Denver, CO 1.30
21 Detroit, MI 1.20
22 Minneapolis-St. Paul, MN-WI 1.14
23 Austin-San Marcos, TX 1.14
24 New Haven-Bridgeport-Stamford, CT 1.07
25 Portland-Vancouver, OR-WA 1.03
26 Nassau-Suffolk, NY 1.02
27 St. Louis, MO-IL 0.98
28 Raleigh-Durham-Chapel Hill, NC 0.95
29 Kansas City, MO-KS 0.88
30 Indianapolis, IN 0.84
31 Orlando, FL 0.67
32 Sacramento, CA 0.66
33 Pittsburgh, PA 0.64
34 Fort-Worth-Arlington, TX 0.64
35 Tampa-St. Petersburg-Clearwater, FL 0.58
36 Bergen-Passaic, NJ 0.57
37 Baltimore, MD 0.57
38 Boise City, ID 0.53
39 San Antonio, TX 0.51
40 Cincinnati, OH-KY-IN 0.50
41 Columbus, OH 0.49
42 Charlotte-Gastonia-Rock Hill, NC-SC 0.46
43 Cleveland-Lorain-Elyria, OH 0.45
44 Hartford, CT 0.43
45 Salt Lake City-Ogden, UT 0.42
46 Monmouth-Ocean, NJ 0.42
47 West Palm Beach-Boca Raton, FL 0.41
48 Kalamazoo-Battle Creek, MI 0.41
49 Fort Lauderdale, FL 0.40
50 Milwaukee-Waukesha, WI 0.40
* Each metro must contain either a place with a minimum population of 50,000 or a Census Bureaudefined urbanized area and total population of at least 100,000 (75,000 in New England). Ametrocomprises one or more counties.
Sources: Milken Institute, RFA

Milken Institute - July 13, 1999 America’s High-Tech Economy
A metro area’s proportion of national high-tech output is another way ofexamining the spatial dimension (horizontal depth). Large metros have anadvantage in this approach. Table 3.7 lists the top 50 metros on the basis ofwhat percentage of national high-tech output they represent. There is nosurprise on which is at the top of this list — namely San Jose. It accountsfor 5.8 percent of total national high-tech output and an astonishing 10.9percent of national high-tech manufacturing output. San Jose’s computerfirms account for 25.7 percent of the value of national industry output.
Los Angeles is second on the list, although its relative ranking is probablyinflated by the inclusion of motion picture production and services in thehigh-tech industries. Motion picture production and services is included inan attempt to capture new multimedia and entertainment technologies.These technologies combine film, television, and amusements withcomputer animation and digital-audio sound effects; Los Angelesdominates this industry. New York placed third on the list representing 4.2percent of national high-tech industry output, but when adjusted for thesize of its economy, this figure is not as impressive. Boston, with a smallereconomic base, accounts for the same share of national output as NewYork. Chicago, Dallas, Washington, Atlanta, and Seattle round out the top10. California’s dominant position in high-tech industries is displayed inthis ranking. It has six metros in the top 20, and they account for over 17percent of national high-tech output.
Measures of concentration of high-tech activity in a metro economy, suchas location quotients, can present a misleading perspective of theimportance of smaller-sized metros in the national picture. Shares ofnational high-tech production, however, can be a deceptive measurebecause a very large metro can rank high merely because of its immensesize (e.g., New York). The central problem becomes how to develop anindex that combines the two approaches to spatial concentrationmeasurement. The ultimate composite measure that is derived will bedependent upon how much weight is placed upon the location quotientversus the share of national high-tech output. We examined severaldifferent approaches and weighting schemes in order to develop acomposite measure. A straightforward approach seemed to be the mostappropriate. Combining the location quotient with the share of nationalhigh-tech output in a multiplicative fashion yields our composite measureof technology production centers, or as we term them, Tech-Poles. Theyare Tech-Poles in the sense of the relative technology gravitation pull thatthey exert. Table 3.8 shows the numeric results for the top 50 Tech-Poleswhile Figure 3.5 maps their location.
The dominance of Silicon Valley (San Jose metro) as a high-tech industrycenter is well documented. But our composite index of 23.7 is more thanthree times the size of the second-ranked metro, which is barely largerthan the third-place metro. As a Tech-Pole, the gravitational pull of the San
65
San Jose accountsfor 5.8 percentof total nationalhigh-techoutput and anastonishing 10.9percent ofnationalhigh-techmanufacturingoutput.
• • •
Los Angelesis secondon the list,aided bymultimedia andentertainmenttechnologies.
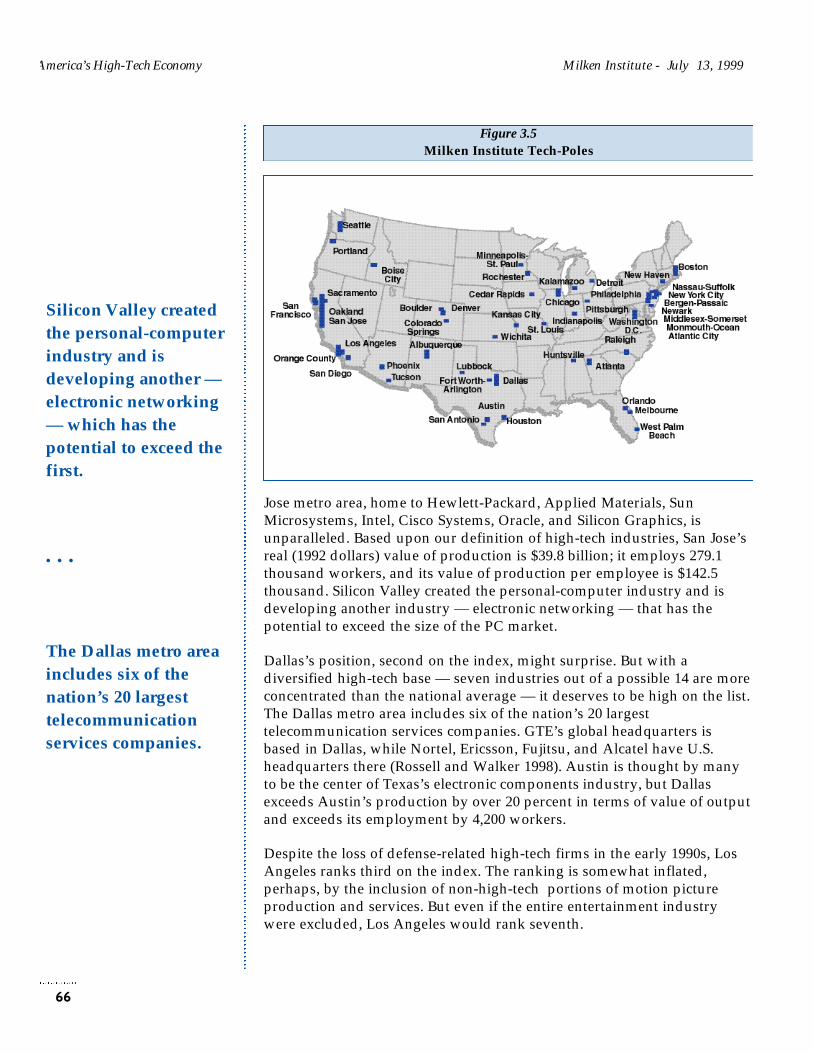
Jose metro area, home to Hewlett-Packard, Applied Materials, SunMicrosystems, Intel, Cisco Systems, Oracle, and Silicon Graphics, isunparalleled. Based upon our definition of high-tech industries, San Jose’sreal (1992 dollars) value of production is $39.8 billion; it employs 279.1thousand workers, and its value of production per employee is $142.5thousand. Silicon Valley created the personal-computer industry and isdeveloping another industry — electronic networking — that has thepotential to exceed the size of the PC market.
Dallas’s position, second on the index, might surprise. But with adiversified high-tech base — seven industries out of a possible 14 are moreconcentrated than the national average — it deserves to be high on the list.The Dallas metro area includes six of the nation’s 20 largesttelecommunication services companies. GTE’s global headquarters isbased in Dallas, while Nortel, Ericsson, Fujitsu, and Alcatel have U.S.headquarters there (Rossell and Walker 1998). Austin is thought by manyto be the center of Texas’s electronic components industry, but Dallasexceeds Austin’s production by over 20 percent in terms of value of outputand exceeds its employment by 4,200 workers.
Despite the loss of defense-related high-tech firms in the early 1990s, LosAngeles ranks third on the index. The ranking is somewhat inflated,perhaps, by the inclusion of non-high-tech portions of motion pictureproduction and services. But even if the entire entertainment industrywere excluded, Los Angeles would rank seventh.
America’s High-Tech Economy Milken Institute - July 13, 1999
66
Silicon Valley createdthe personal-computerindustry and isdeveloping another —electronic networking— which has thepotential to exceed thefirst.
• • •
The Dallas metro areaincludes six of thenation’s 20 largesttelecommunicationservices companies.
Figure 3.5Milken Institute Tech-Poles

Milken Institute - July 13, 1999 America’s High-Tech Economy
67
Table 3.8Top 50 Milken Institute Tech-Poles
Composite Index, 1998
Composite Number of High-Tech Tech-Poles Index* LQs Over 1**
1 San Jose, CA 23.69 10
2 Dallas, TX 7.06 7
3 Los Angeles-Long Beach, CA 6.91 5
4 Boston, MA 6.31 11
5 Seattle-Bellevue-Everett, WA 5.19 6
6 Washington, DC-MD-VA-WV 5.08 5
7 Albuquerque, NM 4.98 3
8 Chicago, IL 3.75 4
9 New York, NY 3.67 2
10 Atlanta, GA 3.46 4
11 Middlesex-Somerset-Hunterdon, NJ 3.40 7
12 Phoenix-Mesa, AZ 2.60 1
13 Orange County, CA 2.59 10
14 Oakland, CA 2.21 8
15 Philadelphia, PA 2.19 4
16 Rochester, MN 1.95 1
17 San Diego, CA 1.93 9
18 Raleigh-Durham-Chapel Hill, NC 1.89 7
19 Denver, CO 1.81 3
20 Newark, NJ 1.80 5
21 Austin-San Marcos, TX 1.78 4
22 San Francisco, CA 1.62 5
23 Houston, TX 1.62 2
24 Boise City, ID 1.43 2
25 New Haven-Bridgeport-Stamford, CT 1.33 10
26 Portland-Vancouver, OR-WA 1.33 2
27 Boulder-Longmont, CO 1.12 9
28 Kalamazoo-Battle Creek, MI 1.09 2
29 Indianapolis, IN 1.07 4
30 Nassau-Suffolk, NY 1.05 7
31 Kansas City, MO-KS 1.03 2
32 Minneapolis-St. Paul, MN-WI 0.98 4
33 Lubbock, TX 0.97 2
34 St. Louis, MO-IL 0.93 4
35 Cedar Rapids, IA 0.92 5
36 Orlando, FL 0.82 4
37 Sacramento, CA 0.82 6
38 Detroit, MI 0.79 2
39 Wichita, KS 0.72 3
40 Tucson, AZ 0.67 5
41 Fort Worth-Arlington, TX 0.66 4
42 Colorado Springs, CO 0.58 9
43 Monmouth-Ocean, NJ 0.55 4
44 Bergen-Passaic, NJ 0.51 6
45 Melbourne-Titusville-Palm Bay, FL 0.51 7
46 San Antonio, TX 0.49 3
47 Pittsburgh, PA 0.48 2
48 Atlantic-Cape May, NJ 0.44 1
49 West Palm Beach-Boca Raton, FL 0.43 3
50 Huntsville, AL 0.43 7
* Composite Index is equivalent to the percent of national high-tech real output multiplied by the high-tech real output location quotient foreach metro.
** The Location Quotient (LQ) equals % output in metro divided by % output in the U.S. If LQ > 1.0, the industry is more concentrated inthe metro area than in the U.S. on average.
Sources: Milken Institute, RFA
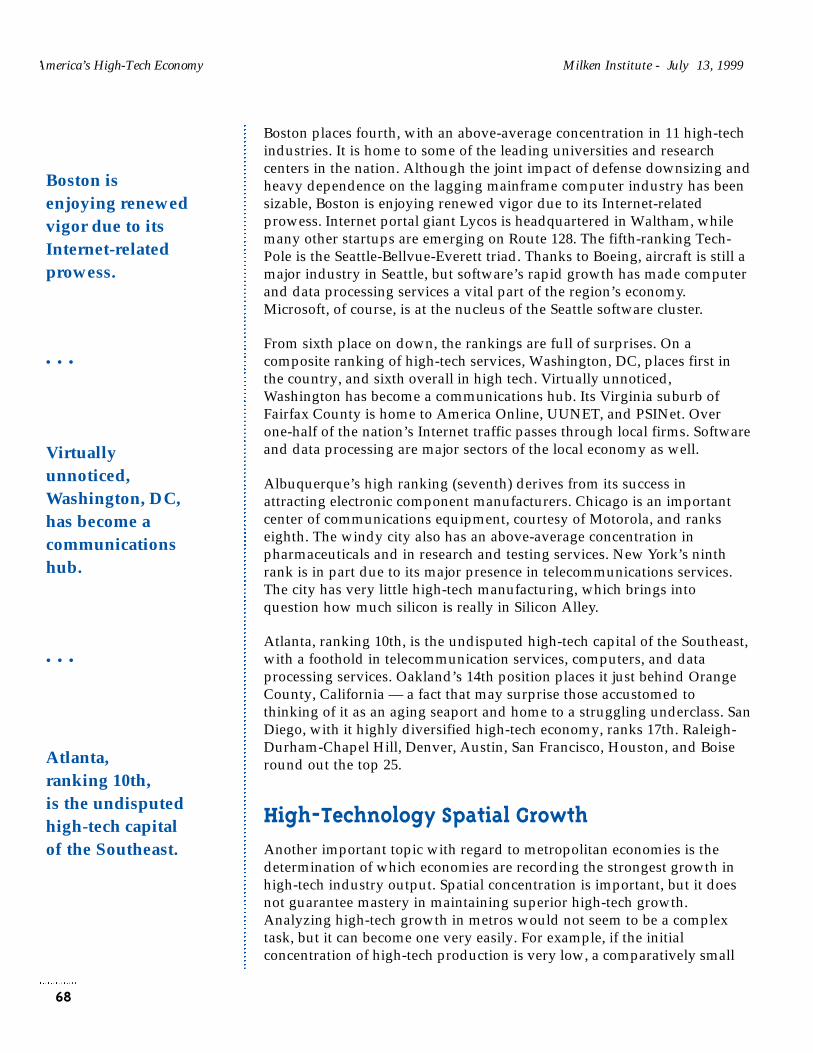
Boston places fourth, with an above-average concentration in 11 high-techindustries. It is home to some of the leading universities and researchcenters in the nation. Although the joint impact of defense downsizing andheavy dependence on the lagging mainframe computer industry has beensizable, Boston is enjoying renewed vigor due to its Internet-relatedprowess. Internet portal giant Lycos is headquartered in Waltham, whilemany other startups are emerging on Route 128. The fifth-ranking Tech-Pole is the Seattle-Bellvue-Everett triad. Thanks to Boeing, aircraft is still amajor industry in Seattle, but software’s rapid growth has made computerand data processing services a vital part of the region’s economy.Microsoft, of course, is at the nucleus of the Seattle software cluster.
From sixth place on down, the rankings are full of surprises. On acomposite ranking of high-tech services, Washington, DC, places first inthe country, and sixth overall in high tech. Virtually unnoticed,Washington has become a communications hub. Its Virginia suburb ofFairfax County is home to America Online, UUNET, and PSINet. Overone-half of the nation’s Internet traffic passes through local firms. Softwareand data processing are major sectors of the local economy as well.
Albuquerque’s high ranking (seventh) derives from its success inattracting electronic component manufacturers. Chicago is an importantcenter of communications equipment, courtesy of Motorola, and rankseighth. The windy city also has an above-average concentration inpharmaceuticals and in research and testing services. New York’s ninthrank is in part due to its major presence in telecommunications services.The city has very little high-tech manufacturing, which brings intoquestion how much silicon is really in Silicon Alley.
Atlanta, ranking 10th, is the undisputed high-tech capital of the Southeast,with a foothold in telecommunication services, computers, and dataprocessing services. Oakland’s 14th position places it just behind OrangeCounty, California — a fact that may surprise those accustomed tothinking of it as an aging seaport and home to a struggling underclass. SanDiego, with it highly diversified high-tech economy, ranks 17th. Raleigh-Durham-Chapel Hill, Denver, Austin, San Francisco, Houston, and Boiseround out the top 25.
High-Technology Spatial Growth
Another important topic with regard to metropolitan economies is thedetermination of which economies are recording the strongest growth inhigh-tech industry output. Spatial concentration is important, but it doesnot guarantee mastery in maintaining superior high-tech growth.Analyzing high-tech growth in metros would not seem to be a complextask, but it can become one very easily. For example, if the initialconcentration of high-tech production is very low, a comparatively small
America’s High-Tech Economy Milken Institute - July 13, 1999
68
Boston isenjoying renewedvigor due to itsInternet-relatedprowess.
• • •
Virtuallyunnoticed,Washington, DC,has become acommunicationshub.
• • •
Atlanta,ranking 10th,is the undisputedhigh-tech capitalof the Southeast.

Milken Institute - July 13, 1999 America’s High-Tech Economy
69
Table 3.9Top 50 High-Tech Metros, by Growth
Relative High-Tech Real Output Growth, 1990 to 1998
Metro* Relative Growth**
1 Albuquerque, NM 4.37
2 Pocatello, ID 3.08
3 Boise City, ID 2.93
4 Cedar Rapids, IA 2.68
5 Harrisburg-Lebanon-Carlisle, PA 2.58
6 Columbus, GA-AL 2.39
7 Merced, CA 2.23
9 Richland-Kennewick-Pasco, WA 2.02
9 Yuma, AZ 1.95
10 Austin-San Marcos, TX 1.92
11 Eugene-Springfield, OR 1.88
12 Albany, GA 1.87
13 Yolo, CA 1.80
14 Tyler, TX 1.78
15 Flint, MI 1.78
16 Portland-Vancouver, OR-WA 1.77
17 Killeen-Temple, TX 1.77
18 Iowa City, IA 1.75
29 Phoenix-Mesa, AZ 1.71
20 New London-Norwich, CT 1.67
21 Little Rock-North Little Rock, AR 1.64
22 Texarkana, TX-AR 1.64
23 San Antonio, TX 1.64
24 Waco, TX 1.64
25 Clarksville-Hopkinsville, TN-KY 1.64
26 Dallas, TX 1.60
27 Kenosha, WI 1.58
28 Colorado Springs, CO 1.55
29 Waterloo-Cedar Falls, IA 1.53
30 Lancaster, PA 1.52
31 Lynchburg, VA 1.51
32 Tallahassee, FL 1.50
33 Atlanta, GA 1.50
34 Brazoria, TX 1.50
35 Sacramento, CA 1.48
36 Houston, TX 1.48
37 Grand Forks, ND-MN 1.47
38 Denver, CO 1.47
39 Springfield, MO 1.47
40 Longview-Marshall, TX 1.45
41 Lubbock, TX 1.45
42 Greeley, CO 1.44
43 Bismarck, ND 1.43
44 Lafayette, LA 1.41
45 Johnstown, PA 1.41
46 San Luis Obispo-Atascadero, CA 1.40
47 Boulder-Longmont, CO 1.39
48 Goldsboro, NC 1.37
49 Vallejo-Fairfield-Napa, CA 1.36
50 San Jose, CA 1.36
* Each Metro must contain either a place with a minimum population of 50,000 or a Census Bureau defined urbanized area and total populationof at least 100,000 (75,000 in New England). Ametro comprises one or more counties.
** Relative growth in high-tech real output is equivalent to metro output indexed to 1990 then divided by U.S. index. Ametro with a value of>1 grew faster than the national average from 1990 to 1998.
Sources: Milken Institute, RFA
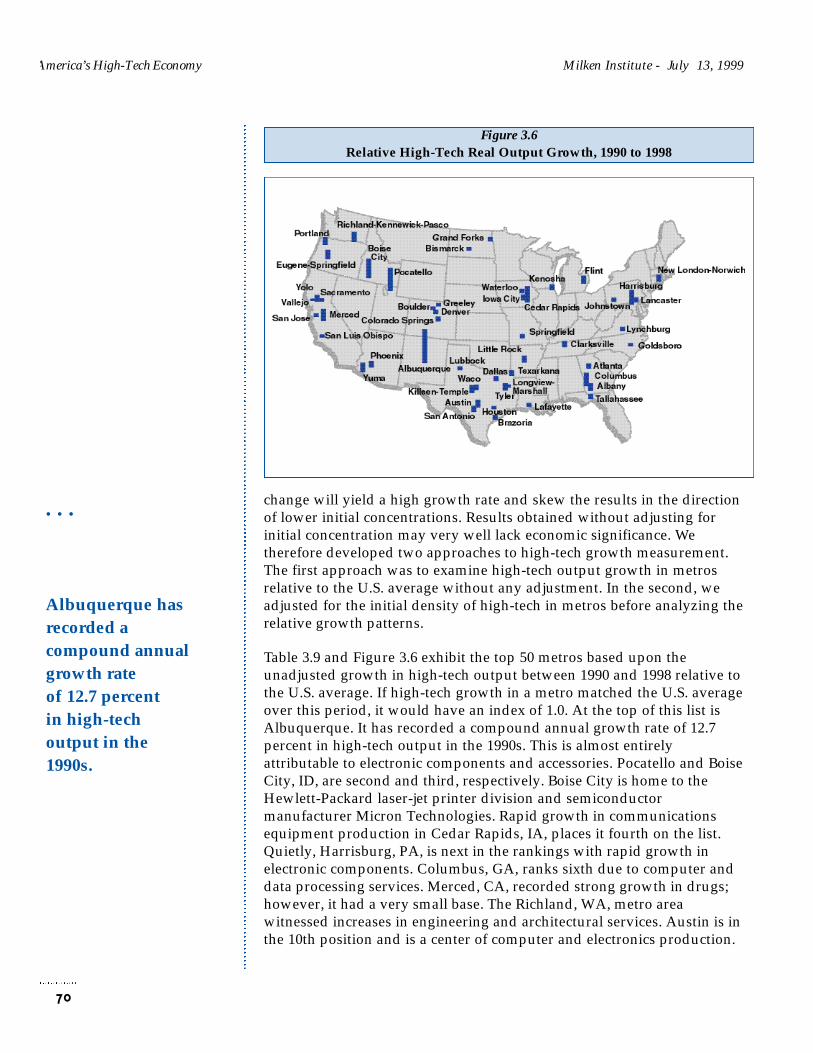
America’s High-Tech Economy Milken Institute - July 13, 1999
change will yield a high growth rate and skew the results in the directionof lower initial concentrations. Results obtained without adjusting forinitial concentration may very well lack economic significance. Wetherefore developed two approaches to high-tech growth measurement.The first approach was to examine high-tech output growth in metrosrelative to the U.S. average without any adjustment. In the second, weadjusted for the initial density of high-tech in metros before analyzing therelative growth patterns.
Table 3.9 and Figure 3.6 exhibit the top 50 metros based upon theunadjusted growth in high-tech output between 1990 and 1998 relative tothe U.S. average. If high-tech growth in a metro matched the U.S. averageover this period, it would have an index of 1.0. At the top of this list isAlbuquerque. It has recorded a compound annual growth rate of 12.7percent in high-tech output in the 1990s. This is almost entirelyattributable to electronic components and accessories. Pocatello and BoiseCity, ID, are second and third, respectively. Boise City is home to theHewlett-Packard laser-jet printer division and semiconductormanufacturer Micron Technologies. Rapid growth in communicationsequipment production in Cedar Rapids, IA, places it fourth on the list.Quietly, Harrisburg, PA, is next in the rankings with rapid growth inelectronic components. Columbus, GA, ranks sixth due to computer anddata processing services. Merced, CA, recorded strong growth in drugs;however, it had a very small base. The Richland, WA, metro areawitnessed increases in engineering and architectural services. Austin is inthe 10th position and is a center of computer and electronics production.
70
• • •
Albuquerque hasrecorded acompound annualgrowth rateof 12.7 percentin high-techoutput in the1990s.
Figure 3.6Relative High-Tech Real Output Growth, 1990 to 1998

Milken Institute - July 13, 1999 America’s High-Tech Economy
71
Table 3.10Top 50 Metros, by Adjusted Relative Growth Index
Metro* Adjusted Relative Growth**
1 Albuquerque, NM 6.92
2 San Jose, CA 5.86
3 Boise City, ID 4.94
4 Rochester, MN 4.75
5 Lubbock, TX 4.43
6 Boulder-Longmont, CO 4.13
7 Cedar Rapids, IA 3.65
8 Pocatello, ID 2.97
9 Richland-Kennewick-Pasco, WA 2.86
10 Kalamazoo-Battle Creek, MI 2.78
11 Middlesex-Somerset-Hunterdon, NJ 2.56
12 Dallas, TX 2.48
13 Raleigh-Durham-Chapel Hill, NC 2.42
14 Colorado Springs, CO 2.34
15 Albany, GA 2.31
16 Austin-San Marcos, TX 2.31
17 Seattle-Bellevue-Everett, WA 2.21
18 Phoenix-Mesa, AZ 2.10
19 Flagstaff, AZ 2.08
20 Tucson, AZ 2.06
21 Burlington, VT 2.04
22 South Bend, IN 2.02
23 Provo-Orem, UT 1.94
24 Wichita, KS 1.88
25 Melbourne-Titusville-Palm Bay, FL 1.87
26 Huntsville, AL 1.81
27 Sherman-Denison, TX 1.77
28 Atlanta, GA 1.76
29 Denver, CO 1.69
30 Fort Collins-Loveland, CO 1.63
31 Portland-Vancouver, OR-WA 1.63
32 Boston, MA 1.55
33 Atlantic-Cape May, NJ 1.55
34 Oakland, CA 1.49
35 Santa Cruz-Watsonville, CA 1.42
36 Indianapolis, IN 1.41
37 Orange County, CA 1.41
38 Washington, DC-MD-VA-WV 1.39
39 Elkhart-Goshen, IN 1.39
40 Orlando, FL 1.38
41 Harrisburg-Lebanon-Carlisle, PA 1.36
42 San Diego, CA 1.34
43 Binghamton, NY 1.32
44 Kansas City, MO-KS 1.31
45 Monmouth-Ocean, NJ 1.30
46 Omaha, NE-IA 1.30
47 Newark, NJ 1.27
48 Fort Worth-Arlington, TX 1.27
49 Greenville, NC 1.27
50 Glens Falls, NY 1.26
* Each metro must contain either a place with a minimum population of 50,000 or a Census Bureau defined urbanized area and total populationof at least 100,000 (75,000 in New England). Ametro compromises one or more counties.
** Adjusted relative growth index is equivalent to relative high-tech real output growth (1998 value) multiplied by high-tech real output locationquotient (1990 value).
Sources: Milken Institute, RFA

America’s High-Tech Economy Milken Institute - July 13, 1999
Starting from a low high-tech base, Eugene-Springfield, OR, has witnessedlarge percentage gains in computers and office equipment,communications equipment, and computer and data processing services.Albany, GA, a small metro, experienced solid increases in drugs andaircraft and parts. Flint, MI, does not often come to mind when one thinksabout high-tech growth, but it ranks high in the 1990s due to stronggrowth in computer and data processing services. Portland, OR, is amongthe best performers in high-tech growth in the 1990s. Electronics firmshave invested billions of dollars in semiconductor chip and wafer plants inthe Portland area; electronics production during the same period grew at acompound annual rate of 13.9 percent. Houston’s past is based uponenergy, but its future will have a high-tech component. Houston has thedistinction of being the largest metro ranking in the top 50 on high-techgrowth in the 1990s. Compaq, the largest supplier of PCs in the U.S.market, is based in Houston and has fueled tremendous growth incomputers.
In developing the concentration-adjusted composite relative growth index,we used the high-tech location quotient to incorporate a measure of initialdensity. Table 3.10 presents this composite growth index. If a metro areahas an above-average initial concentration of high-tech activity, its relativegrowth will be bolstered. Albuquerque is in the top position by thismeasure as well, courtesy of its 29.3 percent compound annual growth ratein electronic components and accessories during the 1990s. Ranking 50thin the unadjusted growth index, San Jose moves up to second place afterits high-tech concentration is taken into account. Rochester, MN, is thirdon this list despite witnessing high-tech output growth slightly below theU.S. average. Its large location quotient accounts for this elevated position.Boise City, ID; Cedar Rapids, IA; Pocatello, ID; and the Richland, WA,metro areas remain in the top 10 even after adjusting for high-techconcentration.
Lubbock, TX, ranks fifth on this list with a very large initial high-techconcentration. Boulder, CO, ranking sixth, experienced strong growth incomputers and office equipment and in telephone communications.Kalamazoo-Battle Creek, MI, completed the top 10. Dallas was high on thelist with solid growth across a number of high-tech industries. Thisbalanced growth pattern is elevating Dallas into the elite of high-techmetros. The Raleigh, NC, metro area has experienced rapid growth in thehigh-tech services of telephone communications and computer and dataprocessing, but not in its traditional area of strength — computers.Colorado Springs, CO, ranks 14th due to a 15.8 percent compound annualgrowth rate in telephone communications.
Phoenix ranked in the top five metros on job growth in the 1990s. Much ofPhoenix’s overall success is based upon the expansion of high tech.Motorola’s semiconductor components group is based in Phoenix.Electronic components and accessories output growth has averaged 10
72
Houston has thedistinction of beingthe largest metroranking in the top 50on high-tech growthin the 1990s.
• • •
The Raleigh, NC,metro area hasexperienced rapidgrowth in the high-tech services oftelephonecommunications andcomputer and dataprocessing.
Milken Institute - July 13, 1999 America’s High-Tech Economy
percent in the 1990s, and the industry employs 42.8 thousand employees.Atlanta is another high-tech growth leader among large metro areas.Atlanta’s growth is in high-tech services, where it recorded a 5.3 percentcompound annual rate of growth since 1990. Denver, another large metroalso is witnessing sustained growth in technology services. Denver isamong the metro leaders in telephone communications and computer andin data processing. Silicon Valley–based computer and communicationsequipment firms have moved production into Oakland in order to takeadvantage of lower costs, but retain operations in the Bay Area.
The Forces of Concentration and Dispersion:Who’s Winning?
We have demonstrated the importance of high-technology industries indetermining economic growth between metros, which metros have thehighest concentrations of technology industries, and which metros areexperiencing the most rapid growth in high-tech output. However, thereremains an unanswered question: Is high-tech production becoming morespatially concentrated or more dispersed? This is a complex issue andmust be analyzed from several perspectives. There is evidence that high-tech manufacturing is becoming less spatially concentrated, but that high-tech services are becoming more concentrated. Even thoughmanufacturing seems to be dispersing to peripheral regions, it remainshighly geographically concentrated and clearly shows that agglomerationforces are continuing to exert influence.
We analyzed the changing spatial patterns of high-technology industriesfrom 1978 to 1998. Each industry was inspected individually, but we founda major distinction between high-tech service and manufacturingindustries. We calculated location quotients and their standard deviationsand medians based on data from the years 1978 to 1998. A standarddeviation that fell over time was indicative of a dispersion process atwork; one that rose was indicative of concentration. In the case of high-tech manufacturing, the standard deviation of the location quotient foroutput fell from 1.76 in 1978 to 1.46 in 1998. The mean of the locationquotients for the top 10 high-tech manufacturing metros declined from 8.3in 1978 to 7.0 in 1998. In high-tech services, the standard deviation of thelocation quotients rose from 0.45 in 1978 to 0.49 in 1998, pointing toward aslight advantage for the forces of agglomeration. For total high-techproduction, the standard deviation of the location quotients decreasedfrom 0.76 in 1978 to 0.67 in 1998, suggesting a mild disagglomerationpattern.
Each metro area’s high-tech evolution has its own unique characteristics,and broad generalizations must be drawn cautiously, but there appears tobe a common pattern among metros that were the leaders in high-tech
73
There is evidencethat high-techmanufacturing isbecoming lessspatiallyconcentrated,but that high-techservices arebecoming moreconcentrated.
• • •
The meanof the locationquotientsfor the top10 high-techmanufacturingmetros declinedfrom 8.3 in 1978to 7.0 in 1998.
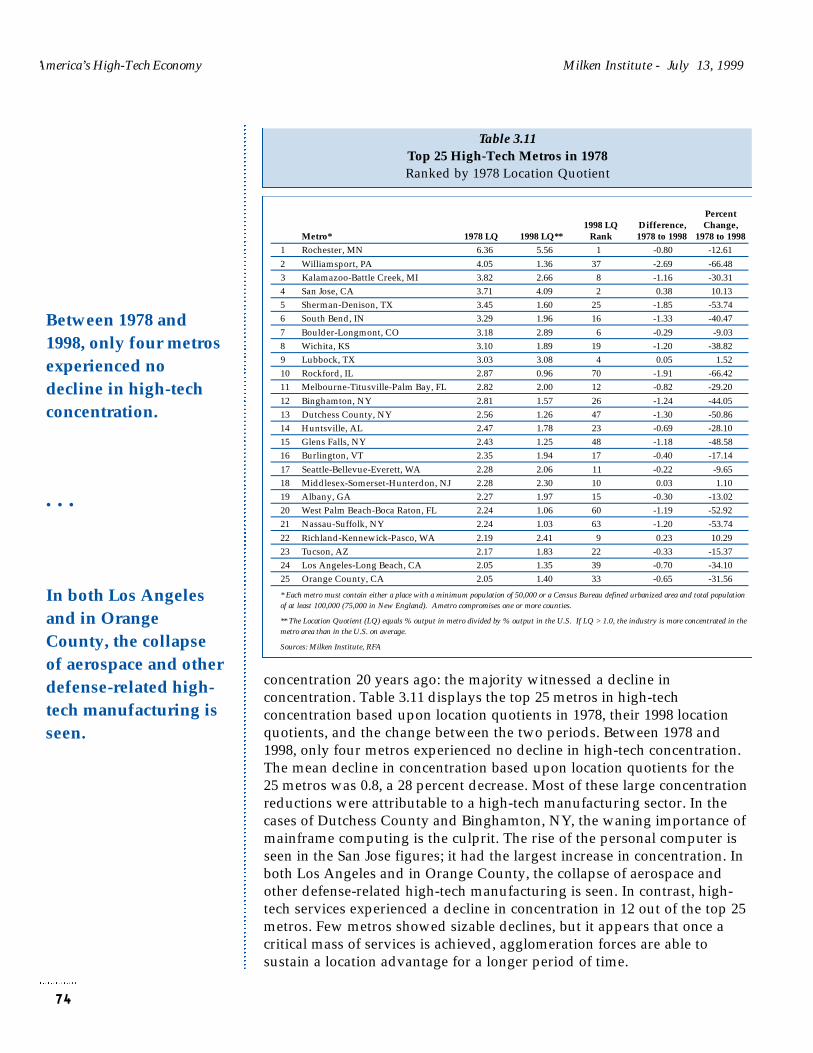
America’s High-Tech Economy Milken Institute - July 13, 1999
concentration 20 years ago: the majority witnessed a decline inconcentration. Table 3.11 displays the top 25 metros in high-techconcentration based upon location quotients in 1978, their 1998 locationquotients, and the change between the two periods. Between 1978 and1998, only four metros experienced no decline in high-tech concentration.The mean decline in concentration based upon location quotients for the25 metros was 0.8, a 28 percent decrease. Most of these large concentrationreductions were attributable to a high-tech manufacturing sector. In thecases of Dutchess County and Binghamton, NY, the waning importance ofmainframe computing is the culprit. The rise of the personal computer isseen in the San Jose figures; it had the largest increase in concentration. Inboth Los Angeles and in Orange County, the collapse of aerospace andother defense-related high-tech manufacturing is seen. In contrast, high-tech services experienced a decline in concentration in 12 out of the top 25metros. Few metros showed sizable declines, but it appears that once acritical mass of services is achieved, agglomeration forces are able tosustain a location advantage for a longer period of time.
74
Between 1978 and1998, only four metrosexperienced nodecline in high-techconcentration.
• • •
In both Los Angelesand in OrangeCounty, the collapseof aerospace and otherdefense-related high-tech manufacturing isseen.
Table 3.11Top 25 High-Tech Metros in 1978Ranked by 1978 Location Quotient
Percent 1998 LQ Difference, Change,
Metro* 1978 LQ 1998 LQ** Rank 1978 to 1998 1978 to 1998
1 Rochester, MN 6.36 5.56 1 -0.80 -12.61
2 Williamsport, PA 4.05 1.36 37 -2.69 -66.48
3 Kalamazoo-Battle Creek, MI 3.82 2.66 8 -1.16 -30.31
4 San Jose, CA 3.71 4.09 2 0.38 10.13
5 Sherman-Denison, TX 3.45 1.60 25 -1.85 -53.74
6 South Bend, IN 3.29 1.96 16 -1.33 -40.47
7 Boulder-Longmont, CO 3.18 2.89 6 -0.29 -9.03
8 Wichita, KS 3.10 1.89 19 -1.20 -38.82
9 Lubbock, TX 3.03 3.08 4 0.05 1.52
10 Rockford, IL 2.87 0.96 70 -1.91 -66.42
11 Melbourne-Titusville-Palm Bay, FL 2.82 2.00 12 -0.82 -29.20
12 Binghamton, NY 2.81 1.57 26 -1.24 -44.05
13 Dutchess County, NY 2.56 1.26 47 -1.30 -50.86
14 Huntsville, AL 2.47 1.78 23 -0.69 -28.10
15 Glens Falls, NY 2.43 1.25 48 -1.18 -48.58
16 Burlington, VT 2.35 1.94 17 -0.40 -17.14
17 Seattle-Bellevue-Everett, WA 2.28 2.06 11 -0.22 -9.65
18 Middlesex-Somerset-Hunterdon, NJ 2.28 2.30 10 0.03 1.10
19 Albany, GA 2.27 1.97 15 -0.30 -13.02
20 West Palm Beach-Boca Raton, FL 2.24 1.06 60 -1.19 -52.92
21 Nassau-Suffolk, NY 2.24 1.03 63 -1.20 -53.74
22 Richland-Kennewick-Pasco, WA 2.19 2.41 9 0.23 10.29
23 Tucson, AZ 2.17 1.83 22 -0.33 -15.37
24 Los Angeles-Long Beach, CA 2.05 1.35 39 -0.70 -34.10
25 Orange County, CA 2.05 1.40 33 -0.65 -31.56
* Each metro must contain either a place with a minimum population of 50,000 or a Census Bureau defined urbanized area and total populationof at least 100,000 (75,000 in New England). Ametro compromises one or more counties.
** The Location Quotient (LQ) equals % output in metro divided by % output in the U.S. If LQ > 1.0, the industry is more concentrated in themetro area than in the U.S. on average.
Sources: Milken Institute, RFA
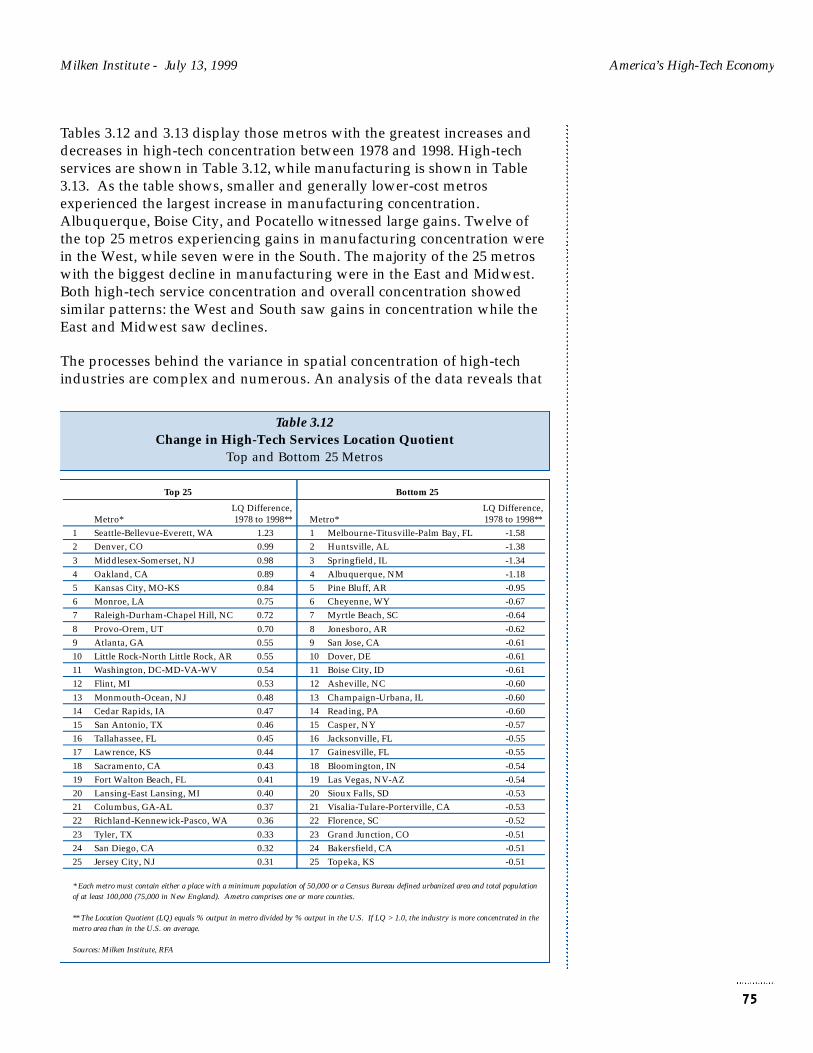
Tables 3.12 and 3.13 display those metros with the greatest increases anddecreases in high-tech concentration between 1978 and 1998. High-techservices are shown in Table 3.12, while manufacturing is shown in Table3.13. As the table shows, smaller and generally lower-cost metrosexperienced the largest increase in manufacturing concentration.Albuquerque, Boise City, and Pocatello witnessed large gains. Twelve ofthe top 25 metros experiencing gains in manufacturing concentration werein the West, while seven were in the South. The majority of the 25 metroswith the biggest decline in manufacturing were in the East and Midwest.Both high-tech service concentration and overall concentration showedsimilar patterns: the West and South saw gains in concentration while theEast and Midwest saw declines.
The processes behind the variance in spatial concentration of high-techindustries are complex and numerous. An analysis of the data reveals that
Milken Institute - July 13, 1999 America’s High-Tech Economy
75
Table 3.12Change in High-Tech Services Location Quotient
Top and Bottom 25 Metros
Top 25 Bottom 25
LQ Difference, LQ Difference,Metro* 1978 to 1998** Metro* 1978 to 1998**
1 Seattle-Bellevue-Everett, WA 1.23 1 Melbourne-Titusville-Palm Bay, FL -1.58
2 Denver, CO 0.99 2 Huntsville, AL -1.38
3 Middlesex-Somerset, NJ 0.98 3 Springfield, IL -1.34
4 Oakland, CA 0.89 4 Albuquerque, NM -1.18
5 Kansas City, MO-KS 0.84 5 Pine Bluff, AR -0.95
6 Monroe, LA 0.75 6 Cheyenne, WY -0.67
7 Raleigh-Durham-Chapel Hill, NC 0.72 7 Myrtle Beach, SC -0.64
8 Provo-Orem, UT 0.70 8 Jonesboro, AR -0.62
9 Atlanta, GA 0.55 9 San Jose, CA -0.61
10 Little Rock-North Little Rock, AR 0.55 10 Dover, DE -0.61
11 Washington, DC-MD-VA-WV 0.54 11 Boise City, ID -0.61
12 Flint, MI 0.53 12 Asheville, NC -0.60
13 Monmouth-Ocean, NJ 0.48 13 Champaign-Urbana, IL -0.60
14 Cedar Rapids, IA 0.47 14 Reading, PA -0.60
15 San Antonio, TX 0.46 15 Casper, NY -0.57
16 Tallahassee, FL 0.45 16 Jacksonville, FL -0.55
17 Lawrence, KS 0.44 17 Gainesville, FL -0.55
18 Sacramento, CA 0.43 18 Bloomington, IN -0.54
19 Fort Walton Beach, FL 0.41 19 Las Vegas, NV-AZ -0.54
20 Lansing-East Lansing, MI 0.40 20 Sioux Falls, SD -0.53
21 Columbus, GA-AL 0.37 21 Visalia-Tulare-Porterville, CA -0.53
22 Richland-Kennewick-Pasco, WA 0.36 22 Florence, SC -0.52
23 Tyler, TX 0.33 23 Grand Junction, CO -0.51
24 San Diego, CA 0.32 24 Bakersfield, CA -0.51
25 Jersey City, NJ 0.31 25 Topeka, KS -0.51
* Each metro must contain either a place with a minimum population of 50,000 or a Census Bureau defined urbanized area and total populationof at least 100,000 (75,000 in New England). Ametro comprises one or more counties.
** The Location Quotient (LQ) equals % output in metro divided by % output in the U.S. If LQ > 1.0, the industry is more concentrated in themetro area than in the U.S. on average.
Sources: Milken Institute, RFA
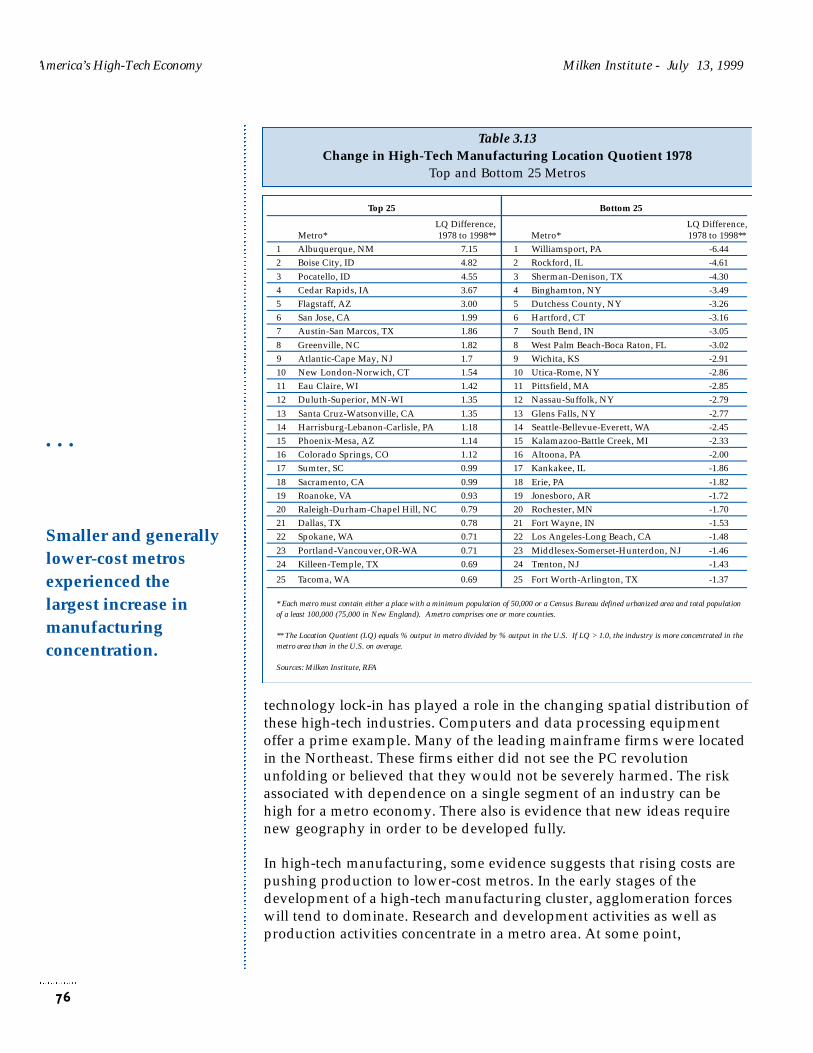
America’s High-Tech Economy Milken Institute - July 13, 1999
technology lock-in has played a role in the changing spatial distribution ofthese high-tech industries. Computers and data processing equipmentoffer a prime example. Many of the leading mainframe firms were locatedin the Northeast. These firms either did not see the PC revolutionunfolding or believed that they would not be severely harmed. The riskassociated with dependence on a single segment of an industry can behigh for a metro economy. There also is evidence that new ideas requirenew geography in order to be developed fully.
In high-tech manufacturing, some evidence suggests that rising costs arepushing production to lower-cost metros. In the early stages of thedevelopment of a high-tech manufacturing cluster, agglomeration forceswill tend to dominate. Research and development activities as well asproduction activities concentrate in a metro area. At some point,
76
Table 3.13Change in High-Tech Manufacturing Location Quotient 1978
Top and Bottom 25 Metros
• • •
Smaller and generallylower-cost metrosexperienced thelargest increase inmanufacturingconcentration.
Top 25 Bottom 25
LQ Difference, LQ Difference,Metro* 1978 to 1998** Metro* 1978 to 1998**
1 Albuquerque, NM 7.15 1 Williamsport, PA -6.44
2 Boise City, ID 4.82 2 Rockford, IL -4.61
3 Pocatello, ID 4.55 3 Sherman-Denison, TX -4.30
4 Cedar Rapids, IA 3.67 4 Binghamton, NY -3.49
5 Flagstaff, AZ 3.00 5 Dutchess County, NY -3.26
6 San Jose, CA 1.99 6 Hartford, CT -3.16
7 Austin-San Marcos, TX 1.86 7 South Bend, IN -3.05
8 Greenville, NC 1.82 8 West Palm Beach-Boca Raton, FL -3.02
9 Atlantic-Cape May, NJ 1.7 9 Wichita, KS -2.91
10 New London-Norwich, CT 1.54 10 Utica-Rome, NY -2.86
11 Eau Claire, WI 1.42 11 Pittsfield, MA -2.85
12 Duluth-Superior, MN-WI 1.35 12 Nassau-Suffolk, NY -2.79
13 Santa Cruz-Watsonville, CA 1.35 13 Glens Falls, NY -2.77
14 Harrisburg-Lebanon-Carlisle, PA 1.18 14 Seattle-Bellevue-Everett, WA -2.45
15 Phoenix-Mesa, AZ 1.14 15 Kalamazoo-Battle Creek, MI -2.33
16 Colorado Springs, CO 1.12 16 Altoona, PA -2.00
17 Sumter, SC 0.99 17 Kankakee, IL -1.86
18 Sacramento, CA 0.99 18 Erie, PA -1.82
19 Roanoke, VA 0.93 19 Jonesboro, AR -1.72
20 Raleigh-Durham-Chapel Hill, NC 0.79 20 Rochester, MN -1.70
21 Dallas, TX 0.78 21 Fort Wayne, IN -1.53
22 Spokane, WA 0.71 22 Los Angeles-Long Beach, CA -1.48
23 Portland-Vancouver, OR-WA 0.71 23 Middlesex-Somerset-Hunterdon, NJ -1.46
24 Killeen-Temple, TX 0.69 24 Trenton, NJ -1.43
25 Tacoma, WA 0.69 25 Fort Worth-Arlington, TX -1.37
* Each metro must contain either a place with a minimum population of 50,000 or a Census Bureau defined urbanized area and total populationof a least 100,000 (75,000 in New England). Ametro comprises one or more counties.
** The Location Quotient (LQ) equals % output in metro divided by % output in the U.S. If LQ > 1.0, the industry is more concentrated in themetro area than in the U.S. on average.
Sources: Milken Institute, RFA

Milken Institute - July 13, 1999 America’s High-Tech Economy
production costs and other forms of congestion-related costs can increasesufficiently to offset the initial location advantage of a metro. Newmanufacturing capacity will be developed in lower business-cost and less-expensive metros, but they must meet key basic criteria. In the case ofsemiconductors, new production facilities are extremely large and costly.New semiconductor facilities are being developed in Albuquerque, Austin,Boise City, Phoenix, and other lower-cost metros. Portland has experienceda boom in electronics capacity expansion, but there already are signs thatrising costs will limit future growth. Industry leaders such as Intel retainmuch of their research and development activities in Silicon Valley butbuild their new plants elsewhere. Austin, Dallas, and Sacramento owesome of their achievement in computer manufacturing to cost-of-doing-business advantages.
Further examination of the list of metros experiencing the fastest growth inhigh-tech industries reveals a high mix of small to medium-sized metrosthat are developing some concentration of these industries. Most of themetros (38 out of the top 50 in high-tech growth) are in the South andWest, and they rank high on most measures of cost of doing business, costof living, and on the elusive concept of quality of life. In essence, high-techmanufacturing concentration is being partially reallocated across thegeographic landscape. This pattern is true for some non-high-techmanufacturing industries as well. This is a dynamic, nonlinear process thatexerts its influence on the geographic landscape. New centers of high-techmanufacturing emerge, agglomeration forces foster further growth, and,ultimately, sustained success of these centers depends upon the degree towhich they can avoid high congestion-related and production costs.
Similar to high-tech manufacturing, the pace of high-tech services growthis fastest in small to medium-sized metro areas that have developed acritical mass of concentration. Contrary to manufacturing, however, theoverall concentration of high-tech services is rising. Large high-techservice metros are sustaining growth and accounting for a larger share ofnational output. Information technology may be a contributing factor tothis process. The expansion of digital communication capabilities, togetherwith their decline in costs, is permitting services to exploit agglomerationeconomies in new ways. Service activities should benefit more fromgeographic proximity than manufacturing. Computer and data processingservices are becoming more spatially concentrated, and the software andInternet-related activities especially so.
Despite some evidence of rising spatial dispersion in high-techmanufacturing, it is remarkable how concentrated it remains.Agglomeration forces have an amazing ability to sustain themselves, onlyto be thwarted at some point by very high congestion-related costs. A
77
The majority of the 25metros with thebiggest decline inmanufacturing werein the East andMidwest.
• • •
In high-techmanufacturing, thereis evidence that risingcosts are pushingproduction to lower-cost metros.
• • •
Most of the metros (38out of the top 50 inhigh-tech growth) arein the South andWest.
combination of high costs and either obsolete technology or firms is almostrequired before high-tech activity goes into a state of decline in a metroarea. The factors that determine the spatial patterns are difficult to model,but further research on their relative importance is crucial to a morethorough understanding of how metros can develop and expand high-technology-based industry clusters. Some degree of modeling attainmentalso may allow metro areas to identify the point at which cost factors areapproaching critical values, alerting them to a potential erosion of theirhigh-tech industry clusters.
As we enter the age of human capital, where firms merely leaseknowledge assets, firms’ location decisions will be increasingly basedupon quality-of-life factors that are important to attracting and retainingthis most vital economic asset. In high-tech services, strict business-costmeasures will be less important to growing and sustaining technologyclusters in metro economies. Locations that are attractive to knowledgeassets will play a vital role in regional economic success.
America’s High-Tech Economy Milken Institute - July 13, 1999
78
The expansion ofdigitalcommunicationcapabilities, togetherwith their decline incosts, is permittingservices to exploitagglomerationeconomies in newways.
• • •
Locations that areattractive toknowledge assets willplay a vital role inregional economicsuccess.
Milken Institute - July 13, 1999 America’s High-Tech Economy
SECTION 4
High-Tech Industriesand Economic Risks
Technology and high-tech industries are promoting favorable economicdevelopments throughout the U.S. economy on many dimensions.Technology is improving the economy’s long-term growth rate anddetermining the relative success of metropolitan areas within the country.On balance, the benefits to the economy far exceed the less-noticednegative aspects of technology-driven economic development. Thetechnology-driven economy — or New Economy as referred to by many— is causing a widening of income disparity along educational attainmentlevels, reducing job security and job tenure in many industries, andresulting in greater risk of unemployment among workers in their 50s(Benner, Brownstein, and Dean 1999). However, the risks emanating fromhigh tech that we will focus on in this section relate to the industry’sinherent volatility, its growing importance in the overall economy, and thecloser relationship between it and the business cycle of the U.S. economy.Will these risks prove to be severe for metropolitan areas that havedeveloped high-tech clusters which are prone either to technology cyclesor to fluctuations emanating from the broader economy, or is high-techimmune to the business cycle?
Life cycles in technology products are shortening, and major swings in theintroduction of new technology products can cause a high degree ofvolatility. After a period of rapid growth attributable to a new productinnovation, the absence of another major innovation can cause a dramaticslowdown, as witnessed in 1985 and 1989 in the computer andsemiconductor industries. High-tech industries have a large multipliereffect on the overall economy and a slowdown can have a significantimpact on the non-high-tech sector, both nationally and regionally.
Because high-tech industries account for so large a share of nationaloutput today, the economy is more vulnerable to a contraction in high techthan ever before. If there were a synchronous shock that was spread acrossa number of related technology industries, such as computers andsemiconductors, and combined with some other inauspiciousdevelopment, an economywide recession could occur. As reported inBusinessWeek, no less an authority than Andy Grove, Chairman and formerCEO of Intel, has commented on this: “every time we thought something
79
The risks emanatingform high tech, andthe focus of thissection, relate to theindustry’s inherentvolatility, its growingimportance in theoverall economy, andthe closer relationshipbetween it and U.S.business cycle.
• • •
If a synchronousshock were to spreadacross a number ofrelated technologyindustries, aneconomywiderecession could occur.
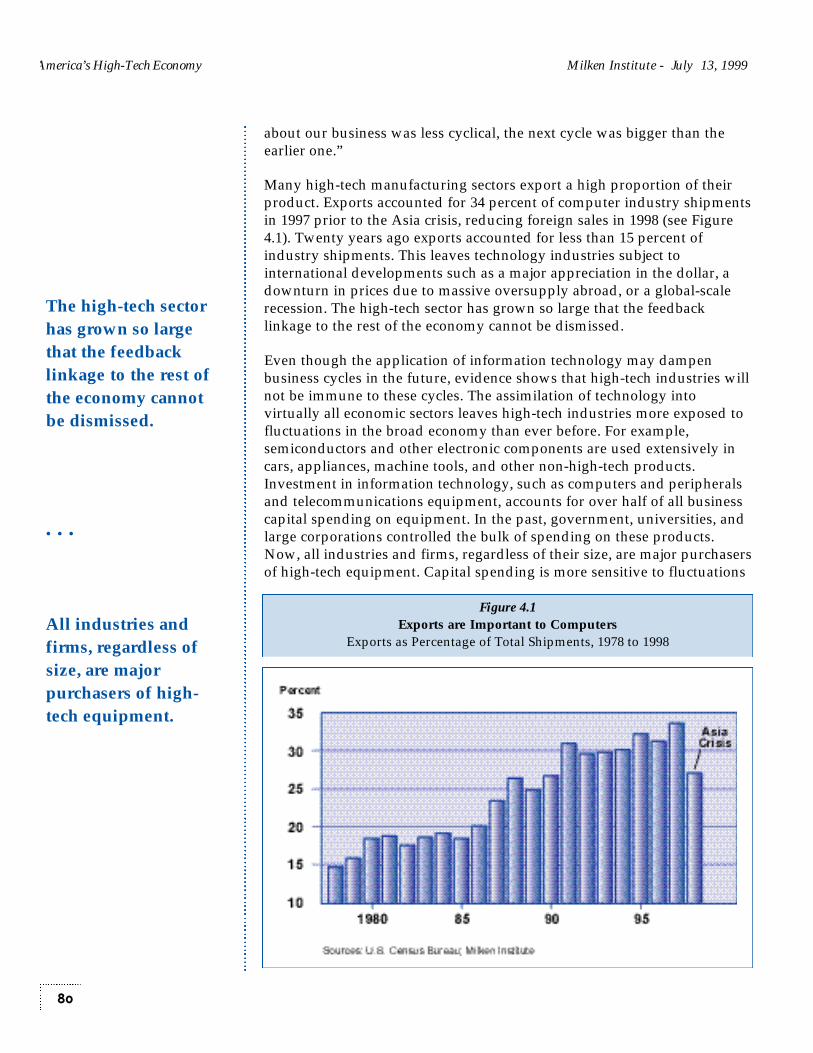
America’s High-Tech Economy Milken Institute - July 13, 1999
about our business was less cyclical, the next cycle was bigger than theearlier one.”
Many high-tech manufacturing sectors export a high proportion of theirproduct. Exports accounted for 34 percent of computer industry shipmentsin 1997 prior to the Asia crisis, reducing foreign sales in 1998 (see Figure4.1). Twenty years ago exports accounted for less than 15 percent ofindustry shipments. This leaves technology industries subject tointernational developments such as a major appreciation in the dollar, adownturn in prices due to massive oversupply abroad, or a global-scalerecession. The high-tech sector has grown so large that the feedbacklinkage to the rest of the economy cannot be dismissed.
Even though the application of information technology may dampenbusiness cycles in the future, evidence shows that high-tech industries willnot be immune to these cycles. The assimilation of technology intovirtually all economic sectors leaves high-tech industries more exposed tofluctuations in the broad economy than ever before. For example,semiconductors and other electronic components are used extensively incars, appliances, machine tools, and other non-high-tech products.Investment in information technology, such as computers and peripheralsand telecommunications equipment, accounts for over half of all businesscapital spending on equipment. In the past, government, universities, andlarge corporations controlled the bulk of spending on these products.Now, all industries and firms, regardless of their size, are major purchasersof high-tech equipment. Capital spending is more sensitive to fluctuations
80
The high-tech sectorhas grown so largethat the feedbacklinkage to the rest ofthe economy cannotbe dismissed.
• • •
All industries andfirms, regardless ofsize, are majorpurchasers of high-tech equipment.
Figure 4.1Exports are Important to Computers
Exports as Percentage of Total Shipments, 1978 to 1998

Milken Institute - July 13, 1999 America’s High-Tech Economy
in economic activity than any other component of the U.S. economy(Huffman 1994). Furthermore, information technology will make atempting target for cost cutting if an economic slowdown materializes.
We analyze the 14 high-tech sectors previously defined in order todetermine their sensitivity to the business cycle. We apply a series ofstatistical techniques in order to examine the risk that a recession mightpose to metropolitan economies. Could clusters of particular technologyindustries leave some metros far more exposed to an economic contractionthan they realize?
Is the Business Cycle Still Relevant?
Before analyzing the likely impact of a recession on technology industriesand metro high-tech clusters, it is important to establish that the businesscycle is still relevant. Some have suggested that the business cycle hasbeen repealed or at least appreciably dampened (Weber 1997). Thesearguments include factors such as: (1) globalization of production, (2)sector shifts in production to less-cyclical industries such as services, (3)financial services innovations and deregulation, (4) automatic fiscalstabilizers, (5) high growth in emerging markets, (6) more stable monetarypolicy, and (7) the application of information technology itself.
There is much optimism that the business cycle has been repealed — inother words, that economic and financial cycles have been eliminated.Victor Zarnowitz (1998, 1999) has pointed out that this notion is hardly anew development. These ideas were expressed in the mid- and late 1920s,just before the onset of the Great Depression; again during the longexpansion of the 1960s, which then was followed by the 1970 and thesevere mid-1970s recessions; and even in the late 1980s, prior to the 1990downturn. Forecasts of unending economic expansion have always provedincorrect. Business cycle peaks are nearly impossible to see in advance,and, indeed, difficult to recognize in the rear-view mirror. The belief thatthe business cycle has been repealed can cause ill-conceived andmisguided policies, complacency, and, ultimately, can worsen the severityof a recession. Expansions have become longer, however, and contractionsshorter, on average, in the postwar period.
The developments listed above will tend to mitigate the severity ofrecessions in the future but are unlikely to eliminate them. Informationtechnology is improving businesses’ ability to manage inventories andthus reduce a key source of contractions in the broad economy. Changes ininventory investment are responsible for a very large proportion of thechange in total business investment over the business cycle. Althoughchanges in inventory investment may not have been the major impulsemechanism behind postwar recessions, they were the major propagationforce in worsening them (Blinder 1981). Information technology and just-
81
Some have suggestedthat the business cyclehas been repealed orat least appreciablydampened.
• • •
Forecasts of unendingeconomic expansionhave always provedincorrect.
America’s High-Tech Economy Milken Institute - July 13, 1999
An economiccontraction orrecession occurs whenaggregate output fallsfor two consecutivequarters or more,loosely defined.
• • •
Because high-techmanufacturingproducts arepurchased forinvestment by firms,or by consumers asdurable goods, theoutput of these goodsshould be highlysusceptible to thebusiness cycle.
in-time production techniques permit firms to match production moreclosely with expected sales and reduce unplanned inventoryaccumulation. Sometimes this is referred to as supply-chain management,the function of which is to track many variables and produce an optimalproduction schedule. A major unanticipated shock to the economy,however, could still lead to an inventory accumulation that must beliquidated.
What is the “business cycle?” There are many possible definitions, but, ingeneral terms, it refers to fluctuations in U.S. aggregate economic activityaround their trend values. An economic contraction or recession occurswhen aggregate output falls for two consecutive quarters or more, looselydefined. Much research on the nature and causes of business cycles hasbeen performed. Even so, there is still much to be learned. Economistshave been successful in isolating key features and sectors of the economythat explain much of the observed pattern of business cycles.
Economists disagree to some extent about which sources are primary incausing the observed business cycle patterns. Some point to “real”business cycles, which are caused by changes in technology and supplyshocks. New Keynesians emphasize imperfect competition in input andoutput markets, which leads to nominal and real rigidities that contributeto the business cycle. Others emphasize monetary and fiscal policy errorsin responding to exogenous shocks. We will not attempt to resolve thisdebate but only to display characteristics of the sectoral components of theeconomy over the business cycle as they pertain to technology industries.
Some industries are much more cyclical than others, but it is remarkablehow little systematic research has been performed. Bruce Peterson andSteven Strongin (1996) conducted one of the most thorough studies on thissubject. They combined industrial organization concepts with laboreconomics and macroeconomics to address this issue using panel data for296 highly disaggregated manufacturing industries. They includeddemand-side conditions such as the durability of output, supply-sideconditions, and various elements of market structure. They found thatdurable-goods industries were three times more cyclical than nondurablegoods, and that nondurable goods industries were roughly as cyclical asthe overall economy. The degree to which the purchase of goods can bepostponed explains much of this observed pattern. Furthermore, theyconcluded that aggregate investment accounted for the majority of thedecline in real GDP during recessions. In another study, Judy Berman andJanet Pfleeger (1997) examined the degree to which the timing andamplitude of those industries that are characterized as cyclical vary. Theyconcluded that cyclical industries experience dramatically divergentimpacts from the business cycle on both dimensions. Because high-techmanufacturing products are purchased for investment by firms, or byconsumers as durable goods, the output of these goods should be highlysusceptible to the business cycle.
82
Milken Institute - July 13, 1999 America’s High-Tech Economy
In high-techmanufacturing, thestandard deviation ofthe growth rate in alleight industries washigher than totaloutput.
• • •
The current view isthat trends alsochange duringbusiness cycles.
High-Tech Industries and the Business Cycle
We analyze the behavior of high-tech industries over the business cycle byapplying several quantitative approaches. We utilize the national data setfrom the BLS’s Office of Employment Projections on real gross industryoutput. This provides annual data back to 1958, and we augment it byapplying quarterly patterns from manufacturing shipments, sales, andemployment information in a few industries. We isolate the cyclicalcomponent from the trend and irregular or random component of eachhigh-tech industry output series, compare the standardized cyclicalcomponent of each industry to the economy overall, and run regressionsto determine their relative cyclicality. Lastly, we test to see if therelationship with the business cycle is becoming stronger over time.
We calculated the standard deviation of the annual growth rate of realoutput for each of the high-tech industries and compared it to the samemeasure for total output. This is one way of examining whethertechnology industries are more volatile than the broad economy. In high-tech manufacturing, the standard deviation of the growth rate in all eightindustries was higher than total output, and only the drug segment wasless volatile than total manufacturing output. As an example, Figure 4.2compares the annual growth rate of electronic components and accessorieswith manufacturing overall and total output. The standard deviation ofoutput growth in electronic components is three times the size ofmanufacturing’s and nearly six times larger than total output’s. Computerand office equipment was slightly more volatile than electronics, asdisplayed in Table 4.1. Growth in high-tech services was not as volatile ashigh-tech manufacturing but was more volatile than total output.Computer and data processing services’ annual growth was more variablethan that of measuring and controlling devices. High-tech services arebecoming more volatile as they are increasingly integrated throughout theeconomy.
When analyzing the sensitivity of individual high-tech industries relativeto the aggregate business cycle, removing the irregular and trendcomponents is appropriate. The irregular component, by definition, is notaffected by the business cycle. We accomplished this by running each ofthe high-tech output series through a seasonal adjustment process (CensusX-11 variant B). This leaves us with the trend/cycle component of theoriginal series. The next step is to remove the trend component. Onemethod is to regress the trend/cycle against a time trend. This assumes adeterministic trend that is constant over time. Economists in recent yearshave concluded that this may be an inappropriate method for removingthe trend. The current view is that trends also change during businesscycles (Carlino and Sill 1997). Inaccurate removal of variable trends ofeconomic time series can result in incorrect cyclical components beingused in the analysis.
83

America’s High-Tech Economy Milken Institute - July 13, 1999
If a variable is trend stationary, current economic shocks, regardless of thesource, will have no long-term effects on the series. Stochastic, ornondeterminist, trends can be removed by a variety of methods. We choseto estimate the trend by a polynomial method. We regressed thetrend/cycle for each high-tech industry against the polynomial time trendsraised to a power until they were no longer individually significant(Enders 1995). The predicted values from these equations were thensubtracted from the trend/cycle, leaving us with the estimated cycle.
Lastly, to control for differences in amplitude between industries and totaloutput, and to be able to examine the timing and duration of the industrycycles, we standardized the cyclical component. Standardization wasaccomplished by dividing each industry’s cyclical component by itsstandard deviation. This process does not change the general cyclicalpattern; however, it does permits us to see turning points andcommonality of cycles more closely.
Graphing the standardized cyclical components of the high-tech industryoutput against manufacturing, other sectors, and the overall economyallows us to visually inspect the relationships. A few high-tech industrieslagged the cyclical movement in the overall economy, but many movedcoincident with it. We found that several high-tech industries did notmove closely with the overall economy between 1965 and 1985, but thatthe relationship tightened after 1985. Computers and office equipment hasbeen cycling much more closely with the overall economy since 1985, asdisplayed in Figure 4.3. The cyclical movement in computersapproximately matched that of the overall economy in the most recent
84
If a variable is trendstationary, currenteconomic shocks willhave no long-termeffects on the series.
• • •
We found that severalhigh-tech industriesdid not move closelywith the overalleconomy between1965 and 1985, butthat relationshiptightened after 1985.
Figure 4.2Electronics Highly VolatileReal Gross Industry Output
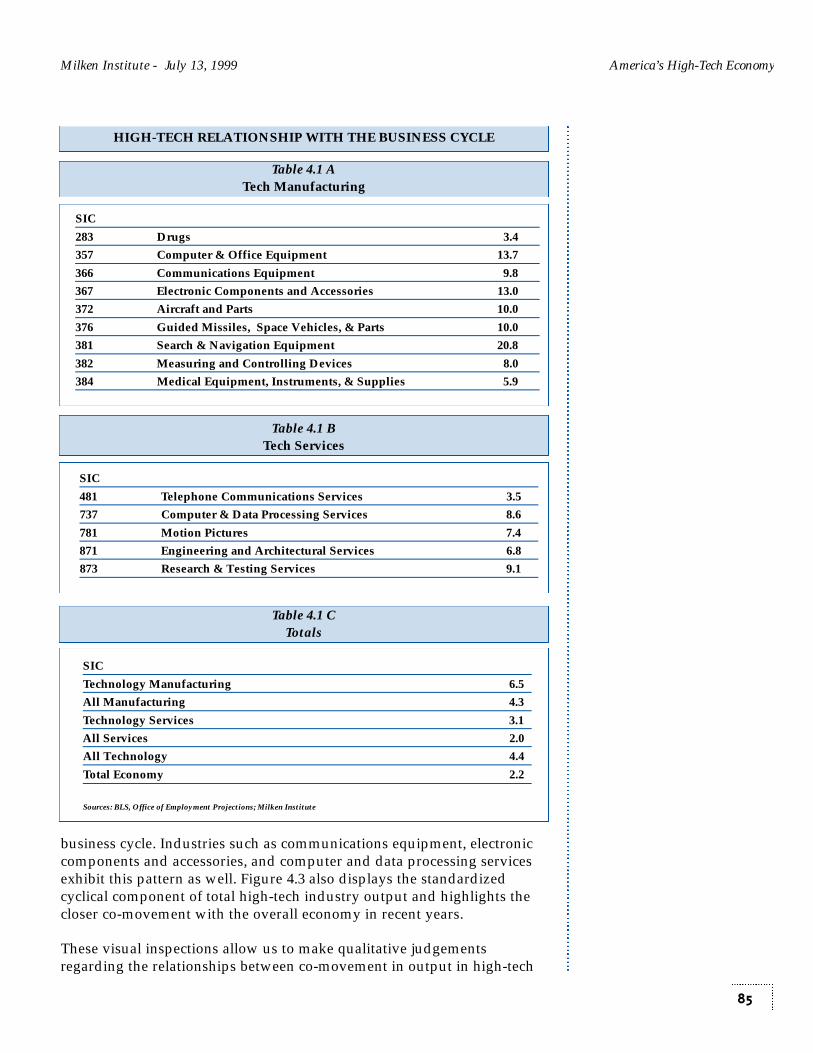
Milken Institute - July 13, 1999 America’s High-Tech Economy
business cycle. Industries such as communications equipment, electroniccomponents and accessories, and computer and data processing servicesexhibit this pattern as well. Figure 4.3 also displays the standardizedcyclical component of total high-tech industry output and highlights thecloser co-movement with the overall economy in recent years.
These visual inspections allow us to make qualitative judgementsregarding the relationships between co-movement in output in high-tech
85
Table 4.1 CTotals
Table 4.1 BTech Services
Table 4.1 ATech Manufacturing
HIGH-TECH RELATIONSHIP WITH THE BUSINESS CYCLE
SIC
283 Drugs 3.4
357 Computer & Office Equipment 13.7
366 Communications Equipment 9.8
367 Electronic Components and Accessories 13.0
372 Aircraft and Parts 10.0
376 Guided Missiles, Space Vehicles, & Parts 10.0
381 Search & Navigation Equipment 20.8
382 Measuring and Controlling Devices 8.0
384 Medical Equipment, Instruments, & Supplies 5.9
SIC
481 Telephone Communications Services 3.5
737 Computer & Data Processing Services 8.6
781 Motion Pictures 7.4
871 Engineering and Architectural Services 6.8
873 Research & Testing Services 9.1
SIC
Technology Manufacturing 6.5
All Manufacturing 4.3
Technology Services 3.1
All Services 2.0
All Technology 4.4
Total Economy 2.2
Sources: BLS, Office of Employment Projections; Milken Institute
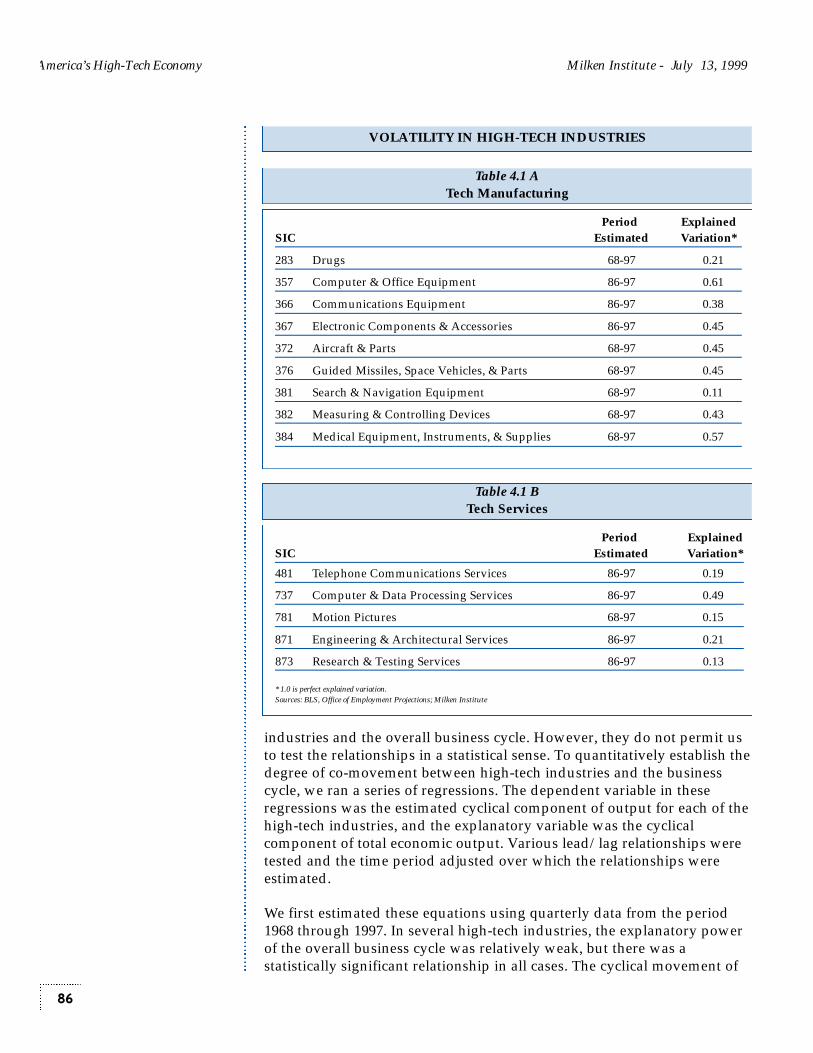
America’s High-Tech Economy Milken Institute - July 13, 1999
industries and the overall business cycle. However, they do not permit usto test the relationships in a statistical sense. To quantitatively establish thedegree of co-movement between high-tech industries and the businesscycle, we ran a series of regressions. The dependent variable in theseregressions was the estimated cyclical component of output for each of thehigh-tech industries, and the explanatory variable was the cyclicalcomponent of total economic output. Various lead/lag relationships weretested and the time period adjusted over which the relationships wereestimated.
We first estimated these equations using quarterly data from the period1968 through 1997. In several high-tech industries, the explanatory powerof the overall business cycle was relatively weak, but there was astatistically significant relationship in all cases. The cyclical movement of
86
Table 4.1 BTech Services
Table 4.1 ATech Manufacturing
VOLATILITY IN HIGH-TECH INDUSTRIES
Period ExplainedSIC Estimated Variation*
283 Drugs 68-97 0.21
357 Computer & Office Equipment 86-97 0.61
366 Communications Equipment 86-97 0.38
367 Electronic Components & Accessories 86-97 0.45
372 Aircraft & Parts 68-97 0.45
376 Guided Missiles, Space Vehicles, & Parts 68-97 0.45
381 Search & Navigation Equipment 68-97 0.11
382 Measuring & Controlling Devices 68-97 0.43
384 Medical Equipment, Instruments, & Supplies 68-97 0.57
Period ExplainedSIC Estimated Variation*
481 Telephone Communications Services 86-97 0.19
737 Computer & Data Processing Services 86-97 0.49
781 Motion Pictures 68-97 0.15
871 Engineering & Architectural Services 86-97 0.21
873 Research & Testing Services 86-97 0.13
* 1.0 is perfect explained variation.Sources: BLS, Office of Employment Projections; Milken Institute
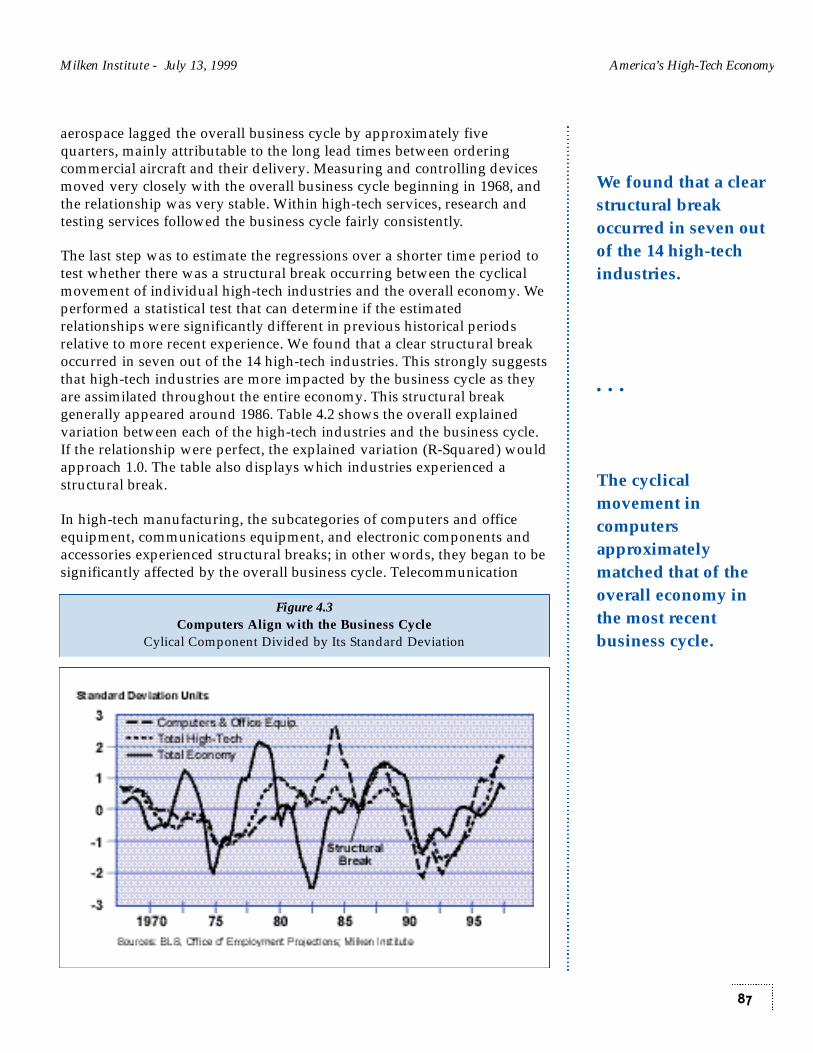
Milken Institute - July 13, 1999 America’s High-Tech Economy
aerospace lagged the overall business cycle by approximately fivequarters, mainly attributable to the long lead times between orderingcommercial aircraft and their delivery. Measuring and controlling devicesmoved very closely with the overall business cycle beginning in 1968, andthe relationship was very stable. Within high-tech services, research andtesting services followed the business cycle fairly consistently.
The last step was to estimate the regressions over a shorter time period totest whether there was a structural break occurring between the cyclicalmovement of individual high-tech industries and the overall economy. Weperformed a statistical test that can determine if the estimatedrelationships were significantly different in previous historical periodsrelative to more recent experience. We found that a clear structural breakoccurred in seven out of the 14 high-tech industries. This strongly suggeststhat high-tech industries are more impacted by the business cycle as theyare assimilated throughout the entire economy. This structural breakgenerally appeared around 1986. Table 4.2 shows the overall explainedvariation between each of the high-tech industries and the business cycle.If the relationship were perfect, the explained variation (R-Squared) wouldapproach 1.0. The table also displays which industries experienced astructural break.
In high-tech manufacturing, the subcategories of computers and officeequipment, communications equipment, and electronic components andaccessories experienced structural breaks; in other words, they began to besignificantly affected by the overall business cycle. Telecommunication
87
We found that a clearstructural breakoccurred in seven outof the 14 high-techindustries.
• • •
The cyclicalmovement incomputersapproximatelymatched that of theoverall economy inthe most recentbusiness cycle.
Figure 4.3Computers Align with the Business Cycle
Cylical Component Divided by Its Standard Deviation

America’s High-Tech Economy Milken Institute - July 13, 1999
services, computer and data processing services, engineering andarchitectural services, and research and testing services experienced astructural break after 1986. In most high-tech industries, nearly half of theoverall variation in their cyclical components can be explained by theoverall business cycle (Table 4.2). After 1986, the cyclical components ofcomputers and office equipment, electronic components, medicalequipment, and computer and data processing services moved closelywith the business cycle. This finding has major implications for the future:software, data management consulting, and programming consulting arelikely to be impacted by movements in the overall economy.
Recession Risk: High-Tech Industries and Metros
We have demonstrated that high-tech industries are more closely tied tothe cyclical behavior of the overall economy, but what might this mean forthe future of these industries and clusters around the country? To attemptto address this question, we simulated a hypothetical recession at somepoint in the future to see how individual high-tech industries mightbehave. As stated earlier, future recessions are likely to be less severe asinformation technologies are applied, thus dampening swings ininventories by improving communication flows. We chose to simulate a1990–91 style recession, which was mild by historical standards with just a1.0 percent peak-to-trough decline. It is possible to argue that thenext–recession could be even milder, but imposing a 1990–91 typerecession does allow a relative benchmarking. We chose to impose arecession in the first quarter of 2000, lasting until the third quarter of thesame year.
The equations estimated in the previous section linking the cyclicalcomponents of high-tech industries with the overall economy were used inthis hypothetical simulation. The results of the simulation are displayed inTable 4.3. This table displays the percentage peak-to-trough decline andthe percentage decline in the cycle relative to the trend for each of thehigh-tech industries versus the total output in the economy. The totaleconomy experiences a peak-to-trough decline of 1.0 percent and a 4.9percent decline in the cyclical component relative to trend. This is animportant distinction because most high-tech industries have a strongupward trend, but their cyclical component can still experience a largedecline.
Based upon our estimated relationships, high-tech manufacturingindustries would experience a substantially more severe decline than theoverall economy, and could even exacerbate the overall decline in theeconomy. For example, the estimated peak-to-trough decline in computersand office equipment is 11.9 percent, closely followed by aerospace.Output of electronic components falls by more than the overall economy.
88
In most high-techindustries, nearly halfof the overallvariation in theircyclical componentscan be explained bythe overall businesscycle.
• • •
Future recessions arelikely to be lesssevere as informationtechnologies areapplied.
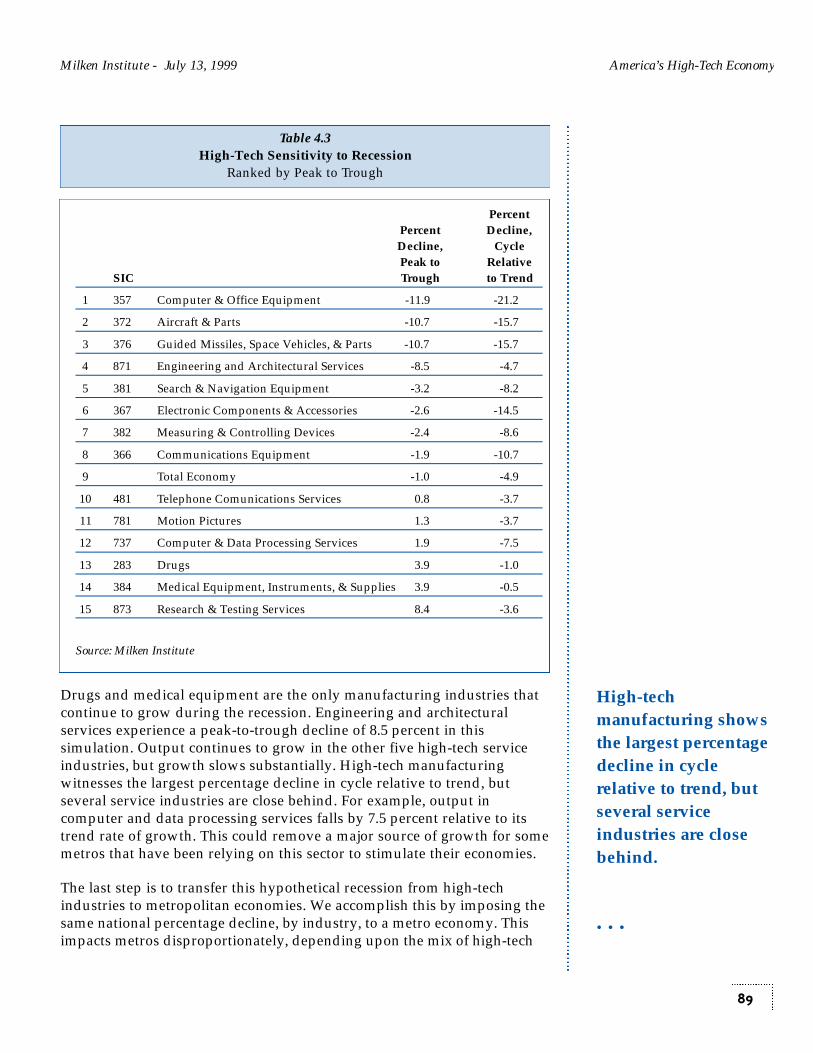
Milken Institute - July 13, 1999 America’s High-Tech Economy
Drugs and medical equipment are the only manufacturing industries thatcontinue to grow during the recession. Engineering and architecturalservices experience a peak-to-trough decline of 8.5 percent in thissimulation. Output continues to grow in the other five high-tech serviceindustries, but growth slows substantially. High-tech manufacturingwitnesses the largest percentage decline in cycle relative to trend, butseveral service industries are close behind. For example, output incomputer and data processing services falls by 7.5 percent relative to itstrend rate of growth. This could remove a major source of growth for somemetros that have been relying on this sector to stimulate their economies.
The last step is to transfer this hypothetical recession from high-techindustries to metropolitan economies. We accomplish this by imposing thesame national percentage decline, by industry, to a metro economy. Thisimpacts metros disproportionately, depending upon the mix of high-tech
89
High-techmanufacturing showsthe largest percentagedecline in cyclerelative to trend, butseveral serviceindustries are closebehind.
• • •
Table 4.3High-Tech Sensitivity to Recession
Ranked by Peak to Trough
Percent Percent Decline,Decline, Cycle Peak to Relative
SIC Trough to Trend
1 357 Computer & Office Equipment -11.9 -21.2
2 372 Aircraft & Parts -10.7 -15.7
3 376 Guided Missiles, Space Vehicles, & Parts -10.7 -15.7
4 871 Engineering and Architectural Services -8.5 -4.7
5 381 Search & Navigation Equipment -3.2 -8.2
6 367 Electronic Components & Accessories -2.6 -14.5
7 382 Measuring & Controlling Devices -2.4 -8.6
8 366 Communications Equipment -1.9 -10.7
9 Total Economy -1.0 -4.9
10 481 Telephone Comunications Services 0.8 -3.7
11 781 Motion Pictures 1.3 -3.7
12 737 Computer & Data Processing Services 1.9 -7.5
13 283 Drugs 3.9 -1.0
14 384 Medical Equipment, Instruments, & Supplies 3.9 -0.5
15 873 Research & Testing Services 8.4 -3.6
Source: Milken Institute

America’s High-Tech Economy Milken Institute - July 13, 1999
industries and their proportion of the local economic base. This method issubject to some criticism. It assumes that output would declineproportionately around the country within the same industry. Industrystructure is more complicated than this. If a metro economy has morerecently added capacity within an industry, and is therefore more efficient,output likely will fall less than the national average during a recession.Nevertheless, this method does provide a means of benchmarking therelative sensitivity of metropolitan economies with a large high-tech base.
Table 4.4 displays the relative sensitivity of the Milken Institute Tech-Polesdescribed earlier. It highlights the risk associated with concentrationwithin one major tech industry in the case of Rochester, MN, especially tothe most cyclical of all tech industries: computers and office equipment.Based upon this simulation, Rochester would experience the most severepeak-to-trough decline of the Tech-Poles, falling by 11.6 percent. Wichita,KN, is the second most impacted because of its high concentration ofaircraft. Tucson, AZ, experiences a peak-to-trough decline in high-tech of7.8 percent due to guided missiles and space vehicles. West Palm Beach-Boca Raton, FL, is negatively impacted by its high concentration of aircraftand parts and communications equipment. Boise, ID, also has highexposure due to electronic components and to computers and officeequipment. Raleigh-Durham-Chapel Hill is sensitive to the business cyclebecause of computers, as is Sacramento. Austin’s success in computers andsemiconductors leaves it exposed to a recession in the future.
San Jose (Silicon Valley) has the most exposure to a future recessionamong the top 15 Tech-Poles. It is diversifying its economic base awayfrom high-tech manufacturing to services but still has a very highconcentration of computers, electronics, and communications equipment.High-tech service clusters in Dallas, Los Angeles, Washington, Chicago,and New York leave these metros less exposed to a future recession. Thecollapse of Los Angeles’s aerospace industry in the early 1990s — althoughstructurally painful — leaves it much less sensitive to the business cycle.
Table 4.5 displays the 50 metro high-tech economies exposed mostseverely to a future recession. Rochester is at the top, followed by EauClaire, WI. The most severely impacted metros have dense concentrationsof computers and office equipment, aircraft, communications equipment,and electronic components. Metros with a heavy reliance on high-techservices are generally not on the list, but because of high-tech services’growing susceptibility to the business cycle, they will be more exposed inthe future. This analysis suggests that metros that have experienced a highdegree of success in developing clusters of computer, semiconductor, andother high-tech manufacturing industries should be more aware of thepotential risks that a recession could pose to their local economies. Mosteconomic development and government officials have encouraged these
90
Missing Pull Quote
• • •
In this simulation,Rochester, MN, wouldexperience the mostsevere peak-to-troughdecline.
• • •
High-tech serviceclusters in Dallas, LosAngeles, Washington,Chicago, and NewYork leave thesemetros less exposed toa future recession.
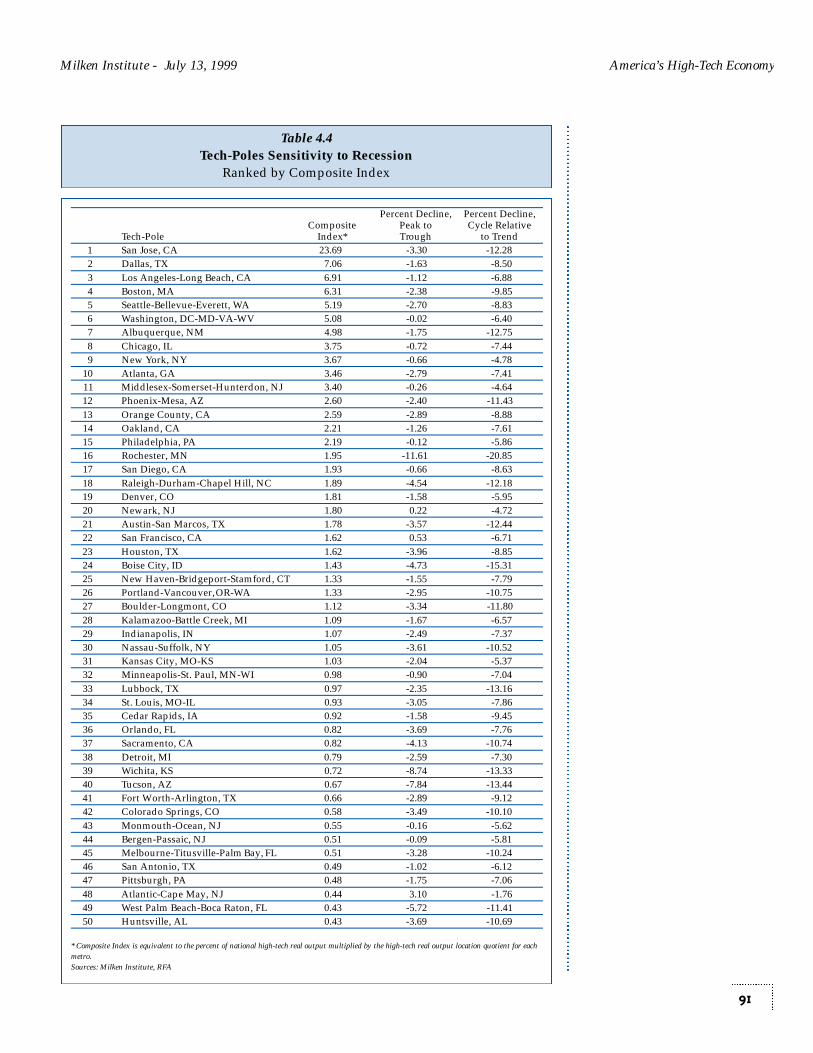
Milken Institute - July 13, 1999 America’s High-Tech Economy
91
Table 4.4Tech-Poles Sensitivity to Recession
Ranked by Composite Index
Percent Decline, Percent Decline, Composite Peak to Cycle Relative
Tech-Pole Index* Trough to Trend1 San Jose, CA 23.69 -3.30 -12.282 Dallas, TX 7.06 -1.63 -8.50
3 Los Angeles-Long Beach, CA 6.91 -1.12 -6.884 Boston, MA 6.31 -2.38 -9.855 Seattle-Bellevue-Everett, WA 5.19 -2.70 -8.836 Washington, DC-MD-VA-WV 5.08 -0.02 -6.407 Albuquerque, NM 4.98 -1.75 -12.75
8 Chicago, IL 3.75 -0.72 -7.449 New York, NY 3.67 -0.66 -4.78
10 Atlanta, GA 3.46 -2.79 -7.4111 Middlesex-Somerset-Hunterdon, NJ 3.40 -0.26 -4.6412 Phoenix-Mesa, AZ 2.60 -2.40 -11.43
13 Orange County, CA 2.59 -2.89 -8.8814 Oakland, CA 2.21 -1.26 -7.6115 Philadelphia, PA 2.19 -0.12 -5.8616 Rochester, MN 1.95 -11.61 -20.8517 San Diego, CA 1.93 -0.66 -8.63
18 Raleigh-Durham-Chapel Hill, NC 1.89 -4.54 -12.1819 Denver, CO 1.81 -1.58 -5.9520 Newark, NJ 1.80 0.22 -4.7221 Austin-San Marcos, TX 1.78 -3.57 -12.4422 San Francisco, CA 1.62 0.53 -6.71
23 Houston, TX 1.62 -3.96 -8.8524 Boise City, ID 1.43 -4.73 -15.3125 New Haven-Bridgeport-Stamford, CT 1.33 -1.55 -7.7926 Portland-Vancouver, OR-WA 1.33 -2.95 -10.7527 Boulder-Longmont, CO 1.12 -3.34 -11.80
28 Kalamazoo-Battle Creek, MI 1.09 -1.67 -6.5729 Indianapolis, IN 1.07 -2.49 -7.3730 Nassau-Suffolk, NY 1.05 -3.61 -10.5231 Kansas City, MO-KS 1.03 -2.04 -5.3732 Minneapolis-St. Paul, MN-WI 0.98 -0.90 -7.04
33 Lubbock, TX 0.97 -2.35 -13.1634 St. Louis, MO-IL 0.93 -3.05 -7.8635 Cedar Rapids, IA 0.92 -1.58 -9.4536 Orlando, FL 0.82 -3.69 -7.7637 Sacramento, CA 0.82 -4.13 -10.74
38 Detroit, MI 0.79 -2.59 -7.3039 Wichita, KS 0.72 -8.74 -13.3340 Tucson, AZ 0.67 -7.84 -13.4441 Fort Worth-Arlington, TX 0.66 -2.89 -9.1242 Colorado Springs, CO 0.58 -3.49 -10.10
43 Monmouth-Ocean, NJ 0.55 -0.16 -5.6244 Bergen-Passaic, NJ 0.51 -0.09 -5.8145 Melbourne-Titusville-Palm Bay, FL 0.51 -3.28 -10.2446 San Antonio, TX 0.49 -1.02 -6.1247 Pittsburgh, PA 0.48 -1.75 -7.06
48 Atlantic-Cape May, NJ 0.44 3.10 -1.7649 West Palm Beach-Boca Raton, FL 0.43 -5.72 -11.4150 Huntsville, AL 0.43 -3.69 -10.69
* Composite Index is equivalent to the percent of national high-tech real output multiplied by the high-tech real output location quotient for eachmetro.Sources: Milken Institute, RFA
America’s High-Tech Economy Milken Institute - July 13, 1999
industries to locate within their borders, hoping that these industrieswould help insolate them from future business cycles. While these high-tech industries will assist metro long-term relative performance, they areunlikely to shield them from fluctuations in aggregate economic activity.
92
While these high-techindustries will assistmetro long-termrelative performance,they are unlikely toshield them fromfluctuations inaggregate economicactivity.
• • •

Milken Institute - July 13, 1999 America’s High-Tech Economy
93
Table 4.5Metros Most Sensitive to High-Tech Recession
Ranked by Peak to Trough
Percent Decline, Percent Decline, Peak to Cycle Relative
Tech-Pole Trough to Trend
1 Rochester, MN -11.61 -20.852 Eau Claire, WI -9.78 -17.743 South Bend, IN -8.86 -13.934 Wichita, KS -8.74 -13.335 Killeen-Temple, TX -8.24 -15.34
6 Williamsport, PA -8.03 -12.397 Tucson, AZ -7.84 -13.448 La Crosse, WI-MN -6.57 -14.399 Sheboygan, WI -6.27 -8.11
10 Jamestown, NY -6.20 -12.35
11 Benton Harbr, MI -6.02 -10.8812 Dutchess County, NY -5.73 -15.6613 West Palm Beach-Boca Raton, FL -5.72 -11.4114 Rockford, IL -5.60 -10.0715 Lexington, KY -5.30 -10.67
16 Fort Collins-Loveland, CO -5.27 -13.4017 Greeley, CO -5.20 -12.3618 Yakima, WA -5.18 -8.4619 Fayetteville, NC -4.95 -7.9720 Beaumont-Port Arthur, TX -4.93 -9.26
21 Utica-Rome, NY -4.85 -10.4822 Fayetteville-Springdale-Rogers, AR -4.83 -8.1723 Baton Rouge, LA -4.80 -7.3524 Boise City, ID -4.73 -15.3125 Savannah, GA -4.72 -8.30
26 Knoxville, TN -4.70 -9.4827 Mansfield, OH -4.69 -7.4328 Amarillo, TX -4.59 -8.6229 Raleigh-Durham-Chapel Hill, NC -4.54 -12.1830 Brownsville-Harlingen-San Benito, TX -4.51 -9.52
31 Erie, PA -4.41 -8.2832 Lake Charles, LA -4.38 -6.8033 Parkerburg-Marietta, WV-OH -4.28 -7.5534 Lakeland-Winter Haven, FL -4.22 -7.0035 Hamilton-Middletown, OH -4.16 -8.73
36 Binghamton, NY -4.15 -11.2237 Sacramento, CA -4.13 -10.7438 Greenville-Spartanburg-Anderson, SC -4.13 -8.0539 Altoona, PA -4.11 -7.2440 Mobile, AL -4.10 -7.90
41 Bellingham, WA -4.09 -8.6642 Green Bay, WI -4.08 -7.3343 Toledo, OH -4.03 -10.0144 Houston, TX -3.96 -8.8545 Lewiston-Auburn, ME -3.83 -7.73
46 Roanoke, VA -3.81 -8.6047 Abilene, TX -3.77 -8.5748 Santa Fe, NM -3.77 -8.7649 Dayton-Springfield, OH -3.77 -9.9950 Punta Gorda, FL -3.75 -6.38
* Each metro must contain either a place with a minimum population of 50,000 or a Census Bureau defined urbanized area and total populationof a least 100,000 (75,000 in New England). Ametro compromises one or more counties.Sources: Milken Institute, RFA

Milken Institute - July 13, 1999 America’s High-Tech Economy
SECTION 5
Key EconomicDevelopment andBusiness PlanningImplications
In previous sections, we demonstrated the potential and actual benefitsof high-tech clustering to regional economic growth in metropolitan areas.The success of many metropolitan areas in the 1990s is contingent uponeither their ability to attract and nurture high-tech-oriented industries, or,in other cases, historical endowment that enables them to promoteexpansion of their high-tech industry base. In either case, the result of suchhigh-tech-driven growth — or endogenous economic growth — has beensubstantial. As a result of this remarkable economic performance, Tech-Pole regions such as San Jose and Boston have been the subjects of variouseconomic studies. Serious attempts have also been made across thecountry, and even around the world, to duplicate “the San Joseexperience,” e.g., Austin and Dallas in Texas, Boise in Idaho, Hsinchu inTaiwan, and Kyushu in Japan. Many regions have at least to some degreemade great strides in high tech developments, but none has been asdynamic and as broadly developed as San Jose (Silicon Valley).
In the Section 4 of this study, a detailed analysis of high-tech industriesand economic risk suggested that a number of regional technology clusterswill face greater uncertainty in the future, in contrast to the euphoric pastassessments of the industry’s resiliency during economic downturns. Themuted cyclical or business cycle neutrality characteristics of high-techindustries will likely disappear in the future as technology andtechnological applications are more widely adapted and defused in the“new” economic system. A more “commercialized” technology industrywill inevitably entangle with the national economy and economic cycle.Furthermore, the geographic and physical constraints of a regionaleconomy could also impose limitations on future high-tech industrygrowth.
In light of this tremendous opportunity for employment gain and incomegrowth, as well as the potential risks in regional and national economic
95
High-tech-driveneconomic growth isthe success story ofthe 1990s.
• • •
The benefit of high-tech growth is wellpublicized, but therisk that comes with itis not addressed norunderstood.
America’s High-Tech Economy Milken Institute - July 13, 1999
downturns, a proper form of public policy and economic developmentstrategy that can lead to the rapid development of a technology-basedeconomy has to be carefully formulated. However, before we can assesswhat types or orientation of policy can be applied, we first need to defineand describe the characteristics of high-tech industries and how theyoperate. High-technology industries can be characterized as:
Industries that hunger for new ideas and concepts rather than a pieceof hardware or machine; knowledge is valued far more highly thanphysical inputs.
Industries with global content and linkages, not solely about servingthe local community or bound by geography.
Industries that emphasize innovation over mass production andentrepreneurial spirit over the risk of failure.
Industries that have a highly mobile and skilled labor force operatingin a fiercely competitive environment.
Industries that, whether heterogeneous or homogeneous in size, incapability, or in specialization, require intensive and expensive basicresearch and development, as the accumulation of the basic researchembodies and fosters entrepreneurial growth.
What advantages do these characteristics provide for a regional economy?What kind of economic environment helps create and foster superiordevelopment? High-tech economic growth brings rapid accumulation ofwealth and employment opportunity to a region. High-tech—basedgrowth transforms and elevates the requirements for the skill-set of thelocal labor force, drastically alters regional income distribution, andchanges the existing demographic mix and business culture in the region.Along with these positive externalities induced by the tech-basedeconomic growth, negative impacts manifest themselves. A high influx ofskilled labor from other regions, as well as out-migration of existinghouseholds, disrupts local ways of life. Long-existing local culture isdiluted if not displaced; rapid growth in population as well as wealthbrings congestion and rising housing costs. High mobility, however, is thenature of high-tech industries and their work forces. It is almostimpossible to predict when and to where high-tech workers and industrieswill migrate. These are the issues and difficulties that regional plannersand economic development officials have to anticipate and for which theymust plan.
About 50 years ago, economic development in different regions inside andoutside the United States took center stage. Various theories and policieswere adopted, only later to be rejected on the basis of being overlysimplistic or difficult to administrate (Higgins and Savoie 1995). In the
96
While the economicbenefit of high-technology-drivengrowth is very similarto that of other meansof economicexpansion, the factorsthat constitute suchgrowth are completelydifferent.
• • •
High-tech growthbrings economicvitality to a region butcomes with certaincosts.
■
■
■
■
■

Milken Institute - July 13, 1999 America’s High-Tech Economy
1970s and 1980s, with compounding problems of urban decay and therapid deterioration of many once U.S.–dominated industries, regionaleconomic development became critically important as a policy tool; itrepresented a remedy for state and local governments — an opportunity torevitalize their local economies. Despite proactive federal, state, and localgovernmental policy and funding (EDC/SBA/EPA), economicdevelopment that depends on a “home grown” or endogenous growthhad mixed results. Most of the larger and older urban areas in the UnitedStates channeled their revitalization efforts into introducing “exogenous”growth measures.
Economic Policy and High Tech Clustering
The vitality of high-tech industries and the economic benefits derivedfrom them are well documented and analyzed in this study and in otherpublications. A more important and relevant question, however, remains.Can the economic achievements of San Jose, Boise, Austin, andAlbuquerque be duplicated? More precisely, can economic policy inducehigh-tech industry formation and augment high-tech clustering in aregion? Those metropolitan areas exemplify how technology andtechnological applications can promote regional economic development. Ifthey can be duplicated, what kind of public policy and economicdevelopment strategy can expedite and fortify development in the future?
We list a set of variables that matters to the development of regional high-tech industries in Table 5.1. State and local governments, public policies,and the interaction between private and public sectors are crucial for thegenesis, the expansion, and the fortification phases of high-techdevelopment. Nonetheless, due to the unique characteristics of high-techindustries, government’s role is also limited. Overly active governmentintervention and public policy may be counterproductive and harmful tothe long-term development of high-tech industries. In the table, we dividethose factors into three groups: public policy, comparative locationbenchmarking, and social infrastructure development. We rated eachfactor based upon its importance in different stages of regional economicdevelopment and its effectiveness in helping the establishment of aregional high-tech cluster. All factors in the table are interrelated. Becauseof this, the role of local government is critical to the development process.
Long before high-tech industries’ significant contribution to regionaleconomic growth and prosperity was recognized, government played animportant role in fortifying regional high-tech formation and clustering(Sternberg 1996). However, research centers and institutions areundisputedly the most important factor in incubating high-tech industries.Furthermore, the technical capability and scientific research activitiestherein train and educate the labor that will be critical in expanding andreinforcing regional high-tech industries. A form of public and privateventure that aims to establish and maintain leading-edge regional research
97
Government can playan important role indeveloping a high-tech economy.
• • •
However, publicpolicy andgovernmentintervention may beinadequate to guidedevelopment in therapidly changingtechnologyenvironment.
• • •
Establishing andnurturing researchcenters and promotingeducation are amongthe basic and mosteffective publicpolicies.
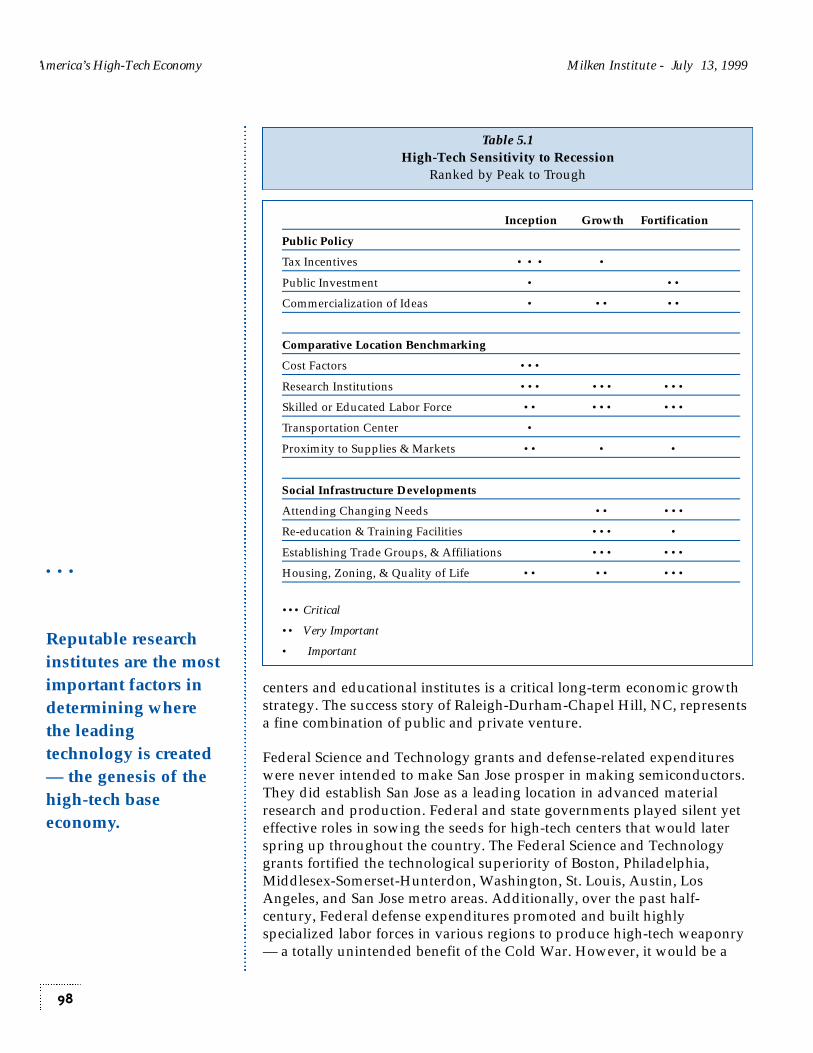
America’s High-Tech Economy Milken Institute - July 13, 1999
centers and educational institutes is a critical long-term economic growthstrategy. The success story of Raleigh-Durham-Chapel Hill, NC, representsa fine combination of public and private venture.
Federal Science and Technology grants and defense-related expenditureswere never intended to make San Jose prosper in making semiconductors.They did establish San Jose as a leading location in advanced materialresearch and production. Federal and state governments played silent yeteffective roles in sowing the seeds for high-tech centers that would laterspring up throughout the country. The Federal Science and Technologygrants fortified the technological superiority of Boston, Philadelphia,Middlesex-Somerset-Hunterdon, Washington, St. Louis, Austin, LosAngeles, and San Jose metro areas. Additionally, over the past half-century, Federal defense expenditures promoted and built highlyspecialized labor forces in various regions to produce high-tech weaponry— a totally unintended benefit of the Cold War. However, it would be a
98
• • •
Reputable researchinstitutes are the mostimportant factors indetermining wherethe leadingtechnology is created— the genesis of thehigh-tech baseeconomy.
Table 5.1High-Tech Sensitivity to Recession
Ranked by Peak to Trough
Inception Growth Fortification
Public Policy
Tax Incentives • • • •
Public Investment • ••
Commercialization of Ideas • •• ••
Comparative Location Benchmarking
Cost Factors •••
Research Institutions ••• ••• •••
Skilled or Educated Labor Force •• ••• •••
Transportation Center •
Proximity to Supplies & Markets •• • •
Social Infrastructure Developments
Attending Changing Needs •• •••
Re-education & Training Facilities ••• •
Establishing Trade Groups, & Affiliations ••• •••
Housing, Zoning, & Quality of Life •• •• •••
••• Critical
•• Very Important
• Important

Milken Institute - July 13, 1999 America’s High-Tech Economy
mischaracterization to overly emphasize the role of the federalgovernment in establishing high-tech centers in those regions.
Pre-existing technology research centers and institutions and the pool ofhighly talented researchers played a more instrumental role than thegovernment in the formation of regional technology production centers.Hence, radar and signal processing research grants were channeled toNew Jersey (Bell Labs) and San Diego (Naval base). Semiconductorresearch grants went to the San Francisco Bay Area where Berkeley andStanford were located. Systems integration grants went to the GreaterBoston area where MIT, Wang Computer, and DEC were located. In otherwords, government plays a significant, yet limited role in high-techformation and clustering in regions. Nonetheless, this limited yet veryimportant function assumed by government established the landscape ofhigh-technology regions across the country. Through its seeminglyunintended policy over the past 50 years, the federal government hasreinforced the position of those regions’ eminent role in leading-edgeresearch and production.
If the formation of high-tech clusters is a “random” event, as manyregional economists and economic geographers tend to believe (Krugman1997), then the expansion of high-technology clusters is the result of anindeterminate dynamic interaction among firms, industry, andgovernment. A proper venue of public policy or development strategy thatis intended to strengthen the development of high-tech industries is animportant endeavor. Providing a readily available labor pool is probablythe best investment that state and local governments can make. The highlysuccessful experiences in metropolitan areas such as Boise, ID, Austin, TX,and others all show one significant common characteristic. Thesemetropolitan areas’ rankings on the percentage of college graduates in thelabor force are within the top 20 percent of all metros in the country. Boise,for example, ranked 61 of 319 metropolitan areas on this measure. Thebuilding up of Austin’s high-tech research complex by the state and localgovernments, in conjunction with the recruitment of new technology firmsinto its existing technology base in late the 1980s and 1990s, proved to be ahighly effective policy. Public investments in basic research establishedcompetitive advantages that benefited both Austin and Dallas in the 1990s.
Enhancing and reinforcing high-tech research capability both in basicresearch and in applied research (commercializing ideas and technology)can be a fruitful and effective public policy, especially during the growthstage of the high-tech industries. Promoting and marketing the region’sindustrial capability and research results serve to link the region’sintellectual power to practical applications. This policy does more thanturn ideas and knowledge into tangible products. More critically, theprocess attracts investments, venture capital, and other talented workers tothe region, thus enhancing economic performance of the region thereafter.
99
A leading researchcenter also attractsinvestment andfosters the buildup ofregional productionfacilities.
• • •
In a dynamic high-tech economy, skilledlabor and qualityeducation are the keyingredients of success.
• • •
Selling andpromoting the localhigh-tech researchcapability can helpreinforce localindustries’ linkages toand dominance in theoutside world.

America’s High-Tech Economy Milken Institute - July 13, 1999
One important distinction of high-tech development is its dynamic andconstantly evolving content and orientation. Location factors, a favorableterm that development economists emphasize relentlessly, are a set ofvariables that remain significantly important, yet no longer sufficient inguaranteeing the long-term prosperity of regional high-tech industries.Costs of doing business, proximity to both suppliers and markets, and theattributes of quality and amenity of life that have traditionally weighedheavily are no longer sufficient to explain the gravitational force of the SanJose, Boston and Washington metros. The importance of these attributeschanges in the course of development. For instance, a high cost of doingbusiness is an unfavorable factor in locating business.
The San Francisco Bay Area is the most expensive location in the country,yet the Bay Area remains the most concentrated Tech-Pole in the country(Table 3.8). One cannot rule out the possibility that the success of suchhigh-profile metropolitan areas is based at least partially on the high costof doing business in those regions. High costs can become the catalyst forexisting firms in the region to pursue higher revenues through inventingnew concepts and products. High costs also force out marginal or olderproducts, an evolutionary step that is both necessary and essential for thehigh-tech cluster to remain at the leading edge of technology innovation. Ithelps create an absolutely dynamic high-tech cluster base that preventsany high tech firm or industry from “lock in.” In the later stage of a high-tech development, the importance of cost factors and proximity tosuppliers and markets is diminished.
Unfavorable costs may not be a significant deterrent to expanding high-tech economies in Boston and San Jose, but they might prove critical toemerging locations. When other factors are equal, low-cost regions doattract high-tech manufacturing. The location factors in Boise, ID, are nearideal. Abundant labor supply and relatively low labor wages and localtaxes enable the region to specialize in semiconductors and relatedaccessories, producing low-end products where cost efficiency is critical.Besides having an adequately educated labor force, falling shipping costsand a favorable local business environment enhance the region’s capabilityas a manufacturing and processing center.
Some other very similar success stories can be told about Sioux Falls, SD,and Rochester, MN. These cases are inarguably the success stories inbuilding and nurturing high-tech industry. In fact, at the current stage ofhigh-tech development, the rapid dispersion of high-tech manufacturingand processing from a Tech-Pole region such as San Jose has intensified.As technology application is broadly adapted, more standardized forms ofhigh-tech manufacturing can be moved to locations such as Sioux Falls,where cost factors are substantially lower than San Jose or Portland, OR.Proximity to suppliers and markets is becoming less relevant today ascommunication and shipping costs fall, as many people have alreadydiscovered. Many of the components that are assembled into our
100
Favorable locationfactors do notguarantee a long-termsuccessful high-techdevelopment.
• • •
High costs of doingbusiness can be apositive factor inreinforcing thedominance of a Tech-Pole.
• • •
Low cost and asupportive localgovernment can helpin establishing a high-tech manufacturingbase.

Milken Institute - July 13, 1999 America’s High-Tech Economy
computers in Sioux Falls’ Gateway 2000 plants or Austin’s Dell Computerplants actually are produced and shipped from Taiwan. Contactingcustomers and sensing the pulse of the market in today’s economy are onefingertip away. The success in utilizing communication technology hasshrunk the importance of being close to markets.
In the realm of economic development, tax incentives and public financeare the instruments that state and local governments applied the most.Can they be decisive and effective policy tools in aiding high-techdevelopment? Tax incentives and public policy may have helped lurefirms and industry to the locality, but the success of high-tech firms reliesmore heavily on their ability to create value and new concepts. Tax rebatesand incentives hence can be a good tool in laying the foundation fordevelopment, particularly by helping smaller entrepreneurs to set up basicoperational bases. Government entities should be cautious indistinguishing and recognizing the orientation of such policy, however.Government’s function should be only to jump-start the process at themost, not to baby-sit the expansion and growth of high-tech industry. Inthe early stage of development, when capital is the most criticalcomponent of starting an enterprise, government and public entities’subsidies in the form of tax incentives and rebates provide invaluableassistance. Overly favorable public investment and tax instruments maycreate distortions and provide a static environment that will not foster thehigh-tech development intended. Furthermore, public finance most oftencaters to larger companies and institutions, while the most dynamic partof the high-tech base — the smaller entrepreneurial enterprises — are leftout.
Rapidly changing high-tech industries mean shorter and shorter productcycles and shelf lives for their products. Huge public investment may notproduce a long enough period of economic benefit. Since the new high-tech economy is a globally based system whose operations are highlymobile, a high-tech company can move from one region or country toanother in a relatively short period of time. Low costs of production in aregion can rarely be a long-term advantage. Public finance in a highlyvolatile, rapidly changing, and evolving industry artificially reduces thepremium of such risks. A good example of that is the memory chip plantsin Austin, TX. The excessive supply of and weak demand for memorychips in 1996 caused memory chip prices in the world market to fall. Manyproducers, including Intel, had to cut back production. In that year,Austin’s economy slowed noticeably because of weakening construction ofchip plants and production of memory chips.
Many of the newly emerging high-tech regions have shown theimportance of high-tech industries to local economic development. Manypeople rarely associate Pocatello, ID, Harrisburg-Lebanon-Carlisle, PA, orRochester, MN, with the catchy phrase of “ high-tech.” Those metros’achievements are fine examples which other state and local governments
101
Financial aid and taxincentives are goodpolicy instruments tojump-startdevelopment.
• • •
Overemphasison such publicinvestmentscan work to a metro’s detriment.
America’s High-Tech Economy Milken Institute - July 13, 1999
should try to emulate. This successful story, however, is still a one-dimensional high-tech development. What Rochester, MN, and SiouxFalls, SD, have in common on high-tech development is their reliance onpersonal computer and accessory manufacturing. This is a form ofindustry concentration and agglomeration based on forward andbackward linkage. These industrial structures are limited compared to thecomplex high-tech clustering of networking and capital venture present inSan Jose, Dallas, or Boston. Rochester and Sioux Falls are not yet thesophisticated high-tech clusters and Tech-Poles that ultimatelydemonstrate the high-tech prowess and resilience in its present form.
Economic development such as Boise or Sioux Falls pursued may faceeminent threats in the future. These regional economies may facecompetition from overseas as the American high-tech gospel migrates andis assimilated around the globe. Malaysia, Korea, and China may be evenmore effective in manufacturing and assembling personal computers andother electronic accessories than the United States has been. We are notsuggesting that this development model is inappropriate for either Boiseor Sioux Falls but merely that they should be cognizant of potential risks.The second threat stems from the fact that their economies areconcentrated in a single dimension of the high-tech development, and onethat future downturns in the national economy may severely impact(Tables 4.4 and 4.5).
To a certain degree, the scope of recent high-tech development policy andits success in attracting firms and industries have been limited.Metropolitan areas such as Rochester, MN, Harrisburg, PA, and Merced,CA, showed tremendous growth in high-tech-related production. But theyremain cost-effective production centers, rather than dynamic high-techclustering regions such as Austin or Raleigh-Durham-Chapel Hill.Dispersion of high tech is a natural path of technology evolution.Establishing a production or assembly plant in a region is very much astandard economic development practice (the effect of spillover). Utilizingpublic policy and the interaction between local high-tech companies andgovernment to form research centers can be important in long-term high-tech development.
The New Economy revolutionizes the utilization of technologies, whichsimultaneously creates the insurgency of technology whereby the oldeconomy adapts to technology changes. As Michael Porter profoundlystated about high-tech clustering, “the most important agglomerationeconomies are dynamic rather than static efficiency and revolve aroundthe rate of learning and the capacity for innovation” (Porter 1996). High-tech development is an eclectic experience. The process of establishing ahigh-tech economy is complex and multifaceted. Its evolution is totallydynamic and, in many aspects, self-guiding. Developing a regional culturethat is amenable to change and growth and building a society that is open
102
A successfulhigh-techeconomy hasto be multi-dimensional.
• • •
High-Techmanufacturing andprocessing alone willnot sustain high-techgrowth in a regionaleconomy.
Milken Institute - July 13, 1999 America’s High-Tech Economy
103
Promoting theexchange of ideas andan open socialenvironment us themost important step.
• • •
Drastic changes thatimpose on a societyare a very seriousconcern.
to new ideas are probably the best strategies and principles governmentcan have in both attracting and expanding high-tech industries.
Just as we have changed our view about the contents of technology fromthe relatively pure form of product to a more complex combination ofideas, creativity, and entrepreneurial activities, economic developmentpolicy should adjust to being about the building of cultural and socialenvironment as well as physical infrastructure. Establishing local publicand private trade groups and affiliations is a sound policy that promotesthe exchange of ideas, trade information, and public awareness of thedevelopment. Attending to the needs of local firms and newcomers alikewill help the region to attract the desired skilled labor.
From its inception of one or two high-tech firms, to the totallyheterogeneous structures of today, took only a quarter of a century for SanJose’s electronic sector. However, the alteration in the region’s landscapethat resulted is beyond description. The explosive transformation turnedfarmland into laboratories and factories. The booming economy attractedimmigrants that changed the faces in the once quiet, fairly homogenousarea to a multicultural neighborhood. Substantial pay differences basedupon educational level deepen income disparity among the “haves” and“have nots.” Congestion and limited living space present insurmountablechallenges to the local government and housing development agency.These are less desirable changes that a promising high-tech economy willbring.
During San Jose’s economic transformation from 1970 to 1995, thepopulation mix changed drastically. The Asian population increased froma miniscule 42,000 in 1970 to 338,000 in 1995, almost an eight-fold increase,while the general population increased by only 50 percent in the sameperiod (Woods and Poole Economics 1998). This truly was a culture shock.The “modernization” of the once-tranquil farmland in Santa Clara Countydisplaced thousands of farmers and unskilled laborers. Those werechanges public officials could not accurately foresee; hence, they could notprovide effective public policy at the outset of development.
Expanding local infrastructure, housing, and educational systems areissues that local governments should anticipate and attempt to solve.Although San Jose might be an extreme case, proper public policiesshould address those “pressure points” during the cultural andtechnological transformations. Promoting life-long learning, and re-educating the existing labor force and population, may be critical inretaining local population and culture. More up-to-date skill-sets passedon to the local population can soften the trepidation local residents mayfeel when faced with newcomers. Proper and responsive housing policycan lighten the burden of rising housing costs on both the existing andnew populations.

America’s High-Tech Economy Milken Institute - July 13, 1999
104
• • •
Changes indemographiccomposition alterhousing demand.
• • •
Implications for Business Planning
What does the high-tech revolution bring to regional economies? Moreprecisely, how important is it for firms to seek out the next technologyfrontier? First and foremost, the new economy is about innovation andnew ideas. Knowledge and information are placed in higher esteem thanever before. The very beginning of the new economy, namely, theelectronic information revolution, will inevitably impact the way we thinkand the way we conduct our daily business. It opens a totally new avenueof possibility for business organizations and individuals alike. The speedof transmitting information and the seemingly unlimited computingpower on our desktops have profound impacts, ranging from howcompanies shall organize to where an individual should live.
The most profound impact of new and cheaper technology is on smallerfirms and entrepreneurial-minded individuals. In the past, when computerequipment was expensive and communication was so costly, economicefficiency and creativity largely rested on the operation of only largerfirms; without expensive and sophisticated computers, ideas cannot betested and communicated. The majority of individuals had only limitedaccess to information and the ability to utilize it. The rules of the gamehave changed in the 1990s. A marketing researcher can build a large set ofdatabases on his or her computer to compete with a large company. Thiscompetition is about ideas and is not handicapped by a piece oftechnology. This change is leveling the playing field of competitionbetween larger and smaller firms. It cultivates an environment thatencourages small business growth.
The ability of growth-oriented firms and business to tap into the nextrising tech-cluster regions, where the customer base is widening and theirneeds are customized, represents a tremendous opportunity. Moreimportant, operating in a high-tech region among firms that gain the firstexperience and knowledge on the next wave of change is a supremecompetitive advantage.
There is nothing more dramatic than the impacts of the high-tech serviceboom upon the commercial and office construction markets. MushroomingInternet Web-service firms and graphic design studios are changing theconcept of space planning, building and office construction, andremodeling. These highly entrepreneurial-spirited companies tend to startwith a limited amount of capital and few staff. Their office spacerequirements and demands are usually small at the beginning. They areamong the least-recognized clients to commercial builders. However, thesurging high-tech service demand offers great opportunity to thesecompanies. The expansion of these enterprises, often through public listingof their stocks, creates escalating demand for commercial and office space.High-tech regions such as Boston, Atlanta, Austin, and Dallas have
Milken Institute - July 13, 1999 America’s High-Tech Economy
105
• • •
Just like other smallerhigh-growth firms,high-tech enterprisesdemand various typesof professionalservices.
• • •
exhibited this growth trend in the past several years. The next high-techfrontier will follow a similar pattern in the commercial constructionmarkets.
A growing high-tech region rapidly transforms the local community. Newtech clustering and rapid accumulation of wealth in a regional marketcreates business opportunity ranging from home building to retail.Housing markets are among the first to witness the impacts. A high influxof immigrants and domestic migrants is common among high-growth,high-tech clusters. Population increases in a growing high-tech regiontend to be biased toward the 25 to 44 age cohort. The developmentexperience in San Jose, Dallas, Atlanta, Washington, DC, and others hasdemonstrated this to be the case. Residential housing catering to thisgrowing age group is an exceptional challenge and opportunity.
With a greater proportion of this age cohort in the 25 to 34 subgroup,development officials must pay attention to factors such as mobility andlack of equity when considering metro housing needs. Multi-unit housingthat addresses the sense of community and also affordability is moreappropriate than single-family homes. Another segment of the housingindustry that offers great potential is the renovation market.Contemporary living in an urban center is major trend shift in 1990s.Home renovation will help generate greater demand for interior designservices, architects, and home improvement stores. Spotting the expansionof the high-tech industries in a region is vitally important to homeimprovement companies such as Home Depot and Hechinger.
Professional service providers should be equally vigilant about high-techfrontier development. These new and relatively smaller high-techenterprises tend to utilize their limited and precious capital to create newideas and products. A new start-up will have to rely heavily on outsideservice providers, such as financial planners, financial consultants,accountants, and human resources agencies. Service providers can expandtheir operations in the growing high-tech region. Specialty serviceproviders, such as Kinko’s, can capitalize on the rapid growth. Anothersignificant change to the business environment caused by high technologyis in the retail sector, and in eating and drinking establishments. Rapidlyrising income and the wealth buildup in the region tend to put furtherdemands on local amenities. Finally, the influx of younger age cohorts, intime, will create great demand for babysitting and for preschool education

America’s High-Tech Economy Milken Institute - July 13, 1999
106
The pharmaceuticalindustry has beenhighly profitable, butprice controls andhealth-care reformthreaten.
• • •
Biotechnologyis animportantinvestmentarea.
services.
APPENDIX
High-Tech IndustryProfiles
SIC 283 - Drugs
The drug and pharmaceuticals industry is the fastest-growing segment ofthe chemical group and has undergone structural change in the pastdecade. The threat of government-imposed price controls and potentialhealth-care reform has resulted in pricing restraint and consolidationwithin the industry. The broad drug industry includes firms involved inmanufacturing, fabricating, and processing pharmaceutical products,medicinal chemicals, diagnostic products, and botanical preparations. Thedrug and pharmaceutical industry has displayed a high degree ofprofitability, encouraged and aided by the 17-year patent protection for itsdiscoveries. The discovery and commercial development of many life-saving medications from company-funded research labs have createdenormous demand for pharmaceuticals. The high research anddevelopment and marketing costs have contributed to a concentratedindustry structure. Many attribute the success of Americanpharmaceuticals firms to the absence of stringent price controls that havebeen imposed in other industrialized nations.
The drug sector is at the forefront of research and development investmentamong U.S. industries. Drug companies plowed 9 percent of sales backinto R&D during the 1980s, and between 10 and 12 percent in the 1990s.This commitment to R&D spending has been a key competitive advantagefor the industry. These investments yielded a whole new batch of drugproducts, includingtreatments for hypertension, cholesterol, blood clots invictims of heart attack, prostate abnormalities, cardiovascular disease,Alzheimer’s disease, cancer, and AIDS. Approximately 20 percent of theindustry’s 260,000 employees are full-time R&D scientists and engineers,as opposed to 4 percent for manufacturing overall (Trumbull 1997).
Biotechnology has been an important investment area. Knowledge ofspecific protein functions in the body — whether to stimulate infection-fighting cells or block a destructive internal process — allows physicians

Milken Institute - July 13, 1999 America’s High-Tech Economy
U.S. pharmaceuticalcompanies producehalf of worldwidesales.
• • •
Demographic changewill keep the industrygrowing in the yearsto come.
• • •
The computerindustry has beennear the top of U.S.growth rankings forthree decades.
• • •
Prices are down,speeds are faster, andthe market hasbroadened.
to inject biotechnology-produced proteins into the body to induce desiredreactions in patients. Bioengineered treatments have had limitedcommercial success but, because of the potential to provide “break-through” treatments, offer much hope for the future.
The export market accounts for approximately 10 percent of drug industryoutput, with Western Europe receiving over half of all exports. The U.S.Department of Commerce has estimated that American pharmaceuticalcompanies produce approximately half of worldwide pharmaceuticalsales. Expanding international sales, especially in China and other Asiancountries, offers great long-range opportunities for growth. Over the past30 years, real output growth in the drug industry was a compound annualrate of 4.6 percent, matching the average of the high-tech sector as awhole. Industry output in real 1992 dollars totaled $77.9 billion in 1997.Output per man-hour in the drug industry in 1996 was $136, the largestamong the high-tech sectors.
The aging of the baby boomers provides great opportunity for growth inindustry sales, not only in the United States but in Japan and WesternEurope as well. Senior citizens purchase one-third of all prescriptionmedication dispensed in the United States and will account for 30 percentof the total population within 10 years. Future growth prospects arefavorable for the drug industry, with high profit margins.
SIC 357 - Computers and Office Equipment
Computers and peripheral equipment are at the core of the informationtechnology revolution. Along with electronic components and accessories,computers and peripheral equipment has been at the top of industrygrowth rankings over the past three decades. When adjusted for pricedeclines and performance improvements, output growth has accelerated inthe 1990s. Technological advancements within the industry have beenremarkable. The computer-equipment sector includes firms engaged in theproduction of electronic computers, storage devices, computer terminals,computer peripheral equipment (including communication interfaces),and electronic-imaging equipment. During each evolutionary phase, theprice of computing power has fallen, and the market has broadened. Thecomputer hardware industry is generally subdivided into three segments:personal computers, systems and servers, and workstations.
The business sector was responsible for generating most of the growth incomputer hardware over the past 30 years, but the importance of theconsumer sector has grown over the past decade. During the 1970s,businesses invested in computer hardware primarily to automate back-office operations, such as accounting. Competition within the industryintensified as technological advances permitted the production of cheaperand smaller devices. By the 1980s, computers were small enough to sit ona desktop, and the personal computer was introduced. Although largely a
107

America’s High-Tech Economy Milken Institute - July 13, 1999
108
The Internet hasplayed an importantrole.
• • •
Exports account for alarge market share,but foreigncompetition is strong.
personal-productivity tool for tasks such as word processing, the PCcreated a massive consumer market for computers. The most recent stagein the computer revolution has been in network computing. Networkedcomputers draw in a growing base of smaller firms and consumer users.Today’s servers provide users with a technology that is lower priced thanbut almost as powerful as large mainframes and minicomputers. Theintroduction of the Internet has promoted strong demand for networkcomputers and equipment. The Internet promises to expand the“network” globally, connecting individuals and businesses in hundreds ofnations.
Research and development expenditures are critical for American firms tomaintain technological leadership. The industry has generally spentbetween 7 and 9 percent of sales on R&D, ranking it among industryleaders. During the 1990s, the U.S. computer industry invested more fundsin R&D than any other U.S. industry. Electrical engineers, programmers,and technicians represent around 30 percent of industry employment of365,000. Restructuring and rapid productivity growth within the industryhave resulted in a decline in employment since it peaked at 516,000 in1984. Output per man-hour has increased at a compound annual rate of9.2 percent over the past 30 years, faster than any other major U.S.industry. Gross industry output in real 1992 dollars totaled $188.9 billionin 1997. Computers and office equipment averaged compound annualoutput growth of 9.6 percent over the past 30 years, and in real terms,growth was substantially greater.
International trade in computer equipment plays a major role in theUnited States. Exports account for over 30 percent of industry output andimports represent about 50 percent of industry sales. The United Statesruns a large deficit in computer peripherals and parts, as Asian firms arehighly efficient and formidable competitors. U.S. firms have movedproduction into foreign countries, helping to give them access to globalmarkets, lowering component costs in the United States, and promotingmanufacturing flexibility to meet customer needs.
Rapid technology improvements in processing capabilities in the computerindustry promise to sustain a high rate of growth. Business investment incomputers and related equipment will be driven by a number of factors:strong Internet growth, declining prices, and intense competitive pressureto boost efficiency and productivity. The tremendous expansion in the areaof communication interfaces (fax modems, Ethernet cards, and PCMCIAcards) due to networking will be an important area of growth.
SIC 366 — Communications Equipment
The communications equipment industry is undergoing a virtualexplosion in demand for its products, led by massive investment in

Milken Institute - July 13, 1999 America’s High-Tech Economy
109
The communicationsequipment industryhas been a majorbeneficiary of thehigh tech revolution.
• • •
Wireless is the fastestgrowing industrysegment.
• • •
The Internet iscreating additionaldemand.
• • •
Deregulation will aidforeign markets.
communications networking gear. Due to the advent of satellitecommunications, wireless services, digital technology, and fiber optics, thecommunications equipment industry has undergone a dramatictransformation over the past 20 years. The technology innovations weredriven by the telecommunications companies’ desire to increase thecapacity of the communications systems and improve the quality andbreadth of their service offerings (Cavallone 1998). Concurrent innovationin computing, microprocessors, and miniaturization also played animportant role. Communication equipment is generally broken down intotwo major categories: telephone and telegraph apparatus, and radio andtelevision broadcasting equipment.
The global communications equipment industry is dominated by anoligopoly of American and international manufacturers, whose structurehas been influenced by relations with major communications companies,economies of scale, and R&D. Several important equipment categoriesdominate the industry. Wireless is the fastest growing segment of thecommunications equipment market, with shipments valued at $40 billionin 1997. This includes both wireless network equipment infrastructure andhandsets. About 64 million Americans subscribed to wireless service in1998, up from 28 million in 1995. In addition to wireless, shipments ofwireline, or traditional network equipment, have also been strong andwere valued at $170 billion in 1997 (Cavallone 1998, 8, 12).
Several factors help to explain this trend, including the boom in privateand commercial construction, corporate expenditures on voice and datacommunications upgrades, installation of the latest fiber optic and high-speed digital access systems, and increased phone line demand for fax,voice mail, and Internet service (Trumbull 1997, 19-8). Indeed, much of thegrowth in communications equipment in recent years has been parallelwith the spread of the Internet. If computers are the vehicles by which wetravel the information superhighway, communications equipment is thepavement that links the system together. Internet volume is increasingdramatically, leading to demand for greater bandwidth supplied by anumber of competing systems from telephone and cable companies.Today, the communications equipment industry is characterized byderegulation, intense competition, and high rates of technological changethat have benefited consumers with lower costs while simultaneouslytightening profit margins for equipment manufacturers.
Few markets have grown as quickly in recent years as communicationsequipment. Between 1991 and 1997, gross industry output increased astaggering 88.2 percent and grew 24.4 percent in the three years from 1995to 1997. The industry has maintained this level of growth with a workforceof 272,300 persons, which is up 13.6 percent from a 1992 recession low, butnowhere near the 307,500 employed in 1985. Output per man-hour was$108 in 1996, ranking it among industry leaders.

America’s High-Tech Economy Milken Institute - July 13, 1999
110
Wireless may offerdeveloping nationssignificant costsavings overtraditional wirelineinfrastructure.
• • •
Semiconductors arefinding their way intoa myriad of productsand devices.
• • •
Continueddevelopment drivesthe entire high techsector.
The United States leads the world in communications equipment exports,although foreign manufacturers produce a great deal of products for theconsumer market. Exports grew 17 percent annually over the past decade,with exports to Japan, China, other Asian countries, and Canada growing11 percent annually. The industry has not been immune to recent globaleconomic turmoil, but with 60 countries planning to privatize theircommunication service industries in the next five years, long-termindustry prospects remain strong. Developed countries will continue tofollow America’s lead by expanding and modernizing voice and datacommunications systems, while new technologies, such as wireless,promise developing nations significant cost savings over the conventionalwireline communications infrastructure.
The communications equipment industry is projected to grow at about 6.5percent annually over the next decade (Trumbull 1997). Most growth willoccur in the wireless, satellite, and broadband fields, but even sales to thefew industry sectors that have performed poorly in recent years, such asdefense, commercial aerospace, and air traffic control, are expected toincrease as systems are modernized. Competition between firms willremain intense, with industry deregulation a continuing trend. Technically,digital, fiber optic, and wireless conversion will continue, and efficiencieswill be sought through the convergence of voice and data transmission bymeans of packet-based switching.
SIC 367 - Electronic Components and Accessories
The electronic components and accessories industry provides the technicalbase that drives the entire high-technology sector. This industry isresponsible for the production of electrical and electronic devices,including semiconductors, printed circuit boards, electron tubes,capacitors, resistors, coils, transformers, and connectors (Trumbull 1997).These devices comprise the vital components in computer,telecommunications, instrumentation, medical, and transportationequipment. Like the computer and office equipment industry, electroniccomponents have placed near the top of industry growth rankings overthe past three decades. Between 1990 and 1997 the value of shipments forsemiconductors alone grew nearly 300 percent. Indeed, semiconductorsand related devices (SIC 3674) account for the largest portion of theelectronic components and accessories industry, with 43 percent ofemployment and 56 percent of value of shipments in 1997.
With developmental forces shaped by defense and industrial concerns, theelectronic components industry has experienced most of its growth in theconsumer sector in the past two decades. This will continue, as personalcomputing and telecommunication devices move beyond the businesssector and into the home, and as these devices become increasinglytechnology-laden. The forces of innovation drive the electronic
Milken Institute - July 13, 1999 America’s High-Tech Economy
111
The industry hascooled off in recentyears...
• • •
...and faces stiffcompetition fromforeignmanufacturers.
components industry. Each subsequent generation of devices realizes gainsin efficiency, productivity, and speed, with simultaneous reductions insize. The very nature of this innovation produces high rates ofobsolescence and subsequent product turnover. This is particularly true inthe semiconductor industry, where innovation (fostered by the premise ofMoore’s Law) produces a demand cycle for processor-intensive applica-tions and a subsequent need for faster speeds. The requirements ofInternet-capable devices have only accelerated this process. Nevertheless,the electronic components industry is currently in a period of slow growthafter a phenomenal mid-decade. Global economic turmoil, industryovercapacity, lower pricing, and the emergence of a strong low-endpersonal computer market are to blame (McGovern 1998).
Employment prospects for electronic components remain strong.Productivity gains and industry consolidation lowered employment froma peak of 683,000 in 1984, but with strong demand in the 1990s,employment has rebounded and approached historical highs in 1998. Overthe last 30 years, nominal industry output growth averaged 9.8 percentannually, and totaled $585.6 billion in 1997. Semiconductor industryfigures are even more striking: between 1959 and 1997 the market grew atan average of 17 percent per year (Scalise 1998). Semiconductors now rankfirst in the generation of added value in the manufacturing sector.Research and development is vital to growth. U.S. companies spend anaverage of 14 percent of annual revenue on R&D.
International trade accounts for a large part of the electronic componentsbusiness. Exports, for example, comprise about 25 percent of industryoutput, while imports account for about 30 percent of sales. The Asia/Pacific region is America’s largest trading partner for electronic com-ponents. Favorable exchange rates, competitive prices, and low productioncosts (particularly for less-sophisticated components), makes Asia the chiefgrowth market for both supply and demand. Most major U.S. manufac-turers now operate production facilities in the region. Asia appears to havebottomed out of its recent economic crisis, and with many reform-mindedgovernments in power, industry deregulation seems likely, although theU.S. market remains vulnerable to low-cost dumping practices.
The computer and telecommunications sectors will continue to be animportant market for devices produced by the electronic componentsindustry. Prospects for continued expansion remain bright, although theindustry will mature, and growth rates will likely moderate as technologydiffuses into the economy. International competition, particularly from theAsia/Pacific Rim region, is expected to remain strong. Finally, theimportance of technological development and innovation should not beunderestimated as a driving force for the continued success andproductivity of the industry as well as the entire high-tech sector.

America’s High-Tech Economy Milken Institute - July 13, 1999
112
Although back ordersremain, the currentround of aircraftpurchases seems tohave ended.
• • •
The Asia Crisis hashurt foreign sales...
SICs 372 and 376 - Aerospace
The aerospace industry is one of the oldest high-technology sectors in theU.S. economy. Barriers to entry are great, including a high ratio of researchand development expenditures to sales. Aerospace consists of a fewbroadly defined product groups for both civilian and military use. For thepurposes of this study, these include SIC 372 aircraft and parts, as well asSIC 376 (guided missiles, space vehicles, and parts). For nearly half acentury aerospace was the largest recipient of the national defenseexpenditures. During the Cold War, the industry typically received morerevenues from its military production than from civilian projects at about atwo-to-one ratio. At its height, the American aircraft industry receivedmore than $41 billion from the Department of Defense. With the collapseof the Soviet Union, however, lucrative government contracts eroded, andthe period of prolonged high growth came to an end. In 1998, aerospacereceived only $30 billion from military contracts (Napier 1998).
With the end of the Cold War, the American aerospace industry faced arapidly integrating global economic structure, robust demand for itsproducts from South East Asian markets, and the transformation of itscustomer mix from military to civilian purchases. The requirements ofcivilian aviation have affected American aerospace in a number of ways.Industry R&D — which makes up more than 25 percent of globalaerospace R&D — now emphasizes fuel efficiency and passenger comfortover the tactical characteristics of military aircraft (Friedman 1998). Rocketand missile R&D has also focused on the needs of the lucrative civiliansatellite market, with an emphasis on new, larger boosters that enhancecost efficiency and increase payload capacity. Consolidation has also takenplace in the aerospace industry. Indeed, the merger of Boeing andMcDonnell Douglas attest to the industry’s ability to transform itself byadapting to the new operating environment. The merger will furtherreinforce the global dominance of the Boeing Co. against fiercecompetition from European manufacturers, who have been steadilygaining world market share. Boeing’s ability to maintain its NorthAmerican market and exploit rapidly expanding demand in Asia will nodoubt determine its future as industry leader.
The U.S. aircraft industry is a leader in the global marketplace, accountingfor more than 60 percent of the world aircraft market. The industry sold$47 billion worth of aircraft and parts to civilian air carriers in 1998(Napier 1999). Superiority in research, development, and production hasallowed the U.S. aircraft industry to position itself as the major exporter ofboth commercial and military aircraft for the past 50 years. Aircraft,aircraft engines, and parts comprise one of the leading net exports in theU.S. economy, with exports valued at $59 billion in 1998 against $22 billionin imports (Napier 1999). Booming economies in Asia over the past 15years have boosted the industry’s bottom line as well as its contribution toU.S. export activities, but the Asian economic downturn has slowed orders
Milken Institute - July 13, 1999 America’s High-Tech Economy
113
...but long-termprospects remainsstrong...
• • •
...and new contractswill stimulate defenseaerospace.
• • •
Producing radar,navigation, andinstruments, thesearch and navigationequipment industry isconsidered a “nichesegment” ofaerospace...
• • •
...and often shares itsfate.
since mid-1997. Asia accounts for about one-fifth of global aircraft sales,and the downturn has led some regional airlines to cancel or defer orders,particularly on profitable widebody aircraft. This may curtail the recentglobal boom in aircraft construction, despite a continuing backlog oforders (Friedman 1998).
The Boeing Co. estimates that from 1998 to 2007, worldwide passenger airtravel will increase at an annual rate of 5 percent. If true, this will mandatethe construction of more than 7,000 commercial aircraft over the nextdecade, worth an estimated $520 billion in 1997 dollars (Friedman 1998).Although the current order cycle for commercial aircraft appears to havepeaked, Asian economies seem to have bottomed out, and sales willincrease in the coming years. Future demand trends for commercialaircraft will move toward longer ranges and greater seating capacities.Like commercial air travel, the aerospace industry will continue toexperience growing demand for commercial satellite launch vehicles,although the American manufacturers have recently been slowed by anumber of well-publicized booster failures, which highlight the technicalcomplexity, difficulty, and risk of rocket launching.
Finally, spending for defense aerospace appears to be bottoming out aftermore than a decade of cutbacks and consolidation. Several importantcontracts are now gearing up for production, including the F-22 Raptorand Joint Strike Fighter. Missile production is also expected to increaseupon reports of shortages after military actions in Iraq, Afghanistan,Africa, and the Balkans.
SIC 381 - Search and Navigation Equipment
The search and navigation equipment industry produces devices used forthe guidance and detection of military and civilian aircraft and ships.These devices include radar and sonar systems, control equipment foraircraft and missiles, flight and navigation products, gyroscopes, andinstruments. Many of these devices employ the latest in computer andelectronic hardware and software, and as such, the industry earns themoniker of high tech.
Although search and navigation equipment manufacturers produce devicesfor nautical use, most equipment sales are to the aerospace sector. As aresult, many consider the industry to be a “niche segment” of aero s p a c e ,and the two share similar fates in the marketplace. Both industries boomedin the early 1980s under Reagan-era defense spending, but less than adecade later each was weathering recession, defense cutbacks, canceledo rders from commercial markets, and increased global competition. Sincethat time, each also has undergone a period of re s t ructuring andconsolidation. By nature, the search and navigation equipment industry iscyclical, relying on extended contracts with long lead times from traditional

America’s High-Tech Economy Milken Institute - July 13, 1999
114
Systems upgrades andnew defense contractsshould pull theindustry out of itscurrent lull.
• • •
Measuring andcontrolling devicesmove, manipulate,and measure fluids orenergy.
c o m m e rcial and government customers. High rates of developmentcharacterize the devices produced by this industry. This burd e n sm a n u f a c t u rers with product obsolescence, employee retraining, andretooling costs, and cost overruns from untried technologies.
Employment is down over 50 percent from a historical high of 360,000employees in 1985. Gross industry output was $30.4 billion in 1997, whichwas down nearly 30 percent from a decade earlier. Despite dramaticreductions in employment and output, the industry has grown at acompound annual rate of 3.8 percent over the past 30 years. Output perman-hour was a respectable $80 in 1996. R&D funds for the search andnavigation equipment industry from both public and private sources havedecreased in recent years.
Despite increasing competition in the global marketplace, the UnitedStates leads the world in the production and export of search andnavigation equipment. Although the industry has suffered setbacks fromglobal financial turmoil (particularly in Asia), prospects for continuedexport growth remain strong. There are several reasons for this assertion.First, the growing market for air travel around the world will result inimproved demand for on-board flight systems in commercial aircraft aswell as the modernization of air traffic and ground control networks.Second, the end of the Cold War has hastened the need to upgrademilitary aircraft, avionics, and control systems in many countries,particularly those in Eastern Europe, Asia, and the Middle East.
The American search and navigation equipment industry is expected tosoon awaken from a decade of dormancy. In addition to a reboundinginternational market, demand for commercial aircraft for domestic useremains strong, and the modernization of the U.S. air traffic controlsystems continues. In defense-related markets, the U.S. aerospace industrywill soon be gearing up for the production of the F-22 Raptor and JointStrike Fighter projects, which are among the largest defense contracts inhistory. Industry shipments are expected to increase 4–5 percent per yearover the next 10 years. Technically, industry trends are moving towardinteractive and virtual systems, increased reliability, and “fault-tolerance”(or the ability to operate through system failures). Efficiencies in size,weight, cost, and power consumption are also being pursued. Finally,defense conversion is on the minds of many search and navigationequipment manufacturers, as the industry tries to branch out fromtraditional markets. The growing use of global positions systems (GPS) inautomobiles and other consumer products is merely one example of arecent conversion success story (Trumbull 1997).
SIC 382 - Measuring and Controlling Devices
“Measuring and controlling devices” is a general term that describes amyriad of technologies employed in industrial, commercial, consumer, and
Milken Institute - July 13, 1999 America’s High-Tech Economy
115
The strong USmanufacturing andconstruction sectorsshould keep theindustry growing at amoderate pace.
• • •
Informationtechnology is nowin many of thedevices that keep usalive and in goodhealth.
research settings. Broadly speaking, these devices move, manipulate, andmeasure fluids or energy. The type of equipment and the industries thatuse these devices run the gamut from high to low tech, but most areincreasingly technical in nature and can be classified into a few broadgroups: (1) laboratory, scientific, and optical apparatus used for medicaland biotechnology research, environmental testing, andtelecommunications; (2) automatic control devices that regulateenvironments, industrial processes, and appliances for commercial,residential, and industrial use; and (3) devices for measuring electricity,such as semiconductor, circuit board, and communications test equipment(U.S. Department of Commerce 1994).
With the exception of equipment sold to defense-related markets, themeasuring and controlling device industry is expected to grow at amoderate pace. Several trends support this assertion. Sales of automaticcontrol devices such as thermostats and appliance systems have been upalong with the strong construction market, which is expected to remainstable in the coming years. The strong American economy has also ledmanufacturers to pursue efficiency and productivity gains through thepurchase of high-tech industrial process controls and instruments. Thecontinued growth of the computer, biomedical, pharmaceutical, andenvironmental industries will hasten demand for laboratory equipmentand measuring devices (Trumbull 1997).
The measuring and controlling device industry employs roughly 300,000people, which is down 11.8 percent from a high of 336,800 in 1981. Grossindustry output increased 69.2 percent during that same period, however,and was $45.3 billion in 1997. Over the last 30 years, gross industry outputgrew 4.4 percent annually. Output per man-hour was $68 in 1996.
Manufacturers of measuring and controlling devices have been hit byrecent global economic turmoil, yet demand for control systems,appliances, and measuring equipment in developing nations will be strongover the next decade. U.S. sales will continue to grow as well. Industryshipments to domestic and foreign customers are expected to expand by5.5 percent per year over the next decade (Trumbull 1997).
SIC 384 - Medical Instruments and Supplies
In addition to being a force behind growth in industries as diverse ascomputer equipment, aerospace, and even motion pictures, informationtechnology is also playing an increasingly important role in keeping usalive and in good health. Medical devices, used to perform diagnoses,complex and delicate surgeries, and, increasingly, “minimally invasive”procedures employ many of the same technologies found in personalcomputers, aircraft, and high-resolution graphics displays. The medicalinstruments and supplies industry is part of a market that in the United

America’s High-Tech Economy Milken Institute - July 13, 1999
116
Profits for medicalequipmentmanufacturers haveslowed, but newinnovation is likely.
• • •
Two forces will shapethe industry in theyears to come:Demographics andmanaged care.
States alone that amounted to $46.2 billion in 1996, and includes thoseestablishments involved in the manufacture of surgical and medicaldevices, dental equipment, orthopedic and prosthetic appliances, as wellas X-ray, electromedical, and electrotherapeutic apparatus.
The medical instruments and supplies industry has undergone dramaticchange in recent years. The industry is currently experiencing a round ofconsolidation, with the value of mergers reaching $10 billion in 1997 andan estimated $15 billion in 1998. Several factors have been cited for thisrecent trend, including greater industry competition, price discounting,constrained Medicare reimbursement, and the growing influence ofmanaged-care companies, which, for purposes of economies of scale,prefer to deal with a few large suppliers of medical equipment. Also citedis the growing cost of government regulation and, in particular, thebarriers to and high costs involved in FDAapproval of medicalequipment. The medical instrument industry has also matured in recentyears, as the market for minimally invasive surgical instruments andangioplasty catheters has peaked. Industry profits have slowed, but thisnew and promising sphere is ripe for further development (Saftlas 1998).
Firms producing medical instruments and supplies employed over 270,000in 1998. More than 20,000 companies are licensed to produce medicaldevices in the United States, but fewer than 1,500 firms are primarilyengaged in the endeavor. The industry spends a large portion of itsrevenues on R&D — near 6.5 percent in the 1990s. Additional fundingcomes from government sources. Gross industry output for the medicalinstruments industry in real 1992 dollars was $181 billion in 1997, and hasincreased at a staggering 6.5 percent annual rate over the past 30 years.Relative to the high tech-sectors ranked in this study, this rate of growthwas outpaced only by those of computer-related fields.
The United States controls about 42 percent of the production market formedical equipment and supplies worldwide, with Europe accounting for27 percent, Japan 14 percent, and other areas 17 percent (Saftlas 1998, 7).International markets for U.S.–produced medical equipment will continueto grow. The value of U.S. exports to Asian emerging markets was nearly$1 billion in 1997. Exports to Asia were hurt in 1998 but are estimated tohave increased slightly, despite recession and currency devaluation. Long-term sales prospects for the region are strong, as rising standards of livingand government emphasis on public health lead to export growth. InEurope, the introduction of the euro is expected to have a positive impacton the medical equipment industry, as business practices and pricesbecome standardized across national boundaries and the regulatoryapproval process is streamlined (Saftlas 1998).
Two primary forces will shape the medical instruments and suppliesindustry, as well as the entire healthcare industry, in the years to come.First is the enormous demographic change that will occur in the United

Milken Institute - July 13, 1999 America’s High-Tech Economy
117
Telephonecommunicationsservices include localand long distancenetworks.
• • •
Long distance remainsvery profitable...
• • •
...wireless service isexploding...
• • •
...but competition isfierce.
States and worldwide in the coming decades. According to the WorldHealth Organization, the number of individuals 65 years and older isexpected to increase from 390 million in 1997 to 800 million in 2025. In theUnited States, the over-65 population will double between 1995 and 2030.This will have an enormous effect on the demand for medical instruments.The second force is the continued influence of the cost-consciousmanaged-care industry on equipment sales and prices. More than 60percent of all medical device purchases in the United States are made bymanaged-care systems, and the industry exerts strong pressures thatencourage lower cost devices, pharmaceutical treatments, and outpatientprocedures (Saftlas 1998, 8–9).
SIC 481 - Telephone Communications
The telephone communications, or telecommunications, industry providesservices to 94 million households and 25 million businesses nationwide.The industry is divided into two distinct segments. The first of thesesegments is wireline, which provides telephone voice and datacommunications services over land-based wire networks. The wirelineindustry can be divided further into local networks (about 70 percent ofwhich are serviced by regional Bell operating companies) and long-distance carriers (of which 80 percent of the market is controlled by fourcompanies: AT&T, MCI, Sprint, and WorldCom) (Wohl 1998a). The secondsegment of the telecommunications industry is wireless, which providestwo-way radiotelephone communications, such as cellular telephone,pager, and beeper services.
The breakup of AT&T in 1984 into regional “Baby Bells” came on the cuspof a technological revolution that would soon sweep thetelecommunications industry. Competition fostered by the breakup led toinvestment in new technology to improve service quality (fiber opticnetworks and call waiting) and create new markets (wireless and pagerservices). The industry stalled in the early 1990s as the result of recessionand lower profits from a competitive environment, but since that time ithas grown at phenomenal rates.
Several factors can explain this growth. For many years long distanceservice has been the mainstay of the telecommunications industry, and stillis. The four main long-distance operators saw an average revenue growthincrease of over 12 percent in 1998; even so, over the decade, technologyhas lowered prices and cut margins (Wohl 1998b). Competition is fierce.This has led many companies to seek new opportunities for growth inmarkets such as wireless, which has grown exponentially. The industry’ssubscriber base has been growing at about 20 percent annually in recentyears, and for many consumers mobile phones are now a necessity.Subscribers are expected to top 75 million by the end of 1999 (Wohl 1998b).Telecommunication companies have also sought new revenue
America’s High-Tech Economy Milken Institute - July 13, 1999
118
Deregulation andinternational tradeagreements will keepthe global marketgrowing despiterecent setbacks.
• • •
The global wirelessmarket mayeventually surpasswireline.
• • •
Consolidation,continuedderegulation, andfierce competitionwill characterize theindustry.
opportunities in the fast-growing Internet-service-provider market.Companies now offer high-speed Internet connections through existingtelephone networks, but competing systems have not been standardizedand service areas are restricted.
Gross industry output in the communications industry (which includesradio, television, and cable broadcasting in addition totelecommunications) has grown an average of 4.8 percent annually overthe past three decades, and stood at $320 billion in 1997. The industryemploys 1.4 million people, an increase of over 6 percent since 1986. Thisrate seems small when considering that gross industry output increased29.3 percent during the same period. This has been possible through theadoption of labor-saving technologies, which continue to promise costreductions without a loss of service, particularly in the wireline segment ofthe industry. Technology has allowed the communications industry tomaintain a highly productive workforce, with an output per man-hour of$105 in 1996.
U.S. telecommunications service providers are the most competitive in theworld. They currently dominate global markets with their technologicalexpertise and market know-how. Despite recent global economic turmoil,markets continue to expand around the world. In 1998, 72 member nationsof the World Trade Organization signed an agreement that allowscompanies to acquire interests in foreign telephone operations thatpreviously had been state-owned. This, along with the plannedprivatization of over 60 telecommunications systems in countries aroundthe world, will open markets to U.S. exports. Similar to the United States,countries around the globe, particularly in Latin America and China,represent a strong growth market for wireless services. These systems offerdeveloping economies the opportunity to meet their telecommunicationsneeds without investment in expensive wireline networks. The globalwireless market is estimated to be a $200 billion segment of the $900billion worldwide telecommunications market, and may eventuallysurpass wireline (Wohl 1998b).
Several trends characterize the telecommunications industry as it preparesto enter a new century. The industry has been consolidating, with mergertalks that may reassemble a number of Baby Bells if resistance fromFederal regulators can be overcome. These larger companies wish to“bundle” long distance, cellular, and Internet services to consumers for asingle flat rate in markets nationwide. Recent legislation and deregulationwill also affect the industry. The Telecom Act of 1996, for example, enableslocal telephone companies, long-distance carriers, and cable televisionoperators to enter one another’s markets. This will increase competition inlocal networks, and continue to blur the distinction betweencommunication and transmission companies. Other trends in thetelecommunications industry include continued deregulation, blindingcompetition, overlapping markets and revenue streams, globalization,

Milken Institute - July 13, 1999 America’s High-Tech Economy
119
Software sales and theInternet will keepcomputer and dataprocessing servicesamong the fastestgrowing sectors of theUS economy.
• • •
The Internet’s truepotential is only nowbeing realized...
• • •
...but labor shortageswill continue to be adrag on the industry.
greater consumer choice, lower prices, and a technical emphasis on datacommunication and on fiber optic and digital conversion.
SIC 737 - Computer and Data Processing Services
The computer and data processing services sector is responsible for theproduction of most computer applications used by business, government,and consumers. Like the computer hardware sector, computer services areamong the fastest-growing industries in the U.S. economy, with annualgrowth rates in the 1990s reaching double digits. The computer and dataprocessing services sector includes a variety of establishments engaged inprogramming services (specialized programming on a contract or feebasis), data preparation and processing services, information retrieval,computer systems design, computer maintenance and repair, and thelargest industry in the sector — prepackaged software.
The origins of the computer and data processing services sector stretchback to the early years of computing in the 1950s. At that time, tailor-madeprograms and systems were created for expensive mainframe computersto automate mundane, time-consuming, and expensive back-office tasksfor large businesses and government, who often shared machines on arental or lease basis. Growth in the computer programming industryskyrocketed in the 1980s with the introduction of the personal computerand the demand for business applications for these machines. By the early1990s, however, growth in the computer programming industry had beenquelled somewhat by the increased sales of prepackaged software.
Several factors can explain this transition. Rapid advances in the speedand memory capabilities of personal computers convinced all but thelargest firms that the high cost of retaining a full-time programming staffcould not be justified. Also, the growing use of networks and client/serversystems required software products that operated in many environmentsand network configurations — conditions that prepackaged softwarecould provide (Trumbull 1997). This has become even more of a necessitywith the spread of the Internet, which has become an enormous new areaof growth for computer and systems programmers. Since its emergence,software vendors have tried to integrate Internet features into theirproducts and develop business-ready E-commerce applications such asonline banking and payment systems, financial and travel services, andnavigation tools (Goodstadt 1998, 2). Perhaps the Internet’s mostpromising feature, in terms of commerce, is its potential to automate front-office duties, including sales, customer service, and supply-chainmanagement functions (Goodstadt 1998). The phenomenal growth of thisnew medium has led to an enormous demand for information systemprogrammers to manage the daily needs of business client/server systems,e-mail, Internet, and software applications.
America’s High-Tech Economy Milken Institute - July 13, 1999
120
The US is the globalleader in software andInternet products andservices.
• • •
Innovation, diffusion,high rates ofobsolescence, and stiffcompetition areindustry norms.
The computer and data processing services sector employed 1.75 millionindividuals in April 1999. The industry has experienced 140 percentemployment growth in the past decade. The three fastest-growingprofessions in the U.S. economy: database administrators–computersupport specialists, computer engineers, and systems analysts can all befound in the computer and data processing services sector. While demandfor these positions grew at enormous rates, labor supply actually hasdeclined. Since 1986, the number of computer science and mathematicsgraduates entering the U.S. workforce has declined 42 percent (Goodstadt1998). With strong demand, salaries have increased 7–10 percent annuallyfor several years, but output per man-hour stood at a flat $63 in 1996 —low for a high-tech industry due to the many data-entry positions. Grossindustry output for the computer and data processing services sector was$190 billion in 1997, which is an increase of over 12 percent over 1996.Industry output has increased an average of 9.4 percent over the past threedecades, which ranks third, behind only electronic components andaccessories, and computer and office equipment. It has been estimated thaton a value-added basis, computer software is the third-largestmanufacturing business in the United States, exceeded only byautomobiles and electronics (Goodstadt 1998), and is soon expected tosurpass the automobile industry as the largest contributor to the economy(Business Software Alliance 1999).
While the United States has lost market share to international competitionin high-tech sectors such as computer hardware and microprocessors, ithas retained its lead as the primary global exporter of software. U.S.companies produce an estimated 57 percent of the world’s software, andthe United States has the largest domestic market. Globally, Japan has thesecond-largest. Japan also is a major U.S. competitor for global softwaresales, even though the United States controls about 50 percent of theJapanese domestic market. Western European markets were collectivelyvalued at three times Japan’s, while Pacific Basin economies registeredone-half Japan’s. The enormous demand for IT workers in the UnitedStates, and the comparatively higher salaries offered here (although lowerthan for domestic employees), has led many foreign workers to emigrateto the United States or seek temporary employment status under H1-Bvisa provisions.
The computer and data processing services sector is expected to maintaindouble-digit annual growth in the near future. New technology drives theindustry, and as hardware prices have fallen dramatically in recent years,competition in the software market has intensified. Software has beenpenetrating markets quickly, and growth will slow as the market maturesif technological change sits still long enough to allow it (Trumbull 1997,297). The Internet will continue to be the driving force in the industry.Today, about 80 million Americans, or about 30 percent of the population,have access to the Internet (U.S. Internet Council, 1999). Competition inthe Internet sector will remain intense. Since the output produced by this

Milken Institute - July 13, 1999 America’s High-Tech Economy
121
High tech is playingan increasinglyimportant role inmotion pictureproduction, post-production, andmarketing.
• • •
Technology isblurring the linebetween motionpictures and otherforms ofentertainment.
• • •
Exports are asignificant share ofthe market...
industry is knowledge and, as such, requires a relatively small outlay ofcapital equipment, few barriers exist for new companies to enter themarket. High failure rates, buyouts, and consolidation will be the norm,however.
SIC 781 - Motion Picture Production and Services
On the surface, one might not believe motion picture production andservices to be a high-technology industry, yet from its inception over acentury ago filmmaking has been a very technical art form. Like othertechnical professions, film has increasingly become the beneficiary of high-technology inputs for production, post-production, and marketing. Themotion picture production and services industry (SIC 781) includes firmsinvolved in the production of theatrical and nontheatrical motion picturesand videotapes for exhibition or sale, as well as educational, industrial,and religious films. Also included are establishments involved in high-techservices vital to motion picture production, such as film processing,editing, titling, and videotape reproduction.
The film industry has played an important role in the Southern Californiaeconomy for most of the 20th century. Lured to the area by its open spacesand sunny weather, the film industry helped establish the California“persona” during the golden age of Hollywood. The industry suffered inthe postwar years with the emergence of television, and it was not untilthe mid-1970s, with special effects–laden blockbusters such as Jaws andStar Wars, did the industry begin to display its enormous profit-makingpotential. Despite a slow start due to recession in the early 1990s, filmssuch as these continue to be Hollywood’s mainstay, with a handful ofmovies often determining a make-or-break year for many studios.Technology drives the motion picture industry both in terms of production(special effects, digital photography, sound effects, editing) and by offeringnew venues for film marketing (multimedia such as video and computergames, DVD, satellite, pay-per-view, toys, and theme park rides). Heavilytechnical and heavily marketed films are very expensive, however, andemphasize what is the biggest problem for the film industry: the highinitial outlay of funds necessary to produce a film (Trumbull 1997). Indeed,the film industry is in many ways an oligopolistic market, in which fivelarge companies (Columbia, Disney, Fox, Universal, and Warner) accountfor about 75 percent of revenues (Trumbull 1997). This has changed a bit inthe 1990s, with the success of several small, inexpensive, independentlyproduced films.
Employment in the motion picture production and services industrystands near an all-time high of 246,000 nationwide in early 1999. In LosAngeles alone, 152,000 individuals are employed in the motion pictureindustry. Nationwide, employment in motion picture production andservices has grown 85 percent since 1990. This is a testament to the

America’s High-Tech Economy Milken Institute - July 13, 1999
122
...but intellectualproperty rights andpiracy are becomingimportant issues.
• • •
Technology islowering productioncosts and barriers toentry.
• • •
The end of the ColdWar led torestructuring in theengineering andarchitectural servicesindustry.
• • •
International competition is
Internationalcompetition is takinga greater marketshare...
booming number of technology positions available in the industry, as wellas the increased demand for the industry’s products in an expandingnumber of marketable forms. Gross industry output averaged an annualgrowth rate of 3.9 percent over the last three decades.
Foreign markets have long been an important source of income for theAmerican motion picture industry, accounting for about half of total salesover the last 30 years. In an industry where only a few films earn more atthe box office than they cost to make, foreign distribution often determinesthe difference between success and failure. Perhaps the most salient issueaffecting export earnings for the American motion picture industry is theissue of intellectual property rights and the unauthorized presentation,theft, or piracy of films in international markets. According to theInternational Intellectual Property Alliance, worldwide piracy costs theAmerican film industry $15 billion to $17 billion each year.
Technological change will continue to drive the motion picture productionand services industry in the coming years. Like the music industry beforeit, motion picture production and marketing is expected to becomeincreasingly digital in form. The use of digital cameras and projectors willcontinue to blur the lines between what are motion pictures and otherforms of multimedia. Technology also is expected to reduce productioncosts (including film stock, editing, and special effects) and subsequentlylower the entry level for filmmakers with stories to tell, but limitedbudgets to tell them with.
SIC 871 - Engineering and Architectural Services,and SIC 873 - Research and Testing Services
This relatively small segment of the high-tech sector includesestablishments employing a varied array of technologies used to providedesign, construction, testing, measuring, and research services. Twoindustries comprise this segment. The first is engineering, architectural,and surveying services (SIC 871), which provides professional engineeringand architectural contracting and consulting, as well as land, water, andaerial surveying. Second is research, development, and testing services(SIC 873), which includes nonmedical laboratory services andorganizations involved in commercial and noncommercial research in theapplied, natural, and social sciences.
Establishments in the engineering and architectural, and research andtesting industries are generally involved in longer-term, contract-typeprojects with long lead times. These projects include commercial buildings,industrial processing plants and factories, naval and aeronautical systems,public and institutional facilities (such as hospitals and schools), and largeinfrastructure projects including power generating facilities, water supplyand sanitation systems, highways, roads, and bridges. Both industries
Milken Institute - July 13, 1999 America’s High-Tech Economy
123
Many foreignprofessionalsare trainedin the U.S.
• • •
The strong U.S.economy shouldkeep the industrygrowing at amoderate pace.
experienced downturns during the recession of the early 1990s. This led tolayoffs, downsizing, and restructuring. The engineering services industrywas burdened further by the end of the Cold War and the political changethat cut funding for defense technologies. Today, civilian projects are theprimary source of industry income, and with them come a moreinterdisciplinary approach to problem solving.
International markets also have become a major growth area, and demandfor services is often tied to conditions in other countries. U.S. companiesare, however, experiencing increased competition from foreign firms, anda small but growing number of international firms are winnnningcontracts for projects in the United States. Competition has forced U.S.companies to expand productivity and reduce costs. Many nations alsoturn to the United States to train their engineers, architects, scientists, andresearchers. In 1994—95, for example, 58 percent of the engineering Ph.D.sawarded by American universities went to foreign-born students (NationalCenter for Education Statistics 1997).
Gross industry output for the engineering and architectural, and researchpast 30 years, and was $94 billion and $62 billion, respectively in 1997.These figures are each near all-time industry highs, as are employmentlevels. Engineering and architectural services firms employ over 900,000individuals, while research and testing services have a workforce ofslightly less that 600,000. Output per man-hour for both industries,however, hovered at $50 in 1996 — at the bottom of the high-tech sector.Each industry is of spillover). Utilizing public policy and the interactionbetween local high-tech companies and government to form researchcenters can be important in long-term high-tech development.
America’s High-Tech Economy Milken Institute - July 13, 1999
References
Audretsch, David B. 1998. Agglomeration and the Location of InnovativeActivity. Oxford Review of Economic Policy 14 (2).
Baily, Martin N., and Robert J. Gordon. 1988. The Productivity Slowdown,Measurement Issues, and the Explosion of Computer Power. BrookingsPapers on Economic Activity, 347–420.
Barro, Robert, and X. Sala-i-Martin. 1992 Convergence. Journal of PoliticalEconomy (April).
Baumont, Catherine, Hubert. Beguin, and Jean-Marie Huriot. 1998. AnEconomic Definition of the City. Econometric Advances in Spatial Modelingand Methodology. Dordrecht, Netherlands: Kluwer AcademicPublishers.
Benner, Chris, Bob Brownstein, and Amy B. Dean. 1999. Walking the LifelongTightrope: Negotiating Work in the New Economy, A Status Report on Social andEconomic Well-Being in the State of California. San Jose, CA: WorkingPartnerships USA, i–vii.
Bergman, Jay, and Janet Pfleeger. 1997. Which Industries Are Sensitive toBusiness Cycles? Monthly Labor Review (February): 19–25.
Black, Duncan, and Vernon Henderson. 1999. Spatial Evolution ofPopulation and Industry in the United States. Papers and Proceedings of theOne Hundred Eleventh Annual Meeting of the American Economic Association89 (2): 321–27..
Blinder, Alan S. 1981. Retail Inventory Behavior and Business Fluctuations.Brookings Papers on Economic Activity, Vol. 443, No. 505.
Brynjolfsson, Erik, and Hitt. 1996. Productivity, Profit, and ConsumerWelfare: Three Different Measures of Information Technology’s Value. MISQuarterly (June).
Business Software Alliance. 1999. Forecasting a Robust Future: An EconomicStudy of the U.S. Software Industry. Washington, D.C.: BSA.http://www.bsa.org/statistics/us_econ_study99_c.html
Carlino, Gerald, and Keith Sill. 1997. Regional Economies: SeparatingTrends from Cycles. Federal Reserve Bank of Philadelphia Business Review(May/June).
124

Milken Institute - July 13, 1999 America’s High-Tech Economy
Cavallone, Mark. 1998. Standard & Poor’s Industry Surveys: CommunicationsEquipment, Vol. 166, No. 53, Sec. 1, December 31.
Cheng Geahigan, Priscilla, ed. 1994. American Business Climate and EconomicProfiles. Detroit: Gale Research Inc.
DeVol, Ross C. 1997a. Factors Driving Regional Growth Disparity: HowDoes the Northeast Rank? The Nor’Easter 2 (1).
DeVol, Ross C. 1997b. Metro Growth: How Dependent on High-Tech Success?Regional Special Study. WEFA Group (August).
Ellison, Glenn, and Edward Glaeser. 1999. The Geographic Concentrationof Industry: Does Natural Advantage Explain Agglomeration? Papers andProceedings of the One Hundred Eleventh Annual Meeting of the AmericanEconomic Association 89 (2): 311–16.
Enders, Walter. 1995. Applied Econometric Time Series. New York: John Wiley& Sons.
Friedman, Robert. 1998. Standard & Poor’s Industry Surveys: Aerospace andDefense, Vol. 166, No. 45, Sec. 2, November 5.
Goodstadt, Brian. 1998. Standard & Poor’s Industry Surveys: Computers –Software, Vol. 166, No. 38, Sec. 1, September 17.
Greenspan, Alan. 1998. Testimony of Chairman Alan Greenspan: TheFederal Reserve’s Semiannual Report on Monetary Policy Before theCommittee on Banking, Housing, and Urban Affairs, U.S. Senate, February24. http://www.bog.frb.fed.us/boarddocs/hh
Higgins, Benjamin, and Donald J. Savoie. 1995. Regional DevelopmentTheories and Their Application. New Brunswick, NJ: Transaction Publishers.
Holmes, Thomas. 1999. Scale of Local Production and City Size. Papers andProceedings of the One Hundred Eleventh Annual Meeting of the AmericanEconomic Association 89:2.
Huffman, Gregory W. 1994. A Primer on the Nature of Business Cycles.Federal Reserve Bank of Dallas Economic Review, First Quarter, 27–41.
Jarboe, Kenan P., and Robert D. Atkinson. 1998. The Case for Technology inthe Knowledge Economy: R&D, Economic Growth, and the Role of Government.Policy Briefing. Washington, D.C.: Progressive Policy Institute (June).
Krueger, Alan B. 1993. How Computers Have Changed the WageStructure: Evidence from Microdata, 1984–1989. Quarterly Journal ofEconomics 108 (1): 3–60.
125
America’s High-Tech Economy Milken Institute - July 13, 1999
126
Krugman, Paul. 1991. Increasing Returns and Economic Geography.Journal of Political Economy 99 (3).
Krugman, Paul. 1997. How the Economy Organizes Itself in Space: A Survey ofthe New Economic Geogrpahy. The Economy as an Evloving Complex System II.In SFI’s Studies in the Sciences of Complexity. Vol. 27. Edited by W.B.Arthur, S.N. Durlauf, and D. Lane. Reading, MA: Addison-Wesley.
Krugman, Paul. 1998. What’s New About the New Economic Geography?Oxford Review of Economic Policy 14 (2): 7–17.
Lichtenberg, Frank. 1995. The Output Contributions of ComputerEquipment and Personnel: A Firm Level Analysis. Economics of Innovationand New Technology (March): 201–17.
McGovern, Brendan. 1998. Standard & Poor’s Industry Surveys:Semiconductors, Vol. 166, No. 44, Sec. 3, October 29.
Napier, David H. 1998. Aerospace Industries Association: 1998 Year-endReview and 1999 Forecast: An Analysis. http://www.aia-aerospace.org/homepage/stats/StatisticalAnalysisText.html
National Center for Education Statistics. 1997. Digest of Education Statistics,1997. http://nces.ed.gov/pubs/digest97/98015ch3.pdf.
Peterson, Bruce, and Steven Strongin. 1996. Why Are Some IndustriesMore Cyclical Than Others? Journal of Business and Economic Statistics 14(2).
Porter, Michael. 1996. Competitive Advantage, Agglomeration Economiesand Regional Policy. International Regional Science Review 19 (1–2).
Romer, Paul. 1990. Endogenous Technological Change. Journal of PoliticalEconomy (October): 71–102.
Rossell, Marci, and Meredith Walker. 1998. Telecom in North Texas: A CaseStudy in Agglomeration. Federal Reserve Bank of Dallas. SouthwestEconomy (November/December).
Saftlas, Herman. 1998. Standard & Poor’s Industry Surveys: Healthcare –Products & Supplies, Vol. 166, No. 37, Sec. 1, September 10.
Saxenian, Annalee. 1994. Regional Advantage: Culture and Competition inSilicon Valley and Route 128. Cambridge, MA: Harvard University Press.
Scalise, George. 1998. A Billion Transistors Per Person by 2008. Speech atthe World Semiconductor Council Conference.http://www.semichips.org/news/speechwsc.htm
Milken Institute - July 13, 1999 America’s High-Tech Economy
Sichel, Daniel. 1997. The Computer Revolution: An Economic Perspective.Washington, D.C.: The Brookings Institution Press.
Solow, Robert. 1957. Technology Change and the Aggregate ProductionFunction. Review of Economics and Statistics 39: 312–20.
Sternberg, Rolf. 1996. Technology Policies and the Growth of Regions:Evidence from Four Countries. Small Business Economics 8 (2).
Trumbull, Priscilla, ed. 1997. WEFA Industrial Monitor 1997. New York:John Wiley & Sons.
U.S. Department of Commerce, International Trade Administration. 1994.U.S. Industrial Outlook 1994. Austin, TX: The Reference Press.
U.S. Internet Council. 1999. State of the Internet: USIC’s Report on Use andThreats in 1999. http://www.usic.org/usic_state_of_net99.htm
Weber, Steven. 1997. The End of the Business Cycle? Foreign Affairs 76 (4):65–82.
Williamson, Oliver E. 1990. Markets and Hierarchies. New York: The FreePress.
Wohl, Philip D. December 10, 1998. Standard & Poor’s Industry Surveys:Telecommunications – Wireless, Vol. 166, No. 50, Sec. 1.
Wohl, Philip D1998. Standard & Poor’s Industry Surveys: Telecommunications– Wireline, Vol. 166, No. 38, Sec. 2, September 17.
Woods & Poole Economics. 1998. 1998 MSA Profile: Metropolitan AreaProjections to 2020. Washington, DC: Woods & Poole Economics.
Zarnowitz, Victor. 1998. Has the Business Cycle Been Abolished? BusinessEconomics (October).
Zarnowitz, Victor. 1999. Theory and History Behind Business Cycles: Arethe 1990s the Onset of the Golden Age? The Journal of Economic Perspectives18 (2)
127
