amlak finance pjsc...dubai real estate market 6 key real estate indicators 7 dubai mortgage market 8...
TRANSCRIPT

Amlak Finance PJSCInvestor Presentation
FY 2019

This presentation has been produced by the management of Amlak Finance PJSC (“Amlak” or the “Company”), solely for use at various teleconference
arranged for existing/prospective institutional investors and for their clients/potential clients and shall not be reproduced or redistributed, in whole or in part,
to any other person without Company’s written consent.
This presentation may contain certain forward-looking statements relating to the plans, strategies, business prospects, financial performance and results of
the Company and/or the industry in which it operates. Forward-looking statements concern future circumstances and results and other statements that are
not historical facts, sometimes identified by the words “believes”, “expects”, “predicts”, “intends”, “projects”, “plans”, “estimates”, “aims”, “foresees”,
“anticipates”, “targets”, and similar expressions. Such forward-looking statements including assumptions, opinions and views of the Company are solely
opinions and forecasts which are subject to risks, uncertainties and other factors that may cause actual events to differ materially from any anticipated
development. None of the Company or the officers or the employees provide any assurance that the assumptions underlying such forward-looking
statements are free from errors nor does any of them accept any responsibility for the future accuracy of the opinions expressed in this presentation or the
actual occurrence of the forecasted developments. The Company assumes no obligation to update any forward-looking statements or to conform these
forward-looking statements to the Company’s actual results.
By participating, attending or receiving this presentation you acknowledge that you will be solely responsible for your own assessment of the market and the
market position of the Company and that you will conduct your own analysis and be solely responsible for forming your own view of the potential future
performance of the Company’s business. Neither the delivery of this presentation nor any further discussions of the Company with any of the recipients
shall, under any circumstances, create any implication that there has been no change in the affairs of the Company since such period or date.
This Presentation is intended for information purposes only and does not constitute or form part of an offer for sale or subscription or an invitation or
solicitation of an offer to subscribe for or purchase securities of any kind and neither this document nor anything contained herein shall form the basis of any
contract or commitment from any party whatsoever.
This presentation has been prepared by Amlak Finance PJSC (“Amlak”) and reflects the management’s current expectations or strategy concerning future
events and are subject to known and unknown risks and uncertainties. No representation or warranty, express or implied, is made or given by or on behalf of
Amlak or any of its respective members, directors, officers or employees or any other person as to the accuracy, completeness or fairness of the information
or opinions contained in or discussed at this presentation.
2
Disclaimer

Amlak at a Glance2
Appendix5
Company Profile 9
Through The Years 10
Key Strategies 11
Strategic Enablers 12
Strategic Focus3
Business Overview 15
Stakeholders Priorities 14
Products and Services 23
Financial Ratios 21
Financial & Operating Performance4
Group Income Statement 17-18
Group Balance Sheet 19-20
Segment Strategy 16
3
Corporate Values 13
Economic Environment1
UAE and Dubai Economy 4
Key Economic Indicators 5
Dubai Real Estate Market 6
Key Real Estate Indicators 7
Dubai Mortgage Market 8
Awards 22
Content

UAE and Dubai Economy
The UAE’s federal budget for 2020 will increase 2 percent from 2019’s budget of AED 60.3 billion, with over 40
percent going to community development programmes.
The Dubai Government approved the budget of AED 196 Billion from 2020 to 2022. For the fiscal year of 2020, the
emirates approved a budget of AED 66.4 Billion which is the largest ever annual budget in Dubai's history.
The Dubai government has also announced a special reserve of 3% [AED 2 Billion] of the total expected
expenditure in 2020 to support the Expo 2020 event, which is expected to boost the economy and stimulate the
real estate sector.
Dubai’s Department of Economic Development (DED) issued 14,737 new licenses in the first half of the year. Of
the new licenses, 7,648 – 52 percent – were commercial, compared to 45 percent (6,722) that were professional,
two percent (262) tourism related and one percent (105) industrial.
Dubai welcomed 8.36 million international overnight visitors in the first six months of 2019, up 3 percent compared
to the same period last year, according to official figures.
4
Economic Environment
Amlak at a Glance Strategic Focus Financial & Operating Performance Appendix
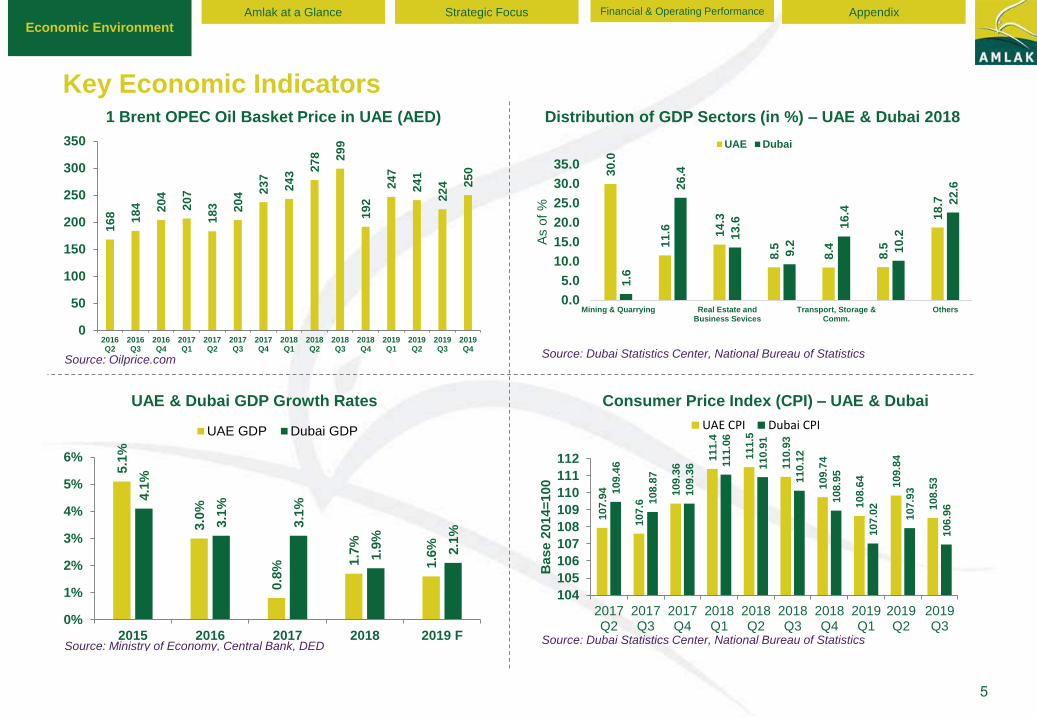
Key Economic Indicators
5
1 Brent OPEC Oil Basket Price in UAE (AED) Distribution of GDP Sectors (in %) – UAE & Dubai 2018
UAE & Dubai GDP Growth Rates Consumer Price Index (CPI) – UAE & Dubai
Economic Environment
Amlak at a Glance Strategic Focus Financial & Operating Performance Appendix
30
.0
11
.6 14
.3
8.5
8.4
8.5
18
.7
1.6
26
.4
13
.6
9.2
16
.4
10
.2
22
.6
0.0
5.0
10.0
15.0
20.0
25.0
30.0
35.0
Mining & Quarrying Real Estate andBusiness Sevices
Transport, Storage &Comm.
Others
As o
f %
UAE Dubai
Source: Dubai Statistics Center, National Bureau of Statistics
5.1
%
3.0
%
0.8
% 1.7
%
1.6
%
4.1
%
3.1
%
3.1
%
1.9
%
2.1
%
0%
1%
2%
3%
4%
5%
6%
2015 2016 2017 2018 2019 F
UAE GDP Dubai GDP
Source: Ministry of Economy, Central Bank, DED
107.9
4
107.6
109.3
6
111.4
11
1.5
110.9
3
109.7
4
108.6
4
109.8
4
108.5
3
109.4
6
108.8
7
109.3
6 111.0
6
110.9
1
110.1
2
108.9
5
107.0
2
107.9
3
106.9
6
104
105
106
107
108
109
110
111
112
2017Q2
2017Q3
2017Q4
2018Q1
2018Q2
2018Q3
2018Q4
2019Q1
2019Q2
2019Q3
Base 2
014=
100
UAE CPI Dubai CPI
Source: Dubai Statistics Center, National Bureau of Statistics
16
8 18
4 20
4
20
7
18
3 20
4 23
7
24
3 27
8 29
9
19
2
24
7
24
1
22
4 25
0
0
50
100
150
200
250
300
350
2016Q2
2016Q3
2016Q4
2017Q1
2017Q2
2017Q3
2017Q4
2018Q1
2018Q2
2018Q3
2018Q4
2019Q1
2019Q2
2019Q3
2019Q4
Source: Oilprice.com

Around 4,200 units have entered the Dubai real estate market in Q3 2019.
Almost, 74% of the projects launched this year are by Tier 1 developers. When compared to the same period last year
only 43% of the projects were by Tier 1 developers. Materialization rate has fallen to 35% compared to the historic
average of 40%.
Volume of secondary & off-plan residential and commercial transactions have risen by 25 percent & 70 percent on a
yearly basis.
On a quarterly basis, Selling and Rental prices in the residential segment have declined by 0.5 per cent and 2.6 per cent
respectively.
The Dubai government has recently launched a new real estate committee to minimize the gap between demand and
supply. The committee will also coordinate supply and demand between private and government-backed developers. The
announcement of the real estate planning committee has improved the overall market sentiment.
Both private and government-backed developers in Dubai are holding back on new project launches and are focused on
selling their existing inventory. Around 9,400 new units have been launched in the first 9 months of 2019, during the same
time last year around 11,600 new units were launched. The number of new units launched are down by 19%. The limited
number of new launches will the market stabilize in the long run.
6
Dubai Real Estate Market
Economic Environment
Amlak at a Glance Strategic Focus Financial & Operating Performance Appendix

Key Real Estate Indicators
7
Number and Value of Real Estate Transactions Dubai Residential Sales and Rental Price Changes
Dubai Commercial Rental PricesDubai Residential Supply Trends (Freehold Areas)
Economic Environment
Amlak at a Glance Strategic Focus Financial & Operating Performance Appendix
- 1 2 3 4 5 6 7 8 9
-
1,000
2,000
3,000
4,000
5,000
2017Q2
2017Q3
2017Q4
2018Q1
2018Q2
2018Q3
2018Q4
2019Q1
2019Q2
2019Q3
AE
D B
illio
ns
Number of Sales Transactions Value of Sales Transactions
Source: Reidin
60
70
80
90
100
110
120
130
-
200
400
600
800
1,000
1,200
1,400
1,600
Ju
n-1
6
Sep
-16
De
c-1
6
Ma
r-17
Ju
n-1
7
Sep
-17
De
c-1
7
Ma
r-18
Ju
n-1
8
Sep
-18
De
c-1
8
Ma
r-19
Ju
n-1
9
Sep
-19
Ren
t P
rice (
AE
D/S
qf/
An
nu
m)
Sale
s P
rice (
AE
D/S
qf)
Sales Price (AED/Sqf) Rent Price (AED/Sqf/Annum)
Source: Reidin
258 271 292 316 334 356
22
93
-
100
200
300
400
500
2015 2016 2017 2018 2019 2020 F
Th
ou
san
ds
Ready Units Announced Supply by Developers
Source: Reidin
100
110
120
130
140
150
160
170
1,000
1,050
1,100
1,150
1,200
1,250
2016Q3
2016Q4
2017Q1
2017Q2
2017Q3
2017Q4
2018Q1
2018Q2
2018Q3
2018Q4
2019Q1
2019Q2
2019Q3 R
en
t P
rice (
AE
D/S
qf/
An
nu
m)
Sale
s P
rice (
AE
D/S
qf)
Sales Price (AED/Sqf) Rent Price (AED/Sqf/Annum)
Source: Reidin

Dubai Mortgage Market
The UAE Central Bank removed the 3 per cent early
settlement fee for mortgages introduced last year and
reverted to a 1 per cent, or Dh10,000, cap as part of a
series of moves aimed at easing home loan rules.
Value of Residential and Commercial mortgages
registered valued at AED 4.5 Billion in Q3 2019, up
quarter on quarter by 23 percent.
As of September 2019, the gross rental yields for the
apartment segment stands at 7.0% while the villa segment
currently provides a yield of 5.5%. Gross Rental Yields
have marginally decreased on a quarterly basis.
Despite price declines over the last few years, Dubai still
provides investors with higher yield when compared to
other emerging markets.
8
Mortgage Transactions Over the Years
Rental Yields in Dubai
Economic Environment
Amlak at a Glance Strategic Focus Financial & Operating Performance Appendix
-
1
2
3
4
5
6
7
-
500
1,000
1,500
2,000
2,500
3,000
3,500
2017Q2
2017Q3
2017Q4
2018Q1
2018Q2
2018Q3
2018Q4
2019Q1
2019Q2
2019Q3
Billio
ns
Number of Mortgage Transactions Value of Mortgage Transactions
Source: Reidin
2%3%4%5%6%7%8%9%
10%
Gross Rental Yields - Apartments Gross Rental Yields - Villas
Source: Reidin

Company Profile
• Amlak Finance PJSC was incorporated in Dubai, United Arab Emirates, on 11 November 2000 as a Private Shareholding Company.
• At the constituent shareholders meeting held on 9 March 2004, a resolution was passed to convert the Company to a Public Joint Stock Company.
• Amlak Finance is a leading specialized real estate financier in the Middle East.
• The activities of the Company are conducted in accordance with Islamic Sharia’a,
• Amlak offers a range of customized financial solutions and products to investors/clients for both ready and off-plan properties.
• Amlak expanded its presence to Kingdom of Saudi Arabia (KSA) in 2006 through investment in ‘Amlak International for Real Estate Finance
Company’.
• Amlak launched its first international office in Egypt in 2007, which operates under the name ‘'Amlak Finance Egypt Company S.A.E’.
• Following the completion of its highly successful financial restructuring in 2014, Amlak is pursuing a prudent business strategy that is also now
well-placed to work towards continuous enhancement of value for its shareholders.
Background
Geographic Presence
Company Location % Shareholding
Amlak Property Investment LLC UAE 100%
Amlak Capital LLC UAE 100%
Amlak Holding Limited UAE 100%
Warqa Heights LLC UAE 100%
Amlak Sky Gardens LLC UAE 100%
EFS Financial Services LLC UAE 57.5%
Amlak Limited UAE 100%
Amlak Finance Egypt Company S.A.E Egypt 100%
Amlak Nasr City Real Estate Investment
LLC
Egypt 100%
Amlak International for Real Estate
Finance Company
KSA 26.21%
Subsidiaries and Associates Retail
Investors
45%
Emaar and its
Subsidiaries
48%
UAE
Nationals
82%
Other Nationalities
13%
GCC Nationals
6%
Ownership Structure
Nationality of Ownership
Other Institutions 7%
Egypt
KSA
9
Economic Environment
Amlak at a Glance
Strategic Focus Financial & Operating Performance Appendix

Through The Years
Economic Environment
Amlak at a Glance
Strategic Focus Financial & Operating Performance Appendix
2014
• Successful completion of restructuring
• Implementation of the approved restructuring plan in November 2014
• Settled AED 2.8 Bn of liabilities in cash
2015
• Reported profit of AED 139 Mn
• Resumption of share
• trading on DFM in June 2015
• Redemption of AED 200 Mn
• of Contingent Convertible Instrument (CCI) within the first year after restructuring
• Advance Payment of AED 558 Mn to Financiers
2016
• Reported profit of AED 107 Mn
• Successful renegotiation of key restructuring terms led Amlak to meet its strategic intents
• Long term
• sustainability and growth
• Improved ability to attract new funding
• Enhancement in shareholder value
• Advance Payment of AED 274 Mn to Financiers
2017
• Reported profit of AED 51 Mn
• CCI Redemption of AED 100 Mn.
• Completion of our first real estate development in Mirdiff
• Reduce operating cost by 18%
2018
• Further advance payments of AED 684 Million to financiers in January 2018
2019
• Amlak reached an advanced stage of renegotiating the
funding terms with its financiers
• AED 780 million win in arbitration ruling (no
impact on 2019 financials)
2000-2004
• 2000
• Incorporation of AmlakFinance as a private shareholding company in Dubai, UAE
• 2004
• Share Capital increase by 6 times to AED750 Mn
• Converted into Sharia Compliant Public Joint Stock Company
• Listed on DFM
2005
• Share Capital increase by 2 times to AED 1.5 Bn
• Rights issue
• Successfully launched Sukuk
• FM
2006
• Launched “First AmlakReal Estate Fund”
• Invested in Amlak International for Real Estate Finance Company KSA (Associate)
2007
• Invested in AmlakFinance & Real Estate Investment (S.A.E.) (100% subsidiary in Egypt)
2008
• Total assets reaching AED 21 Bn. Real estate investment reaching AED 6 Bn. Mortgage portfolio reaching AED 13 Bn
• The financial turmoil hit the UAE
• Suspension of share trading on DFM
2009-2013
• 43% drop in Liabilities and Commitments by AED 8 Bn
• It was the stand still period for Amlak growth. However management proactively adopted focused strategies covering:
• Continue serving financier
• Effective Portfolio management
• Robust liquidity management
• Cost rationalization
• Negotiated significant reduction in liabilities& commitments
• Protecting Shareholders’ value
10

Key Strategies
11
• Renegotiation with financiers to ensure long term growth of the Company and ensuring full
compliance with and adherence to revised agreement reached with the Depositors.
• Flawless implementation of restructuring milestones
Liquidity &
Compliance
Remain Profitable
Funds Availability
Product Innovation
New Customer
Segments
Profitability and Growth
Sustainable Funding
Restructuring
Value Proposition
Customer
SatisfactionOrganizational
Capability
• Ensure cost rationalization to maintain and align efficiency ratios in line with industry best practices EfficiencyCost Rationalization
• Build up real estate finance business comprising of both ready and under-construction properties
for growth in core revenue streams
• Create long term value from real estate portfolio through development of land parcels
• Exit real estate investments to limit real estate markets volatility impact and reinvest in generation
of core revenue stream
• Enhance shareholder profitability through improved margins and sustained operational efficiencies
• Secure funding from innovative sources subject to parameters and covenants agreed with
financiers
• Develop a range of financing options both off and on balance sheet which are best suited keeping
in view liquidity gap and refinancing needs
• Offer specialized and differentiated products, superior lead generation and excellent sales and
service execution
• Robust risk management to manage risks within risk appetite.
• Staff and talent development and retention as well as boosting corporate brand.
Enhance shareholder value whilst adhering to restructuring obligations
Strategic Intents Strategic MetricsStrategic Priorities
Economic Environment Amlak at a Glance
Strategic Focus
Financial & Operating Performance Appendix

Strategic Enablers
12
Product Differentiation
Customer Focus
New Customer Segments
Lead Generation
Funding
Real Estate Development
Cost Rationalization
Regional & Political Stability
Strategic
Enablers
“To provide niche
financial solutions,
customized to fit
our customers'
needs, while
maximizing
shareholder value
and nurturing our
employees”
Our Mission (What is our purpose?)
Our Vision (What we aim to become?)
“To be a
specialized and
customer centric
real estate
financing institution
in the UAE”
Economic Environment Amlak at a Glance
Strategic Focus
Financial & Operating Performance Appendix

Corporate Values
13
Strategic
Enablers“To provide niche
financial solutions,
customized to fit
our customers'
needs, while
maximizing
shareholder value
and nurturing our
employees”
Our Mission (What is our purpose?)
Our Corporate Values (What we stand for?)
Our Corporate Values (What we stand for?)
Economic Environment Amlak at a Glance
Strategic Focus
Financial & Operating Performance Appendix
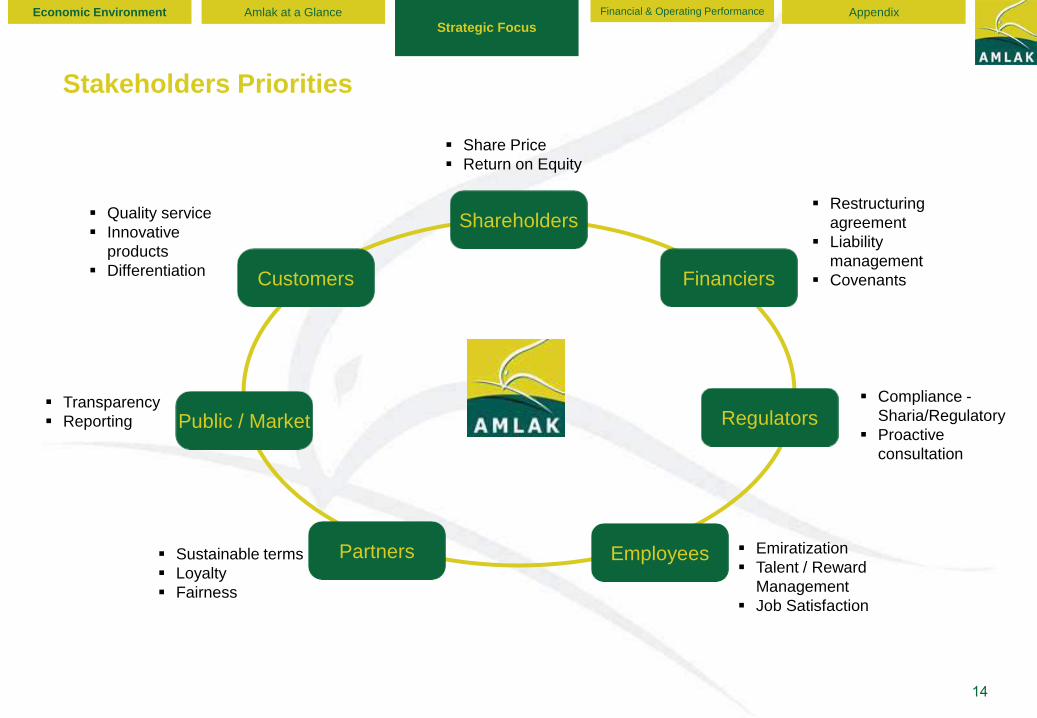
Stakeholders Priorities
14
Shareholders
Share Price
Return on Equity
Financiers
Restructuring
agreement
Liability
management
Covenants
Regulators Compliance -
Sharia/Regulatory
Proactive
consultation
Employees Emiratization
Talent / Reward
Management
Job Satisfaction
Partners Sustainable terms
Loyalty
Fairness
Public / Market Transparency
Reporting
Customers
Quality service
Innovative
products
Differentiation
Economic Environment Amlak at a Glance
Strategic Focus
Financial & Operating Performance Appendix

Business Overview
Amlak’s overall business is being managed by way of 3 segments
Real Estate Investment
(REI)Real Estate Finance (REF)
Corporate Finance
and Investment (CFI)
Ready Property Private Construction
• Ready Property
Financing
• Ready property
portfolio
(Repossessed
units)
• Customer
centricity,
relationship
management and
property
management
• Private
Construction
Financing
• Management of
under construction
projects
• Customer centricity
• End to end
customer solution
• Includes investment
in ready property,
land parcels and
properties under
development
• Proactive property
management to
enhance value
• Development of
land parcels
• Includes Amlak
Finance Egypt
Company S.A.E.
(Subsidiary - Egypt)
• Includes investment
in Amlak
International for
Real Estate
Development and
Finance Company
(Associate - KSA)
• Other Investments
(Private Equity and
Funds)
Business Segments
Segment Asset Mix – Q3 2019
Corporate Finance
Investment & Others
9%
Real Estate
Investment
34%
Real Estate
Finance
57%
15
Economic Environment Amlak at a Glance
Strategic Focus
Financial & Operating Performance Appendix

16
Real Estate Finance (REF)
Segment Strategy
Key MetricsActual
Q3 2019
Targeted
2020
Portfolio Level AED 2.2Bn AED 2.2Bn
Delinquency Rate 5.9% 5%
Rental Income AED 20Mn AED 20Mn
Economic Environment Amlak at a Glance
Strategic Focus
Financial & Operating Performance Appendix
Ready Property
Continue to pursue investors through investor
related products
Cross-sell to existing customers
Offer innovative products and address under-
served segments
Ensure superior service to customers
Utilize targeted marketing approach to reach
identified client segments, utilizing alliances
where appropriate
Exit Amlak Finance Investment Unit (AFIU)
repossessed assets
Improve portfolio quality
Private Construction
Focus on higher-margin business with aim to
capture larger market share of this untapped
segment
Real Estate Investment (REI) Corporate Finance & Investment (CFI)
Key MetricsActual
Q3 2019
Targeted
2020
Rental Income AED 24Mn AED 19Mn
Rental Yield 4.5% 5%
Mark to Market
(MTM) on real
estate assets
AED
127MnAED (50)Mn
Development
Completion % -
Nad Al Hamar
70% 100%
Development
Completion % -
Al Ttay
100% NA
Focus on value creation by continuing to develop
land parcels
Maintain high asset yield and low vacancy rates
for ready properties
Enhance property management offering
REI Portfolio
Key MetricsActual
Q3 2019
Targeted
2020
Dividend Income AED 17Mn AED 2Mn
KSA IPO Sale % - 30%
Return on Investment
(ROI)7.6% 8.4%
Focus on exiting non-core investments
Ready PropertyUnder
Construction Property
Land Parcel
• Sky Gardens
• Remraam
• Discovery Gardens
• Waha Villas
• Al Ghadeer
• Mirdif
• Al Ttay
• Nad Al
Hamar
• Al Ttay plot
• Nad Al Hamar
plot
• Nasr City
• Land (Egypt)

Group Income Statement
Highlights
17
• Total revenues of 2019 amounted to AED 260 million; a decrease of 15% compared to 2018.
• Revenues from financing business activities down by 1% to AED 172 million in 2019 compared to AED
174 million in 2018.
• The company reported net loss of AED 320 million in 2019 compared to AED 272 million net loss in 2018.
• Operating costs remained under control amounting to AED 117 million when compared to last year.
• Impairment charge of AED 111 million on Islamic Financing Assets compared to AED 59 million in same
period last year; this increase in impairment is mainly due to a financial default of one developer.
Profit / (Loss) for the period
21
-221
-279
51
-272
-320
-400 -300 -200 -100 0 100
Q4 2017
Q4 2018
Q4 2019
Dec 2017
Dec 2018
Dec 2019
Economic Environment Amlak at a Glance Strategic FocusFinancial & Operating
Performance
Appendix
Change in %Particulars
AED in Mn
VarianceDec 2019 Dec 2018
Dec 2019 vs. Dec 2018
Change in %VarianceQ4 2019 Q4 2018
Q4 2019 vs. Q4 2018
Income from Financing and Investing assets 41 42 (1) -2% 172 174 (2) -1%
Rental income 13 16 (3) -19% 57 64 (7) -11%
Sale of properties under development - - - - - 61 (61) -100%
Fair value gain / (loss) on investment properties (91) (10) (81) -810% (18) (35) 17 -49%
Loss on sale of investment properties (8) 0 (8) - (18) - (18) -
Other Income 24 2 22 1100% 50 22 28 127%
Total Income (19) 56 (75) -134% 260 307 (47) -15%
Reversal of impairments / (impairments) (36) (17) (19) 112% (111) (59) (52) 88%
Amortisation of initial fair value gain on investment deposits (22) (26) 4 -15% (96) (110) 14 -13%
Operating Expenses (29) (59) 30 -51% (117) (145) 28 -19%
Cost of sale of properties under development (including
related operating expenses)(146) (146) - - (146) (153) 7 -5%
Share of results of an associate 2 6 (4) -67% 17 21 (4) -19%
Profit Before Distribution to financiers / investors (252) (192) (60) 31% (210) (160) (50) 31%
Distribution to financiers / investors (27) (29) 2 -7% (110) (112) 2 -2%
Profit / (Loss) for the year (279) (221) (58) 26% (320) (272) (48) 18%
Dec stands for 12 months of the year (i.e. 12 months from Jan to Dec) .Q4 stands for the Fourth quarter of the year only (i.e. 3 months Oct to Dec)

Group Income Statement (cont’d)
Total Income*Income from Financing
and Investing Assets
Operating Expenses Distribution to Financiers/ InvestorsNet Gain on Sale of Properties
Under Development
Rental Income
AED in Mn
18
14356
-19
432307
260
Q4 2017Q4 2018Q4 2019
Dec 2017Dec 2018Dec 2019
484241
191174172
Q4 2017Q4 2018Q4 2019
Dec 2017Dec 2018Dec 2019
1616
13
6164
57
Q4 2017Q4 2018Q4 2019
Dec 2017Dec 2018Dec 2019
4059
29
122145
117
Q4 2017Q4 2018Q4 2019
Dec 2017Dec 2018Dec 2019
322927
125112110
Q4 2017Q4 2018Q4 2019
Dec 2017Dec 2018Dec 2019
1600
5261
0
Q4 2017Q4 2018Q4 2019
Dec 2017Dec 2018Dec 2019
Economic Environment Amlak at a Glance Strategic FocusFinancial & Operating
Performance
Appendix
*Including Share of Results

Group Balance Sheet
19
• Total assets of Amlak stand at AED
5.3 billion FY 2019 (2018: AED 5.8
billion) and total liabilities at AED
4.5 billion (2018: AED 4.6 billion)
Highlights
YE 2019 YE 2018Change in %
YE 2019 vs. YE 2018Particulars
AED in Mn
Variance
Cash and Balances with Banks 183 256 -73 -29%
Islamic Financing and Investing Assets 2,435 2,704 -269 -10%
Real Estate Investments 2,320 2,396 -76 -3%
Corporate Investments 297 297 0 0%
Other Assets 72 84 -12 -14%
Total Assets 5,307 5,737 -430 -7%
Investment Deposits and Other Islamic Financing 4,171 4,330 -159 -4%
Other Liabilities (Incl Non-Controlling Interest) 429 403 26 6%
Equity 707 1,005 -298 -30%
Total Equity & Liabilities 5,307 5,737 -431 -8%
Economic Environment Amlak at a Glance Strategic FocusFinancial & Operating
Performance
Appendix
Cash and Balances with Banks Islamic Financing and Investing Assets
673
256
183
2017
2018
2019
3,085
2,704
2,435
2017
2018
2019

Group Balance Sheet (cont’d)
20
Total Assets
Real Estate Investments Corporate Investments
Investment Deposits and Other Islamic Financing Liability and Equity Mix – Dec 2019
Assets Mix – Dec 2019
AED in Mn
2,357
2,396
2,320
2017
2018
2019
315
297
297
2017
2018
2019
6,579
5,737
5,307
2017
2018
2019
4,858
4,330
4,171
2017
2018
2019
43%
47%44%
2% 3%
Cash and balances with banks
Islamic financing and investing assets
Real Estate Investments
Corporate Investments
79%
7%20%
Investment deposits and other Islamic financing
Other liabilities (incl non-controlling interest)
Equity
Economic Environment Amlak at a Glance Strategic FocusFinancial & Operating
Performance
Appendix

21
Net Financing to Deposit Ratio Liquid Assets to Total Assets Ratio
Financial Ratios
64%
58%
54%
2017
2018
2019
16%
5%
4%
2017
2018
2019
3%
-18%
-28%
2017
2018
2019
1%
-5%
-6%
2017
2018
2019
32%
59%
42%
2017
2018
2019
Economic Environment Amlak at a Glance Strategic FocusFinancial & Operating
Performance
Appendix
Return on Equity (ROE)
Return on Assets (ROA) Cost to Income Ratio

22
2017
1. Best Sharia Compliant Property Finance
Company
2. Best Islamic Finance CSR Company UAE 2017
3. Best for Sharia Compliant Property Finance
4. 2017 UAE Leading Decision Makers Award
Chief Executive Officer of The Year 2017 –
Dubai.
5. Best Real Estate Product (Double Your
Property)_ UAE
6. Best Home Finance Company
2018
1. Global Islamic Business Award 2018
2. Dubai Chamber’s CSR Label 2018
3. Best Islamic Finance CSR Company UAE 2018
4. Best Sharia Compliant Property Finance Company
2018
5. Best Real Estate Financier 2018 & Award for
Excellence in Client-Focused Financial Services
Economic Environment Amlak at a Glance Strategic Focus Financial & Operating Performance
Appendix
Awards
2019
1. Best Islamic Finance CSR Company UAE 2019
2. Best Sharia Compliant Property Finance Company
UAE 2019

Products and Services
23
Istithmari
Ijarah
Tatweer
Private Construction
Finance
Istithmari is the first-of-its-kind Buy-To-Let property finance (Ijara) product in the region, designed for investors looking
to invest in completed residential and commercial properties. Customers are also provided with a complimentary full
suite of Property Management Services.
Ijara is the basic home finance product aimed towards end users for residential as well as commercial property in ready
or completed projects. Under Ijarah, Amlak buys the property from the developer/seller and leases it out to the
customer with a promise to sell at the end of the lease term. The customer pays monthly rentals that comprise of fixed,
variable and supplementary rentals.
Tatweer is an under-construction financing product for investors as well as for end users. Finance is supplemented by a
complimentary full suite of property management services that comes into effect post completion and handover of the
property.
Private Construction Finance is offered to individuals or corporates that carry out under construction projects with an
intention to either rent, occupy or operate the development, post construction completion.
Although the product is primarily targeted towards the wholesale segment, individual or retail applications are also
catered under the same offer on a case by case basis.
Double Your Property
Portfolio
This first-of-its-kind product is designed for investors who have equity in UAE property to double their property portfolio.
The product provides investors with increased returns on their real estate investments as well as attractive financing
terms. Amlak will facilitate the entire new investment process and investors can enjoy complete access to Amlak’s
diverse real estate portfolio and receive complimentary property management services.
Economic Environment Amlak at a Glance Strategic Focus Financial & Operating Performance
Appendix
Phone: +971 4 4274500
Web: http://www.amlakfinance.com/en/investor-relations.html
Email: [email protected]
P O Box: 2441, Dubai, United Arab Emirates
Contact
Investor
Relations