ammonia: a new business for nuclear energy
TRANSCRIPT
Ammonia: A New Business for Nuclear Energy
Richard Boardman, Ph.D. ChE
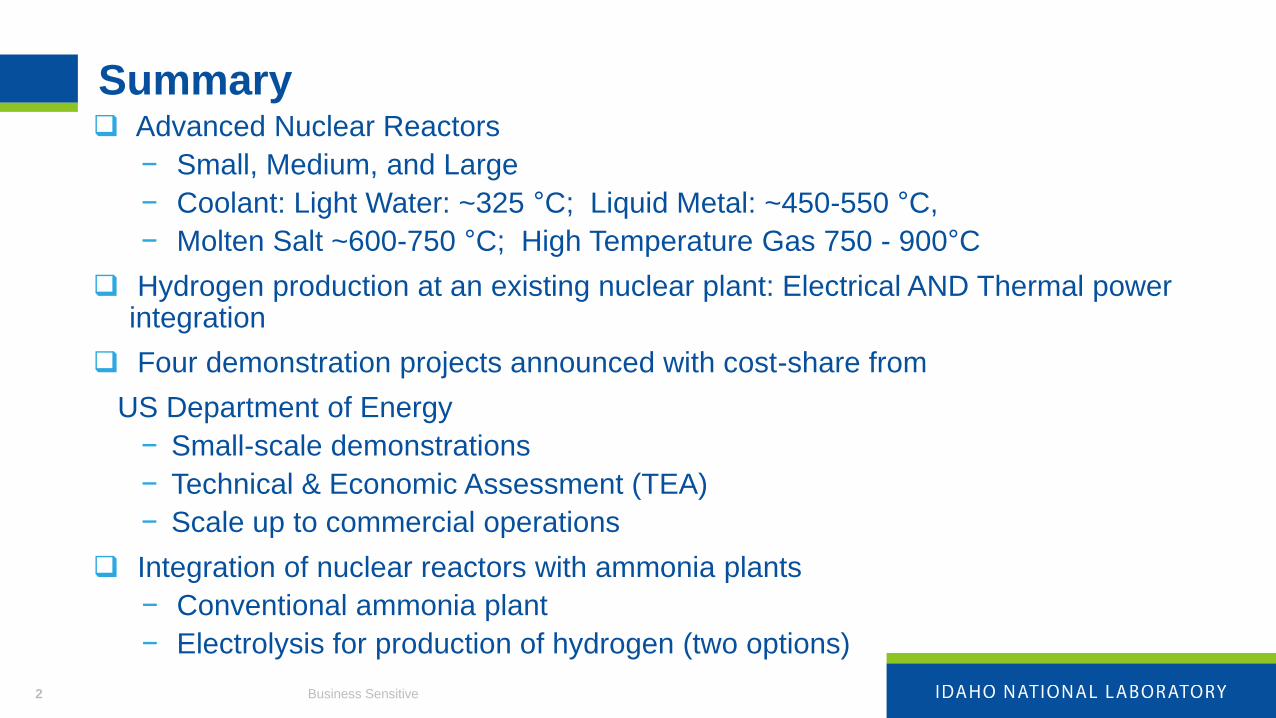
Summary❑ Advanced Nuclear Reactors
− Small, Medium, and Large
− Coolant: Light Water: ~325 °C; Liquid Metal: ~450-550 °C,
− Molten Salt ~600-750 °C; High Temperature Gas 750 - 900°C
❑ Hydrogen production at an existing nuclear plant: Electrical AND Thermal power integration
❑ Four demonstration projects announced with cost-share from
US Department of Energy
− Small-scale demonstrations
− Technical & Economic Assessment (TEA)
− Scale up to commercial operations
❑ Integration of nuclear reactors with ammonia plants
− Conventional ammonia plant
− Electrolysis for production of hydrogen (two options)
Business Sensitive2
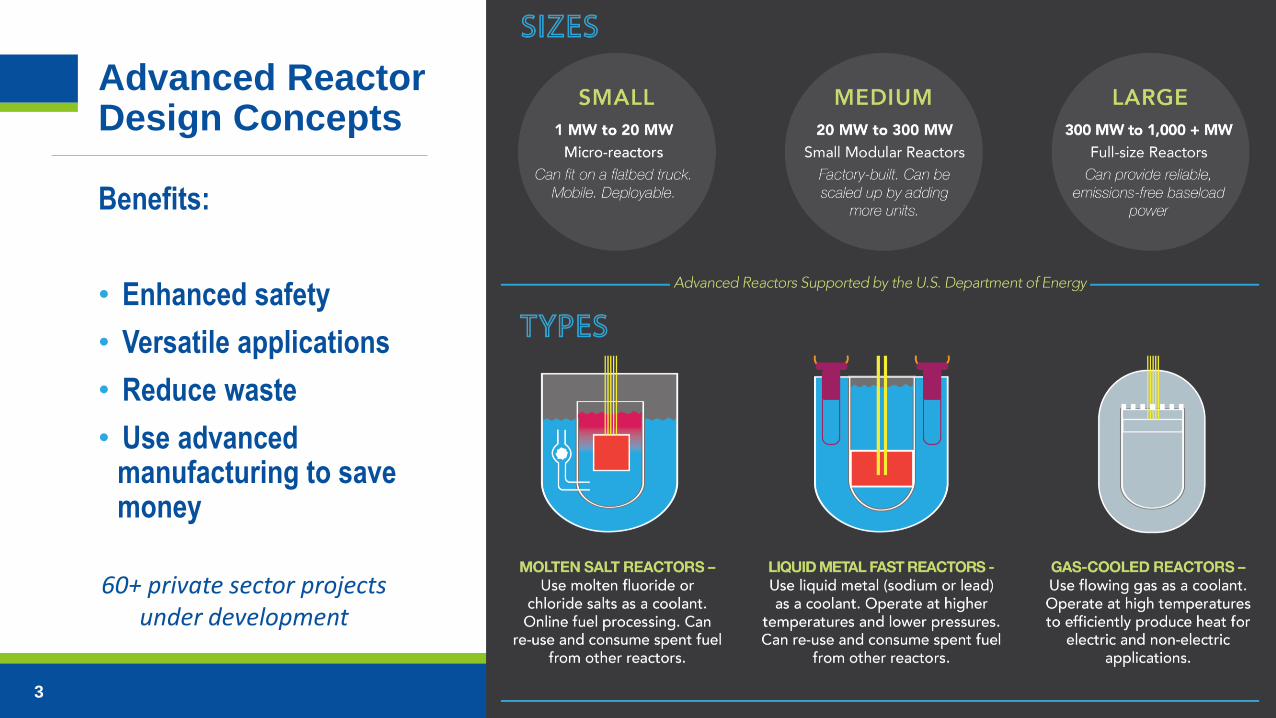
Advanced Reactor Design Concepts
Benefits:
• Enhanced safety
• Versatile applications
• Reduce waste
• Use advanced manufacturing to save money
3
60+ private sector projects under development

Accelerating advanced reactor demonstration and deployment
MARVELDOE
2022-2023
DOME Test BedNRIC2023-2024
Project Pele MicroreactorDoD
2023-2024
MCRESouthern Co. & TerraPower
2025
SMRUAMPS & NuScale2029
Natrium Reactor
TerraPower & General Electric
2028
LOTUS Test BedNRIC2024
HermesKairos
2026
AuroraOklo Inc.TBD
Xe-100
X-energy
2027
2030
4
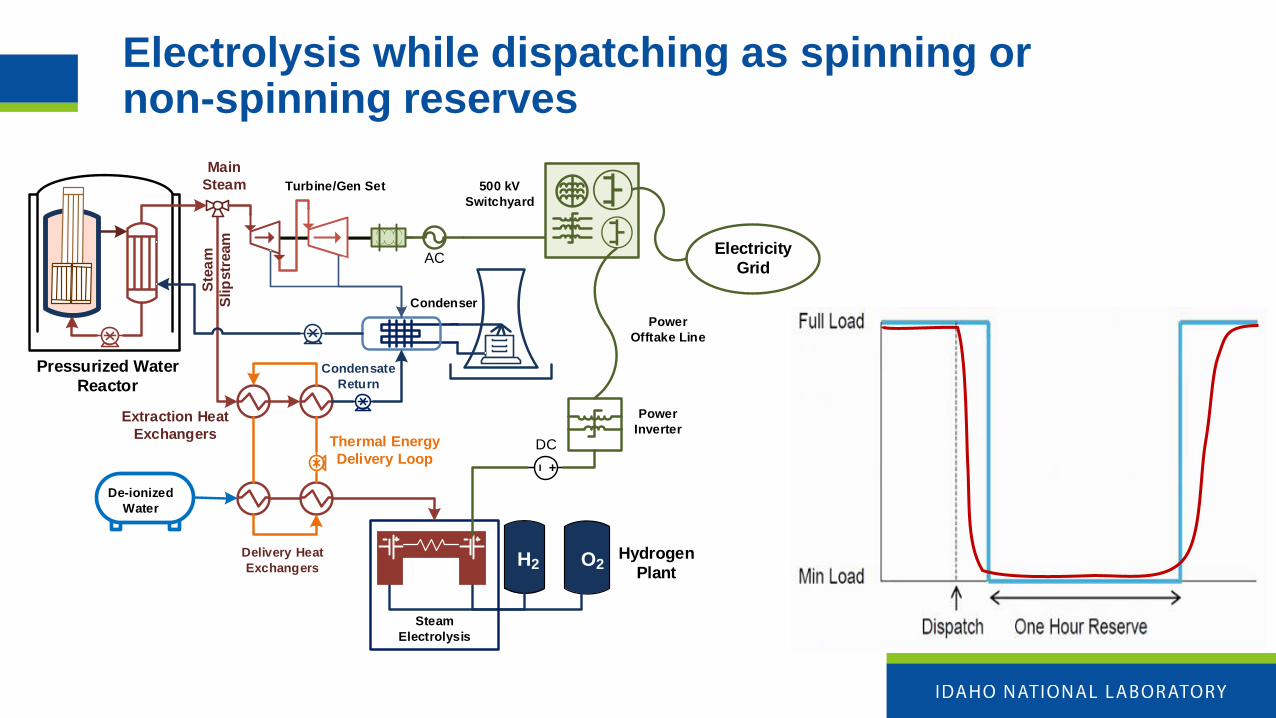
Electrolysis while dispatching as spinning or non-spinning reserves
Pressurized Water
Reactor
AC
DC
Electricity
Grid
Steam
Electrolysis
O2H2
De-ionized
Water
500 kV
Switchyard
Main
Steam
Ste
am
Slip
str
eam
Power
Inverter
Power
Offtake Line
Extraction Heat
ExchangersThermal Energy
Delivery Loop
Hydrogen
Plant
Delivery Heat
Exchangers
Condenser
Turbine/Gen Set
Condensate
Return

Dynamic Energy Transport and Integration Laboratory (DETAIL)
Power
Hardware
and Grid-in-
the-Loop
Integrated Plant Simulator with
Human-in-the-Loop
Thermal Energy
Generation and Transport
Dynamic
Hydrogen
production
6

Two paths to H2 Earthshot Target ($1/kg-H2 within a decade)
7
Improve stacks and reduce BOP costs
Reduce cost of LWR power production
Oxygen sales offset
Joint EERE-NE H2 Production Demonstration Projects
8
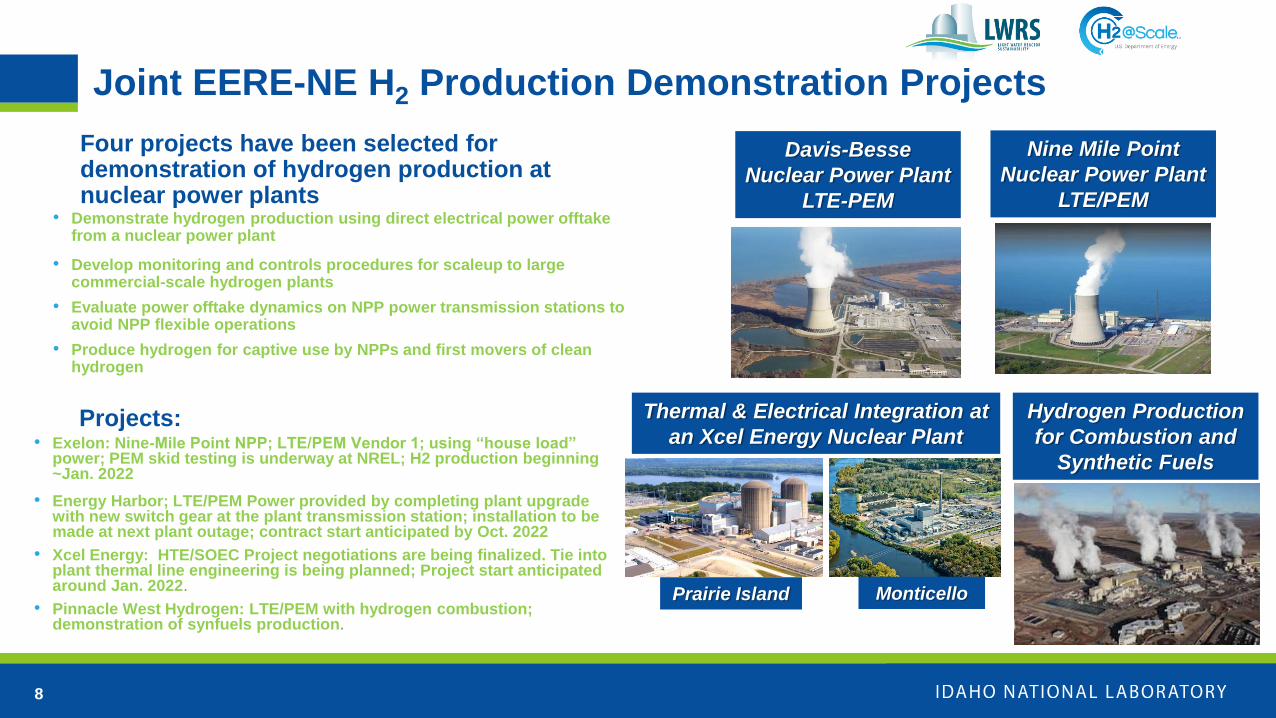
Four projects have been selected for demonstration of hydrogen production at nuclear power plants
• Demonstrate hydrogen production using direct electrical power offtake from a nuclear power plant
• Develop monitoring and controls procedures for scaleup to large commercial-scale hydrogen plants
• Evaluate power offtake dynamics on NPP power transmission stations to avoid NPP flexible operations
• Produce hydrogen for captive use by NPPs and first movers of clean hydrogen
Davis-Besse
Nuclear Power Plant
LTE-PEM
Thermal & Electrical Integration at
an Xcel Energy Nuclear PlantProjects:
• Exelon: Nine-Mile Point NPP; LTE/PEM Vendor 1; using “house load” power; PEM skid testing is underway at NREL; H2 production beginning ~Jan. 2022
• Energy Harbor; LTE/PEM Power provided by completing plant upgrade with new switch gear at the plant transmission station; installation to be made at next plant outage; contract start anticipated by Oct. 2022
• Xcel Energy: HTE/SOEC Project negotiations are being finalized. Tie into plant thermal line engineering is being planned; Project start anticipated around Jan. 2022.
• Pinnacle West Hydrogen: LTE/PEM with hydrogen combustion; demonstration of synfuels production.
Nine Mile Point
Nuclear Power Plant
LTE/PEM
Prairie Island Monticello
Hydrogen Production
for Combustion and
Synthetic Fuels

9
Water
High Temperature
Heat
Reformer
Hydrogen
CO2
Sequestration
Nuclear Power Plant
Heator Steam
Steam
O-SOECElectrolysis
or Co-Electrolysis
Synergies between nuclear and steam-methane reforming
❑ Oxygen from high
temperature steam
electrolysis
❑ Power for CO2 compression
and sequestration
❑ Steam generation
❑ Preheat natural gas
❑ Flameless reformer with
very high temperature
gas-cooled reactor
(>900°C ROT)
❑ GAPS:
- Heat integration
- Efficient CO2 separation
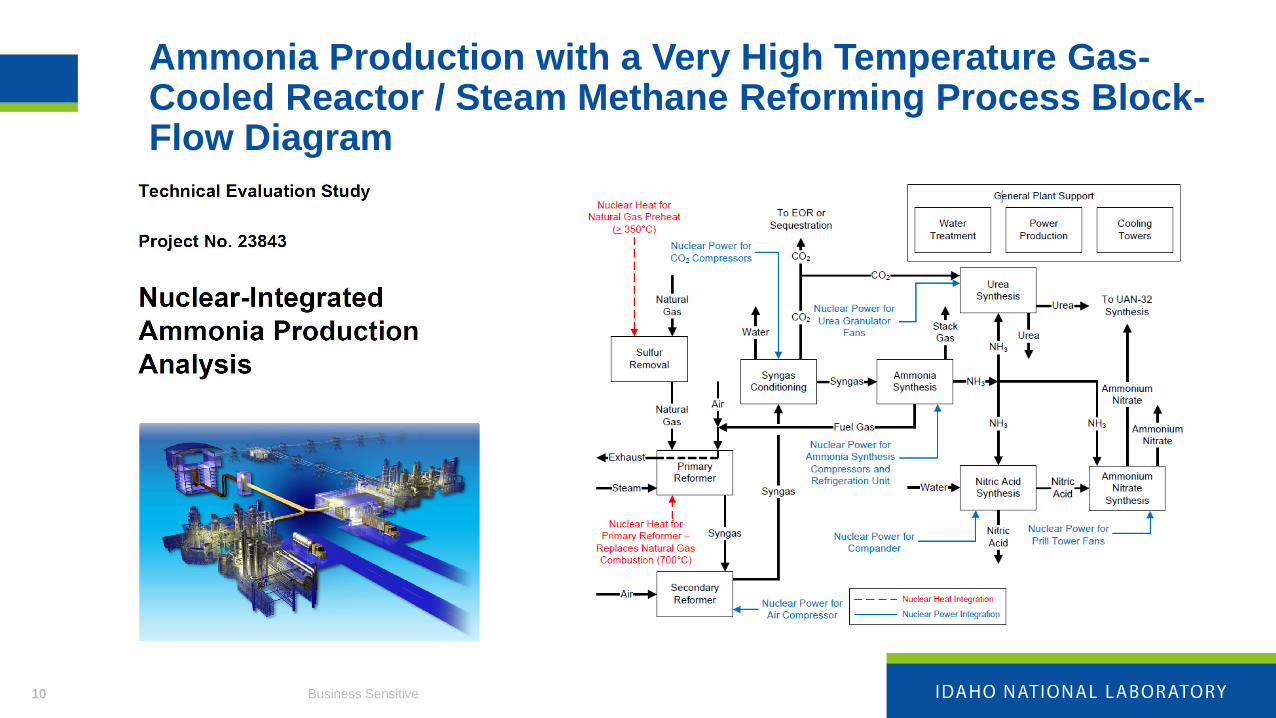
Ammonia Production with a Very High Temperature Gas-Cooled Reactor / Steam Methane Reforming Process Block-Flow Diagram
Business Sensitive10

High Temperature Steam Electrolysis for Hydrogen Production
Business Sensitive11
HTSE with Traditional Air Separation Unit HTSE with Hydrogen Combustion for
Nitrogen Production

Comparison of Inputs and Outputs
12
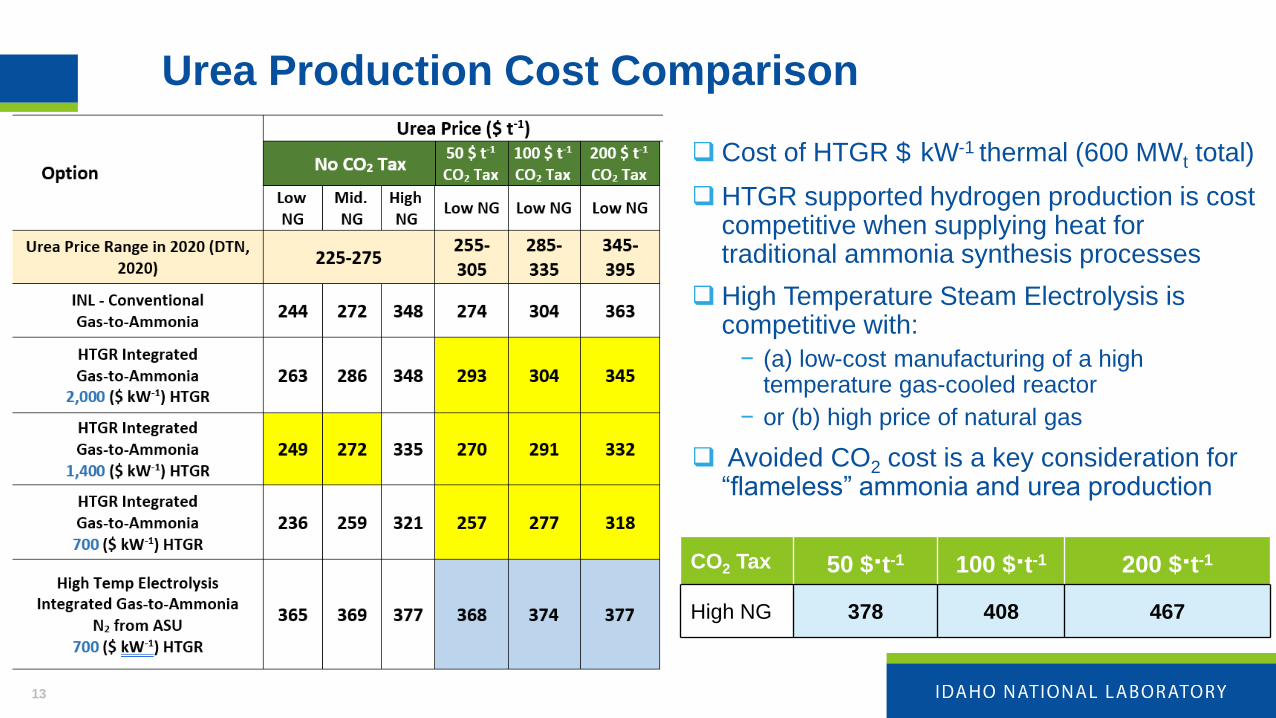
Urea Production Cost Comparison
❑ Cost of HTGR $ kW-1 thermal (600 MWt total)
❑ HTGR supported hydrogen production is cost competitive when supplying heat for traditional ammonia synthesis processes
❑ High Temperature Steam Electrolysis is competitive with:
− (a) low-cost manufacturing of a high temperature gas-cooled reactor
− or (b) high price of natural gas
❑ Avoided CO2 cost is a key consideration for “flameless” ammonia and urea production
13
CO2 Tax 50 $∙t-1 100 $∙t-1 200 $∙t-1
High NG 378 408 467

Mini Ammonia Plant Design
Objective of Research
❑ Evaluate a novel configuration for small-scale production of ammonia using low temperature electrolysis
❑ Local ammonia production
❑ Use locally sourced heat and electricity (i.e. small nuclear reactor)
❑ Eliminate the need for storage of large amounts of ammonia (ammonia on demand)
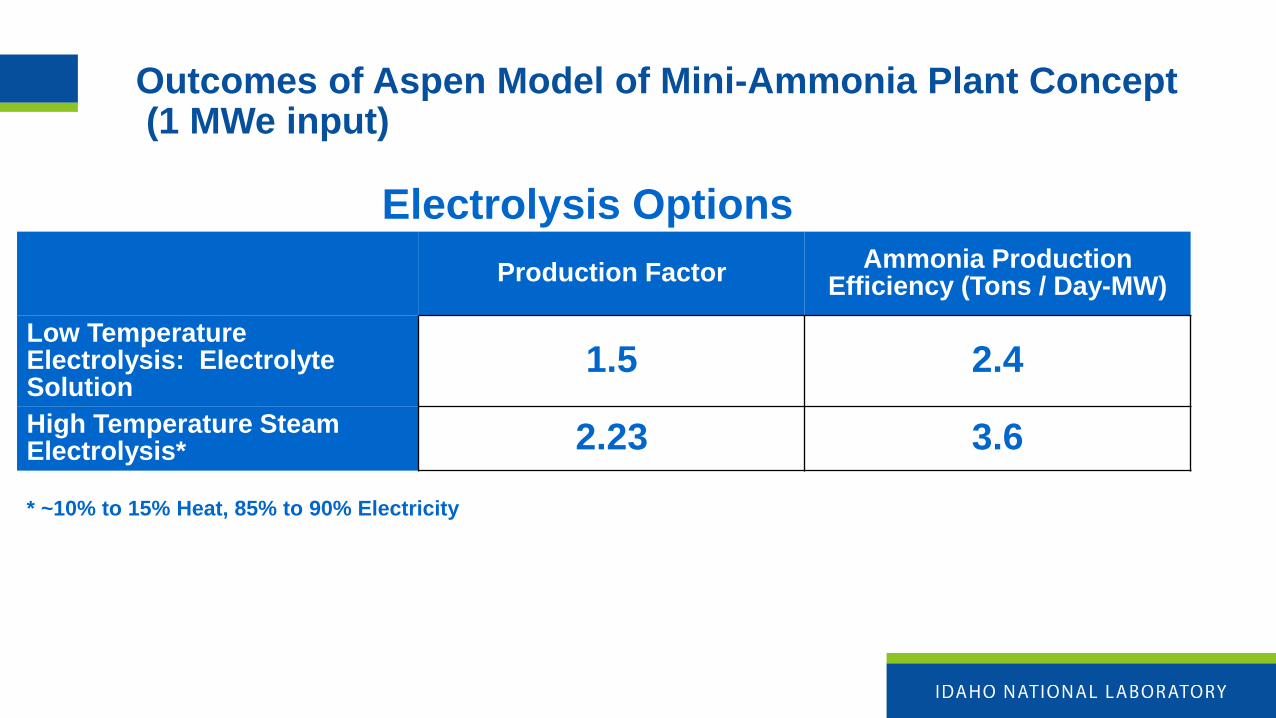
Electrolysis Options
Production FactorAmmonia Production
Efficiency (Tons / Day-MW)
Low Temperature Electrolysis: Electrolyte Solution
1.5 2.4
High Temperature Steam Electrolysis* 2.23 3.6
* ~10% to 15% Heat, 85% to 90% Electricity
Outcomes of Aspen Model of Mini-Ammonia Plant Concept(1 MWe input)
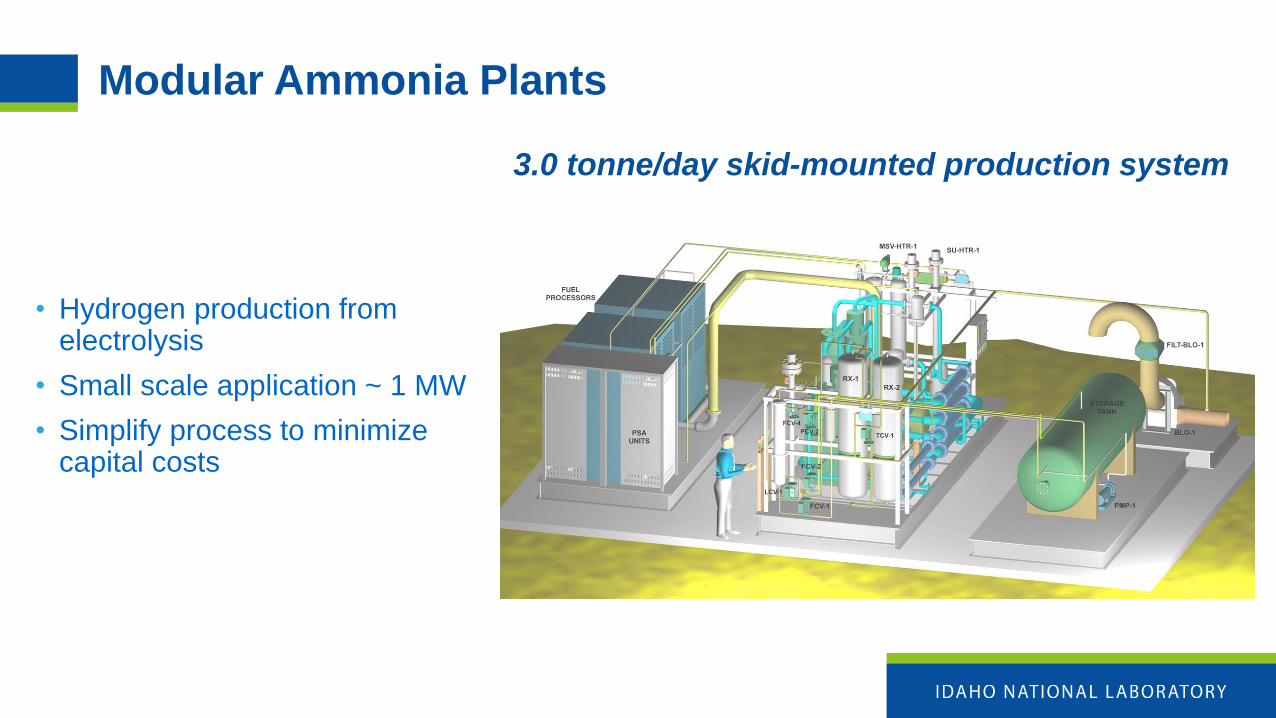
Modular Ammonia Plants
3.0 tonne/day skid-mounted production system
• Hydrogen production from electrolysis
• Small scale application ~ 1 MW
• Simplify process to minimize capital costs

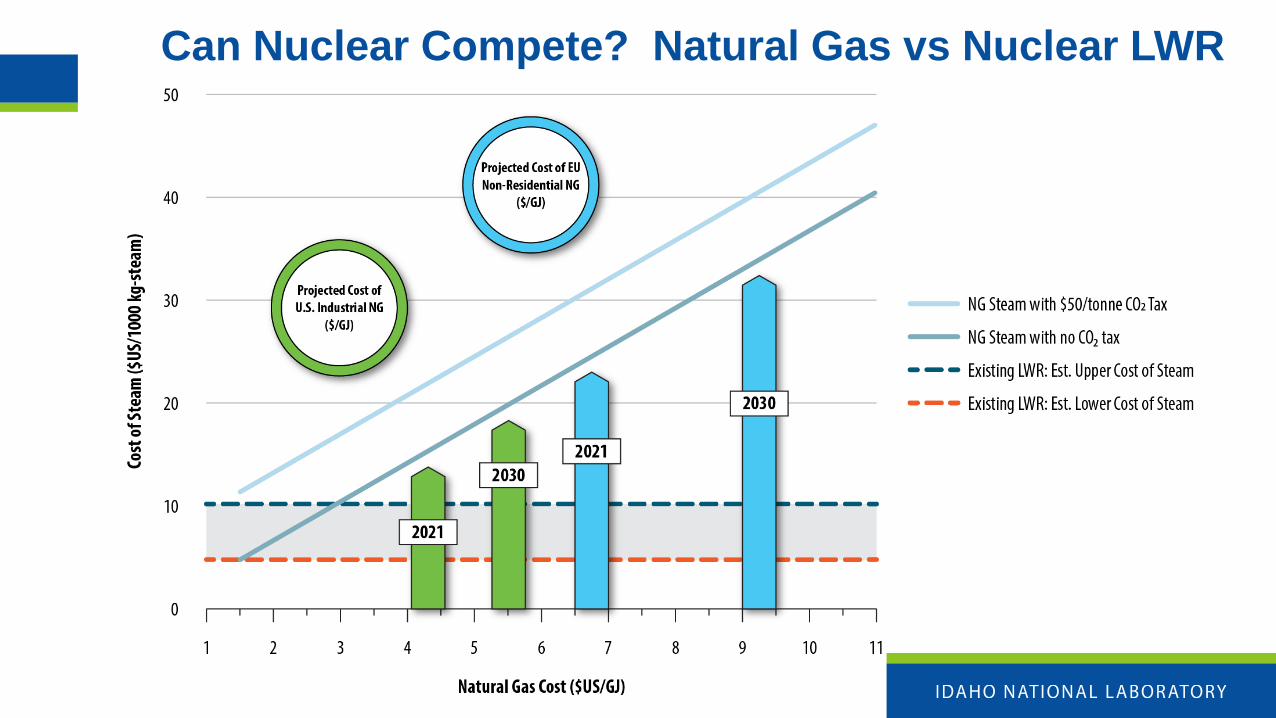
Can Nuclear Compete? Natural Gas vs Nuclear LWR
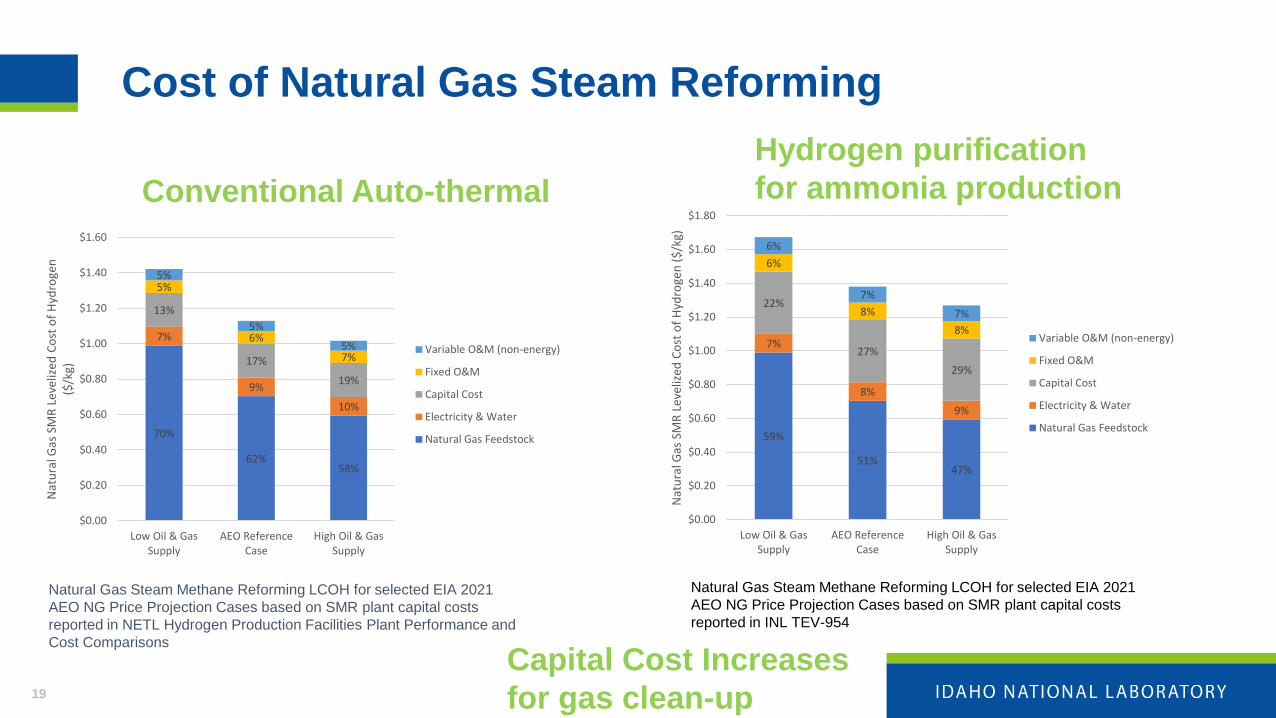
Cost of Natural Gas Steam Reforming
19
59%
51%47%
7%
8%
9%
22%
27%
29%
6%
8%
8%
6%
7%
7%
$0.00
$0.20
$0.40
$0.60
$0.80
$1.00
$1.20
$1.40
$1.60
$1.80
Low Oil & GasSupply
AEO ReferenceCase
High Oil & GasSupply
Nat
ura
l Gas
SM
R L
evel
ized
Co
st o
f H
ydro
gen
($
/kg)
Variable O&M (non-energy)
Fixed O&M
Capital Cost
Electricity & Water
Natural Gas Feedstock70%
62%58%
7%
9%
10%
13%
17%
19%
5%
6%
7%
5%
5%
5%
$0.00
$0.20
$0.40
$0.60
$0.80
$1.00
$1.20
$1.40
$1.60
Low Oil & GasSupply
AEO ReferenceCase
High Oil & GasSupply
Nat
ura
l Gas
SM
R L
evel
ized
Co
st o
f H
ydro
gen
($
/kg)
Variable O&M (non-energy)
Fixed O&M
Capital Cost
Electricity & Water
Natural Gas Feedstock
Natural Gas Steam Methane Reforming LCOH for selected EIA 2021
AEO NG Price Projection Cases based on SMR plant capital costs
reported in NETL Hydrogen Production Facilities Plant Performance and
Cost Comparisons
Natural Gas Steam Methane Reforming LCOH for selected EIA 2021
AEO NG Price Projection Cases based on SMR plant capital costs
reported in INL TEV-954
Conventional Auto-thermal
Hydrogen purification
for ammonia production
Capital Cost Increases
for gas clean-up
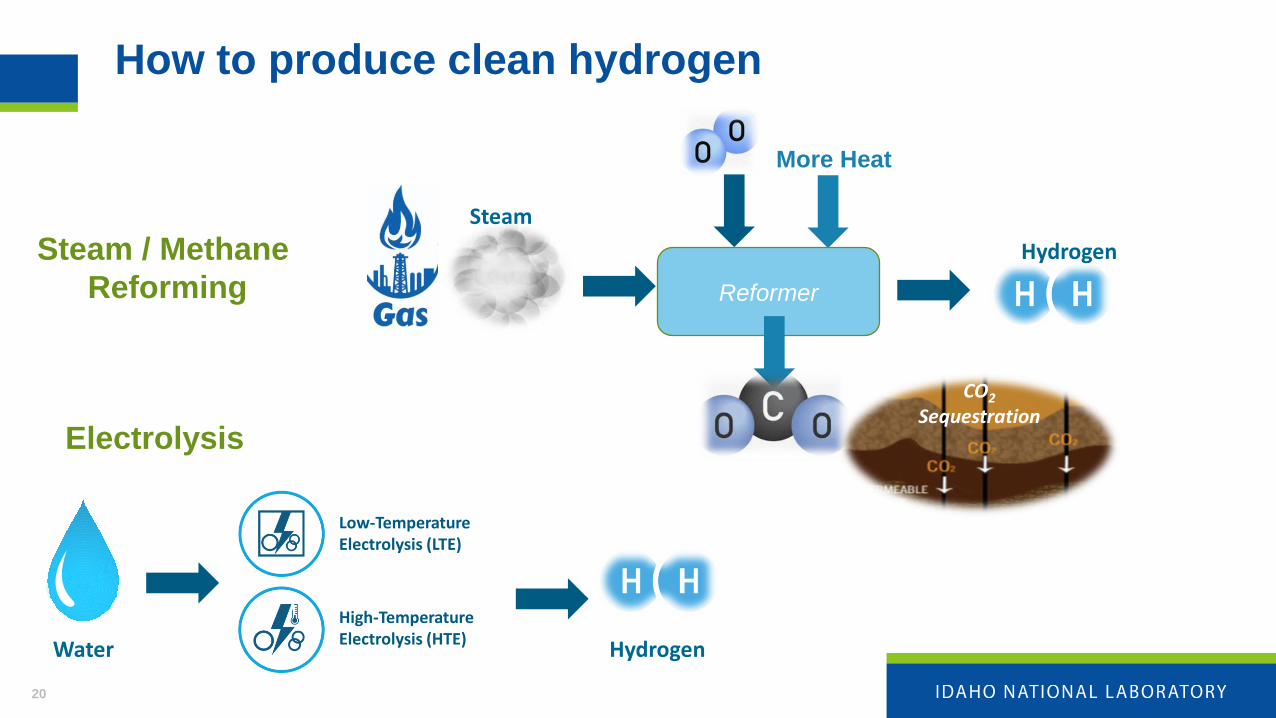
How to produce clean hydrogen
20
Low-TemperatureElectrolysis (LTE)
High-TemperatureElectrolysis (HTE)
Water Hydrogen
Steam
More Heat
Reformer
Hydrogen
CO2
Sequestration
Steam / Methane
Reforming
Electrolysis
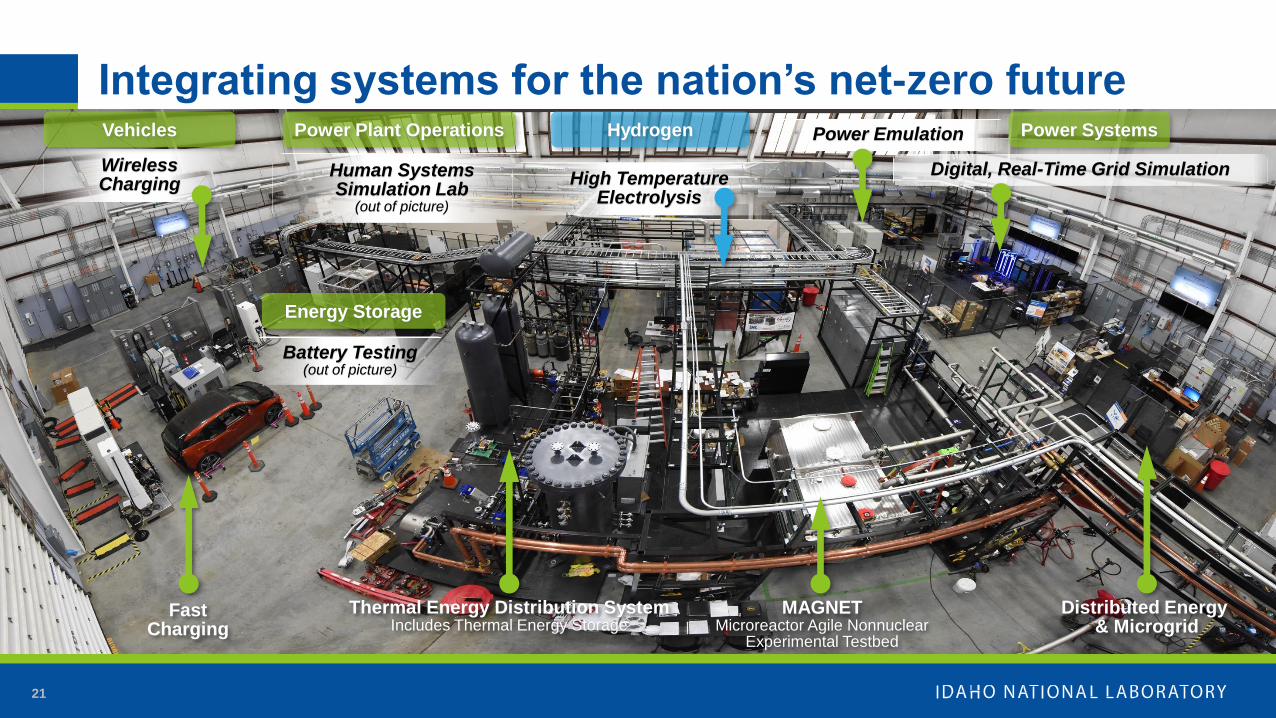
21
Battery Testing(out of picture)
WirelessCharging High Temperature
Electrolysis
FastCharging
Thermal Energy Distribution SystemIncludes Thermal Energy Storage
Distributed Energy & Microgrid
MAGNETMicroreactor Agile Nonnuclear
Experimental Testbed
Human Systems Simulation Lab
(out of picture)
Digital, Real-Time Grid Simulation
Power Emulation
Energy Storage
Vehicles HydrogenPower Plant Operations Power Systems
Integrating systems for the nation’s net-zero future

Switching between electricity and hydrogen markets
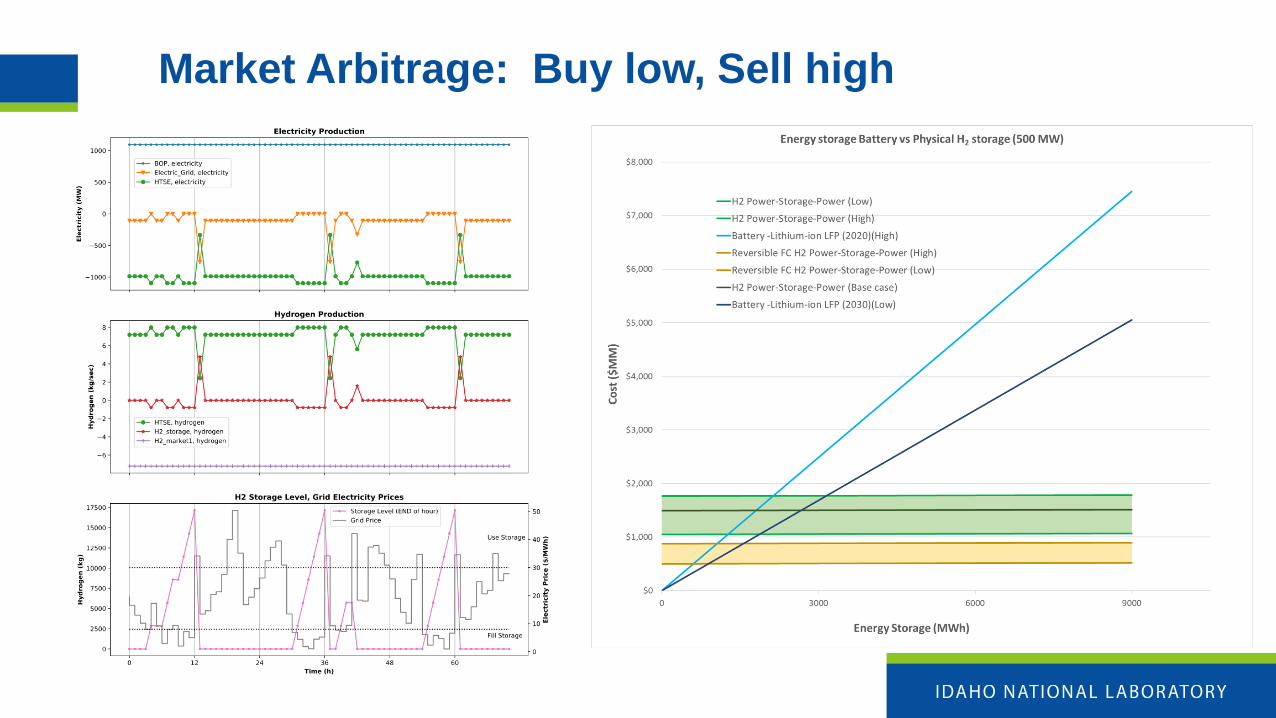
Market Arbitrage: Buy low, Sell high

Cost of producing hydrogen with conventional steam/methane reforming
Business Sensitive25
0
1
2
3
4
5
6
7
8
2020 2025 2030 2035 2040 2045 2050
Industr
ial N
atu
ral G
as D
eliv
ere
d P
rice
(2020 $
/MM
Btu
)
Year
Low Oil & Gas Supply
Reference Case
High Oil & Gas Supply
$1.02
$1.13
$1.09
$1.10
$1.11
$1.42
$1.38
$1.18
$1.18
$1.15
$1.13
$0.95 $1.00 $1.05 $1.10 $1.15 $1.20 $1.25 $1.30 $1.35 $1.40 $1.45 $1.50
NG feedstock cost (case)[1 2 3]
SMR Plant CAPEX (case)[1 2]
After-tax Real IRR (%)± 30% [0.07 0.1 0.13]
Plant Design Capacity (tonne/day)± 30% [423 325 228]
Capacity Factor (%)± 6% [0.95 0.9 0.85]
Levelized Cost of Hydrogen ($/kg)