&+$37(5,9 - virginia tech
TRANSCRIPT
&+$37(5�,9
CEHF>EBE=O � FHEF;HJ?;I E<
8B;D:I E< FEBO>O:HENO#7BA7DE7J;I
7D: B?=D?D :;H?L7J?L;I$
Chapter IV: Morphology & properties of PHB and PHBV blends 89
CHAPTER IV
MORPHOLOGY & PROPERTIES OF BLENDS OFPOLYHYDROXY-ALKANOATES
AND LIGNIN DERIVATIVES.
ABSTRACT
Poly-3-hydroxybutyrate (PHB) and poly-3-hydroxybutyrate-co-3-hydroxyvalerate(PHBV) were blended in melt and solution with organosolv lignin (L) and organosolvlignin butyrate (LB). In the presence of lignin component, crystallization was inhibited orretarded for PHB blends revealing polymer-polymer interaction between PHB and lignincomponents. Shifting of glass transition temperatures was observed for PHB/L blendsand the amount of crystallinity was lower for PHB/L as compared to PHB/LB blends,revealing greater interaction between PHB and L as opposed to LB. LB blends alsorevealed some interaction with PHBV and significantly reduced crystallinity in thesamples. Melt processed samples of PHBV/LB had higher crystallinity compared tosolvent cast blends possibly due to reduction in molecular weight owing to degradation.Mechanical properties reflected the morphological characteristics presented by thethermal measurements. All the blends had higher modulus than the native polymers (PHBand PHBV). Improvement in tensile strength and elongation at break was drastic in caseof PHB/L blends.
Chapter IV: Morphology & properties of PHB and PHBV blends 90
INTRODUCTION
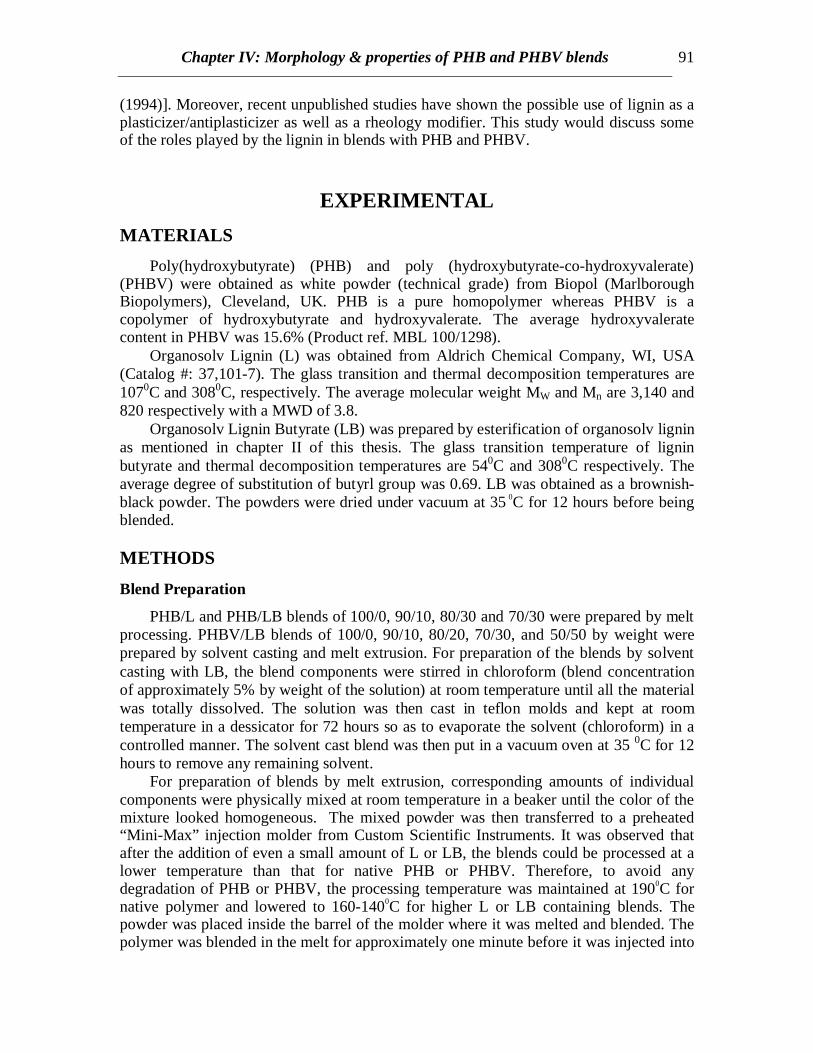
Bacterially produced polyhydroxyalkanoates such as poly-3-hydroxybutyrate(PHB), are potentially very important biodegradable and biocompatible thermoplasticpolymers [Doi (1990)]. PHB is highly crystalline and very brittle which reduces itspossible use as a useful thermoplastic polymer. Copolymerization with hydroxyvalerateby feeding the bacteria with propionic acid, provides a solution to the above problem[Holmes (1988)]. The structure of a typical polyhydroxyalkanoate repeat unit is
Poly-3-hydroxyalkanoate
where, R represents CH3 for beta-hydroxybutyrate, or C2H5 for beta-hydroxyvalerate.Random copolymers can crystallize between two well defined extremes: (1)
complete exclusion of the non-crystallizable comonomer [Flory (1955)], and (2) uniforminclusion of co-units [Sanchez and Eby (1975)]. In case of PHBV, the first extreme caseis not possible since both the co-monomer units readily co-crystallize [Orts et.al. (1991)].Crystallization studies on PHBV copolymers showed similar results as that ofhomopolymer PHB, though the rates of growth and nucleation are significantly lower inthe copolymers due to considerable exclusion of hydroxyvalerate (HV) from the crystals,specially at higher HV content and at high crystallization temperatures [Organ andBarham (1991)].
Due to high cost of producing these polymers, polyhydroxyalkanoates arepresently used only for special medical applications [Holmes (1988)]. However, in orderto use these polymers as commodity plastics, the price has to be sufficiently loweredwithout affecting the useful properties of the original polymer. Blending with otherbiopolymers provides a solution to this problem. Studies on blends of poly-3-hydroxybutyrate-co-3-hydroxyvalerate (PHBV) with cellulose esters such as celluloseacetate butyrate and cellulose acetate propionate revealed single glass transitions up to50% concentration of PHBV and followed the Fox equation for miscible systems [Lottiand Scandola (1992)]. For concentrations of PHBV higher than 50%, crystallization ofPHBV separated the two polymer phases and separate transitions were observed. Similarresults were presented for the blends of the homopolymer PHB by the authors earlier.Incorporating maize starch granules into PHB and PHBV revealed that destructuredstarch produces a greater reinforcing effect than native starch granules with increase inmodulus [Koller and Owen (1996)]. Also crystallinity in PHBV was increased withincorporation of starch without affecting nucleation.
The present study is based on modifying the properties of PHB and PHBV byblending with lignin and lignin derivatives. Lignin is a small molecule and acts as areinforcement for many other polymers such as poly(methyl methacrylate) [Ciemnieckiand Glasser (1988)]. Moreover, it is biodegradable and so can suitably be blended withPHB and PHBV without losing their biodegradable properties. Lignin has been found toact as a nucleating agent for other crystalline polymer systems [Willer and Glasser
2 2
25 Q
Chapter IV: Morphology & properties of PHB and PHBV blends 91
(1994)]. Moreover, recent unpublished studies have shown the possible use of lignin as aplasticizer/antiplasticizer as well as a rheology modifier. This study would discuss someof the roles played by the lignin in blends with PHB and PHBV.
EXPERIMENTAL
MATERIALS
Poly(hydroxybutyrate) (PHB) and poly (hydroxybutyrate-co-hydroxyvalerate)(PHBV) were obtained as white powder (technical grade) from Biopol (MarlboroughBiopolymers), Cleveland, UK. PHB is a pure homopolymer whereas PHBV is acopolymer of hydroxybutyrate and hydroxyvalerate. The average hydroxyvaleratecontent in PHBV was 15.6% (Product ref. MBL 100/1298).
Organosolv Lignin (L) was obtained from Aldrich Chemical Company, WI, USA(Catalog #: 37,101-7). The glass transition and thermal decomposition temperatures are1070C and 3080C, respectively. The average molecular weight MW and Mn are 3,140 and820 respectively with a MWD of 3.8.
Organosolv Lignin Butyrate (LB) was prepared by esterification of organosolv ligninas mentioned in chapter II of this thesis. The glass transition temperature of ligninbutyrate and thermal decomposition temperatures are 540C and 3080C respectively. Theaverage degree of substitution of butyrl group was 0.69. LB was obtained as a brownish-black powder. The powders were dried under vacuum at 35 0C for 12 hours before beingblended.
METHODS
Blend Preparation
PHB/L and PHB/LB blends of 100/0, 90/10, 80/30 and 70/30 were prepared by meltprocessing. PHBV/LB blends of 100/0, 90/10, 80/20, 70/30, and 50/50 by weight wereprepared by solvent casting and melt extrusion. For preparation of the blends by solventcasting with LB, the blend components were stirred in chloroform (blend concentrationof approximately 5% by weight of the solution) at room temperature until all the materialwas totally dissolved. The solution was then cast in teflon molds and kept at roomtemperature in a dessicator for 72 hours so as to evaporate the solvent (chloroform) in acontrolled manner. The solvent cast blend was then put in a vacuum oven at 35 0C for 12hours to remove any remaining solvent.
For preparation of blends by melt extrusion, corresponding amounts of individualcomponents were physically mixed at room temperature in a beaker until the color of themixture looked homogeneous. The mixed powder was then transferred to a preheated“Mini-Max” injection molder from Custom Scientific Instruments. It was observed thatafter the addition of even a small amount of L or LB, the blends could be processed at alower temperature than that for native PHB or PHBV. Therefore, to avoid anydegradation of PHB or PHBV, the processing temperature was maintained at 1900C fornative polymer and lowered to 160-1400C for higher L or LB containing blends. Thepowder was placed inside the barrel of the molder where it was melted and blended. Thepolymer was blended in the melt for approximately one minute before it was injected into
Chapter IV: Morphology & properties of PHB and PHBV blends 92
the mold. The mold cavity was heated through conduction from the fixture and thepolymer melt during the injection process and so can be considered as a preheated mold.The cooling rate was not controlled after injection. Consequently, the specimens shouldbe considered to have been quenched.
Two types of specimens were molded: rectangular DMTA specimens and dog boneMinimat specimens. Rectangular specimens had dimensions of 38 mm x 12.6 mm x 1.6mm. Dog bone specimens, had a nominal length of 38 mm long with a gage sectionmeasuring 10 mm x 2.7 mm x 3.0 mm.
Differential Scanning Calorimetry (DSC)
The thermal analysis of the samples was determined on a Perkin-Elmer Model DSC-4 equipped with a Thermal Analysis Data Station (TADS) using standard aluminum pans.The temperature was scanned from –40 to 1800C at scanning rates of 2.5 and 100C/min.Nitrogen was used as a sweeping gas. The instrument was calibrated with an indiumstandard. The glass transition temperature and the heat of fusion were reported from thesecond heating scan, unless otherwise indicated. The glass transition temperature (Tg) wastaken as the temperature at the midpoint (1/2 ∆Cp.) of the transition. The meltingtemperature (Tm) is reported as the peak value of the melting endotherms. Thecrystallization temperatures were reported from the first cooling scans from melt.
Dynamic Mechanical Thermal Analysis (DMTA)
The dynamic mechanical properties of the blend samples were determined in adynamic mechanical thermal analyzer (DMTA) by Polymer Laboratories Ltd.;Shropshire, England. The samples were loaded horizontally in DMTA standard mediumsize clamps. Measurements were performed in the single cantilever bending mode. Thespectra were collected from –200C to 1500C at a heating rate of 40C/min at a frequency of1.0 Hz. The final temperature of scan varied from sample to sample depending on theonset of melting where the value of tan δ was above limits and the DMTA was out ofbalance.
Mechanical Properties
The mechanical properties (modulus, strength and ultimate strain) of the blends weredetermined on a Miniature Materials Tester (Minimat model # SM9-06) by PolymerLaboratories Ltd., Loughborough, England. Tests were conducted at room temperaturewith a 1000 N load cell using a strain rate of 0.25 mm/min. The calculation of modulusand strength was based on the initial cross sectional area. The data reported represent theaverage of five measurements for each blend composition.
Transmission Electron Microscopy (TEM)
Samples of 20%LB/PHBV were embedded in Poly/Bed 812 (Polysciences, Inc.)cured at 60 0C for 48 hours in flat molds. 80-100 nm thick sections were cut from theembedded films with a diamond knife mounted on a Reichert Ultracut E microtome. Thesections were carefully mounted on copper grids. The grids were observed on a JEOLJEM-100CX-II electron microscope operated at an accelerating voltage of 80 kV. The
Chapter IV: Morphology & properties of PHB and PHBV blends 93
micrographs were from the bright field images of the cut unstained samples atmagnifications of 4,800x and 10,000x.
RESULTS AND DISCUSSION
PHB BLENDS
• DSC Results
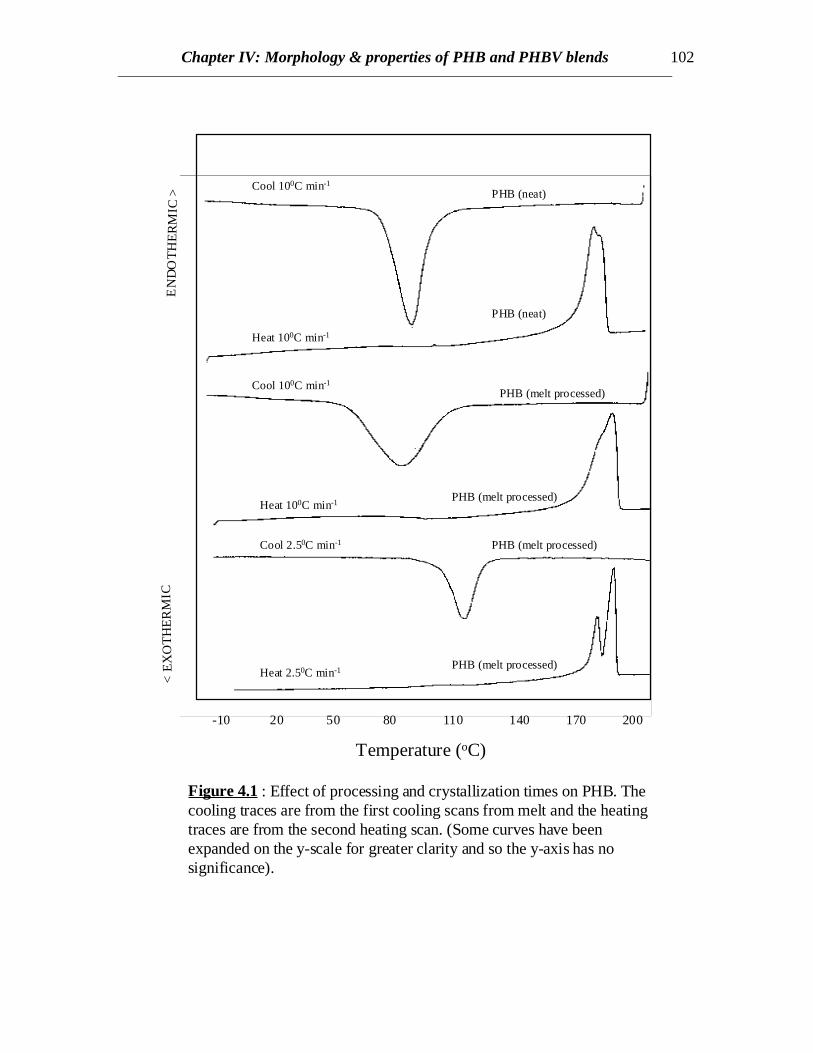
DSC scans of the native PHB showed a sharp exothermic peak at 81.50C and anendotherm at 1730C corresponding to the crystallization and melting respectively of thehomopolymer (Fig. 4.1 and Table 4.1). The value of the melting peak of 1730C is lowerthan the published value of 195 ± 5 0C [Barham et.al. (1984)] probably due to differencesin the molecular weights as well as the heating rate resulting in shorter crystallizationtimes. However, the DSC scans of melt processed PHB revealed a broader crystallizationpeak occurring at 780C (lower than that for native PHB) (Fig.4.1). This is possibly due tothe reduction in the molecular weight owing to degradation of PHB while meltprocessing as also reported by Edie and Marand [Edie and Marand (1991)]. But meltprocessed PHB has ∆Hc or ∆Hm values greater than native PHB (Table 4.1). This mightbe due to the dependence of crystallization kinetics with molecular weight. However,when the melt processed PHB is scanned at a slower rate (2.50C), crystallization occurs ata higher temperature (1050C) as expected, due to longer crystallization times (Fig.4.1).When the PHB sample was quenched from melt, a sharp second order transition relatedto the glass transition of PHB was observed at around 00C in the subsequent heating scan.
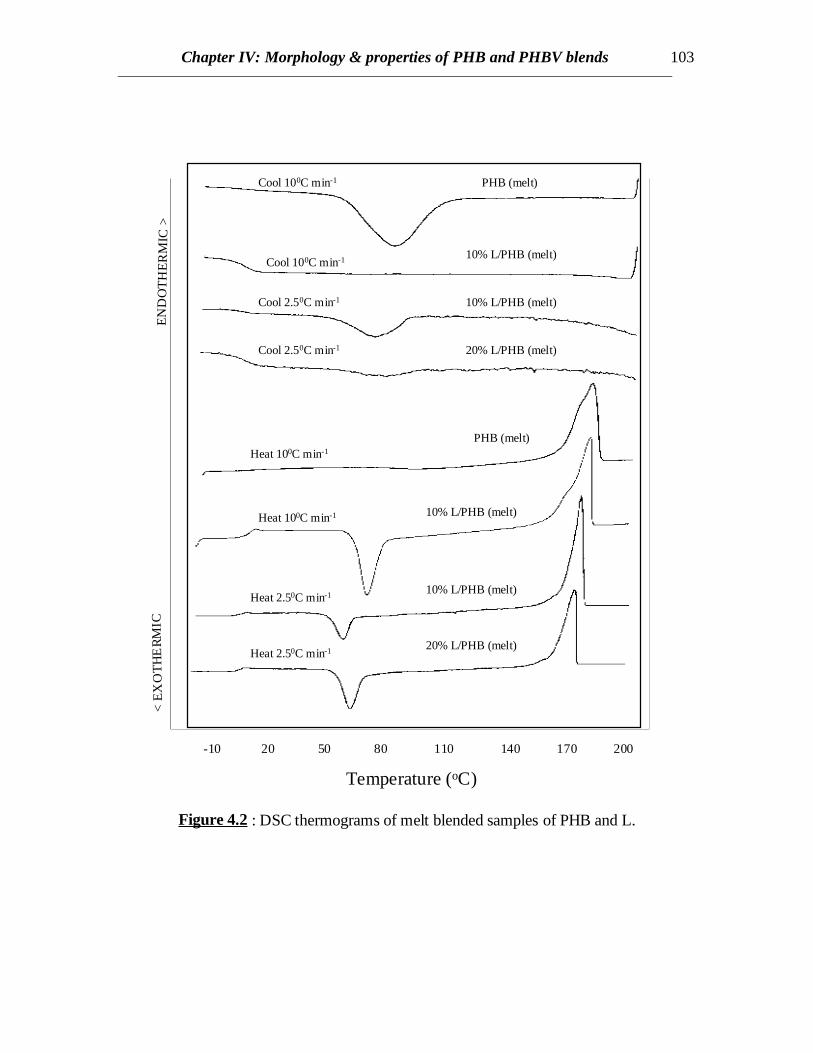
When L or LB was added to PHB, crystallization was retarded due to the presenceof the lignin component. The DSC curves for PHB/L blends are shown in Fig.4.2. At acooling rate of 100C/min, no crystallization was observed for any of the PHB/L blends.Cooling at a slower rate (2.50C/min) revealed some crystallization of 10%L/PHB blenddue to longer crystallization times. However, addition of 20% L to PHB further retardedcrystallization at a cooling rate of 2.50C/min (Fig.4.2). Therefore, the crystallinity in PHBis lower when higher amount of L is present possibly due to the dilution effect. Thisreveals interaction between PHB and L or LB (data not shown). This is a good sign fromthe fact that most of the undesirable properties of PHB such as brittleness results from thehigh crystallinity and cracks formed in spherulites [Barham and Keller (1986)].
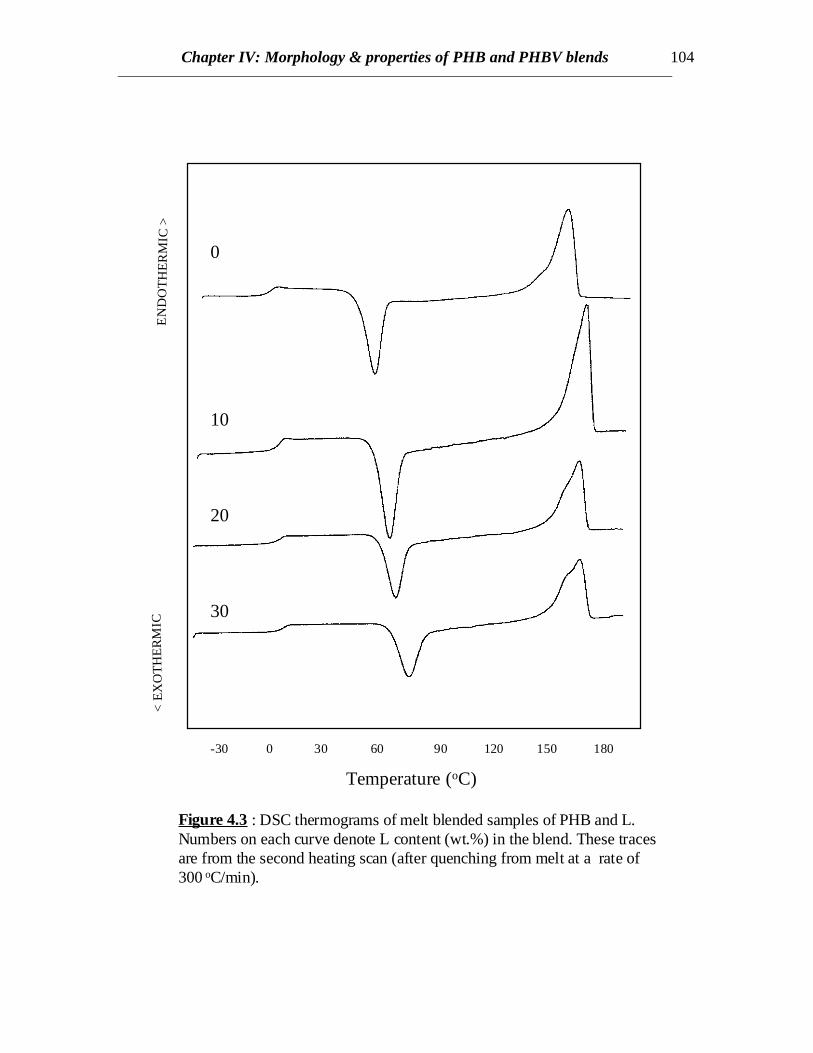
However, cold crystallization was observed for all the blends during thesubsequent heating cycle at a scanning rate of 100C/min followed by melting (Fig.4.2).DSC curves from the second heating scans for blends of PHB and L revealed coldcrystallization and melting (Fig. 4.3). The first curve with no lignin in Fig.4.3 representsthe heating scan of PHB quenched from melt in order to observe the Tg of PHB. Glasstransitions are very prominent in case of all blend compositions. The glass transitions ofthe blends show an increasing trend and the values are about 7 to 110C higher than purePHB (Table 4.1). This reflects the effect of molecular interaction between PHB and L onthe Tg of PHB. The glass transition of L was reported earlier (in chapter II) as 1070C. Tg’scorresponding to the L component is not pronounced compared to those from the PHBphase, however, faint transitions are observed near 1000C for the blends corresponding toL component. The Tm’s do not vary significantly with the L content in blend, though cold
Chapter IV: Morphology & properties of PHB and PHBV blends 94
crystallization temperatures increase (Table 4.1). Therefore, it can be understood thatthere exists some polymer-polymer interaction between L and PHB. Also, lignin acts asan anti-plasticizer for PHB.
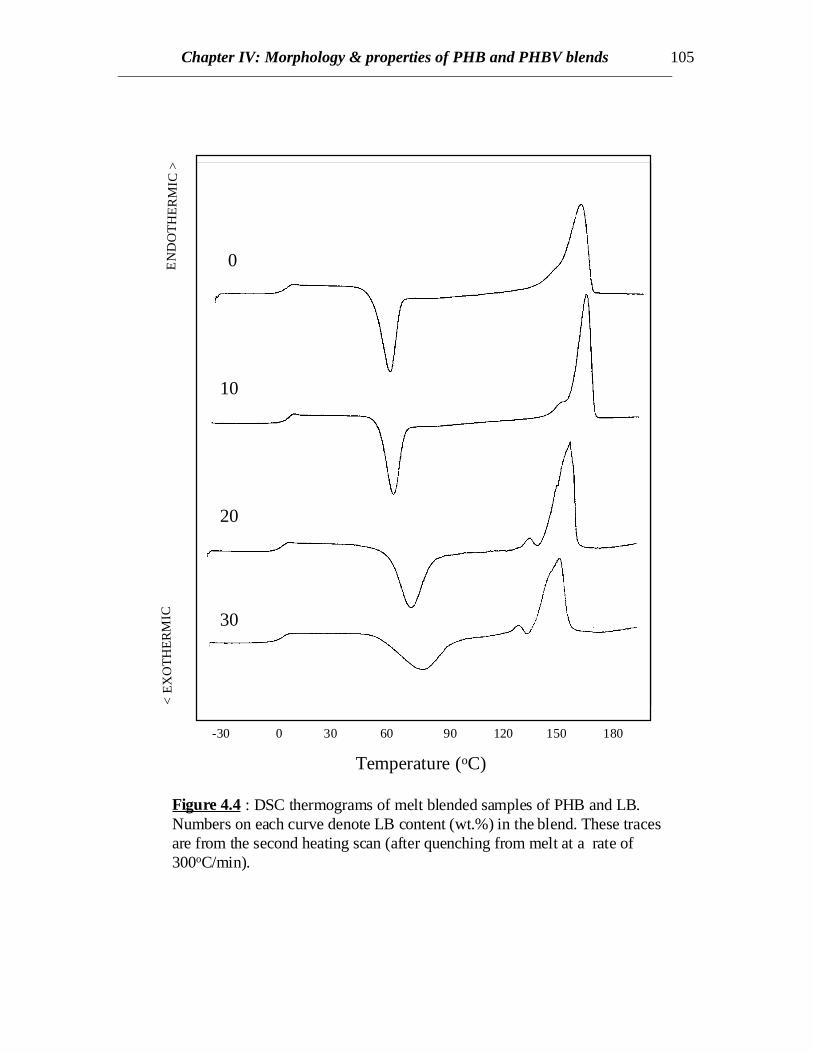
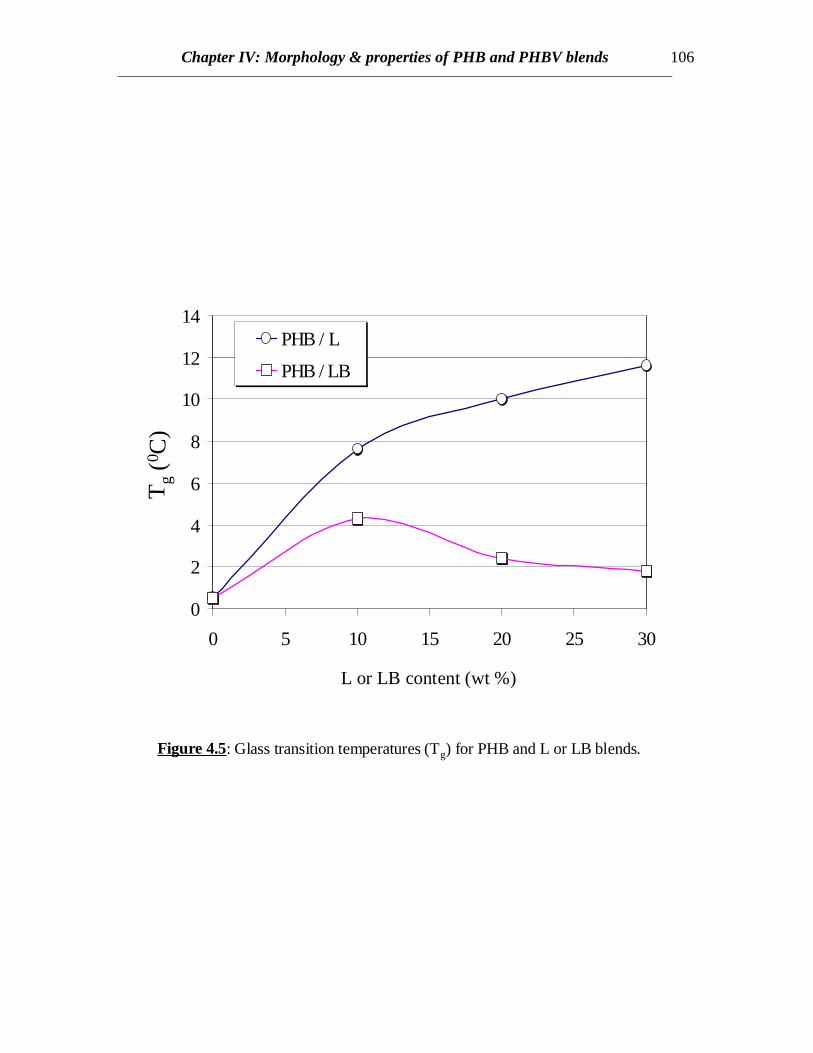
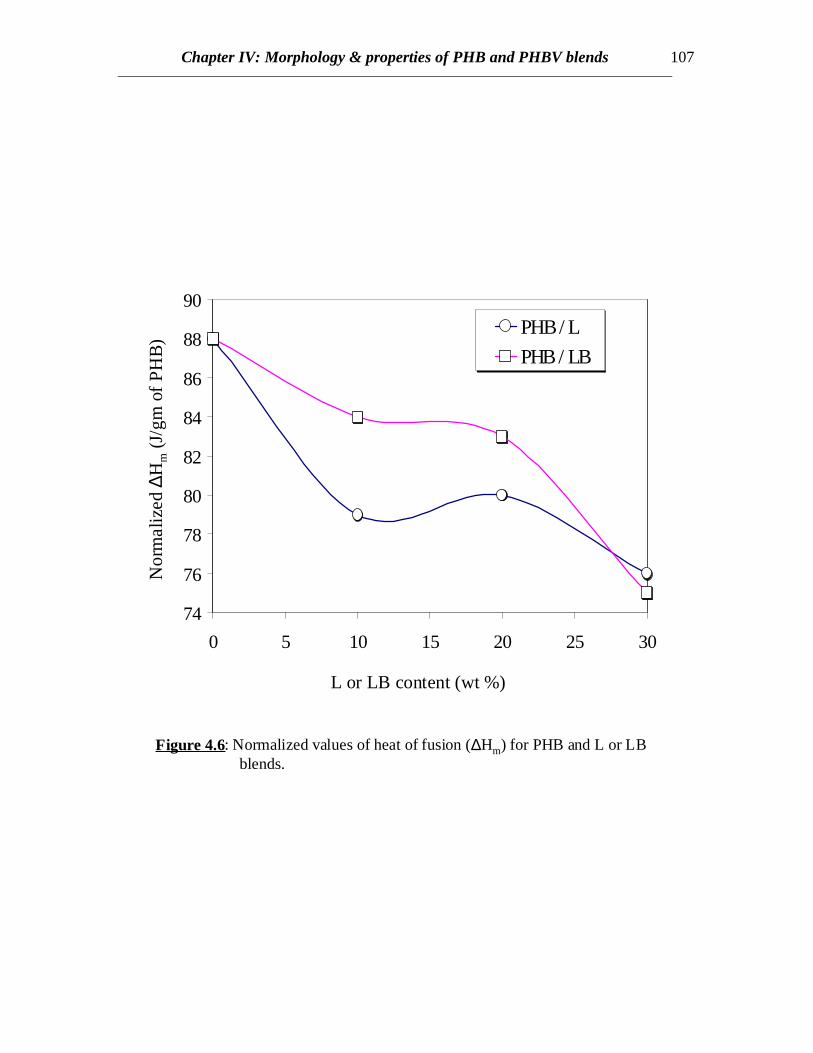
In case of PHB/LB blends, the glass transition of LB has been eclipsed by theexothermic crystallization peak of PHB in the temperature range of 45 to 900C in allcases. Annealing the samples by very slow cooling was attempted in order to observe theglass transition of LB by minimizing the exothermic crystallization peak. In all the casesof slow cooling, some amount of cold crystallization was observed in the consecutiveheating scans and the glass transition corresponding to LB was not observed (Fig.4.4). Inall the cases, sharp second order transitions near the glass transition of PHB wereobserved. The Tc values for PHB/LB blends shift towards higher temperatures and thecrystallization peaks become broader with increasing amount of LB (Fig.4.4). No specificconclusions can be made at this stage without further investigations of the crystal latticestructure, dimensions and crystallization kinetics. Also there is not much or no elevationin the Tg values for PHB/LB as compared to PHB/L blends (Fig.4.5). Moreover, thenormalized ∆Hm values for PHB/LB are higher than those for PHB/L blends (Fig.4.6).This might be an indication of greater interaction between PHB and L as compared toPHB and LB. On the other hand, the Tm values for PHB/LB blends are observed to shifttowards lower temperatures (Table 4.1). This reveals that the crystallization process isretarded. Also, an emergence of a side peak is observed and this peak becomes prominentat higher LB concentrations (Fig.4.4). This might be attributed to the lamellar thickeningthat occurs while crystallization. The normalized ∆Hm values for the blend compositionsof up to 20% LB are equal to that of pure PHB. This reveals that the PHB component inthe crystalline phase of the blend can retain its original degree of crystallinity even whenLB is added. At 30% LB concentration, possibly the amount of LB is high enough tohinder the growth of crystals due to dilution effect and therefore, the value of ∆Hm
decreases.
• DMTA Results
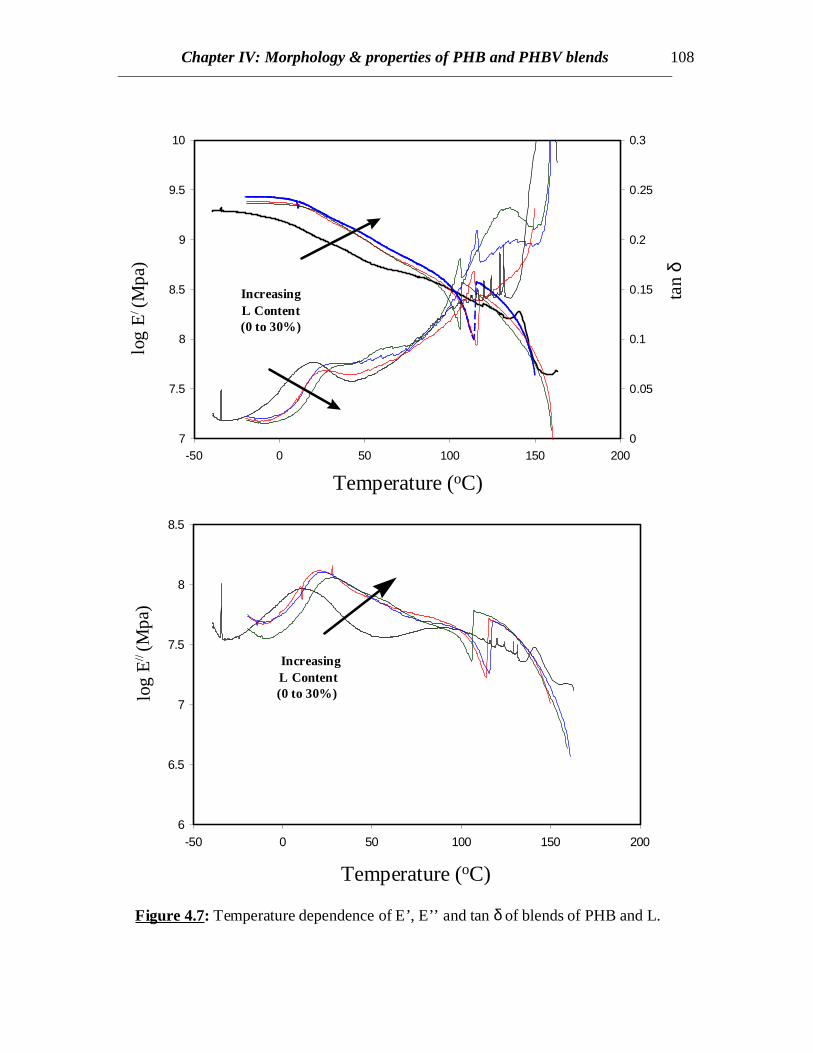
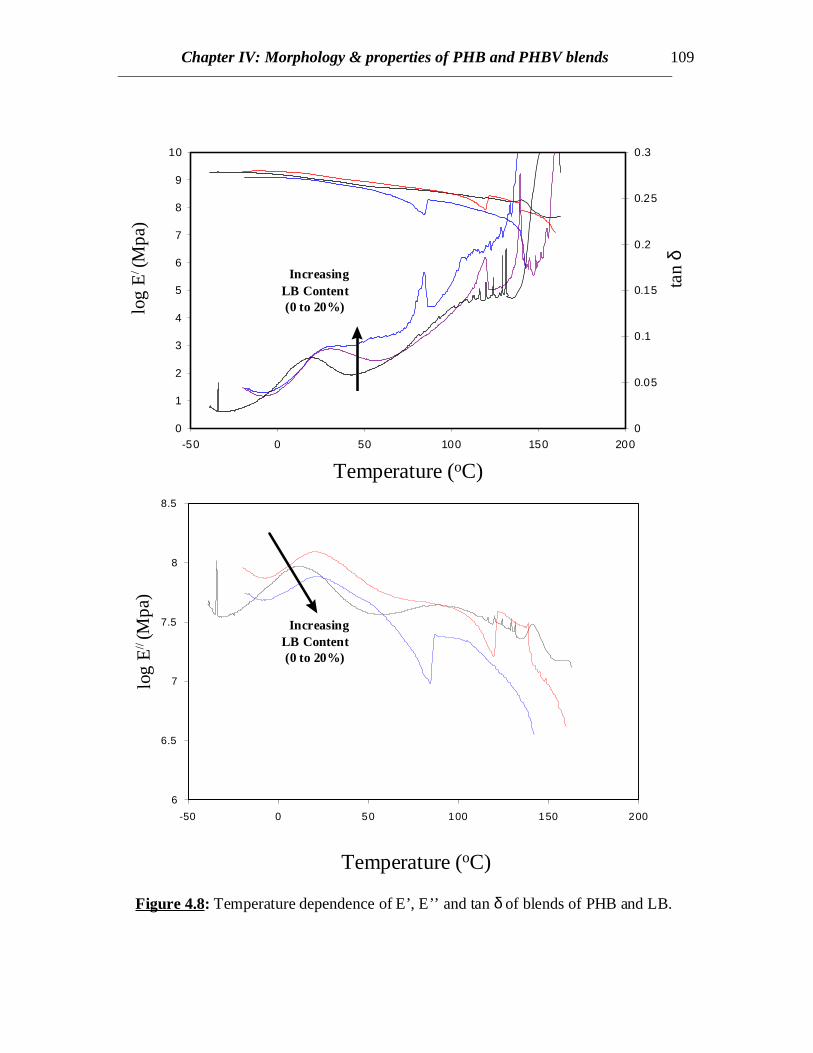
Dynamic mechanical thermal analysis results reveal clear indications of the shiftsin the glass transitions of PHB towards higher temperatures when L or LB is present (Fig.4.7 and 4.8). In both the blends of PHB with L and LB, the tan δ curves as well as E’’curves representing the glass transition behavior of PHB component in blend shifttowards higher temperatures whereas no clear separate peaks showing the glasstransitions of L and LB are observed. This might be due to the fact that the lignincomponents are entrapped within the spherulitic structures of PHB and so the glasstransitions arising from the lignin component are suppressed. The transitions associatedwith L and LB might have been prominent if the L and LB had been present in muchgreater concentrations. This predicts interaction between PHB and L or LB revealingsome interaction between the two components.
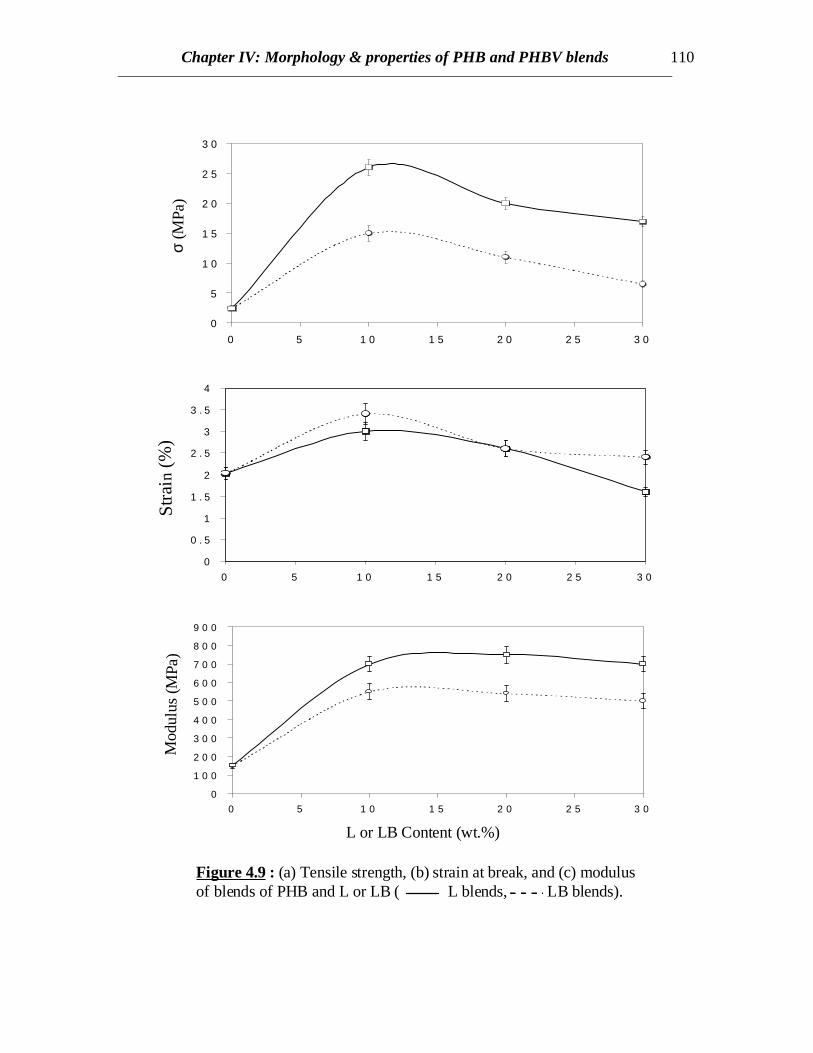
• Mechanical Properties
Chapter IV: Morphology & properties of PHB and PHBV blends 95
When the polymer pairs exist in two phases, the mechanical properties of theblend material are governed by the distribution of the properties of the respectivepolymers within the blend. In other words, the properties are related to mainly the highervolume polymer phase, which usually forms the continuous matrix, while the secondaryphase plays the role of reinforcing the matrix by adequate stress transfer betweeninterphases. Lignin is a small molecule and acts as reinforcing filler when it is in glassystate, i.e. below its Tg. This effect has been detected earlier in case of blends ofhydroxypropyl lignin and poly(methyl methacrylate) [Ciemniecki and Glasser (1988)].The mechanical properties indicate improvement in tensile strength, strain at break andmodulus when LB or L are incorporated (Fig.4.9). The increase in modulus is expectedbecause LB and L both act as reinforcing filler as explained earlier (Fig.4.9c). Butmodulus decrease is also expected since the amount of crystallinity decreases in PHB.These are two competing effects and from the results it is found that the effect ofcrystallinity is less pronounced than the reinforcing effect of L and LB. Also themolecular weight of L being much lower than LB, probably the sizes of the L moleculesare smaller than those for LB. Therefore, the reinforcing effect of smaller particles isexpected to be higher than that of larger particles. This is valid since the modulusincrease in case of L is much greater than that for LB.
The tensile strength depends largely on the ease of stress transfer between thephases present in the blend, greater stress transfer leading to higher strength. In all blendsof lignin with other polymers such as poly(methyl methacrylate), modulus increase hasbeen observed with decrease in tensile strength [Ciemniecki and Glasser (1988)]. Sincelignin is a glassy material, it is not expected to increase tensile strength of the blends. Butin case of blends with PHB, an increase in tensile strength is also observed. This might beattributed to the decrease in the crystallinity in PHB with incorporation of L or LB. Moreof PHB is present as amorphous material than that in crystalline phase in the blends andso adequate stress transfer is more probable between two amorphous phases than betweencrystalline and amorphous phases. Also this might be a possible explanation since theamount of increase in tensile strength of L blends is much more than that of LB blends(Fig.4.9a), since the amount of crystallinity in PHB/L blends is lower compared toPHB/LB blends at similar blend compositions (Table 4.1). Another reason of higherstrength in case of L blends might be due to better interaction between PHB and L asevidenced from the DSC results already discussed earlier and therefore, better stresstransfer between phases is possible. The PHB/LB blend samples were more brittle ascompared to PHB/L blends and powdered material was obtained when a PHB/LB samplewas cut with a sharp edge. Whereas, chunks of thin slices were obtained when a PHB/Lblend material was cut.
PHB is usually quite brittle and low strains at break are observed in PHB mainlydue to cracks in the spherulites [Barham and Keller (1986)]. These cracks may be eitherradial or circumferential depending on the crystallization temperatures and are formedunder no externally applied stress. When the material is strained, the cracks propagateand join together leading to a brittle failure. So brittleness can be decreased either byhealing of the cracks (usually by cold rolling process) or by decreasing the amount ofcrystallinity. In the latter case, the amorphous portion can elongate to certain extent morecompared to crystalline regions and distribute the stress without concentrating at aparticular area. This diminishes the propagation of cracks. Therefore, the elongation at
Chapter IV: Morphology & properties of PHB and PHBV blends 96
break also increases to certain extent if crystallinity is reduced. This is observed in thePHB blends where the ultimate strain increases by 50% in case of 10% of L or LBcontent (Fig. 4.9). At this composition, the overall crystallinity is found to decrease bymore than 15% (Table 4.1). Also decrease in normalized ∆Hm in case of L blends is morethan that for LB blends (Fig.4.6) and so correspondingly, increase in strain for L blends isgreater than LB blends. This can also be attributed to higher polymer-polymer interactionbetween L and PHB as explained earlier. At higher L or LB contents, the blend becomesmore brittle due to higher glassy lignin content and so the ultimate strain value declines athigher L or LB contents.
PHBV BLENDS
• DSC Results
DSC scans of native PHBV reveal a sharp glass transition at –2 0C and twoendothermic peaks at around 145 and 160 0C (Fig. 4.10 and Table 4.2) which isconsistent with the earlier published result [Organ and Barham (1991)]. The presence oftwo melting peaks is attributed to the lamellar thickening, which occurs even for highheating scan rates. Also the ratio of the original (lower) melting peak to the highermelting peak depends on various factors such as crystallization temperature as well as thehydroxyvalerate (HV) content in the copolymer. It has been found that for lowercrystallization temperatures, greater thickening occurred and the original peak was barelyrecognized. For higher HV content copolymers, the crystallization kinetics is much morecomplex and five melting peaks were reported [Organ and Barham (1991)].Crystallization was observed during the cooling scan when the sample was cooled frommelt at a slow rate of 10 0C/min (Not shown). Native PHBV crystallized while coolingonly for low cooling rates. But hardly any crystallization occurred when the sample wasquenched from melt revealing slower crystallization kinetics for PHBV. In case ofquenched samples, cold crystallization occurred when it was subsequently heated at a rateof 100C/min. The heat of crystalline melting (∆Hf) values for PHBV is lower (36 J/gm) ascompared to 83 J/gm in case of PHB (Table 4.1 and 4.2). The lower crystallinity inPHBV makes it more useful than PHB for applications.
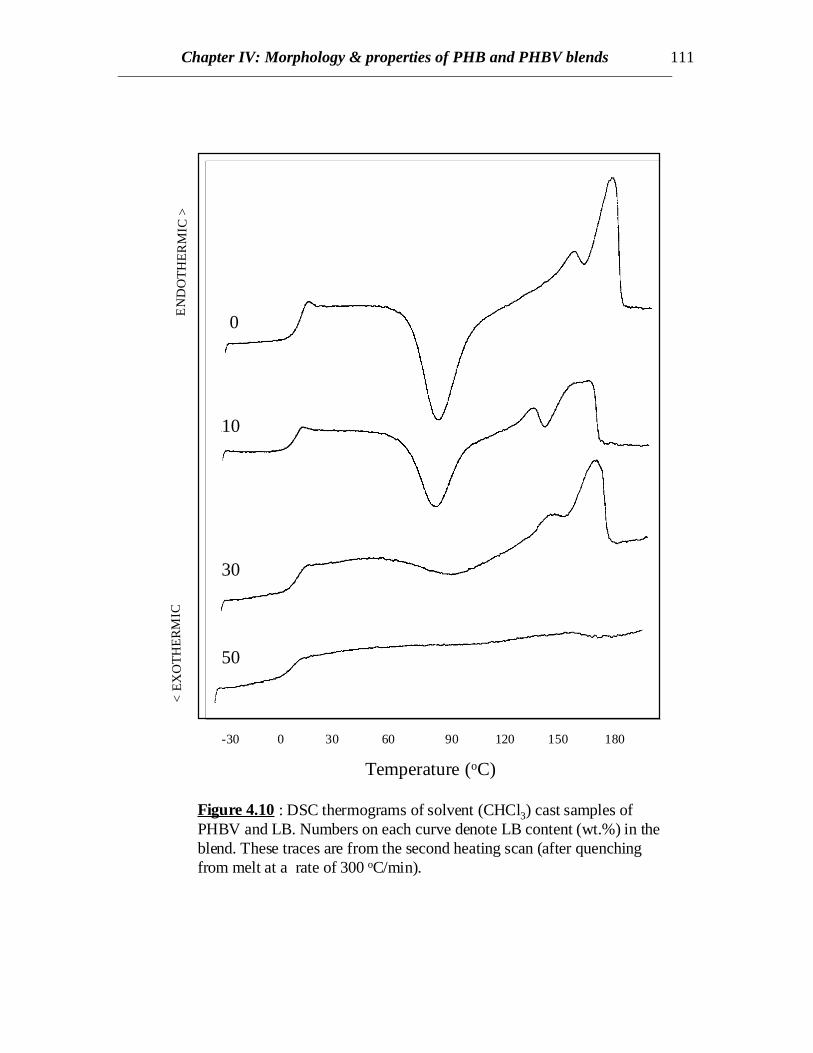
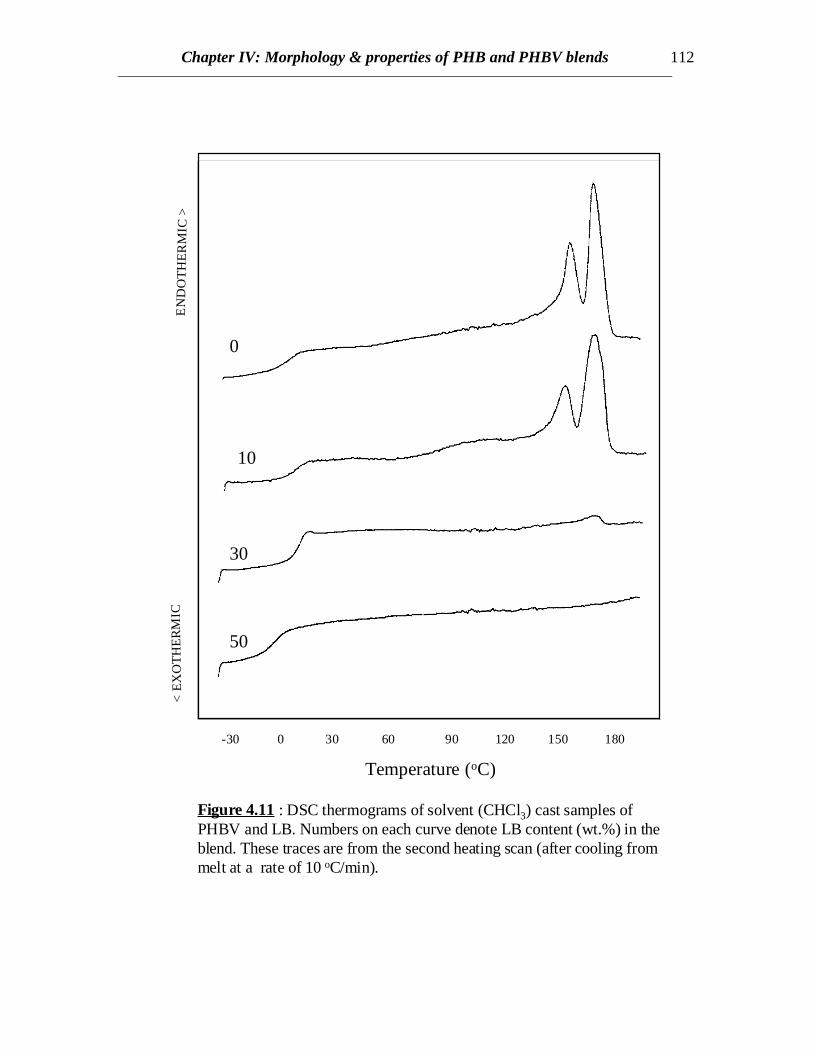
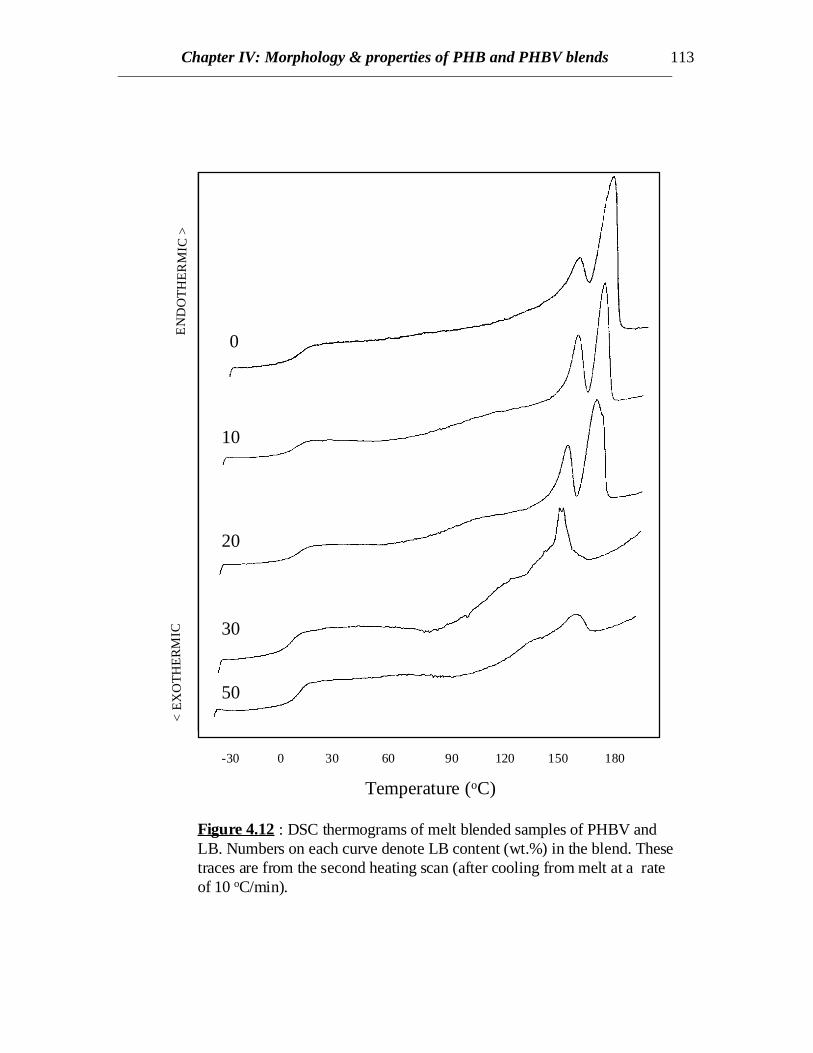
DSC scans of blends of PHBV and LB prepared by solvent casting as well as meltblending show decreasing trends in crystallinity as the LB content increases (Figs 4.10,4.11 and 4.12). For solvent cast samples, at 30% LB content, crystallinity is quitepronounced when the samples are quenched from melt but hardly any crystallinity isobserved if it is cooled slowly (compare Figs. 4.10 and 4.11). This might be attributed tospontaneous orientation of the chains of PHBV occurring at a temperature higher than theglass transition temperature of the copolymer when heated rather than orientation takingplace in molten state while cooling. At higher LB content (50%) no crystallinity isobserved in either cases of solvent cast blends (Figs. 4.10 and 4.11), though somecrystallinity is evident from the blends prepared by melt blending (compare curves at50% LB in Figs. 4.11 and 4.12). Therefore, similar to the results discussed for PHBblends, there exists some interaction between LB and PHBV and hence LB retards thecrystallization of PHBV. In case of melt processed samples, PHBV is degraded to someextent and weight average molecular weight (Mw) decreases. Similar to other semi-
Chapter IV: Morphology & properties of PHB and PHBV blends 97
crystalline polymers, the crystallization process is dependent on the molecular weight ofPHBV and the rate of crystallization peaks at a certain Mw and again decreases for higherMw. Therefore, the rate of crystallization is enhanced at a lower Mw for melt processedPHBV and crystallinity is greater in melt processed than solvent cast PHBV blends.
• DMTA Results
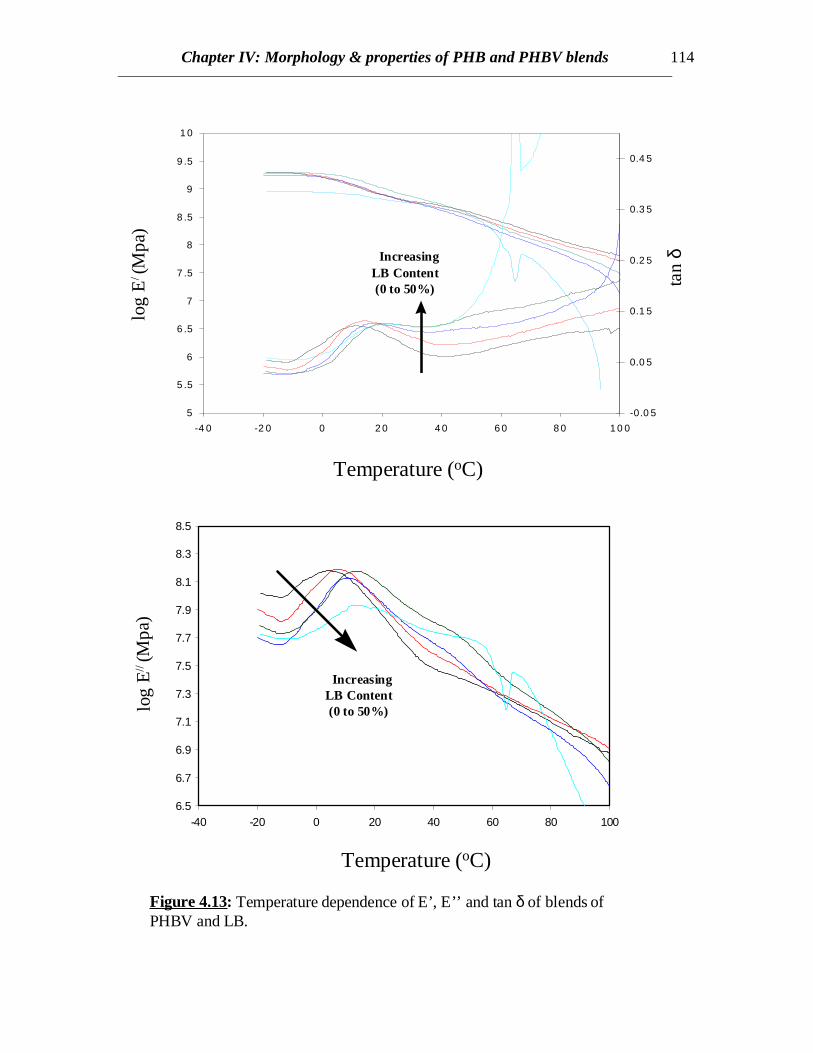
Both the tan δ and E’’ curves show a broadened peak near 10 0C which conformswith the relaxations associated with the glass transition phenomenon of PHBV (Fig.4.13).Also the peaks shift towards higher temperatures indicating some interaction between thePHBV and LB. The tan δ peaks are also elevated after the glass transition of PHBV as theLB content increases. This reveals the emergence of the relaxations associated with theglass transitions of LB around 500C. This transition might become more prominent if theLB content is sufficiently higher. This might also indicates that the average dimensions ofLB phase increases with increase in LB content in the blend. Since the blends arecrystalline (except that of 50% LB content), no sharp decline in the storage moduluscurves are observed near the Tg’s of the components. The decline starts at the onset ofmelting of the crystals at temperatures above 1000C (not shown here) though gradualdecline is observed over the entire temperature range. But for 50% LB content, thedecline starts after the Tg of LB since the amount of crystallinity is very less. Therefore,LB can retain the modulus of the blends till the Tg of LB is reached though PHBV is inrubbery state.
• TEM Results
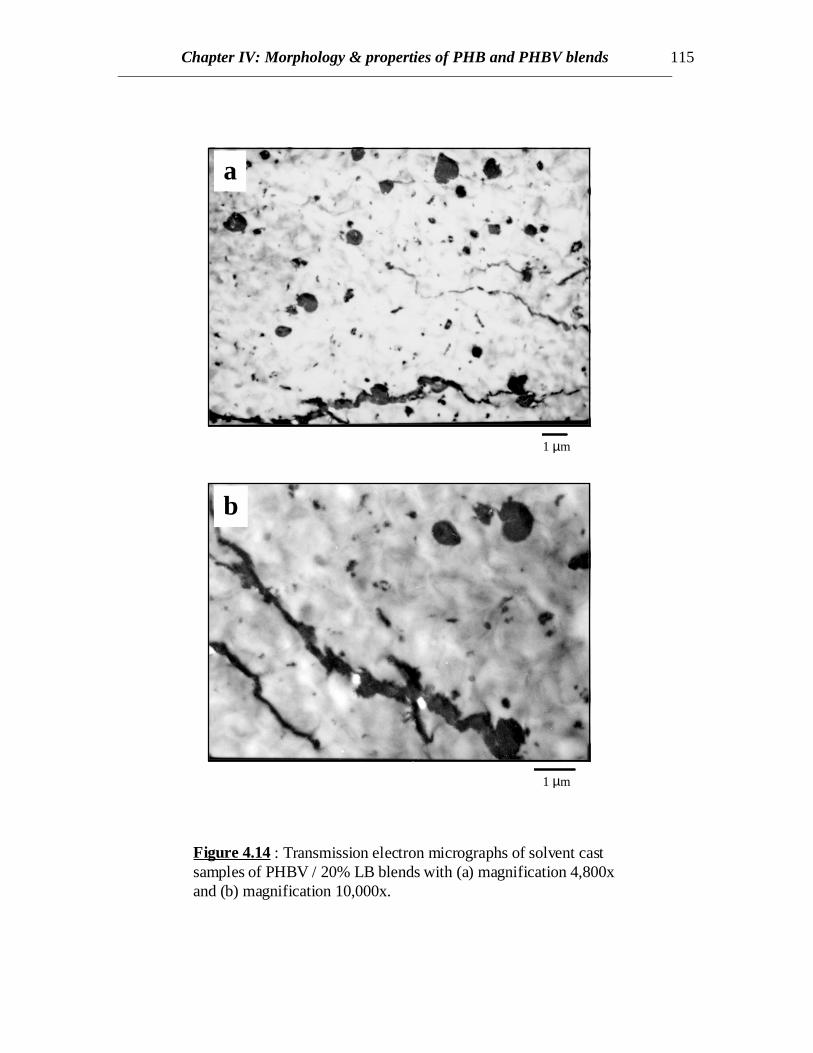
Transmission electron micrographs reveal distinct phases for PHBV and LB(Fig.4.14). LB phase can be distinguished from the PHBV phase by the dark color of LBphase. However, it is noted from the wavy pattern of the bright regions that the PHBVphase contains some amount of LB. This reveals some interaction between PHBV andLB and possibly some amount of LB goes into the PHBV phase whereas the rest of LB issegregated into distinct LB phase. This is consistent with the thermal results. It was notpossible to magnify the PHBV phase any further above 10,000x because the microtomedspecimen began to tear apart as the electron beam was concentrated at a smaller area.
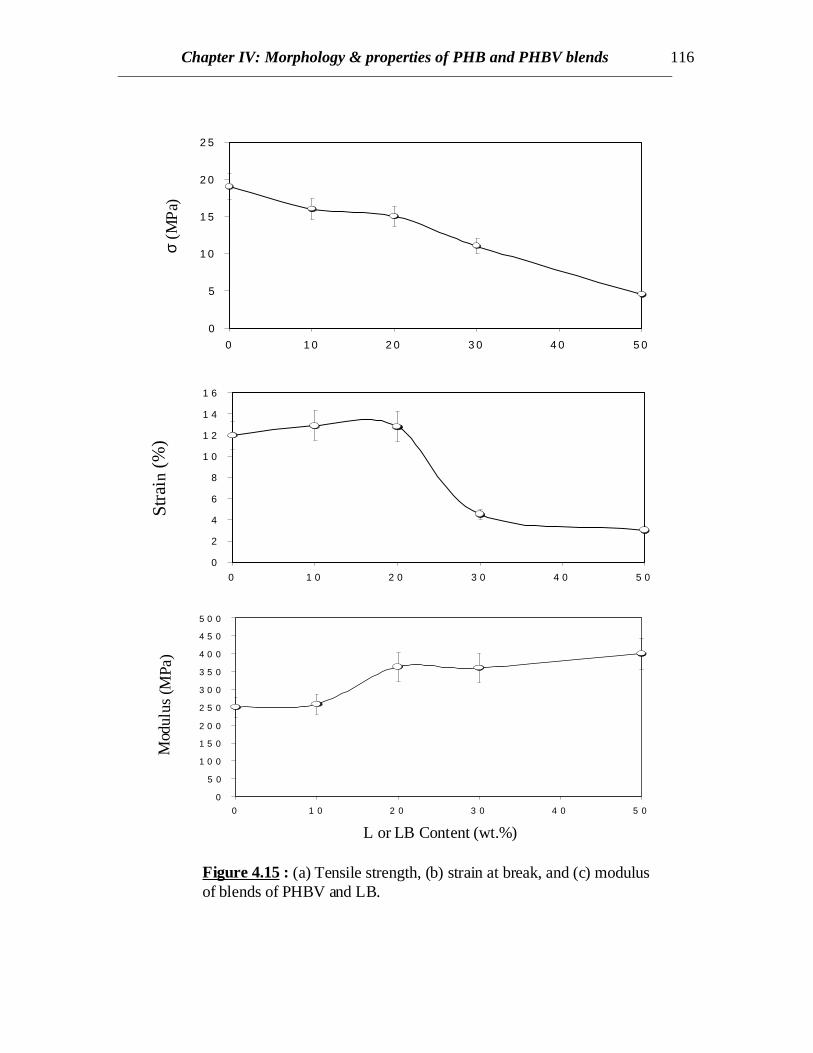
• Mechanical Properties :
PHBV is a copolymer and possesses lower crystallinity than PHB. So being in therubbery state at ambient temperatures, PHBV shows higher strain and tensile strengththan PHB. With the incorporation of LB into PHBV phase, stress transfer in thecontinuous PHBV phase is hindered due to the presence of glassy LB phase. Therefore, adecline in tensile strength is observed with increasing LB content (Fig.4.15). The ultimatestrain decreases rapidly when the LB content is more than 20%. This effect is not due tothe amount of crystallinity present in the blend since lower crystallinity should showbetter stress transfer in the amorphous phases. It is due to the higher amount of glassymaterial (LB) present in the blend and this makes it more brittle. This is particularly truesince an increase in modulus is observed around 20% LB content.
Chapter IV: Morphology & properties of PHB and PHBV blends 98
CONCLUSIONS
DSC and DMTA results revealed interaction between the PHB and L or LB.Crystallization was retarded by the presence of lignin component revealing interactionbetween PHB and lignin components. The glass transitions of PHB in the blends wereshifted towards higher temperatures, though enough evidence was found of anotherrelaxation present near the glass transitions of L or LB. Higher amounts of crystallinitywere observed in case of PHB/LB as compared to those of PHB/L blends at the samecomposition ratios. This gives an idea that the interaction between L and PHB is morepronounced than LB. This is very important from the point of view of application sincebrittleness can be reduced in PHB. Similar decrease in crystallinity was observed forPHBV blends. Crystallinity in PHBV decreases to almost zero when 30% LB is present.Crystallinity observed in case of solvent cast films is less than that for melt blendedsamples due to higher Mw. Modulus increase in blends of PHB and PHBV with L and LBhas been accounted for the reinforcing property of glassy lignin molecules. But increasein tensile strength and ultimate strain is observed in both PHB/L and PHB/LB blends. Lor LB significantly enhances the mechanical properties in PHB when blended and can beused to modify PHB for useful applications. Significant increase in modulus is also usefulfor specific applications of PHB and PHBV.
FUTURE WORK
Recommendations for future work include :1) The present study covered in this chapter is not sufficient to reveal any form of
miscibility of the blend components. So further crystallinity studies are necessaryto test whether the blends of PHB or PHBV with L or LB are miscible. The blendmiscibility characteristics can be performed by using the well established Flory-Huggins relationship using the equilibrium melting temperatures from theHoffman-Weeks plots.
2) Rheological studies of the blends can be carried out in order to understand theeffect of the lignin component on the melt viscosity and processing conditions ofthe blends.
3) The effect of the lignin component on the molecular weight of PHB or PHBVwhen processed at a temperature range above 1500C should be studied. Thiswould suggest the degradation characteristics of the polyhydroxyalkanoates in thepresence of lignin component. Lignin is observed to be an electron absorbingspecies and can reduce the chances of oxidation (hence degradation) of thepolyhydroxyalkanoates.
Chapter IV: Morphology & properties of PHB and PHBV blends 99
REFERENCESBarham, P. J. and Keller, A. (1986), The relationship between Microstructure and mode of
Fracture in Polyhydroxybutyrate, Journal of Polymer Science: Polymer Physics Edition,Vol. 24, 69-77.
Barham, P. J., Keller, A., Otun, E. L. and Holmes, P. A. (1984), Crystallization and morphologyof a bacterial thermoplastic: poly-3-hydroxybutyrate, Journal of Materials Science, 19,2781-2794.
Ciemniecki, S. L. and Glasser, W. G. (1988), Multiphase materials with lignin: 1. Blends ofhydroxypropyl lignin with poly(methyl methacrylate), Polymer, Vol. 29, 1021-1029.
Doi, Y. (1990), “Microbial Polyesters”, VCH Publishers, New York.
Edie, S. L., and Marand, H. (1991), “Study of Miscible Blends of Poly(vinylidene fluoride) andPoly(3-hydroxybutyrate)”, A.C.S. Polym. Preprints, 32(2), 329-330.
Flory, P. J.(1955), Trans. Faraday Soc., 51, 848.
Holmes, P. A.,(1988), Biologically produced (R)-3-hydroxy-alkanoate polymers and copolymers.In: Basset, D.C. (ed.) “Developments in Crystalline Polymers”, Elsevier, New York,Vol.2, pp.1-65.
Koller, I; and Owen, A. J. (1996), Starch-Filled PHB and PHB/HV Copolymer, PolymerInternational, 39, 175-181.
Lotti, N and Scandola, M (1992), Miscibility of bacterial poly(3-hydroxybutyrate-co-3-hydroxyvalerate) with ester substituted celluloses, Polymer Bulletin 29, 407-413.
Organ, S. J. and Barham, P. J. (1991), Nucleation, growth and Morphology of poly(hydroxybutyrate) and its copolymers, Journal of Material Science, 26, 1368-1374.
Orts, W. J, Bluhm, T. L. and Marchessault, R. H. (1991), Macromolecules, 24, 6435.
Orts, W. J, and Bluhm, T. L. (1992), Melting Point Depression for Poly(β−hydroxybutyrate-co—β−hydroxyvalerate) Random Copolymers, Polymer Preprints (ACS, Poly Chem), Vol 33,No 2, 530-531.
Sanchez, I. C. and Eby, R. K. (1975), Macromolecules, 8, 638.
Oliveira, Willer de, and Glasser, W.G., (1994) Multiphase materials with Lignin II .StarlikeCopolymers with Caprolactone, Macromolecules, 27, 5-11.
Yoshie, N.; Azuma, Y.; Sakurai, M.; and Inoue, Y. (1995), Crytallization and compatibility ofPoly(vinyl alcohol)/Poly(3-hydroxybutyrate) Blends: Influence of Blend Compositionand Tacticity of Poly(vinyl alcohol), Journal of Applied Polymer Science, Vol. 56, 17-24.
Chapter IV: Morphology & properties of PHB and PHBV blends 100
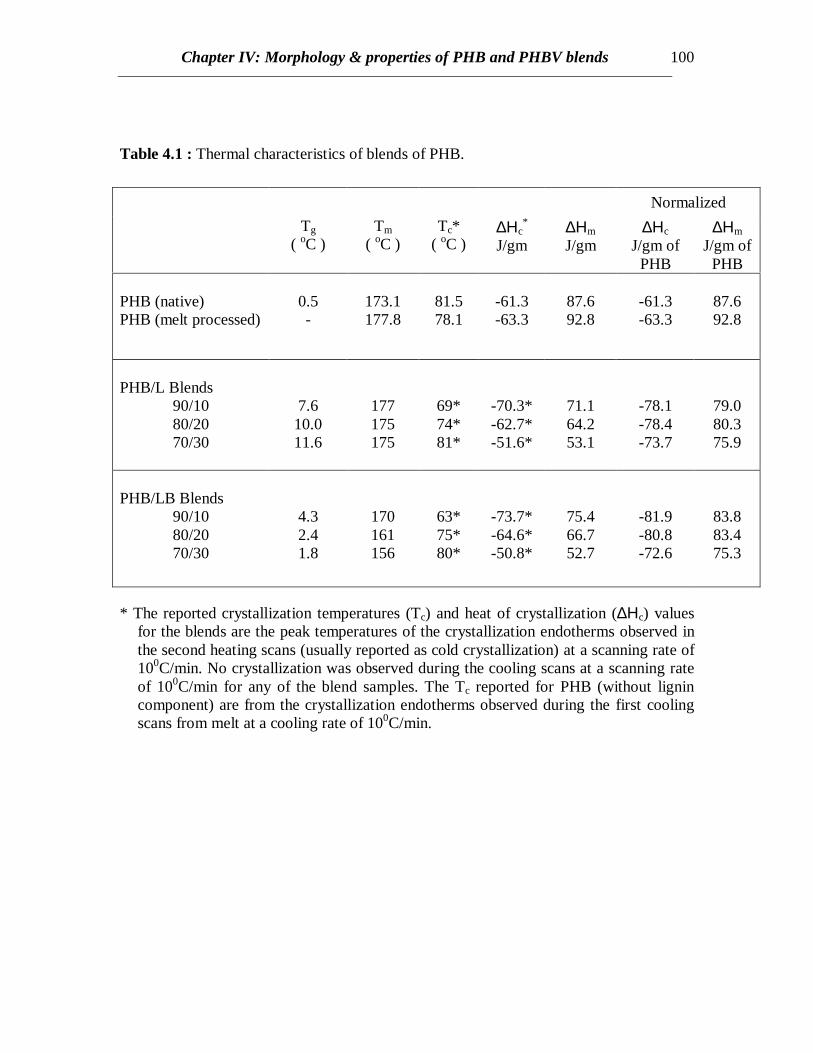
Table 4.1 : Thermal characteristics of blends of PHB.
Normalized
Tg
( oC )Tm
( oC )Tc*
( oC )∆Ηc
*
J/gm∆Ηm
J/gm∆Ηc
J/gm ofPHB
∆Ηm
J/gm ofPHB
PHB (native)PHB (melt processed)
0.5-
173.1177.8
81.578.1
-61.3-63.3
87.692.8
-61.3-63.3
87.692.8
PHB/L Blends90/1080/2070/30
7.610.011.6
177175175
69*74*81*
-70.3*-62.7*-51.6*
71.164.253.1
-78.1-78.4-73.7
79.080.375.9
PHB/LB Blends90/1080/2070/30
4.32.41.8
170161156
63*75*80*
-73.7*-64.6*-50.8*
75.466.752.7
-81.9-80.8-72.6
83.883.475.3
* The reported crystallization temperatures (Tc) and heat of crystallization (∆Ηc) valuesfor the blends are the peak temperatures of the crystallization endotherms observed inthe second heating scans (usually reported as cold crystallization) at a scanning rate of100C/min. No crystallization was observed during the cooling scans at a scanning rateof 100C/min for any of the blend samples. The Tc reported for PHB (without lignincomponent) are from the crystallization endotherms observed during the first coolingscans from melt at a cooling rate of 100C/min.
Chapter IV: Morphology & properties of PHB and PHBV blends 101
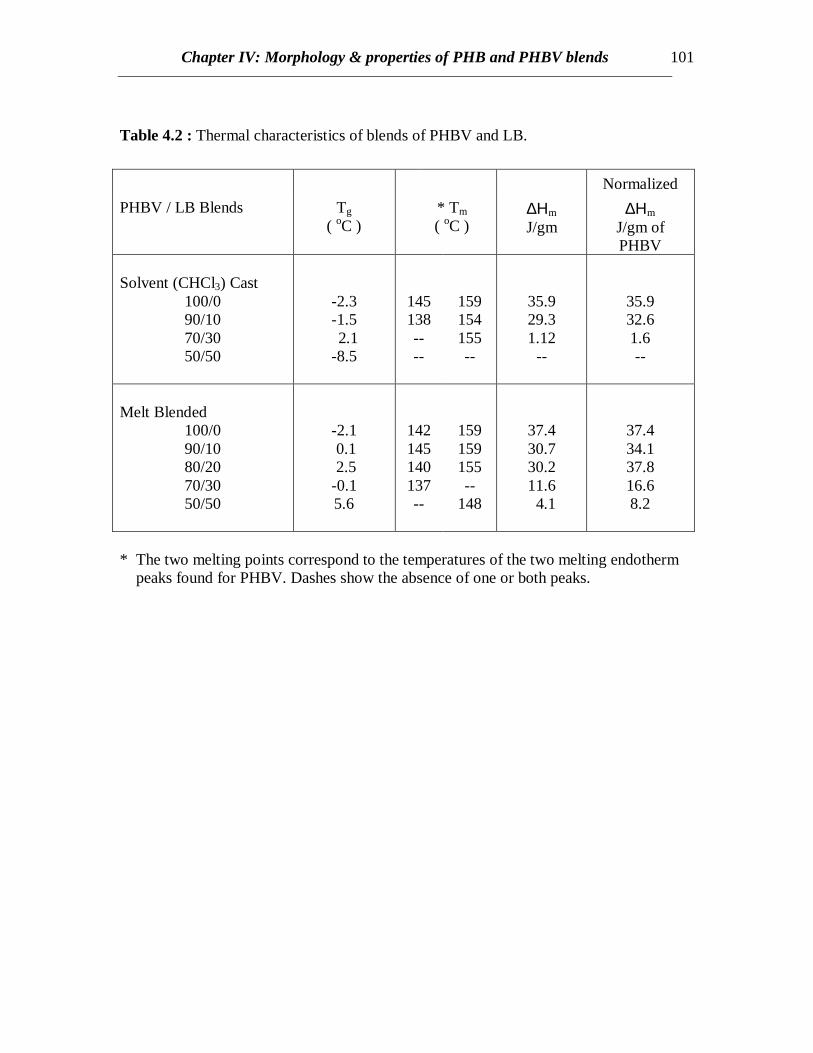
Table 4.2 : Thermal characteristics of blends of PHBV and LB.
Normalized
PHBV / LB Blends Tg( oC )
* Tm
( oC )∆Ηm
J/gm∆Ηm
J/gm ofPHBV
Solvent (CHCl3) Cast100/090/1070/3050/50
-2.3-1.5 2.1-8.5
145138----
159154155--
35.929.31.12--
35.932.61.6--
Melt Blended100/090/1080/2070/3050/50
-2.1 0.1 2.5-0.15.6
142145140137--
159159155--
148
37.430.730.211.6 4.1
37.434.137.816.68.2
* The two melting points correspond to the temperatures of the two melting endotherm peaks found for PHBV. Dashes show the absence of one or both peaks.
Chapter IV: Morphology & properties of PHB and PHBV blends 102
Figure 4.1 : Effect of processing and crystallization times on PHB. Thecooling traces are from the first cooling scans from melt and the heatingtraces are from the second heating scan. (Some curves have beenexpanded on the y-scale for greater clarity and so the y-axis has nosignificance).
Temperature (oC)
EN
DO
TH
ER
MIC
><
EX
OT
HE
RM
IC
-10 20 50 80 110 140 170 200
PHB (neat)Cool 100C min-1
Heat 100C min-1
PHB (melt processed)
PHB (melt processed)
PHB (melt processed)
PHB (melt processed)
PHB (neat)
Heat 2.50C min-1
Heat 100C min-1
Cool 2.50C min-1
Cool 100C min-1
Chapter IV: Morphology & properties of PHB and PHBV blends 103
-10 20 50 80 110 140 170 200
Figure 4.2 : DSC thermograms of melt blended samples of PHB and L.
Temperature (oC)
EN
DO
TH
ER
MIC
><
EX
OT
HE
RM
IC
PHB (melt)Cool 100C min-1
10% L/PHB (melt)
10% L/PHB (melt)
20% L/PHB (melt)
PHB (melt)
10% L/PHB (melt)
10% L/PHB (melt)
20% L/PHB (melt)
Cool 100C min-1
Cool 2.50C min-1
Cool 2.50C min-1
Heat 100C min-1
Heat 100C min-1
Heat 2.50C min-1
Heat 2.50C min-1
Chapter IV: Morphology & properties of PHB and PHBV blends 104
-30 0 30 60 90 120 150 180
Figure 4.3 : DSC thermograms of melt blended samples of PHB and L.Numbers on each curve denote L content (wt.%) in the blend. These tracesare from the second heating scan (after quenching from melt at a rate of300 oC/min).
Temperature (oC)
EN
DO
TH
ER
MIC
><
EX
OT
HE
RM
IC
0
10
20
30
Chapter IV: Morphology & properties of PHB and PHBV blends 105
-30 0 30 60 90 120 150 180
Figure 4.4 : DSC thermograms of melt blended samples of PHB and LB.Numbers on each curve denote LB content (wt.%) in the blend. These tracesare from the second heating scan (after quenching from melt at a rate of300oC/min).
Temperature (oC)
EN
DO
TH
ER
MIC
><
EX
OT
HE
RM
IC
0
10
20
30
Chapter IV: Morphology & properties of PHB and PHBV blends 106
0
2
4
6
8
10
12
14
0 5 10 15 20 25 30
PHB / L
PHB / LB
Tg
(0C
)
L or LB content (wt %)
Figure 4.5: Glass transition temperatures (Tg) for PHB and L or LB blends.
Chapter IV: Morphology & properties of PHB and PHBV blends 107
74
76
78
80
82
84
86
88
90
0 5 10 15 20 25 30
PHB / L
PHB / LB
No
rma
lize
d ∆H
m (
J/g
m o
f P
HB
)
L or LB content (wt %)
Figure 4.6: Normalized values of heat of fusion (∆Hm) for PHB and L or LBblends.
Chapter IV: Morphology & properties of PHB and PHBV blends 108
7
7.5
8
8.5
9
9.5
10
-50 0 50 100 150 2000
0.05
0.1
0.15
0.2
0.25
0.3
Temperature (oC)
lo
g E
/ (M
pa)
tan
δ
Increasing L Content(0 to 30%)
6
6.5
7
7.5
8
8.5
-50 0 50 100 150 200
log
E// (M
pa)
Temperature (oC)
Increasing L Content(0 to 30%)
Figure 4.7: Temperature dependence of E’, E’’ and tan δ of blends of PHB and L.
Chapter IV: Morphology & properties of PHB and PHBV blends 109
0
1
2
3
4
5
6
7
8
9
10
-50 0 50 100 150 2000
0.05
0.1
0.15
0.2
0.25
0.3
Temperature (oC)
lo
g E
/ (M
pa)
tan
δ
Increasing LB Content(0 to 20%)
log
E// (M
pa)
Temperature (oC)
Figure 4.8: Temperature dependence of E’, E’’ and tan δ of blends of PHB and LB.
6
6.5
7
7.5
8
8.5
-50 0 50 100 150 200
Increasing LB Content(0 to 20%)
Chapter IV: Morphology & properties of PHB and PHBV blends 110
0
5
1 0
1 5
2 0
2 5
3 0
0 5 1 0 1 5 2 0 2 5 3 0
0
0 . 5
1
1 . 5
2
2 . 5
3
3 . 5
4
0 5 1 0 1 5 2 0 2 5 3 0
0
1 0 0
2 0 0
3 0 0
4 0 0
5 0 0
6 0 0
7 0 0
8 0 0
9 0 0
0 5 1 0 1 5 2 0 2 5 3 0
Figure 4.9 : (a) Tensile strength, (b) strain at break, and (c) modulusof blends of PHB and L or LB ( L blends, LB blends).
L or LB Content (wt.%)
σ (M
Pa
)S
trai
n (%
)M
odul
us (
MP
a)
Chapter IV: Morphology & properties of PHB and PHBV blends 111
-30 0 30 60 90 120 150 180
Figure 4.10 : DSC thermograms of solvent (CHCl3) cast samples ofPHBV and LB. Numbers on each curve denote LB content (wt.%) in theblend. These traces are from the second heating scan (after quenchingfrom melt at a rate of 300 oC/min).
Temperature (oC)
EN
DO
TH
ER
MIC
><
EX
OT
HE
RM
IC
0
10
30
50
Chapter IV: Morphology & properties of PHB and PHBV blends 112
-30 0 30 60 90 120 150 180
Figure 4.11 : DSC thermograms of solvent (CHCl3) cast samples ofPHBV and LB. Numbers on each curve denote LB content (wt.%) in theblend. These traces are from the second heating scan (after cooling frommelt at a rate of 10 oC/min).
Temperature (oC)
EN
DO
TH
ER
MIC
><
EX
OT
HE
RM
IC
0
10
30
50
Chapter IV: Morphology & properties of PHB and PHBV blends 113
-30 0 30 60 90 120 150 180
Figure 4.12 : DSC thermograms of melt blended samples of PHBV andLB. Numbers on each curve denote LB content (wt.%) in the blend. Thesetraces are from the second heating scan (after cooling from melt at a rateof 10 oC/min).
Temperature (oC)
EN
DO
TH
ER
MIC
><
EX
OT
HE
RM
IC
0
10
20
30
50
Chapter IV: Morphology & properties of PHB and PHBV blends 114
Temperature (oC)
lo
g E
/ (M
pa)
tan
δ
log
E// (M
pa)
Temperature (oC)
Figure 4.13: Temperature dependence of E’, E’’ and tan δ of blends ofPHBV and LB.
5
5 .5
6
6 .5
7
7 .5
8
8 .5
9
9 .5
1 0
-4 0 -2 0 0 2 0 4 0 6 0 8 0 1 0 0
-0.0 5
0.0 5
0.1 5
0.2 5
0.3 5
0.4 5
6.5
6.7
6.9
7.1
7.3
7.5
7.7
7.9
8.1
8.3
8.5
-40 -20 0 20 40 60 80 100
Increasing LB Content(0 to 50%)
Increasing LB Content(0 to 50%)
Chapter IV: Morphology & properties of PHB and PHBV blends 115
Figure 4.14 : Transmission electron micrographs of solvent castsamples of PHBV / 20% LB blends with (a) magnification 4,800xand (b) magnification 10,000x.
1 µm
a
b
1 µm
Chapter IV: Morphology & properties of PHB and PHBV blends 116
0
5
1 0
1 5
2 0
2 5
0 1 0 2 0 3 0 4 0 5 0
0
2
4
6
8
1 0
1 2
1 4
1 6
0 1 0 2 0 3 0 4 0 5 0
0
5 0
1 0 0
1 5 0
2 0 0
2 5 0
3 0 0
3 5 0
4 0 0
4 5 0
5 0 0
0 1 0 2 0 3 0 4 0 5 0
L or LB Content (wt.%)
σ (M
Pa)
Str
ain
(%)
Mod
ulus
(M
Pa
)
Figure 4.15 : (a) Tensile strength, (b) strain at break, and (c) modulusof blends of PHBV and LB.