ams q3 2016 results / heptagon acquisition
TRANSCRIPT

© ams AG 2016
ams
Q3 2016 results / Heptagon acquisition
Alexander Everke, CEO
Michael Wachsler-Markowitsch, CFO
Moritz M. Gmeiner, Head of IR
October 2016

© ams AG 2016
Page 2
Our business
• Focus on high performance sensor solutions
• Sensor solutions, sensor ICs, interfaces, related software
• Small, low power, highest sensitivity, multi-sensor integration
• Best-in-class solutions for leading OEMs
Our end markets
• Consumer & Communications (C&C) – 50% of sales H1 2016
• Automotive, Industrial, Medical (AIM) – 50% of sales H1 2016
By the numbers
• 700+ ams engineers (830+ combined with Heptagon)
• 17+1 design centers, 2+1 manufacturing locations
• 35 years of design and manufacturing know-how
• 2,100+ ams employees worldwide
(2,900+ combined with Heptagon)
• 8,000+ customers
ams at a glance

© ams AG 2016
Page 3
True leadership
in four sensor
areas
• Optical
• Imaging
• Environmental
• Audio
ams strategy
Best-in-class performance
per sensor area and in multi-
sensor application solutions
• Smallest, lowest cost, high
volume multi-sensor modules,
driving monolithic integration
• Sensor algorithms and
sensor fusion software
• Application software for
differentiating end-user
experiences
Diversified business
with balanced appli-
cation and customer
portfolio
• Long-term target
mix of at least 60/40
C&C / AIM split
Financial
target model of
sustained 30%
EBIT margin
Build the global leader in sensor solutions

© ams AG 2016
Page 4
Sensor ICs Sensor solutions Application solutions
Delivering best-in-class sensor solutions and applications
ams strategic value chain
Optical
Imaging
Environmental
Audio
Multi-sensor
packages &
modules
Monolithic
integrated
sensors
Sensor
algorithms
Sensor
fusion
algorithms
Application
software to
deliver end-user
experiences

© ams AG 2016
Page 5
Heptagon: Global leader in high end optical packaging
• Market leader and innovation driver in micro-optics and
high performance optical packaging
• Advanced optics capabilities enable world-class integration
and high end packaging solutions for optical sensing
• Currently focused on the consumer market, major supplier into
high volume mobile device applications for small form factors
• Customer base includes key customer serving smartphone/mobile device markets
• Expects substantial revenue growth over the coming years starting mid-year 2017,
based on revenue and capacity pipeline and existing customer commitments
ams + Heptagon: The end-to-end optical sensing solutions leader
• Increasing value-add of high end packaging for upcoming optical sensor applications
drives strategic combination
• Clear #1 in optical sensing with scale and ability to drive industry trends
• End-to-end solution capability under one roof to better serve customers, and
accelerating expansion of ams’ capability in sensor fusion/sensor hubs
• ams’ consumer market access accelerates broadening of Heptagon customer base
Heptagon acquisition: Optical sensing leadership

© ams AG 2016
Page 6
Heptagon business overview
• Headquarters/manufacturing Singapore, R&D center Switzerland
• 830+ employees (approx. 120 engineers and 500 manufacturing
staff), 250 patent families
• Current 12 month revenue run rate around USD 90m
• Negative operating profitability due to current underutilization of capacity
• Major expansion of Singapore manufacturing capacity underway, based on confirmed
customer commitment for usage of additional capacity
• Total capital investment of more than USD 250m in 2016/17,
fully funded from existing cash in the business, no ams funding required
ams including Heptagon: Higher growth target and focus on EBIT margin
• Significantly higher mid-term growth opportunities for ams including Heptagon, particularly
in consumer optical sensing
• Substantial content increases in smartphone and mobile device space
expected to drive accelerated growth
• New revenue growth target of 30% CAGR including Heptagon for the coming three years
• Focus on EBIT profitability: target of 30% sustained operating margin from 2019
Heptagon acquisition: Overview, new targets

© ams AG 2016
Page 7
Transaction details
• Upfront payment in cash and shares
+ deferred earn-out in cash
• USD 64m cash from available funds,15% capital
increase (excl. subscription rights) plus treasury
shares, total upfront payment value approx. USD 570m
• Earn-out of up to USD 285m based on acquired
business delivering high revenue growth over FY2017
• Closing expected within 3 months
• Valuation based on high growth potential from revenue pipeline,
customer commitments and capacity increase
• Total valuation determined by future performance of acquired business
Heptagon shareholders
• Financial investors, including GGV Capital (global financial investor, USA) and Temasek
(Government of Singapore-owned investment company, SIN), management and employees
Heptagon acquisition: Transaction details
New ams shareholder structure
20% former Heptagon shareholders
80%
existing
share-
holders
Other new 12%
GGV Capital 6%Temasek 2%
(all approx. values)

© ams AG 2016
Page 8
Worldwide leader in light sensing solutions
• Clear #1 in mobile optical sensing
• True Color spectral sensing for advanced
analysis of light spectrum / light environment
• RGB color, ALS, proximity sensors / modules
• Time-of-flight (ToF) technologies
• Spectral sensing for color identification
• Spectral sensing high quality biosensors
• Color and spectral sensing for Industrial IoT applications
• Spectral light sensing for smart LED lighting
High value image sensing
• High-performance area and line scan CMOS image sensors
• NanEye miniature camera technology
• Future combination of imaging and spectral sensing
Optical and image sensing
Spectral
sensing drives
differentiation: True
Color in consumer

© ams AG 2016
Page 9
Audio sensing
ANC (active noise cancellation)
• High performance solution based on
analog noise reduction technology
• Low power budget + footprint advantages
• Significantly better receive-path audio quality,
also lowering potential health risks
• Broad market interest in high-end adoption
• Expansion of audio signal processing
capabilities through addition of digital IP team
MEMS microphone interface ICs
• Continuing market leadership in high volume market
• Leading position in low noise solutions and tight integration
• Strong customer partnership focused on high quality segments
• Digital interface roadmap
• Exploring potential for audio sensor fusion
adding further sensor modalities to audio input hardware
Audio sensing
growth opportunities
in high-end
applications

© ams AG 2016
Page 10
Environmental (including gas) sensing
Technology leader in environmental/gas sensing
• End-to-end solution provider
• Unique CMOS-based portfolio for low power,
high volume, small form factor
• Key environmental sensing areas
- MOX gas
- Infrared gas / presence detection
- Rel. humidity, pressure, temperature
• Broad range of emerging applications in mobile, home/building
automation, Industrial IoT and other AIM markets
Uniquely positioned for multi-sensor modules and monolithic
multi-sensor integration
• Combination of related environmental sensor modalities in module
(e.g. gas + relative humidity)
• Integration roadmap to realize low-cost, low-power, smallest size
consumer solutions
• Sensor algorithms and application software as value drivers
Emerging market
in HABA and
Industrial IoT, road-
map for consumer

© ams AG 2016
Page 11
Mobile device optical sensor applications
• Clear #1 in mobile optical sensing
• Display management (ALS, RGB color, prox)
• True Color ambient light identification and display optimization
• New spectral sensing-based applications (color identification)
Mobile device audio sensing
• High quality ANC (Active Noise Cancellation) headsets expected to move “into the box”
• Audio sensor fusion potential for other sensor modalities
Health data acquisition
• Focus on quality data for wearables and new device types
• Spectral sensing enables upcoming relative blood pressure feature
Environmental sensing
• Roadmap for emerging gas sensing applications
Sensor solutions and sensor interfaces
End markets – Consumer & Communications
Largest mid-term
revenue growth
opportunities

© ams AG 2016
Page 12
Industrial automation, control, and sensing
• Motion control, drives and electrical motors
• Industrial sensors including time-based sensors
• Integrated magnetic position encoders
Building automation, infrastructure and lighting
• HVAC, safety, sensor networking and bus systems
• Highest accuracy gas and water flow metering
• Smart LED lighting (lighting management, daylight harvesting)
High-performance CMOS image sensing
• Leading position in high-end imaging
• Global shutter technology for high speed, frame rate, dynamic range
• Upcoming Industrial IoT opportunities include spectral sensing fusion
Environmental sensing
• CMOS monolithic relative humidity, pressure, temperature sensors
• Emerging spectral sensing (agriculture, machinery)
Sensor solutions and sensor interfaces
End markets – Industrial
Emerging markets for
environmental/gas
sensing, lighting and
spectral sensing
© ams AG 2016
Page 13
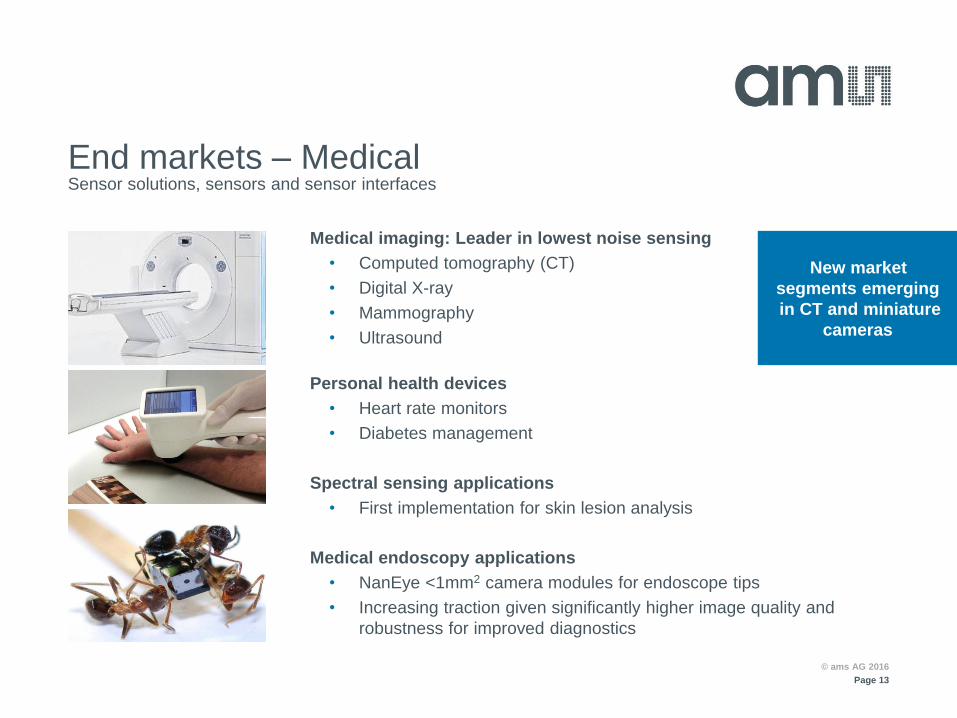
Medical imaging: Leader in lowest noise sensing
• Computed tomography (CT)
• Digital X-ray
• Mammography
• Ultrasound
Personal health devices
• Heart rate monitors
• Diabetes management
Spectral sensing applications
• First implementation for skin lesion analysis
Medical endoscopy applications
• NanEye <1mm2 camera modules for endoscope tips
• Increasing traction given significantly higher image quality and
robustness for improved diagnostics
Sensor solutions, sensors and sensor interfaces
End markets – Medical
New market
segments emerging
in CT and miniature
cameras

© ams AG 2016
Page 14
Position sensing
• Pedal and throttle position
• Transmission (clutch, gear shift)
• Steering wheel angle and torque
• Brushless motor control applications
Safety and infrastructure, ADAS
• Advanced driver assistance/object detection LIDAR systems
• ESP (Electronic Stability Program), data bus networks
• Battery management for conventional, hybrid, electric vehicles
Environmental sensing
• Air quality sensing
• Relative humidity and temperature sensing
Automotive lighting
• Exploring new lighting applications (advanced cabin lighting)
Sensor solutions, sensors and sensor interfaces
End markets – Automotive
Potential for broader
presence across
application areas
© ams AG 2016
Page 15
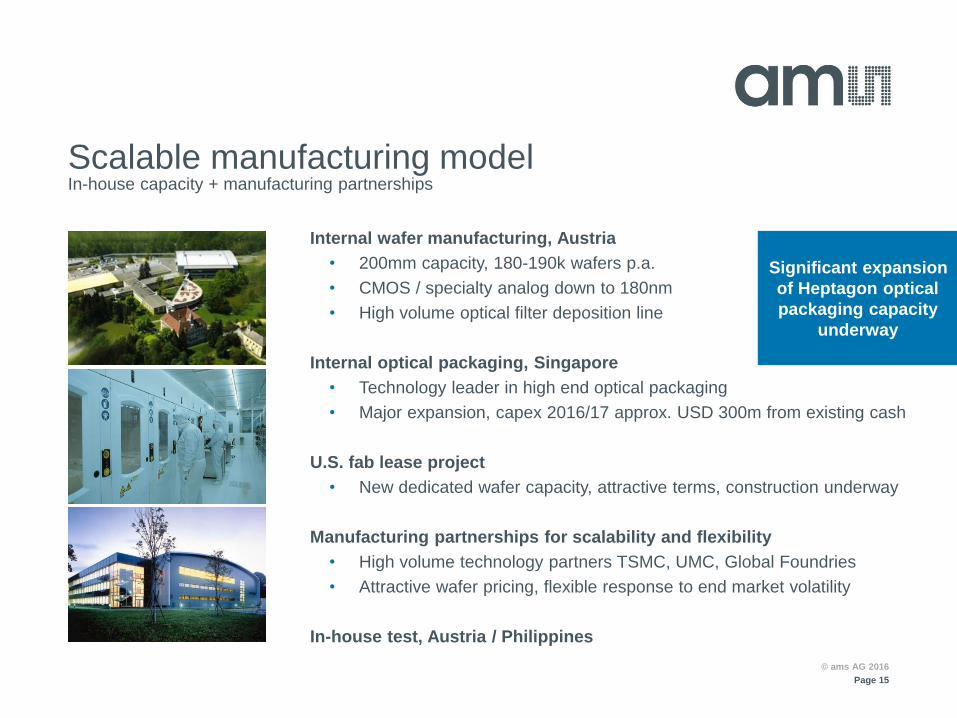
Internal wafer manufacturing, Austria
• 200mm capacity, 180-190k wafers p.a.
• CMOS / specialty analog down to 180nm
• High volume optical filter deposition line
Internal optical packaging, Singapore
• Technology leader in high end optical packaging
• Major expansion, capex 2016/17 approx. USD 300m from existing cash
U.S. fab lease project
• New dedicated wafer capacity, attractive terms, construction underway
Manufacturing partnerships for scalability and flexibility
• High volume technology partners TSMC, UMC, Global Foundries
• Attractive wafer pricing, flexible response to end market volatility
In-house test, Austria / Philippines
In-house capacity + manufacturing partnerships
Scalable manufacturing model
Significant expansion
of Heptagon optical
packaging capacity
underway

© ams AG 2016
Page 16
Headquarters
Design centers
Manufacturing/Test
Sales/customer
support locations
Global network – design, manufacturing, support
• 17+1 design centers
Austria, Switzerland (1+1), Italy (2), Spain, Germany (4), Belgium, Netherlands,
Portugal, Finland, USA (2), India, Japan
• Manufacturing
Austria, Singapore
• High volume test center
Philippines

© ams AG 2016
Page 17
ams highlights
Global leadership in sensor solutions
Focus on growth and emerging markets
Scalable manufacturing
Growth relationships with leading OEMs
Worldwide network and customer reach
Strong financial model for earnings growth

© ams AG 2016
Page 18
Key figuresEURm
(IFRS) 9M 2016 9M 2015 Q3 2016 Q3 2015
Total revenues 416.3
- 12.5%
475.9 146.7
- 4.1%
153.0
Gross margin (adjusted 1) )
(IFRS reported)
56%
53%
56%
54%
55%
53%
56%
54%
Result from operations (adjusted – see footnotes)
(EBIT) (IFRS reported)
80.62)
86.1
130.51)
118.0
28.02)
49.7
38.51)
35.1
Net result 89.2
- 24.4%
118.0 55.9
+ 64.4%
34.0
EPS (basic/diluted) 3) CHF
EUR
1.45 / 1.40
1.32 / 1.28
1.81 / 1.74
1.71 / 1.65
0.91 / 0.88
0.84 / 0.81
0.54 / 0.52
0.49 / 0.47
1) Excl. acquisition-related and share-based compensation costs2) Excl. acquisition-related costs, share based compensation costs and result from divestiture (EUR 29.7m)3) Earnings per share in CHF were converted using the average currency exchange rate for the respective periods

© ams AG 2016
Page 19
146.6132.2
0
50
100
150
200
Jun 30 2016 Sep 30 2016
475.9
416.3
153.0 146.7
0
100
200
300
400
500
9M 2015 9M 2016 Q3 2015 Q3 2016
Total revenues
Total backlog
- 4.1%
- 12.5%
Europe (EMEA)
Asia/Pacific
Americas
Total revenues by market H1 2016
Consignment
stock agreements
approx. EUR 13-14m
Total revenues by region 9M 2015 / 9M 2016
Automotive,
Industrial,
MedicalConsumer &
Communications50%
50%
31% 36%
4%5%
65% 59%
0%
20%
40%
60%
80%
100%
9M 2015 9M 2016
Financial resultsEURm

© ams AG 2016
Page 20
266.71)
233.61)
85.71)81.31)
56.0%1) 56.1%1)
56.0%1)55.4%1)
0
100
200
300
9M 2015 9M 2016 Q3 2015 Q3 2016
Gross profit, gross margin
EBIT
R&D
SG&A
1) Excl. acquisition-related and share-based compensation costs
2) Excl. acquisition-related costs and share based compensation costs and result from divestiture (EUR 29.7m)
76.1
101.8
25.836.5
16.0%
24.4%
16.9%24.9%
0
25
50
75
100
125
9M 2015 9M 2016 Q3 2015 Q3 2016
72.1 71.9
24.3 23.1
15.2%17.3%
15.9% 15.8%
0
25
50
75
100
9M 2015 9M 2016 Q3 2015 Q3 2016
130.51)
80.62)
38.51)
28.02)
27.4%1)
19.4%2)
25.2%1)
19.1%2)
0
25
50
75
100
125
150
9M 2015 9M 2016 Q3 2015 Q3 2016
Financial resultsEURm, % of revenues

© ams AG 2016
Page 21
118.0
89.2
34.0
55.9
0
25
50
75
100
125
150
9M 2015 9M 2016 Q3 2015 Q3 2016
Net result, EPS (basic/diluted)
Capital expenditures
Operating cash flow
Net cash, cash + short term investments
108.5
60.0
36.245.2
22.8%
14.4%
23.7%
30.8%
0
30
60
90
120
150
9M 2015 9M 2016 Q3 2015 Q3 2016
61.4
-250.3
206.4 199.5
-300
-200
-100
0
100
200
300
9M 2015 9M 2016 9M 2015 9M 2016
63.869.2
18.124.3
13.4%16.6%
11.8%
16.6%
0
20
40
60
80
9M 2015 9M 2016 Q3 2015 Q3 2016
CHF 1.45/1.40EUR 1.32/1.28
CHF 0.91/0.88 EUR 0.84/0.81
Net cash/Net debt Cash + short term invest.
Financial results
CHF 1.81/1.74EUR 1.71/1.65
CHF 0.54/0.52EUR 0.49/0.47
EURm, % of revenues

© ams AG 2016
ams
Shaping the world with sensor solutions

© ams AG 2016
Page 23
EURm
Profit and loss statement
(IFRS) 9M 2016 9M 2015 Q3 2016 Q3 2015
Total revenues
• Products
• Foundry
416.3
379.7
36.6
475.9
442.8
33.1
146.7
131.7
15.0
153.0
142.4
10.6
Gross profit• Gross margin (adjusted 1))
• Gross margin (IFRS reported)
222.356.1%
53.4%
258.856.0%
54.4%
77.755.4%
53.0%
83.156.0%
54.3%
Research and development
Selling, general and administrative
Other operating income/expenses
- 101.8
- 71.9
35.9
- 76.1
- 72.1
5.5
- 36.5
- 23.1
31.6
- 25.8
- 24.3
2.2
Result from operations (EBIT)• EBIT margin (adjusted – see footnotes)
• EBIT margin (IFRS reported)
86.119.4%2)
20.7%
118.027.4%1)
24.8%
49.719.1%2)
33.9%
35.125.2%1)
23.0%
Net financing costs - 2.8 8.6 - 1.6 1.3
Result before tax
Income tax result
83.3
5.9
126.6
- 8.6
48.1
7.8
36.4
- 2.4
Net result 89.2 118.0 55.9 34.0
1) Excl. acquisition-related and share-based compensation costs2) Excl. acquisition-related costs and share based compensation costs and result from divestiture (EUR 29.7m)

© ams AG 2016
Page 24
Balance sheetEURm
Assets (IFRS) Sep 30,2016
Dec 31,2015
Liabilities and equity Sep 30, 2016
Dec 31,2015
Cash and short term invest.
Trade receivables
Inventories
Other current assets
199.5
102.4
87.8
33.7
143.9
88.7
79.8
28.7
Interest-bearing debt
Trade liabilities
Tax liabilities
Provisions
Other liabilities
75.3
46.9
35.4
30.3
38.5
75.0
58.6
46.3
34.7
31.0
Total current assets 423.4 341.0 Total current liabilities 226.3 245.6
Fixed assets
Intangible assets
Investments in associates
Deferred tax asset
Other non-current assets
294.2
595.0
2.1
34.8
23.3
256.6
582.0
1.9
34.8
7.0
Interest-bearing debt
Employee benefits
Provisions
Deferred tax liabilities
Other liabilities
374.5
34.4
0.0
54.9
36.9
200.2
32.4
0.0
57.9
6.0
Total non-current assets 949.5 882.3 Total non-current
liabilities
Shareholders’ equity
500.7
645.9
296.6
681.2
Total assets 1,372.9 1,223.4 Total liabil. and equity 1,372.9 1,223.4

© ams AG 2016
Page 25
Cash flow statementEURm
(IFRS) 9M 2016 9M 2015 Q3 2016 Q3 2015
Income before tax
Depreciation
83.3
46.4
126.6
35.0
48.1
15.9
36.4
11.1
Cash flow from operations 60.0 108.5 45.2 36.2
Capital expenditures - 69.2 - 63.8 - 24.3 - 18.1
Cash flow from investing activities - 47.0 - 75.3 29.9 - 17.8
Proceeds from borrowings
Repayment of borrowings
Dividends paid
Changes resulting from capital increase
257.2
- 85.2
- 34.6
0.0
65.1
- 105.7
- 22.8
0.9
181.9
- 80.2
0.0
0.0
1.1
- 10.1
0.0
0.0
Cash flow from financing activities 49.7 - 78.3 58.8 - 12.3
Change in cash and cash equivalents(incl. effects of changes in foreign exchange rates)
59.7 - 37.4 133.6 7.2
Cash and cash equivalents at end of period 163.3 166.3 163.3 166.3