amt 8-3685-2015 - copernicus.org
TRANSCRIPT

Atmos. Meas. Tech., 8, 3685–3699, 2015
www.atmos-meas-tech.net/8/3685/2015/
doi:10.5194/amt-8-3685-2015
© Author(s) 2015. CC Attribution 3.0 License.
Automated rain rate estimates using the Ka-band ARM
zenith radar (KAZR)
A. Chandra1, C. Zhang1, P. Kollias2, S. Matrosov3, and W. Szyrmer2
1Rosenstiel School of Marine and Atmospheric Sciences, University of Miami, Miami, Florida, USA2Department of Atmospheric and Oceanic Sciences, McGill University, Montreal, Canada3Cooperative Institute for Research in Environmental Sciences, University of Colorado and NOAA/Earth System Research
Laboratory, Boulder, Colorado, USA
Correspondence to: A. Chandra ([email protected])
Received: 14 January 2014 – Published in Atmos. Meas. Tech. Discuss.: 25 February 2014
Revised: 1 September 2015 – Accepted: 1 September 2015 – Published: 14 September 2015
Abstract. The use of millimeter wavelength radars for prob-
ing precipitation has recently gained interest. However, esti-
mation of precipitation variables is not straightforward due
to strong signal attenuation, radar receiver saturation, an-
tenna wet radome effects and natural microphysical variabil-
ity. Here, an automated algorithm is developed for routinely
retrieving rain rates from the profiling Ka-band (35-GHz)
ARM (Atmospheric Radiation Measurement) zenith radars
(KAZR). A 1-dimensional, simple, steady state microphysi-
cal model is used to estimate impacts of microphysical pro-
cesses and attenuation on the profiles of radar observables
at 35-GHz and thus provide criteria for identifying situa-
tions when attenuation or microphysical processes dominate
KAZR observations. KAZR observations are also screened
for signal saturation and wet radome effects. The algorithm
is implemented in two steps: high rain rates are retrieved by
using the amount of attenuation in rain layers, while low rain
rates are retrieved from the reflectivity–rain rate (Ze–R) re-
lation. Observations collected by the KAZR, rain gauge, dis-
drometer and scanning precipitating radars during the DY-
NAMO/AMIE field campaign at the Gan Island of the tropi-
cal Indian Ocean are used to validate the proposed approach.
The differences in the rain accumulation from the proposed
algorithm are quantified. The results indicate that the pro-
posed algorithm has a potential for deriving continuous rain
rate statistics in the tropics.
1 Introduction
Precipitation is a key variable in the Earth’s water cycle. It
is fundamental to atmospheric processes on a wide range
of scales, and it is one of the most important components
of weather and climate prediction models. Observations of
precipitation associated with all cloud types are needed to
improve our understanding of the life cycle of the atmo-
spheric convection, and their interaction with the circulation,
and their roles in global weather and climate (Zhang, 2013).
Structures of cloud and precipitation systems span over a
large spectrum of scales. Holistic, continuous ground obser-
vations across the scales of time, space and intensity are diffi-
cult to collect even at heavily instrumented sites (Mather and
Voyles, 2013). More often than otherwise, only parts of the
systems are observed.
This is particularly true in the tropics where operational
precipitation radar networks are extremely rare. Tropical
Rainfall Measurements Mission (TRMM, Kummerow et al.,
1998) has collected observations of tropical rainfall that
allow climatology of tropical precipitation for more than
10 years (Wang et al., 2013). NASA’s CloudSat Cloud Profil-
ing Radar (Lebsock and L’Ecuyer, 2011) provided unprece-
dented details of tropical cloud and precipitation. Multi-
satellite based precipitation products yield information at
finer temporal scales (Huffman et al., 2007). However, char-
acterizing precipitation from cloud systems with short life
times (within an hour) demands observations at much finer
temporal resolutions, which is a challenge for remote sens-
ing measurement from space. Conventional methods of re-
trieving precipitation from low frequency (S-, C- or X-band)
Published by Copernicus Publications on behalf of the European Geosciences Union.

3686 A. Chandra et al.: Automated rain rate estimates using the KAZR
ground-based radars use different regime dependent relations
between rain rate and radar measurables.
There are various approaches of deriving precipitation
from different instruments depending on the measurable
quantity. Profilers (UHF, ultra-high frequency or VHF, very
high frequency or combination of both) are used to derive
raindrop size distributions along with vertical air motions in-
formation (e.g., Wakasugi et al., 1986; Rajopadhyaya et al.,
1998) as they could detect precipitation echoes simultane-
ously with echoes from the ambient atmosphere. For nonpo-
larimetric precipitation radars operating at lower frequencies
(e.g., at C- and S-band), rain rates are usually derived from
the observed reflectivity values using empirical reflectivity
(Ze)–rain rate (R) relations, in which Ze and R are functions
of drop size distributions (DSDs) (e.g., Marshall and Palmer,
1948). The polarization capability (ZDR: differential reflec-
tivity, φDP: differential phase) offers a possibility of estimat-
ing the DSD parameters from radar measurements of differ-
ential backscatter properties (e.g., Sachidananda and Zrnic,
1987; Ryzhkov and Zrnic, 1996), thus potentially providing
more accurate estimates of rainfall rates.
Many permanent Atmospheric Radiation Measurement
(ARM) Program observational sites have collected a long
record of data on precipitating and non-precipitating clouds
from millimeter wavelength cloud radars without accompa-
nying precipitation radars (e.g., Kollias et al., 2007; Mather
and Voyles, 2013). The millimeter wavelength cloud radars
are primarily designed is observe only clouds, and their ap-
plication to observe precipitation is limited due to strong
attenuation by raindrops (e.g., Lhermitte, 1990) and radar
receiver saturation in the lowest 1–2 km. Nevertheless, re-
cent studies (e.g., Aydin and Daisley, 2002; Matrosov, 2005,
2007) have demonstrated the use of millimeter wavelength
cloud radars for retrieving rain rates during stratiform con-
ditions utilizing information on signal attenuation in the rain
layer.
In this study we describe an approach which extends the
utility of zenith-looking Ka-band (∼ 35 GHz) cloud radar
measurements for routine estimations of rain rate. Given that
Ka-band radars are deployed at many permanent and mobile
locations throughout the world, such estimates would be use-
ful in future applications especially for observational sites
when retrievals from more conventional approaches that uti-
lize lower frequency (e.g., X-, C-, or S-band) scanning radar
measurements are unavailable or limited in time and/or ver-
tical resolution (e.g., due to remoteness of scanning radar lo-
cations). The potential advantages of rainfall retrievals from
zenith-looking radar measurements compared to more direct
ground-based sensor estimates from gauge and/or disdrom-
eters is in an ability to provide vertically resolved informa-
tion. However, it is necessary to evaluate the robustness of the
zenith looking Ka-band radar rain rate estimates with more
direct results when they are available, which is the case in the
present study.
2 Data sets and instruments
The evaluation of the Ka-band radar based approach to
estimate rain rate was performed using data set obtained
during the DYNAMO (Dynamics of the Madden–Julian
Oscillation)/AMIE (ARM MJO Investigation Experiment)
field campaign which took place in the tropical Indian
Ocean and surrounding regions between 1 October 2011 and
31 March 2012 (Yoneyama et al., 2013). Several ground-
based radars along with other instruments were deployed for
this campaign at the Addu Atoll of the Maldives (Fig. 1).
The instruments and their specifications are listed in Table 1.
The radar triad consisted of two scanning precipitation radars
and the vertically pointing Ka-band Atmospheric Radiation
Measurement (ARM) zenith radar (KAZR) radar, which was
deployed at the Gan Island airport as part of the ARM Mobile
Facility (AMF).
One scanning radar had a polarimetric and a dual-
wavelength S- and Ka-band (i.e., the S-PolKa radar) ca-
pabilities and was located on Hithadhoo Island (0.6304◦ S,
73.1029◦ E) at a distance of 8.61 km from the KAZR. The
other scanning radar (i.e., the Shared Mobile Atmospheric
Research & teaching Radar – the SMART-R radar) was
nonpolarimetric and operated at a C-band frequency and
in 10 min scan cycles. It was located on the same island
(0.6076◦ S, 73.0958◦ E), which was about 9.28 km from the
KAZR. Vertical scans over the KAZR, were performed by
both the S-PolKa (every 15 min) and the SMART-R (every
10 min), allowing comparisons between radar and direct es-
timates of rainfall from gauge and disdrometer data. For the
DYNAMO period, the data from the KAZR, SMART-R and
S-PolKa are merged into a single data set (Feng et al., 2014),
which was used in this study.
The ARM KAZR radars provide vertical profiles of three
Doppler moments (reflectivity, Doppler velocity and spec-
trum width). These radars are usually operated at a ver-
tical and time resolutions of 30 m and 4 s with a maxi-
mum range of about 18 km. During DYNAMO, two KAZR
measurement modes were used: a general mode and a cir-
rus mode. The KAZR sensitivity for the general and cirrus
modes are approximately −25 dBZ at 10 km, and −36 dBZ
at 10 km, respectively. The KAZR systems have higher dy-
namic range than the millimeter wavelength cloud radars
(∼ 85 dB compared to ∼ 65 dB) operating in general mode,
which enables the avoidance of early receiver saturation dur-
ing precipitation. KAZR data used in this study were taken
from the KAZR ARSCL (Active Remote Sensing of Clouds)
product from the ARM data archive (www.arm.gov/kazr).
This product provides cloud boundaries and best estimates
of time–height fields of radar moments. In this product,
the KAZR radar observations are corrected for water vapor
attenuation and velocity folding and non-significant (non-
hydrometeors) echoes are removed. The corrected KAZR
measurements along with the observations from the mi-
cropulse lidar (MPL), ceilometer, soundings, rain gauge, and
Atmos. Meas. Tech., 8, 3685–3699, 2015 www.atmos-meas-tech.net/8/3685/2015/

A. Chandra et al.: Automated rain rate estimates using the KAZR 3687
Figure 1. Top: aerial view of the radar triad on Addu Atoll (top) and AMF-2 instrument setup at Gan Island (bottom) during the DY-
NAMO/AMIE field campaign.
Table 1. Specifications of radars used in this study.
Radar wavelength/frequency Range, resolution Beamwidth, sensitivity Remarks
KAZR (8.66mm/35GHz) 15 km,30 m 0.3◦, −45 dBZ at 1 km Vertically pointing
S-PolKa (10 cm for S-band, 150 km, 150 m 0.91◦, −30 dBZ at 8.5 km Scanning: 8PPIs (0.5–11◦)
0.8 cm for Ka-band) 55 RHIs (0–45◦) 8.62 km apart from KAZR
SMART-R (5 cm) 150/300 km, 100 m 1.5◦, −21 dBZ at 10 km 25 PPIs (0.5–33◦)
RHI over KAZR 9.28 km from KAZR
microwave radiometer (MWR) are combined to provide two
data streams in the KAZR-ARSCL product: one with cloud
base and cloud layer boundaries, and the other including ad-
ditional best estimates of time–height fields of radar mo-
ments. Figure 2 shows an example of Doppler moments from
the KAZR and S-PolKa during a stratiform rain event. The
sharp gradients of reflectivity and Doppler velocity at∼ 5 km
indicate the presence of the melting layer. The loss of KAZR
reflectivity data corresponding to the heavy rain episodes
for the periods 01:00–02:00 and 04:00–05:00 UTC is due to
the total extinction of KAZR signals in rain compared to S-
PolKa.
The rain measuring surface-based instruments collocated
with the KAZR included an optical rain gauge (Short et
www.atmos-meas-tech.net/8/3685/2015/ Atmos. Meas. Tech., 8, 3685–3699, 2015

3688 A. Chandra et al.: Automated rain rate estimates using the KAZRH
eigh
t, km
dBZ(a)
0 2 4 6 8 100369
121518
− 40
− 20
0
20
40
Hei
ght,
km
dBZ(b)
0 2 4 6 8 100369
121518
− 40
− 20
0
20
40
Hei
ght,
Km
ms−1(c)
0 2 4 6 8 100369
121518
−8
−4
0
4
8
0 2 4 6 8 100
20
40
60
R, [
mm
h−1 ]
UTC time, Hour
(d)
Figure 2. An example of time series of reflectivity from KAZR (a),
reflectivity from S-PolKa (b), Doppler velocity from KAZR (c), and
surface rain rates from an optical rain-gauge (d). Positive Doppler
velocities in panel (c) represent downward velocities.
al., 1994) and a 2-dimensional video disdrometer (2-DVD).
This disdrometer provided measurements of size and veloc-
ity distributions of falling hydrometeors. It is comprised of
video cameras capable of observing individual hydrometeors
from two viewing directions, which are perpendicular to each
other. The 2-DVD disdrometer illuminates the hydrometeors
from two sides, which allows the determination of size and
fall velocity of particles. The rain rates are calculated from
the observed drop size distributions. The details of the in-
strument can be found in Kruger and Krajewski (2002). The
optical rain gauge provides rain rates. It has an uncertainty of
±0.1 mm h−1.
3 KAZR algorithm of rain rate retrieval
3.1 Retrieval algorithm
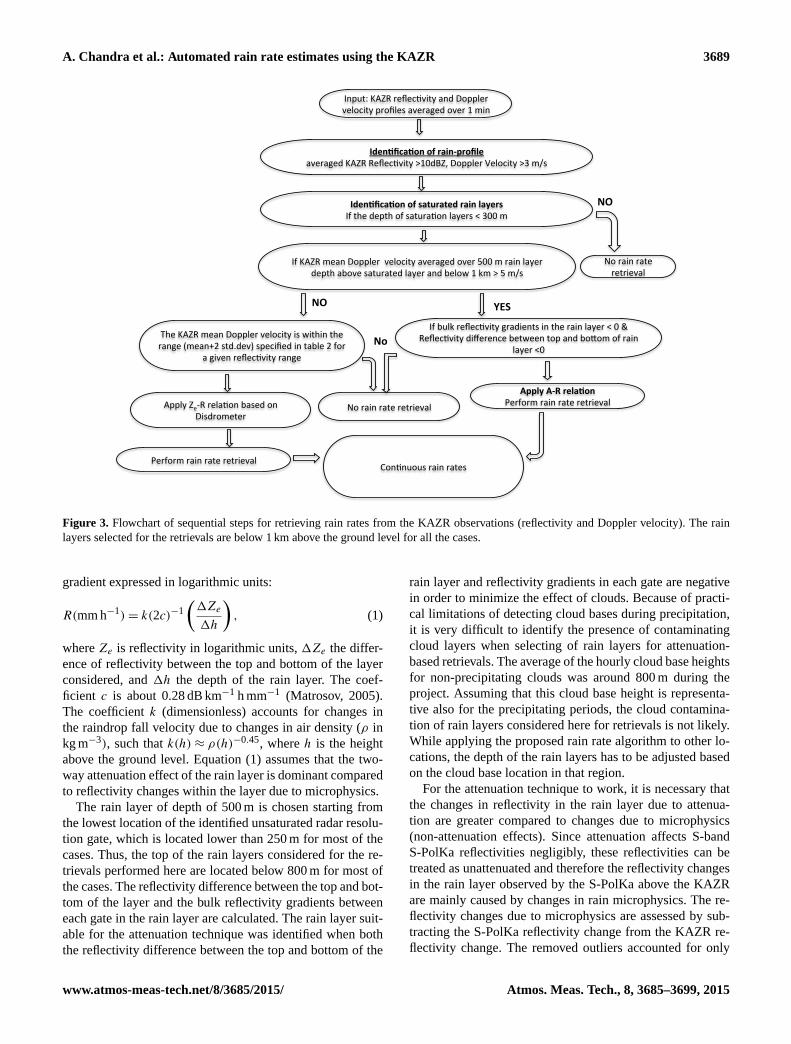
Figure 3 shows the flow chart that explains the steps taken
in retrieving the rain rate R using KAZR observations. The
reflectivity and Doppler velocities are averaged over 1 min,
to reduce the effect of vertical wind and wind drift effects.
The presence of rain in the profile is identified if the maxi-
mum reflectivity is greater than −10 dBZ. The rain aloft is
considered to reach the ground if the average radar reflectiv-
ity and mean Doppler velocity in the layer between 200 and
400 m a.g.l. (above ground level) exceed 10 dBZ and 3 m s−1,
respectively. In this study a total of 3149 rain cases (1 min)
with rain reaching the ground were identified.
The next algorithm step is to identify the portion of the
Ze profile that saturates the KAZR receiver. KAZR satura-
tion occurs at high rain rates where attenuation is the main
contributor to the observed Ze profile. Thus, it is anticipated
that the maximum reflectivity will be observed at the lowest
usable KAZR range gate, and subsequently Ze will decrease
with height due to signal attenuation. If the maximum Ze is
not observed at the first gate, the maximum radar reflectivity
in the lowest 1 km is searched. The rain layers below the first
maximum in reflectivity are not taken into account to avoid
the KAZR receiver saturation effects. Most of the observed
saturated layers are located below 300 m above ground level.
Out of the total 3149 rain cases identified, 51 have saturated
layer tops greater than 300 m and were excluded from the
rain retrieval.
All 1 min rain cases were classified into two main regimes:
rain events with dominant attenuation effects, and the rain
events with negligible attenuation effects. The automated al-
gorithm is implemented in two stages: the (i) attenuation
based technique and the (ii) Ze–R technique.
3.1.1 A–R based rain rate estimation
This section explains the details of the technique to retrieve
rain rates based on the amount of attenuation in the rain layer
at Ka-band. Matrosov (2005) demonstrated that at 35 GHz
there is a nearly linear relation between specific attenuation
(A) and R. The linearity of this relation and its low sensi-
tivity to the DSD details is explained by the fact that at Ka
band both A and R are approximately proportional to the
3.65th DSD moment (Matrosov et al., 2006). These authors
used this relation to retrieve layer–average rain rates from a
vertically pointing Ka-band radar and showed that relative
retrieval errors generally increase for lighter rainfall when
reflectivity changes due to attenuation become smaller com-
pared to vertical changes of non-attenuated reflectivity. An
important advantage of this attenuation-based method is that
the retrieval of the rain rate is independent of radar calibra-
tion as it does not depend on the absolute reflectivity values.
The mean layer rain rate is proportional to the reflectivity
Atmos. Meas. Tech., 8, 3685–3699, 2015 www.atmos-meas-tech.net/8/3685/2015/
A. Chandra et al.: Automated rain rate estimates using the KAZR 3689
Input: KAZR reflec0vity and Doppler velocity profiles averaged over 1 min
No rain rate retrieval
No rain rate retrieval
Iden%fica%on of saturated rain layers If the depth of satura0on layers < 300 m
If KAZR mean Doppler velocity averaged over 500 m rain layer depth above saturated layer and below 1 km > 5 m/s
Iden%fica%on of rain-‐profile averaged KAZR Reflec0vity >10dBZ, Doppler Velocity >3 m/s
The KAZR mean Doppler velocity is within the range (mean+2 std.dev) specified in table 2 for
a given reflec0vity range
Apply Ze-‐R rela0on based on Disdrometer
If bulk reflec0vity gradients in the rain layer < 0 & Reflec0vity difference between top and boVom of rain
layer <0
NO
YES
Apply A-‐R rela%on Perform rain rate retrieval
NO
No
Perform rain rate retrieval Con0nuous rain rates
Figure 3. Flowchart of sequential steps for retrieving rain rates from the KAZR observations (reflectivity and Doppler velocity). The rain
layers selected for the retrievals are below 1 km above the ground level for all the cases.
gradient expressed in logarithmic units:
R(mm h−1)= k(2c)−1
(1Ze
1h
), (1)
where Ze is reflectivity in logarithmic units, 1Ze the differ-
ence of reflectivity between the top and bottom of the layer
considered, and 1h the depth of the rain layer. The coef-
ficient c is about 0.28 dB km−1 h mm−1 (Matrosov, 2005).
The coefficient k (dimensionless) accounts for changes in
the raindrop fall velocity due to changes in air density (ρ in
kg m−3), such that k(h)≈ ρ(h)−0.45, where h is the height
above the ground level. Equation (1) assumes that the two-
way attenuation effect of the rain layer is dominant compared
to reflectivity changes within the layer due to microphysics.
The rain layer of depth of 500 m is chosen starting from
the lowest location of the identified unsaturated radar resolu-
tion gate, which is located lower than 250 m for most of the
cases. Thus, the top of the rain layers considered for the re-
trievals performed here are located below 800 m for most of
the cases. The reflectivity difference between the top and bot-
tom of the layer and the bulk reflectivity gradients between
each gate in the rain layer are calculated. The rain layer suit-
able for the attenuation technique was identified when both
the reflectivity difference between the top and bottom of the
rain layer and reflectivity gradients in each gate are negative
in order to minimize the effect of clouds. Because of practi-
cal limitations of detecting cloud bases during precipitation,
it is very difficult to identify the presence of contaminating
cloud layers when selecting of rain layers for attenuation-
based retrievals. The average of the hourly cloud base heights
for non-precipitating clouds was around 800 m during the
project. Assuming that this cloud base height is representa-
tive also for the precipitating periods, the cloud contamina-
tion of rain layers considered here for retrievals is not likely.
While applying the proposed rain rate algorithm to other lo-
cations, the depth of the rain layers has to be adjusted based
on the cloud base location in that region.
For the attenuation technique to work, it is necessary that
the changes in reflectivity in the rain layer due to attenua-
tion are greater compared to changes due to microphysics
(non-attenuation effects). Since attenuation affects S-band
S-PolKa reflectivities negligibly, these reflectivities can be
treated as unattenuated and therefore the reflectivity changes
in the rain layer observed by the S-PolKa above the KAZR
are mainly caused by changes in rain microphysics. The re-
flectivity changes due to microphysics are assessed by sub-
tracting the S-PolKa reflectivity change from the KAZR re-
flectivity change. The removed outliers accounted for only
www.atmos-meas-tech.net/8/3685/2015/ Atmos. Meas. Tech., 8, 3685–3699, 2015

3690 A. Chandra et al.: Automated rain rate estimates using the KAZR
−40 −20 0 20 400
2
4
6
8
10
Hei
ght [
km M
SL]
S−Polka Reflectivity [dBZ]−40 −20 0 20 400
2
4
6
8
10
Hei
ght [
km M
SL]
KAZR Reflectivity [dBZ]
0 mm/hr
0.01mm/hr
0.1mm/hr
1 mm/hr
5 mm/hr
10 mm/hr
100mm/hr
(a) (b)
Figure 4. Illustration of rain-rate retrieval under a stratiform rain condition. (a) Reflectivity profiles of the S-PolKa for different rain rates.
(b) Reflectivity profile of the KAZR for different rain-rates.
Figure 5. Scatter plots of rain rates (R) observed from a video disdrometer vs. KAZR reflectivity values (Ze) averaged over a rain layer
depth of 500 m as a function of KAZR Doppler velocities. (a) Before correction; (b) after constraining from Doppler velocity. The rain rates
and KAZR reflectivity values corresponding to the KAZR Doppler velocities up to 5 m s−1 are only considered. The correlation coefficient
and root mean square error before and after the correction are (0.495 vs. 0.606) and (1.672 vs. 1.549), respectively.
118 out of 3098 total rain cases (i.e., 1 min rain profiles) iden-
tified in this study. For the selected profiles (2980 cases), the
reflectivity changes due to microphysics were accounted for
in the rain layer by subtracting the reflectivity change due
to non-attenuation from the reflectivity change due to atten-
uation. For most rain cases considered here, the reflectivity
changes due to attenuation were larger than those due mi-
crophysical changes by a factor of about 3–4 if the mean
layer vertical Doppler velocity (DV) values in this layer were
greater than 5 m s−1. Figure 4a and b show the profiles of re-
flectivity from the KAZR and S-PolKa as a function of sur-
face rain rates from the optical rain gauge. For rain rates
>∼ 1 mm h−1, the KAZR shows lower reflectivity values
compared to the S-PolKa (Fig. 4a), which is due to the atten-
uation and Mie effects for large drops at the Ka-band. The re-
flectivity profiles from both KAZR and S-PolKa attain max-
ima around 4.5 km, which is due to the melting layer. For
higher rain rates, reflectivity profiles from the KAZR have
sharp gradients in the lower layers, which is mainly due to
attenuation in the rain layer.
3.1.2 Ze–R based rain rate estimation
Here we describe a procedure to retrieve lighter rain rates
based on the KAZR reflectivity measurements by apply-
ing the Ze–R relation computed from the disdrometer at
Ka-band. Compared to high rain rates, radar signals in low
rain rate precipitation are affected by attenuation less signifi-
cantly. Thus, the absolute reflectivities during lighter rainfall
can be used to infer rain rates. Here, Doppler velocity is used
to separate lighter rain by selecting a threshold of 5 m s−1.
The justification for the chosen threshold is discussed later.
Figure 5a shows KAZR reflectivity values (averaged over a
500 m rain layer) and rain rates from the 2-DVD disdrom-
eter corresponding to the Doppler velocities up to 5 m s−1.
Reflectivity values exhibit skill for implementing a Ze–R re-
lation, though there is considerable scatter. The non-linear
Atmos. Meas. Tech., 8, 3685–3699, 2015 www.atmos-meas-tech.net/8/3685/2015/

A. Chandra et al.: Automated rain rate estimates using the KAZR 3691
Table 2. Statistics on data sample reduction, and mean and standard deviation of the Doppler velocity (DV) used to constrain the Ze–R
relation as shown in Fig. 6. Outliers are removed for the Doppler velocities that are larger than the Doppler velocity bound (mean± 2 SD)
for each reflectivity bin.
Reflectivity range (mm6 m−3) 1–5 5–10 10–50 50–100 100–500 500–1000
Total no. of samples 307 264 714 228 266 50
No. of outliers 48 59 169 47 64 11
Mean DV (m s−1) 3.63 4.21 4.46 4.3 4.46 4.6
1 SD (m s−1) 0.53 0.40 0.36 0.43 0.40 0.34
effects of evaporation might have on the Ze–R relation is to
widen the Ze–R bound, which results in large errors in the
retrieved rain rates. The increase in Doppler velocities with
rain rates provides an additional constraint to remove some of
these outliers and refine theZe–R relation. For each reflectiv-
ity bin, the Doppler velocities have been sorted in an ascend-
ing manner and threshold bounds are defined by considering
the mean and twice the standard deviation of Doppler veloc-
ities. The reflectivity values were removed if corresponding
Doppler velocities in each bin exceeded the threshold bound
(mean ±2 SD). The reduction in number of data samples af-
ter applying the Doppler velocity constraint, and the thresh-
olds (mean and SD) used for different reflectivity bins are
listed in Table 2. Figure 5b shows the refined Ze–R relation
after using Doppler velocities as a constraint. After apply-
ing the constraint, the correlation coefficient increased from
0.495 to 0.606, and root mean square error (RMSE) is re-
duced from 1.672 to 1.549. The Ka-band reflectivity values
were computed from DSDs obtained from a video disdrom-
eter using Mie calculations (Bohren and Hufman, 1983) as
Zeh = λ4π−5
∣∣∣∣ (m2w+ 2)
(m2w− 1)
∣∣∣∣2∑i
〈σh(Dei)〉ni(Dei), (2)
where mw is the complex refractive index of water, σh(Dei)
the Mie backscatter cross section, ni(Dei) the drop concen-
tration in ith diameter (Dei) bin of the disdrometer, and the
summation is performed over the disdrometer size bins. The
Ze–R relation based on KAZR observed reflectivity is com-
pared with the computed reflectivity values using disdrom-
eter data by fitting the power law (of the form R = aZbe )
(Fig. 6). The Ze–R relations were derived as in Martner et
al. (2008) using a power-law regression approach (i.e., the
linear regression in the logarithmic units of log (Ze) and
log(R), with log (Ze) being an independent variable).
This approach provides a better representation of lighter
rainfall for which absolute values of KAZR reflectivity are
used to estimate R. While deriving the Ze–R relation, a
lower cutoff threshold of R > 0.01 mm h−1 was employed
as a tradeoff to eliminate lighter rain rate (and correspond-
ing Ze) points which are possibly noise contaminated and
increase the sample size at the lower rain rate spectrum. The
coefficients (A= (1/a)1/b) and exponents (B = 1/b) of the
proposed Ze–R relations from the KAZR and disdrometer
100
101
102
103
10−4
10−2
100
102
Reflectivity [mm6m−3]
KAZRDisdrometer
Figure 6. Comparison of Ze–R relationships based on the KAZR
reflectivity, and computed reflectivity’s at the Ka-band using dis-
drometer data. The green and magenta dashed lines indicate power
laws (RR= aZb, where a and b are coefficient and exponent) fitted
to the KAZR and disdrometer data, respectively. For the green line,
a = 0.0112 and b = 0.8469. For the magenta line are a = 0.0267
and b = 0.664.
for stratiform and convective rain regimes are summarized
in Table 3. The coefficient and exponents for the convective
rain events derived from both KAZR and disdrometer data
sets are slightly higher compared to stratiform rain events,
and they are slightly lower for the KAZR compared to the
disdrometer. For reflectivity range (up to 500 mm6 m−3), the
KAZR rain rates are slightly lower compared to the disdrom-
eter for a given reflectivity. Whereas, for the higher reflectiv-
ities (above 500 mm6 m−3), the KAZR reflectivities matches
closely with the disdrometer values. The underestimate of the
rain rates corresponds to the KAZR reflectivity range (up to
500 mm6 m−3) may be attributed to the reflectivity attenua-
tion due to antenna/radome wetting, which we have not ac-
counted in this study. The coefficients and exponents derived
from this study are with in the range between 75 and 300 and
1.2 and 2.0 used in the operationalZe–R relations. The expo-
www.atmos-meas-tech.net/8/3685/2015/ Atmos. Meas. Tech., 8, 3685–3699, 2015

3692 A. Chandra et al.: Automated rain rate estimates using the KAZR
Table 3. Coefficients (a, A) and exponents (b, B) in Z–R relations derived from disdrometer and the KAZR for convective and stratiform
rain events.
Disdrometer KAZR
Total Stratiform Convective Total Stratiform Convective
a 0.0267 0.0240 0.0366 0.0112 0.0094 0.0192
b 0.664 0.6847 0.6049 0.8469 0.901 0.7355
A= (1/a)(1/b) 233.76 232.21 236.64 202.07 177.03 215.80
B = 1/b 1.50 1.46 1.65 1.18 1.11 1.35
nent from the KAZR relation is slightly smaller (B = 1.18)
compared to the values (B = 1.3−1.4) derived previously by
Tokay et al. (2009) who used vertically pointing S- and Ka-
band radars with a collocated disdrometer. This can be at-
tributed to the effect of attenuation for low rain rates, which
is assumed to be negligible in the proposed Ze–R relation
based on the KAZR.
3.2 Choosing Doppler velocity threshold to separate
rain regimes
This section explains the basis for selecting a Doppler ve-
locity threshold to separate two rain retrieval methods and
sensitivity of the chosen Doppler velocity threshold on the
overall performance of the rain rate retrieval.
The development of an automated Ka-band radar algo-
rithm for the rain rate depends on the proper identification
of the dominant mechanisms that control the profile of radar
reflectivity Ze, (dBZ: decibels of mm6 m−3) and its gradient1Ze1h
(dB km−1), where h is height. In light rain, the evolu-
tion of the drop size distribution (DSD) via different micro-
physical processes (accretion above the cloud base, evapo-
ration below the cloud base) has a non-negligible impact on
the profile of radar reflectivity Ze. In this case, the use of
specific attenuation A (dB km−1) estimates for rain rate re-
trievals can lead to larger errors (Matrosov, 2005) and the
rain rate R should be estimated from attenuation-corrected
reflectivity values using a proper Ze–R relation.
Given that reflectivities are corrected for gaseous attention,
the vertical gradient of radar reflectivity in the liquid hydrom-
eteor layer can be expressed as
1ZedBZ
1h=−2(Ar+Ac)+
1ZedBZ
1h
∣∣∣∣PRC
, (3)
where Ar and Ac are the one-way specific attenuations by
rain liquid water and cloud respectively, and1ZedBZ
1h
∣∣∣PRC
is
the induced vertical gradient of the reflectivity due to two mi-
crophysical processes (e.g., accretion above the cloud base
and evaporation below the cloud base) during the liquid
precipitation (PRC). In this study, a simple 1-dimensional
steady state microphysical model that accounts for accretion
of cloud droplets and raindrop evaporation below the cloud
base is used to investigate the sensitivity of1ZedBZ
1hto ei-
ther microphysical processes or radar signal attenuation by
clouds and rain. A full bin-resolving microphysical calcula-
tions form the model. The raindrop population at the upper
levels is assumed to follow the three-parameter DSD rep-
resented by two-parameter normalized gamma function and
concentration parameter (Illingworth and Blackman, 2002):
N(D)=
[Nw · 0.033 · (3.67+µ)µ+4
0(µ+ 4)
(D
Do
)µ](4)
· exp
[−(3.67+µ)
D
Do
],
where N(D) is the drop concentration (m−3), Nw is the nor-
malized intercept (m−3 mm−1) and µ is the shape param-
eter. Do is the median volume diameter. 501 raindrop size
bins, regularly spaced, represent the DSD extending up to
equivalent drop diameter of 6 mm. This equation reduces to
N(D)=No · exp(−λD) for µ= 0.
A combination of three values of the shape parameter µ
and four values of the normalized concentration parameter
Nw are used here for modeling. The parameterization of the
microphysical processes (including sedimentation, accretion
and evaporation) is drop size dependent and can be used to
simulate liquid precipitation ranging from very light driz-
zle to heavy rainfall. The profiles of temperature, vertical air
motion and relative humidity in the subcloud layer, and liq-
uid water content in the cloud layer are fixed with no feed-
back from microphysical processes. This is because the mi-
crophysical processes (accretion and evaporation) that mod-
ify raindrop sizes conserve the raindrop flux with respect to
number concentration (neglecting eventual complete evapo-
ration of smallest rain drops), which results in vertical gradi-
ent of unattenuated reflectivity independent of the DSD con-
centration parameter. It is assumed that besides sedimenta-
tion, accretion and evaporation are the only active processes.
The details of the parameterization of accretion and evapora-
tion in the model are described in Kollias et al. (2011).
Figure 7 shows the model vertical gradient of reflectivity
due to accretion, evaporation and attenuation by neglecting
the vertical air motion. Thus, the Doppler velocity represents
the reflectivity-weighted velocity of raindrop population. In
these conditions, the computations shown in Fig. 7 can be
representative for any type of rainfall. Above the cloud base,
Atmos. Meas. Tech., 8, 3685–3699, 2015 www.atmos-meas-tech.net/8/3685/2015/

A. Chandra et al.: Automated rain rate estimates using the KAZR 3693
Figure 7. Theoretical curves of the reflectivity gradients vs. the
Doppler velocities at the Ka-band frequency for different rain pa-
rameters. Nw and µ are normalized intercept and shape parameters
of the gamma-function distribution. The solid lines (above zero) in-
dicate reflectivity gradient changes due to evaporation on raindrops
for various Doppler velocities assuming RH= 80 %. The dotted and
dashed lines (above zero) indicate changes in reflectivity gradients
due to attenuation from raindrops for various Doppler velocities.
The solid lines below zero indicate reflectivity gradient changes due
to accretion above the cloud base. Different line colors indicate rain
drop size distributions with different shape parameters, while line
types indicate different normalized intercept parameters.
a cloud liquid water content amount of 0.2 g m−3 is assumed
to be constant with height to estimate the change in the verti-
cal gradient of the radar reflectivity due to accretion. Below
the cloud base, a relative humidity of 80 % is assumed to in-
vestigate the impact of evaporation on the observed vertical
gradient of the radar reflectivity.
As expected, for mean Doppler velocity less than about
5 m s−1, the microphysical processes that can affect the evo-
lution of the rain DSD with height are the main contributors
to the observed vertical gradient of the radar reflectivity. At
mean Doppler velocities higher than 5 m s−1, attenuation is
the primary contributor to the observed Ze profile and can
be used to extract the rain rate. All the calculations for rain-
drops pertinent to Fig. 7 are done using the Mie theory with
accounting for rain attenuation. The attenuation by liquid wa-
ter cloud is proportional to the cloud liquid water content
with the proportionality factor being temperature-dependent
(Matrosov et al., 2004). The cloud liquid attenuation is typi-
cally much smaller than that of rain for moderate and higher
rain rates. A variable correction for attenuation due to oxy-
gen and water vapor (Liebe et al., 1991) was implemented in
the model calculations using the sounding data.
KAZR-based rain rate retrievals suggested here imply the
use of two techniques for the two categories of rain rates.
For low rain rate cases, which are characterized by Doppler
velocities of equal or less than 5 m s−1, the Ze–R rela-
tion is applied. For rainfall with DV exceeding 5 m s−1, the
attenuation-based technique is applied. Though choosing a
DV threshold of 5 m s−1 based on 1-dimensional microphys-
ical model results would seem to be a reasonable choice for
separating two regimes (A–R andZe–R), they are not clearly
separated in Fig. 7. This may lead to different retrievals for
different selection of the DV threshold. Therefore, the sensi-
tivity of choosing different thresholds on rain rates retrieved
from both the Ze–R and A–R (for DV > DVthreshold) tech-
niques are tested for different Doppler velocity thresholds
(3, 5, and 7 m s−1). For each set of selected Doppler veloc-
ity thresholds, A–R technique is applied for DV > DVthreshold
and the Ze–R relations based on the disdrometer and the
KAZR are separately applied for DV <=DVthreshold. The re-
trieved rain rates from the KAZR are compared with the
observed rain rates from the optical rain gauge (Fig. 8).
It was found that the correlation coefficient between rain
gauge and KAZR retrieved rain rates marginally increase
from 0.56 to 0.70 for an increase in Doppler velocity thresh-
old from 3 to 5 m s−1, and then slightly decreases (0.70 and
0.66) for higher Doppler velocity threshold. For the same
Doppler velocity threshold (DV= 5 m s−1), the correlation
coefficient between rain rates retrieved from the KAZR im-
proved marginally from 0.62 to 0.7 for Ze–R based on dis-
drometer compared to the one based on the KAZR. This con-
firms that the Doppler velocity threshold of 5 m s−1 might be
a logical choice for separating the two regimes with domi-
nant microphysical effects and dominant attenuation effects
for applying Ze–R and A–R techniques respectively.
4 Rain rates and rain amount
4.1 Rain rate comparison
Applying the disdrometer-based Ze–R relation and A–R
techniques in two stages retrieves the continuous rain rates
from the KAZR. Figure 9 compares the time series of re-
trieved rain rates from the KAZR with that based on the rain
gauge measurement at 1 min resolution. The comparison of
the time series is separately shown for the stratiform and con-
vective rain events (Fig. 9a). Given the rudimentary treatment
of the uncertainties in this study, the good agreement of the
trend justifies the scope to use the KAZR measurements for
continuous retrievals of rain rates. The time series are further
separated based on the method used to derive the rain rates
(Fig. 9b). The agreement of the rain rates retrieved from the
A–R method are slightly better compared to the rain rates
derived from the Ze–R method. Some of the underestimated
www.atmos-meas-tech.net/8/3685/2015/ Atmos. Meas. Tech., 8, 3685–3699, 2015

3694 A. Chandra et al.: Automated rain rate estimates using the KAZR
Figure 8. Scatter plot of observed rain rates from an optical gauge vs. rain rates retrieved from the KAZR using the Ze–R relations developed
from the disdrometer (a–c) and the KAZR (d–f) for different Doppler velocity thresholds (DVthresh). The samples covering 15 days of rain
events between 8 October 2011 and 6 February 2012. Rain rates from the KAZR are retrieved using both Ze–R (for DV <=DVthresh) and
A–R (for DV > DVthresh) methods for different Doppler velocity thresholds (3, 5, and 7 m s−1) shown in the legend. The Ze–R relations
are applied separately for the stratiform and convective rain events. The list of Ze–R coefficients and exponents for different rain types are
summarized in Table 3.
Figure 9. Time series of 1 min averaged rain rates from the KAZR and a rain gauge covering 15 days of rain events between 8 October 2011
and 6 February 2012. (a) Rain rates are separated based on the regime type: stratiform (up to 1614 min) and convective (1615–2168 min) rain
cases. (b) Rain rates are separated based on the method used to derive rain rates: Ze–R relationship (for DV <= 5 m s−1; up to 1344 min)
and A–R relationship (for DV > 5 m s−1; 1345–2168 min).
Atmos. Meas. Tech., 8, 3685–3699, 2015 www.atmos-meas-tech.net/8/3685/2015/
A. Chandra et al.: Automated rain rate estimates using the KAZR 3695
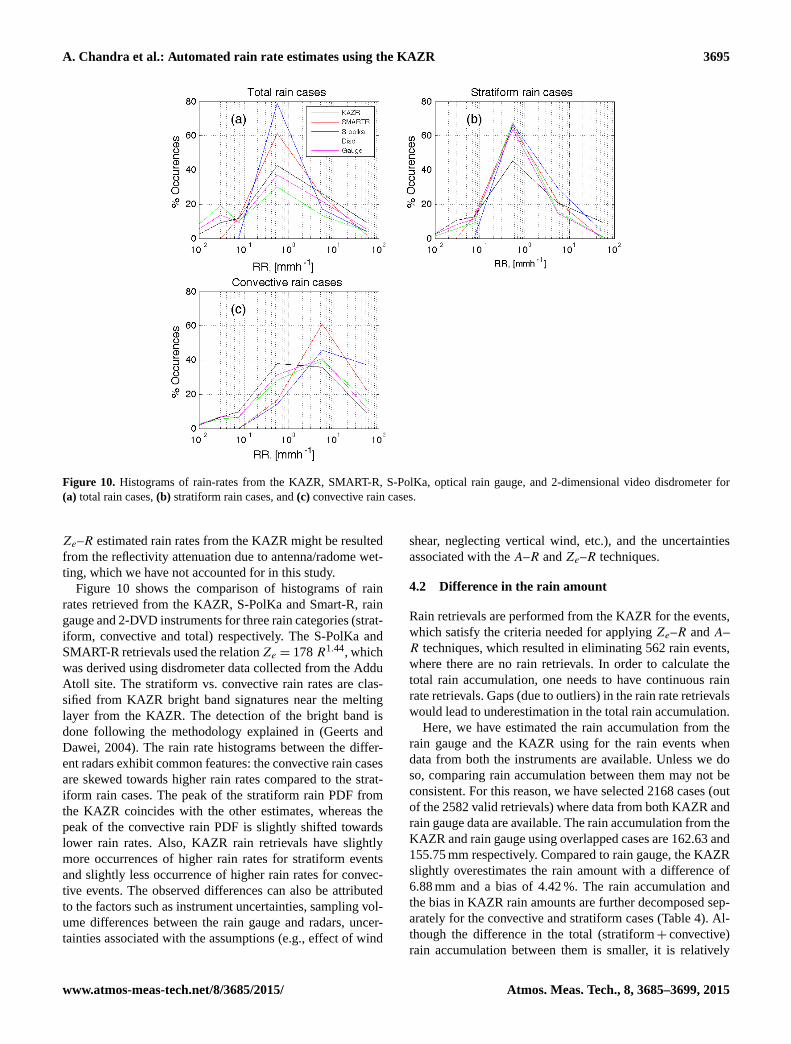
Figure 10. Histograms of rain-rates from the KAZR, SMART-R, S-PolKa, optical rain gauge, and 2-dimensional video disdrometer for
(a) total rain cases, (b) stratiform rain cases, and (c) convective rain cases.
Ze–R estimated rain rates from the KAZR might be resulted
from the reflectivity attenuation due to antenna/radome wet-
ting, which we have not accounted for in this study.
Figure 10 shows the comparison of histograms of rain
rates retrieved from the KAZR, S-PolKa and Smart-R, rain
gauge and 2-DVD instruments for three rain categories (strat-
iform, convective and total) respectively. The S-PolKa and
SMART-R retrievals used the relationZe = 178 R1.44, which
was derived using disdrometer data collected from the Addu
Atoll site. The stratiform vs. convective rain rates are clas-
sified from KAZR bright band signatures near the melting
layer from the KAZR. The detection of the bright band is
done following the methodology explained in (Geerts and
Dawei, 2004). The rain rate histograms between the differ-
ent radars exhibit common features: the convective rain cases
are skewed towards higher rain rates compared to the strat-
iform rain cases. The peak of the stratiform rain PDF from
the KAZR coincides with the other estimates, whereas the
peak of the convective rain PDF is slightly shifted towards
lower rain rates. Also, KAZR rain retrievals have slightly
more occurrences of higher rain rates for stratiform events
and slightly less occurrence of higher rain rates for convec-
tive events. The observed differences can also be attributed
to the factors such as instrument uncertainties, sampling vol-
ume differences between the rain gauge and radars, uncer-
tainties associated with the assumptions (e.g., effect of wind
shear, neglecting vertical wind, etc.), and the uncertainties
associated with the A–R and Ze–R techniques.
4.2 Difference in the rain amount
Rain retrievals are performed from the KAZR for the events,
which satisfy the criteria needed for applying Ze–R and A–
R techniques, which resulted in eliminating 562 rain events,
where there are no rain retrievals. In order to calculate the
total rain accumulation, one needs to have continuous rain
rate retrievals. Gaps (due to outliers) in the rain rate retrievals
would lead to underestimation in the total rain accumulation.
Here, we have estimated the rain accumulation from the
rain gauge and the KAZR using for the rain events when
data from both the instruments are available. Unless we do
so, comparing rain accumulation between them may not be
consistent. For this reason, we have selected 2168 cases (out
of the 2582 valid retrievals) where data from both KAZR and
rain gauge data are available. The rain accumulation from the
KAZR and rain gauge using overlapped cases are 162.63 and
155.75 mm respectively. Compared to rain gauge, the KAZR
slightly overestimates the rain amount with a difference of
6.88 mm and a bias of 4.42 %. The rain accumulation and
the bias in KAZR rain amounts are further decomposed sep-
arately for the convective and stratiform cases (Table 4). Al-
though the difference in the total (stratiform+ convective)
rain accumulation between them is smaller, it is relatively
www.atmos-meas-tech.net/8/3685/2015/ Atmos. Meas. Tech., 8, 3685–3699, 2015
3696 A. Chandra et al.: Automated rain rate estimates using the KAZR
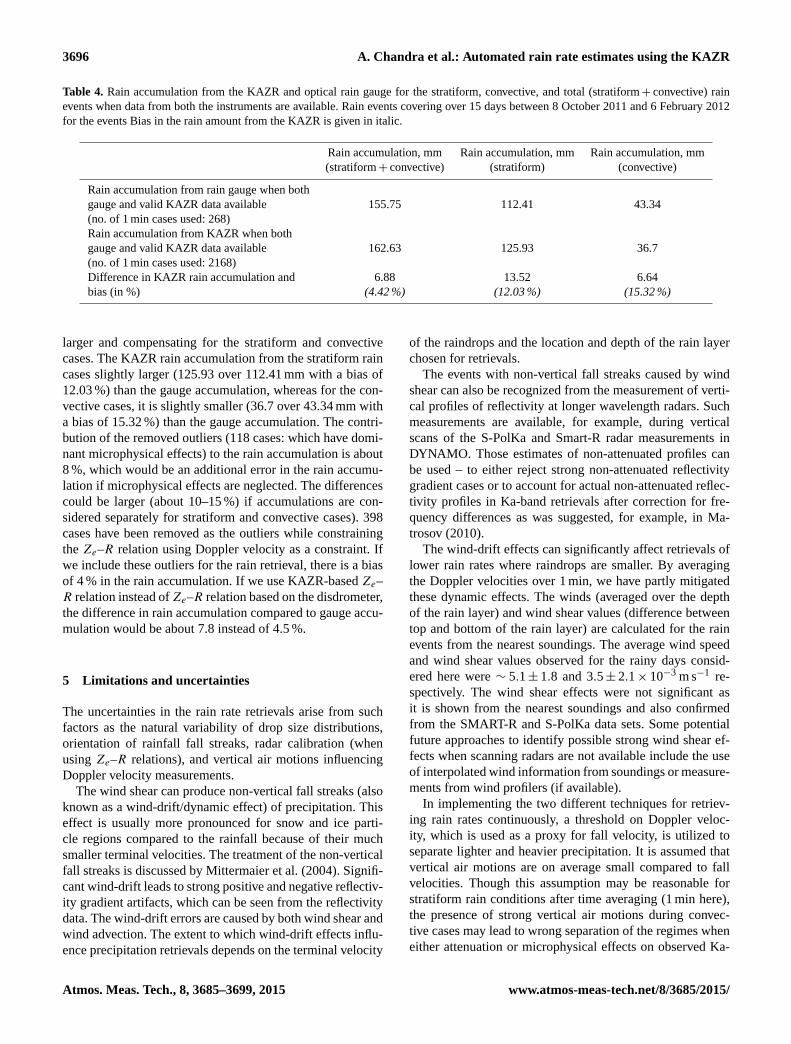
Table 4. Rain accumulation from the KAZR and optical rain gauge for the stratiform, convective, and total (stratiform+ convective) rain
events when data from both the instruments are available. Rain events covering over 15 days between 8 October 2011 and 6 February 2012
for the events Bias in the rain amount from the KAZR is given in italic.
Rain accumulation, mm Rain accumulation, mm Rain accumulation, mm
(stratiform+ convective) (stratiform) (convective)
Rain accumulation from rain gauge when both
gauge and valid KAZR data available 155.75 112.41 43.34
(no. of 1 min cases used: 268)
Rain accumulation from KAZR when both
gauge and valid KAZR data available 162.63 125.93 36.7
(no. of 1 min cases used: 2168)
Difference in KAZR rain accumulation and 6.88 13.52 6.64
bias (in %) (4.42 %) (12.03 %) (15.32 %)
larger and compensating for the stratiform and convective
cases. The KAZR rain accumulation from the stratiform rain
cases slightly larger (125.93 over 112.41 mm with a bias of
12.03 %) than the gauge accumulation, whereas for the con-
vective cases, it is slightly smaller (36.7 over 43.34 mm with
a bias of 15.32 %) than the gauge accumulation. The contri-
bution of the removed outliers (118 cases: which have domi-
nant microphysical effects) to the rain accumulation is about
8 %, which would be an additional error in the rain accumu-
lation if microphysical effects are neglected. The differences
could be larger (about 10–15 %) if accumulations are con-
sidered separately for stratiform and convective cases). 398
cases have been removed as the outliers while constraining
the Ze–R relation using Doppler velocity as a constraint. If
we include these outliers for the rain retrieval, there is a bias
of 4 % in the rain accumulation. If we use KAZR-based Ze–
R relation instead ofZe–R relation based on the disdrometer,
the difference in rain accumulation compared to gauge accu-
mulation would be about 7.8 instead of 4.5 %.
5 Limitations and uncertainties
The uncertainties in the rain rate retrievals arise from such
factors as the natural variability of drop size distributions,
orientation of rainfall fall streaks, radar calibration (when
using Ze–R relations), and vertical air motions influencing
Doppler velocity measurements.
The wind shear can produce non-vertical fall streaks (also
known as a wind-drift/dynamic effect) of precipitation. This
effect is usually more pronounced for snow and ice parti-
cle regions compared to the rainfall because of their much
smaller terminal velocities. The treatment of the non-vertical
fall streaks is discussed by Mittermaier et al. (2004). Signifi-
cant wind-drift leads to strong positive and negative reflectiv-
ity gradient artifacts, which can be seen from the reflectivity
data. The wind-drift errors are caused by both wind shear and
wind advection. The extent to which wind-drift effects influ-
ence precipitation retrievals depends on the terminal velocity
of the raindrops and the location and depth of the rain layer
chosen for retrievals.
The events with non-vertical fall streaks caused by wind
shear can also be recognized from the measurement of verti-
cal profiles of reflectivity at longer wavelength radars. Such
measurements are available, for example, during vertical
scans of the S-PolKa and Smart-R radar measurements in
DYNAMO. Those estimates of non-attenuated profiles can
be used – to either reject strong non-attenuated reflectivity
gradient cases or to account for actual non-attenuated reflec-
tivity profiles in Ka-band retrievals after correction for fre-
quency differences as was suggested, for example, in Ma-
trosov (2010).
The wind-drift effects can significantly affect retrievals of
lower rain rates where raindrops are smaller. By averaging
the Doppler velocities over 1 min, we have partly mitigated
these dynamic effects. The winds (averaged over the depth
of the rain layer) and wind shear values (difference between
top and bottom of the rain layer) are calculated for the rain
events from the nearest soundings. The average wind speed
and wind shear values observed for the rainy days consid-
ered here were ∼ 5.1± 1.8 and 3.5± 2.1× 10⁻³ m s−1 re-
spectively. The wind shear effects were not significant as
it is shown from the nearest soundings and also confirmed
from the SMART-R and S-PolKa data sets. Some potential
future approaches to identify possible strong wind shear ef-
fects when scanning radars are not available include the use
of interpolated wind information from soundings or measure-
ments from wind profilers (if available).
In implementing the two different techniques for retriev-
ing rain rates continuously, a threshold on Doppler veloc-
ity, which is used as a proxy for fall velocity, is utilized to
separate lighter and heavier precipitation. It is assumed that
vertical air motions are on average small compared to fall
velocities. Though this assumption may be reasonable for
stratiform rain conditions after time averaging (1 min here),
the presence of strong vertical air motions during convec-
tive cases may lead to wrong separation of the regimes when
either attenuation or microphysical effects on observed Ka-
Atmos. Meas. Tech., 8, 3685–3699, 2015 www.atmos-meas-tech.net/8/3685/2015/
A. Chandra et al.: Automated rain rate estimates using the KAZR 3697
band reflectivity profiles are dominant. The simultaneous re-
trieval of precipitation parameter and vertical velocity from
Doppler radar spectra using VHF profiler data is discussed in
Wakasugi et al. (1986). Since DYNAMO offers no such setup
for combined retrievals of precipitation and vertical velocity,
no treatment of vertical wind was considered in the present
study.
Another issue that needs careful assessment is the vari-
ability, correction and representativeness of the Ze–R rela-
tion proposed in this study. The present study proposed a
Ze–R relation for the Ka-band using Doppler velocity as a
constraint. Though the rain rate correction is proposed to ac-
count for attention when the Ze–R relation is used for re-
trievals, its practical implementation to other regions, sea-
sons and different rain conditions needs to be tuned and the
deviations resulted from the radar calibration needs to be ac-
counted. The attenuation of the reflectivity at Ka-band when
the radome/antenna is wet is not non-negligible and not ac-
counted for in this study. This results in some of the Ze–R
based rain estimates being substantially underestimated. To
refine the methodology and improve the corrections proposed
here further investigations using previous field experimental
data sets and/or collocated Ka-band and precipitation radar
observations is required.
6 Summary and conclusions
An automated algorithm is developed to retrieve rain rates
from vertically pointing Ka-band radar measurements. To
the best knowledge of the authors, this is first attempt to ex-
tend KAZR observations for routine rain rate retrievals. The
proposed algorithm uses two different methods for estimat-
ing rain rates. For high Doppler velocities (DV > 5 m s−1,
the A–R relation is applied. For lower Doppler veloci-
ties (DV <= 5 m s−1), the Ze–R relation is applied. A 1-
dimensional microphysical model that accounts for the mi-
crophysical processes of accretion and evaporation, and radar
attenuation due to liquid is used to infer the criteria for deter-
mining if microphysics or attenuation controls the observed
vertical profiles of KAZR reflectivity. Ze–R relations based
on the KAZR and disdrometer data at Ka-band is proposed.
The proposed algorithm is applied to 4 months of KAZR ob-
servations collected during the deployment of the ARM Mo-
bile Facility during the DYNAMO/AMIE field campaign.
Collocated observations from the S-PolKa radar is used
to identify the rainy profiles where microphysical effects are
dominant over rain layer attenuation effects. Out of 3149 rain
cases, 118 had dominant microphysical effects during the pe-
riod of observations. Failing to separate them would result in
the bias of 8 % in the total rain amount in addition to the dif-
ference contributing from the outliers and also due to uncer-
tainty in the rain retrieval technique. Bias in the total rain ac-
cumulation would slightly larger (∼ 7.8 %) if we use KAZR-
based Ze–R relation compared to Ze–R relation based on
the disdrometer (4.5 %). Compared to rain gauge, the rain
amount from the KAZR slightly overestimates with a differ-
ence of 6.88 mm and a bias of 4.42 %. By separating the con-
tributions of total rain accumulation into stratiform and con-
vective rain accumulations, it was found that the stratiform
rain accumulation from the KAZR is slightly larger (125.93
over 112.41 mm) gauge accumulation, whereas the convec-
tive rain accumulation from the KAZR is slightly smaller
(36.7 over 43.34 mm) compared to the gauge accumulation.
The KAZR retrieved rain rate time series are compared
with the nearby surface rain gauge measurements. The com-
parison shows a good agreement. The statistics of the KAZR
retrieved rain rates, observed rain rates from the gauge
and disdrometer, and those derived from the S-PolKa and
SMART-R data are decomposed for stratiform, convective,
and total rain events. The peak of the stratiform rain rate
PDF from the KAZR coincides with the other measurements,
whereas the peak of the convective rain PDF is slightly
shifted towards lower rain rates. Also, KAZR rain retrievals
have slightly more occurrences of higher rain rates for strat-
iform events and slightly less occurrence of higher rain rates
for convective events.
The present study sets a framework for retrieving rainfall
rates from vertically pointing Ka-band radars using an algo-
rithm with a physical basis. This algorithm will be applied
to retrieve rain rates at the other ARM sites to study shal-
low to deep convection transitions and related microphysical
processes.
Given that the Ka-band radars are deployed at many per-
manent and mobile facilities as part of the ARM program
throughout the world and also at several research institu-
tions in Europe (e.g., MIRA-36 cloud radars), such estimates
would be useful in future applications especially for obser-
vational sites when retrievals from more conventional ap-
proaches that utilize lower frequency (e.g., X-, C-, or S-band)
scanning radar measurements are unavailable or limited in
time or vertical resolution (e.g., due to remoteness of scan-
ning radar locations).
Though we have focused our study on retrieving only
layer-average rain rates, it has the potential scope for pro-
viding vertically resolved information, which is one of the
potential advantages of using zenith-looking radar compared
to more direct ground based sensor estimates from gauge
or disdrometer. The presented technique will be applied to
other ARM sites (Manus, Darwin and Southern Great Plains)
where there is KAZR and surface rain observations are avail-
able.
www.atmos-meas-tech.net/8/3685/2015/ Atmos. Meas. Tech., 8, 3685–3699, 2015

3698 A. Chandra et al.: Automated rain rate estimates using the KAZR
Acknowledgements. We would like to thank Zhe Feng from Pacific
Northwest National Laboratory for sharing the merged radar data
for the DYNAMO period. This study was supported by DOE ASR
Grant ER65283.
Edited by: M. Portabella
References
Aydin, K. and Daisley, S. E. A.: Relationships between rainfall rate
and 35 GHz attenuation and differential attenuation: modeling
the effects of raindrop size distribution, canting, and oscillation,
IEEE T. Geosci. Remote, 40, 2343–2351, 2002.
Bohren, C. F. and Huffman, D. R.: Absorption and Scattering of
Light by Small Particles, Wiley, New York, USA, 530 pp., 1983.
Feng, Z., McFarlane, S. A., Schumacher, C., Ellis, S., and Bharad-
waj, N.: Constructing a merged cloud-precipitation radar dataset
for tropical convective clouds during the DY- NAMO/AMIE Ex-
periment at Addu Atoll, J. Atmos. Ocean. Technol., 31, 1021–
1042, doi:10.1175/JTECH-D-13-00132.1, 2014.
Geerts, B. and Dawei, Y.: Classification and characterization of
tropical precipitation based on high-resolution airborne vertical
incidence radar, Part I: Classification, J. Appl. Meteorol., 43,
1554–1566, 2004.
Huffman, G. J., Bolvin, D. T., Nelkin, E. J., Wolff, D. B., Adler, R.
F., Gu, G., Hong, Y., Bowman, K. P., and Stocker, E. F.: The
TRMM Multisatellite Precipitation Analysis (TMPA): quasi-
global, multiyear, combined-sensor precipitation estimates at
fine scales, J. Hydrometeorol., 8, 38–55, 2007.
Illingworth, A. J. and Blackman, T. M.: The need to represent rain-
drop size spectra as normalized gamma distributions for the inter-
pretation of polarization radar observations, J. Appl. Meteorol.,
41, 286–297, 2002.
Kollias, P., Clothiaux, E. E., Miller, M. A., Albrecht, B. A.,
Stephens, G. L., and Ackerman, T. P.: Millimeter-wavelength
radars: new frontier in atmospheric cloud and precipi-
tation research, B. Am. Meteorol. Soc., 88, 1608–1624,
doi:10.1175/BAMS-88-10-1608, 2007.
Kollias, P., Szyrmer, W., Remillard, J., and Luke, E.: Cloud radar
Doppler spectra in drizzling stratiform clouds, Part II: Observa-
tions and microphysical modeling of drizzle evolution, J. Geo-
phys. Res.-Atmos., 116, D13203, doi:10.1029/2010JD015238,
2011.
Kruger, A., and Krajewski, W.: Two-dimensional video disdrom-
eter: A description, J. Atmos. Oceanic Technol., 19, 602–617,
doi:10.1175/1520-0426(2002)019<0602:TDVDAD>2.0.CO;2,
2002.
Kummerow, C., Barnes, W., Kozu, T., Shiue, J., and Simpson, J.:
The Tropical Rainfall Measuring Mission (TRMM) sensor pack-
age, J. Atmos. Ocean Tech., 15, 809–817, 1998.
Lhermitte, R.: Attenuation and scattering of millimeter wavelength
radiation by cloud and precipitation, J. Atmos. Ocean Tech., 7,
464–479, 1990.
Lebsock, M. D. and L’Ecuyer, T. S.: The retrieval of warm
rain from CloudSat, J. Geophys. Res., 116, D20209,
doi:10.1029/2011JD016076, 2011.
Liebe, H. J., Huffort, G. A., and Manage, T.: A model for the com-
plex permittivity of water at frequencies below 1 THz, Int. J. In-
frared. Milli., 12, 659–675, 1991.
Marshall, J. S. and Palmer, W. Mc K.: The distribution of raindrops
with size, J. Meteor., 5, 165–166, 1948.
Mather, J. H. and Voyles, J. W.: The ARM Climate Research Facil-
ity: a review of structure and capabilities, B. Am. Meteorol. Soc.,
94, 377–392, doi:10.1175/BAMS-D-11-00218.1, 2013.
Martner, B. E., Yuter, S. E., White, A. B., Matrosov, S. Y.,
Kingsmill, D. E., and Ralph, F. M.: Raindrop size distributions
and rain characteristics in California-coastal rainfall for periods
with and without a radar bright band, J. Hydrometeor., 9, 408–
425, 2008.
Matrosov, S. Y.: Attenuation-based estimates of rainfall rates aloft
with vertically pointing Ka-band radars, J. Atmos. Ocean Tech.,
22, 43–54, 2005.
Matrosov, S. Y.: Potential for attenuation-based estimations of
rainfall rate from CloudSat, Geophys. Res. Lett., 34, L05817,
doi:10.1029/2006GL029161, 2007.
Matrosov, S. Y.: Synergetic use of millimeter- and centimeter-
wavelength radars for retrievals of cloud and rainfall parameters,
Atmos. Chem. Phys., 10, 3321–3331, doi:10.5194/acp-10-3321-
2010, 2010.
Matrosov, S. Y., Uttal, T., and Hazen, D. A.: Evaluation of Radar
Reflectivity-Based Estimates of Water Content in Stratiform Ma-
rine Clouds, J. Appl. Meteor., 43, 405–419, 2004.
Matrosov, S. Y., May, P. T., and Shupe, M. D.: Rainfall profil-
ing using Atmospheric Measurement Program vertically pointing
8 mm wavelength radars, J. Atmos. Ocean Tech., 23, 1478–1491,
2006.
Mittermaier, M. P., Hogan, R. J., and Illingworth, A. J.: Using
mesoscale winds for correcting wind-drift errors in radar esti-
mates of surface rainfall, Q. J. Roy. Meteor. Soc., 130, 2105–
2123, 2004.
Rajopadhyaya, D. K., May, P. T., Cifelli, R., Avery, S. K., Williams,
C. R., Ecklund, W. L., and Gage, K. S.: The effect of vertical air
motions on rain rates and median volume diameter determined
from combined UHF and VHF wind profiler measurements and
comparisons with rain gauge measurements, J. Atmos. Oceanic
Technol., 15, 1306–1319, 1998.
Ryzhkov, A. V. and Zrnic, D. S.: Assessment of rainfall measure-
ment that uses specific differential phase, J. Appl. Meteor., 35,
2080–2090, 1996.
Sachidananda, M. and Zrnic, D. S.: Rain rate estimated from differ-
ential polarization measurements, J. Atmos. Oceanic Technol., 4,
588–598, 1987.
Short, D. A., Thiele, O. W., and McPhaden, M. J.: Optical
Rain gauge performance: Second workshop on Optical Rain
Gauge Measurements, NASA Technical report, Washington,
USA, NASA-CP-3288, 1994.
Tokay, A., Hartmann, P., Battaglia, A., Gage, K. S., Clark, W. L.,
and Williams, C. R.: A field study of reflectivity and Z-R rela-
tions using vertically pointing radars and disdrometers, J. Atmos.
Ocean Tech., 26, 1120–1134, 2009.
Wakasugi, K., Mizutani, A., Matsuo, M., Fukao, A., and Kato, S.: A
direct method for deriving drop-size distribution and vertical air
velocities from VHF Doppler radar spectra, J. Atmos. Oceanic
Technol., 3, 623–629, 1986.
Atmos. Meas. Tech., 8, 3685–3699, 2015 www.atmos-meas-tech.net/8/3685/2015/

A. Chandra et al.: Automated rain rate estimates using the KAZR 3699
Wang, J.-J., Alder, R. F., Huffman, G. J., and Bolvin, D.: An updated
TRMM composite climatology of tropical rainfall and its valida-
tion, J. Climate, 27, 273–284, doi:10.1175/JCLI-D-13-00331.1,
2013.
Yoneyama, K., Zhang, C., and Long, C. N.: Tracking pulses of the
Madden–Julian Oscillation, B. Am. Meteorol. Soc., 94, 1871–
1891, 2013.
Zhang, C.: Madden–Julian Oscillation: bridging weather
and climate, B. Am. Meteorol. Soc., 94, 1849–1870,
doi:10.1175/BAMS-D-12-00026.1, 2013.
www.atmos-meas-tech.net/8/3685/2015/ Atmos. Meas. Tech., 8, 3685–3699, 2015