amy m. elleman - vanderbilt...
TRANSCRIPT
EXPLORING DYNAMIC ASSESSMENT AS A MEANS OF IDENTIFYING CHILDREN
AT-RISK OF DEVELOPING COMPREHENSION DIFFICULTIES
By
Amy M. Elleman
Dissertation
Submitted to the Faculty of the
Graduate School of Vanderbilt University
in partial fulfillment of the requirements
for the degree of
DOCTOR OF PHILOSOPHY
in
Special Education
August, 2009
Nashville, Tennessee
Approved:
Professor Donald L. Compton
Professor Doug Fuchs
Professor Lynn S. Fuchs
Professor Joseph R. Jenkins

To Earle and Marge
ii

ACKNOWLEDGEMENTS
This research would not have been possible without the funding of Grant R324G060036 from
the U. S. Department of Education, Institute of Education Sciences; and Core Grant HD15052 from
the National Institute of Child Health and Human Development to Vanderbilt University.
I am grateful for the support of my committee members throughout this project. I would like
to thank Lynn Fuchs for her thorough feedback that has helped me to be clearer and more precise in
my writing. I consider myself very lucky to have had Lynn as a teacher and role model. I would also
like to thank Joe Jenkins whose feedback made me consider alternative viewpoints and practical
matters. I am also grateful for being able to work with Doug Fuchs. His insightful feedback helped me
tremendously throughout this project. I would especially like to thank Don Compton without whom I
would never have attempted this degree or project. Don is a rare mentor who is able to guide students
in developing expertise in their area of interest while encouraging them to ask and tackle questions in
their own way. I am very grateful for having the opportunity to learn from him.
I would not have been able to complete this project without the support of my family and
friends. I would like to thank Lori Day and Kitty Lozak for their on-going support, as well as, Endia
Lindo who keeps me on track, and Paul Morphy who makes me think outside the box. I am especially
grateful to my mother who unselfishly drove many miles and stayed countless weeks with us over the
past few years. I would also like to thank my father who encouraged her to come. I am also thankful
for my two thoughtful and amazing daughters, Samantha and Alyssa, who have supported me with
many hugs and kisses while I worked incessantly at the computer. Most importantly, I would like to
thank my incredible husband who encouraged me to begin this journey, supported me throughout it,
and never once complained about being woken up in the middle of the night to fix a computer
problem.
iii

TABLE OF CONTENTS
Page
DEDICATION.........................................................................................................................ii
ACKNOWLEDGEMENTS....................................................................................................iii
LIST OF TABLES..................................................................................................................iv
LIST OF FIGURES..................................................................................................................v
Chapter
I. INTRODUCTION................................................................................................1
Dynamic assessment........................................................................................4The role of inference in comprehension..........................................................6Purpose of the studies......................................................................................8
II. STUDY 1..............................................................................................................9
Introduction......................................................................................................9Method.............................................................................................................9
Participants..........................................................................................9Measure development.......................................................................10Procedure...........................................................................................12Data analysis.....................................................................................12
Results and discussion...................................................................................13
III. STUDY 2...........................................................................................................17
Introduction....................................................................................................17Method...........................................................................................................18
Study design......................................................................................18Participants........................................................................................19Inference instruction..........................................................................19Prompts..............................................................................................20Measures............................................................................................22Procedure...........................................................................................23Data Analysis....................................................................................27
Results and discussion...................................................................................28Concurrent validity............................................................................28Unique variance................................................................................32Student profiles according to the simple view..................................34
iv
IV. GENERAL DISCUSSION...............................................................................39
Limitations.....................................................................................................40Future Research.............................................................................................42
REFERENCES...........................................................................................................44
v
LIST OF TABLES
Page
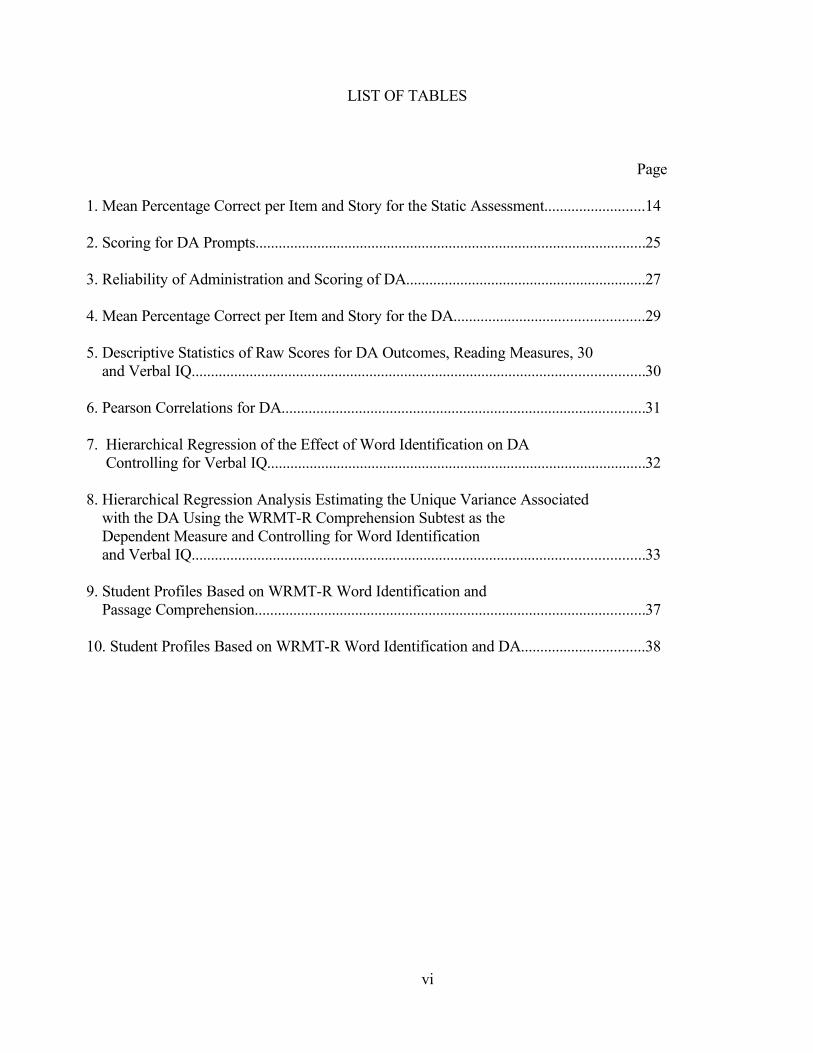
1. Mean Percentage Correct per Item and Story for the Static Assessment..........................14
2. Scoring for DA Prompts.....................................................................................................25
3. Reliability of Administration and Scoring of DA..............................................................27
4. Mean Percentage Correct per Item and Story for the DA.................................................29
5. Descriptive Statistics of Raw Scores for DA Outcomes, Reading Measures, 30 and Verbal IQ.....................................................................................................................30
6. Pearson Correlations for DA..............................................................................................31
7. Hierarchical Regression of the Effect of Word Identification on DA Controlling for Verbal IQ..................................................................................................32
8. Hierarchical Regression Analysis Estimating the Unique Variance Associated with the DA Using the WRMT-R Comprehension Subtest as the Dependent Measure and Controlling for Word Identification and Verbal IQ.....................................................................................................................33
9. Student Profiles Based on WRMT-R Word Identification and Passage Comprehension.....................................................................................................37
10. Student Profiles Based on WRMT-R Word Identification and DA................................38
vi

LIST OF FIGURES
Figure Page
1. Study Design for the DA....................................................................................................18
2. Example of Story and Prompts Administered in the Dynamic Phase of Test..................21
3. Scatter Plot of Word Reading by Passage Comprehension ..............................................35
4. Scatter Plot of Word Reading by DA...............................................................................36
vii

viii
CHAPTER I
INTRODUCTION
Although much of the research in reading disabilities (RD) has focused on problems due to
poor word identification, there are a substantial number of children who have difficulty understanding
what they read despite having adequate word identification skills (e.g., Cain & Oakhill, 2007; Nation
& Snowling, 1997; Yuill & Oakhill, 1991). According to Gough and Tumner’s (1986) simple view of
reading, reading is the product of word identification and linguistic comprehension. This framework
can be used to classify poor readers into three subtypes due to: (1) word recognition problems only
(i.e., poor decoder or dyslexic), (2) a specific comprehension deficit only (i.e., poor comprehender), or
(3) a combination of problems with decoding and comprehension (i.e., garden variety poor reader). It
is estimated that poor comprehenders comprise 3% to 10% of school-age children (Aaron, Joshi, &
Williams, 1999; Catts & Compton, 2009; Leach, Scarborough, & Rescorla, 2003; Yuill & Oakhill,
1991). Early identification and treatment for students with poor comprehension has the potential to
mitigate later reading problems. Yet, these students are often overlooked in the primary years.
Students who are diagnosed early with RD are often identified due to difficulties in word
identification, not specific deficits in comprehension (Nation & Snowling, 1997; Yuill & Oakhill,
1991). Although children identified with RD later in school have been shown to have deficits in word
identification, comprehension, or both word identification and comprehension (e.g., Leach,
Scarborough, & Rescorla, 2003; Lipka, Lesaux, & Siegel, 2006). Catts and Compton (2009) using
mixture latent transition modeling in a longitudinal study found that poor comprehenders made up the
largest group of children transitioning from typically developing to RD in late elementary school.
1
One reason for the delay in identification of poor comprehenders may be that reading tasks in
the primary grades do not tax students’ ability to comprehend text. Empirical evidence provides
support that the relative importance of word identification and comprehension shifts over time, with
word recognition contributing more variance in earlier reading development and comprehension
explaining more variance in later development (Catts, Fey, Zhang, & Tomblin, 1999; Francis,
Fletcher, Catts, & Tomblin, 2005; Gough, Hoover, & Peterson, 1996). Early reading instruction in the
primary grades is often concentrated on word identification, and students are exposed to relatively
short, simple texts that offer little challenge for comprehension (Duke, 2000). As students transition
from learning to read to reading to learn in the late elementary grades, they are presented with longer
and more complex texts that they are expected to read independently. Another change during this
transition is an increased focus on expository texts. The ability to monitor comprehension and make
inferences is thought to play an increased role in the understanding of expository texts (see Graesser,
Leon, & Otero, 2002). As expository texts become increasingly prevalent in the curriculum, students
who experience comprehension difficulties are likely to struggle.
In addition to shifts in instruction and reading tasks, the insensitivity of early reading
measures to detect comprehension problems may contribute to the delayed identification of students
with specific deficits in comprehension. Identification of reading problems and instructional planning
rely on the accurate measurement of the construct of interest. There is a justified assumption that
reading comprehension tests measure the construct of comprehension and that results should be
comparable across tests (Keenan, Betjemann, & Olson, 2008). Recent studies have challenged these
assumptions by showing that different comprehension measures tap varying levels of underlying skills
(Cutting & Scarborough, 2006; Francis, Fletcher, Catts, et al., 2005; Keenan et al., 2008; Nation &
Snowling, 1997). For example, in a comparison of four widely-used comprehension tests, Keenan et
al. (2008) found that the Woodcock-Johnson Passage Comprehension (WJPC) subtest from the
2

Woodcock-Johnson Tests of Achievement-III (Woodcock, McGrew, & Mather, 2001) and the
Peabody Individual Achievement Test (PIAT: Markwardt, 1997) relied mostly on decoding skills,
whereas the Gray Oral Reading Test (GORT; Wiederholt & Bryant, 1992) and the Qualitative
Reading Inventory (QRI; Leslie & Caldwell, 2001) depended on listening comprehension. This
research supports the findings of other studies that have considered the differential demands of
comprehension tests (Cutting & Scarborough, 2006; Francis, Fletcher, Catts, et al., 2005; Nation &
Snowling, 1997).
Although Cutting and Scarborough (2006) did not find differences in the decoding demands
across children’s developmental or ability level, several other studies have found comprehension tests
to be constrained by decoding level for younger and poorer readers (e.g., Catts et al., 1999; Francis,
Fletcher, Catts, et al., 2005; Keenan, 2008). Reading comprehension assessments constrained by the
students’ word recognition abilities are unlikely to identify problems that may occur when the text
complexity increases to match the students’ linguistic abilities (Catts, Hogan, & Adlof, 2005). These
findings call into question the utility of current comprehension measures to accurately identify young
students with specific comprehension deficits.
In addition to conflating comprehension with other reading skills such as word identification,
vocabulary, and domain-specific knowledge, current comprehension tests have been criticized for
lacking a clear theoretical underpinning, inadequately representing the complexity of comprehension,
and lacking utility for practitioners (Sweet, 2005). Researchers have attempted to address these
concerns by developing tests that use non-reading formats for young children. Recent research
indicates that children’s ability to generate inferences is highly correlated across different modalities
(i.e., aural, written, and televised stories) and predicts later reading comprehension (e.g., Kendeou,
Bohn-Gettler, White, & van den Broek, 2008). Although the addition of early listening
comprehension measures seems to be a viable alternative for measuring reading comprehension
3

independent of word identification, listening measures of general comprehension have not been
successful in adequately differentiating students who later develop RD from those who do not (e.g.,
Catts, Adlof, Weismer, 2006; Compton, Fuchs, Fuchs, Elleman, & Gilbert, 2008). In a previous study,
Compton et al. (2008) found that while a measure of listening comprehension was promising for
identifying poor comprehenders in first grade, it produced too many false positives (i.e., students
identified with comprehension difficulties who when test later show no deficits; Compton et al.,
2008). Two possible reasons these tests were ineffective at discriminating late-emerging poor
comprehenders may be that (1) the measures are tapping general comprehension skills instead of
specific comprehension skills that become increasingly important in the later grades or (2) poor
comprehenders differentially benefit from instruction they receive between initial and later testing
sessions. With this in mind, we developed an assessment to tap children’s inference generation, a skill
considered crucial to comprehension, and we decided to use a dynamic testing format in an attempt to
capture and predict students’ responsiveness to comprehension instruction.
Dynamic Assessment
Our long-term goal is to identify children at risk for developing RD due to comprehension
problems and to predict children’s response to early comprehension instruction. To increase our
chances for identifying these children, we decided to develop a dynamic assessment (DA) instead of a
traditional measure because of the added information a DA could potentially provide. In contrast to
traditional testing which provides a summary of what a child can or cannot do, DA allows direct
observation and measurement of the actual learning process. When using a DA format, the examiner
provides feedback to facilitate the student’s performance. The amount of feedback required for the
student to solve a task is a measure of how receptive he or she is to the instruction provided
(Campione & Brown, 1987). Traditional scores may underestimate a child’s ability to benefit from
4
instruction, because they reflect what the child has learned prior to testing instead of the child’s
potential for learning. For example, if a child lacks learning experiences due to an impoverished
school or home environment, he or she may score poorly on a traditional test. Scores for students
from impoverished environments are likely to be indistinguishable from the scores of students who
have been instructed appropriately but still struggle in school due to a disability. Focusing on the
process instead of the product of learning may provide a clearer picture of the student’s potential to
learn in the classroom.
Currently, response-to-intervention models (RTI) address this issue by providing struggling
readers with validated small group instruction linked to on-going assessment. Not only does this
process help differentiate students who have not had adequate instruction from students who have
difficulty learning, it also provides information to gauge how much support will be necessary for the
student to succeed in the future. Dynamic assessment, used in conjunction or as an alternative to
current RTI practices, may be able to provide this type of predictive information in a much shorter
time period (Caffrey, Fuchs, & Fuchs, 2008; Grigorenko, 2009).
There are many different kinds of dynamic test models (for a review see Grigorenko &
Sternberg, 1998). One format, the graduated prompts model, has been used successfully to measure
individuals’ learning and school achievement (e.g., Campione & Brown, 1987; Campione, Brown,
Ferrara, Jones, & Steinberg, 1985). Like many forms of DA, this model evolved from Vygotsky’s
(1962) idea of the zone of proximal development (ZPD). The ZPD is the difference between what the
child can do independently and what the child can accomplish with adult or peer mediation. It is in the
ZPD that learning is considered optimal. In this type of DA, unfamiliar learning tasks are selected, so
that the outcome represents the students’ response to learning, not what they have already learned
(Grigorenko & Sternberg, 1998). Mediation is then provided through systematic scaffolding of the
learning. When the student answers incorrectly or makes a mistake, the examiner provides the student
5

with a pre-determined set of increasingly explicit hints until the student can perform the task
independently (Campione & Brown, 1987).
Whereas static test items are scored as right or wrong, dynamic items using prompts allow
graded information to be captured about the student’s partial or developing ability. Use of items with
prompting also allows quantification of the student’s responsiveness to instruction. Students who
require more prompts to answer items successfully are likely to need more support in the classroom
than those requiring fewer prompts (Campione & Brown, 1987). In addition to better estimation of
students’ skills at the lower end of the distribution, the graduated prompts model requires
development and the consistent administration of scaffolds across participants (Grigorenko &
Sternberg, 1998). Dynamic tests using this type of standardized feedback have been shown to be more
predictive of academic achievement than dynamic tests without such standardization (Caffrey et al.,
2008).
The Role of Inference in Comprehension
After deciding that a dynamic assessment using the graduated prompts model would provide
the best format for the measure, our next step was to create a comprehension task that: (1) tapped an
important comprehension skill, (2) would differentiate good and poor comprehenders, (3) is not
typically taught to young children (to eliminate prior learning as a confound), and (4) could be learned
from a few trials administered in a single testing session. Choosing a task that fit these criteria was
difficult because comprehension is a complex process that is not fully understood. To date, there are
no definitive answers on the relative contributions of factors known to influence comprehension or the
mechanisms underlying poor comprehension. Although definitive answers are not yet available,
current research points to numerous skills which are important for comprehension (see Perfetti, Landi,
& Oakhill, 2005). One well-researched skill we felt met our task criteria was inference generation.
6

The ability to generate inferences is considered critical to understanding text (e.g., Bransford &
Franks, 1971; Cain & Oakhill, 2007; Kintsch & Kintsch, 2005; Thorndyke, 1976; Trabasso & van den
Broek, 1985). To gain the full meaning of a text, a reader must first consider the information stated
explicitly in the text and then create a coherent mental representation of it. The creation of this mental
model requires the reader to integrate information across the text, as well as with his or her prior
knowledge. The ability to make inferences has been shown to consistently differentiate good and poor
comprehenders (see Cain & Oakhill, 2007; McNamara, O’Reilly, & DeVega, 2007; Yuill & Oakhill,
1988; 1991). In a series of experiments, Oakhill and her colleagues demonstrated that good and poor
comprehenders, matched on vocabulary and decoding, differed in their ability to make inferences at
each level of textual discourse (i.e., word, sentence, and passage; Cain & Oakhill, 1999; 2007;
Oakhill, 1984; Yuill & Oakhill, 1991).
Although there is no consensus about the underlying cause of poor comprehenders’ difficulty
with generating inferences, researchers have identified three plausible explanations: an inability to
integrate text due to working memory deficits, a lack of background knowledge, and poor
metacognitive skills (see McNamara et al., 2007). As mentioned earlier, students are increasingly
required to read and independently comprehend longer, more complex texts as they progress through
school. These texts place increased burdens on background knowledge and comprehension
monitoring abilities. To independently learn from text, readers must have well-connected background
knowledge, strong meta-cognitive skills, and the ability to integrate ideas within and across texts.
Any deficits in these skills are likely to present problems. Interventions addressing each of these areas
have been successful at increasing children’s ability to make inferences (e.g., Dewitz, Carr, &
Patberg, 1987; Hansen & Pearson, 1983). In addition, we decided to use a metacognitive-oriented
inference intervention that focused on selecting and using clue words to make inferences, because this
type of instruction has been shown to be effective on near transfer measures of inferential
7

comprehension within relatively short periods of time (i.e., less than 4 hours; Carnine, Kameenui, &
Woolfson, 1982; Holmes, 1985; Reutzel & Hollingsworth, 1988; Winne, Graham, & Prock, 1993;
Yuill & Joscelyne, 1988; Yuill & Oakhill, 1988).
Purpose of the Studies
We conducted two studies to explore a newly constructed dynamic assessment (DA) intended
to tap inference making skills. Our long-term goal is to identify children at risk for developing RD
due to comprehension problems. These studies are our first step in exploring the measure’s reliability
and validity. In the first study, we administered a static version (i.e., traditional test administered with
no feedback) of the measure, so we could examine the reliability and difficulty of the items without
the confounding effects from the instruction and feedback provided in the dynamic measure. We
asked the following questions: (1) What is the internal consistency of the measure? (2) Are the effects
due to the order of the passage presentation? (3) What is the relative difficulty of the different types of
inference items? (4) Are the passages equivalent in difficulty? In the second study, we were interested
in the concurrent validity of the dynamic measure. In this study, we focused on the dynamic measure
and asked the following questions: (1) What is the correlation of the dynamic test with a validated
reading comprehension measure, word reading measures, and verbal IQ? (2) How much unique
variance does the dynamic test explain in a validated reading comprehension measure after
considering word identification and verbal IQ? In the second study, we also explored the differences
between the DA and the reading comprehension measure in classifying students based on the simple
view of reading.
8
CHAPTER II
STUDY 1
Introduction
We conducted two studies to explore a newly constructed dynamic assessment (DA) intended
to tap inference making skills. Our long-term goal is to identify children at risk for developing RD
due to comprehension problems. These studies are our first step in exploring the measure’s reliability
and validity. In this first study, we administered a static version (i.e., traditional test administered with
no feedback) of the measure, so we could examine the reliability and difficulty of the items without
the confounding effects from the instruction and feedback provided in the dynamic measure. We
asked the following questions: (1) What is the internal consistency of the measure? (2) Are the effects
due to the order of the passage presentation? (3) What is the relative difficulty of the different types of
inference items? (4) Are the passages equivalent in difficulty?
Method
Participants
We administered a static version of the test to 68 second-grade students enrolled in 5
classrooms in 2 public schools in Nashville, Tennessee. This was a convenience sample of
participants from another study. Students’ mean age for the sample was 8 years, 2 months.
Female students made up 53% of the sample. More than half of the students (57%) received free or
reduced lunch, and 5% of the students received special education services. The racial make-up of the
sample was 65% African American, 28% Caucasian, 3% Hispanic, 1% Kurdish, and 3% of students
were reported as “other”.
9

Measure Development
Passages. The test included seven short passages. Five of the stories were created to be equal
in difficulty and two passages were created to assess transfer and avoid ceiling effects. One of the
transfer passages was created with a lower level of cohesion, because research has shown that lower
levels of cohesion negatively affects reading comprehension for poor readers (e.g., McNamara,
Kintsch, Songer, & Kintsch, 1996). The low-cohesion passage contained a higher number of
pronouns, fewer causal connectives, and more filler text between inferences. The other transfer
passage was created to assess students’ inference in expository text. This text was adapted from a
third grade text about the rainforest (Myers, 1999). All of the other passages were narrative. Early in
test development, we considered using expository text to simulate the textual changes that occur in
late elementary school. However, we decided that the difficulty and unfamiliarity of expository tests
would likely make the task too difficult for second graders and preclude us from assessing any
differences due to learning, especially within a single session.
The stories were based on passages developed by Yuill and Joscelyne (1988). The passages
were crafted so that the setting of the story and pieces of information vital to understanding the story
were never explicitly stated. These omissions required the children to make an inference about the
story’s setting and causal inferences for what was happening in the story. Causal inferences are made
by the reader to weave together each event or fact encountered in a narrative to previous information
in the text or to his or her prior knowledge (van den Broek & Lorch, 1993). With consideration of the
abilities of the second grade children in our sample, we decided to use causal inference, not only
because of their prominent role in understanding narrative text, but also because they have also been
shown to be easier than other types of elaborative inferences (e.g., Bowyer-Crane, 2005; Casteel &
Simpson, 1991; Graesser, Singer, & Trabasso, 1994; Trabasso & van den Broek, 1985).
10

The passages contained 160 – 217 words and ranged from a third to fifth grade level as
indexed by the Flesch-Kincaid readability formula. Differences in background knowledge have been
found to affect inference generation (e.g., Hansen & Pearson, 1983), so we controlled for prior
knowledge by including topics (e.g., climbing toddlers, messy friends, and mean bullies) and settings
(e.g., grocery store, classroom, park) familiar to second grade students. Passages in the test, except for
the transfer phase, were equated on vocabulary and syntax using the Coh-Metrix indices developed by
Graesser, McNamara, Louwerse, & Cai (2004).
Items. Three open-ended questions were created for each passage for a total of 21 items. For
the first question after each story, students were required to make a setting inference. The setting
questions were considered fairly easy and were included to avoid floor effects for students with poorer
inference skills. For the other two questions, we asked students to make causal inferences. Research
suggests that readers have more difficulty making inferences when the information needed to be
integrated to make the inference is distally rather than proximally located in the text (e.g., Bonitatibus
& Beal, 1996; Ackerman, Jackson, & Sherill, 1991). These difficulties are more pronounced for poor
comprehenders (e.g., Ehrlich, Remond, & Tardieu, 1999). Therefore, to create a range of difficulty in
the items and to better differentiate good and poor comprehenders, we developed two causal inference
questions for each passage. The first causal inference question required students to integrate clues in
the text across shorter amounts of text and the other required integration across longer amounts of
text.
11
Procedure
Students were assessed in one session in early May. Each session took approximately one
hour. The static test was group-administered and required a written response for each item. The test
was administered by three trained doctoral students. Two examiners were always present to assist in
administration and ensure fidelity of administration. The examiners used a scripted protocol to
administer the test. The examiners handed out a packet containing the stories, questions, and a place
for the child to write an answer to each question. The examiner read each story and question aloud to
the students and waited until all students had written their answers before moving to the next item.
Each classroom received the first five passages in a different order, so we could consider any order
effects. We only had five classrooms with which to administer the test, so we decided to
counterbalance the first five passages and administer the transfer items last for each group. All
protocols were double-scored. Scoring reliability for this condition was 98%. All discrepancies
between scorers were discussed and resolved.
Data Analysis
First, reliability was evaluated by determining the internal consistency of the items in the
measure using Cronbach’s alpha. Next, using a repeated measures analysis of variance, we tested
whether the order of the passages made a difference in scores. Then, again using a repeated measures
analysis of variance, we tested the equivalency of the first five passages. We also tested whether the
two transfer passages were more difficult than the other passages, and whether some types of
inferences were more difficult than others.
12

Results and Discussion
The internal consistency as measured by Cronbach’s alpha was .77, indicating sufficient
reliability for the test. To assess order effects and the difficulty of the items and passages, we used
repeated measures analysis of variance. In each analysis, we first checked that the data met the
assumption of sphericity using Mauchly's Test. The test was not significant in any of the following
analyses, indicating that the variances of the differences between conditions were equal. First, we
tested whether there were differences due to the order of the passages. A repeated measures analysis
of covariance with order as the between-subjects factor was not significant, F (4, 63) = 1.35, p = .26,
indicating that the presentation order of the passages did not matter. Next, we considered whether the
passages and items functioned as planned. See Table 1 for the item level data. The first five stories
administered in the measure were created to be equal in difficulty and the transfer stories were created
to be more difficult than the other passages. We tested whether the first five passages were equivalent
by conducting a repeated measures analysis of variance which revealed that the passages were not
equal, F(4, 268) = 17.57, p < .001. Contrasts using the Bonferroni adjustment for multiple
comparisons showed that Story 1 and Story 5 were equivalent, F(1, 67) = .29, p = .59, as well as Story
5 and Story 3, F (1, 67) = .29, p = .60. However, Story 2 was significantly more difficult than Story 1,
F (1, 67) = 4.18, p = .05 and Story 4 was significantly more difficult than Story 2, F(1, 67) = 29.43, p
< .001. Next, we considered the difficulty of the transfer passages. The low cohesion transfer
passage, Story 6, was more difficult than Story 2, F (1, 67) = 5.21, p = .03 but was significantly less
difficult than Story 4, F(1, 67) = 29.60, p < .001. Although Story 7 (the expository text) was
significantly more difficult than Story 6 (the low cohesion text), F (1, 67) = 26.09, p < .001, it was not
significantly different than Story 4, F(1, 67) = .20, p = .66.
13
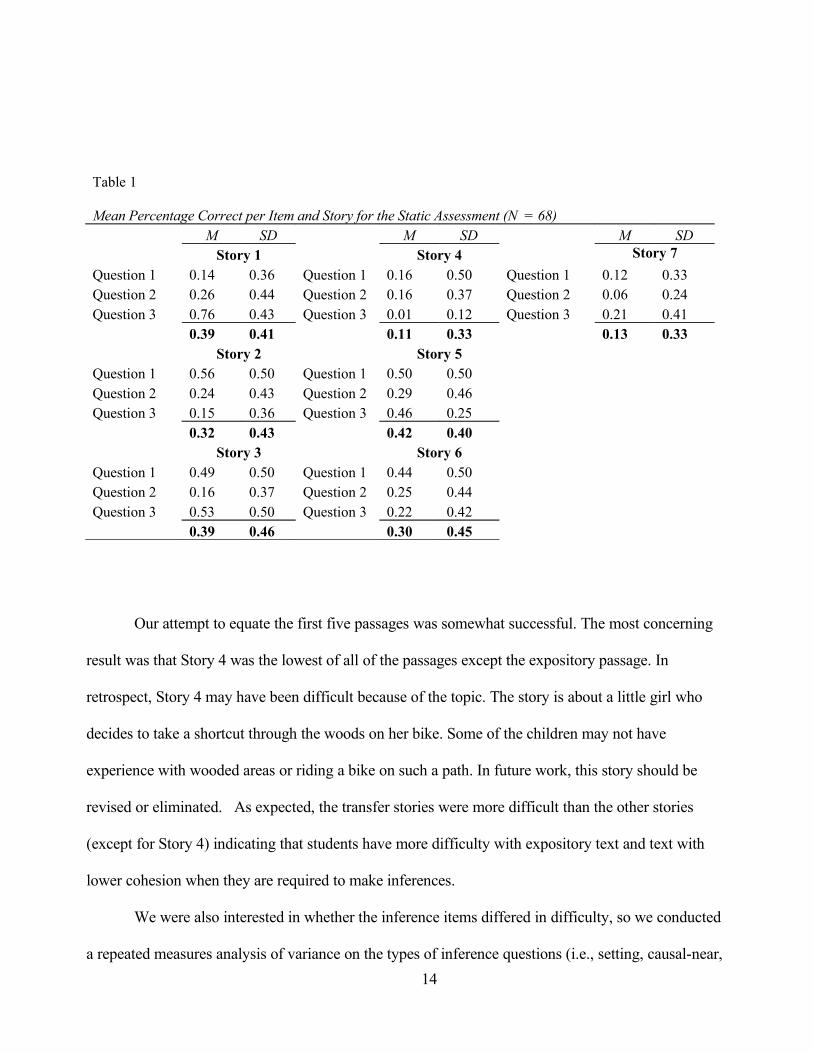
Table 1
Mean Percentage Correct per Item and Story for the Static Assessment (N = 68)M SD M SD M SD
Story 1 Story 4 Story 7
Question 1 0.14 0.36 Question 1 0.16 0.50 Question 1 0.12 0.33Question 2 0.26 0.44 Question 2 0.16 0.37 Question 2 0.06 0.24Question 3 0.76 0.43 Question 3 0.01 0.12 Question 3 0.21 0.41
0.39 0.41 0.11 0.33 0.13 0.33Story 2 Story 5
Question 1 0.56 0.50 Question 1 0.50 0.50Question 2 0.24 0.43 Question 2 0.29 0.46Question 3 0.15 0.36 Question 3 0.46 0.25
0.32 0.43 0.42 0.40Story 3 Story 6
Question 1 0.49 0.50 Question 1 0.44 0.50Question 2 0.16 0.37 Question 2 0.25 0.44Question 3 0.53 0.50 Question 3 0.22 0.42
0.39 0.46 0.30 0.45
Our attempt to equate the first five passages was somewhat successful. The most concerning
result was that Story 4 was the lowest of all of the passages except the expository passage. In
retrospect, Story 4 may have been difficult because of the topic. The story is about a little girl who
decides to take a shortcut through the woods on her bike. Some of the children may not have
experience with wooded areas or riding a bike on such a path. In future work, this story should be
revised or eliminated. As expected, the transfer stories were more difficult than the other stories
(except for Story 4) indicating that students have more difficulty with expository text and text with
lower cohesion when they are required to make inferences.
We were also interested in whether the inference items differed in difficulty, so we conducted
a repeated measures analysis of variance on the types of inference questions (i.e., setting, causal-near,
14
and causal-far). The analysis of the static assessment showed that the types of inferences required by
the test were not equivalent in difficulty, F (2, 134) = 17.78, p <.001. The setting questions were
created to be the easiest of the three types of inference. As expected, contrasts using Bonferroni
adjustment for multiple comparisons showed that the setting questions (M = 0.34, SD =0.46) were
easier than the causal-near questions (M = .20, SD = .39), F (1, 67) = 27.47, p < .001. However,
contrary to previous research, the causal-far questions (M = .33, SD = .36) were easier than the causal-
near questions, F(1, 67) = 25.68, p < .001.
Previous research has shown that inferences are more difficult to make when pieces of
information required to make the inference are located distally, rather than proximally, in a text. This
unexpected finding that the near-causal questions were more difficult than the far-causal inferences
may be an artifact of the order of the questions, not the inference task. For each passage, the order of
the questions remained the same: (1) setting, (2) causal-near, and (3) causal-far. Answering two
inferential questions required the student to engage in the text beyond the surface level, possibly
making it easier to answer the causal-far questions which were always presented last. This opens the
possibility that there may be a lack of independence between the items and, therefore, caution should
be used in interpreting the item-level differences. In future work, the items should be counter-
balanced to consider item dependencies. An alternative possibility is that the far-causal items required
an inference to be made that had more causal connections related to the overall goals of the main
character making the inference more central to the story than inferences required in the near-causal
items. It has been shown that the number of causal links in a story may be more important for making
inferences than the amount of text between relevant information (van den Broek & Lorch, 1993). The
passages were not evaluated for the number of causal links in each story. Future work should consider
the causal structure of the story and the number of links for each item requiring a causal inference to
15

be made. Teasing apart why the items did not operate as intended could help us to better understand
the underlying processes involved in making inferences.
16

CHAPTER III
STUDY 2
Introduction
We conducted two studies to explore a newly constructed dynamic assessment (DA) intended
to tap inference making skills. Our long-term goal is to identify children at risk for developing RD
due to comprehension problems. In the first study, we administered a static version (i.e., traditional
test administered with no feedback) of the measure, so we could examine the reliability and difficulty
of the items without the confounding effects from the instruction and feedback provided in the
dynamic measure. In the following study, we were interested in the concurrent validity of the dynamic
measure. In this study, we focused on the dynamic measure and asked the following questions: (1)
What is the correlation of the dynamic test with a validated reading comprehension measure, word
reading measures, and verbal IQ? (2) How much unique variance does the dynamic test explain in a
validated reading comprehension measure after considering word identification and verbal IQ? In this
study, we also explored the differences between the DA and the reading comprehension measure in
classifying students based on the simple view of reading.
17
Method
Study Design
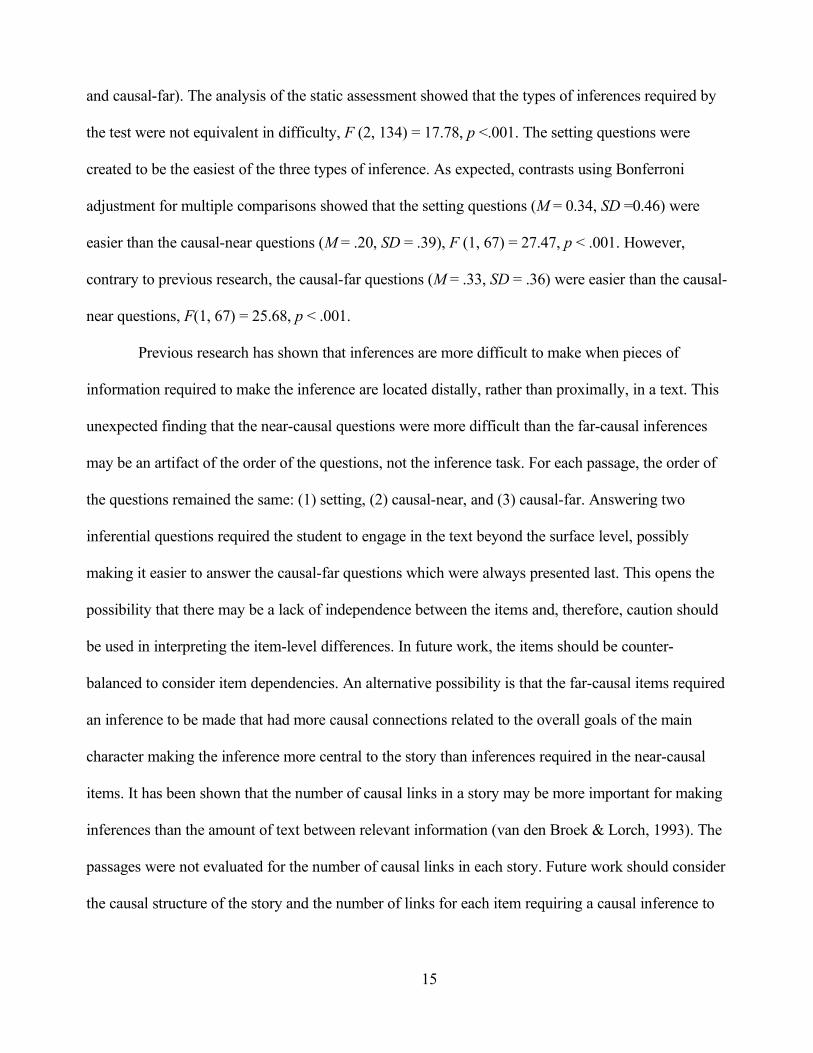
The same 7 passages and 21 test items (3 for each passage) were used in the dynamic version
of the test as were used with the static version with the addition of one training passage (see Figure 1).
No data was collected for the items pertaining to the training passage. The passages for the DA were
presented over five phases: (1) pre-test (Story 1), (2) inference instruction (Training Story), (3)
Dynamic practice with feedback prompts (Stories 2, 3, & 4), (4) post-test without feedback (Story 5),
and (5) transfer without feedback (Story 6 & 7). In contrast to the static test, the DA was administered
individually to each student and students responded orally to questions instead of writing their
answers. In addition, whereas no instruction or feedback was provided for the static measure in Study
1, examiners administering the DA provided inference instruction after the pre-test story and feedback
for each item students answered incorrectly in Stories 2, 3, and 4.
Story 1 Training
Story
Story 2 Story 3 Story 4 Story 5 Story 6 Story 7
Pre-test
No
Feedback
Detective
Training
Dynamic
with
feedback
prompts
Dynamic
with
feedback
prompts
Dynamic
with
feedback
prompts
Posttest
No
feedback
Transfer
Low
Cohesion
No feedback
Transfer
Expository
No
feedback
Figure 1. Study design for the DA
18
Participants
We administered the DA to 100 second-grade students across 24 classrooms in 9 public
schools in Nashville, Tennessee who were selected from a larger pool of students (N = 391)
participating in a longitudinal study. From this larger sample, we selected 25 high, 50 average, and 25
low readers using a latent class analysis of their first grade scores on the Test of Word Reading
Efficiency (TOWRE; Torgeson, Wagner, & Rashotte, 1997) and the Woodcock Reading Mastery Test
– R/NU (WRMT-R/NU; Woodcock, 1998) subtests of word identification (WID), word attack (WA),
and passage comprehension (PC). The mean age of the sample was 8 years and 3 months. Fifty-five
percent of the sample was female, 53% received free/reduced lunch, and 12% received special
education services. The racial make-up of the sample was 36% African American, 42% Caucasian,
8% Hispanic, 8% Kurdish, 2% Asian, and 4% were reported as “other”.
Inference Instruction
After the pretest, students received instruction designed to improve their inference skills. The
instruction was modeled after studies shown to be effective at increasing students’ inference skills by
teaching them to find and use important information in the text (Reutzel & Hollingsworth, 1988;
Winne et al., 1993; Yuill & Joscelyne, 1988). During the inference instruction phase of the test,
students were taught to be “reading detectives” by identifying clues in the text to help them figure out
what is happening in the stories. After discussing the similarities between good readers and detectives,
the examiner explained that good reading detectives pay attention to repeated information, use clues
across all parts of the text, and keep looking for clues until the story makes sense. After this
instruction, the examiner read a passage and modeled how to use the clues to solve what is happening
in a story. The examiner demonstrated how to use the clues in the story to answer three inference
questions similar to those used for the other passages.
19

Prompts
Prompts were created for each of the nine items in the dynamic phase of the test. The majority
of prompts consisted of reminding the student how to be a reading detective and orienting them to
clues in the story. We also added a prompt that consisted of rereading the story. Even though the story
was present for the children to refer to, some of the children with poor word identification might not
be able to make full use of the text to help them remember events or details of the story. We wanted to
provide these students with another chance at hearing the story if they could not answer the initial
question. This prompt was used only once per story. For each item the children could not answer, they
were provided with a prompt. For each prompt a clue was read to the student. The clue was
highlighted in the text, as well. The clues were presented from least to most helpful for making the
inference. The last prompt in each series of prompts consisted of a summary of all of the clues
presented in the story. Students were presented each prompt until they answered the question correctly
or the prompts were exhausted. An example of a passage and the prompting procedure is provided in
Figure 2.
20
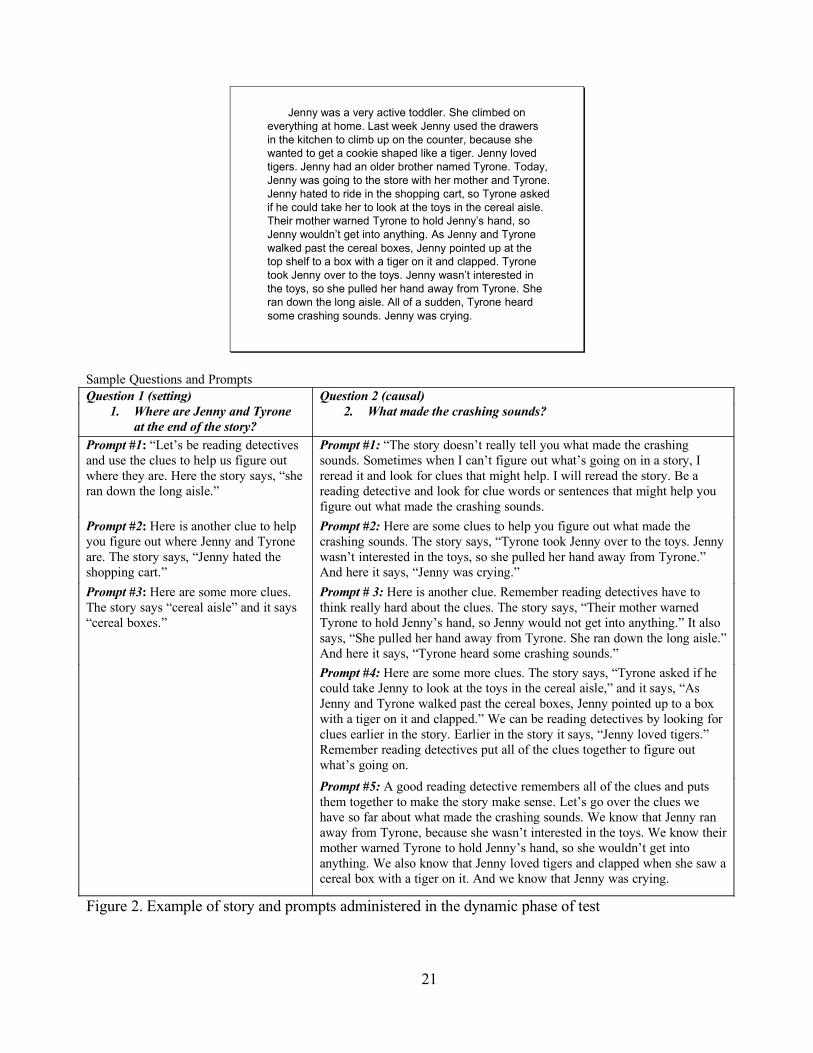
Jenny was a very active toddler. She climbed on everything at home. Last week Jenny used the drawers in the kitchen to climb up on the counter, because she wanted to get a cookie shaped like a tiger. Jenny loved tigers. Jenny had an older brother named Tyrone. Today, Jenny was going to the store with her mother and Tyrone. Jenny hated to ride in the shopping cart, so Tyrone asked if he could take her to look at the toys in the cereal aisle. Their mother warned Tyrone to hold Jenny’s hand, so Jenny wouldn’t get into anything. As Jenny and Tyrone walked past the cereal boxes, Jenny pointed up at the top shelf to a box with a tiger on it and clapped. Tyrone took Jenny over to the toys. Jenny wasn’t interested in the toys, so she pulled her hand away from Tyrone. She ran down the long aisle. All of a sudden, Tyrone heard some crashing sounds. Jenny was crying.
Sample Questions and PromptsQuestion 1 (setting) Question 2 (causal)
1. Where are Jenny and Tyrone at the end of the story?
2. What made the crashing sounds?
Prompt #1: “Let’s be reading detectives and use the clues to help us figure out where they are. Here the story says, “she ran down the long aisle.”
Prompt #1: “The story doesn’t really tell you what made the crashing sounds. Sometimes when I can’t figure out what’s going on in a story, I reread it and look for clues that might help. I will reread the story. Be a reading detective and look for clue words or sentences that might help you figure out what made the crashing sounds.
Prompt #2: Here is another clue to help you figure out where Jenny and Tyrone are. The story says, “Jenny hated the shopping cart.”
Prompt #2: Here are some clues to help you figure out what made the crashing sounds. The story says, “Tyrone took Jenny over to the toys. Jenny wasn’t interested in the toys, so she pulled her hand away from Tyrone.” And here it says, “Jenny was crying.”
Prompt #3: Here are some more clues. The story says “cereal aisle” and it says “cereal boxes.”
Prompt # 3: Here is another clue. Remember reading detectives have to think really hard about the clues. The story says, “Their mother warned Tyrone to hold Jenny’s hand, so Jenny would not get into anything.” It also says, “She pulled her hand away from Tyrone. She ran down the long aisle.” And here it says, “Tyrone heard some crashing sounds.”
Prompt #4: Here are some more clues. The story says, “Tyrone asked if he could take Jenny to look at the toys in the cereal aisle,” and it says, “As Jenny and Tyrone walked past the cereal boxes, Jenny pointed up to a box with a tiger on it and clapped.” We can be reading detectives by looking for clues earlier in the story. Earlier in the story it says, “Jenny loved tigers.” Remember reading detectives put all of the clues together to figure out what’s going on.
Prompt #5: A good reading detective remembers all of the clues and puts them together to make the story make sense. Let’s go over the clues we have so far about what made the crashing sounds. We know that Jenny ran away from Tyrone, because she wasn’t interested in the toys. We know their mother warned Tyrone to hold Jenny’s hand, so she wouldn’t get into anything. We also know that Jenny loved tigers and clapped when she saw a cereal box with a tiger on it. And we know that Jenny was crying.
Figure 2. Example of story and prompts administered in the dynamic phase of test
21
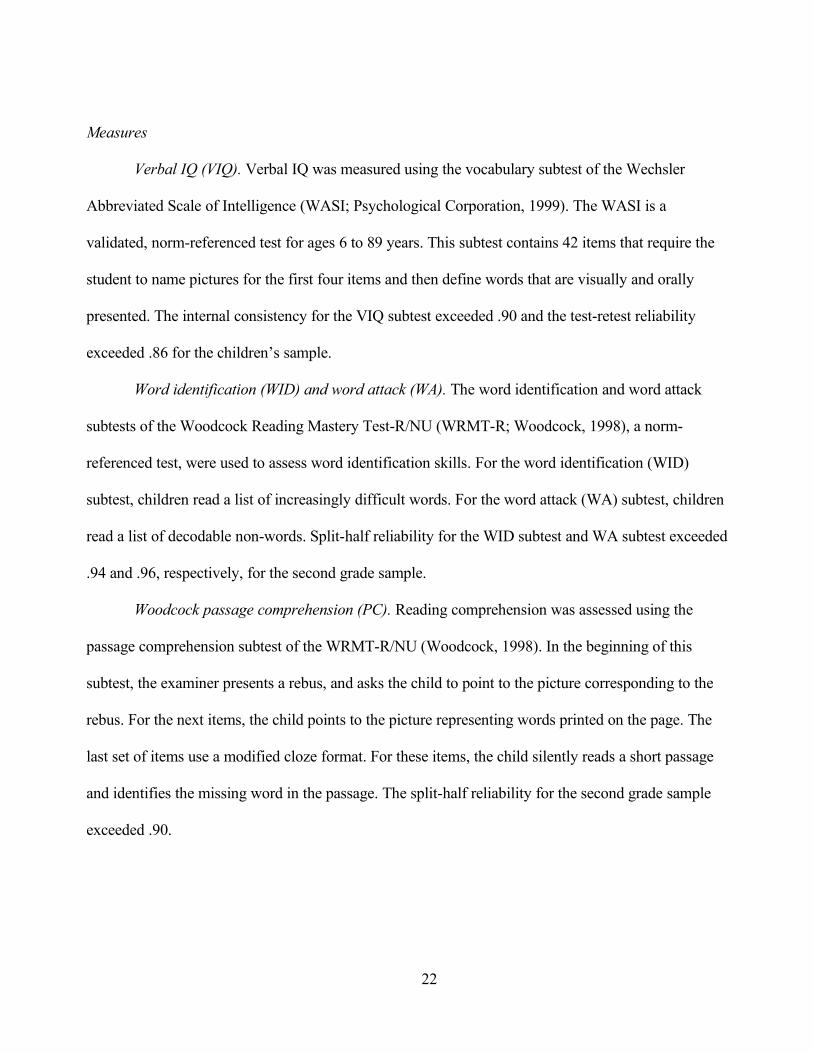
Measures
Verbal IQ (VIQ). Verbal IQ was measured using the vocabulary subtest of the Wechsler
Abbreviated Scale of Intelligence (WASI; Psychological Corporation, 1999). The WASI is a
validated, norm-referenced test for ages 6 to 89 years. This subtest contains 42 items that require the
student to name pictures for the first four items and then define words that are visually and orally
presented. The internal consistency for the VIQ subtest exceeded .90 and the test-retest reliability
exceeded .86 for the children’s sample.
Word identification (WID) and word attack (WA). The word identification and word attack
subtests of the Woodcock Reading Mastery Test-R/NU (WRMT-R; Woodcock, 1998), a norm-
referenced test, were used to assess word identification skills. For the word identification (WID)
subtest, children read a list of increasingly difficult words. For the word attack (WA) subtest, children
read a list of decodable non-words. Split-half reliability for the WID subtest and WA subtest exceeded
.94 and .96, respectively, for the second grade sample.
Woodcock passage comprehension (PC). Reading comprehension was assessed using the
passage comprehension subtest of the WRMT-R/NU (Woodcock, 1998). In the beginning of this
subtest, the examiner presents a rebus, and asks the child to point to the picture corresponding to the
rebus. For the next items, the child points to the picture representing words printed on the page. The
last set of items use a modified cloze format. For these items, the child silently reads a short passage
and identifies the missing word in the passage. The split-half reliability for the second grade sample
exceeded .90.
22
Procedure
Administration. Students were individually assessed over two sessions within two weeks in
early May. The data collection for this sample overlapped for one week with the data collection for
the static sample. The DA was given in one session of 25 minutes to 1 hour depending on the ability
of the child. All of the remaining measures were given in another session which lasted up to one hour.
At the start of the DA, examiners explained the task to the students with the following directions:
I’m going to read some stories to you. These stories are tricky. They don’t actually tell you
everything that’s happening in them. Even though they don’t say what’s actually happening,
the stories give you clues to help you figure it out. Today, you’re going to be a reading
detective to figure out what’s happening in the stories. After I read you a story, I’ll ask you
some questions. For some stories, we’ll work together to figure out what’s happening. For
other stories, you’ll figure it out yourself. For this test, you can ask me to reread any parts of
the stories or questions to you.
Next, the examiner presented the pretest passage and items to the student. Throughout the test, the
passages were available to the student to refer to when listening to the story or answering the
questions. Students were encouraged to follow along in the text while listening to the story. After the
pretest, the examiner presented the lesson on inference generation (i.e., reading detective lesson on
how to find and use clues in a story) and practice story. Next, the examiner led the student through the
dynamic phase of the test which included nine items over three passages. If the student answered an
item incorrectly, the examiner provided prompts until the student answered correctly or the prompts
were exhausted. Last, the examiner presented the posttest story and two transfer stories. The examiner
provided no prompts for items on these stories.
Scoring. Researchers employing the graduated-prompts model have used various scores
obtained from information gathered during testing to assess potential learning. Some researchers have
23

had success with using a ratio between the prompts and transfer, whereas others have only been able
to discriminate children based on the total score (see Grigorenko & Sternberg, 1998). On our DA,
scores were calculated for the number of prompts a student required to answer a question correctly, a
transfer score that combined the scores on items from the low-cohesion text and the expository text,
and a total score. The learning potential information for the DA is not only captured in the number of
prompts, but also in each of the items presented after the instruction in inference generation. To obtain
a total score, we needed to score the test in a way that best captured information from prompts from
the dynamic phase and information from responses to the initial questions on the other questions in
the test. The scores from the initial scores were positive and the prompts scores were negative. To
simplify interpretation of the total score, we decided to use a rating scale for the dynamic items. We
set the value of each item by determining the number of prompts required for the each type of
inference question in the dynamic phase of the test. For example, there were a maximum of three
prompts provided for the setting inferences. We assigned a score of +4 for students who required no
prompts, +3 for 1 prompt, +2 for 2 prompts, +1 for 3 prompts with a correct answer after the last
prompt, and to distinguish between students who answered correctly after the final prompt and
students who would have required another prompt, we assigned 0 for 3 prompts with no correct
answer after the final prompt. Each corresponding inference question (i.e., setting, causal-near,
causal-far) were valued the same. For example, all static setting questions received +4 or 0. This
scoring system allowed the learning captured in the static items in the last three phases of the test to
have as much weight as the information gained from the items with prompting. The scoring guide for
the prompts is provided in Table 2.
24

Table 2
Scoring for DA PromptsPoints
Question 1 (Setting)Correct initial answer 41 prompt required 32 prompts required 23 prompts required; correct answer 13 prompts required; incorrect answer 0
Question 2 (Causal - Near)Correct initial answer 61 prompt required 52 prompts required 43 prompts required 34 prompts required 25 prompts required; correct answer 15 prompts required; incorrect answer 0
Question 3 (Causal- Far)Correct initial answer 51 prompt required 42 prompts required 33 prompts required 24 prompts required; correct answer 14 prompts required; incorrect answer 0
25

Fidelity and reliability of administration. The DA was administered by 11 graduate students
trained in the administration of educational assessments. Examiners received three hours of training in
administration and scoring and were required to demonstrate competency by administering the test in
a mock session with 95% fidelity for administration and scoring. If examiners did not reach the
criterion, they were retrained and retested until they met criterion. All of the directions and dialogue
were scripted to ensure standardization across examiners. An answer key was provided to each
examiner, so he or she could determine if a child had answered a question correctly or required
another prompt. Sometimes children answered questions ambiguously. Answers children might
provide were included in the administration guide. When an answer was not provided and the
examiner felt that the answer was close, the examiner was instructed to ask, “Can you tell me more
about …” All answers and any extra dialogue between the examiner and student was transcribed on
the scoring sheet. In addition, all sessions were tape-recorded. However, of the 100 tapes, 8 could not
be reviewed because the tape recorder did not work, and 14 of the tapes contained portions that were
inaudible and could not be evaluated. All audible portions of the tapes and all protocols were used to
assess administration fidelity and scoring reliability. Administration fidelity was assessed by
completing a component checklist. Administration of each story was evaluated based on whether the
examiner correctly presented the questions, prompts, and queries, as well as, how they read each
story. Examiners were trained to carefully read the story in a clear voice without any undue inflection
that could provide hints for the answering the questions. A separate score was calculated for scoring
reliability. Administration and scoring reliability was calculated using percent agreement (i.e.,
percentage agreement = agreements / agreements + disagreements). Overall reliability of
administration and scoring was 97. 8%. Detailed information for each category is presented in Table
3. All errors were reconciled by one of the authors.
26

Table 3
Reliability of Administration and Scoring of DA
Percent
Agreement
Story 1 (pretest) 97.5
Training Story and Inference Instruction 96.6
Story 2 with prompts (dynamic) 94.1
Story 3 with prompts (dynamic) 98.8
Story 4 with prompts (dynamic) 98.4
Story 5 (Posttest) 98.9
Story 6 (Transfer - Low Cohesion) 98.3
Story 7 (Transfer - Expository) 96.4
Story Reading 99.7
Scoring Reliability 98.9
Overall 97.8
Data Analysis
First, we considered the concurrent validity of the dynamic measure. We compared outcomes
on the DA (i.e., number of prompts, transfer score, and/or total score) to a validated reading
comprehension measure, the PC subtest of the WRMT-R, and other measures related to reading
comprehension including the VIQ subtest of the WASI and the WID subtest of the WRMT-R. The
two word reading subtests on the WRMT-R were highly correlated, so we decided to choose one to
represent word reading skills. The correlation between WID and PC was much stronger than the
relationship between WA and PC, so we retained the WID for all subsequent analyses.
After we determined the relationship between the predictor measures and PC, we considered
how much variance the DA could explain in the PC above and beyond that explained by word
identification and verbal IQ. Next, because the DA was developed to fill a gap not being addressed by
27

current measures of reading comprehension, we decided to explore the differences between it and the
PC for classifying students according to the Gough & Tunmer’s (1986) simple view of reading. To do
this, we converted each student’s PC, DA, and word identification raw scores to z-scores. Next, we
plotted each student’s score on word identification against scores on his or her score on the PC and
then, against scores on the DA.
Results and Discussion
Concurrent Validity
To consider the concurrent validity of the DA, we compared it to the PC, a validated measure
of general reading comprehension. In addition, we compared the DA to other measures tapping skills
important to reading comprehension including VIQ, WID, and WA. It should be noted that one
student did not receive the second battery of tests, so all results including measures other than the DA
were based on a sample of 99 children. Item and passage level data for the DA is provided in Table 4.
Descriptive information for each of the measures is provided in Table 5.
28

Table 4
Mean Percentage Correct per Item and Story for the DA (N = 100)M SD M SD M SD
Story 1 Story 4 Story 7
Question 1 0.24 0.43 Question 1 0.45 0.50 Question 1 0.18 0.39Question 2 0.28 0.45 Question 2 0.45 0.50 Question 2 0.18 0.39Question 3 0.69 0.47 Question 3 0.05 0.22 Question 3 0.19 0.40
0.40 0.45 0.32 0.41 0.18 0.39Story 2 Story 5
Question 1 0.63 0.49 Question 1 0.42 0.49Question 2 0.30 0.46 Question 2 0.41 0.49Question 3 0.53 0.50 Question 3 0.44 0.50
0.49 0.48 0.42 0.49Story 3 Story 6
Question 1 0.59 0.49 Question 1 0.58 0.50Question 2 0.45 0.50 Question 2 0.40 0.49Question 3 0.55 0.50 Question 3 0.23 0.42
0.53 0.50 0.40 0.47
29

Table 5
Descriptive Statistics of Raw Scores for DA Outcomes, Reading Measures, and Verbal IQ (N = 99)
M (SD) Range PossibleComprehension 23.04 (5.49) 9 - 35 0 - 68Word Identification 55.19 (13.61) 12 - 90 0 - 106Word Attack 22.61 (10.81) 0 - 41 0 - 45Verbal IQ 27.54 (6.99) 5 - 46 0 - 56DA Total 51.01 (18.02) 9 - 90 0 - 105DA Prompts 14.27 (9.19) 1 - 36 0 - 45DA Transfer 8.62 (6.93) 0 - 30 0 - 30
Correlations among the variables showed that each of the measures correlated significantly
with one another (Table 6). The DA total score correlated highly with PC, suggesting that the DA is
measuring a similar construct of comprehension as PC. As expected, the number of prompts a student
required on the DA was negatively related to the student’s general comprehension, but not as strongly
associated with PC as the total score. We, therefore, used the total score instead of prompts or transfer
score in all of the subsequent analyses.
30
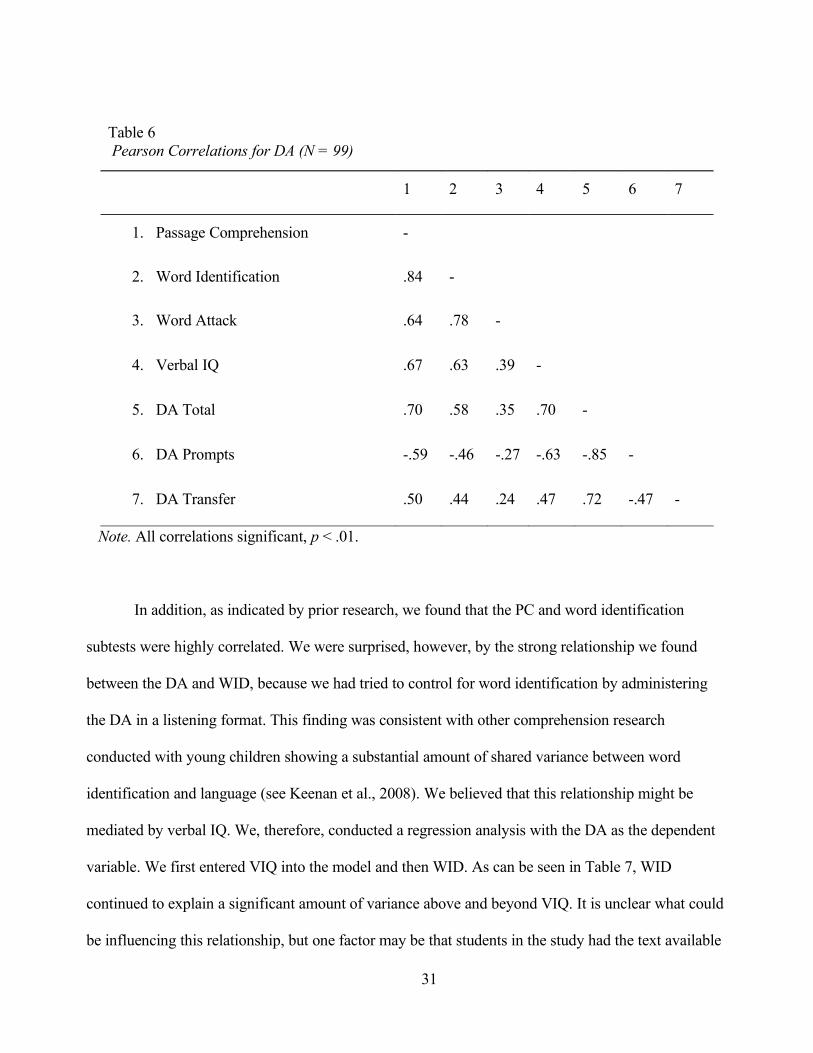
Table 6 Pearson Correlations for DA (N = 99)
1 2 3 4 5 6 7
1. Passage Comprehension -
2. Word Identification .84 -
3. Word Attack .64 .78 -
4. Verbal IQ .67 .63 .39 -
5. DA Total .70 .58 .35 .70 -
6. DA Prompts -.59 -.46 -.27 -.63 -.85 -
7. DA Transfer .50 .44 .24 .47 .72 -.47 -
Note. All correlations significant, p < .01.
In addition, as indicated by prior research, we found that the PC and word identification
subtests were highly correlated. We were surprised, however, by the strong relationship we found
between the DA and WID, because we had tried to control for word identification by administering
the DA in a listening format. This finding was consistent with other comprehension research
conducted with young children showing a substantial amount of shared variance between word
identification and language (see Keenan et al., 2008). We believed that this relationship might be
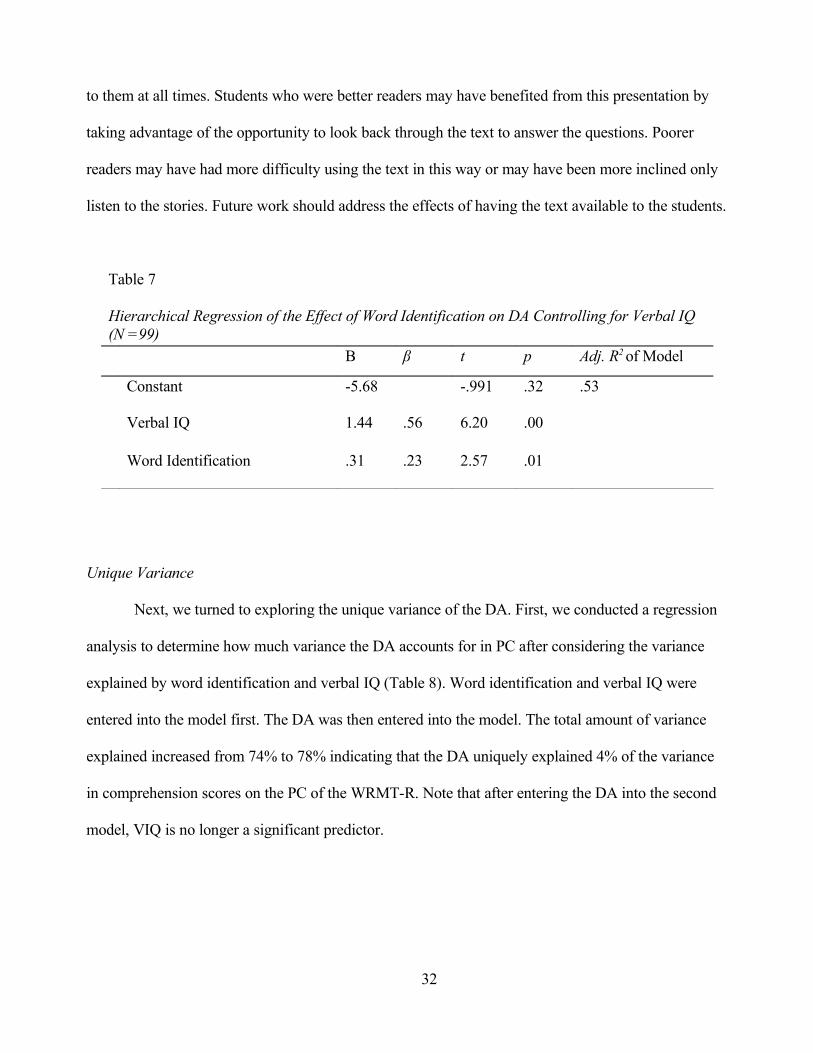
mediated by verbal IQ. We, therefore, conducted a regression analysis with the DA as the dependent
variable. We first entered VIQ into the model and then WID. As can be seen in Table 7, WID
continued to explain a significant amount of variance above and beyond VIQ. It is unclear what could
be influencing this relationship, but one factor may be that students in the study had the text available
31
to them at all times. Students who were better readers may have benefited from this presentation by
taking advantage of the opportunity to look back through the text to answer the questions. Poorer
readers may have had more difficulty using the text in this way or may have been more inclined only
listen to the stories. Future work should address the effects of having the text available to the students.
Table 7
Hierarchical Regression of the Effect of Word Identification on DA Controlling for Verbal IQ (N =99)
B β t p Adj. R2 of Model
Constant -5.68 -.991 .32 .53
Verbal IQ 1.44 .56 6.20 .00
Word Identification .31 .23 2.57 .01
Unique Variance
Next, we turned to exploring the unique variance of the DA. First, we conducted a regression
analysis to determine how much variance the DA accounts for in PC after considering the variance
explained by word identification and verbal IQ (Table 8). Word identification and verbal IQ were
entered into the model first. The DA was then entered into the model. The total amount of variance
explained increased from 74% to 78% indicating that the DA uniquely explained 4% of the variance
in comprehension scores on the PC of the WRMT-R. Note that after entering the DA into the second
model, VIQ is no longer a significant predictor.
32

Table 8
Hierarchical Regression Analysis Estimating the Unique Variance Associated with the DA Using the WRMT-R Comprehension Subtest as the Dependent Measure and Controlling for Word Identification and Verbal IQ (N = 99)
B β t p Adj. R2 of Model
Model 1 Constant 2.50 1.93 .05 .74Word Identification 0.28 .69 10.36 .00Verbal IQ 0.19 .24 3.56 .01
Model 2Constant 2.96 2.43 .02 .78*Word Reading 0.26 .63 9.73 .00Verbal IQ 0.07 .09 1.17 .24DA Total .082 .022 3.81 .00
Note. *Significant F Δ (1,95) = 14.52, p < .00
The unique variance explained in PC by the DA does not seem like a lot, but it does indicate
that the DA is picking up something that word identification and verbal IQ are not addressing. With
PC and WID being very strongly correlated, it is interesting that the DA picks up any unique variance
beyond word identification and verbal IQ. These results bolster the case that the DA is tapping a
comprehension skill. Although promising, establishing the unique variance associated on the DA
using the PC as the dependent measure is probably inadequate for establishing the possible utility of
the test. The DA was created to fill a gap not being addressed by traditional reading comprehension
measures for primary students. Many of these measures have been found to be dependent on word
identification, not comprehension. The constructs the DA was created to capture (i.e., responsiveness
to instruction, inferential comprehension, and listening comprehension) are different than the
constructs underlying many current reading comprehension measures. Therefore, many of the
constructs intended to be captured by the DA are not represented in the 4% unique variance, because
33
the PC does not address these constructs. We believe that because the DA addresses these skills, it
may be better suited to find students likely to have reading problems due to comprehension deficits.
Ultimately, this hypothesis can only be tested by establishing the predictive power of the DA. The
true test of its utility will be determined when we retest the students in fourth grade.
Student Profiles According to the Simple View
The DA was designed to identify students that are likely to develop late emerging RD due to
reading comprehension problems, because traditional reading comprehension tests have been unable
to accurately identify these students. Therefore, we wanted to compare how well the PC and DA
capture intra-individual skill profiles based on the simple view of reading (Gough & Tunmer, 1986).
This is only a concurrent look at how these tests classify students. No conclusions about the predictive
validity of the DA can be drawn from these plots, because we do not know if the scores from the DA
are stable over time or if the DA will be able to predict which students will likely become poor
comprehenders. In addition, any differences in classification could be due to the lower reliability of
the DA instead of true intra-individual skill differences of the students. That being said, the pattern of
correlations does suggest that the two tests may be tapping different skills. For example, the DA had a
strong relationship with PC, and PC was highly correlated with WID, the DA total had a weaker
relationship with WID. The scatter plots in Figures 3 and 4, show a stronger relationship between
WID and PC than the relationship between WID and the DA, indicating that more children have
substantial intra-individual differences in their reading skills on the DA as compared to the PC.
Although we cannot rule out the possibility that the spread in scores seen with the DA may be due to
measurement error, the pattern of correlations gives some credence to the idea that the differences
displayed may be due to the differences in the constructs underlying the tests.
34

Figure 3. Scatter plot of WID and DA
35

Figure 4. Scatter plot of WID and PC
To better illustrate these classification differences and consider the subgroup we were most
interested in, poor comprehenders, we ranked students on each measure as low (z-score ≥ -1), low-
average (z-score > - 1 but ≤ 0), high-average (z-score > 0 but < +1), and high (z-score ≥ +1). Note that
although a cut-off score of -1 is commonly used to identify poor readers, this score is arbitrary and
these groupings would change if the cut-off score were moved. Again, this example is used only to
illustrate differences between the information gathered from each test. The number of students
36

identified for low, low-average, high-average, and high is presented in Tables 9 and 10. Of particular
interest are the students identified as low on the DA and PC. The DA identified 10 students who have
average to above average word identification skill, but poor comprehension (i.e. poor comprehender
subtype). PC, on the other hand, identified only 3 such students. The DA also indicated that most of
the students who were low in word identification were low-average in comprehension. In contrast, the
PC showed little differentiation between low readers. This finding is consistent with other research
showing that PC relies heavily on decoding skills. These results suggest that the DA may be better
than PC at identifying intra-individual differences in young children’s reading abilities. It is yet to be
seen, however, if the DA will be able to accurately predict later reading comprehension scores.
Table 9
Student Profiles Based on WRMT-R Word Identification and Passage Comprehension (n = 99)
Word Identification
lowlow-average
high-average high
low 15 1 1 1 18
PC
low-average 3 19 14 0 36
high-average 0 6 13 7 26 high 0 1 8 10 19 18 27 36 18Note. Low was equal to or less than a z-score of -1. Low-average was more than a z-score of -1, but less than 0. Average-high was more than 0, but less than a z-score of 1. High was equal to or more than a z-score of 1.
37
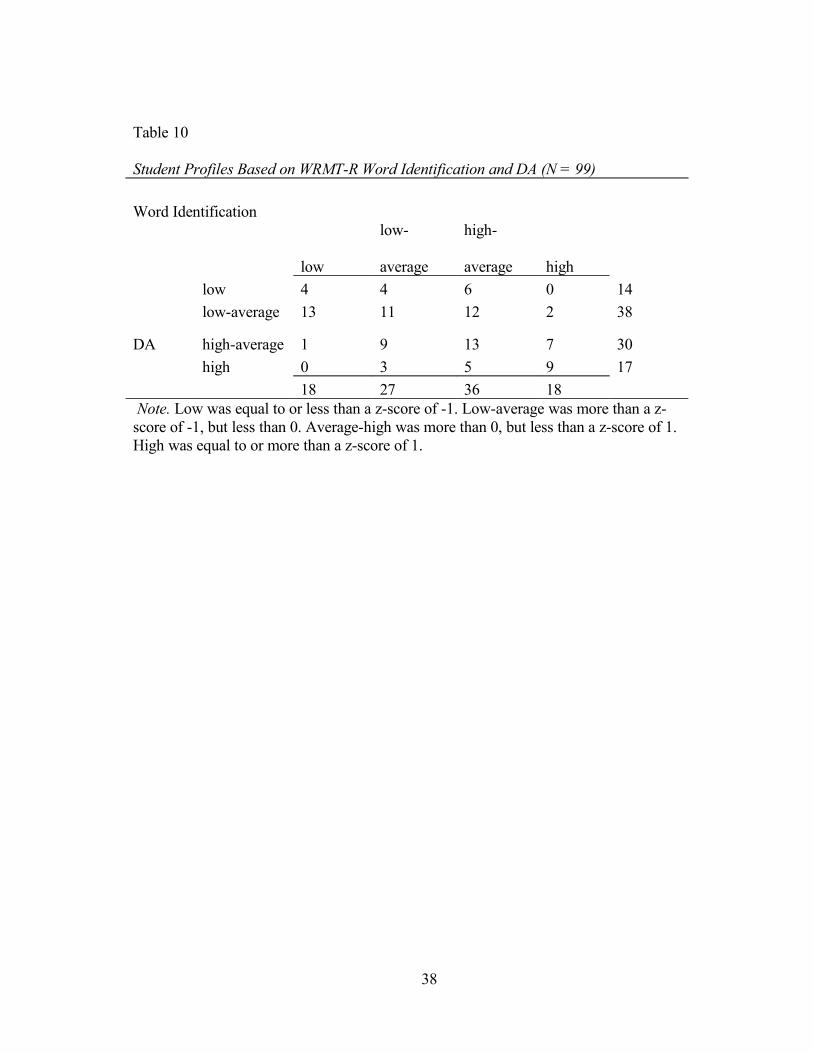
Table 10
Student Profiles Based on WRMT-R Word Identification and DA (N = 99)
Word Identification
low
low-
average
high-
average high
low 4 4 6 0 14
DA
low-average 13 11 12 2 38
high-average 1 9 13 7 30
high 0 3 5 9 17
18 27 36 18 Note. Low was equal to or less than a z-score of -1. Low-average was more than a z-score of -1, but less than 0. Average-high was more than 0, but less than a z-score of 1. High was equal to or more than a z-score of 1.
38
CHAPTER IV
GENERAL DISCUSSION
Providing early intervention for children with poor comprehension is dependent on accurate
identification. Recently, researchers have turned a critical eye toward standardized measures of
reading comprehension asking important questions about what these tests are actually measuring.
There is a concern that the insensitivity of reading comprehension measures at the primary level may
be impeding early identification and intervention of reading comprehension deficits. Addressing some
of the concerns, the RAND Reading Study Group (RRSG; 2002) suggested guidelines for developing
measures for the identification of poor comprehenders including that comprehension tests should be
driven by reading theory, reliable and valid at the item level, sensitive to developmental shifts in
reading, and informative to practitioners. With this in mind, we designed a DA to help identify
children at risk for developing RD due to comprehension difficulties. We used a dynamic format
because of the potential of DA to measure the actual learning process and provide a window into a
child’s responsiveness to instruction. We hypothesized that a dynamic test tapping inferential
comprehension, independent of word reading skill, may provide better prediction than current
comprehension measures.
Findings from our initial consideration of the reliability and concurrent validity of the measure
are encouraging. In the first study, the test was shown to have adequate internal consistency. In the
second study, we focused on exploring the validity of the dynamic test and found that the DA had a
strong relationship to PC, a validated reading comprehension measure. The DA explained unique
variance in PC scores after taking into account WID and VIQ suggesting it may be useful in finding
students likely to develop comprehension problems. In addition, although our classification example
39
was exploratory, the pattern of results was interesting. A comparison of the DA and WID identified
more students exhibiting a poor comprehender profile than the PC. The plot for the WID and DA also
identify many children across reading levels that show marked differences in their word reading and
comprehension abilities.
Catts, Hogan, & Fey (2003) suggested that identifying subtypes of poor readers according to
the simple view might be helpful for designing instruction. Identifying the intra-individual profiles
may be helpful, not only to better meet the needs of struggling readers, but also to meet the needs of
other students who have discrepant profiles. Teachers could use this information to more effectively
allocate instructional time and differentiate instruction according to the needs of each student based
on his or her reading profile. Many current measures of reading comprehension are unlikely to pick up
these differences in young children, underscoring the need for assessments that isolate comprehension
and word identification.
Limitations
Questions still remain about the test items and passages, as well as, the effects of allowing the
students to view the text as it was read to them. In the first study, we found that the causal questions
did not operate as would be expected from previous research. In addition, it was unclear why one of
the passages was particularly difficult for the children. Unfortunately, because the administration
dates overlapped with the two samples, we could not revise or remove any passages or items before
administering the DA. In addition, it is unclear what the relationship is between word identification
and the DA. Despite trying to isolate word identification skills by developing a listening
comprehension measure, in the second study, we found that some variance in the DA could be
explained by word identification skills even after considering the mediation of verbal IQ. More work
40
will have to be done to consider the differential effects of having the text available for good and poor
readers.
The design of this study also limits the conclusions that can be drawn about the importance of
the dynamic aspect of the DA. The first concern is that an evaluation of the effectiveness of the
inference instruction and feedback was not conducted. Unfortunately, we could not make a
comparison between the static and dynamic conditions because of the differences in administration
(i.e., the children in the static condition were tested in a group format with written responses and the
children in the dynamic condition were tested individually with oral responses) and the lack of
random assignment of individuals to conditions.
In addition, the design of this study did not allow us to adequately assess the relative
contributions of various aspects of the DA. For example, although the PC and DA are correlated, they
classify students differently. Are the differences found between the DA and PC because the DA is
tapping inferential comprehension, listening comprehension, responsiveness to learning, or a
combination of some, or all, of these aspects? In a previous study, we found that although the
listening comprehension variable looked promising for predicting students with late-emerging RD, it
produced too many false-positives (Compton et al., 2008). Thus, it is likely that the DA will have to
explain variance above and beyond that attributed to the listening method to help in the prediction of
late emerging poor comprehenders. The inclusion of a listening comprehension measure and validated
measure of inferential comprehension in our test battery would have been beneficial for teasing apart
effects due to method and test content.
41

Future Research
It is unlikely that one assessment tool or method will solely lead to the accurate early
identification of comprehension deficits (Sweet, 2005). Identification will most likely require a
battery of assessments and use of latent variable techniques so that effects due to measurement
methods can be removed (Francis, Fletcher, Catts, et al., 2005). Therefore, future work in establishing
the construct validity of the DA should be conducted with larger samples and more diverse measures.
Latent variable models can then be used to evaluate the discriminant and convergent validity of the
measure while controlling for effects due to method and test error. A larger sample would also allow
the item and passage equivalency issues to be resolved using methods based on item response theory.
Future work with the DA needs to establish its predictive validity, the effectiveness of the
inference instruction, and more thoroughly address issues of construct validity. In addition, the
amount of time and resources required for administering the test must be addressed. There is a balance
that must be maintained between the extra information gained from the dynamic test and the resources
required to administer it. The inference training required time that may not be necessary for the test to
predict comprehension deficits. In addition, the administration of the prompts requires the test to be
administered to each child individually. The design of these studies did not allow us to evaluate the
effectiveness of the prompts. Although prior intervention studies have found that instruction orienting
children to relevant information increases reading comprehension, we have no way to know if the
providing clues helped the children make the inferences. It is the possible that the pattern of responses
could be an artifact of allowing multiple opportunities to answer a question.
One option for reducing the costs of administration in future research is to use a gating is to
administer the test in two phases. Students could first be screened by a group-administered static test.
Students who score poorly on this test could then be administered a dynamic version of the test. The
amount of time saved in screening would allow the remaining students to be tested over two or more
42

sessions. Increasing the number of dynamic items might allow us to model students’ growth over the
course of the testing session and possibly increase our ability to detect those students who will not
respond to classroom instruction.
In conclusion, the need for early identification and intervention for poor comprehenders is
underscored by recent findings that comprehension abilities exist across different media
(Kendeou et al., 2008). These findings suggest that the problems exhibited by poor comprehenders
could be pervasive and extend beyond the written word. If this is so, poor comprehenders are likely to
have difficulties in many areas of their lives, in and outside of school. Constructing reliable and valid
tests for the early identification of these children will require a new consideration of how tests should
be constructed and what they should measure. We hope that the DA, used in combination with other
tests, will be helpful in differentiating young children who are at risk of developing comprehension
difficulties. In this first attempt in examining the reliability and validity of the measure, we found
some evidence for the internal reliability and construct validity of the DA. Although promising, more
work will need to be conducted to determine the measure’s predictive power, to isolate and
adequately capture children’s responsiveness to the instruction provided, and to determine the
measure’s relative utility among other tests of early comprehension before any definitive
recommendations can be made regarding its use.
43

REFERENCES
Aaron, P. G., Joshi, M., & Williams, K. A. (1999). Not all reading disabilities are alike. Journal of Learning Disabilities, 32, 120-137.
Ackerman, B. P., Jackson, M., & Sherill, L. (1991). Inference modification by children and adults. Journal of Experimental Child Psychology, 52, 166 – 196.
Bonitatibus, G. J., & Beal, C. R. (1996). Finding new meanings: Children’s recognition of interpretive ambiguity in text. Journal of Experimental Child Psychology, 62, 131-150.
Bowyer-Crane, C., & Snowling, M. (2005). Assessing children's inference generation: What do tests of reading comprehension measure? British Journal of Educational Psychology, 75, 189-201.
Bransford, J. D., & Franks, J. J. (1971). The abstraction of linguistic ideas. Cognitive Psychology, 2, 331-350.
Cain, K., & Oakhill, J.V. (1999). Inference making ability and its relation to comprehensionfailure in young children. Reading and Writing: An Interdisciplinary Journal, 11, 489-503.
Cain, K., & Oakhill, J.V. (2007). Reading comprehension difficulties: Correlates, causes, and consequences. In K. Cain & J. Oakhill (Eds.), Children’s comprehension problems in oral and written language: A cognitive perspective (pp. 41-76). New York: Guilford Press.
Caffrey, E., Fuchs, D., & Fuchs, L. S. (2008). The predictive validity of dynamic assessment: A review. The Journal of Special Education, 41, 254-270.
Campione, J. C., & Brown, A. L. (1987). Linking dynamic assessment with school achievement. In C. S. Lidz (Ed.), Dynamic Testing (pp.82 – 115). New York: Guilford Press.
Campione, J. C., Brown, A. L., Ferrara, R. A., Jones, R. S., & Steinberg, E. (1985). Breakdowns in flexible use of information: Intelligence-related differences in transfer following equivalent learning performance. Intelligence, 9, 297-315.
Carnine, D. W., Kameenui, E. J. & Woolfson, N. (1982). Training of textual dimensions related to text-based inferences. Journal of Reading Behavior, 14(3), 335-340.
Casteel, M. A., & Simpson, G. B. (1991). Textual coherence and the development of inferential generation skills. Journal of Research in Reading, 14, 116-129.
Catts, H. W., Adlof, S. M., & Weismer, S. E. (2006). Language processing deficits in poor comprehenders: A case for the simple view of reading. Journal of Speech, Language, and Hearing Research, 49, 278-293.
44

Catts, H. W., Fey, M. E., Zhang, X., & Tomblin, J. B. (1999). Language basis of reading and reading disabilities: Evidence from a longitudinal investigation. Scientific Studies of Reading, 3, 331-361.
Catts, H. W., Hogan, T. P., & Adlof, S. M. (2005). Developmental changes in reading and reading disabilities. In H. Catts & A. Kamhi (Eds.), Connections between language and reading disabilities (pp. 25-40). Mahwah: NJ: Erlbaum.
Catts, H. W., & Compton, D. L. (2009). Exploring subtypes of late-emerging RD using latent Markov modeling. Manuscript in preparation.
Compton, D. L., Fuchs, D. & Fuchs, L. S. (2006). Response-to-Intervention as an Approach to Preventing and Identifying Learning Disabilities in Reading. Funded by U.S. Department of education, Institute of Education Science.
Compton, D. L., Fuchs, D., Fuchs, L. S., Elleman, A. M., & Gilbert, J. K. (2008).Tracking children who fly below the radar: Latent transition modeling of students with late-emerging reading disability. Learning and Individual Differences, 18, 329-337.
Cutting, L. E., & Scarborough, H. S. (2006). Prediction of reading comprehension: Relative contributions of word recognition, language proficiency, and other cognitive skills can depend on how comprehension is measured. Scientific Studies of Reading, 10, 277 – 299.
Dewitz, P., Carr, E. M., & Patberg, J. P. (1987). Effects of inference training on comprehension and comprehension monitoring. Reading Research Quarterly, 22, 99-120.
Duke, N. K. (2000). For the rich it’s richer: Print environments and experience offered to first-grade students in very low- and very high- SES school districts. American Educational Research Journal, 37, 456-457.
Ehrlich, M., Remond, M., & Tardieu, H. (1999). Processing of anaphoric devices in young skilled and less skilled comprehenders: Differences in metacognitive monitoring. Reading and Writing: An Interdisciplinary Journal, 11, 29-63.
Francis, D. J., Fletcher, J. M., Catts, H. W., & Tomblin, J. B. (2005). Dimensions affecting the assessment of reading comprehension. In S. G. Paris, & S. A. Stahl (Eds.), Children’s Reading Comprehension and Assessment (pp. 369 - 394). Mahwah, NJ: Lawrence Erlbaum Associates.
Francis, D. J., Fletcher, J. M., Stuebing, K. K., Lyon, G. R., Shaywitz, B. A., & Shaywitz, S. E. (2005) Psychometric approaches to the identification of LD: IQ and achievement scores are not sufficient. Journal of Learning Disabilities, 38, 98-108.
Gough, P. B., Hoover, W. A., & Peterson, C. L. (1996). Some observations on a simple view of reading. In C. Cornoldi & J. Oakhill (Eds.), Reading comprehension difficulties: Processes and intervention (pp. 1-13). Mahwah, NJ: Erlbaum.
45
Gough, P. B., & Tunmer, W. E. (1986). Decoding, reading, and reading disability. RASE: Remedial and Special Education, 7, 6-10.
Graesser, C. A., Leon, J., & Otero, J. A. (2002). Introduction to the psychology of science text comprehension. In J. Otero, J. A. Leon, & A. C. Graesser (Eds.), The psychology of science text comprehension (pp. 1-15). Mahwah, NJ: Erlbaum.
Graesser, A. C., McNamara, D. S., Louwerse, M. M., & Cai, Z. (2004). Coh-Metrix: Analysis of text on cohesion and language. Behavior Research Methods, Instruments, and Computers, 36, 193-202.
Graesser, C.A., Singer, M., & Tarabasso, T. (1994). Constructing inference during narrative text comprehension. Psychological Reviews, 3, 371-395.
Grigorenko, E. L., & Sternberg, R. J. (1998). Dynamic testing. Psychological Review, 124, 75 – 111.
Grigorenko, E. L. (2009). Dynamic assessment and response to intervention: Two sides of one coin. Journal of Learning Disabilities, 42, 11-132.
Hansen, J., & Pearson, D.P. (1983). An instructional study: improving the inferential comprehension of good and poor fourth-grade readers. Journal of Educational Psychology, 75, 821-829.
Holmes, B. C. (1985). The effects of a strategy and sequenced materials on the inferential comprehension of disabled readers. Journal of Learning Disabilities, 18, 543-546.
Kame’enui, E. J., Fuchs, L., Francis, D. J., Good, R., O’Connor, R. E., Simmons, D. C., Tindal, G., Torgeson, J. K. (2006). The adequacy of tools for assessing reading competence: A framework and review. Educational Researcher, 35, 3-11.
Keenan, J. M., Betjemann, R. S., & Olson, R. K. (2008). Reading comprehension tests vary in the skills they assess: Differential dependence on decoding and oral comprehension. Scientific Studies of Reading, 12, 281-300.
Kendeou, P., Bohn-Gettler, C., White, M. J., & van den Broek, P. (2008) Children’s inference generation across different media. Journal of Research in Reading, 31, 259-272.
Kintsch, W., & Kintsch, E. (2005). Comprehension. In S. G. Paris, & S. A. Stahl (Eds.), Children’s Reading Comprehension and Assessment (pp. 71-104). Mahwah, NJ: Lawrence Erlbaum Associates.
Leach, J., Scarborough, H., & Rescorla, L. (2003). Late-emerging reading disabilities. Journal of Educational Psychology, 95, 211-224.
Leslie, L., & Caldwell, J. (2001). Qualitative Reading Inventory-3. New York: Addison Wesley Longman.
46
Lipka, O., Lesaux, N. K., & Siegel, L. S. (2006). Retrospective analyses of the reading development of Grade 4 students with reading disabilities: Risk status and profiles over 5 years. Journal of Learning Disabilities, 39, 364-378.
Markwardt, F. C. (1997). Peabody Individual Achievement Test-Revised (normative update). Bloomington, MN: Pearson Assessments.
McNamara, D. S., Kintsch, E., Songer, N., & Kintsch, W. (1996). Are good texts always better? Interactions of text coherence, background knowledge, and levels of understanding in learning from text. Cognition and Instruction, 14, 1-43.
McNamara, D. S., O’Reilly, T., & deVega, M. (2007). Comprehension skill, inference making, and the role of knowledge. In F. Schmalhofer and C. A. Perfetti (Eds.). Higher Level Language Processes in the Brain: Inference and Comprehension Processes (pp. 234 -251). Mahwah, New Jersey: Lawrence Erlbaum Associates.
Myers, E. (1999). Secrets of the Rainforest. New Jersey: Modern Curriculum Press.
Nation, K., & Snowling, M. (1997). Assessing reading difficulties: The validity and utility of current measures of reading skill. British Journal of Educational Psychology, 67, 359 – 370.
Oakhill, J. V. (1984). Inferential and memory skills in children's comprehension of stories. British Journal of Educational Psychology, 54, 31-39.
Perfetti, C. A., Marron, M. A., & Foltz, P. W. (1996). Sources of comprehension failure: Theoretical perspectives and case studies. In C. Cornoldi & J. Oakhill (Eds), Reading comprehension difficulties (pp. 137-165). Mahwah, New Jersey: Lawrence Erlbaum Associates.
Perfetti, C. A., Landi, N., & Oakhill, J. (2005). The acquisition of reading comprehension skill. In M. J. Snowling & C. Hulme (Eds), The science of reading: A handbook. Oxford: Blackwell.
Psychological Corporation (1999). WASI manual. San Antonio: The Psychological Corporation.
RAND Reading Study Group (RRSG; 2002). Reading for understanding: Toward an R & D program in reading comprehension. Washington, DC: RAND Education.
Reutzel, D.R. , & Hollingsworth, P.M. (1985). Highlighting key vocabulary: a generative-reciprocal procedure for teaching selected inference types. Reading Research Quarterly, 23(3), 358-378.
Sternberg, R. J., & Grigorenko, E. L. (2002). Dynamic testing: The nature and measurement of learning potential. Cambridge, UK: Cambridge University Press.
Sweet, A. P. (2005). Assessment of reading comprehension: The RAND Reading Study Group vision. In S. G. Paris, & S. A. Stahl (Eds.), Children’s Reading Comprehension and Assessment (pp. 3 - 12). Mahwah, NJ: Lawrence Erlbaum Associates.
47
Thorndyke, P. W. (1976). The role of inferences in discourse comprehension. Journal of Verbal Learning and Verbal Behavior, 15, 437-446.
Torgesen, J. K., Wagner, R. K., & Rashotte, C. A. (1997). Test of Word Reading Efficiency. Austin, TX: Pro-Ed.
Trabasso, T., & van den Broek, P. W. (1985). Causal relatedness and importance of story events. Journal Memory and Language, 24, 595-611.
van den Broek, P., & Lorch, R. F. (1993). Network representations of causal relations in memory for narrative texts: Evidence from primed recognition. Discourse Processes, 16, 75 – 98.
Vygotsky, L. S. (1962). Thought and language. Cambridge, MA: MIT Press.
Wiederholt, L., & Bryant, B. (1992). Examiner’s manual: Gray Oral Reading Test-3. Austin, TX: Pro-Ed.
Winne, P. H., Graham, L. & Prock, L. (1993). A model of poor readers' text-based inferencing: Effects of explanatory feedback. Reading Research Quarterly, 28(1), 53-66.
Woodcock, R., W. (1998). Woodcock Reading Mastery Test –Revised/Normative Update. Circle Pines, MN: AGS.
Woodcock, R. W., McGrew, K. S., & Mather, N. (2001). Woodcock-Johnson III tests of achievement. Itasca, IL: Riverside.
Yuill, N., & Joscelyne, T. (1988). Effect of organizational cues and strategies on good and poor comprehenders' story understanding. Journal of Educational Psychology, 80(2), 152-158.
Yuill, N., & Oakhill, J. (1991). Children’s problems in text comprehension: An experimental investigation. Cambridge, UK: Cambridge University Press.
Yuill, N., & Oakhill, J. (1988). Effects of inference awareness training on poor reading comprehension. Applied Cognitive Psychology, 2(1), 313-345.
48