an 528: pcb dielectric material selection and fiber weave
TRANSCRIPT

090
1 May 1970
RATIONAL METHODS FORENGINE RATING
Michael Wagner
/ f1611
THlE DEPRrMN
AND MARINE ENGINEERIG
yk k t 5 a _
' L w f .. yti tiY C rtz 4 Jyn y 'zya , t.v.; t .
y ice' i °I" rtN,,,t ! y .tt '{ S' .c f' nai,.{' b X ti 1 1 ". G yakf . +
l- c. .s r '_5 r :_ C 3 t" " ,-- w 4:.. ySn " '? t rte F ty Q.
t} is Y st r i i'. ' _vr ^ te"( dw',. ; : r. , k 'IDCZa +.w . , -r._
ft ti.? S t ; .5 J x t r Rt+i 1 '. r t ; t n ,"
'.;" { iy . t' z ? 3 t ?: t 7 r .'"' ,C y c Lhs' 'i .L v Ac \ rti jy
:5n r n v ". .,y. : ^ -'h .y :4c .1 '} _ t l ' x,, Yj v 1y r v 1 t' t. '.
ni .. ter c - t
'
4 l' A G 2ig
..Ar~
RATIONAL METHODS FOR
ENGINE RATING
by
Michael Wagner
Graduate Student
University of Michigan
Department of Naval Architectureand
Marine Engineering
May 1, 1970
PAPER PRESENTED AT OCTOBER 2, 1970 MEETING
THE SOCIETY OF NAVAL ARCHITECTS & MARINE ENGINEERS
GREAT LAKES & GREAT RIVERS SECTION
INTRODUCTION
The purpose of rating an engine is to give a prospective user a
complete picture of the capabilities of the engine in relation to the
system in which it is expected to operate. To describe the interaction
of the engine and the system, a set of standard measurable qualities.
peculiar to each engine and of pertenance to the rest of the system is
required. These qualities, presently in use as standards, are well known
and are stated in different manners by various manufacturers and users,
but fall eventually into relationships between power, engine speed (RPM),
fuel consumption, displacement, and cylinder pressure. These qualities,
when used with principles of engineering, are sufficient to insure that
the system in which the engine is to operate is mechanically sound.
There is, however, another consideration that an engineer should make
when studying the application of a power system. This is a judgement
of how long and how effectively the system will operate before expensive
repairs or replacements become -necessary. This brings to mind the
problem of engine life and how it varies with the individual application.
It seems only reasonable that some sort of data should be furnished by
the manufacturer in addition to the other rating information, which
will facilitate the engineer's selection of a proper engine to perform
a given task.
There are myriads of possibilities to choose from when one tries
to pick a criterion for judging engine life. Many sources say that
crankshaft bearing life'is the controlling factor; others claim that
wrist pin bearings will eventually determine the life; while still
others believe in cylinder component distress as the limiting variable.
To a large extent, each point of view is correct, depending upon the
peculiarities of the particular engine in question. However, in the
end most involved parties will agree that if the individual components
of the engine are properly designed and installed, the part which will
experience the earliest natural failure (due to wear) is the cylinder
kit. This seems reasonable from the standpoint that the highest
temperatures and pressures and the least amount of lubricating oil
are concentrated in this single area. In addition, whenever a piece
does fail in the region of the piston cylinder, the reapir necessitated
is usually extensive and expensive.
For the purpose of this study, failure or extreme wear of the
cylinder components to the point where they must be replaced will
serve as the basis for one engine life. The procedures developed in
subsequent pages are not peculiar to this basis, however, but may be
applied to any terminal wear or failure criterion which the user wishes
to select.
Having decided the matter of how to designate one engine life,
the problem of determining an acceptable length for that life naturally
arises. The first point to make clear when talking about engine life
is that there are an infinite number of possible lengths of life which
any engine can experience, barring abnormal failures. Wear in an engine,
as in any other machine, is a function of the number of cycles it is
expected to endure and the load which it experiences during each of these
cycles, assuming, of course, that maintenance is properly performed at
all times. Obviously, then, if the loading per cycle is decreased, the
number of possible operating cycles should increase, thus yielding a
longer life span. On the other hand, if the load per cycle is increased,
the number of possible operating cycles should decrease proportionally,
thereby shortening the total'life of the engine. In the mind's eye,
one can stretch this idea to the point at which an engine should exist
that will carry an infinite load but will last less than one cycle; or,
conversely, will carry no load and last forever. There is little doubt
of the facetiousness of these extreme cases, but they do serve the
purpose of domonstrating the existence of a range of engine operating
conditions rather than the usual one, two, or three points of operation
specified in most manufacturers published ratings.*
Herein lies the principal shortcoming of the existing rating
system. Instead of selling an engine which costs one price but can
furnish its user with a continuum of possible operating characteristics
ranging from a great deal of power for a short period of time to a
very small amount of power for an extended period of time, the manufacturer
truncates his market by vending an engine which he states will perform
at a given power output or two (or less) for a minimum specified (though
not usually publically specified) period of time. Since the real nature
of the engine is more flexible than this, there should be a method for
exploiting this versitility in a manner which will be beneficial to both
the manufacturer and the user.
In order to find such a method one must have a basis for judgement.
There are several measures of merit which might be called upon to provide
a basis for determining the optimum power output and length fo engine
life for a given application. For instance, in a military setting the
controlling factor could be the average life of the powered system in
combat. In an emergency back up system the most important factor might
be dependability over extended periods of time. The most common measure
* as upper limits
of merit, however, is economic feasibility. The problem of being faced
with the choice of either a system which will increase income by
operating at a high power output level, but which will also cost more
to maintain by virtue of the fact that it will have to be rebuilt more
often, or of a system which will run for long periods of time without
incurring failure or downtime, but which will also reduce income for
the same initial investment, is a complex one indeed. This problem is
not a new one and has been investigated and welldefined in other areas
where appropriate data is available. The remainder of this paper
will be devoted to:
1. defining what type of information is necessary to
provide a basis for determining the proper life-power
output ratio to optimize the profit of the power system
by using existing theory
2. presenting data obtained from engine manufacturers and
users which is pertinent to making such a determination.
PART I ENGINE RATINGS AND ECONOMICS
It is proposed that, given a ship operating in a reasonably
well-defined economic climate and given a power plant which can be
operated at a wide variety of power outputs to be used for that ship's
propulsion, the output rating of that power plant should be determinable
by an economic study involving six basic factors:
1. Engine operating costs as a function of power output.
2. Engine maintenance costs as a function of power output.
3. Initial engine costs as a function of power output.
4. Engine life (time between major overhauls) as a function
of power output.
5. Earning power of ship as a function of engine power output.
6. Less well-defined measures of merit (predictability of
failure, safety, parts unity, etc.).
Once the above factors areknown, a dererministic economic study
becomes a distinct possibility. The factors may be combined to give
an infinite set of economic operational characteristics for any given
ship in any given economic climate. From the set of operational
characteristics, a curve of characteristics may be plotted to indicate
an operation point which optimizes return on investdient.
To demonstrate this argument a little more clearly, suppose that
in addition to the things which are usually known about the economics
of the marine system (cost of building the ship, ship maintenance, ship
operating costs, labor expenses, etc.), the above six factors are known.
A cash flow diagram (Reference 1) for a years operation should be easy
-2-
to construct might be similar to that shown in Figure 1. The three
basic inputs of Figure 1 are directly affected by the first three
engine output characteristics in the following way:
1. P, the capital investment, is affected by the initial
cost of the engine #1 (usually about 20% of the total
cost of the ship.).
2. N, the depreciation life of the marine system, will be
affected by the life of the power system.
3. Y, the operating costs of the marine system, will be affected
by the operating and maintenance costs of the power system.
4. Gross income is affected by factor #5.
Keeping in mind all of the time that each of the three characteristics
mentioned is directly related to the way the engine is rated, it becomes
quite clear thet the annual cash flow is, in turn, closely affected by
engine output ratings. It should be noticed that the fourth factor
(engine life vs. output rating) does not enter, in its entirety, into the
annual cashf low diagram unlses rebuild happens to occur every year. Since
this is not the usual case and since the economic life of the ship is far
greater than one year long, it is necessary to extend an economic study to
cover the entire depreciable life of the system. Each year of the study
would be representable by a figure similar to Figure 1. Each of these, in
turn, would be reducible to two indicators such as "after tax income" or
"annual cost." These latter figures may be then combined to yield an
over-all economic picture such as that in Figure 2. With Figure 2 it
becomes possible to make full use of the fourth relationship of engine
rating. In the general diagram the engine rebuild period is every three
years. By changing the engine's output rating this cost might occur as often
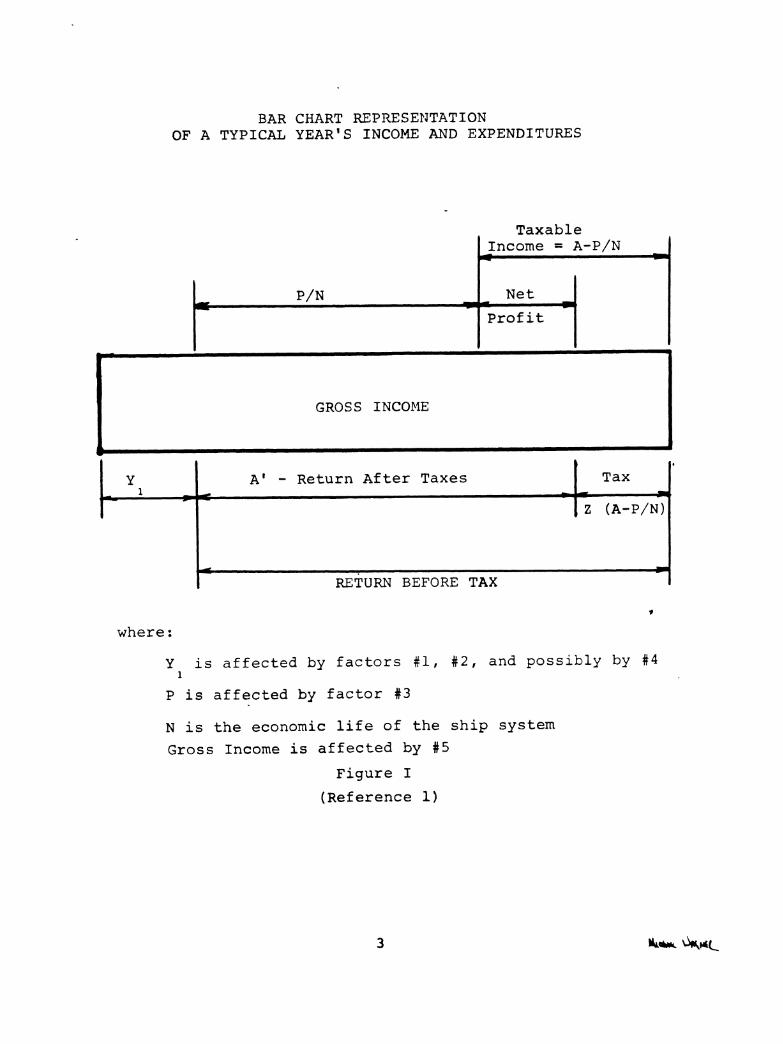
BAR CHART REPRESENTATIONOF A TYPICAL YEAR'S INCOME AND EXPENDITURES
TaxableIncome = A-P/N
Net1~ P/N-I
F Profit
GROSS INCOME
Y A' - Return After Taxes Tax
I- Z (A-P/N)
RETURN BEFORE TAX
where:
Y is affected by factors #1, #2, and possibly by #41
P is affected by factor #3
N is the economic life of the ship system
Gross Income is affected by #5
Figure I
(Reference 1)
3 wL L

CASH FLOW DIAGRAM FOR A SHIP OPERATING WITH A THREE YEAR ENGINE OVERHAUL.
ALL OTIIER' INCOME & EXPENSES DISTRIBUTED UNIFORMLY
INCOME
1 2 3
4 5 6 7 8 9 10 11 12 13 YEARS
EXPENSE
Figure 2
(Reference 1)

-5-
as every year or as seldom as every 6 or 7 years. At first glance it
looks as if the only logical course of action is to make the frequency
of rebuild as long as possible since this would decrease the total
number of rebuilds and the total amount of downtime during the life-
time of the ship. However, it must be remembered that each time the
rebuild interval is increased the annual income is decreased by reason
of the ship's speed being decreased due to a necessary reduction in
output power (factors #4 and #5). It also should be remembered that
the initial cost of the engine and the economic life of the machinery
can have an effect on the structure of the cash flow diagram as shown
in Figure 1.
After Figure 2 has been described for several possible engine ratings
and operating conditions, any one of several methods of economic
reduction may be usedito compare the various possible conditions (DCF,
NPV, delta DCF, RFR, cost of service (Reference 1)) and once these have
been employed their respective results may be plotted to give the
investigat6r a method for determining the optimum engine rating to be
used in his marine systems operation.
PART II ENGINE RATINGS AND COSTS
With the theories stated in Part I as the premise, an investigation
was initiated to determine the six relationships stated as being
necessary to perform a :eaningful economic analysis of engine rating.
Because of the size of the endeavor and the complexity of the subject,
the results of the investigation were necessarily limited. Therefore,
while the data obtained and here presented is felt to be reliable and
valid, it should be reviewed with the thought in mind that it is
preliminary to more extensive research and is somewhat shallow in its
coverage of the field describable as Diesel Engines.
A total of ten businesses were contacted to provide three types
of information:
A. Credibility of the theories involved.
B. Present methods being imployed to determine what engine
rating and ship speed should be utilized in a given
operation.
C. The six engine output rating relationships.
A list to firms visited in the course of gathering data, including
contributors and non-contributors, is as follows:
Detroit Diesel
Electromotive Diesel
Fairbanks Morse
Caterpillar
Cummins
Valley Lines
Ohio River Company
-7-
Ashland Oil
Grafton Boat Works
St. Louis Ship
A synopsis of the results is as follows:
A. Credibility
Of the ten firms and eighteen individuals interviewed, only two
felt that there was definitely no need or use for additional engine
rating information. However, only two individuals were actively
attempting to alter the existing system or searching for a better one.
The remainder felt that while there probably was a better method for
doing things, the present one was doing an adequate job and would'be too
expensive to augment.
B. Present Methods of Determining Ship Speed and Engine Rating
Ship Speed: Some disagreement seemed to exist among builders and
owners as to who specifies ship speed (and thereby governs one of its
economic characteristics), the owner-operator or the builder-designer.
The builders were of the unanimous opinion that it was the owners who
made such a specification, while the owners were of the opinion that
it was on the builder-designers recommendation that he made a speed
selection. Both, however, were in complete agreement about the fact
that there was an undesirably high amount of guesswork involved in
specifying ship speed.
Engine Power Rating: The methods employed by engine manufacturers
for setting an upper limit on power output and the reasons lying behind
selecting the method were consistent over the group interviewed. The
principle method employed in each case was the use of intrinsic judge-
ment on the part of the staff level engineering personnel. This
-8-
judgement was motivated by the idea of protecting the outflow of cash
due to waranty claims. It was felt by those involved in power rating
that the figures listed as maximums for power output reflected an engine
life which was considered by the user to be good enough to require no
waranty by the manufacturer at the time of overhaul. Any life that
fell short of this, of course, would have to be covered by reimbursement.
When asked how they knew that this maximum figure was a true representation
of an acceptible life on the part of the owner-operator, it was stated
that over past years of operation the life given by this maximum figure
was the point at which the owner-operator ceased to request rebuild
aid from teh manufacturer due to premature failure. In short, this life
was what the market would bear and not necessarily the optimum life for
the particular application. It was also noted that none of the engine
manufacturers interviewed had stated in their waranty what length of
life could be expected from the maximum rating. When questioned as to
how they accepted or denied repair requests, it was stated that this also
was a judgement to be made at the staff level, usually governed by the
past or future business relationship with the individual customer.
C. The Six Engine Output Rating Relationships
1. Operating Costs at Various Output Ratings
There are two basic factors affecting this relationship; fuel
consumption and lube oil consumption. Of those interviewed, it was
generally agreed that the oil consumption over the reasonable range of
engine ratings to be considered would rise linearly with engine output.
Published data on oil consumption is available at request from most
engine manufacturers. From published data reviewed, it was noted that
-9-
the oil consumption is directly relatable to engine RPM for a given
cylinder displacement, regardless of power output rating, by the formula:
% rise in oil consumption % rise in RPM.
2. Maintenance Costs vs. Output Ratings
No hard and fast publishable data was available from any of the
sources contacted, but the general feeling among both the engine manu-
facturers and the field maintenance personnel was that the maintenance
costs would rise linearly at a 1 to 1 ratio with the engine's output
ratings. Major considerations for making such a judgement were:
1. Increased failure of minor associated parts.
2. More frequent changing of oil, fuel, and air filters.
3. More constant necessary personal attention to minor repairs
(tightening loose bolts, etc.) because of engine sensitivity
to minor failures.
4. More constant personal attention to watching for and
predicting major failures, since major failures would tend
to be more costly as the engine ratings increased.
5. Earlier breakdown of lubricating oil.
When questioned about the fifth factor, manufacturers felt that
the premature breakdown of lubricating oil would accur but would not
fall outside their normally specified period of oil renewal for a
reasonable range of output ratings.
3. Initial Costs vs. Engine Output Ratings
It was the original intention, when the study began, to leave
this realm of interest for further investigation since accessability
to pricing data is reasonably good. However, some rough figures have
been obtained for estimating purposes. The data represents a cross-
section of engine manufacturers and is divided into three basic
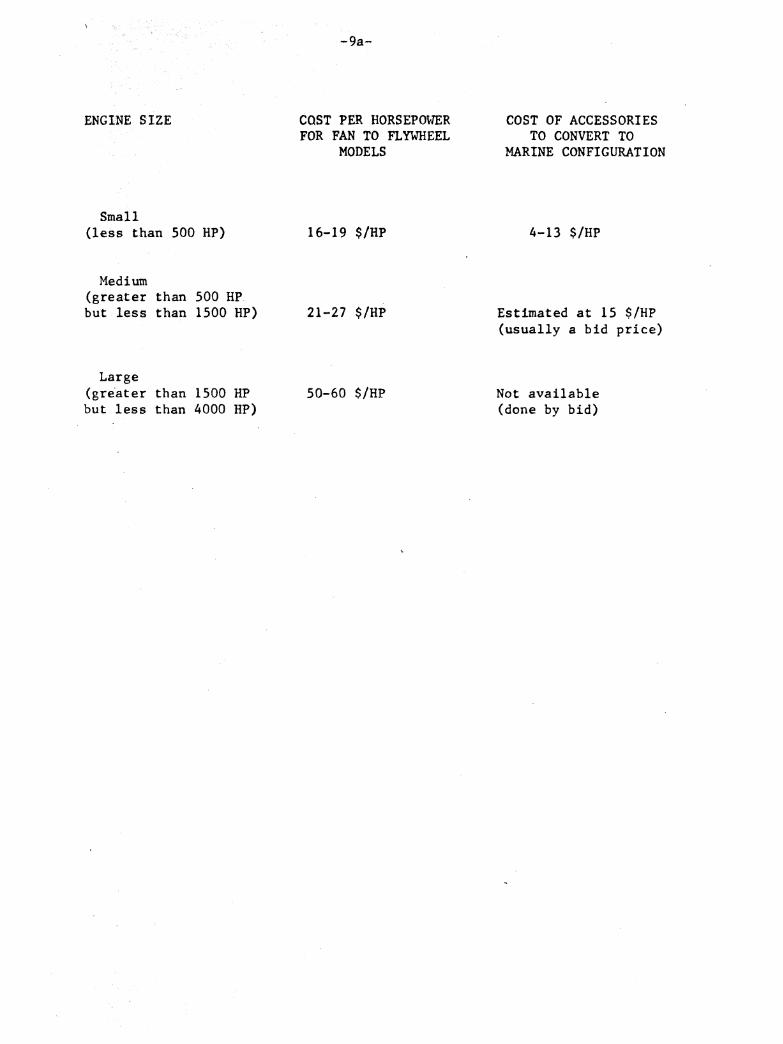
ENGINE SIZE COST PER HORSEPOWERFOR FAN TO FLYWHEEL
MODELS
Small(less than 500 HP)
Medium(greater than 500 HPbut less than 1500 HP)
Large(greater than 1500 HPbut less than 4000 HP)
16-19 $/HP
21-27 $/HP
50-60 $/HP
COST OF ACCESSORIESTO CONVERT TO
MARINE CONFIGURATION
4-13 $/HP
Estimated at 15 $/HP(usually a bid price)
Not available(done by bid)
-10-
categories. The first two categories represent figures applicable to
small and medium displacement engines and each contains two sets of data;
first, a $/HP figure for the standard bare engine; second, a $/HP
figure for adapting the bare engine to marine use (heat exchangers, raw
water system, etc.). The third category lists approximate $/HP figures
for large displacement engines. It should be mentioned at this point
that no hard and fast pricing data was available for the large displacement
engines, as it was for the small and medium categories, since most sales
work in this area is done by bid only. The figures given represent
ballpark estimates made by several sales personnel interviewed.
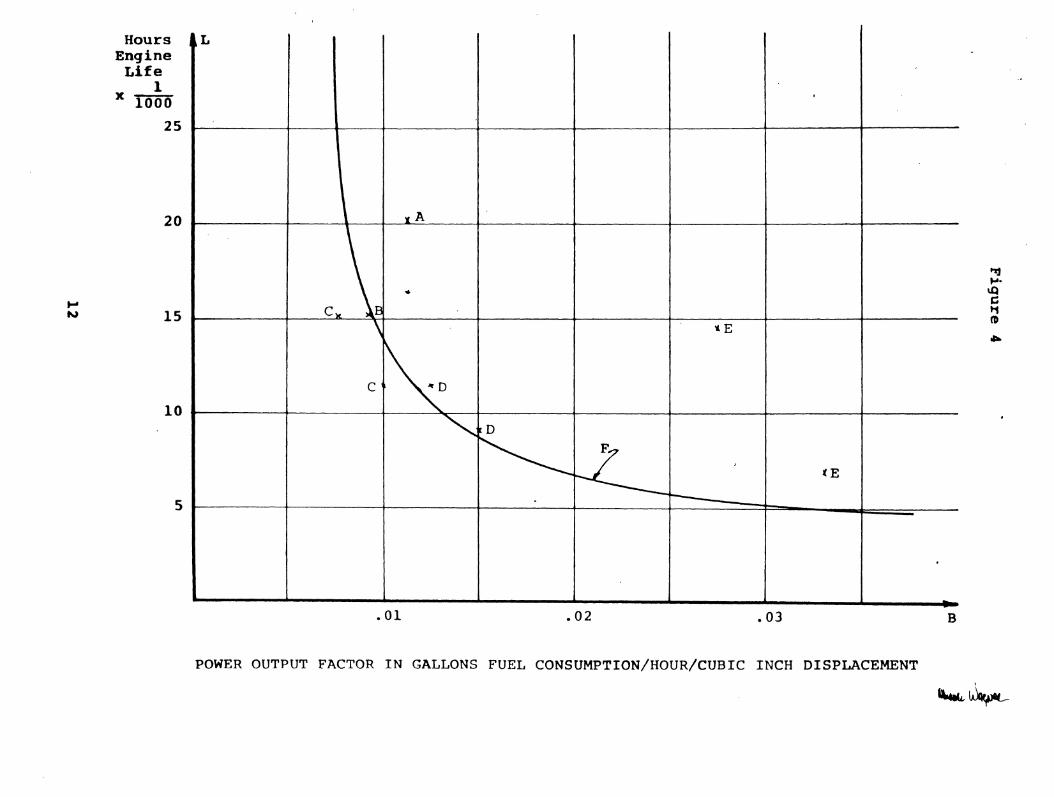
4, Output Rating vs. Engine Life
Some disagreement exists throughout the industry as to the beat
and most meaningful characteristics to be used when describing the
duress which an engine is experiencing. The indicators most frequently
recognized as being the most significant were BMEP, HP per CU. IN. DISPL.,
Fuel Consumption, and Firing Pressure. For tut purpose of this paper,
fuel consumption in gallons per hour per cubicinch displacement was
chosen for usage because of its universal availability. The curve
represented in Figure 4 was contributed by one information source.
The individual data points were contributed by three additional
sources from service records and personal experience. In addition to
these four information sources, six more companies in the marine field
were visited in search of corroborative data. These companies either
did ivt have the requested information or refused to part with it on
the grounds that it was a trade secret. The credibility of the relation-
ship depicted in Figure 4, however, is not necessarily reduced by the
limited data sources. The curve was formed by a review of actual field
-11--
data which was obtained over several years of service operation of
engines with approximately 100 cubic inches displacement per cylinder.
Points A and E were results of field service data accumulated by an
owner-operator for engine displacements of approximately 300 cubic
inches per cylinder (point E) and 700 cubic inches displacement per
cylinder (point A).
Point B is a personal judgement of the current field conditions,
by a staff level engineer of a major engine manufacturer, for engines
having a cylinder displacement of about 1,000 cubic inches.
Points C and D are the net results of field data accumulated
over several years of operation of engines having the same cylinder
displacement (approximately 1,000 cubic inches) but having different
fuel rates and power outputs. Engines C were non-turbocharged and
Engines D were turbocharged.
5. Economic Climate of Ship Operation
As stated earlier, this phase of the economic study was
considered by those in a position to reveal it to be a matter of
trade secret. This is academic for those actively participating
in the industrial theater, since each business would have this
information available to it. However, for present purposes the lack
of this information prevents any sort of meaningful sample calculation
from bking made.
Hours LEngineLife
x 11000
25__ _ _ _ _ _ _ _ _ _
20A
CD
D
5
.01 .02 .03
POWER OUTPUT FACTOR IN GALLONS FUEL CONSUMPTION/HOUR/CUBIC INCHDSLCMN
D

REFERENCE LIST
[1] Benford, Harry, Measures of Merit for Ship Design,University of Michigan, February 1968.