an acoustic phonetic analysis of northern minnesota
TRANSCRIPT
St. Cloud State UniversitytheRepository at St. Cloud State
Culminating Projects in English Department of English
12-2018
An Acoustic Phonetic Analysis of NorthernMinnesota English Vowel SpacesMichel Backstrom
Follow this and additional works at: https://repository.stcloudstate.edu/engl_etds
This Thesis is brought to you for free and open access by the Department of English at theRepository at St. Cloud State. It has been accepted forinclusion in Culminating Projects in English by an authorized administrator of theRepository at St. Cloud State. For more information, please [email protected].
Recommended CitationBackstrom, Michel, "An Acoustic Phonetic Analysis of Northern Minnesota English Vowel Spaces" (2018). Culminating Projects inEnglish. 144.https://repository.stcloudstate.edu/engl_etds/144

An Acoustic Phonetic Analysis of Northern Minnesota English Vowel Spaces
by
Michel Lopez-Backstrom
A Thesis
Submitted to the Graduate Faculty of
St. Cloud State University
in Partial Fulfillment of the Requirements
for the Degree
Master of Arts in
English: Teaching English as a Second Language
December, 2018
Thesis committee:
Ettien Koffi, Chairperson
Edward Sadrai
Monica Devers

2
Abstract
The dialect of Northern Minnesota English (NMNE) has been acknowledged as a leading
suspect in the search for the Minnesota accent. The majority of the commenters who accept the
Minnesota accent at the bottom of a Youtube video page (Bartholid, 2015, Are You MN
Enough?) indicate that if any Minnesotans have this accent, it is probably the residents of
Northern Minnesota. Thus, this study begins to reveal just what that particular dialect of
Northern Minnesota actually looks like acoustically. Twenty speakers from the queried region
were recorded saying the following eleven vowel phonemes three times [i, ɪ, e, ɛ, æ, ɑ, ɔ, o, ʊ, u,
ʌ] within an isolated hVd structure. After recordings were imported into Praat, they were spliced,
measured, and analyzed under six acoustic correlates: F1, F2, F3, duration, F0, and intensity. The
total number of tokens analyzed in this study is 3,960 (20 x 11 x 3 x 6).This acoustic data was
then compared with four other English dialects, General American English (Peterson & Barney,
1952), Midwest English (Hillenbrand, Getty, Clark, & Wheeler, 1995), Central Minnesota
English (Koffi, 2017b; 2016c; 2014; 2013), and Winnipeg Canadian English (Hagiwara, 2006).
What has been exposed thus far is that NMNE men are most similar to men who speak Winnipeg
Canadian English (WCE) although there are some inconsistencies. The men who speak NMNE
and the men who speak WCE share common characteristics like the masked lot/cloth [ɑ/ɔ]
vowel, reversing of the kit [ɪ] and face [e] vowels, lowering of the foot [ʊ] vowel, and heavy
vocalic inventories in the mid level of vowel height and the front region of tongue retraction.
They also carry similar patterns such as vowels pertaining to all three levels of vowel height and
all three regions of tongue retraction. The only major distinctions between NMNE men and
WCE men are the strut [ʌ] vowel and the trap [æ] vowel. Although both dialects realize the strut
[ʌ] vowel as a mid vowel sound, WCE men’s strut [ʌ] vowel has been fronted so much compared
to its NMNE equivalent that it actually runs the risk of masking with the NMNE trap [æ] vowel.
That also leads to the second distinction which is the WCE trap [æ] vowel. It has been lowered
quite a bit in comparison to its NMNE counterpart. Nevertheless, these male speech patterns
remain as the most similar out of all the comparative dialects. However, these conclusions are
not reflective in the women’s speech. NMNE women are actually more similar to their southern
neighbors, Central Minnesota English (CMNE) speakers. With the exact same T-shape in their
vowel space quadrant, women who speak CMNE and women who speak NMNE are almost
completely identical in their vowel space charts. Vowel sounds are produced in all three levels of
vowel height along with all three regions of tongue retraction in each dialect. Furthermore,
although they have multiple vowels which are realized distinctively, [ɪ, ɛ, ɑ, ɔ, ʊ, ʌ], CMNE
women follow most of the same dialectal patterns as do NMNE women such as merging the lot
[ɑ] and cloth [ɔ] vowels, reversing their kit [ɪ] and face [e] vowels, and lowering the foot [ʊ]
vowel. Conclusively, NMNE women are more closely aligned with CMNE women than any
other comparative dialect of women. However, their divergences merely begin with one pattern
found the speech of NMNE women. All NMNE women’s vowels are raised in comparison to
their southern neighbors. While some of these movements are in fact obvious to the naked ear,
there are others which are only obvious in the acoustic data provided within this study.
3
Acknowledgements
When I first encountered the topic of the Minnesota accent for a study, the idea terrified
me. I had been told for many years that I had a thick Minnesota accent. However, I was unaware
of what that even meant. I could not hear it at all in myself or any other speaker for that matter.
Luckily for me, I had the pleasure to work with Kandice Byron and Chris Reigstad. Kandice
helped me face my fear and take the challenge head on while Chris taught me how to understand
and acoustically locate particular features pertaining to said accent without being able to hear it.
With the guidance from Chris along with some direction from Dr. Sadrai, I was able to depend
on the science of formant frequencies and spectrograms to show me what the Minnesota accent
looked like. You three initiated my passion for the finding the Minnesota accent and you gave
me the most basic tools that I needed to pursue it: courage, confidence, and a basic knowledge of
Praat. Thank you Kandice Byron, Chris Reigstad, and Dr. Sadrai.
Subsequently, another professor by the name of Dr. Koffi caught wind of our small
classroom study. He was so overjoyed by the idea of Kandice and me presenting the topic that he
consistently asked about future pursuits in this area. Had it not been for his persistent reminders
of the topic I do not think I would have considered it since I had only a very basic knowledge
about the topic with no prior experience in the area outside of that previous study. Dr. Koffi,
however, made the idea for a thesis seem so exciting and intriguing that I finally accepted. So to
Dr. Koffi, thank you for your persistence.
I began taking classes from Dr. Koffi, three in total, which were all based around acoustic
phonetics and phonology. Although they were extremely hard, the classes were absolutely

4
unbelievable. Dr. Koffi is like the equivalent of drinking from Mimir’s well1. I did not just learn
some things from him but instead I learned everything. His knowledge exceeded the classroom
and spread through a multitude of articles and books as well. Furthermore, if ever there was a
question, it was exciting to watch as he lit up while explaining his answer with such detail. It
made pursuing this thesis so much fun and even at the end I am sad that I will no longer be
surrounded by a world of acoustic phonetics. So again to Dr. Koffi, thank you for sharing with
me your knowledge of and enthusiasm for acoustic phonetics.
Lastly, I would have never made it through my thesis without the help from so many
patient listeners. Thank you to my mama, my stepdad, and my sister, Rachel, for pushing me
forward and supporting me the whole way through. Thank you to my amazingly patient husband,
Ricardo Lopez Guzman, for listening to me talk about my thesis for months and still choosing to
marry me. Thank you to all of my close friends at St. Cloud State University who continuously
encouraged me with this thesis and kept me company during those long nights of study with
pizza parties. Thank you Angelica Carnero, Thammy San Alarcón, Glymaris Lugo, Chris
Reigstad, Yuman Zhao, Mohammed Al-Madkhali, and Sam Carley. I miss you all more than you
know. Thank you to my mother-in-law, Irene, and my sister-in-law, Romina, for listening to me
talk about a strange subject, for supporting me, and for encouraging me to finish. (Gracias a mi
suegra, Irene, y a mi cuñada, Romina, por escucharme hablar sobre un tema extraño, apoyarme
y estimularme a terminar esta tesis.) Finally, I would like to thank my three readers who decided
to stand behind me through all of this, thank you Monica Devers, Edward Sadrai, and Ettien
Koffi. Without your support I would have never been able to have this opportunity.
1 Mimir’s well is a pool of knowledge born from Norse mythology.

5
The final group that I would like to thank provided me the necessary tools, participants,
and opportunities that I needed to complete my thesis. Thank you to the Mass Communication
department at Bemidji State University for allowing me to use your equipment and recruiting
your students as participants. Thank you Roger Paskvan, Valicia Boudry, Monika Lawrence,
Debra Sea, and Carl Sewall. I also want to thank the public libraries which permitted me
entrance and time to recruit your patrons as participants. Thank you to Hallock Public Library,
Roseau Public Library, Thief River Falls Public Library, and Two Harbors Public Library.
Additionally, without my participants I would have absolutely no study at all, so thank you to all
of my voluntary participants within this study. Finally, I would like to thank the Vemma
corporation for your bod•ē Burn drink. I have never been a coffee drinker but I have however
enjoyed your product every morning as I woke up and started work on my thesis.
6
Table of Contents
Page
List of Tables……………………………………………………………………...……… 10
List of Figures……………………...………………………………………………...…… 12
Chapter
1. Introduction………...…………………………………………………………...… 14
Statement of the Problem……………………………………………..…….… 14
Rationale………………………………………………………………..…..… 19
2. Literature Review…………………………………………...…………...…...…… 24
Vowel Sounds…………………………………………..………..…………… 24
Vowel Features……………………………………………..……..………..… 29
Vowel Height…………………...…………………………….……….……… 29
Tongue Retraction………………………..……………………………..…..… 30
Lip Rounding………………..……..……………………………...….….…… 30
Vowel Duration………………………..……………………………………… 31
Vowel Intensity and Vowel Pitch………..………………………….…...…… 32
3. Methodology………………………………………………..…………..………… 34
Research Questions…………………………………………………..……….. 34
Procedures…….……………………………………………………….……… 34
Participants……………………………………………………………..……... 37

7
Chapter Page
Equipment……………………………………………………………..…....… 39
4. Results……………………………………………………..……………………… 44
NMNE Men F1: Vowel Height…………………..........................................… 44
NMNE Men F2: Tongue Retraction …………………..………..….………… 47
NMNE Men: Acoustic Vowel Space Chart ……………..…………………… 50
NMNE Men F3: Lip Rounding ……………………………..….…………….. 53
NMNE Men Dur: Vowel Duration…………….………………...…………… 55
NMNE Men Int & F0: Vowel Intensity & Vowel Pitch …………...………… 57
NMNE Women F1: Vowel Height…………………………………………… 60
NMNE Women F2: Tongue Retraction………………………..………...…… 64
NMNE Women: Acoustic Vowel Space Chart…………………..…………… 67
NMNE Women F3: Lip Rounding…………...………………………………. 70
NMNE Women Dur: Vowel Duration………………………………..………. 72
NMNE Women Int & F0: Vowel Intensity & Vowel Pitch……….………….. 74
Comparison: Northern Minnesota English and General American English..… 77
Comparing Men F1 & F2: Vowel Height & Tongue Retraction…...………… 78
Comparing Women F1 & F2: Vowel Height & Tongue Retraction……..…… 82
Comparison: Northern Minnesota English and Midwest English...………….. 87
Comparing Men F1 & F2: Vowel Height & Tongue Retraction………...…… 88

8
Chapter Page
Comparing Women F1 & F2: Vowel Height & Tongue Retraction……......… 93
Comparison: Northern Minnesota English and Central Minnesota English..… 97
Comparing Men F1 & F2: Vowel Height & Tongue Retraction…………...… 99
Comparing Women F1 & F2: Vowel Height & Tongue Retraction.……...… 104
Comparison: Northern Minnesota English and Winnipeg Canadian English. 108
Comparing Men F1 & F2: Vowel Height & Tongue Retraction.....………… 110
Comparing Women F1 & F2: Vowel Height & Tongue Retraction........…… 115
5. Discussion………………………………………………..……………………… 119
Summary of NMNE Men and Women ...……………...……………….…… 119
Comparison Summary of NMNE and Other American English Dialects...… 121
Implications ……………………………………………………………….… 123
Limitations and Further Research ……………….……………..…………… 123
References…………………………………………….……………….………………… 124
Appendix……...………………………………………………………………………… 128
A. Tables—F0 of men………………...……………………………………...… 128
B. Tables—F0 of women…………….……………………………………...… 129
C. Tables—F1 of men………………...……………………………………...… 130
D. Tables—F1 of women…………….………………………………………… 131
E. Tables—F2 of men………………...……………………………………...… 132
F. Tables—F2 of women…………….………………………………………… 133

9
Chapter Page
G. Tables—F3 of men………………...……………………………………...… 134
H. Tables—F3 of women…………….…………………………….…………… 135
I. Tables—Duration of men……….....………………………………………... 136
J. Tables—Duration of women…………….……..……………….…………… 137
K. Tables—Intensity of men………………...…………………..….……...…… 138
L. Tables—Intensity of women…………….…..………………….…………… 139
M. Task 1……..……………...…………...……………………………...……… 140
N. Task 2…………………..…………….……………………………………… 141
O. Task 3…………….………………...……………………………………...… 142

10
List of Tables
Table Page
1.1 Counties of Northern Minnesota Table………..……………………………………… 22
2.1 Liljencrants and Lindlom’s Prototype Vowel Data for Men Table…….…………..… 26
2.2 Liljencrants and Lindlom’s Prototype Vowel Data for Women Table……......……… 27
2.3 F1 Boundaries for each Level of Vowel Height Table………..……………………… 28
2.4 F2 Boundaries for each Region of Tongue Retraction Table…...……….…………… 29
2.5 F3 Boundaries for each Degree of Lip Rounding Table..……..……...………….…… 29
3.1 Vowels under Investigation Table…………….……………………………………… 35
3.2 Men’s Background Information Table...……………………………………………… 38
3.3 Women’s Background Information Table………………….………………………… 39
3.4 Recording Locations of Men Table….………………………..……………………… 40
3.5 Recording Locations of Women Table..…………………......…………..…………… 41
4.1 NMNE Men F1 Measurements Table………….……………..……………….……… 45
4.2 NMNE Men F2 Measurements Table………………..………………….…….……… 48
4.3 NMNE Men F3 Measurements Table……………..…………………………….……. 54
4.4 NMNE Men Vowel Duration Measurements Table…………….……….…………… 56
4.5 NMNE Men Vowel Intensity Measurements Table……………..…………………… 58
4.6 NMNE Men Vowel Pitch Measurements Table..………………..…………………… 59
4.7 NMNE Women F1 Measurements Table……………..……………………………… 61
11
Table Page
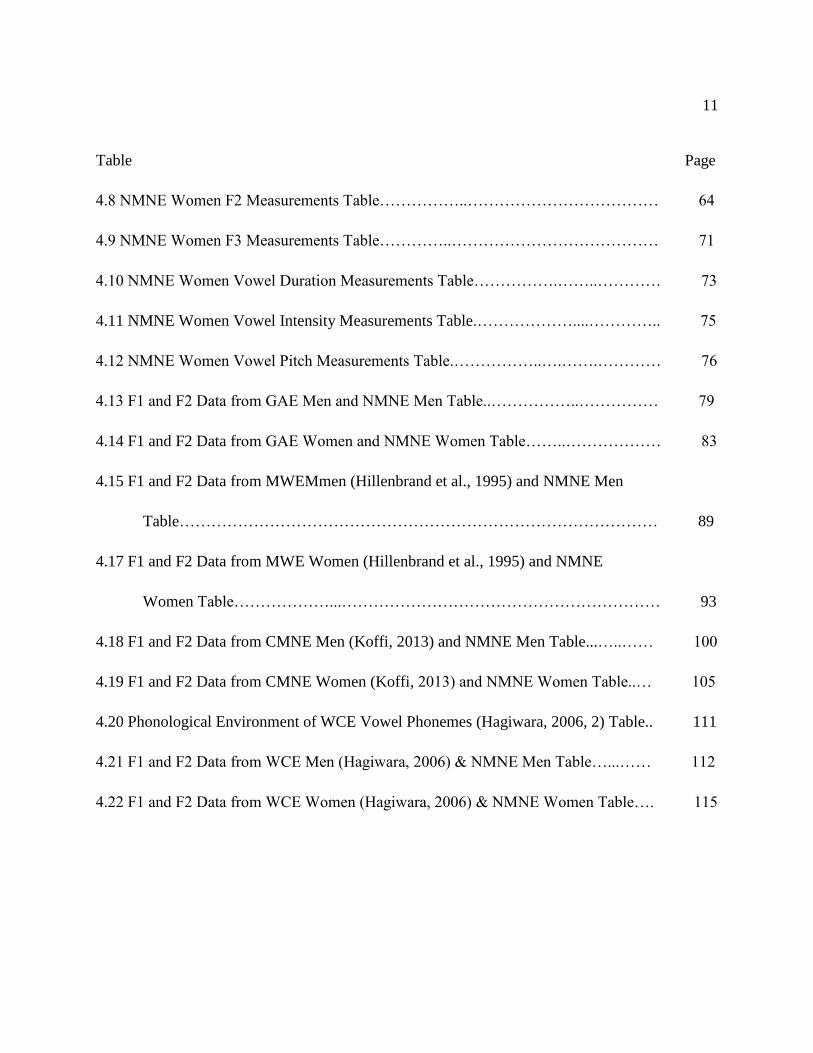
4.8 NMNE Women F2 Measurements Table……………..……………………………… 64
4.9 NMNE Women F3 Measurements Table…………..………………………………… 71
4.10 NMNE Women Vowel Duration Measurements Table…………….……..………… 73
4.11 NMNE Women Vowel Intensity Measurements Table.………………....………….. 75
4.12 NMNE Women Vowel Pitch Measurements Table.……………..….…….………… 76
4.13 F1 and F2 Data from GAE Men and NMNE Men Table..……………..…………… 79
4.14 F1 and F2 Data from GAE Women and NMNE Women Table……..……………… 83
4.15 F1 and F2 Data from MWEMmen (Hillenbrand et al., 1995) and NMNE Men
Table……………………………………………………………………………… 89
4.17 F1 and F2 Data from MWE Women (Hillenbrand et al., 1995) and NMNE
Women Table………………...…………………………………………………… 93
4.18 F1 and F2 Data from CMNE Men (Koffi, 2013) and NMNE Men Table...…..…… 100
4.19 F1 and F2 Data from CMNE Women (Koffi, 2013) and NMNE Women Table..… 105
4.20 Phonological Environment of WCE Vowel Phonemes (Hagiwara, 2006, 2) Table.. 111
4.21 F1 and F2 Data from WCE Men (Hagiwara, 2006) & NMNE Men Table…...…… 112
4.22 F1 and F2 Data from WCE Women (Hagiwara, 2006) & NMNE Women Table…. 115

12
List of Figures
Figure Page
1.1 A representation of Minnesota commenters who reject the MN accent.………….….. 15
1.2 A representation of Minnesota commenters rejecting the MN accent…….………...... 16
1.3 A representation of Minnesota commenters who accept the MN accent.………...…... 17
1.4 A representation of Minnesota commenters accepting the MN accent.………….…... 18
1.5 A map of Minnesota districts according to the Minnesota Department of
Transportation (2018)………………………………………………………..…… 21
2.1 A representation of Ladefoged and Johnson (2015, p. 46)’s vowel space chart of
English vowels ………….……………………………………………...………… 28
3.1 A representation of speaker 2F’s first realization of the word <hæd >…………….… 42
4.1 A representation of the NMNE men’s acoustic vowel space chart…..………….…… 51
4.2 A representation of the NMNE women’s acoustic vowel space chart…...…………… 68
4.3 US map of Northern Minnesota and Mid Atlantic region (Wikimedia Commons,
2018)…………………….………………………………………………………… 78
4.4 A representation of the acoustic vowel space chart for GAE men and NMNE men.… 81
4.5 A representation of the acoustic vowel space chart for GAE women and NMNE
women…………………….…………………………………………………….… 85
4.6 A map of Midwest and Northern Minnesota (Wikimedia Commons, 2018)...… 88
4.7 A representation of the acoustic vowel space chart for MWE men and NMNE men... 91

13
Figure Page
4.8 A representation of the acoustic vowel space chart for MWE women and NMNE
women…………………………………………………………………………..… 96
4.9 A map of the Minnesota districts according to the Minnesota Department of
Transportation (2018)………………………………………………………..…… 98
4.10 A representation of the acoustic vowel space chart for CMNE men and NMNE
men………………………………………………………………………….....… 102
4.11 A representation of the acoustic vowel space chart for CMNE women and
NMNE women ……………………………………………………………..…… 106
4.12 A map of Winnipeg of Manitoba, CA and Northern Minnesota, US (Google Image,
2007)…………………………………………………………………………..… 109
4.13 A representation of the acoustic vowel space chart for WCE men and NMNE men 114
4.14 A representation of the acoustic vowel space chart for WCE women and NMNE
women………………………………………………………………………...… 117

14
Chapter 1: Introduction
Statement of the Problem
The Minnesota (MN) accent is one of many dialects of American English that is
recognizable across the U.S. (Bartholdi, 2015). National attention to this dialect can be
attributed to the movie Fargo (1996). Since the Hollywood movie’s big debut, the accent of the
movie has become a statewide marked dialect of English spoken specifically in Minnesota. Just
under 20 years later a follow-up Youtube Video was produced and uploaded by Batholdi (2015).
The video was called Are You Minnesota Enough?. In her video production, Bartholdi makes
reference to the nationally-known accent of the movie Fargo but she also draws a slight
distinction between the movie and the marked MN accent. “While we might not sound quite like
this…sometimes we get pretty close” (Batholdi, 2015). Within the video there are four actors
using the MN accent. Alongside of this Bartholdi includes nine other interviewees in the Mall of
America who are asked to talk about and/or demonstrate the MN accent. (It is assumed that all of
the interviewees are from Minnesota with the exception of one who may be from New York.) Of
those interviewees some admit to having a MN accent, another states that it is “ugly”, and there
is even one Minnesotan who denies having any accent at all. These varying opinions of the MN
accent are only the beginning. Minnesotans throughout the whole state share their true feelings
of this accent in the commentary area of this video’s webpage.
It is interesting to note that throughout this video, there is no reference to any boundaries
around the MN accent other than state lines. However, the accompanied comments underneath

15
the video seem to tell otherwise. There are a total of 195 comments2 made by Minnesotans while
the rest either didn’t stipulate their origin or clearly stated that they were not from Minnesota.
Therefore, they are not considered in the tally. One hundred and forty Minnesota commenters
(71%) completely rejected the idea of any Minnesotans speaking like those actors and
interviewees from Are You Minnesota Enough? Of that group, there were 15 people who
specifically associated the accent with Canadian English rather than Minnesota English. Figure
1.1 below presents this data.
Figure 1.1: A representation of Minnesota commenters who reject the MN accent.
Comments by Jeremiah Gorian (2016) and Anonymous Gaming (2016) are only two
examples of the former groups in the rejection category. They explicitly reject that Minnesotans
use the accent of interest presented in the video. Furthermore, as is evident in the figure above,
they are not alone in this opinion.
2 Replies to any comments were not considered in this tally.
125
15
0
20
40
60
80
100
120
140
Reject
Statewide Rejection
Canadian Accent

16
Figure 1.2: A representation of Minnesota commenters rejecting the MN accent.
At the other side of the spectrum, 55 of the Minnesota commenters (28%) accepted the
accent although 31 people of that group (15%) stipulated that the accent is associated with a
particular region, the older generation, and/or the rural areas of the state. The latter 24 people
gave no indication of any boundary surrounding the Minnesota accent. For this reason, they have
been classified as recognizing that the Minnesota accent is statewide. The largest amount of
people who restricted the Minnesota accent to specific boundaries includes a group of 24 people.
This group specified that the MN accent is only found in Northern Minnesota. Another group of
five commenters (2%) stated that it is only the older generation and/or rural areas of the state that
speaks with the MN accent. The last two accepting commenters stated that the Minnesota accent
is restricted to specific region of Minnesota. However, one person lacks the mention of the
specific region to which they are referring while the other commenter confines the MN accent to
the central region of Minnesota. Figure 1.3 presents data for the Minnesotans whom have
accepted the MN accent.

17
Figure 1.3: A representation of Minnesota commenters who accept the MN accent.
Examples of these types of comments are presented below. Individuals such as Trini Tae
(2017) does not actually state whether they use the accent but does in fact acknowledge knowing
people within their area (Northern Minnesota) that do have the MN accent. Others such as Ryan
Hostad completely reject the accent in their area (the metro area) and push it off to a different
region outside of their own.
24 24
21
2 2
0
5
10
15
20
25
30
Accept
Spoken Statewide
Spoken in Northern MN
Only
Spoken by Older
Generation
Spoken in Rural Areas
Spoken in Rural & by
Older Generation
Spoken in Other
Regions of MN

18
Figure 1.4: A representation of Minnesota commenters accepting the MN accent.
In general, it is extremely difficult to actually scientifically prove who is correct based on
the information presented in the video and its accompanied comments below. Unfortunately,
there are no numerical data defining any dialectal patterns or features. Therefore, one is left to
making assessments based on inference which can easily be influenced subconsciously. To
actually find these answers, some investigations must first be done. Initially, one must know the
exact dialectal features and patterns associated with the true Minnesota accent. To find this
information, studies need to cover all areas of Minnesota and then, after enough data have been
collected, one can start to make generalizations at a state level. Only then, can a person start
comparing the Minnesota dialect with other dialects. Secondly, the Canadian accent must also be
specified. Are the commenters referencing to the Standard Canadian English dialect investigated
by Boberg (2008)? Is it a dialect from a single Canadian providence that shares the international
border with Minnesota such as Manitoba or Ontario? Maybe it is just a city dialect from one of
the said providences such as the Winnipeg Canadian English dialect investigated by Hagiwara

19
(2006)? That leads to the last investigation which requires an acoustic phonetic analysis of those
actors and interviewees from Bartholdi’s Youtube video production. Then, a comparison can be
drawn between their accent, those of Northern Minnesota English, and the specified Canadian
English. So, although there are a multitude of opinions that will continue to congregate at the
bottom of this referenced video’s page, the actual scientific answers remain hidden until more
studies are pursued and the appropriate data are revealed.
For this reason, the current study is in pursuit of one of the investigations mentioned
above. This study is an instrumental description of the acoustic phonetic vowel spaces of
Northern Minnesota English. Although there are not enough participants to represent the entire
Northern Minnesota region for generalization purposes, this study is adding to the collection of
acoustical data from Minnesota.
Rationale
The importance of this study lies in its location. Previous studies over the Midwest
dialect reported by Hillenbrand, Getty, Clark, and Wheeler (1995) and the Central Minnesota
dialect reported by Koon (2010) and by Koffi (2013, 2014, 2016c, & 2017b) have made some
reference to Minnesota. However, those references reflected a sampling that was either too
broad—Hillenbrand et al.’s study—or too narrow—Koon and Koffi’s research—to appropriately
represent the northern region of the state. Furthermore, Hagiwara produced a study (1995) along
with a subsequent letter (1997) which encouraged more “‘local’ studies” such as this as a means
of “cooperatively producing an ‘acoustic atlas’ of American English dialects as indicated by
formant frequencies” (1997, p. 655). Therefore, to continue contributing to the “acoustic atlas,”

20
this current study has collected and analyzed 6453 vowels uttered by 20 participants specifically
from Northern Minnesota.
The state of Minnesota consists of eight different districts according to the Minnesota
Department of Transportation (2018). Starting from the top, there are the Northeast and
Northwest districts of Minnesota (District 1 and 2), District 3 is Central Minnesota, District 4 is
West Central Minnesota, District 5 is Metro Minnesota, District 6 is Southeast Minnesota,
District 7 is South Central Minnesota, and finally District 8 is the Southwest District of
Minnesota. However, since the main interest of the current study is Northern Minnesota, no more
will be said about the six latter districts.
3 There should have been a total of 660 vowels realized by the participants. However, due to certain
participants mispronouncing words or laughing during the recording, I was unable to utilize 15 uttered vowels.

21
Figure 1.5: A map of Minnesota districts according to the Minnesota Department of
Transportation (2018).
Northern Minnesota is an area that encompasses a total of 21 counties. Although the area
has been divided into two districts by the Minnesota Department of Transportation, the current
study recognizes the Northeast and the Northwest districts as one region, that is, the Northern
region of Minnesota. Below are the counties of the region:

22
Table 1.1
Counties of Northern Minnesota Table
NO Counties of NMNE Counties Sampled
1. Aitkin No
2. Beltrami Yes
3. Carlton No
4. Cass Yes
5. Clearwater Yes
6. Cook No
7. Hubbard Yes
8. Itasca Yes
9. Kittson Yes
10. Koochiching Yes
11. Lake Yes
12. Lake of the Woods No
13. Mahnomen No
14. Marshall Yes
15. Norman No
16. Pennington Yes
17. Pine No
18. Polk Yes
19. Red Lake No
20. Roseau Yes
21. St. Louis Yes
Northern Minnesota has a total population of 550,443 people (U.S. Census Bureau,
2010). Of this population about 87.8% is white, 3.8% is American Indian, 1.7% is Latino, and
the Asian (0.5%) and African American (0.5%) populations average below one percent. This
region may also be considered as rural because the majority of the towns’ populations are around
23
15,0004 or less (U.S. Census Bureau, 2017). Contrary to this finding, the city of Duluth—the
fourth biggest city in all of Minnesota according to the U.S. Census (2010)—has a population of
86,266 people, which greatly exceeds any other neighboring towns in the region by at least
50,000 people. The last geographical detail about Northern Minnesota is that it shares an
international border with Canada. There are seven counties that are along this international
border. Those counties are Kittson county, Roseau county, Lake of the Woods county,
Koochiching county, St. Louis county, Lake county, and Cook county.
4 Minnesota does not actually stipulate any size of population which distinguishes a city from a town (U.S.
Census Bureau, 2017, p. 9-5). However, according to Wikipedia, “Common population definitions for a city range
between 1,500 and 50,000 people” (Dec. 13, 2017).

24
Chapter 2: Literature Review
Vowel Sounds
Although the “acoustic space,” or the mouth, in which vowels are produced shares
similar human constraints, vowel sounds still manage to maintain a distinctive nature about them
no matter the number of vowels within the space. According to Liljencrantz and Lindblom
(1972, p. 841) this is possible because of the principle of maximum contrast. This principle
stipulates that vowels naturally “repel” from one another and because of this repellent behavior
they retain divergent characteristics.
To illustrate, let us consider an analogy of two particles with an equal electrical charge.
They will repel each other with a force that is inversely proportional to the square of their
distance. If we now place these particles in a limited space within which they can move
freely, then the particles will move away from each other because of the force of
repulsion. Eventually they will hit the boundary of the space, and then possibly move
along the boundary, if their mutual distance can be increased that way. Finally, an
equilibrium is reached where their distance cannot be increased any more. Characteristic
of this state is the fact that the mutual energy has reached a minimum. If other particles
are introduced into the space, the whole set will move to new positions, always fulfilling
the very general equilibrium criterion, that of minimal energy. For this analogy, we must
of course assume that the energy released when the particles move apart is dissipated in
some way; otherwise the system would exhibit perpetual oscillations, like the molecules
in a gas.

25
This analogy makes sense from the perspective of the interpreter because without those
divergent characteristics it would be difficult to decipher the words of a speaker. This is
especially true for the English language since it is highly impacted by vocalic sounds. “English is
a language in which the differences between dialects are largely in the vowels” (Ladefoged,
2005, p. 27). It is for this reason as well that English vowels remain a cornerstone of dialectal
studies. However, the study of vowels has not always been so simple.
The articulatory patterns of vowel sounds have not always been the easiest to describe
since no two articulators make contact during vowel production. According to Ladefoged (1971,
p. 67), vowels are best “described as points on a continuum”. In using this analogy, one can
better understand the movements of the main articulator (the tongue) throughout the open area of
the mouth. For example, on this continuum, the tongue moves vertically between the high and
low areas of the mouth. Vowels such as [i] and [æ] in the words <fleece> and <trap> exemplify
these two extremes. Likewise, the tongue also moves horizontally on a continuum between the
front and the back regions of the mouth. An example vowel for the front region is again [i] (the
fleece vowel) while the back region is typically represented by [u] (the goose vowel). However,
this analogy alone does not entirely solve the problem of describing vowels. It merely begins to
set the stage for vowel classification such as vowel height, tongue retraction, and lip rounding.
Within each of the three classes there are various types of vowels and it is here that the main
issue finally arises. “Part of the problem in describing vowels is that there are no distinct
boundaries between one type of vowel and another” (Ladefoged & Johnson, 2015, p. 92).
The current study describes vocalic sounds based on formant frequencies, duration and
intensity, or in other words, numerical data presented in Hertz (Hz), milliseconds (ms), and
26
decibels (dB). Therefore, vocalic boundaries cannot just be defined by a name such as high,
back, rounded, or long but rather by actual numerical data. Since it is not entirely common to
draw physical boundaries around vowel types, insights from two studies have been combined for
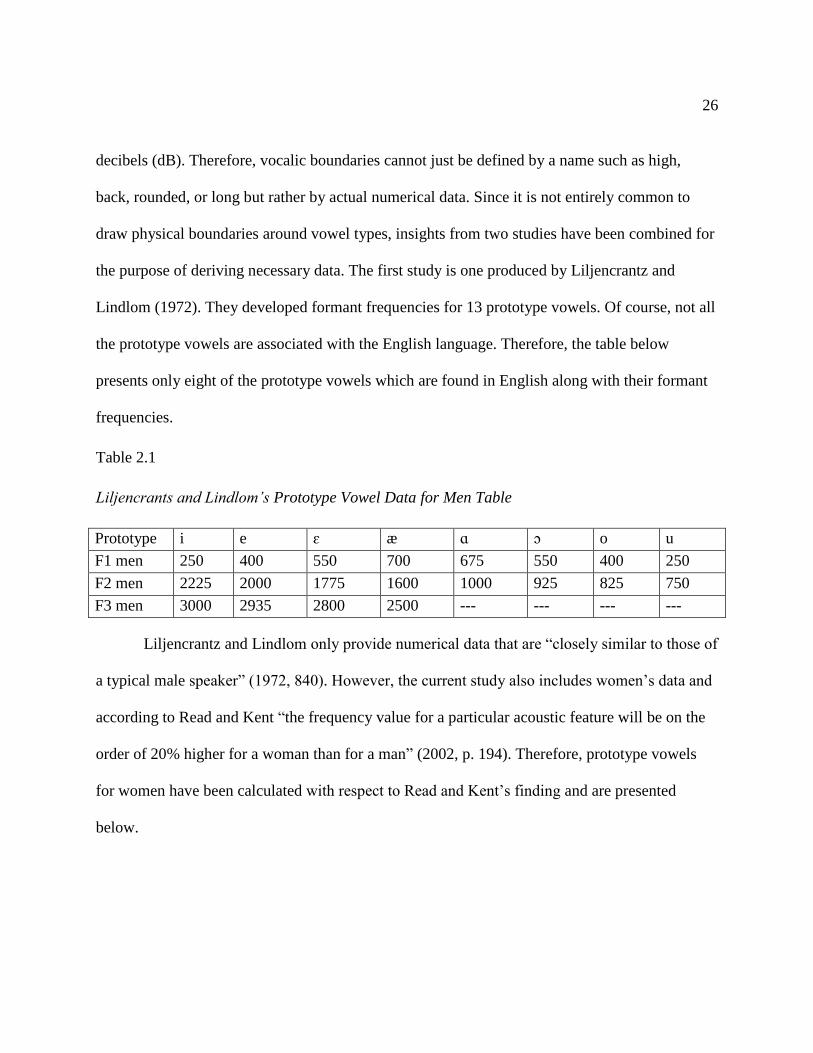
the purpose of deriving necessary data. The first study is one produced by Liljencrantz and
Lindlom (1972). They developed formant frequencies for 13 prototype vowels. Of course, not all
the prototype vowels are associated with the English language. Therefore, the table below
presents only eight of the prototype vowels which are found in English along with their formant
frequencies.
Table 2.1
Liljencrants and Lindlom’s Prototype Vowel Data for Men Table
Prototype i e ɛ æ ɑ ɔ o u
F1 men 250 400 550 700 675 550 400 250
F2 men 2225 2000 1775 1600 1000 925 825 750
F3 men 3000 2935 2800 2500 --- --- --- ---
Liljencrantz and Lindlom only provide numerical data that are “closely similar to those of
a typical male speaker” (1972, 840). However, the current study also includes women’s data and
according to Read and Kent “the frequency value for a particular acoustic feature will be on the
order of 20% higher for a woman than for a man” (2002, p. 194). Therefore, prototype vowels
for women have been calculated with respect to Read and Kent’s finding and are presented
below.

27
Table 2.2
Liljencrants and Lindlom’s Prototype Vowel Data for Women Table
Prototype i e ɛ æ ɑ ɔ o u
F1 women 300 480 660 840 810 660 480 300
F2 women 2670 2400 2662 1920 1200 1110 990 900
F3 women 3600 3522 560 3000 --- --- --- ---
While numerical data is necessary for drawing vocalic boundaries, it alone is not enough
to distinguish vowel types since Liljencrantz and Lindlom did not specifically classify any of
their prototype vowels. For this reason, a second study by Ladefoged and Johnson (2015) is
referenced as a means of classifying said vowels. These two researchers, although they have no
numerical data defining their vowel sounds, do in fact classify a total of 14 English vowels.
According to them, there are five levels of vowel height for English vowels which are high, mid-
high, mid, mid-low, and low. Figure 2.1 presents Ladefoged and Johnson (2015, p. 46)’s
classifications of all English vowels.

28
Figure 2.1: A representation of Ladefoged and Johnson (2015, p. 46)’s vowel space chart of
English vowels.
The current study uses only three broad vowel heights, namely high, mid, and low. Given
the biological differences between men and women alluded to earlier, here are the numerical
values that correspond to the boundaries between vowels. F1 correlates with vowel height, F2
correlates with backness, and F3 correlates with rounding:
Table 2.3
F1 Boundaries for each Level of Vowel Height Table
High Mid Low
F1 men > 400 400 – 600 < 600
F1 women > 480 480 – 720 < 720

29
Table 2.4
F2 Boundaries for each Region of Tongue Retraction Table
Front Central Back
F2 men ≥ 1600 1200 – 1599 < 1200
F2 women ≥ 1920 1440 – 1919 < 1440
Table 2.5
F3 Boundaries for each Degree of Lip Rounding Table
Rounded Unrounded
F3 men < 2500 Hz ≥ 2500 Hz
F3 women < 3000 Hz ≥ 3000 Hz
Vowel Features
The current study classifies vowel sounds by four distinct features: vowel height, tongue
retraction, lip rounding, and vowel duration. Each feature is divided into either two or three types
of vowels. Alongside of these four features, vowel intensity and vowel pitch are also briefly
discussed. However, the latter two acoustic correlates do not divide into distinct sub-classes.
Furthermore, for all six features, there is an acceptable range of variance before a vowel becomes
distinguished from other phonemic sounds and, as in the former four features, moves into a new
type of vowel. Those ranges of variance are known as the Just Noticeable Difference (JND)5.
Vowel Height
Vowel height is a vowel feature that is divided into three types, high vowels, mid vowels,
and low vowels. Of all four features, vowel height is the most prominent due to its correlation
5 For more details on the concept of JND please refer to the following study by Koffi and Bloch (2017, p.
41).

30
with the F1 cue. The first formant has the greatest impact on vowel quality and “on average, has
80% of the energy in a vowel” (Ladefoged & Johnson, 2015, p. 207). It is important to note that
F1 measurements are indirectly proportional to the height of a vowel. Therefore, high vowels
have low F1 values, while their lower neighboring counterparts have high F1 values. According
to Koffi (2016b, pp. 121-22), as long as there is less than 63 Hz between two vowels, the human
ear has a hard time detecting any distinction between two vocalic sounds. Measurements which
exceed this threshold are different vowels.
Tongue Retraction
The second feature describing vowels is tongue retraction. This feature breaks down
similarly to that of the original chart produced by Ladefoged and Johnson (2015) in Figure 2.1.
They recognize three types of tongue retraction which are front vowels, central vowels, and back
vowels. High F2 values are associated with front vowels while low F2 values represent back
vowels. The JND for this correlate is stipulated by Koffi as the following, “In the F2 frequency
band, pairs of contiguous vowels whose acoustic distance is ≥ 200 Hz are clearly perceived, but
those whose acoustic distance falls below 200 Hz may be subject to confusion” (2016a, p. 12).
Therefore, any vowels which fall within the 200 Hz range are more likely to be recognized as the
same sound whereas vowels which fall outside of this threshold are more likely to be recognized
as having slightly distinctive characteristics.
Lip Rounding
The third feature is lip rounding. Its acoustic correlate is the third formant. High F3
values are associated with unrounded vowels while low F3 values represent rounded vowels.
Back vowels are known for having a higher degree of lip rounding than front vowels (Thomas,

31
2011, p. 48; Crothers, 1978, pp. 96-97). With that said, all back vowels from Liljencrantz and
Lindlom (1972) study are considered as rounded and their front vowels are considered as
unrounded. Thus, the boundaries presented in Table 2.5 were then derived accordingly. Lastly,
the acceptable range of F3 variance, or JND, is as follows, “In the F3 frequency band, pairs of
contiguous vowels whose acoustic distance is ≥ 400 Hz are clearly perceived, but those whose
acoustic distance falls below 400 Hz, may be subject to confusion” (Koffi, 2016a, p. 13). In other
words, two vowels which hold a distance of at least 400 Hz are more likely to be recognized as
slightly distinctive sounds and those which fall inside of this threshold have more potential for
being identified as the same sound.
Vowel Duration
The fourth feature is vowel duration. Even though this feature does not have a huge
impact phonemically on English vowels, according to Lisker (1974, p. 226), there may be some
biological factors that influence the length of a vowel.
[A] mechanical effect due to a temporal constraint on the movement of the relatively
large mass of the lower jaw, with that of the tongue sometimes also implicated: if open or
low vowels involve more jaw movement than do the close vowels, then the greater so-
called “intrinsic duration” of the former is a natural consequence, provided we believe
that in speech we regularly operate close to the limits set by the physical constraints on
the mechanism.

32
In other words, lower vowels are biologically more inclined to be longer than high
vowels due to the articulatory gestures involved in their production6. According to Koffi and
Lopez-Backstrom, the JND for vowel duration is as follows, “The JND 10 ms is most
appropriate for segments lasting less than 200 ms. For those lasting 200 ms or longer, the
optimal JND is 17 ms” (2018, p. 6). Lastly, the current study measured vowel duration in the
second formant. Measurements commenced at the first obvious vocal fold after the [h] and
terminated with the last vocal fold before the [d].
Vowel Intensity & Vowel Pitch
Even though intensity and pitch have never been explicitly associated with vowel
description, researchers have still continued to include this data (Peterson & Barney, 1952;
Hillenbrand, Getty, Clark, & Wheeler, 1995). For this reason the current study continues to
measure these two acoustic correlates although neither feature is broken down into various types.
Intensity is an acoustic correlate that is associated with the loudness of a sound. It is also
called absolute intensity. According to Koffi, the JND of intensity is as follows. “Segments
whose intensity is ≥ 5 dB are clearly perceptible, but those whose intensity difference is ≤ 3 dB
are barely aurally distinguishable” (2016a, p. 14).
The last acoustic cue under investigation is pitch which is also known as the fundamental
frequency or F0. This correlate has a threshold that is quite small in comparison to all the
previous acoustic cues. For distinctiveness to be perceived by the naked ear, the following
6 There is expected variation of duration outside of the biological constrains that is dependent on context.
However, this study evades that variation considering that all vowels appear in the same isolated phonological
environment

33
threshold must be exceeded. “In the F0 frequency band, an acoustic distance of ≥ 1 Hz is needed
to distinguish between two contiguous segments on the same octave band” (Koffi, 2016a, p. 9).

34
Chapter 3: Methodology
Research Questions
This study commences an investigation around the following three research questions.
Data for each question are addressed in the subsequent chapter.
1. What are the acoustic vowel qualities of the following English vowels [i, ɪ, e, ɛ, æ, ɑ,
ɔ, o, ʊ, u, ʌ] in the dialect of 20 Northern Minnesotan speakers?
2. In the F1 and F2 features, how similar or different are the 20 participants of Northern
Minnesota from other speakers with dialects such as General American English7,
Midwest English, Central Minnesota English, and Winnipeg Canadian English?
3. In the F1 and F2 features, to which dialect is Northern Minnesota English most
similar?
These research questions intend to elicit salient dialectal characteristics and patterns
associated with the Northern Minnesota English dialect as well as to verify whether or not the
NMNE dialect converges to and/or diverges from other American English dialects. With these
answers, one can begin to determine whether or not the Northern Minnesota English dialect is
unique to its region.
Procedures
This study replicates the methodology used by Peterson and Barney (1952) in their study
of General American English. In their research they focused on two areas, speech production and
7 When comparing NMNE and GAE, there are only nine vowel pairs which are discussed. Because
Peterson and Barney (1952) did not include the face [e] vowel or the goat [o] vowel, I was forced to compare only
the latter nine phonemes. However, NMNE data for the face [e] vowel and the goat [o] are still present in the
accompanied tables and vowel space charts. Therefore, whenever necessary, small discussions focus on the NMNE
face [e] and goat [o] vowels and how they interact with the GAE vowel phonemes.

35
speech perception. However, this study focuses only on speech production. Peterson and Barney
investigated the acoustic vowel spaces of ten vowels in General American English. Each vowel
was embedded in an hVd structure and then realized two times in isolation. This hVd structure
was very important since it allowed for easy vowel location and extraction. The current study
reproduces the methodology of Peterson and Barney with three slight adaptations.
My first adaptation was to develop three tasks8 for the participants. The commencing
task, Task 1, elicited demographic information from each speaker. The eight demographic
questions were adapted from Koon (2010, pp. 164-66). The subsequent task, Task 2, elicited 11
vowels produced in isolated hVd structures. All 11 phonemic vowels are listed in Table 3.1.
Table 3.1
Vowels under Investigation Table
NO Phoneme hVd
Structure
Names of
Vowels
1. /i/ heed fleece
2. /ɪ/ hid kit
3. /e/ hayed face
4. /ɛ/ head dress
5. /æ/ had trap
6. /ɑ/ hod lot
7. /ɔ/ hawed cloth
8. /o/ hoed goat
9. /ʊ/ hood foot
10. /u/ who'd goose
11. /ʌ/ hud strut
8 Each task is located in the Appendix.

36
The final task consisted of each participant reading a paragraph. This paragraph is an
adapted version of the original George Mason University Speech Accent Archive. The original
paragraph only included 69 words whereas the adapted paragraph utilized in this study contains a
total of 120 words. This paragraph is presented below.
Please call Stella. Ask her to bring these things with her from the store: Six good spoons
of fresh snow peas, five thick slabs of blue cheese, and maybe a foot long sandwich as a
snack for her brother Bob. We also need a small plastic snake, a yellow book, a rubber
duck, a paper I-pad, the dog video game, a big toy frog for the kids, but not the faked
gun. She can scoop these things into three red bags and two old backpacks, and we will
go meet her, Jake, and Jenny Wednesday at the very last train station at the edge of the
zoo. Also, let Stella know that the toy frog is running low on battery.
The second adaptation was two parts: repeated vowel utterances by participants and
measuring vowel duration. In the original Peterson and Barney (1952) study there were no
reports on vowel duration. However, more current studies such as Hillenbrand, Getty, Clark, and
Wheeler (1995) and Koffi (2017b) have begun reporting on this correlate. Therefore, to maintain
consistency, this study also includes vowel duration as another acoustic correlate for describing
the vowel spaces of Northern Minnesota English. The second part of this adaptation is that
vowels are uttered three times rather than only twice. This was implemented for normalization
purposes. Each speaker was averaged over their three utterances. Following this, overall men
averages and overall women averages were found for each word.
The last adaptation to the Peterson and Barney (1952) methodology was the implication
of vowel types. While it is basic linguistics to recognize high vowels from low vowels and front

37
vowel from back vowels, the actual boundaries between each is a bit more complex (Ladegfoged
& Johnson, 2015, p. 92). The complexity only worsens when mid vowels and central vowels are
introduced. Therefore, general vocalic boundaries between vowel types have been developed for
ease of classification. More on these vowel types is discussed in Chapter 2.
Participants
Data was collected from 20 participants whose origins are scattered in 13 different
Northern Minnesota counties—Beltrami, Cass, Clearwater, Hubbard, Itasca, Kittson,
Koochiching, Lake, Marshall, Pennington, Polk, Roseau, and Saint Louis. There are ten men
who are between the ages of 20 and 50 while the ten women have an even greater range of 18
through 64 years of age. Each of the participants is considered as a native resident of Northern
Minnesota. Native resident can be defined as persons who grew up in the region of inquiry
during their influential years of youth which refers to ages one through seventeen. Therefore, any
participants asked to participate in the study were screened by three factors. The first screener
narrowed in on all participants who spoke English as their first language. The second screener
required that participants were within the age bracket of 18-64 years. The final screener required
that all participants lived in Northern Minnesota during the years of one through seventeen.
Labov, Rosenfelder, and Fruehwald (2013) stated that from the age 17 and on, speakers
diminishing rate of dialectal variance follows the “1/age” (p. 39). In other words, as speakers
grow in years their accent becomes more and more fixed and the chance of speakers drastically
changing their accent becomes less with time. For example, if there are two speakers, a 56 year
old speaker and a 7 year old speaker, the 56 year old person is less likely to drastically change
his or her dialect since their diminishing rate is 1/56. The 7 year old speaker, on the other hand,

38
has a much greater possibility of dialectal variation since their diminishing rate is 1/7. It is for
this reason that speakers are required to have remained all of their influential years of youth (1-
17) in Northern Minnesota.
Out of all the 20 speakers who participated in this study, 40% of the participants declared
having some knowledge of a second language—Korean, Japanese, Ojibwe, Finish, and
Bulgarian. If participants indicated any form of partial fluency of a second language such as
“some”, “partial”, or “not fluent”, all answers are considered as having partial fluency and are
labeled as “second language (not fluent)”. Table 3.2 below represents the men’s background
information which was collected from the Task 1 Survey. Table 3.3 contains the women’s
background information from said task.
Table 3.2
Men’s Background Information Table
Participants Age First
Language
Other Languages County Years outside of
Northern MN
Speaker 1M 20 English NA 20 (Beltrami) 0
Speaker 2M 23 English NA 23 (Itasca) 0
Speaker 3M 24 English Korean (not fluent) 20 (Clearwater)
4 (Beltrami County)
0
Speaker 4M 50 English NA 48 (Kittson) 0
Speaker 5M 21 English NA 21 (Lake) 0
Speaker 6M 30 English NA 30 (Pennington) 0
Speaker 7M 21 English NA 18 (Polk)
3 (Beltrami)
0
Speaker 8M 21 English NA 21
(Beltrami/Hubbard) 0
Speaker 9M 27 English NA 27 (Beltrami) 0
Speaker
10M
42 English NA 9 (Pennington) 0

39
Table 3.3
Women’s Background Information Table
Participants Age First
Language
Other Languages County Years outside of
Northern MN
Speaker 1F 53 English NA Beltrami (46) 5.5 yrs (Texas)
9 mths (Alaska)
Speaker 2F 22 English Japanese 22 (Lake) 0
Speaker 3F 22 English Ojibwe (not fluent) 19 (Cass)
3 (Beltrami)
0
Speaker 4F 20 English Finish (not fluent) 16 (Clearwater)
4 (Beltrami)
0
Speaker 5F 55 English NA 55 (Kittson) 0
Speaker 6F 20 English NA 18 (Koochiching)
2 (Beltrami)
0
Speaker 7F 30 English Bulgarian 25 (Marshall)
(math results in 21
years)
3 yrs (Bulgaria)
6 yrs (Metro Area,
MN)
Speaker 8F 21 English NA 18 (Pennington)
3 (Beltrami)
0
Speaker 9F 64 English NA 46 (Roseau) 0
Speaker 10F 22 English NA 22 (St. Louis) 0
The last point worth making pertains to the last column on each table above which is
titled “Years outside of Northern MN”. As the title reads, this is time that the participants spent
outside of Northern Minnesota. However, it should be borne in mind that any time spent outside
of this region was after the influential years (1-17). Therefore, according to Labov, Rosenfelder,
and Fruehwald (2013, p. 39), this time away does not have any significant effects on their
dialects.
Equipment
The speakers for this study were recruited in one of two ways, either from the Mass
Communication department at Bemidji State University (BSU) or from public libraries scattered

40
in various counties of the northern region of Minnesota. Personal connections with students and
professors in said department at BSU made it possible to recruit Mass Communication students
and to acquire a sound proof recording studio. These volunteer students were recorded in one of
the department’s recording studios with an ElectroVoice RE20 microphone connected by a BSW
XLR cable to a Behringer U-Phoria UMC22 audio interface which was connected to a Windows
10 Enterprise Dell desktop with an Intel Zeon processor and a 64-bit operating system. The
program used for recording was Adobe Audition CC 2017. Speakers recorded in the public
libraries were recorded with an Audio-Technica AT8035 Shotgun Condenser which was
connected to a Zoom H4nSP Handy Recorder by a JSJ OFC XLR cable. If permitted by public
libraries (such as in Lake county), a separate room was used for recording speakers. Otherwise
recordings were done in a quiet corner of the library if no room was available (such as with
Kittson, Pennington, and Roseau county). The subsequent tables indicate the location of
recording for each speaker.
Table 3.4
Recording Locations of Men Table
Men recorded at BSU sound proof room Men recorded at public libraries
Speaker 2M Speaker 1M
Speaker 3M Speaker 4M
Speaker 7M Speaker 5M
Speaker 9M Speaker 6M
Speaker 8M
Speaker 10M

41
Table 3.5
Recording locations of women Table
Women recorded at BSU sound proof room Women recorded at public libraries
Speaker 3F Speaker 1F
Speaker 4F Speaker 2F
Speaker 6F Speaker 5F
Speaker 10F Speaker 7F
Speaker 8F
Speaker 9F
After the recordings were made, they were transferred either by a K&ZZ 16 GB 2.0 USB
Flashdrive Swivel (transferring from the desktop) or a SanDisk SDHC card (transferring from
the Zoom H4nSP Handy Recorder) to my personal computer which is an HP Pavilion g6
Notebook PC with an Intel processor and 64-bit operating system. Once each recording was
transferred, they were immediately imported into the computer software program, Praat, where
the vowel sounds from Task 2 were isolated, measured, and analyzed under six acoustic
correlates: first formant (F1), second formant (F2), third formant (F3), duration (DUR), intensity,
and pitch.

42
Figure 3.1: A representation of speaker 2F’s first realization of the word <hæd >.
Spectrographs such as the one presented in Figure 3.1 above exemplify how vowels were
isolated, measured and analyzed. In a narrow frame such as this, the “steady state” of a vowel
was first located. The “steady state” is associated with the acoustic energy of a vowel. Fricatives
such as [h] and voiced stops such as [d] have differing acoustic frequency patterns than those of
vocalic sounds. The initial [h] sound has no vibrations of the vocal folds whereas a vowel does.
Furthermore, even though vocal vibrations are also present in the realization of [d], just before
this stop there is normally a very prevalent pause of airflow. However, as is quite clear in the F1,
there is a continuous sound that does not easily distinguish between vowels and voiced stops. For
this reason, the second formant was utilized for vowel location since it more clearly reveals the
separation of the two types of sounds. This method was used consistently throughout the whole
study.
Once the “steady state” was found, then each vowel could be measured and analyzed.
The acoustic correlates analyzed were the first formant (F1), second formant (F2), third formant
(F3), duration, intensity, and pitch. More details on these cues are discussed in Chapter 2.

43
Measurements for each word were pooled into two groups, men and women (for obvious
biological purposes). Each group was first averaged individually, since each speaker produced
each word three times. Then, overall averages for every word were calculated from each
biological group. After all the averages were calculated, standard deviation was taken for each
word in both groups. Lastly, overall averages were transferred to Norm9 where the data was
plotted in vowel space charts accordingly.
9 Norm is a website for creating vowel space charts. It can be found at
http://lingtools.uoregon.edu/norm/norm1.php
44
Chapter 4: Results
This chapter is divided into six sections. The first section discusses the acoustic qualities
of vowels spaces in men’s speech from Northern Minnesota, focusing on six different acoustic
correlates (F1, F2, F3, Duration, Intensity, and Pitch). The second section, following a similar
structure, discusses the acoustic vowels spaces within women’s speech from Northern
Minnesota. The third section commences the comparisons between Northern Minnesota English
dialect with other American English dialects. General American English and Northern Minnesota
English are compared first. The forth section covers the comparison of Northern Minnesota
English and Midwest English. The comparison of Northern Minnesota English and Central
Minnesota English is discussed in the fifth section. The final section is dedicated to comparing
Northern Minnesota English and Winnipeg Canadian English.
NMNE Men F1: Vowel Height
Vowel height correlates to the first formant and is distinctive when there is at least 63 Hz
between two phonemic vowels (Koffi, 2016b, pp. 121-22). Within the vowel height feature there
are three levels of vowels which are high vowels, mid vowels, and low vowels. Boundaries for
these levels are dependent upon biological factors which divide men from women (Read & Kent,
2002, pp. 189-95). To briefly recall, vocalic boundaries within vowel height have been
developed from insights from Liljencrantz and Lindlom (1972) as well as Ladefoged and
Johnson (2015). Each level has a specific range of Hertz (Hz) and those ranges for men are as
follows. High vowels must be less than 400 Hz. Mid vowels must fall within the range of 400 Hz
to 600 Hz. Low vowels must be greater than 600 Hz. The subsequent table presents acoustic data
from ten NMNE men.

45
Table 4.1
NMNE Men F1 Measurements Table10
Lexical Set fleece kit face dress trap lot cloth goat foot goose strut
Vowels [i] [ɪ] [e] [ɛ] [æ] [ɑ] [ɔ] [o] [ʊ] [u] [ʌ]
Speaker
1M
F1 276 442 453 535 623 723 723 513 473 301 586
Speaker
2M
F1 285 425 374 485 591 671 694 431 441 312 531
Speaker
3M
F1 274 441 401 581 685 748 731 490 533 288 606
Speaker
4M
F1 311 447 408 512 623 707 694 448 487 348 578
Speaker
5M
F1 291 422 378 561 649 667 606 NA 436 347 NA
Speaker
6M
F1 277 405 367 534 656 624 607 414 431 323 544
Speaker
7M
F1 276 434 425 576 715 734 798 494 469 342 578
Speaker
8M
F1 262 405 364 479 520 569 679 450 422 315 557
Speaker
9M
F1 251 401 351 472 639 NA 650 444 418 308 489
Speaker
10M
F1 302 419 392 454 502 596 585 431 447 355 532
Average 280 424 391 518 611 671 676 457 455 323 555
Standard
Deviation 17.73 16.74 31.18 45.43 67.89 63.39 66.15 33.71 35.39 22.84 35.71
NMNE men collectively produce vowels in all three levels of vowel height. Within the
highest level of vowel height, NMNE men realize three vowels as high vowels. In the next level,
they realize five vowels as mid vowels. Lastly, NMNE men realize three vowel phonemes in the
lowest level of vowel height.
10 It should be noted that Speakers 5M and 9M all mispronounced words during task 2. Speaker 5M
produced <hoed> and <hud> as [who’d] and [hʊd] respectively. Likewise, Speaker 9M realized the word <hod> as
[hʊd]. Therefore, these data were not included in any of the tables and I have chosen to write NA in the
corresponding boxes in Table 4.1. This same gap in data can be expected for these speakers throughout the rest of
the study.

46
Commencing with the highest level, NMNE men realize the fleece [i] vowel (280 Hz),
the goose [u] vowel (323 Hz), and the face [e] vowel (391 Hz) as high vowel sounds. Of the
three, the fleece [i] vowel has the lowest standard deviation (17.73 Hz) and it is realized as the
highest vocalic sound of this dialect. The second highest vowel of the NMNE men’s dialect is
the goose [u] vowel. Like the fleece [i] vowel, it has a low standard deviation of only 22.84 Hz.
The face [e] vowel, on the other hand, is averaged as the lowest of the high vowels and, since its
location is so close to the 400 Hz boundary, four of the speakers (Speaker 1M, Speaker 3M,
Speaker 4M, and Speaker 7M) produce it as a mid vowel. However, considering this fluctuation
between levels, standard deviation for the face [e] vowel is still quite low (31.18 Hz).
Mid vowels are more numerous in NMNE men’s speech. The mid level contains five out
of the eleven vowels (45%), which is just under half of men’s phonemic vowels from the
Northern Minnesota English dialect. Beginning with the highest and moving toward the lowest,
the mid level vowels consist of the kit [ɪ] vowel (424 Hz), the foot [ʊ] vowel (455 Hz), the goat
[o] vowel (457 Hz), the dress [ɛ] vowel (518 Hz), and the strut [ʌ] vowel (555 Hz). Similar to
high vowels, standard deviations for mid vowels are also low. The kit [ɪ] vowel has the lowest
standard deviation of only 16.74 Hz while the highest standard deviation is found in the dress [ɛ]
vowel. It deviates only by an average of 45.43 Hz.
Finally at the lowest level of vowel height, NMNE men realize three vowel phonemes as
low vowels. F1 averages of these vowels show that the lowest vowel of this dialect is the cloth
[ɔ] vowel, which is realized at 676 Hz. It is closely pursued by the lot [ɑ] vowel (671 Hz).
Trailing in last is the trap [æ] vowel and it is realized at an average of 611 Hz. Interestingly
enough, deviations in this level are much higher in comparison to the former levels of vowel

47
height. The trap [æ] vowel has the greatest standard deviation of 67.89 Hz. The cloth [ɔ] vowel
follows next with 66.15 Hz. Finally, the lot [ɑ] vowel comes in with the lowest value of standard
deviation which is 63.39 Hz. All of these values of standard deviation do in fact exceed the 63
Hz threshold and this is a result of at least one speaker producing each sound as a mid vowel.
The trap [æ] vowel is realized as a mid vowel by three speakers, Speaker 2M, Speaker 8M, and
Speaker 10M. Speaker 8M and Speaker 10M also realize the lot [ɑ] vowel as a mid vowel and
only Speaker 10M realizes the cloth [ɔ] vowel as a mid vowel. Consequently, the low vowels
have the highest standard deviations while the high level vowels maintain the lowest standard
deviations.
NMNE Men F2: Tongue Retraction
Tongue retraction, represented by the F2 correlate, is divided into three regions which are
front, central, and back. Similar to the levels of vowel height, the regions of tongue retraction
also have particular ranges which are as follows. For men, front vowels must have an F2 value
that is greater than or equal to 1600 Hz. Central vowels must be within the range of 1200 Hz and
1599 Hz. Back vowels must be less than 1200 Hz. Acoustic data under the second formant for
NMNE men are presented below in Table 4.2.

48
Table 4.2
NMNE Men F2 Measurements Table
Lexical Set fleece kit face dress trap lot cloth goat foot goose strut
Vowels [i] [ɪ] [e] [ɛ] [æ] [ɑ] [ɔ] [o] [ʊ] [u] [ʌ]
Speaker
1M
F2 2336 2012 2149 1935 1872 1226 1203 1140 1296 1037 1340
Speaker
2M
F2 2510 1912 2123 1779 1712 1284 1298 1097 1414 1169 1426
Speaker
3M
F2 2262 1907 2122 1727 1608 1236 1193 1052 1390 1217 1364
Speaker
4M
F2 2244 1852 2060 1778 1628 1298 1291 1321 1432 1348 1478
Speaker
5M
F2 2257 1900 2164 1938 1801 1056 1149 NA 1180 1234 NA
Speaker
6M
F2 2483 2153 2408 2139 1947 1196 1135 889 1515 1074 1448
Speaker
7M
F2 2349 1965 2215 1850 1763 1270 1358 1016 1374 1070 1388
Speaker
8M
F2 2194 1775 2039 1689 1646 1254 1632 1184 1356 1359 1465
Speaker
9M
F2 2214 1853 2076 1638 1534 NA 1137 907 1143 999 1225
Speaker
10M
F2 2256 1894 2174 1841 1828 1181 1232 906 1318 1070 1334
Average 2310 1922 2153 1831 1733 1222 1262 1056 1342 1157 1385
Standard
Deviation
109.12 103.37 104.81 145.8 130.77 73.37 149.78 145.57 112.45 128.38 80.13
Northern Minnesota English men realize vowels in all three regions of tongue retraction,
with the exception of Speaker 4M. Five vowels are produced in the front region, the central
region has four vocalic phonemes, and there are only two vowel sounds realized in the back
region.
The front region has the biggest inventory because these men realize 45% of all their
vowel phonemes here. The most fronted vowel of the dialect is the fleece [i] vowel. It has an
average of 2310 Hz. The face [e] vowel is the second most fronted vowel in the men’s dialect

49
with an average of 2153 Hz. The kit [ɪ] vowel comes in third, where it is realized at 1922 Hz.
The dress [ɛ] vowel trails behind at 1831 Hz and the trap [æ] vowel comes in last at 1733 Hz.
Standard deviations for all front vowels are low since none exceed the 200 Hz threshold.
Central vowels include the lot [ɑ] vowel (1222 Hz) which is the most fronted of all the
central vowels, followed by the cloth [ɔ] vowel (1262 Hz), the foot [ʊ] vowel (1342 Hz), and
finally the strut [ʌ] vowel (1385 Hz). Even though all of the standard deviations remain low
under the F2 cue, most of the male participants do in fact still vary in their regions of production
while uttering these particular vowels. The cloth [ɔ] vowel, for instance, is realized in all three
regions of tongue retraction. It is produced as a central vowel by Speaker 1M, Speaker 2M,
Speaker 4M, Speaker 7M, and Speaker 10M (50% of men). The cloth [ɔ] vowel is produced as a
back vowel by Speaker 3M, Speaker 5M, Speaker 6M, and Speaker 9M (40% of men), and it is
realized as a front vowel by Speaker 8M (10% of men). Likewise, the lot [ɑ] vowel is realized as
both a central vowel by 66% of the participants and a back vowel by 33% of the speakers
(Speakers 5M, 6M, and 10M)11. The foot [ʊ] vowel also follows this same pattern. Eighty
percent of the speakers realize the foot [ʊ] vowel as a central sound, whereas Speaker 5M and
Speaker 9M realize it as a back vowel. The strut [ʌ] vowel is the only central vowel which is
realized by all of the speakers as a central sound (with the exception of Speaker 5M due to a
mispronunciation during the recording).
According to the criteria in Table 4.2, there are only two back vowels in the Northern
Minnesota English men’s dialect although the lot [ɑ] and cloth [ɔ] vowels are both realized at the
11 Speaker 9M mispronounced the lot [ɑ] vowel. Consequently, his data for this word was unable to be used
in this study. It is for this reason that I choose to take percentages from a pool of nine participants rather than ten.

50
borderline of the central and back regions. The NMNE back vowels include the goat [o] vowel
and the goose [u] vowel. Of the two, the goat [o] vowel is the most stable in its region of tongue
retraction since all but Speaker 4M produce it as a back vowel (with the exclusion of Speaker
5M who mispronounced this vowel). Furthermore, the goat [o] vowel is the most backed vowel
of the two. It has an F2 average of 1056 Hz. The goose [u] vowel, on the other hand, is realized
at 1157 Hz. This close proximity to the 1200 Hz boundary explains why 40% of the speakers
realize the goose [u] vowel as a central sound. Despite this fluctuation, both of the back vowels,
as well as the front vowels and central vowels for that matter, maintain low values of standard
deviation.
NMNE Men: Acoustic Vowel Space Chart
An acoustic vowel space chart is a scatter plot graph that depicts the location of vowels
within the acoustic space. Data for this chart include only F1 and F2 averages. Along the y-axis
are the data points for the F1 correlate and along the x-axis are the data points for the F2
correlate. The acoustic vowel space chart for men is correlated with their particular vowel
boundaries. Data from the ten men from Northern Minnesota are presented below in Figure 4.1.

51
Figure 4.1: A representation of the NMNE men’s acoustic vowel space chart.
The NMNE men’s acoustic vowel space chart makes it much easier to identify the
extreme vowels of the dialect, which are the high and fronted fleece [i] vowel, the low cloth [ɔ]
vowel, and the backed goat [o] vowel. Furthermore, there are other characteristics about the
NMNE men’s dialect that also become more apparent which may not have been as evident

52
before in the previous tables. A few of the most significant findings are merged vowels, reversed
vowel positions, and distinctive vowel qualities.
The first finding is the merged lot [ɑ] and cloth [ɔ] vowels. According to Koffi, vowels
become merged “when the F1 distance between two adjacent vowels that are phonetically similar
but functionally different is less than 60 Hz” (2017a, p. 109). As it appears in the figure above,
the cloth [ɔ] vowel (676 Hz) is almost directly on top of the lot [ɑ] vowel (671 Hz). This is
because the acoustic space realized between the two sounds is only 5 Hz. As a result, the men’s
dialect from this study is unable to distinguish between the two phonemes. This finding is not
entirely unexpected considering Hillenbrand et al.’s confusion data (1995, p. 3108). They also
found that hearers confuse these two sounds 13.8% of the time.
The second significant finding in the NMNE men’s acoustic vowel space chart is the
reversed positions of the kit [ɪ] vowel and the face [e] vowel. Recalling back to Ladefoged and
Johnson’s (2015, p. 46) original vowel space chart alluded to in chapter 1, the kit [ɪ] vowel is
actually a high sound (or a mid-high sound rather) while the face [e] vowel is a mid sound.
However, it is the complete opposite in the NMNE men’s dialect. The face [e] vowel (391 Hz) is
the lowest constituent of the high vowels since it does not meet or exceed the 400 Hz boundary
separating mid sounds from high sounds. The kit [ɪ] vowel (424 Hz), on the other hand, is
actually the highest sound of all the mid vowels but still easily falls below the mid-high vowel
boundary. Consequently, the ten men from Northern Minnesota have in fact changed the order of
their vowel inventory.
The last significant finding is the distinctive qualities of the NMNE men’s foot [ʊ] vowel.
Presented by Ladefoged and Johnson (2015, p. 46), the English foot [ʊ] vowel is a high (mid-

53
high), back vowel. However, this is not the same location of realization for the NMNE men’s
foot [ʊ] vowel. As is apparent in the figure above, the NMNE men’s foot [ʊ] vowel has actually
been lowered from a high (mid-high) vowel sound to a mid vowel sound. Likewise, it has also
been fronted from the back region of tongue retraction to the central region. Consequently, the
NMNE men’s foot [ʊ] vowel is realized as a mid, central vowel because of its F1 average of 455
Hz and F2 average of 1342 Hz.
NMNE Men F3: Lip Rounding
Lip rounding is an acoustic correlate that “provides information about the position of the
lips in the production of sounds” (Koffi, 2016a, p. 13). In this current study this correlate has
been broken down into two distinct categories: rounded and unrounded. Men who utter words
that are classified into the former category must produce a sound that is averaged below 2500
Hz. The latter category entails of sounds produced equal to or above 2500 Hz. Lastly, if any two
sounds are perceptually salient in this cue, there must be at least 400 Hz between each sound
(Koffi, 2016a, p. 13). The table below presents F3 data from ten NMNE men.

54
Table 4.3
NMNE Men F3 Measurements Table
Lexical Set fleece kit face dress trap lot cloth goat foot goose strut
Vowels [i] [ɪ] [e] [ɛ] [æ] [ɑ] [ɔ] [o] [ʊ] [u] [ʌ]
Speaker
1M
F3 3125 2672 2734 2670 2612 2518 2516 2573 2439 2449 2550
Speaker
2M
F3 3107 2827 2843 2651 2514 2295 2407 2485 2659 2503 2615
Speaker
3M
F3 2957 2611 2626 2550 2479 2376 2319 2249 2364 2182 2427
Speaker
4M
F3 2959 2815 2741 2715 2683 2768 2723 2756 2465 2802 2611
Speaker
5M
F3 3056 2703 2907 2702 2483 2463 2794 NA 2374 2626 NA
Speaker
6M
F3 3162 2922 2963 2958 2557 2500 2483 2776 2592 2389 2480
Speaker
7M
F3 2790 2732 2921 2951 2886 2942 2793 2488 2531 2253 2675
Speaker
8M
F3 3001 2621 2628 2622 2645 2665 2751 2725 2704 2732 2671
Speaker
9M
F3 2893 2571 2603 2540 2424 NA 2524 2480 2403 2246 2514
Speaker
10M
F3 2882 2480 2920 2696 2615 2667 2700 2578 2398 2585 2382
Average 2993 2695 2788 2705 2589 2577 2601 2567 2492 2476 2547
Standard
Deviation
119.71 133.1 139.09 144.14 132.74 202.44 171.76 168.14 122.45 211.94 104.69
Rounding vowels is not a common feature in the speech patterns of NMNE men nor is it
an entirely robust correlate. To begin, there are only two rounded vowels within the data which
are the foot [ʊ] vowel and the goose [u] vowel. The central foot [ʊ] vowel is averaged at 2492
Hz, which falls just below the 2500 Hz limit. Likewise the back goose [u] vowel also just passes
this limit with an F3 average of 2476 Hz. However, these averages are not reflective within each
idiolect. For instance, speaker 8M is the only participant who does not round any of his vowels.
Furthermore, the lack of robustness of the F3 cue is more than obvious in Table 4.3 above. For

55
instance, the goose [u] vowel has the lowest F3 average of this dialect, and out of all the ten
other vowels, only the fleece [i] vowel is distinct from it. The two sounds are separated by a total
distance of 517 Hz (2476 Hz – 2993 Hz). The face [e] vowel, on the other hand, is averaged at
2788 Hz. Even though the face [e] vowel holds the second greatest distance from the goose [u]
vowel, the two vowels are only separated by 312 Hz. A similar conclusion can be said about the
latter eight vowels whose distance from the goose [u] vowel only decreases.
NMNE Men Dur: Vowel Duration
Vowel duration is an acoustic cue that describes the length of a sound. Even though in
English this correlate is not an essential cue for distinguishing vowel phonemes, it still does
provide some vowel characteristics which may or may not reveal dialectal patterns. For
perceptual salience in this correlate, there must be at least 10 ms between sounds that are less
than 200 ms in length. However, if a sound lasts 200 ms or longer, there must be at least 17 ms
between each sound for vowel distinction (Koffi & Lopez-Backstrom, 2018, p. 6). Acoustic data
for duration from the ten men from Northern Minnesota is presented below.

56
Table 4.4
NMNE Men Vowel Duration Measurements Table
Lexical Set fleece kit face dress trap lot cloth goat foot goose strut
Vowels [i] [ɪ] [e] [ɛ] [æ] [ɑ] [ɔ] [o] [ʊ] [u] [ʌ]
Speaker
1M
DUR 182 142 209 149 193 218 197 203 146 170 139
Speaker
2M
DUR 189 168 257 158 245 213 227 222 157 181 138
Speaker
3M
DUR 208 135 218 125 222 204 214 182 112 168 97
Speaker
4M
DUR 213 136 222 161 271 226 258 257 152 224 127
Speaker
5M
DUR 237 187 234 169 290 207 232 NA 171 189 NA
Speaker
6M
DUR 253 128 222 150 143 234 256 245 131 210 123
Speaker
7M
DUR 237 172 239 190 269 248 215 245 161 236 150
Speaker
8M
DUR 196 149 230 178 222 234 242 214 150 173 119
Speaker
9M
DUR 281 205 281 230 331 NA 305 266 209 273 171
Speaker
10M
DUR 233 149 280 164 299 300 230 265 154 176 136
Average 222 157 239 167 248 231 237 233 154 200 133
Standard
Deviation 30.99 25.09 25.37 28.13 55.41 29.34 30.24 29.49 25.27 34.97 20.7
Duration data for NMNE men reveal that there is a group of vowels which is realized as
the longest sound, one vowel that is realized as the second longest sound, and one vowel realized
as the shortest sound of this dialect. The longest vowel sound of NMNE men is held by the trap
[æ] vowel (248 ms). However, sharing this title is also the face [e] vowel (239 ms), the cloth [ɔ]
vowel (237 ms), the goat [o] vowel (233 ms), and finally the lot [ɑ] vowel (231 ms). Since each
of these vowels is within a distance of 17 ms of each other, the human ear is unable to detect a
difference between their durations. Interestingly enough, all three levels of vowel height are

57
represented by at least one constituent of this group (high [e], mid [o], low [æ, ɑ, ɔ]). The second
longest sound includes only the fleece [i] vowel. It is a high vowel that has a duration of 222
milliseconds. The last category of the shortest sound also includes only one vowel. The shortest
vowel of the NMNE men’s dialect is the strut [ʌ] vowel. It is a mid sound that is averaged at 133
ms and it does not share this title with any other. In fact, the closest durational neighbor, which is
the foot [ʊ] vowel, is separated from the strut [ʌ] vowel by a total of 21 ms (154 ms – 133 ms).
NMNE Men Int & F0: Vowel Intensity & Vowel Pitch
Vowel intensity and vowel pitch, similar to vowel duration, do in fact describe some
vowel characteristics, although they are not robust features for distinguishing between vowel
phonemes. The Just Noticeable Difference for vowel intensity is that sounds must be separated
by at least 5 dB to be distinguished. Vowel pitch, on the other hand, only calls for 1 Hz between
each vowel to cause a distinction between vowel sounds. Acoustic data for NMNE men is
presented in the following two tables. Vowel intensity data is presented first and then it is
followed by vowel pitch.

58
Table 4.5
NMNE Men Vowel Intensity Measurements Table
Lexical Set fleece kit face dress trap lot cloth goat foot goose strut
Vowels [i] [ɪ] [e] [ɛ] [æ] [ɑ] [ɔ] [o] [ʊ] [u] [ʌ]
Speaker
1M
INT 53 51 52 52 52 53 53 53 52 56 54
Speaker
2M
INT 77 80 75 75 74 74 73 77 77 79 75
Speaker
3M
INT 73 74 70 73 72 76 75 72 75 73 73
Speaker
4M
INT 53 53 50 50 49 50 47 49 53 54 52
Speaker
5M
INT 63 65 65 57 56 58 58 NA 63 63 NA
Speaker
6M
INT 48 53 53 50 54 49 48 54 52 56 51
Speaker
7M
INT 58 58 58 58 57 58 61 59 61 61 58
Speaker
8M
INT 52 54 53 51 47 48 46 50 52 51 46
Speaker
9M
INT 55 56 55 54 54 NA 57 57 58 58 55
Speaker
10M
INT 59 56 57 51 53 54 52 57 54 59 54
Average 59.1 60 58.8 57.1 56.8 57.7 57 58.6 59.7 61 57.5
Standard
Deviation 9.39 9.84 8.40 9.33 9.05 10.40 10.21 9.63 9.45 8.71 9.88
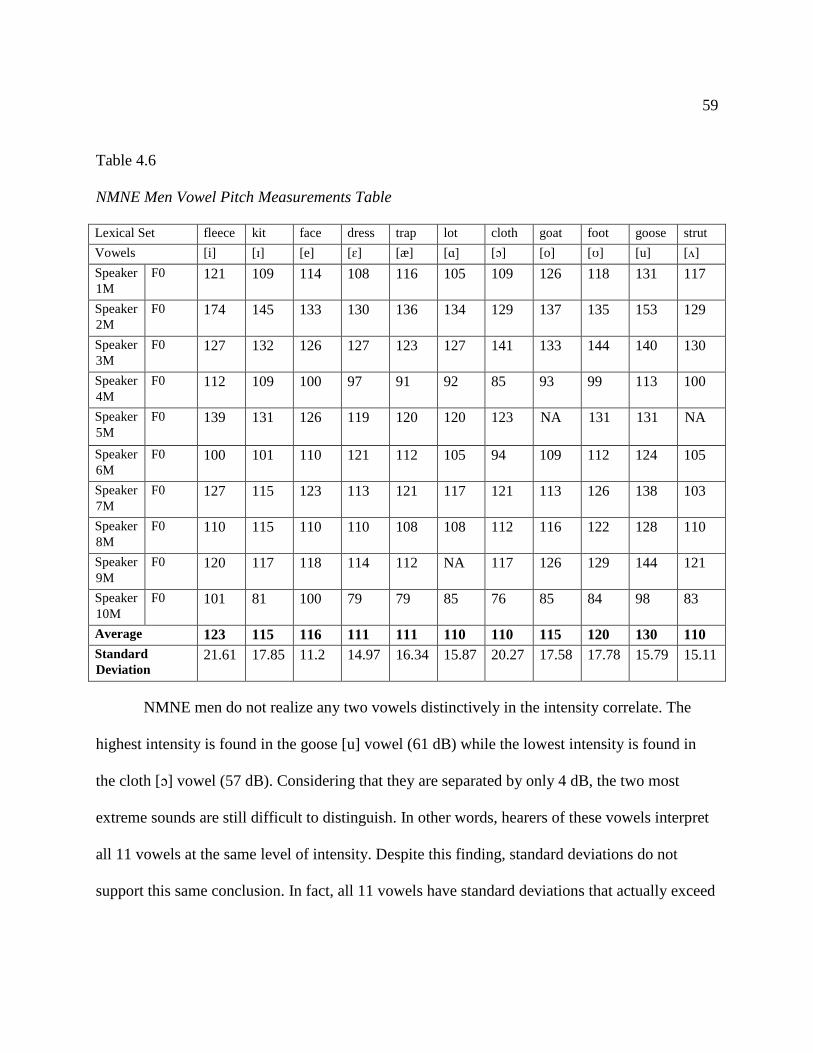
59
Table 4.6
NMNE Men Vowel Pitch Measurements Table
Lexical Set fleece kit face dress trap lot cloth goat foot goose strut
Vowels [i] [ɪ] [e] [ɛ] [æ] [ɑ] [ɔ] [o] [ʊ] [u] [ʌ]
Speaker
1M
F0 121 109 114 108 116 105 109 126 118 131 117
Speaker
2M
F0 174 145 133 130 136 134 129 137 135 153 129
Speaker
3M
F0 127 132 126 127 123 127 141 133 144 140 130
Speaker
4M
F0 112 109 100 97 91 92 85 93 99 113 100
Speaker
5M
F0 139 131 126 119 120 120 123 NA 131 131 NA
Speaker
6M
F0 100 101 110 121 112 105 94 109 112 124 105
Speaker
7M
F0 127 115 123 113 121 117 121 113 126 138 103
Speaker
8M
F0 110 115 110 110 108 108 112 116 122 128 110
Speaker
9M
F0 120 117 118 114 112 NA 117 126 129 144 121
Speaker
10M
F0 101 81 100 79 79 85 76 85 84 98 83
Average 123 115 116 111 111 110 110 115 120 130 110
Standard
Deviation 21.61 17.85 11.2 14.97 16.34 15.87 20.27 17.58 17.78 15.79 15.11
NMNE men do not realize any two vowels distinctively in the intensity correlate. The
highest intensity is found in the goose [u] vowel (61 dB) while the lowest intensity is found in
the cloth [ɔ] vowel (57 dB). Considering that they are separated by only 4 dB, the two most
extreme sounds are still difficult to distinguish. In other words, hearers of these vowels interpret
all 11 vowels at the same level of intensity. Despite this finding, standard deviations do not
support this same conclusion. In fact, all 11 vowels have standard deviations that actually exceed

60
the 5 dB threshold. For that reason, it can be stated that the intensity correlate does distinguish
between the men’s idiolects even though it does not distinguish between vowels.
Vowel pitch is a bit more distinctive. Although there are three groups of vowels which
are not distinguished by pitch (1: the dress [ɛ] and trap [æ] vowels, 2: the lot [ɑ], cloth [ɔ], and
strut [ʌ] vowels, and 3: the kit [ɪ] and goat [o] vowels), there are still the remaining vowels that
are realized distinctively. The most extreme cases are the goose [u] vowel along with the lot [ɑ],
cloth [ɔ], and strut [ʌ] vowels. The goose [u] vowel is realized with the highest pitch (130 Hz)
while the lot [ɑ], cloth [ɔ], and strut [ʌ] vowels are realized with the lowest pitch (110 Hz) of this
dialect. What’s more is that lying between those two extremities are also five more distinct levels
of pitch. Thus, it is clear that NMNE men do in fact distinguish majority of their vowels (63%) in
the pitch correlate. Standard deviations, on the other hand, reveal that all ten participants do
realize their vowels differently.
NMNE Women F1: Vowel Height
Acoustic data for the ten women from Northern Minnesota are presented independently
from their male counterparts. “Because women’s vocal tracts are generally shorter than men’s,
women have higher values for formant frequencies” (Read & Kent, 2002, p. 194). Thus, distinct
boundaries for vowel height have been developed for women’s speech as well. Although vowel
height for women still encompasses the same three levels as their male counterparts (high, mid,
and low), the boundaries were divided differently from men’s so as to compensate for the
biological differences of women’s vocal tracts. Therefore, for women, high vowels must be less
than 480 Hz. Mid vowels must be within 480 Hz to 720 Hz. Low vowels must be greater than
720 Hz. Table 4.7 below presents acoustic data from ten NMNE women.

61
Table 4.7
NMNE Women F1 Measurements Table12
Lexical Set fleece kit face dress trap lot cloth goat foot goose strut
Vowels [i] [ɪ] [e] [ɛ] [æ] [ɑ] [ɔ] [o] [ʊ] [u] [ʌ]
Speaker
1F
F1 349 522 468 623 709 738 724 501 531 389 637
Speaker
2F
F1 383 462 416 644 799 704 720 444 478 417 575
Speaker
3F
F1 390 548 504 837 979 935 948 593 564 410 812
Speaker
4F
F1 333 502 423 717 962 862 828 485 521 385 615
Speaker
5F
F1 314 505 433 634 753 718 761 460 494 386 674
Speaker
6F
F1 372 493 516 711 963 882 854 509 557 408 727
Speaker
7F
F1 366 412 382 505 773 572 590 433 447 378 559
Speaker
8F
F1 326 598 520 699 862 891 807 654 672 434 734
Speaker
9F
F1 387 400 395 490 614 777 836 NA 420 380 638
Speaker
10F
F1 339 497 417 693 844 804 788 507 530 395 675
Average 355 493 447 655 825 788 785 509 521 398 664
Standard
Deviation
27.35 58.96 50.92 102.62 120.08 109.55 95.92 71.69 70.22 18.34 77.27
F1 values for Northern Minnesota English women represented in Table 4.7 clearly
demonstrate three distinct levels of vowel height. Although not all speakers produce the same
vowels for each level, every speaker does in fact realize at least one vowel in all levels (high,
mid, and low). Similar to their male counterparts, NMNE women realize three vowels in the high
level, five vowels in the mid level, and three phonemic vowels in the low level.
12It should be noted that speaker 9F mispronounced the word <hoed> as [hud] during task 2. Consequently,
her data was unable to be used for the goat [o] vowel and because of this I have chosen to write NA in Table 4.7.
This same gap in data can be expected throughout the rest of the study.
62
According to the general vocalic boundaries derived within this study, the three high
vowels are the fleece [i] vowel (355 Hz), the goose [u] vowel (398 Hz), and the face [e] vowel
(447 Hz). Both the fleece [i] vowel and the goose [u] vowel have low standard deviations. In
other words, women from this study have a similar area of realization for each vowel and they do
not deviate from these locations much at all. The last high vowel, and the lowest of the three, is
the face [e] vowel. It has a standard deviation of 50.92 Hz. Although this is still on the low side
since it doesn’t exceed the 63 Hz threshold, standard deviation for the face [e] vowel is a bit
higher in comparison to the fleece [i] and goose [u] vowels. Furthermore, its close location to the
480 Hz boundary explains why Speaker 2F, Speaker 5F, and Speaker 7F realize it as a mid
vowel instead of a high vowel like the latter 70% of the speakers.
According the data in Table 4.7, NMNE women realize the majority of their vowels in
the mid level. Out of eleven vowels, five of them (45%) are included in this particular level.
These sounds include the following vowel phonemes. Beginning with the highest mid vowel, the
kit [ɪ] vowel (493 Hz) does not waiver between levels at all and its standard deviation (58.96 Hz)
is just beneath its peak of 63 Hz. However, this vowel maintains the lowest standard deviation of
all the mid vowels realized by the ten NMNE women. The latter four vowels have standard
deviations which easily exceed the 63 Hz threshold. The second highest mid vowel is the goat
[o] vowel. It has an F1 value of 509 Hz, a standard deviation of 71.69 Hz, and it is realized by
every speaker as a mid vowel. Next is the foot [ʊ] vowel which has very similar acoustic
characteristics as the goat [o] vowel. The foot [ʊ] vowel has an F1 average of 521 Hz, its
standard deviation is 70.22 Hz, and it is also produced as a mid vowel by each woman. Trailing
in last are the dress [ɛ] vowel (655 Hz) and the strut [ʌ] vowel (664 Hz). These are the only two
63
mid vowels which are produced in two distinct levels of vowel height. Speaker 3F realizes the
dress [ɛ] vowel as a low vowel (837 Hz) while the latter nine participants produce it as a mid
vowel. Likewise, the strut [ʌ] vowel is realized as a low vowel by Speaker 3F, Speaker 6F, and
Speaker 8F, whereas the latter seven speakers produce it as a mid vowel. Consequently, the dress
[ɛ] vowel and the strut [ʌ] vowel carry the highest standard deviations of this level which are
102.62 Hz and 77.27 Hz, respectfully.
Low vowels for NMNE women consist of three vocalic phonemes. Unlike their male
counterparts, the lowest of these sounds is the trap [æ] vowel (835 Hz). It is realized by 80% of
the speakers as a low vowel while two speakers, Speaker 1F and Speaker 9F, produce it as a mid
vowel. Consequently, the trap [æ] vowel holds the greatest standard deviation of all eleven
vowels in Table 4.7. Its standard deviation is 120.08 Hz. Proceeding this in a similar manner is
the lot [ɑ] vowel. It has an F1 average of 788 Hz and its standard deviation is 109.55 Hz. Lastly,
the highest of all low vowel phonemes is the cloth [ɔ] vowel. It has an F1 value of 785 Hz and a
standard deviation of 95.92 Hz. Even though standard deviations for the lot [ɑ] vowel and the
cloth [ɔ] vowel are not as dramatic as the trap [æ] vowel, they still easily exceed the 63 Hz
threshold. Similar to the trap [æ] vowel, this is a result of multiple participants producing both
the lot [ɑ] vowel and the cloth [ɔ] vowel as mid vowels instead of low vowels. Speaker 2F and
Speaker 5F produce the lot [ɑ] vowel as a mid vowel and Speaker 7F realizes both the lot [ɑ] and
cloth [ɔ] vowels as mid vowels. Out of all the vowel height levels, low vowels, along with the
dress [ɛ] vowel which is a central sound, have the highest standard deviations of all vowels in
this particular dialect.

64
NMNE Women F2: Tongue Retraction
Within the F2 feature women also have their own specific boundaries which are distinct
from their male counterparts even though they maintain the same regions of tongue retraction
which are front, central, and back. For women, the boundaries of front vowels must be greater or
equal to 1920 Hz. Central vowels must fall with the range of 1440 Hz to 1919 Hz. Back vowels
must be less than 1440 Hz. Acoustic data for the F2 correlate for women of Northern Minnesota
are presented below in Table 4.8.
Table 4.8
NMNE Women F2 Measurements Table
Lexical Set fleece kit face dress trap lot cloth goat foot goose strut
Vowels [i] [ɪ] [e] [ɛ] [æ] [ɑ] [ɔ] [o] [ʊ] [u] [ʌ]
Speaker
1F
F2 2539 2022 2361 1968 1870 1363 1327 971 1397 1117 1629
Speaker
2F
F2 2414 2101 2470 1674 1396 1271 1344 1130 1506 1330 1411
Speaker
3F
F2 2839 2280 2499 2002 1703 1377 1387 1136 1554 1246 1623
Speaker
4F
F2 2755 2153 2631 2022 1610 1344 1376 1132 1589 1110 1574
Speaker
5F
F2 2665 2120 2483 1974 1875 1259 1238 744 1337 868 1548
Speaker
6F
F2 2213 2374 2536 2098 1845 1482 1420 1172 1641 1262 1719
Speaker
7F
F2 2495 2300 2598 2135 2012 1139 1226 990 1338 1123 1447
Speaker
8F
F2 2299 2090 2184 1759 1951 1451 1472 1190 1596 1335 1645
Speaker
9F
F2 2941 2511 2492 2344 2088 1593 1538 NA 1626 1352 1808
Speaker
10F
F2 2690 2184 2577 2035 1908 1444 1426 1088 1498 1140 1559
Average 2585 2213 2483 2001 1825 1372 1375 1061 1508 1188 1596
Standard
Deviation
235.04 150.56 129.77 186.76 204.66 129.32 97.17 140.86 114.79 148.15 117.79

65
Similar to the three levels of vowel height, all three regions of tongue retraction are also
represented in the NMNE women’s dialect. The front vowels include four sounds, the central
region has three vowel sounds, and the back region has four vowel phonemes produced within it.
Front vowels realized in the NMNE women’s dialect include the fleece [i] vowel, the
face [e] vowel, the kit [ɪ] vowel, and the dress [ɛ] vowel. The most fronted sound of this dialect
is the fleece [i] vowel. It has an F2 average of 2585 Hz. Furthermore, out of all the front vowels,
the fleece [i] vowel has the highest standard deviation of 235.04 Hz which exceeds the 200 Hz
threshold. Although all speakers do realize this sound as a front vowel, some speakers, Speaker
3F (2839 Hz) and Speaker 9F (2941 Hz), are far more fronted than all the rest. As a result, this
vowel reveals slightly distinctive F2 characteristics among the ten NMNE women. The second
most fronted vowel is the face [e] vowel since its F2 average is 2483 Hz. It has a low standard
deviation of 129.77 Hz and is realized by each of the ten women as a front vowel. Similarly, the
kit [ɪ] vowel follows the same pattern. It is the third most fronted vowel with an F2 average of
2213 Hz. The kit [ɪ] vowel has a low standard deviation of 150.56 Hz and all speakers produce it
as a front vowel. The last vowel of this group, and the least fronted, is the dress [ɛ] vowel. Its
average F2 value is 2001 Hz and it has a low standard deviation of 186.76 Hz. However, its close
proximity to the central-front boundary of 1920 Hz has caused a slight division within the
speakers. Speaker 2F and Speaker 8F both realize this sound as a central vowel rather than as
front vowel like the latter 80% of women.
Central vowels for these ten women are the trap [æ] vowel (1825 Hz), the foot [ʊ] vowel
(1508 Hz), and the strut [ʌ] vowel (1596 Hz). The former is realized closest to the 1920 Hz
boundary between the front and central regions. It is for this reason that Speaker 7F, Speaker 8F

66
and Speaker 9F produce the trap [æ] vowel as a front sound rather than as a central one. In
contrast, Speaker 2F deviates in the opposing direction and realizes the trap [æ] vowel as a back
vowel. Consequently, standard deviation reaches its peak at 204.66 Hz and the women remain
divided. At the other side of the central region are the foot [ʊ] vowel (1508 Hz) and the strut [ʌ]
vowel (1596 Hz). Even though women do produce these two vowels as well in various regions of
tongue retraction, they still maintain low standard deviations, unlike the trap [æ] vowel. The foot
[ʊ] vowel, for instance, has a standard deviation of only 114.79 Hz even though three
participants, Speaker 1F, Speaker 5F, and Speaker 7F, produce the foot [ʊ] vowel as a back
vowel. Likewise, the strut [ʌ] vowel also has a low standard deviation of 117.79 Hz, although
Speaker 2F realizes it as a back vowel. Considering these small divisions among the ten NMNE
women, they still do not deviate enough in their realizations of either the foot [ʊ] vowel or the
strut [ʌ] vowel to produce any distinctive characteristics in the F2 correlate. The trap [æ] vowel,
on the other hand, does deviate much more than its central vocalic counterparts. It is realized in
each of the three regions of tongue retraction with the majority (60%) settled in the central
region.
Women from Northern Minnesota realize four of the eleven vowel phonemes as back
vowels. The lot [ɑ] vowel is most fronted of all back vowels. It has an F2 average of 1372 Hz
and it has a low standard deviation of 129.32 Hz. Furthermore, this vowel lies right at the
central-back boundary of 1440 Hz. For this reason 40% of the speakers (Speaker 6F, Speaker 8F,
Speaker 9F, and Speaker 10F) realize this sound as a central vowel rather than as a back one.
Sitting only 3 Hz away is the cloth [ɔ] vowel (1375 Hz). It too has a low standard deviation of
97.17 Hz and it also sits close to the 1440 Hz boundary. As a result, similar to the lot [ɑ] vowel,

67
Speaker 8F and Speaker 9F both realize the cloth [ɔ] vowel as a central vowel. The next back
sound is the goose [u] vowel. It is the third most fronted of the back vowels with an F2 value of
1188 Hz. Standard deviation is low (148.15 Hz) and all speakers produce it as a back vowel.
Lastly, the goat [o] vowel is the most backed vowel of all the eleven vowels. It has an F2 average
of 1061 Hz, a low standard deviation of 140.86 Hz, and all speakers realize it as a back vowel.
Overall, back vowels, as well as central and front vowels (with the exception of the trap [æ]
vowel and the fleece [i] vowel), have low standard deviations in the F2 correlate.
NMNE Women: Acoustic Vowel Space Chart
Since men and women are biologically distinctive within the F1 and F2 correlates (Read
& Kent 2002), their acoustic vowel space charts are presented individually. Similar to their male
counterparts, the NMNE women’s acoustic vowel space chart is also correlated with their
distinct boundaries. The F1 and F2 data for NMNE women are presented in the subsequent
figure.

68
Figure 4.2: A representation of the NMNE women’s acoustic vowel space chart.
Women from Northern Minnesota follow a slightly similar pattern of extreme vowels as
their male counterparts. For instance, the fleece [i] vowel is both their highest and most fronted
vowel of their dialect. Likewise, the goat [o] vowel is their most backed sound. However, these
extreme vowels are not entirely identical. In place of realizing the cloth [ɔ] vowel as their lowest
sound, NMNE women actually realize the trap [æ] vowel in this position. Their trap [æ] vowel
(825 Hz) easily drops below their cloth [ɔ] vowel (785 Hz) by a total of 40 Hz. Outside of this

69
inconsistency, NMNE women still do uphold the same dialectal patterns as their male
counterparts which are presented in the previous sections. Those dialectal patterns include
merged sounds, reversed vowel positions, and distinctive vowel qualities.
Northern Minnesota English women, like the ten NMNE men, have merged their cloth
[ɔ] vowel with their lot [ɑ] vowel. This is a result of the cloth [ɔ] vowel being lowered and
fronted so much that it eventually masked the latter vowel. Now, the cloth [ɔ] vowel (785 Hz) is
only 3 Hz away from the lot [ɑ] vowel (788 Hz). Consequently, hearers of these two vowels are
unable to decipher between the two sounds because of the unintelligible distinctions (Koffi,
2017a, p. 109).
The second dialectal pattern that is also apparent in the women’s speech from Northern
Minnesota is the reversed vowel positions of the kit [ɪ] vowel and the face [e] vowel. Ordinarily,
the kit [ɪ] vowel pertains to the high level of vowel height (Ladefoged & Johnson, 2015, p. 46).
However, the ten women from Northern Minnesota have actually lowered this sound so that it is
now realized as a mid vowel sound. The face [e] vowel, on the other hand, deviates in the
opposing direction. It has been raised from a typical mid vowel to a high vowel sound. Thus, just
as the ten men from Northern Minnesota, the ten NMNE women have reversed the positions of
their kit [ɪ] vowel and their face [e] vowel.
This final dialectal pattern is the distinctive qualities of the foot [ʊ] vowel. It is originally
represented as a high, back vowel (Ladefoged & Johnson, 2015, p. 46). However, this is not the
case for the ten women from Northern Minnesota. Instead, they have dropped this vowel down to
the mid level of vowel height as well as fronted this sound so much that it crossed into the

70
central region of tongue retraction. Similar to the NMNE men, the results of these movements is
an entirely new title which is now called a mid, central vowel sound.
NMNE Women F3: Lip Rounding
Lip rounding categories for women are the same, rounded and unrounded. However, the
ranges of frequencies for each are different from their male counterparts. For women, a rounded
vowel must have an F3 value less than 3000 Hz. An unrounded vowel, on the other hand, must
hold an average of at least 3000 Hz or greater. NMNE women’s acoustic data is presented below
in Table 4.9.

71
Table 4.9
NMNE Women F3 Measurements Table
Lexical Set fleece kit face dress trap lot cloth goat foot goose strut
Vowels [i] [ɪ] [e] [ɛ] [æ] [ɑ] [ɔ] [o] [ʊ] [u] [ʌ]
Speaker
1F
F3 3179 2979 2927 2964 2751 2830 2811 2761 2873 2866 2872
Speaker
2F
F3 2996 2920 2885 2817 2599 2728 2903 2725 2782 2652 2804
Speaker
3F
F3 3219 3014 2871 2944 2531 2460 2618 2705 2760 2726 2831
Speaker
4F
F3 3174 2703 2943 2909 2613 2840 2760 2615 2644 2564 2924
Speaker
5F
F3 3214 2997 2849 2863 2771 2881 2845 2952 2900 2978 2872
Speaker
6F
F3 3257 2861 2848 2706 2545 2777 2752 2887 2907 2869 2885
Speaker
7F
F3 3197 2919 2989 2918 2722 2689 2598 2536 2490 2588 2792
Speaker
8F
F3 2929 2806 2784 2429 2655 2500 2923 2806 2791 2715 2848
Speaker
9F
F3 3352 3303 3167 3210 3143 3095 2953 NA 3094 2844 3124
Speaker
10F
F3 3316 2997 3029 2977 2772 2673 2760 2589 2729 2563 2777
Average 3183 2949 2929 2873 2710 2747 2792 2730 2797 2736 2872
Standard
Deviation
130.7 158.28 110.41 202.56 176.66 185.01 120.24 137.86 163.5 146.75 99.26
Rounding vowels in the speech patterns of the ten women from Northern Minnesota is a
common feature. Out of all 11 uttered vowels, ten of them are rounded (90%). Only the front
fleece [i] vowel is unrounded because of an F3 average of 3183 Hz. Even though this is almost
completely contradictive to the pattern of lip rounding found in the ten NMNE men’s speech,
there is still a shared commonality between each biological group and that is that the F3 cue still
lacks robustness. Similar to their male counterparts, the only distinct vowel is the fleece [i]
vowel. When comparing it to the latter vowels, the fleece [i] vowel is distinguished from the trap

72
[æ] vowel (2710 Hz), the lot [ɑ] vowel (2747 Hz), the goat [o] vowel (2730 Hz), and the goose
[u] vowel (2736 Hz). They all remain at a distance that is greater than 400 Hz (473 Hz, 436 Hz,
453 Hz, and 447 Hz respectively). However, with the exclusion of the fleece [i] vowel, the
remaining ten vowels are completely indistinguishable from one another in the F3 correlate since
none exceed a distance of at least 400 Hz.
NMNE Women Dur: Vowel Duration
Vowel duration for women holds the same thresholds for perceptual salience as men.
Therefore, sounds under 200 ms only need at least 10 ms between them for salience while
sounds with 200 ms or more must hold at least 17 milliseconds. Acoustic data for the ten NMNE
women is presented below.

73
Table 4.10
NMNE Women Vowel Duration Measurements Table
Lexical Set fleece kit face dress trap lot cloth goat foot goose strut
Vowels [i] [ɪ] [e] [ɛ] [æ] [ɑ] [ɔ] [o] [ʊ] [u] [ʌ]
Speaker
1F
DUR 191 145 225 147 207 215 206 196 154 194 117
Speaker
2F
DUR 239 170 245 172 235 261 276 264 204 208 148
Speaker
3F
DUR 255 210 313 207 293 294 310 305 196 249 165
Speaker
4F
DUR 219 130 223 134 214 217 225 238 130 182 92
Speaker
5F
DUR 281 193 286 206 338 352 343 297 181 259 151
Speaker
6F
DUR 217 146 214 157 238 230 211 231 152 187 106
Speaker
7F
DUR 205 105 215 117 209 202 246 230 116 188 103
Speaker
8F
DUR 147 138 175 122 193 193 187 200 140 157 118
Speaker
9F
DUR 180 99 203 131 187 157 197 NA 83 160 82
Speaker
10F
DUR 214 192 246 183 258 252 278 252 203 221 171
Average 214 152 234 157 237 237 247 245 155 200 125
Standard
Deviation 38.11 37.63 40.29 33.21 47.64 55.54 52.21 38.08 40.3 34.16 31.29
Northern Minnesota English women do not have entirely similar patterns of vowel
duration as their male counterparts. However, they are not completely different either. NMNE
women realize a group of vowels as their longest sound. Likewise, for their second longest sound
they realize two vowels at perceptually the same duration. However, the title for shortest vowel
is taken by only one vowel phoneme, like NMNE men.
The group which holds the title for the longest sound of this dialect consists of five
different phonemes. The first longest phoneme is the cloth [ɔ] vowel. It is a low vowel that has

74
an average duration of 247 milliseconds. Following next is the goat [o] vowel. It is a mid vowel
that is averaged at 245 milliseconds. The third is both the trap [æ] vowel and the lot [ɑ] vowel.
Each of these low vowels has a durational average of 237 milliseconds. Finally, the last
constituent of this group is the high face [e] vowel. It has an average duration of 234
milliseconds. The greatest range between these vowels is only 13 ms (247 ms – 234 ms).
Therefore, all of these sounds are perceptually the same duration, even though they are realized
in three completely different levels of vowel height.
The second longest sound of this dialect includes both the fleece [i] vowel and the goose
[u] vowel. Each of these sounds is realized in the high level of vowel height. The fleece [i] vowel
has an average duration of 214 milliseconds. The goose [u] vowel, on the other hand, is realized
at an average of 200 milliseconds. Despite the 14 ms difference, both the fleece [i] vowel and the
goose [u] vowel are recognized as the same duration to the human ear.
Finally, the shortest sound of this dialect is the mid strut [ʌ] vowel. It is realized by
NMNE women at an average duration of 125 milliseconds. Its closest neighbor, the kit [ɪ] vowel,
is separated from it by a total of 27 ms (152 ms – 125 ms).
NMNE Women Int & F0: Vowel Intensity & Vowel Pitch
Vowel intensity and vowel pitch for women have the same JND thresholds. Vowel pitch
is distinguished with 5 dB or more between each sound. Likewise, vowel intensity calls for only
1 Hz to distinguish vowels. The NMNE women’s acoustic data for vowel intensity is presented
first in Table 4.11. Subsequently, in Table 4.12 is the women’s acoustic data for vowel pitch.

75
Table 4.11
NMNE Women Vowel Intensity Measurements Table
Lexical Set fleece kit face dress trap lot cloth goat foot goose strut
Vowels [i] [ɪ] [e] [ɛ] [æ] [ɑ] [ɔ] [o] [ʊ] [u] [ʌ]
Speaker
1F
INT 56 58 58 59 58 60 58 60 62 60 59
Speaker
2F
INT 52 55 55 52 50 51 52 54 56 58 52
Speaker
3F
INT 53 55 54 57 59 55 59 54 53 53 50
Speaker
4F
INT 59 62 60 62 64 61 64 64 65 62 60
Speaker
5F
INT 53 54 52 52 51 52 54 57 58 56 55
Speaker
6F
INT 51 52 52 51 51 51 51 52 50 52 49
Speaker
7F
INT 49 50 50 45 43 45 44 50 52 53 48
Speaker
8F
INT 52 55 50 55 52 58 53 53 54 51 51
Speaker
9F
INT 47 45 43 41 41 40 42 NA 42 47 42
Speaker
10F
INT 62 61 62 62 62 62 61 62 61 62 61
Average 53.4 54.7 53.6 53.6 53.1 53.5 53.8 56.2 55.3 55.4 52.7
Standard
Deviation 4.50 5.03 5.54 6.89 7.63 7.16 7.05 4.81 6.68 5.03 6.03

76
Table 4.12
NMNE women vowel intensity measurements Table
Lexical Set fleece kit face dress trap lot cloth goat foot goose strut
Vowels [i] [ɪ] [e] [ɛ] [æ] [ɑ] [ɔ] [o] [ʊ] [u] [ʌ]
Speaker
1F
F0 168 146 153 147 143 156 151 166 175 183 155
Speaker
2F
F0 220 191 204 203 192 194 199 206 217 224 201
Speaker
3F
F0 221 204 202 191 188 188 187 197 208 214 152
Speaker
4F
F0 198 191 193 182 166 171 186 201 204 205 226
Speaker
5F
F0 179 197 189 184 176 187 215 202 206 219 188
Speaker
6F
F0 223 201 181 189 183 184 196 195 193 215 186
Speaker
7F
F0 194 191 144 170 146 161 115 148 193 189 150
Speaker
8F
F0 286 272 257 245 241 286 199 239 252 269 144
Speaker
9F
F0 205 185 173 170 166 176 192 NA 175 183 168
Speaker
10F
F0 211 196 192 194 187 159 179 193 168 187 91
Average 211 197 188 187 178 186 181 194 199 208 166
Standard
Deviation 32.28 30.8 31.06 25.6 27.69 37.49 28.79 24.02 24.65 26.32 37.11
Similar to their male counterparts, NMNE women do not distinguish any vowel
phonemes under the intensity correlate. They realize the goat [o] vowel with the highest intensity
(56.2 dB) and the trap [æ] vowel with the lowest intensity (53.1 dB). Even though they are the
furthest apart of all 11 phonemes, the goat [o] vowel and trap [æ] vowel are still only separated
by 3.1 dB. However, standard deviation for this cue actually does exceed the 5 dB threshold for
most vowels. In other words, when comparing the idiolects, all ten women realize nine of the 11
vowels at different levels of intensity. The only exceptions to this are the fleece [i] vowel and the

77
goat [o] vowel. They have standard deviations of 4.5 dB and 4.81 dB respectively, which fall just
below the threshold.
Dissimilar to NMNE men, vowel pitch for NMNE women is completely different for
each vowel. NMNE women do not have any sounds that are averaged with the same F0 values.
Likewise, the standard deviations also reflect this same conclusion since they all surpass the 1 Hz
threshold. Thus, NMNE women not only realize all 11 vowels differently under the pitch
correlate, but they also realize each individual vowel at different pitch levels.
Comparison: Northern Minnesota English and General American English
General American English is a dialect that is considered as the standard dialect of
American English, hence the name. It does not represent a dialect that is spoken by a minute
group of people from one small area of the country, such as is the case for Northern Minnesota
English. Instead, Peterson and Barney (1952) studied the speech patterns of Americans from all
over the U.S. “Most of the women and children grew up in the Middle Atlantic speech area. The
male speakers represented a much broader regional sampling of the United States” (1952, p.
177). Moreover, Peterson and Barney did not screen any participants for certain demographics or
speaking characteristics, nor did they collect data from only monolingual English speakers. “Two
of the speakers were born outside of the United States and a few others spoke a foreign language
before learning English” (1952, p. 177). Contrary to this, the current study did implement various
screening questions that narrowed the pool to a specific group of speakers. Therefore, the GAE
dialect includes a diverse group of speakers from a variety of states. The NMNE dialect, on the
other hand, includes a more homogeneous group of speakers from a minuscule area in
comparison. The figure below presents a map depicting these areas of study.

78
Figure 4.3: US map of Northern Minnesota and Mid Atlantic region (Wikimedia Commons
2018).
Comparing Men F1 & F2: Vowel Height & Tongue Retraction
The Peterson and Barney (1952) study was the first of its kind. These two researchers
initiated the measuring of the acoustic vowel spaces in General American English (GAE). They
recorded a total of 76 participants, and of that group, 33 of them are men. Peterson and Barney
measured ten vowels imbedded within an hVd structure. Their vowels of interest included the
following [i, ɪ, ɛ, æ, ɑ, ɔ, ʊ, u, ʌ, ɚ13]. Each of the words was uttered in isolation two times. Once
the participants were recorded, Peterson and Barney measured and analyzed the “steady state” of
13 Peterson and Barney did not include the face [e] vowel or the goat [o] vowel because they associated
them with diphthongs. For this reason, I have decided to write NA in each box lacking this data. Furthermore, the
nurse [ɹ] vowel, which was investigated by Peterson and Barney, does not fall within the scope of this current study.
Thus, there will be no further discussion over it.

79
each vowel. Their F1 and F2 data, along with the ten NMNE men’s F1 and F2 data, are
presented below in the subsequent table.
Table 4.13
F1 and F2 Data from GAE Men (Peterson & Barney, 1952) and NMNE Men Table
Lexical Set fleece kit face dress trap lot cloth goat foot goose strut
Vowels [i] [ɪ] [e] [ɛ] [æ] [ɑ] [ɔ] [o] [ʊ] [u] [ʌ]
GAE
Men
F1 270 390 NA 530 660 730 570 NA 440 300 640
GAE
Men
F2 2290 1990 NA 1840 1720 1090 840 NA 1020 870 1190
NMNE
Men
F1 280 424 391 518 611 671 676 457 455 323 555
NMNE
Men
F2 2310 1922 2153 1831 1733 1222 1262 1056 1342 1157 1385
General American English men and Northern Minnesota English men share slightly
similar dialects when comparing the extreme quadrants of their acoustic space. The fleece [i]
vowel, for instance, is the highest and most fronted vowel in each dialect. Likewise, the lot [ɑ]
vowel is the lowest of both dialects. However, in the NMNE men’s dialect, the title for lowest
vowel is actually shared with its merged counterpart, the cloth [ɔ] vowel. Consequently, the
lexical set of GAE men remains at nine distinct vowel sounds while that of the NMNE men is
reduced down to ten vowel sounds (from 11) because of the masking phenomenon between the
lot [ɑ] and the cloth vowel [ɔ]. (More details on this merge are explained in chapter two.)
Moreover, the most backed vowel is another inconsistency between these two dialects. For GAE
men, the most backed vowel is the goose [u] vowel. However, in NMNE men’s dialect, it is the
goat [o] vowel that is the most backed sound. The rest of this section covers only the divergent

80
features and masking tendencies that are perceptually salient between the GAE men and NMNE
men.
There are four vowels which are perceptually salient between the GAE dialect and the
NMNE dialect. Those vowels include the cloth [ɔ] vowel, the strut [ʌ] vowel, the goose [u]
vowel, and the foot [ʊ] vowel. The cloth [ɔ] vowel has already been partially discussed. Because
of its masking tendencies in the NMNE dialect, the NMNE cloth [ɔ] vowel (676 Hz; 1262 Hz) is
lower and more fronted than its GAE equivalent (570 Hz; 840 Hz) by 106 Hz in the F1 cue and
by 422 Hz in the F2 cue. However, the aftermath of this divergence does not just stop at a
masked pair. This move also puts both the NMNE cloth [ɔ] vowel and lot [ɑ] vowel (671 Hz) at
risk of masking the GAE strut [ʌ] vowel (640 Hz). With only 36 Hz and 31 Hz between sounds,
these vowels show “moderate masking” capabilities which could “compromise intelligibility”
(Koffi 2017a, p. 109). That leads us to the next distinctive vowel which is the NMNE strut [ʌ]
vowel. Although it is produced as a low sound by GAE men (640 Hz), NMNE men actually
realize the strut [ʌ] vowel as a mid sound (555 Hz). This is because the NMNE strut [ʌ] vowel
has been raised by 85 Hz and thus is a distinguished sound between dialects. The final two
distinctive vowels are fronted in the NMNE men’s dialect. The foot [ʊ] vowel, for instance, has
been fronted so much that it actually crossed the central-back boundary. This movement is
pointed out in the figure below.

81
Figure 4.4: A representation of the acoustic vowel space chart for GAE men and NMNE men.
In the NMNE dialect, the foot [ʊ] vowel (1342 Hz) is realized as a central sound.
However, in the GAE dialect it is produced as a back sound (1020 Hz). As a result, the acoustic
space separating these two vowels is 322 Hz. Since this distance exceeds the 200 Hz threshold,
the two vowels are perceptually different. Similarly, the NMNE goose [u] vowel (1157 Hz) has
been fronted by 287 Hz from its GAE equivalent (870 Hz). However, GAE men and NMNE men

82
alike realize the goose [u] vowel in the back region of tongue retraction even though each
phoneme remains distinct.
The overlapping vowels include two pairs which are GAE kit [ɪ] vowel and NMNE face
[e] vowel along with the GAE foot [ʊ] vowel and NMNE goat [o] vowel. Although these
phonemes are mostly identified correctly by hearers according the Hillenbrand et al. (1995, p.
3108) confusion data, NMNE men and GAE men still manage to overlap these vowels. Normally
within a single dialect, the kit [ɪ] vowel and the face [e] vowel are only confused 0.3% of the
time and the foot [ʊ] and goat [o] vowel are confused a mere 0.5% of the time. However, when
NMNE men and GAE men interact this is not the case considering that the distances between
each of the merged vowels are far below the stipulated thresholds. For instance, the former pair
of high vowels is separated by only 1 Hz in the F1 cue (390 Hz – 391 Hz) and 163 Hz in the F2
cue (1990 Hz – 2153 Hz). Since the distances between GAE kit [ɪ] vowel and NMNE face [e]
vowel easily fall below the thresholds of 63 Hz (F1) and 200 Hz (F2), these vowel phonemes are
the same. Furthermore, according to Koffi, if two sounds are separated by 20 Hz or less in the F1
cue, they are classified in the degree of “complete masking” and are entirely indistinguishable to
the human ear (2017a, p. 109). Therefore, the GAE kit [ɪ] vowel and NMNE face [e] vowel are
perceptually realized as the same phoneme. Similarly, the GAE foot [ʊ] vowel and the NMNE
goat [o] vowel are completely indistinctive since they are also only separated by 17 Hz in the F1
cue (440 Hz – 457 Hz) and 36 Hz in the F2 cue (1020 Hz – 1056 Hz).
Comparing Women F1 & F2: Vowel Height & Tongue Retraction
Northern Minnesota English women and General American English women are
compared next. Similar to their male counterparts, the numbers of participants for each group is

83
not equal. Peterson and Barney (1952) recruited 28 women14 to represent the GAE dialect. The
current study, on the other hand, only includes ten women from Northern Minnesota. The
following table presents F1 and F2 data from both groups of women.
Table 4.14
F1 and F2 Data from GAE Women (Peterson & Barney, 1952) and NMNE Women Table
Lexical Set fleece kit face dress trap lot cloth goat foot goose strut
Vowels [i] [ɪ] [e] [ɛ] [æ] [ɑ] [ɔ] [o] [ʊ] [u] [ʌ]
GAE
Women
F1 310 430 NA 610 860 850 590 NA 470 370 760
GAE
Women
F2 2790 2480 NA 2330 2050 1220 920 NA 1160 950 1400
NMNE
Women
F1 355 493 447 655 825 788 785 509 521 398 664
NMNE
Women
F2 2585 2213 2483 2001 1825 1372 1375 1061 1508 1188 1596
The extreme vowels realized in the GAE women’s dialect include the fleece [i] vowel
(310 Hz; 2790 Hz), which is the highest and most fronted of the dialect, the trap [æ] vowel (860
Hz), which is the lowest sound of the dialect, and the goose [u] vowel (950 Hz), which is the
most backed sound of the dialect. However, these extreme vowels are not entirely similar to
those in the NMNE women’s dialect. The former two vowels maintain the same placements as
the highest and most fronted, which is the fleece [i] vowel (355 Hz; 2585 Hz,) and the lowest
sound, which is the trap [æ] vowel (825 Hz). However, the most backed vowel for NMNE
women is actually the goat [o] vowel (1061 Hz). It has easily passed the NMNE goose [u] vowel
by 127 Hz. Thus, similar to their male counterparts, NMNE women do not share the same
14 The remaining 15 participants from the Peterson and Barney study were children. However, this current
study does not include any data on children. Therefore, children’s data from the Peterson and Barney study is not
presented nor is it discussed.

84
English dialect with GAE women. The rest of this section discusses the noticeable
inconsistencies and masked phonemes between each dialect.
GAE women and NMNE women actually have more divergent vowel sounds between
dialects than the men of this section. However, women still mask the same number of vowel
phonemes. Out of the nine vowels, seven of them are distinct. Those distinct vowels include the
kit [ɪ] vowel, the cloth [ɔ] vowel, the strut [ʌ] vowel, the fleece [i] vowel, the dress [ɛ] vowel, the
goose [u] vowel, and the foot [ʊ] vowel. Starting with the former, the kit [ɪ] vowel is lowered
and less fronted in the NMNE women’s dialect by 63 Hz in the F1 cue (430 Hz – 493 Hz) and by
267 Hz in the F2 cue (2480 Hz – 2213 Hz). Consequently, GAE women realize the kit [ɪ] vowel
as a high, front sound while NMNE women realize it as a mid, front vowel. However, this
salience is continued since the location of the GAE kit [ɪ] vowel almost completely overlaps the
NMNE face [e] vowel. This masking phenomenon is evident in Figure 4.5 below.

85
Figure 4.5: A representation of the acoustic vowel space chart for GAE women and NMNE
women.
The GAE kit [ɪ] vowel lies almost directly on top of the NMNE face [e] vowel since there
is only 17 Hz of a difference in the F1 cue (430 Hz – 447 Hz) and only 3 Hz of a difference in
the F2 cue (2480 Hz – 2483 Hz). Because no human ear can decipher between these two sounds,
the GAE kit [ɪ] vowel and the NMNE face [e] vowel are perceptually the same sound.

86
The second distinct vowel is the cloth [ɔ] vowel. In GAE the cloth [ɔ] vowel is produced
as a mid, back vowel (590 Hz; 920 Hz). However, in the NMNE dialect, women produce it as a
low, back vowel (785 Hz; 1375 Hz) along with its merged counterpart, the lot [ɑ] vowel (788
Hz; 1372 Hz). Consequently, the NMNE cloth [ɔ] vowel is lowered by 195 Hz and is fronted by
455 Hz compared to its GAE equivalent. Easily exceeding both the F1 and F2 thresholds, the
cloth [ɔ] vowels are two completely different sounds. Furthermore, this divergence puts the
vowels at risk for masking other phonemes, such as is the case for both the NMNE cloth [ɔ] and
lot [ɑ] vowels. According to Hillenbrand et al. data (1995, p. 3108) these sounds are rarely
confused since the lot [ɑ] vowel is interpreted as the strut [ʌ] vowel 3.7% of the time and cloth
[ɔ] vowel is interpreted as the strut [ʌ] vowel only 1.8% of the time. For NMNE women and
GAE women, however, this is untrue. The NMNE cloth [ɔ] and lot [ɑ] vowels are perceptually
similar to the GAE strut [ʌ] vowel. In NMNE, the cloth [ɔ] vowel is separated from the GAE
strut [ʌ] vowel by 25 Hz in both the F1 and F2 cue. Likewise, the lot [ɑ] vowel is only separated
from the GAE strut [ʌ] vowel by 28 Hz in each cue. As a result, the NMNE vowel pair
“moderate[ly] mask[s]” the GAE strut [ʌ] vowel (Koffi, 2017a, p. 109).
This leads us to the third perceptually salient vowel which is the strut [ʌ] vowel. Since
the GAE strut [ʌ] vowel is masked by the NMNE vowel pair, its NMNE counterpart is obviously
divergent. The strut [ʌ] vowel in NMNE is produced as a mid, central sound (664 Hz; 1596 Hz)
rather than as a low, back sound as in GAE (760 Hz; 1400 Hz). Although it does in fact change
both vowel height levels and tongue retraction regions, the only distinctive movement of the
NMNE strut [ʌ] vowel is that it is raised by 96 Hz (760 Hz – 664 Hz).
87
The last four perceptually distinct vowels actually share a common centralizing behavior
in the NMNE dialect. These sounds include the fleece [i] vowel, the dress [ɛ] vowel, the goose
[u] vowel, and the foot [ʊ] vowel. Although it is a front vowel in each dialect, the NMNE
women’s fleece [i] vowel is backed by 205 Hz (2790 Hz – 2585 Hz) toward the central region.
Similarly, the front dress [ɛ] vowel is also backed toward the central region by 329 Hz (2330 Hz
– 2001 Hz) in the NMNE women’s dialect. Moving in the opposing direction is the NMNE
goose [u] vowel and foot [ʊ] vowel. The goose [u] is fronted toward the central region by 238 Hz
(950 Hz – 1188 Hz) in comparison to its GAE counterpart, even though each goose [u] vowel is
still realized as a back sound. The foot [ʊ] vowel, on the other hand, is fronted so much that it
actually crossed into the central region. The NMNE foot [ʊ] vowel is fronted by 348 Hz (1160
Hz – 1508 Hz). This leaves its GAE equivalent as a back vowel and also at risk for masking
another NMNE phoneme, the goat [o] vowel. NMNE men realize the goat [o] vowel (509 Hz;
1061 H) at a close proximity to the GAE foot [ʊ] vowel (470 Hz; 1160 Hz). Separated by only
39 Hz in the F1 cue and 99 Hz in the F2 cue, these two vowels fall into the degree of “moderate
masking” (Koffi, 2017a, p. 109) and are consequently similar phonemes.
Comparison: Northern Minnesota English and Midwest English
The Midwest dialect, unlike General American English, encompasses only six of the fifty
U.S. states. “The majority of the speakers (87%) were raised in Michigan’s lower peninsula,
primarily the southeastern and southwestern parts of the state. The remainder were primarily
from other areas of the upper Midwest, such as Illinois, Wisconsin, Minnesota, southern Ohio,
and northern Indiana” (Hillenbrand, Getty, Clark, & Wheeler, 1995, pp. 3099-3100). However,
this Midwest area is larger than the area of Northern Minnesota, which remains as only a fraction
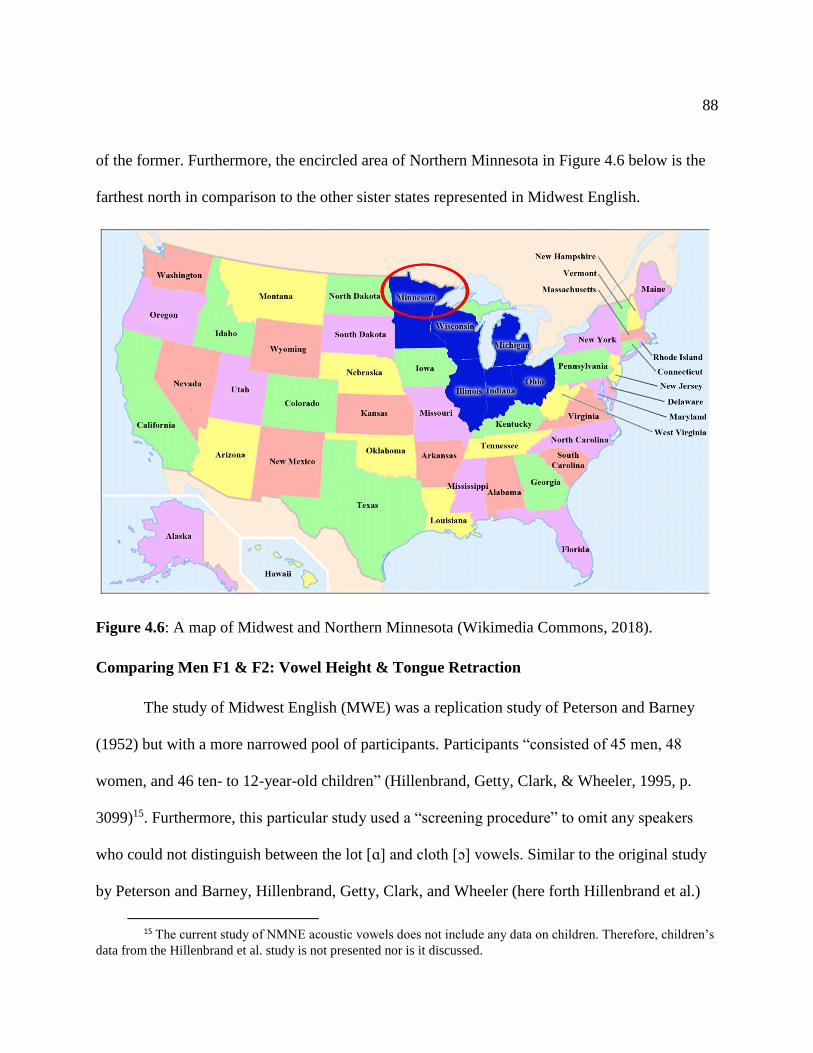
88
of the former. Furthermore, the encircled area of Northern Minnesota in Figure 4.6 below is the
farthest north in comparison to the other sister states represented in Midwest English.
Figure 4.6: A map of Midwest and Northern Minnesota (Wikimedia Commons, 2018).
Comparing Men F1 & F2: Vowel Height & Tongue Retraction
The study of Midwest English (MWE) was a replication study of Peterson and Barney
(1952) but with a more narrowed pool of participants. Participants “consisted of 45 men, 48
women, and 46 ten- to 12-year-old children” (Hillenbrand, Getty, Clark, & Wheeler, 1995, p.
3099)15. Furthermore, this particular study used a “screening procedure” to omit any speakers
who could not distinguish between the lot [ɑ] and cloth [ɔ] vowels. Similar to the original study
by Peterson and Barney, Hillenbrand, Getty, Clark, and Wheeler (here forth Hillenbrand et al.)
15 The current study of NMNE acoustic vowels does not include any data on children. Therefore, children’s
data from the Hillenbrand et al. study is not presented nor is it discussed.

89
studied vowels uttered within an isolated, monosyllabic word that used the same hVd structure.
They studied twelve vowels which were [i, ɪ, e, ɛ, æ, ɑ, ɔ, o, ʊ, u, ʌ, ɚ16]. After the participants
were recorded, the “steady state” of every vowel was measured and analyzed. Acoustic F1 and
F2 data for the 45 MWE men are presented in the subsequent table along with data from the ten
NMNE men.
Table 4.15
F1 and F2 Data from MWE Men (Hillenbrand et al., 1995) and NMNE Men Table
Lexical Set fleece kit face dress trap lot cloth goat foot goose strut
Vowels [i] [ɪ] [e] [ɛ] [æ] [ɑ] [ɔ] [o] [ʊ] [u] [ʌ]
MWE
Men
F1 342 427 476 580 588 768 652 497 469 378 623
MWE
Men
F2 2322 2034 2089 1799 1952 1333 997 910 1122 997 1200
NMNE
Men
F1 280 424 391 518 611 671 676 457 455 323 555
NMNE
Men
F2 2310 1922 2153 1831 1733 1222 1262 1056 1342 1157 1385
MWE men share almost all of the same extreme vowels as the NMNE men. However,
they still are not entirely the same dialect. Both groups of men realize the fleece [i] vowel as
their highest and most fronted vowel. Likewise, the goat [o] vowel is the most backed sound and
the lot [ɑ] vowel is the lowest sound. However, MWE men do not merge their lot [ɑ] and cloth
[ɔ] vowel as do NMNE men. Therefore, the MWE men only have one phoneme that is realized
as the lowest vowel while NMNE men actually have two. The rest of the section covers only
divergences and masking phenomena.
16 The nurse vowel is not investigated within the current study and therefore the data for it from the
Hillenbrand et al. study is not presented.

90
The first perceptually salient vowel is the face [e] vowel. It is produced as a mid sound by
MWE men (476 Hz). NMNE men, on the other hand, realize this same phoneme as a high sound
(391 Hz). As a result, the NMNE face [e] vowel is raised by 85 Hz and is at risk of masking the
MWE kit [ɪ] vowel. Separated by only 36 Hz in the F1 cue (391 Hz – 427 Hz) and 119 Hz in the
F2 cue (2153 Hz – 2034 Hz), these two sounds are classified in the degree of “moderate
masking” (Koffi, 2017a, p. 109) and are difficult to decipher although not impossible.
The second distinctive vowel between these two dialects is the trap [æ] vowel. The
NMNE trap [æ] vowel is backed by 219 Hz compared to its MWE equivalent. Moreover,
because of this movement, the NMNE trap [æ] vowel is now in the perfect location to mask
another MWE vowel. This masking phenomenon is evident in the figure below.

91
Figure 4.7: A representation of the acoustic vowel space chart for MWE men and NMNE men.
The acoustic space between the NMNE trap [æ] vowel and the MWE dress [ɛ] vowel is
only 31 Hz in the F1 cue (611 Hz – 580 Hz) and 66 Hz in the F2 cue (1733 Hz – 1799 Hz).
Falling into a moderate degree of masking, hearers would have trouble differentiating between
the NMNE trap [æ] vowel and the MWE dress [ɛ] vowel even though in a single dialect these

92
vowels are only interpreted as the same sound 3.7% of the time (Hillenbrand et at., 1995, p.
3108).
The third salience includes both the lot [ɑ] vowel and the cloth [ɔ] vowel. Because these
two sounds are merged in the NMNE men’s dialect but are distinguished in the MWE men’s
dialect, they obviously are going to cause divergences when comparing the two dialects. Starting
with the former, the NMNE lot [ɑ] vowel (671 Hz) is raised by 97 Hz from its MWE counterpart
(768 Hz). However, although the two sounds are drastically different in the F1 correlate, they
both still remain in the same vowel quadrants: low, central sounds. The cloth [ɔ] vowel, on the
other hand, diverges only in the F2 cue, and because of this it also changes vowel quadrants. The
MWE cloth [ɔ] vowel is realized as a back sound (997 Hz). However, NMNE men produce this
vowel as a central sound (1262 Hz). As a result, there is a total of 265 Hz separating each cloth
[ɔ] vowel.
The fourth divergent vowel is the foot [ʊ] vowel. In NMNE, the foot [ʊ] vowel is realized
as a central sound (1342 Hz). Yet, in MWE, men produce this sound as a back vowel (1122 Hz).
Consequently, the two sounds are separated in the F2 cue by 220 Hz. Furthermore, the MWE
foot [ʊ] vowel also masks another sound, the NMNE goat [o] vowel, because of this divergence.
Sitting at a distance of only 12 Hz in the F1 cue (469 Hz – 457 Hz) and 66 Hz in the F2 cue
(1122 Hz – 1056 Hz), the MWE foot [ʊ] vowel has completely masked the NMNE goat [o],
making it impossible to decipher between the two sounds.
The last divergence is in the strut [ʌ] vowel. This vowel is realized as a low, back vowel
(623 Hz; 1200 Hz) by MWE men. However, NMNE men actually produce this sound as a mid,
central vowel (555 Hz; 1385 Hz). Even though this vowel changes both vowel height levels and
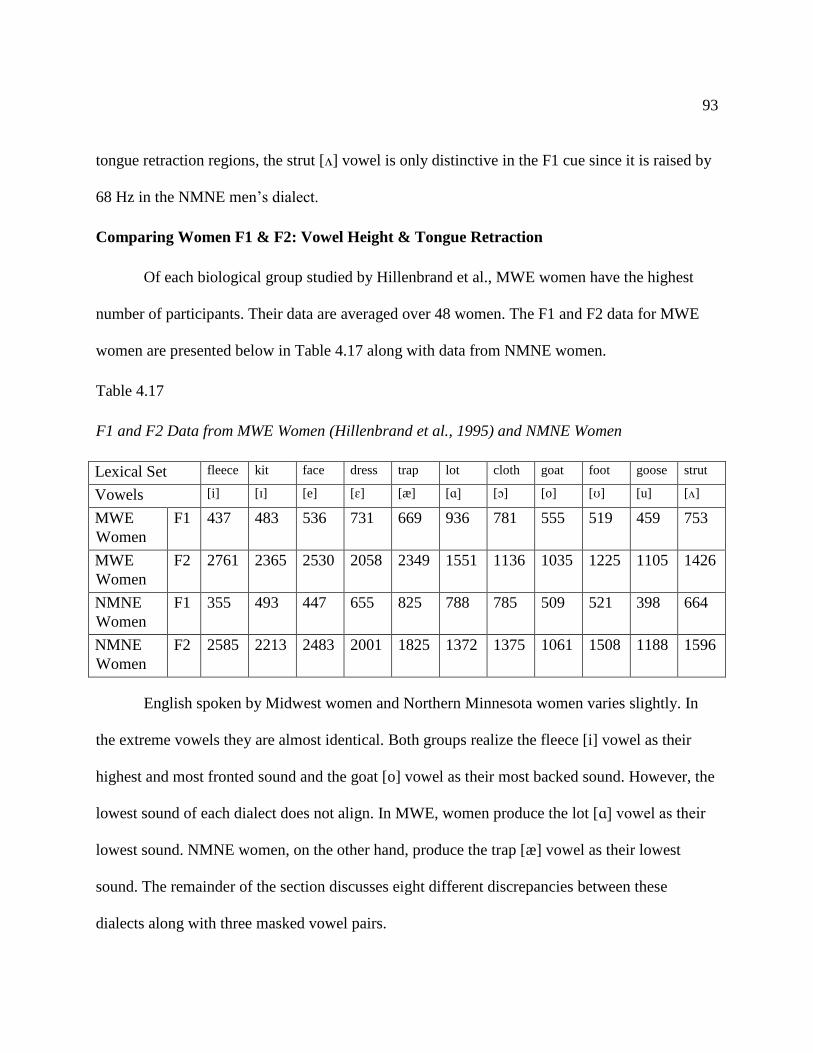
93
tongue retraction regions, the strut [ʌ] vowel is only distinctive in the F1 cue since it is raised by
68 Hz in the NMNE men’s dialect.
Comparing Women F1 & F2: Vowel Height & Tongue Retraction
Of each biological group studied by Hillenbrand et al., MWE women have the highest
number of participants. Their data are averaged over 48 women. The F1 and F2 data for MWE
women are presented below in Table 4.17 along with data from NMNE women.
Table 4.17
F1 and F2 Data from MWE Women (Hillenbrand et al., 1995) and NMNE Women
Lexical Set fleece kit face dress trap lot cloth goat foot goose strut
Vowels [i] [ɪ] [e] [ɛ] [æ] [ɑ] [ɔ] [o] [ʊ] [u] [ʌ]
MWE
Women
F1 437 483 536 731 669 936 781 555 519 459 753
MWE
Women
F2 2761 2365 2530 2058 2349 1551 1136 1035 1225 1105 1426
NMNE
Women
F1 355 493 447 655 825 788 785 509 521 398 664
NMNE
Women
F2 2585 2213 2483 2001 1825 1372 1375 1061 1508 1188 1596
English spoken by Midwest women and Northern Minnesota women varies slightly. In
the extreme vowels they are almost identical. Both groups realize the fleece [i] vowel as their
highest and most fronted sound and the goat [o] vowel as their most backed sound. However, the
lowest sound of each dialect does not align. In MWE, women produce the lot [ɑ] vowel as their
lowest sound. NMNE women, on the other hand, produce the trap [æ] vowel as their lowest
sound. The remainder of the section discusses eight different discrepancies between these
dialects along with three masked vowel pairs.

94
To begin, it should be noted that five of the eight divergent vowels follow a similar
pattern which is to rise from the F1 location in MWE to that in NMNE. Those five vowels are
the lot [ɑ] vowel, the face [e] vowel, the strut [ʌ] vowel, the fleece [i] vowel, and the dress [ɛ]
vowel. Commencing with the most dramatic, the lot [ɑ] vowel raises a comparable amount of
148 Hz from MWE (936 Hz) to NMNE (788 Hz), although both vowels still remain in the same
low level of vowel height. The face [e] vowel and the strut [ʌ] vowel are next with an equal shift
of 89 Hz from MWE to NMNE. The face [e] vowel is raised from 536 Hz (MWE) to 447 Hz
(NMNE). Likewise, the strut [ʌ] vowel is raised from 753 Hz in MWE to its average of 664 Hz
in NMNE. Furthermore, because of these upward movements, both vowels cross over a vocalic
boundary. The former crosses the mid-high boundary (480 Hz) while the latter crosses the mid-
low boundary (720 Hz). Following the same pattern but to lesser extent is the fleece [i] vowel. It
is raised by 82 Hz. In the MWE dialect, women realize this vowel at 437 Hz whereas in NMNE,
women produce it at 355 Hz. Even though both F1 values are classified as high vowels, the
distance is recognized as distinct since it surpasses the 63 Hz limit. Finally, the dress [ɛ] vowel is
raised 76 Hz (731 Hz – 655 Hz). Consequently, the dress [ɛ] vowel has shifted out of the low
level of vowel height and into the mid level in the NMNE women’s dialect.
The other three distinctive vowels which do not assimilate to this pattern are the trap [æ]
vowel, the foot [ʊ] vowel, and the cloth [ɔ] vowel. The former is the only vowel which actually
deviates in both the F1 and F2 correlate. In MWE, women produce the trap [æ] vowel as a mid,
front vowel (669 Hz; 2349 Hz). However, NMNE women produce it as a low, central vowel
(825 Hz; 1825 Hz). As a result, each realization of the trap [æ] vowel is separated by 156 Hz in
the F1 cue and 524 Hz in the F2 cue. The foot [ʊ] vowel and the cloth [ɔ] vowel, on the other

95
hand, are only divergent in the F2 cue. In MWE, both the foot [ʊ] vowel (1225 Hz) and the cloth
[ɔ] vowel (1136 Hz) are produced as back sounds. However, in NMNE, these vowels are both
fronted either into or toward the central region of tongue retraction. The NMNE foot [ʊ] vowel
(1508 Hz), for instance, has completely crossed into the central region because it is fronted by
283 Hz. The NMNE cloth [ɔ] vowel, on the other hand, is still realized as a back sound (1375
Hz). However, NMNE women are still more fronted than their MWE counterparts by 239 Hz.
The last area of discussion is the masked pairs between MWE women and NMNE
women. There are three masked pairs which are prevalent and those are the NMNE face [e]
vowel and the MWE kit [ɪ] vowel, the NMNE lot/cloth [ɑ/ɔ] vowel and the MWE strut [ʌ]
vowel, and lastly the NMNE goat [o] vowel and the MWE goose [u] vowel. Each pair is circled
below in Figure 4.8.

96
Figure 4.8: A representation of the acoustic vowel space chart for MWE women and NMNE
women.
The first pair is the NMNE face [e] vowel and the MWE kit [ɪ] vowel. Although they are
phonemically distinct vowels, the sounds are only separated by 36 Hz in the F1 (447 Hz – 483
Hz) and 118 Hz in the F2 correlate (2483 Hz – 2365 Hz). Therefore, this masked pair is
categorized as “moderate masking” and as such, the vowel constituents are difficult to

97
distinguish. Likewise, the NMNE lot/cloth [ɑ/ɔ] vowel and the MWE strut [ʌ] vowel are
moderately masked. The distance between each phoneme is 35 Hz in the F1 cue (788 Hz – 753
Hz) and 54 Hz in the F2 cue (1372 Hz – 1426 Hz)17. Thus, they are also difficult to distinguish
although not impossible. The last masked pair is the NMNE goat [o] vowel and the MWE goose
[u] vowel. They are only “slightly masked” according to Koffi (2017a, p. 109) because they are
separated by 50 Hz (509 Hz – 459 Hz) in the F1 cue and 44 Hz in the F2 (1061 Hz – 1105 Hz).
Therefore, these sounds are mostly similar, although still slightly distinguishable.
Comparison: Northern Minnesota English and Central Minnesota English
Central Minnesota English is an area that, like Northern Minnesota which includes both
District 1 and 2, also consists of two districts according to the Minnesota Department of
Transportation (2018). There is District 3, which is Central Minnesota, and there is also District
4, which is West Central Minnesota. These two districts were combined by Koffi (2014) to
represent the whole region of Central Minnesota. “The Central Minnesota area…is divided into
East Central and West Central. However, this distinction is not relevant for this study because
the participants were selected from the Greater Central Minnesota area” (Koffi, 2014, p. 2).
17 Each distance was calculated from the NMNE lot [ɑ] vowel and the MWE kit [ɪ] vowel because they
hold the greatest distance in comparison to the NMNE cloth [ɔ] vowel and the MWE kit [ɪ] vowel.

98
Figure 4.9: A map of the Minnesota districts according to the Minnesota Department of
Transportation (2018).
As can be seen then in Figure 4.9, the Central region is located just below the Northern
region of Minnesota. These two regions even share two different counties which are Cass county
and Mahnomen county. Other than county and district lines though, not much is separating these

99
two regions other than random batches of forests and lakes (Minnesota Department of Natural
Resources, 2018: Recreation Compass18). Furthermore, just like the Northern region is
considered to be rural, the Central region of Minnesota has similar demographics since it “is not
heavily urbanized” (Koffi, 2014, p. 2). Likewise, each region also has one city that poses as an
exception to this. For Northern Minnesota that city is Duluth which has a population of 86,265
(US Census Bureau 2010) and for Central Minnesota that city is St. Cloud with a population of
65,842 (US Census Bureau 2010).
Comparing Men F1 & F2: Vowel Height & Tongue Retraction
Koffi (2013; 2014; 2016c; 2017b) produced various studies which reported the acoustic
phonetic vowel spaces of 11 phonemic vowels realized by 34 participants from Central
Minnesota. Each participant was a current or former college student of his “who identified
themselves as having lived in Central Minnesota for the first 17 years of their lives” (2016c, p.
2). Furthermore, the entire pool of speakers “are Caucasians in their late teens to their early 30s”
(2013, p. 5). Each of the 11 phonemic vowels is imbedded in the same hVd structure as the
original Peterson and Barney (1952) study. Additionally, Koffi replicated a similar methodology
as Peterson and Barney. Every participant uttered 11 monosyllabic words three times in isolation
and was recording when doing so. Then, each recording was transferred into Praat where Koffi
extracted, measured, and analyzed each vowel. In his first study (2013), Koffi reported acoustical
data in the first two formants. The subsequent table presents acoustic data from the 12 Central
Minnesota English (CMNE) men from Koffi (2013)’s study along with acoustic data from the
ten NMNE men.
18 http://www.dnr.state.mn.us/maps/compass/index.html

100
Table 4.18
F1 and F2 Data from CMNE Men (Koffi, 2013) and NMNE Men Table
Lexical Set fleece kit face dress trap lot cloth goat foot goose strut
Vowels [i] [ɪ] [e] [ɛ] [æ] [ɑ] [ɔ] [o] [ʊ] [u] [ʌ]
CMNE
Men
F1 289 542 434 577 709 753 699 600 516 485 616
CMNE
Men
F2 2298 1963 2185 1781 1737 1289 1296 1464 1467 1541 1365
NMNE
Men
F1 280 424 391 518 611 671 676 457 455 323 555
NMNE
Men
F2 2310 1922 2153 1831 1733 1222 1262 1056 1342 1157 1385
CMNE men and NMNE men differ by only a handful of vowels while the majority of
their vowels are uttered similarly. However, their extreme vowels are not as similar. For
instance, the lowest vowel of the CMNE men’s dialect is solely the lot [ɑ] vowel. Although this
sound is masked with the CMNE cloth [ɔ] vowel because of a 54 Hz distance between each
sound, the degree of this merge is only “slight masking” (Koffi, 2017a, p. 109). NMNE men, on
the other hand, are completely masked since they realize a distance of only 5 Hz between their
lot [ɑ] and cloth [ɔ] vowels. The most backed vowel is also different between these two dialects.
In CMNE, men realize the lot [ɑ] vowel as their most backed sound while NMNE men produce
the goat [o] vowel as the most backed sound. The only extreme vowel which is the same is the
fleece [i] vowel. It is produced as the highest and most fronted sound for both groups of
speakers. The latter portion of this section focuses on three areas: a common dialectal pattern,
five perceptually salient vowels, and two masking phenomena.

101
The common dialectal pattern is a behavior found in 100% of the NMNE men’s vowels.
Each NMNE vowel is raised in comparison to its CMNE counterpart. Whether it is obvious to
the hearer (like the five divergences to be discussed below) or it is only evident in the acoustic
data provided in Table 4.18 (such as is the case for the latter six vowels that are not perceptually
salient), every NMNE vowel phoneme is raised to some extent over its equivalent in Central
Minnesota English. This raising behavior is clear in Figure 4.10 below.

102
Figure 4.10: A representation of the acoustic vowel space chart for CMNE men and NMNE
men.
Of the five divergences, three of them are only divergent in the F1 correlate. The kit [ɪ]
vowels, for instance, are separated 118 Hz in the F1 cue. Although both groups realize the kit [ɪ]
vowel as a mid sound, NMNE men produce a much higher kit [ɪ] vowel (424 Hz) than do CMNE
men (542 Hz). Similarly, the low trap [æ] vowel is also divergent in the F1 by 98 Hz. NMNE
103
men produce the trap [æ] vowel at an average of 611 Hz while the CMNE men realize the same
phoneme at 709 Hz. The last divergent vowel in this group is the lot [ɑ] vowel. In NMNE, the lot
[ɑ] vowel is produced as a higher sound (671 Hz) than its equivalent in CMNE (753 Hz), even
though both sounds are realized as a low vowel. Consequently, the two lot [ɑ] vowels are
separated by a total of 82 Hz and thus are realized distinctively.
The last two divergent vowels differ in both the F1 and F2 correlates and those sounds
include the goat [o] vowel and the goose [u] vowel. As can be seen in Figure 4.10 above, these
two vowels are drastically different when comparing NMNE men and CMNE men. In CMNE,
the goat [o] vowel is a mid, central vowel (600 Hz; 1464 Hz). However, in NMNE, the goat [o]
is a mid, back vowel (457 Hz; 1056 Hz). Even though the vowel height level remains the same,
these two sounds still differ by 143 Hz in the F1 cue and by 408 Hz in the F2 cue. Likewise, the
goose [u] vowel is also perceptually salient. Realized by CMNE men as a mid, central sound, the
goose [u] vowel has an F1 average of 485 Hz and an F2 average of 1541 Hz. NMNE men, on the
other hand, produce this vowel as a high, back sound with an F1 average of 323 Hz and an F2
average of 1157 Hz. As a result, the two sounds are separated by 162 Hz in the F1 correlate and
384 Hz in the F2 correlate.
The final area of discussion is the two masking phenomena. When comparing the 12 men
from Central Minnesota and the ten men from Northern Minnesota, there are two pairs of vowels
which run the risk of masking each other. The first pair is the CMNE dress [ɛ] vowel and the
NMNE trap [æ] vowel. They are only separated by only 34 Hz in the F1 cue (577 Hz – 611 Hz)
and 48 Hz (1781 Hz – 1733 Hz) in the F2 cue. Because of this small distance in each correlate,
the CMNE dress [ɛ] vowel and the NMNE trap [æ] vowel are “moderately masked” and

104
therefore could potentially cause some difficulty for any hearers. Likewise, the CMNE foot [ʊ]
vowel and the NMNE strut [ʌ] vowel are also merged. Although they are only interpreted as
each other only 3.2% of the time according to confusion data (Hillenbrand et al., 1995, p. 3108),
the CMNE foot [ʊ] vowel has only an F1 distance of 39 Hz (516 Hz – 555 Hz) and an F2
distance of 82 Hz (1467 Hz – 1385 Hz) from the NMNE strut [ʌ] vowel. As a result, the two
sounds fall into the degree of “moderate masking” and thus, like the former vowel pair, are hard
to distinguish although not impossible.
Comparing Women F1 & F2: Vowel Height & Tongue Retraction
In Koffi’s studies (2013; 2014; 2016c; 2017b), the majority of his participants are
actually women. Of all 34 speakers, only 12 of them are men while the latter 22 are women.
They still fall into the same age bracket of “late teens to their early 30s” (Koffi, 2013, p. 5).
Likewise, the 22 women also fall into the same demographic as their male counterparts, which is
that they are all Caucasians (Koffi, 2013, p. 5). The F1 and F2 data for 22 CMNE women are
presented below in Table 4.19 along with F1 and F2 data for the ten NMNE women.

105
Table 4.19
F1 and F2 Data from CMNE Women (Koffi, 2013) and NMNE Women Table
Lexical Set fleece kit face dress trap lot cloth goat foot goose strut
Vowels [i] [ɪ] [e] [ɛ] [æ] [ɑ] [ɔ] [o] [ʊ] [u] [ʌ]
CMNE
Women
F1 385 573 508 754 848 855 851 569 626 417 743
CMNE
Women
F2 2609 2232 2487 2028 1951 1462 1420 1117 1519 1230 1643
NMNE
Women
F1 355 493 447 655 825 788 785 509 521 398 664
NMNE
Women
F2 2585 2213 2483 2001 1825 1372 1375 1061 1508 1188 1596
The extreme vowels within each dialect of Northern Minnesota English and Central
Minnesota English are similar between women. Each group realizes the fleece [i] vowel as the
highest and most fronted sound along with the goat [o] vowel as the most backed sound.
However, the lowest vowel is not consistent. CMNE women produce the lot [ɑ] vowel as their
lowest sound, similar to their male counterparts. NMNE women, on the other hand, realize the
trap [æ] vowel as their lowest vowel constituent. The rest of this section discusses the following:
a common pattern found within the NMNE dialect, six perceptually salient vowels, and one
masking phenomenon.
Similar to their male counterparts, there is a dialectal pattern that surfaces when
comparing NMNE women to CMNE women. That pattern is that all NMNE vowels are raised in
comparison to their corresponding vowel constituents in Central Minnesota English. Even
though just under half of the vowel pairs (45%) are not perceptually distinctive in the F1 cue, all
eleven vowel pairs (100%) are separated to some degree, and it is always the NMNE vowel

106
constituent that is higher. Figure 4.11 below clearly demonstrates this pattern. Furthermore, it
should also be noted that there are no F2 divergences obvious to the naked ear when comparing
these two groups of women. They only diverge from one another in the F1 correlate alone.
Figure 4.11: A representation of the acoustic vowel space chart for CMNE women and NMNE
women.
107
When comparing NMNE vowels and CMNE vowels, women realize a total of six vowels
distinctively. The first and most drastic is the foot [ʊ] vowel. In NMNE, the foot [ʊ] vowel (521
Hz) is raised by 105 Hz over its CNMNE equivalent (626 Hz). As a result, these two mid sounds
are completely different even though they both remain in the same vowel height level. Following
closely behind is the dress [ɛ] vowel. It is realized as a low sound by CMNE women (754 Hz).
However, NMNE women produce it at a mid sound (655 Hz). Consequently, this vowel pair is
separated by a total distance of 99 Hz and is realized in two distinct levels of vowel height. The
kit [ɪ] vowel comes in third with a distance of 80 Hz separating the two vowel realizations. While
both groups of women do in fact produce this vowel as a mid sound, NMNE women realize the
kit [ɪ] vowel at an average of 493 Hz while CMNE women produce it at 573 Hz. Thus, the two
kit [ɪ] vowels remain distinct. The strut [ʌ] vowel pair is next. In NMNE, women realize the strut
[ʌ] vowel at an average of 664 Hz (in the mid level) whereas CMNE women realize it at an
average of 743 Hz (in the low level). As a result, there is a total of 79 Hz between each sound as
well as a vocalic boundary. The last two vowel pairs are the lot [ɑ] and cloth [ɔ] vowels. They
are both in fact merged in each dialect and likewise, they are also similarly distinctive when
comparing dialects. The lot [ɑ] vowels diverge by 67 Hz (778 Hz – 855 Hz) while the cloth [ɔ]
vowels diverge by 66 Hz (785 Hz – 851 Hz).
The final area of discussion is the masking phenomenon taking place between two
different phonemes. The CMNE foot [ʊ] vowel is masked by the NMNE strut [ʌ] vowel since
they are separated by only 38 Hz (626 Hz – 664 Hz) in the F1 cue and 77 Hz in the F2 cue (1519
Hz – 1596 Hz). Falling into the “moderate masking” degree (Koffi, 2017a, p. 109), these two
sounds are not easy to distinguish.

108
Comparison: Northern Minnesota English and Winnipeg Canadian English
The two dialects of interest in this section are the Northern Minnesota English (NMNE)
and Winnipeg Canadian English (WCE). The former is represented by 21 counties in the
Northern region of Minnesota while the latter is represented by Winnipeg, the capital city of
Manitoba, Canada. The only physical boundary between the two dialects is an international
border. As can be seen in the figure below, the city of Winnipeg sits above the northwest corner
of Northern Minnesota and remains at a distance of only 70 miles from said border between the
U.S. and Canada. Consequently, even though these two dialects do reside in two different
countries, they still remain quite close in proximity to one another.

109
Figure 4.12: A map of Winnipeg of Manitoba, CA and Northern Minnesota, US (Google Image,
2017).
According to Canada Statistics (2016), the population of Winnipeg is 705,244. This
population far exceeds the total population of the whole Northern region of Minnesota which is
only 550,443 people (U.S. Census Bureau, 2010). For this reason, it is safe to say that Winnipeg
is urbanized while Northern Minnesota is rural with the exception of the city of Duluth.

110
Comparing Men F1 & F2: Vowel Height & Tongue Retraction
Data on Winnipeg Canadian English (WCE) is presented by Hagiwara (2006) in his study
on the acoustic phonetic vowel spaces of 12 phonemic vowels [i, ɪ, e, ɛ, æ, ɑ, ɔ, o, ʊ, u, ʌ, ɹ] and
three diphthongs [aɪ, aʊ, oɪ]19. He uses the same methodology of Peterson and Barney (1952)
with only four slight adaptations. The first adaptation is in the phonological environment in
which each phonemic vowel appears. Although most of the uttered vowels are presented in the
original hVd structure (with the exception of [e, ɑ, o]), Hagiwara adjusted this structure so as to
create “real monosyllabic words” rather than the nonsensical words such as <hade, hod, hode>.
His second adaptation was to implement a second phonological environment. In addition to the
hVd structure, Hagiwara’s participants uttered vowels in an hVt structure as well. These
phonological environments in Hagiwara’s study are presented below in Table 4.20.
19 Although Hagiwara included the subsequent phonemes within his study [ɹ, aɪ, aʊ, oɪ], these sounds fall
outside the scope of this study and therefore they are not included in Table 4.20 below, nor are they discussed any
further.

111
Table 4.20
Phonological Environment of WCE Vowel Phonemes (Hagiwara, 2006, p. 2) Table
Vowel category /hVd/ /hVt/
/i/ heed heat
/ɪ/ hid hit
/e/ aid ate
/ɛ/ head pet
/æ/ had hat
/ɑ/ odd hot
/ɔ/ hawed ought
/o/ ode oat
/ʊ/ hood put
/u/ who'd hoot
/ʌ/ hudd hut
The third adaptation to Peterson and Barney’s original 1952 methodology is that the
words were not uttered in isolation, but rather in the phrasal frame “‘say ___ once’” (Hagiwara,
2006, p. 3). This leads to the fourth and final adaptation which was the number of utterances for
each phrase. Instead of saying each phrase two times or three times like the last few studies in
the previous sections, speakers in Hagiwara’s study realized the phrases five times each.
Speakers involved in Hagiwara’s study are “ten monolingual English speakers (five
women and five men), 18-25 years of age. They are natives of Winnipeg, and children of natives
of Winnipeg” (Hagiwara, 2006, p. 2). After said speakers were recorded, data were measured
and analyzed. “Vowel durations were determined by taking the difference between the vowel
start point (the time at which periodic energy in F2 begins) and the vowel end point (the time of
the onset of closure, if visible, or the last regular period of voicing in F2, if not)” (2006, p. 3).
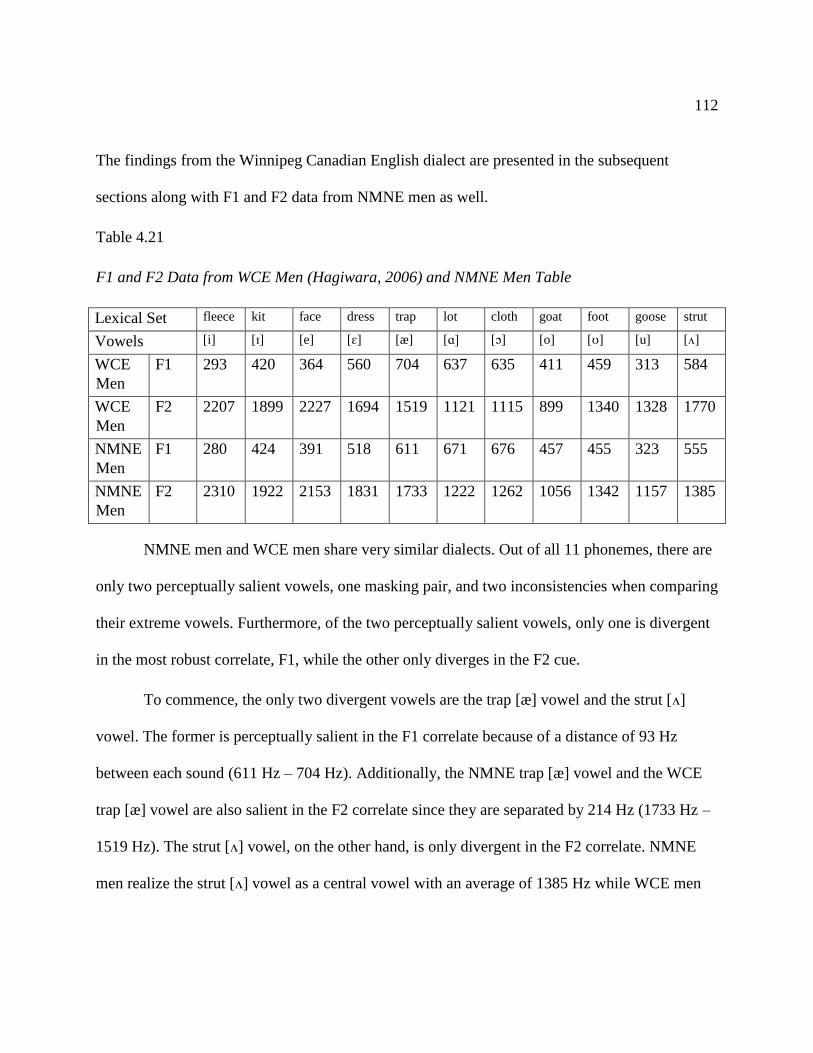
112
The findings from the Winnipeg Canadian English dialect are presented in the subsequent
sections along with F1 and F2 data from NMNE men as well.
Table 4.21
F1 and F2 Data from WCE Men (Hagiwara, 2006) and NMNE Men Table
Lexical Set fleece kit face dress trap lot cloth goat foot goose strut
Vowels [i] [ɪ] [e] [ɛ] [æ] [ɑ] [ɔ] [o] [ʊ] [u] [ʌ]
WCE
Men
F1 293 420 364 560 704 637 635 411 459 313 584
WCE
Men
F2 2207 1899 2227 1694 1519 1121 1115 899 1340 1328 1770
NMNE
Men
F1 280 424 391 518 611 671 676 457 455 323 555
NMNE
Men
F2 2310 1922 2153 1831 1733 1222 1262 1056 1342 1157 1385
NMNE men and WCE men share very similar dialects. Out of all 11 phonemes, there are
only two perceptually salient vowels, one masking pair, and two inconsistencies when comparing
their extreme vowels. Furthermore, of the two perceptually salient vowels, only one is divergent
in the most robust correlate, F1, while the other only diverges in the F2 cue.
To commence, the only two divergent vowels are the trap [æ] vowel and the strut [ʌ]
vowel. The former is perceptually salient in the F1 correlate because of a distance of 93 Hz
between each sound (611 Hz – 704 Hz). Additionally, the NMNE trap [æ] vowel and the WCE
trap [æ] vowel are also salient in the F2 correlate since they are separated by 214 Hz (1733 Hz –
1519 Hz). The strut [ʌ] vowel, on the other hand, is only divergent in the F2 correlate. NMNE
men realize the strut [ʌ] vowel as a central vowel with an average of 1385 Hz while WCE men

113
realize the same phoneme as a front vowel with an average of 1770 Hz. As a result, there is a
total distance of 385 Hz between each strut [ʌ] vowel.
That leads to the one masking pair of vowels. Because the WCE strut [ʌ] vowel has been
fronted so much, it now masks the NMNE trap [æ] vowel even though these two sounds are
interpreted as the other 0% of the time according to Hillenbrand et al. (1995, p. 3108)’s
confusion data. As can be seen in the figure below, the two vowels are in a close proximity of
one another. The distance between each is merely 27 Hz in the F1 correlate (584 Hz – 611 Hz)
and 37 Hz in the F2 correlate (1770 Hz – 1733 Hz). Thus, the two sounds are difficult to
decipher by hearers because their degree of masking is moderate according to Koffi (2017a, p.
109).

114
Figure 4.13: A representation of the acoustic vowel space chart for WCE men and NMNE men.
Lastly, in their extreme vowels, NMNE men and WCE men realize the fleece [i] vowel as
the highest sound and the goat [o] vowel as their most backed sound. However, the most fronted
sound is not the same when comparing these dialects. NMNE men realize the fleece [i] vowel as
their most fronted sound while WCE men actually realize the face [e] vowel as their most fronted
constituent. The lowest vowel of each dialect is also inconsistent. For WCE men, the trap [æ]

115
vowel is their lowest sound. NMNE men, on the other hand, produce the lot [ɑ] and cloth [ɔ]
vowels are their lowest phoneme.
Comparing Women F1 & F2: Vowel Height & Tongue Retraction
The women’s dialect of Winnipeg Canadian English is represented by only monolingual
speakers within the age bracket of 18-25 years. Northern Minnesota English women, on the other
hand, are a bit more diverse. For instance, four of the NMNE female participants speak another
language to some extent. Also, the age bracket of NMNE women is greater (20-64 years of age)
than that of the WCE women. However, the number of participants in each group is more
aligned. NMNE women include ten speakers while WCE women include only five. F1 and F2
data for each group is presented below.
Table 4.22
F1 and F2 Data from WCE Women (Hagiwara, 2006) and NMNE Women Table
Lexical Set fleece kit face dress trap lot cloth goat foot goose strut
Vowels [i] [ɪ] [e] [ɛ] [æ] [ɑ] [ɔ] [o] [ʊ] [u] [ʌ]
WCE
Women
F1 392 479 412 712 996 856 891 419 500 387 778
WCE
Women
F2 2765 2197 2742 1956 1752 1294 1310 999 1580 1328 1770
NMNE
Women
F1 355 493 447 655 825 788 785 509 521 398 664
NMNE
Women
F2 2585 2213 2483 2001 1825 1372 1375 1061 1508 1188 1596
NMNE women and WCE women do not share a very similar dialect such as is the case
for the male speakers of these two groups. While there is only a slight difference in their extreme
vowels, the number of perceptually salient vowels is up to six different phonemes. In spite of

116
these divergences though, WCE women and NMNE women do, however, share the same
masking vowel pair as their male counterparts. The remainder of this section addresses each of
these areas.
Commencing with their extreme vowels, WCE women are the first group of speakers in
this study to realize the goose [u] vowel as their highest sound rather than the fleece [i] vowel,
such as is the case for NMNE women. Despite this inconsistency, the rest of the extreme vowels
are the same. Both groups realize the fleece [i] vowel as their most fronted sound, the goat [o]
vowel as their most backed sound, and the trap [æ] vowel as their lowest sound.
Next, the six perceptually salient vowels include the trap [æ] vowel, the strut [ʌ] vowel,
the cloth [ɔ] vowel, the lot [ɑ] vowel, the goat [o] vowel, and the face [e] vowel. The most
drastic is the trap [æ] vowel. Easily exceeding the 63 Hz threshold, the trap [æ] vowels are
separated by 171 Hz in the F1 cue. Although both groups of women do in fact realize this
phoneme as a low vowel, WCE women realize a much lower sound (996 Hz) than do NMNE
women (825 Hz). The strut [ʌ] vowel is the second most distinct vowel because of a difference
of 114 Hz. WCE women realize this phoneme as a low vowel (778 Hz) whereas NMNE women
produce it as a mid vowel (664 Hz). The third and fourth salient vowels are the merged lot [ɑ]
and cloth [ɔ] vowels. Considering that these two sounds are merged in each dialect, it seems only
appropriate to discuss them together. The cloth [ɔ] vowels are separated by 106 Hz (891 Hz –
785 Hz) and the lot [ɑ] vowels are separated by 68 Hz (856 Hz – 778 Hz). Although their
distances are not entirely identical, the masked vowel pair still diverges together as one sound. It
should also be noted that even though both groups of women merge these two vowels, WCE
women have only moderately masked the two vowels because of a 35 Hz (856 Hz – 891 Hz)

117
distance between the WCE lot [ɑ] vowel and the WCE cloth [ɔ] vowel. NMNE women, on the
other hand, have a complete merge of these two sounds since there is only 3 Hz separating each
vowel (788 Hz – 785 Hz). These differences are visible in Figure 4.14 below.
Figure 4.14: A representation of the acoustic vowel space chart for WCE women and NMNE
women.

118
That leads to the fifth distinct vowel which is the goat [o] vowel. This is realized as a
high vowel by WCE women since it has an F1 average of 419 Hz. NMNE women, on the other
hand, produce it as a mid sound since it has an average of 509 Hz. Consequently, the two sounds
have a total distance of 90 Hz between them. The final distinct vowel is only divergent in the F2
cue and that is the face [e] vowel. This vowel is realized as a front sound in each dialect.
However, WCE women produce a sound that is far more fronted (2742 Hz), specifically 259 Hz
more, than NMNE women (2483 Hz). Accordingly, these two vowels are realized slightly
distinctively from one another.
The last area to discuss about these women’s dialects is the sole pair of overlapping
vowels. The NMNE trap [æ] vowel has merged with the WCE strut [ʌ] vowel. There is a total
distance of 47 Hz between the F1 measurements (825 Hz – 778 Hz). Likewise, the F2 averages
are separated by 55 Hz (1825 Hz – 1770 Hz).

119
Chapter 5: Discussion
Summary of NMNE Men and Women
This study set out to answer three research questions. The first question, What are the
acoustic vowel qualities of the following English vowels [i, ɪ, e, ɛ, æ, ɑ, ɔ, o, ʊ, u, ʌ] in the dialect
of 20 Northern Minnesotan speakers?, was addressed in the first and second section of Chapter
4. Conclusions from these sections are as follows.
Northern Minnesota English speakers realize exactly the same vowels in each of the three
levels of vowel height. Whether man or woman, this dialect produces the fleece [i] vowel, the
goose [u] vowel, and the face [e] vowel as their high vowels. They produce the kit [ɪ] vowel, the
goat [o] vowel, the foot [ʊ] vowel, the dress [ɛ] vowel, and the strut [ʌ] vowel as their mid
vowels. Lastly, they realize the trap [æ] vowel, the lot [ɑ] vowel, and the cloth [ɔ] vowel as their
low vowels. Likewise, these speakers also produce vowels in all three regions of tongue
retraction. However, the vowel inventories for each region are not as consistent as those levels in
the vowel height feature. Within the front region, the common vowels include the fleece [i]
vowel, the face [e] vowel, the kit [ɪ] vowel, and the dress [ɛ] vowel. In the central region, the
common vowels include the strut [ʌ] vowel and the foot [ʊ] vowel. The common back vowels
consist of the goose [u] vowel and the goat [o] vowel. That leaves just three vowels which do not
correlate between the men and women’s dialects. The first divergence is the trap [æ] vowel. In
the women’s speech, the trap [æ] vowel is realized as a central vowel whereas in the men’s
speech it is realized as a front vowel. Similarly, the lot [ɑ] vowel and the cloth [ɔ] vowel are also
inconsistent. In men’s speech they are central vowel phonemes. However, in women’s speech
they are realized as back vowel phonemes. Furthermore, it is no coincidence that these latter two

120
vowel phonemes move together. This is because speakers of this dialect have actually merged
their cloth [ɔ] vowel with their lot [ɑ] vowel. The greatest acoustic distance between each
phoneme is either 5 Hz (NMNE men) or 3 Hz (NMNE women). Nevertheless, both distances are
entirely indiscernible to the human ear. In addition to this, these speakers have also reversed their
kit [ɪ] and face [e] vowels. Now, the former is a mid vowel while the latter takes the former’s
place as a high vowel. Finally, whether man or woman, NMNE speakers have lowered and
fronted their foot [ʊ] vowel so much that it has actually caused this vowel to be classified as a
mid, central vowel now rather than a high, back vowel. Considering these findings, there is only
one feature that is prominent enough for any listener with normal ears to be able to perceive and
that is the overlapping of the lot [ɑ] and cloth [ɔ] vowels. Since NMNE speakers have merged
these two phonemes in the F1 and F2 acoustic cues, listeners will find it more than obvious that
Northern Minnesotans are unable to distinguish between words such as <cot> and <caught>.
The other four acoustic correlates under investigation in this study do in fact extend the
conversation of Northern Minnesota English acoustic vowel spaces. For instance, the current
data shows that NMNE women are more likely to round their vowels while their male
counterparts diverge in the opposing direction and prefer to unround their vowels. Furthermore,
the rounding feature is not limited to back vowels as theories predict (Thomas, 2011, p. 48;
Crothers, 1978, pp. 96-97). Another feature which evades discrimination is the vowel duration
feature. Although the idea of “intrinsic duration” is suggested by Lisker (1974, p. 226), NMNE
speakers realize high, mid, and low vowels alike as their longest sounds. Such as is exemplified
by NMNE men who realize the low trap [æ] vowel, the high face [e] vowel, the low cloth [ɔ]
vowel, the mid goat [o] vowel, and the low lot [ɑ] vowel as their longest sounds. They also

121
realize the high fleece [i] vowel as their second longest sound. Similarly, NMNE women realize
the low cloth [ɔ] vowel, the mid goat [o] vowel, the low trap [æ] vowel, the low lot [ɑ] vowel,
and the high face [e] vowel all as their longest sound along with the high fleece [i] and goose [u]
vowels as their second longest sound. Finally, although vowel intensity is indistinguishable
between the overall averages of both men and women from NMNE, the standard deviations from
each reveal that majority of their vowels are in fact distinctive between idiolects. Vowel pitch, on
the other hand, is mostly distinctive in both the averages as well as idiolects.
Comparison Summary of NMNE and Other American English Dialects
The second and third research questions which are presented below are addressed and
summarized together due to their cohesive nature.
2. In the F1 and F2 features, how similar or different are the 20 participants of Northern
Minnesota from other speakers with dialects such as General American English,
Midwest English, Central Minnesota English, and Winnipeg Canadian English?
3. In the F1 and F2 features, to which dialect is Northern Minnesota English most
similar?
NMNE men sound most similar to their northern neighbors in Winnipeg, Manitoba, CA.
This is because of their nine common vowel phonemes. Furthermore, even though each group of
men distinguish themselves when they produce the trap [æ] vowel and the strut [ʌ] vowel,
hearers are more likely to notice a divergence in only the trap [æ] vowels since they diverge in
the F1 correlate (Ladefoged & Johnson, 2015, p. 207; Koffi, 2016b, pp. 121-22). That being said,
a listener hearing each group of men will perceive these dialects as being almost entirely the
same. This is an interesting finding considering that 15 Minnesota commenters actually stated

122
that the dialect being used in Bartholdi (2015)’s Youtube video was actually a Canadian accent
rather than a Minnesotan accent. The truth in that statement then is that, according to the data
revealed in this study, Bartholdi’s video may be representing an accent that is actually almost
entirely the same as a Canadian accent, or more specifically a Winnipeg Canadian accent. For
this reason, it can be concluded that NMNE men and WCE men speak very similar dialects and
most hearers will detect only one noticeable difference, if any at all.
NMNE women, on the other hand, sound most similar to their southern neighbors in
Central Minnesota because of five common vowels and various common dialectal features.
However, their dialects are still very different considering that over half of their vowels diverge
in the F1 correlate. Given that English dialects are highly impacted by their vowels (Ladefoged,
2005, p. 27), listeners can actually hear noticeable differences between these two groups of
women. This may be why 24 of those Minnesota commenters started to draw boundaries around
the Minnesota accent. They claim that Bartholdi’s Youtube video is actually representing an
accent that is only spoken in the northern region of Minnesota while the other residents of
Minnesota regions speak differently. According to the current data from this study, that
statement is exactly true for NMNE women, as well as for their male counterparts for that matter.
NMNE women, along with NMNE men, do in fact have a dialect that is different from other
Minnesota speakers. Furthermore, NMNE women have a dialect that is distinct from other
speakers around them which include GAE women, MWE women, and even WCE women. Even
though they do share some common vowels with all four aforementioned dialects, NMNE
women have a dialect that is unique to their own region of Minnesota.

123
Implications
The relevance of these findings reaches into various areas of study. The first and most
obvious area is Linguistics. There are countless studies produced all over the U.S. that
acoustically describe American dialects. The current data of this study continues to develop this
acoustic inventory even further by adding another region to the “acoustic atlas” of America
(Hagiwara, 1997; 1995).
A second area which may find importance in these conclusions is Speech Technology.
Similar to linguists, speech technologists can incorporate this data as means of broadening their
knowledge of American English to include another salient dialect, Northern Minnesota English.
Limitations and Further Research
This study still does not even come close to collecting all of the data necessary for
determining whether or not the NMNE dialect is similar to that dialect present in the Batholdi
(2015)’s video production. However, it does start to reveal acoustical data for determining
potential patterns and characteristics of the NMNE dialect as well as to which surrounding
dialects it is most similar. That being said, to further investigate whether Barthodi’s video is truly
representing the Minnesota accent, researchers need to further these studies and investigate the
southern region(s) of Minnesota along with the Metro region. In addition to this, researchers also
need to collect data from the speakers presented in Bathodi’s video. With all of the compiled
data, finally then can we determine whether or not those actors and interviewees are speaking a
dialect that is similar to and/or different from Minnesota dialects.

124
References
Bartholdi, M. (2015). Are you Minnesota enough? TPT Rewire Retrieve from
https://www.youtube.com/watch?v=iVlNl_LX47I
Boberg, C. (2008). Regional phonetic differentiation in standard Canadian English. Journal of
English Linguistics, 36(2). McGill University.
Crothers, J. (1978). Typology and universals of vowel systems. In: Moracsik, E. A., Ferguson, C.
A., & Greenberg, J. H.: Universals of human language. Stanford University Press.
Stanford, CA. USA.
Google Image (2017). The miracle of Minneapolis: “the Canadian border strikes
again,…”.VDARE.com. Retrieve from
https://www.google.com/imgres?imgurl=https://vdare.com/wp-
content/uploads/2015/02/canada-map1.png&imgrefurl=https://vdare.com/posts/the-
miracle-of-minneapolis-the-canadian-border-strikes-
again&h=373&w=500&tbnid=s7YoGCtIsQAA5M&tbnh=194&tbnw=260&usg=__GtK
HF5ss3C1kLYdrsHbhCuwSjGw=&hl=en&docid=H5245FHLbVia6M
Hagiwara, R. (2006). Vowel production in Winnipeg. Canadian journal of Linguistics, 52(2-3).
University of Manitoba. MB, CA.
Hagiwara, R. (1997). Dialect variation and formant frequency: The American English vowels
revisited. Acoustic Society of America, 102(1). University of Wisconsin-Madison,
Madison, WI.

125
Hagiwara, R. (1995). Acoustic realizations of American /r/ as produced by women and men.
(Unpublished dissertation), University of California-Los Angeles.
Hillenbrand, J., Getty, L. A., Clark, M. J., & Wheeler, K. (1995). Acoustic characteristics of
American English vowels. The Journal of the Acoustical Society of America, 97(5), 3099
-3111.
Karvonen, D. (2015, March 4). Are You MN Enough?: The Minnesotan Accent. TPT Rewire
[Video file]. Retrieved from https://www.youtube.com/watch?v=iVlNl_LX47I
Kent, R., D., & Read, C. (2002). The acoustic analysis of speech.( 2nd ed.). Canada: Singular
Thomson learning.
Koffi, E. (2017a). Relevant acoustic phonetics of L2 English: Focus on intelligibility. (Course
Manuscript), St. Cloud, MN.
Koffi, E. (2017b). The duration of [o] in central Minnesota English: An Acoustic Phonetic
Investigation. Linguistic Portfolios, 6(3). St. Cloud, MN. Retrieved from
http://repository.stcloudstate.edu/stcloud_ling/vol6/iss1/3
Koffi, E. (2016a). The acoustic correlates of [±ATR] vowels: An analysis by reference levels of
Anyi vowels. Linguistic Portfolios, 5(9). St. Cloud, MN.
Koffi, Ettien. (2016b). Relevant acoustic phonetics of L2 English: Focus on intelligibility.
(Course Manuscript), St. Cloud, MN.
Koffi, E. (2016c). The lowering of high lax vowels in central Minnesota English: Does it happen
in other dialects. Linguistic Portfolios, 5(2). St. Cloud, MN. Retrieved from
http://repository.stcloudstate.edu/stcloud_ling/vol5/iss1/2

126
Koffi, E. (2014). The acoustic vowel space of central Minnesota English in light of the northern
cities shift. Linguistic Portfolios, 3(2). St. Cloud, MN. Retrieved from
http://repository.stcloudstate.edu/stcloud_ling/vol3/iss1/2
Koffi, Ettien (2013). The acoustic vowel space of central Minnesota English: Focus on female
vowels. Linguistic Portfolios, 2(2). St. Cloud, MN. Retrieved from
http://repository.stcloudstate.edu/stcloud_ling/vol2/iss1/2
Koon, D. (2010). Acoustic analysis of NAE vowels in central Minnesota. Saint Cloud State
University, MN. USA.
Labov, W., Rosenfelder, I., & Fruehwald, J. (2013). One hundred years of sound changes in
Philadelphia: Linear incrementation, reversal, and reanalysis. Language, 89(1). Linguistic
Society of America.
Ladefoged, P., & Johnson, K. (2015). A course in phonetics (7th ed.). Cengage Learning:
Stamford, CT, USA.
Ladefoged, P. (2005). Vowels and consonants (2nd ed.). Blackwell Publishing: Malden, MA,
USA.
Ladefoged, P. (1971). Preliminaries to linguistic phonetics. University of Chicago Press.
Chicago, IL, USA.
Liljencrantz, J., & Lindblom, B. (1972). Numerical simulation of vowel quality systems: The
role of perceptual contrast. Linguistic Society of America. 48(4).
Lisker, L. (1974). On “explaining” vowel duration variation. An International Journal of
Linguistics. Burnaby, Canada.

127
Minnesota Department of Transportation. (2017). Minnesota [2017]. Retrieved from
www.dot.state.mn.us/
Peterson, G., E., & Barney, H., L. (1952). Control methods in a study of the vowels. The Journal
of the Acoustic Society in America, 24(2).
Thomas, E., R. (2011). Sociophonetics: An introduction. Palgrave Macmillan: New York, NY,
USA.
Statistics Canada. 2018. Retrieved from http://www.statcan.gc.ca/eng/start
U.S. Census Bureau: (2017, 9-5). Retrieved from
https://www2.census.gov/geo/pdfs/reference/GARM/Ch9GARM.pdf
United State Census Boreau. (2010). Minnesota counties [July 2010]. Retrieved from
https://www.census.gov/quickfacts/table/PST045216/27017,27137
Wikimedia Commons (Jan. 11, 2018). Retrieved from
https://commons.wikimedia.org/wiki/File:Map_of_USA_with_state_names.svg
Wikipedia, (Mar. 24, 2018). Retrieved from https://en.wikipedia.org/wiki/City

128
Appendix
Appendix A: Tables—F0 of men
Lexical Set fleece kit face dress trap lot cloth goat foot goose strut
Vowels [i] [ɪ] [e] [ɛ] [æ] [ɑ] [ɔ] [o] [ʊ] [u] [ʌ]
Speaker
1M
F0 121 109 114 108 116 105 109 126 118 131 117
Speaker
2M
F0 174 145 133 130 136 134 129 137 135 153 129
Speaker
3M
F0 127 132 126 127 123 127 141 133 144 140 130
Speaker
4M
F0 112 109 100 97 91 92 85 93 99 113 100
Speaker
5M
F0 139 131 126 119 120 120 123 NA 131 131 NA
Speaker
6M
F0 100 101 110 121 112 105 94 109 112 124 105
Speaker
7M
F0 127 115 123 113 121 117 121 113 126 138 103
Speaker
8M
F0 110 115 110 110 108 108 112 116 122 128 110
Speaker
9M
F0 120 117 118 114 112 NA 117 126 129 144 121
Speaker
10M
F0 101 81 100 79 79 85 76 85 84 98 83
Average 123 115 116 111 111 110 110 115 120 130 110
Standard
Deviation 21.61 17.85 11.2 14.97 16.34 15.87 20.27 17.58 17.78 15.79 15.11

129
Appendix B: Tables—F0 of women
Lexical Set fleece kit face dress trap lot cloth goat foot goose strut
Vowels [i] [ɪ] [e] [ɛ] [æ] [ɑ] [ɔ] [o] [ʊ] [u] [ʌ]
Speaker
1F
F0 168 146 153 147 143 156 151 166 175 183 155
Speaker
2F
F0 220 191 204 203 192 194 199 206 217 224 201
Speaker
3F
F0 221 204 202 191 188 188 187 197 208 214 152
Speaker
4F
F0 198 191 193 182 166 171 186 201 204 205 226
Speaker
5F
F0 179 197 189 184 176 187 215 202 206 219 188
Speaker
6F
F0 223 201 181 189 183 184 196 195 193 215 186
Speaker
7F
F0 194 191 144 170 146 161 115 148 193 189 150
Speaker
8F
F0 286 272 257 245 241 286 199 239 252 269 144
Speaker
9F
F0 205 185 173 170 166 176 192 NA 175 183 168
Speaker
10F
F0 211 196 192 194 187 159 179 193 168 187 91
Average 211 197 188 187 178 186 181 194 199 208 166
Standard
Deviation 32.28 30.8 31.06 25.6 27.69 37.49 28.79 24.02 24.65 26.32 37.11
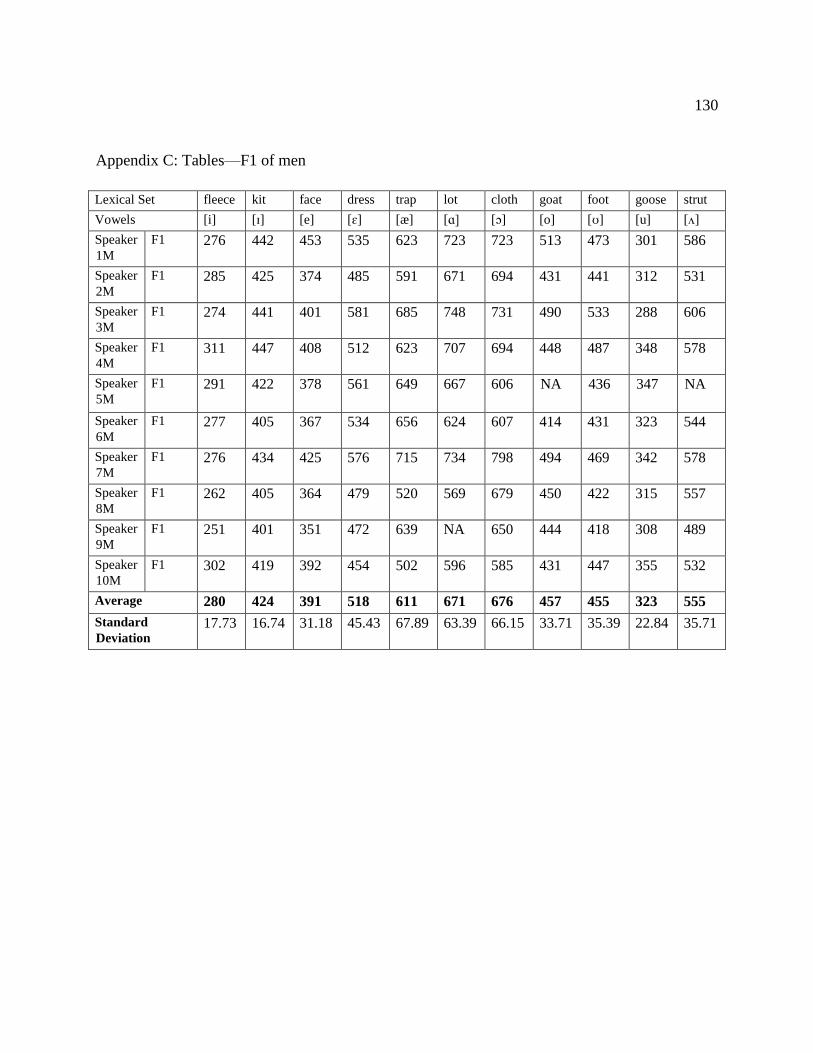
130
Appendix C: Tables—F1 of men
Lexical Set fleece kit face dress trap lot cloth goat foot goose strut
Vowels [i] [ɪ] [e] [ɛ] [æ] [ɑ] [ɔ] [o] [ʊ] [u] [ʌ]
Speaker
1M
F1 276 442 453 535 623 723 723 513 473 301 586
Speaker
2M
F1 285 425 374 485 591 671 694 431 441 312 531
Speaker
3M
F1 274 441 401 581 685 748 731 490 533 288 606
Speaker
4M
F1 311 447 408 512 623 707 694 448 487 348 578
Speaker
5M
F1 291 422 378 561 649 667 606 NA 436 347 NA
Speaker
6M
F1 277 405 367 534 656 624 607 414 431 323 544
Speaker
7M
F1 276 434 425 576 715 734 798 494 469 342 578
Speaker
8M
F1 262 405 364 479 520 569 679 450 422 315 557
Speaker
9M
F1 251 401 351 472 639 NA 650 444 418 308 489
Speaker
10M
F1 302 419 392 454 502 596 585 431 447 355 532
Average 280 424 391 518 611 671 676 457 455 323 555
Standard
Deviation 17.73 16.74 31.18 45.43 67.89 63.39 66.15 33.71 35.39 22.84 35.71

131
Appendix D: Tables—F1 of women
Lexical Set fleece kit face dress trap lot cloth goat foot goose strut
Vowels [i] [ɪ] [e] [ɛ] [æ] [ɑ] [ɔ] [o] [ʊ] [u] [ʌ]
Speaker
1F
F1 349 522 468 623 709 738 724 501 531 389 637
Speaker
2F
F1 383 462 416 644 799 704 720 444 478 417 575
Speaker
3F
F1 390 548 504 837 979 935 948 593 564 410 812
Speaker
4F
F1 333 502 423 717 962 862 828 485 521 385 615
Speaker
5F
F1 314 505 433 634 753 718 761 460 494 386 674
Speaker
6F
F1 372 493 516 711 963 882 854 509 557 408 727
Speaker
7F
F1 366 412 382 505 773 572 590 433 447 378 559
Speaker
8F
F1 326 598 520 699 862 891 807 654 672 434 734
Speaker
9F
F1 387 400 395 490 614 777 836 NA 420 380 638
Speaker
10F
F1 339 497 417 693 844 804 788 507 530 395 675
Average 355 493 447 655 825 788 785 509 521 398 664
Standard
Deviation
27.35 58.96 50.92 102.62 120.08 109.55 95.92 71.69 70.22 18.34 77.27

132
Appendix E: Tables—F2 of men
Lexical Set fleece kit face dress trap lot cloth goat foot goose strut
Vowels [i] [ɪ] [e] [ɛ] [æ] [ɑ] [ɔ] [o] [ʊ] [u] [ʌ]
Speaker
1M
F2 2336 2012 2149 1935 1872 1226 1203 1140 1296 1037 1340
Speaker
2M
F2 2510 1912 2123 1779 1712 1284 1298 1097 1414 1169 1426
Speaker
3M
F2 2262 1907 2122 1727 1608 1236 1193 1052 1390 1217 1364
Speaker
4M
F2 2244 1852 2060 1778 1628 1298 1291 1321 1432 1348 1478
Speaker
5M
F2 2257 1900 2164 1938 1801 1056 1149 NA 1180 1234 NA
Speaker
6M
F2 2483 2153 2408 2139 1947 1196 1135 889 1515 1074 1448
Speaker
7M
F2 2349 1965 2215 1850 1763 1270 1358 1016 1374 1070 1388
Speaker
8M
F2 2194 1775 2039 1689 1646 1254 1632 1184 1356 1359 1465
Speaker
9M
F2 2214 1853 2076 1638 1534 NA 1137 907 1143 999 1225
Speaker
10M
F2 2256 1894 2174 1841 1828 1181 1232 906 1318 1070 1334
Average 2310 1922 2153 1831 1733 1222 1262 1056 1342 1157 1385
Standard
Deviation
109.12 103.37 104.81 145.8 130.77 73.37 149.78 145.57 112.45 128.38 80.13

133
Appendix F: Tables—F2 of women
Lexical Set fleece kit face dress trap lot cloth goat foot goose strut
Vowels [i] [ɪ] [e] [ɛ] [æ] [ɑ] [ɔ] [o] [ʊ] [u] [ʌ]
Speaker
1F
F2 2539 2022 2361 1968 1870 1363 1327 971 1397 1117 1629
Speaker
2F
F2 2414 2101 2470 1674 1396 1271 1344 1130 1506 1330 1411
Speaker
3F
F2 2839 2280 2499 2002 1703 1377 1387 1136 1554 1246 1623
Speaker
4F
F2 2755 2153 2631 2022 1610 1344 1376 1132 1589 1110 1574
Speaker
5F
F2 2665 2120 2483 1974 1875 1259 1238 744 1337 868 1548
Speaker
6F
F2 2213 2374 2536 2098 1845 1482 1420 1172 1641 1262 1719
Speaker
7F
F2 2495 2300 2598 2135 2012 1139 1226 990 1338 1123 1447
Speaker
8F
F2 2299 2090 2184 1759 1951 1451 1472 1190 1596 1335 1645
Speaker
9F
F2 2941 2511 2492 2344 2088 1593 1538 NA 1626 1352 1808
Speaker
10F
F2 2690 2184 2577 2035 1908 1444 1426 1088 1498 1140 1559
Average 2585 2213 2483 2001 1825 1372 1375 1061 1508 1188 1596
Standard
Deviation
235.04 150.56 129.77 186.76 204.66 129.32 97.17 140.86 114.79 148.15 117.79

134
Appendix G: Tables—F3 of men
Lexical Set fleece kit face dress trap lot cloth goat foot goose strut
Vowels [i] [ɪ] [e] [ɛ] [æ] [ɑ] [ɔ] [o] [ʊ] [u] [ʌ]
Speaker
1M
F3 3125 2672 2734 2670 2612 2518 2516 2573 2439 2449 2550
Speaker
2M
F3 3107 2827 2843 2651 2514 2295 2407 2485 2659 2503 2615
Speaker
3M
F3 2957 2611 2626 2550 2479 2376 2319 2249 2364 2182 2427
Speaker
4M
F3 2959 2815 2741 2715 2683 2768 2723 2756 2465 2802 2611
Speaker
5M
F3 3056 2703 2907 2702 2483 2463 2794 NA 2374 2626 NA
Speaker
6M
F3 3162 2922 2963 2958 2557 2500 2483 2776 2592 2389 2480
Speaker
7M
F3 2790 2732 2921 2951 2886 2942 2793 2488 2531 2253 2675
Speaker
8M
F3 3001 2621 2628 2622 2645 2665 2751 2725 2704 2732 2671
Speaker
9M
F3 2893 2571 2603 2540 2424 NA 2524 2480 2403 2246 2514
Speaker
10M
F3 2882 2480 2920 2696 2615 2667 2700 2578 2398 2585 2382
Average 2993 2695 2788 2705 2589 2577 2601 2567 2492 2476 2547
Standard
Deviation
119.71 133.1 139.09 144.14 132.74 202.44 171.76 168.14 122.45 211.94 104.69
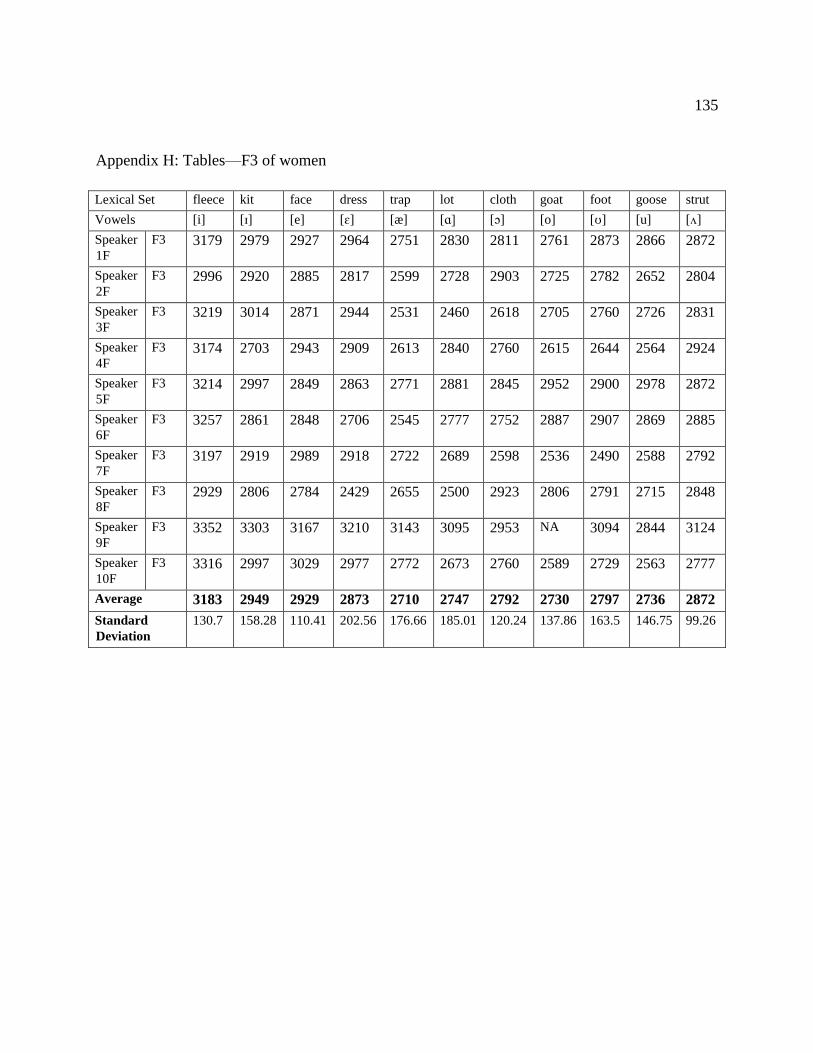
135
Appendix H: Tables—F3 of women
Lexical Set fleece kit face dress trap lot cloth goat foot goose strut
Vowels [i] [ɪ] [e] [ɛ] [æ] [ɑ] [ɔ] [o] [ʊ] [u] [ʌ]
Speaker
1F
F3 3179 2979 2927 2964 2751 2830 2811 2761 2873 2866 2872
Speaker
2F
F3 2996 2920 2885 2817 2599 2728 2903 2725 2782 2652 2804
Speaker
3F
F3 3219 3014 2871 2944 2531 2460 2618 2705 2760 2726 2831
Speaker
4F
F3 3174 2703 2943 2909 2613 2840 2760 2615 2644 2564 2924
Speaker
5F
F3 3214 2997 2849 2863 2771 2881 2845 2952 2900 2978 2872
Speaker
6F
F3 3257 2861 2848 2706 2545 2777 2752 2887 2907 2869 2885
Speaker
7F
F3 3197 2919 2989 2918 2722 2689 2598 2536 2490 2588 2792
Speaker
8F
F3 2929 2806 2784 2429 2655 2500 2923 2806 2791 2715 2848
Speaker
9F
F3 3352 3303 3167 3210 3143 3095 2953 NA 3094 2844 3124
Speaker
10F
F3 3316 2997 3029 2977 2772 2673 2760 2589 2729 2563 2777
Average 3183 2949 2929 2873 2710 2747 2792 2730 2797 2736 2872
Standard
Deviation
130.7 158.28 110.41 202.56 176.66 185.01 120.24 137.86 163.5 146.75 99.26
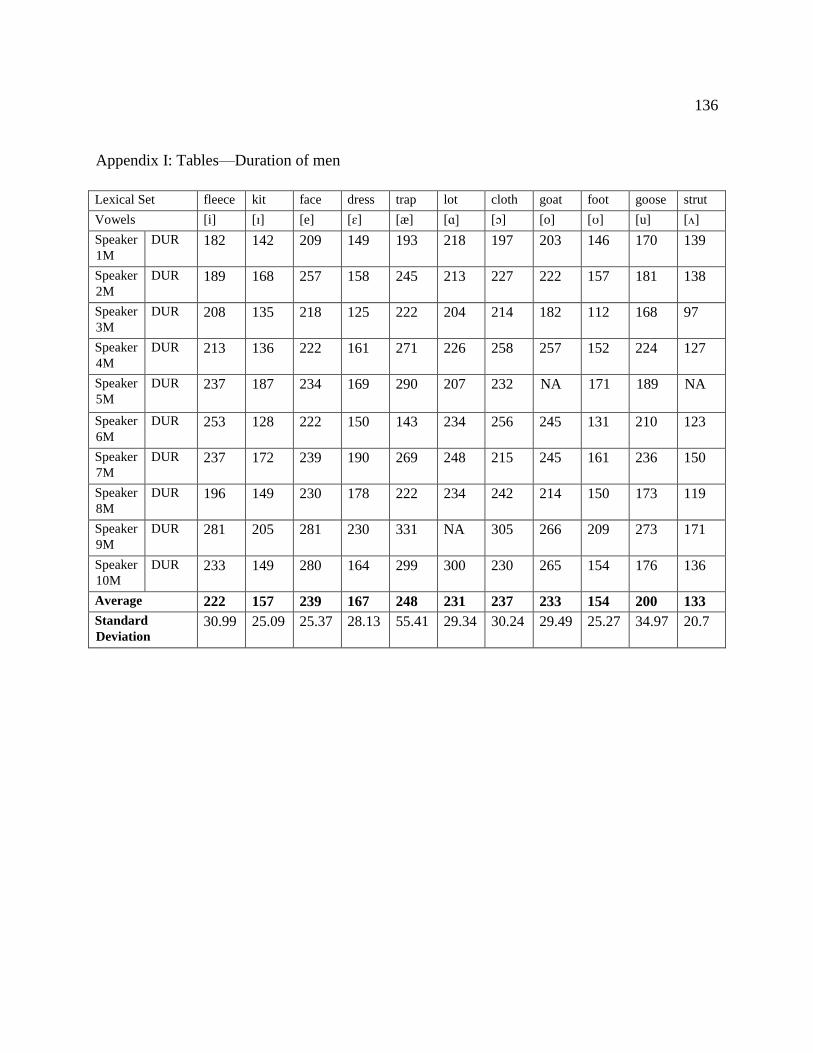
136
Appendix I: Tables—Duration of men
Lexical Set fleece kit face dress trap lot cloth goat foot goose strut
Vowels [i] [ɪ] [e] [ɛ] [æ] [ɑ] [ɔ] [o] [ʊ] [u] [ʌ]
Speaker
1M
DUR 182 142 209 149 193 218 197 203 146 170 139
Speaker
2M
DUR 189 168 257 158 245 213 227 222 157 181 138
Speaker
3M
DUR 208 135 218 125 222 204 214 182 112 168 97
Speaker
4M
DUR 213 136 222 161 271 226 258 257 152 224 127
Speaker
5M
DUR 237 187 234 169 290 207 232 NA 171 189 NA
Speaker
6M
DUR 253 128 222 150 143 234 256 245 131 210 123
Speaker
7M
DUR 237 172 239 190 269 248 215 245 161 236 150
Speaker
8M
DUR 196 149 230 178 222 234 242 214 150 173 119
Speaker
9M
DUR 281 205 281 230 331 NA 305 266 209 273 171
Speaker
10M
DUR 233 149 280 164 299 300 230 265 154 176 136
Average 222 157 239 167 248 231 237 233 154 200 133
Standard
Deviation 30.99 25.09 25.37 28.13 55.41 29.34 30.24 29.49 25.27 34.97 20.7

137
Appendix J: Tables—Duration of women
Lexical Set fleece kit face dress trap lot cloth goat foot goose strut
Vowels [i] [ɪ] [e] [ɛ] [æ] [ɑ] [ɔ] [o] [ʊ] [u] [ʌ]
Speaker
1F
DUR 191 145 225 147 207 215 206 196 154 194 117
Speaker
2F
DUR 239 170 245 172 235 261 276 264 204 208 148
Speaker
3F
DUR 255 210 313 207 293 294 310 305 196 249 165
Speaker
4F
DUR 219 130 223 134 214 217 225 238 130 182 92
Speaker
5F
DUR 281 193 286 206 338 352 343 297 181 259 151
Speaker
6F
DUR 217 146 214 157 238 230 211 231 152 187 106
Speaker
7F
DUR 205 105 215 117 209 202 246 230 116 188 103
Speaker
8F
DUR 147 138 175 122 193 193 187 200 140 157 118
Speaker
9F
DUR 180 99 203 131 187 157 197 NA 83 160 82
Speaker
10F
DUR 214 192 246 183 258 252 278 252 203 221 171
Average 214 152 234 157 237 237 247 245 155 200 125
Standard
Deviation 38.11 37.63 40.29 33.21 47.64 55.54 52.21 38.08 40.3 34.16 31.29

138
Appendix K: Tables—Intensity of men
Lexical Set fleece kit face dress trap lot cloth goat foot goose strut
Vowels [i] [ɪ] [e] [ɛ] [æ] [ɑ] [ɔ] [o] [ʊ] [u] [ʌ]
Speaker
1M
INT 53 51 52 52 52 53 53 53 52 56 54
Speaker
2M
INT 77 80 75 75 74 74 73 77 77 79 75
Speaker
3M
INT 73 74 70 73 72 76 75 72 75 73 73
Speaker
4M
INT 53 53 50 50 49 50 47 49 53 54 52
Speaker
5M
INT 63 65 65 57 56 58 58 NA 63 63 NA
Speaker
6M
INT 48 53 53 50 54 49 48 54 52 56 51
Speaker
7M
INT 58 58 58 58 57 58 61 59 61 61 58
Speaker
8M
INT 52 54 53 51 47 48 46 50 52 51 46
Speaker
9M
INT 55 56 55 54 54 NA 57 57 58 58 55
Speaker
10M
INT 59 56 57 51 53 54 52 57 54 59 54
Average 59.1 60 58.8 57.1 56.8 57.7 57 58.6 59.7 61 57.5
Standard
Deviation 9.39 9.84 8.40 9.33 9.05 10.40 10.21 9.63 9.45 8.71 9.88

139
Appendix L: Tables—Intensity of women
Lexical Set fleece kit face dress trap lot cloth goat foot goose strut
Vowels [i] [ɪ] [e] [ɛ] [æ] [ɑ] [ɔ] [o] [ʊ] [u] [ʌ]
Speaker
1F
INT 56 58 58 59 58 60 58 60 62 60 59
Speaker
2F
INT 52 55 55 52 50 51 52 54 56 58 52
Speaker
3F
INT 53 55 54 57 59 55 59 54 53 53 50
Speaker
4F
INT 59 62 60 62 64 61 64 64 65 62 60
Speaker
5F
INT 53 54 52 52 51 52 54 57 58 56 55
Speaker
6F
INT 51 52 52 51 51 51 51 52 50 52 49
Speaker
7F
INT 49 50 50 45 43 45 44 50 52 53 48
Speaker
8F
INT 52 55 50 55 52 58 53 53 54 51 51
Speaker
9F
INT 47 45 43 41 41 40 42 NA 42 47 42
Speaker
10F
INT 62 61 62 62 62 62 61 62 61 62 61
Average 53.4 54.7 53.6 53.6 53.1 53.5 53.8 56.2 55.3 55.4 52.7
Standard
Deviation 4.50 5.03 5.54 6.89 7.63 7.16 7.05 4.81 6.68 5.03 6.03

140
Appendix M: Task 1
1. Sex: _____ Male or _____ Female
2. Age: ______________________
3. First language: ______________________
4. Other languages you speak: ______________________
5. In what city/county do you currently live? ______________________
6. How many years have you lived in that city/county? ______________________
7. How long have you lived in the Northern Minnesota region? ______________________

141
Appendix N: Task 2
1. Heed, heed, heed (Note: the vowel sounds like the “ee” in <fleece>)
2. Hid, hid, hid (Note: the vowel sounds like the “i” in <kit>)
3. Hayed, hayed, hayed (Note: the vowel sounds like the “a” in <face>)
4. Head, head, head (Note: the vowel sounds like the “e” in <dress>)
5. Had, had, had (Note: the vowel sounds like the “a” in <bath>)
6. Hod, hod, hod (Note: the vowel sounds like the “o” in <lot>)
7. Hawed, hawed, hawed (Note: the vowel sounds like the “o” in <cloth>)
8. Hoed, hoed, hoed (Note: the vowel sounds like the “oa” in <goat>)
9. Hood, hood, hood (Note: the vowel sounds like the “oo” in <foot>)
10. Who’d, who’d, who’d (Note: the vowel sounds like the “oo” in <goose>)
11. Hud, hud, hud (Note: the vowel sounds like the “u” in <hug>)

142
Appendix O: Task 3
Please call Stella. Ask her to bring these things with her from the store: Six good spoons of
fresh snow peas, five thick slabs of blue cheese, and maybe a foot long sandwich as a snack
for her brother Bob. We also need a small plastic snake, a yellow book, a rubber duck, a
paper I-pad, the dog video game, a big toy frog for the kids, but not the faked gun. She can
scoop these things into three red bags and two old backpacks, and we will go meet her,
Jake, and Jenny Wednesday at the very last train station at the edge of the zoo. Also, let
Stella know that the toy frog is running low on battery.