an affinity for scope
DESCRIPTION
An Affinity for ScopeTRANSCRIPT
An Affinity for Scope
Mike was a newly hired Black Belt (BB) at a roofing shingle manufacturing plant who
was going through Six Sigma training. Tim, the general manager of the plant where Mike
worked, brought Mike into his office and explained that Mike s Master Black Belt was
on the speaker phone. The Master Black Belt, Robert, shared with Mike the details of
what would be his first project. Tim and I have been talking and congratulations,
Mike! here is your first project: Reduce Tray Jams. It is the second highest cause of
downtime at your plant, exclaimed Robert.
Tim explained to Mike that tray jamming in the plant s autocatcher was a big problem
that needed to be solved. The autocatcher was a mechanical bundling device notorious for
having jams in the tray that stacks and consolidates individual shingles into bundles ready
for packaging. Tim further explained that in his role as general manager of the plant, he
would support Mike as the Champion of this project.
The Magnitude of the Project
Mike was excited about having his first project and immediately shared his news with the
plant s employees. Many of the operators patted Mike on the back and commented,
Well, if you reduce tray jams, you ll make quite the name for yourself. Others
chided, You poor soul, and Who did you upset to get stuck with that? And then a
wave of stories came of Remember when so-and-so took on a tray jam project? It s
still a problem! A heavy weight overtook Mike as he began to realize the gravity of the
situation.
One operator encouraged Mike, saying, We ll help you in any way we can. We hate
autocatcher tray jams. These jams result in the operators having to manually clear the
jams often bringing the production line to a halt. How was Mike going to finish his
first project in the standard six to nine months when it seemed this problem was so
resistant to being solved?
Scope, Time and Resources
Mike reflected on the importance of establishing the scope of a project during the Define
phase of any DMAIC (Define, Measure, Analyze, Improve, Control) project. As he went
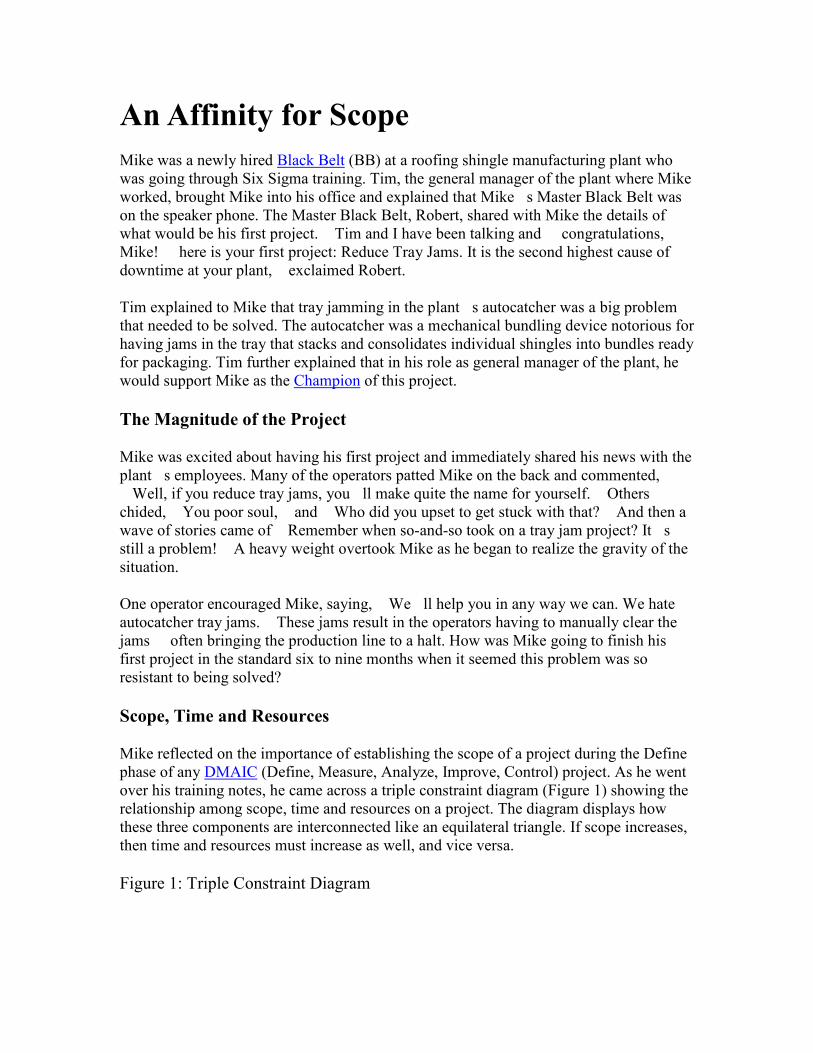
over his training notes, he came across a triple constraint diagram (Figure 1) showing the
relationship among scope, time and resources on a project. The diagram displays how
these three components are interconnected like an equilateral triangle. If scope increases,
then time and resources must increase as well, and vice versa.
Figure 1: Triple Constraint Diagram
As with any project leader, Mike needed to find the right combination of scope, time and
resources. For Mike specifically, time was of the essence because there was pressure for a
new Black Belt to complete his first project in the expected six to nine months. If Mike
did not have the project rightly scoped and resourced, the project s cycle time would
inevitably drift beyond that time frame. The project s scope needed to reasonably match
what he could accomplish with his allotted time. With scope and time defined, Mike
would be able to communicate to his Champion what resources he would need.
Starting with the Right Tool
Mike remembered his Six Sigma instructor telling him to trust the tools and to trust the
methodology. Mike wondered, What tool do I need to kick this project off? Mike
recalled that his instructor taught that when you want to dig into the root cause of a
specific problem the Ishikawa fishbone diagram is a tool of choice. He also remembered
his instructor sharing a warning in the form of a joke, Now some of you are going to
run out there and do a fishbone and discover that what you have is not a fish, but an entire
whale! In this situation, you should have used an affinity diagram. Affinity diagrams!
Mike began refreshing his memory on the tool. Affinity diagrams are a scoping tool that
can be used to break down large-scale, complex problems into smaller, more manageable
pieces. Mike recalled that when he visited the plant floor and asked individual operators
what they thought caused the tray jams, the operators would often respond, Everything!
Everything causes tray jams! Mike began to realize that the tray jam problem
potentially had a broad base of root causes; he did not need the scalpel of a fishbone
diagram, but rather a tool to help him identify the many potential root causes an
affinity diagram.
Brainstorming for Root Causes
Mike gathered a cross-functional team comprised of two engineers, three maintenance
technicians and two operators for a brainstorming session. He explained the ground rules
and then at the top of a dry erase board, he wrote the undesirable effect: autocatcher tray
jams. Mike asked the team to tell him anything and everything that they thought caused
tray jams.
At first, the team overwhelmed him with ideas all at once. He thanked them for their
enthusiasm, but he had to refocus them on the ground rules of only talking one at a time.
This gave Mike time to write down each suggested cause on a sticky note and attach it
randomly to the board. He explained that after the brainstorming session the team would
organize the sticky notes and (with luck) begin to see the problem with more clarity.
The operators enjoyed sharing their ideas. Mike noted there was a degree of venting by
the operators with each suggestion. He also noticed that their insights initially revolved
around ambient temperature, humidity and raw materials. Mike ensured that the
maintenance technicians were not being left out. Their insights had to do with settings
and the setup of the machine itself. The operators took offense at this since it revealed a
degree of tampering on their part with the process. Mike settled the group and reminded
everyone that they were one team and that the problem plagued the entire plant. He
reaffirmed that there would be no finger pointing, just honest root cause analysis, and that
it was the process that needed fixing.
The engineers began to chime in with potential solutions, rather than root causes, which
started all kinds of excitement and side conversations. Mike had to stop the meeting and
refocus everyone s attention again. Team, we are not ready to jump to solutions. We
have to break down the problem first. Einstein said that if I have an hour to solve a
problem, then I want to take 50 minutes understanding the problem and 10 minutes
solving it. He then assigned one of the engineers to be the enforcer of his no-
solutions rule. After the flow of ideas diminished and the team s eyes began to glaze
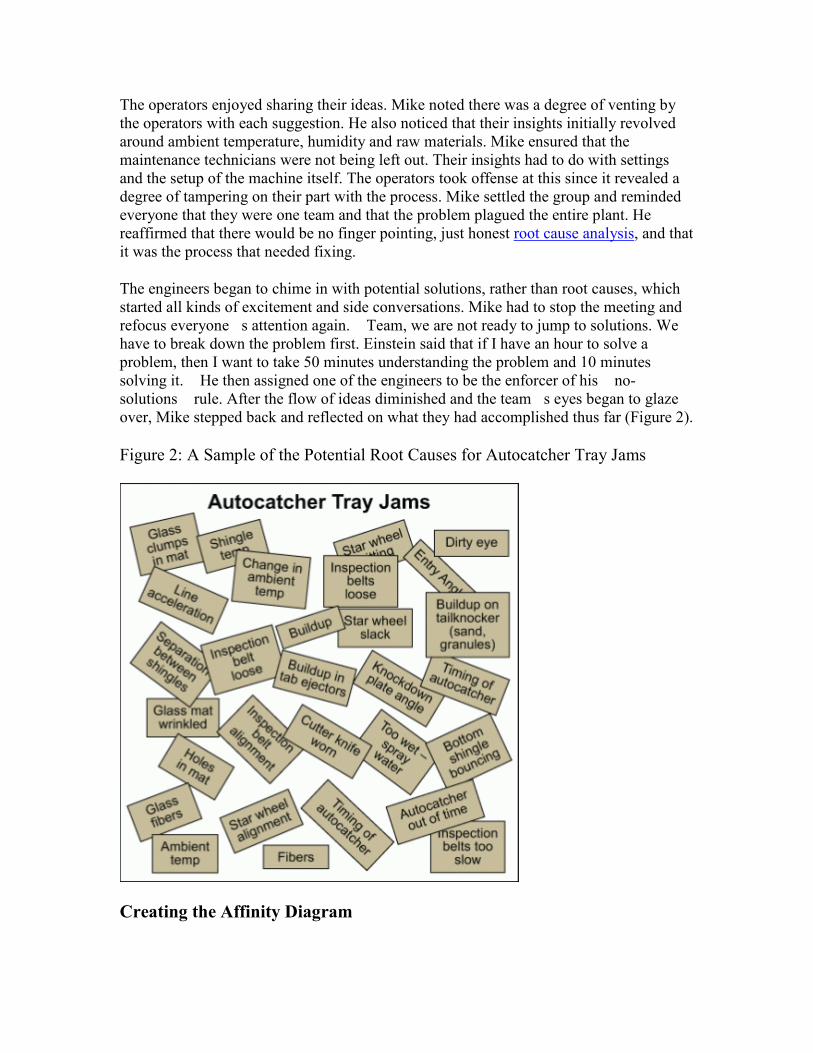
over, Mike stepped back and reflected on what they had accomplished thus far (Figure 2).
Figure 2: A Sample of the Potential Root Causes for Autocatcher Tray Jams
Creating the Affinity Diagram
Mike was impressed by the number of potential root causes that he saw on the board. It
looked like there were more than 100 ideas after about 40 minutes of brainstorming. With
a quick review of the potential root causes, he noticed that many of them came from
different raw materials and different locations in the manufacturing process; this
reinforced the idea that everything caused tray jams.
Steps to Create Affinity Diagrams
The steps for creating an affinity diagram are:
1. Have a cross-functional team
2. Cover the ground rules:
1. Only one person talks at a time.
2. Do not discuss solutions; the problem must be understood first.
3. All potential root causes are welcome there are no bad ideas.
4. Blame the process, not the person.
3. Write the undesired effect at the top of the white board (or whatever you are using
to collect the ideas and ensure the team members can see them) to focus the
brainstorming. It is also helpful to have a macro-level process map posted.
4. As they are identified, write each potential root cause on a sticky note and put it
on the board. Repeat until done.
5. After the brainstorming session is complete, it is time to affinitize. Arrange the
sticky notes into common categories.
Mike explained the next step to the team. Okay team, now we have to move all of these
sticky notes around into similar categories. If you see any matches, call them out. He
asked for a couple of volunteers to help him move the notes around. An engineer started
the process by commenting, It seems like some of these root causes are upstream away
from the autocatchers, and the others are related to the shingle machine that the
autocatcher is a part of. Everyone liked that idea as a first step, so Mike wrote
upstream and shingle machine at the top of the board. His volunteers began to
shuffle the ideas to their appropriate categories. Members of the team that were in their
seats chimed in to help direct Mike and his volunteers as to which category to place each
sticky note under.
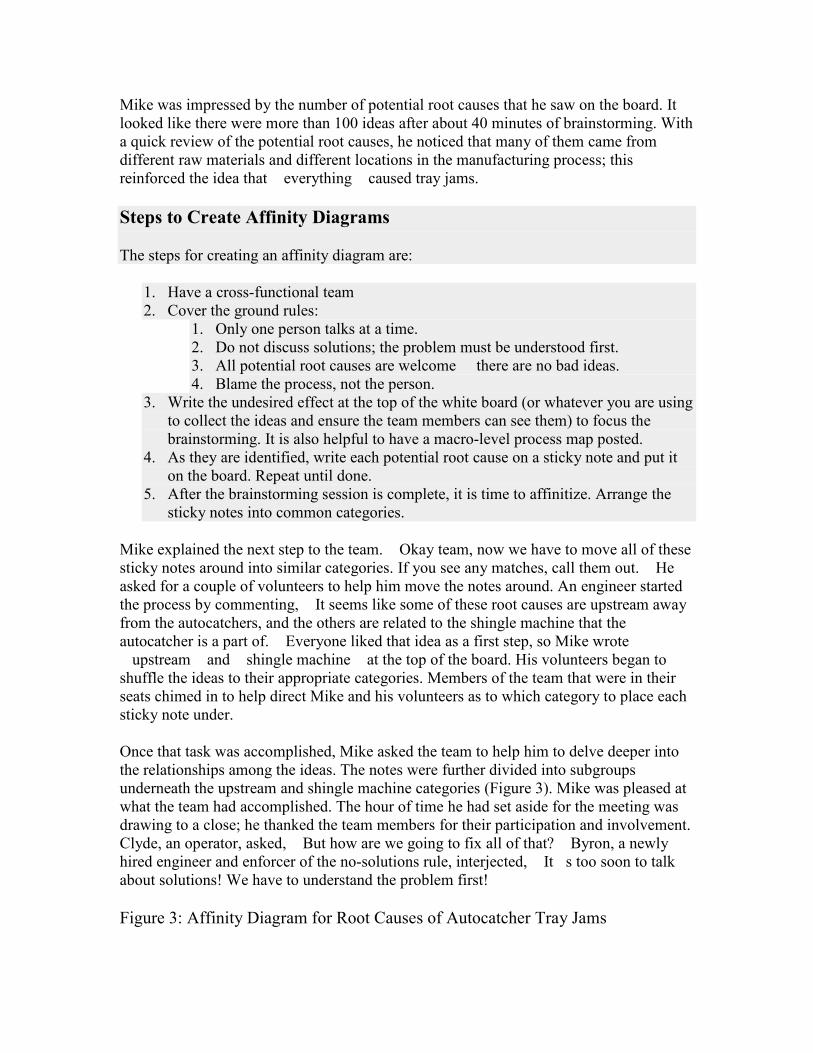
Once that task was accomplished, Mike asked the team to help him to delve deeper into
the relationships among the ideas. The notes were further divided into subgroups
underneath the upstream and shingle machine categories (Figure 3). Mike was pleased at
what the team had accomplished. The hour of time he had set aside for the meeting was
drawing to a close; he thanked the team members for their participation and involvement.
Clyde, an operator, asked, But how are we going to fix all of that? Byron, a newly
hired engineer and enforcer of the no-solutions rule, interjected, It s too soon to talk
about solutions! We have to understand the problem first!
Figure 3: Affinity Diagram for Root Causes of Autocatcher Tray Jams
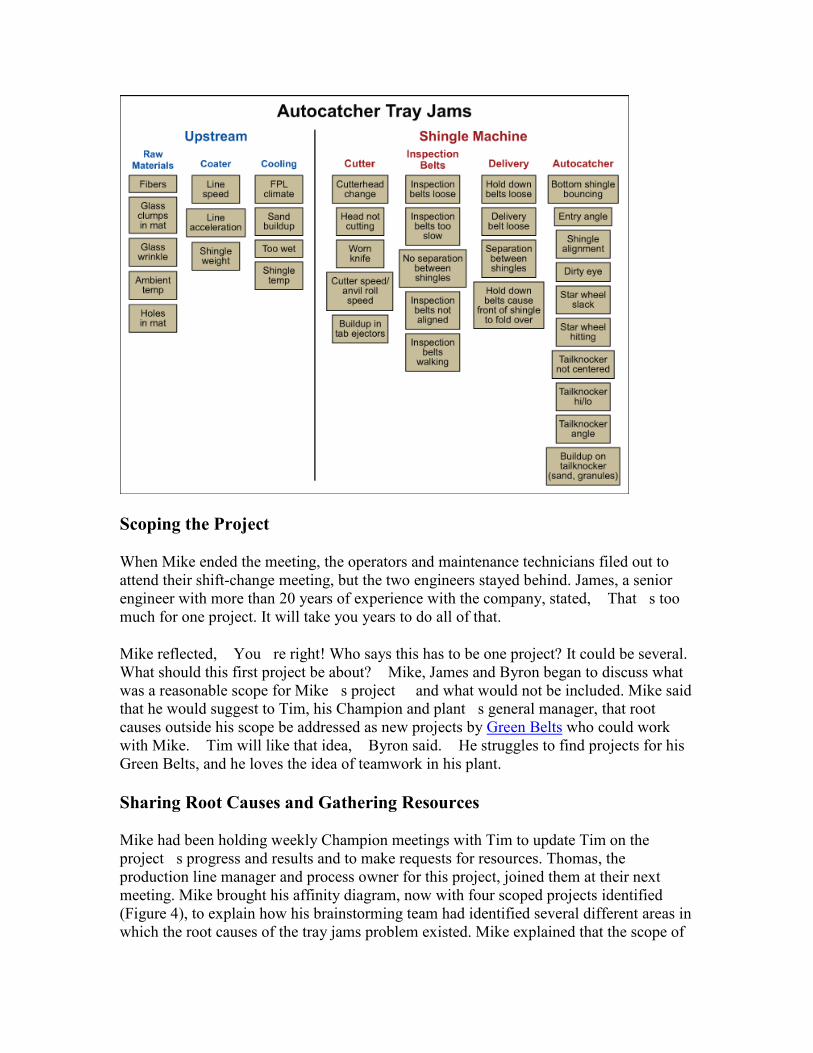
Scoping the Project
When Mike ended the meeting, the operators and maintenance technicians filed out to
attend their shift-change meeting, but the two engineers stayed behind. James, a senior
engineer with more than 20 years of experience with the company, stated, That s too
much for one project. It will take you years to do all of that.
Mike reflected, You re right! Who says this has to be one project? It could be several.
What should this first project be about? Mike, James and Byron began to discuss what
was a reasonable scope for Mike s project and what would not be included. Mike said
that he would suggest to Tim, his Champion and plant s general manager, that root
causes outside his scope be addressed as new projects by Green Belts who could work
with Mike. Tim will like that idea, Byron said. He struggles to find projects for his
Green Belts, and he loves the idea of teamwork in his plant.
Sharing Root Causes and Gathering Resources
Mike had been holding weekly Champion meetings with Tim to update Tim on the
project s progress and results and to make requests for resources. Thomas, the
production line manager and process owner for this project, joined them at their next
meeting. Mike brought his affinity diagram, now with four scoped projects identified
(Figure 4), to explain how his brainstorming team had identified several different areas in
which the root causes of the tray jams problem existed. Mike explained that the scope of
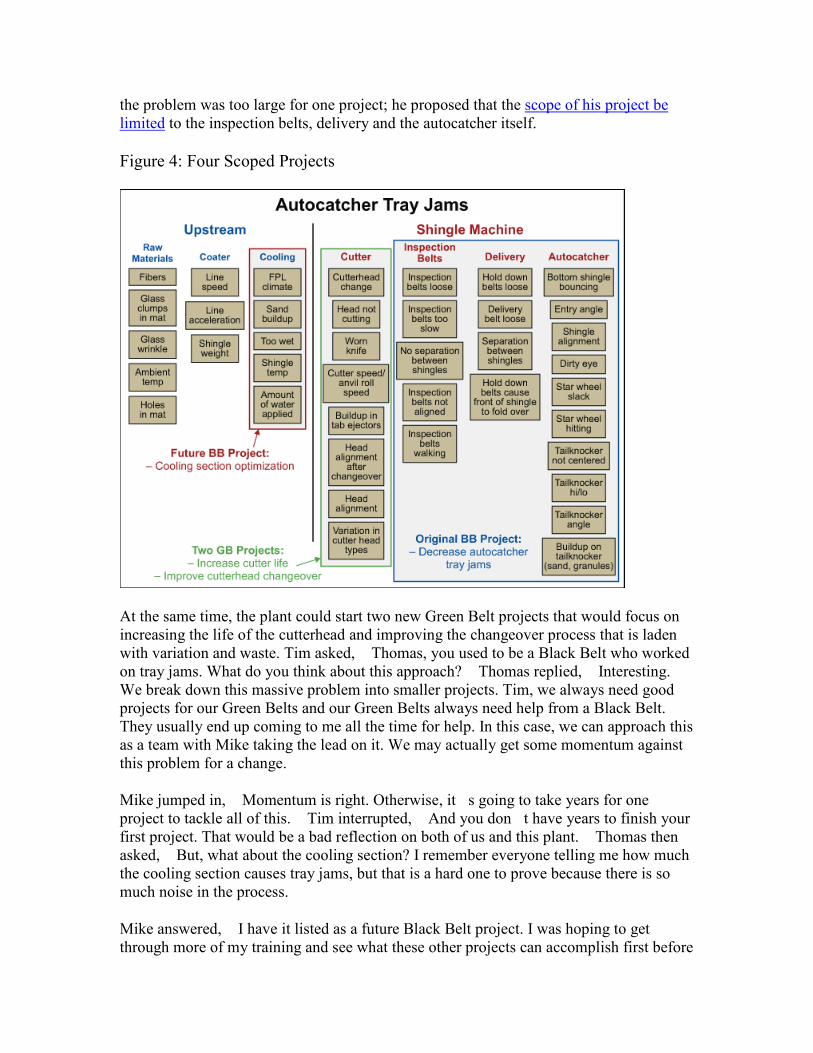
the problem was too large for one project; he proposed that the scope of his project be
limited to the inspection belts, delivery and the autocatcher itself.
Figure 4: Four Scoped Projects
At the same time, the plant could start two new Green Belt projects that would focus on
increasing the life of the cutterhead and improving the changeover process that is laden
with variation and waste. Tim asked, Thomas, you used to be a Black Belt who worked
on tray jams. What do you think about this approach? Thomas replied, Interesting.
We break down this massive problem into smaller projects. Tim, we always need good
projects for our Green Belts and our Green Belts always need help from a Black Belt.
They usually end up coming to me all the time for help. In this case, we can approach this
as a team with Mike taking the lead on it. We may actually get some momentum against
this problem for a change.
Mike jumped in, Momentum is right. Otherwise, it s going to take years for one
project to tackle all of this. Tim interrupted, And you don t have years to finish your
first project. That would be a bad reflection on both of us and this plant. Thomas then
asked, But, what about the cooling section? I remember everyone telling me how much
the cooling section causes tray jams, but that is a hard one to prove because there is so
much noise in the process.
Mike answered, I have it listed as a future Black Belt project. I was hoping to get
through more of my training and see what these other projects can accomplish first before
I tackle that one. Thomas then agreed, That makes sense. I bet your project and these
other two Green Belt projects can clear the noise out of the process to the point where we
could start seeing clearer signals from the effect of sheet temperature on tray jams.
Defining Scope Is Critical
Mike s story shows a critical approach to defining scope that many Green Belts and
Black Belts neglect during Define. Project cycle time and success hinge upon an upfront
understanding of the problem and of what a Belt is trying to accomplish. Mike was able
to balance his scope, time and resources by using an affinity diagram. Using the affinity
diagram in the Define phase enabled Mike to:
1. Understand how broad a problem the project was trying to solve.
2. Define the project s scope into a manageable chunk that could be addressed
within the allotted time and resources.
3. Break down a large, complex problem into several smaller, manageable subsets.
Once he established the scope of his project, Mike was able to separate the
different problem areas into GB projects that would work alongside his BB
project. He was also able to identify future projects that he could tackle after
initial successes had reduced the noise in the current process.