an agent-based travel demand model system for hurricane
TRANSCRIPT

An Agent-based Travel Demand Model System for Hurricane
Evacuation Simulation
Weihao Yin
Dissertation submitted to the Faculty of the
Virginia Polytechnic Institute and State University
in partial fulfillment of the requirements for the degree of
Doctor of Philosophy
In
Civil Engineering
Pamela M. Murray-Tuite, Chair
Kathleen L. Hancock
Hesham A. Rakha
Kris F. Wernstedt
October 30, 2013
Falls Church, VA
Keywords: Hurricane Evacuation, Agent-based Modeling and Simulation, Household Behavior
Copyright © 2013, Weihao Yin

An Agent-based Travel Demand Model System for Hurricane Evacuation
Simulation
Weihao Yin
ABSTRACT
This dissertation investigates the evacuees’ behavior under hurricane evacuation conditions and develops
an agent-based travel demand model system for hurricane evacuation simulation using these behavioral
findings. The dissertation econometrically models several important evacuation decisions including
evacuate-stay, accommodation type choice, evacuation destination choice, evacuation mode choice,
departure time choice, and vehicle usage choice. In addition, it explicitly considers the pre-evacuation
preparation activities using activity-based approach. The models are then integrated into a two-module
agent-based travel demand model system.
The dissertation first develops the evacuate-stay choice model using the random-coefficient binary logit
specification. It uses heterogeneous mean of the random parameter across households to capture shadow
evacuation. It is found that the likelihood of evacuation for households that do not receive any evacuation
notice decreases as their distance to coast increase on average. The distance sensitivity factor, or DSF, is
introduced to construct the different scenarios of geographical extent of shadow evacuation.
The dissertation then conducts statistical analysis of the vehicle usage choice. It identifies the contributing
factors to households’ choice of the number of vehicles used for evacuation and develop predictive
models of this choice that explicitly consider the constraint imposed by the number of vehicles owned by
the household. This constraint is not accommodated by ordered response models. Data comes from a
post-storm survey for Hurricane Ivan. The two models developed are variants of the regular Poisson

iii
regression model: the Poisson model with exposure and right-censored Poisson regression. The right-
censored Poisson model is preferred due to its inherent capabilities, better fit to the data, and superior
predictive power. The multivariable model and individual variable analyses are used to investigate seven
hypotheses. Households traveling longer distances or evacuating later are more likely to use fewer
vehicles. Households with prior hurricane experience, greater numbers of household members between 18
and 80, and pet owners are more likely to use a greater number of vehicles. Income and distance from the
coast are insignificant in the multivariable models, although their individual effects have statistically
significant linear relationship. However, the Poisson based models are non-linear. The method for using
the right-censored Poisson model for producing the desired share of vehicle usage is also provided for the
purpose of generating individual predictions for simulation.
The dissertation then presents a descriptive analysis of and econometric models for households’ pre-
evacuation activities based on behavioral intention data collected for Miami Beach, Florida. The
descriptive analysis shows that shopping - particularly food, gasoline, medicine, and cash withdrawal -
accounts for the majority of preparation activities, highlighting the importance of maintaining a supply of
these items. More than 90% of the tours are conducted by driving, emphasizing the need to incorporate
pre-evacuation activity travel into simulation studies. Households perform their preparation activities
early in a temporally concentrated manner and generally make the tours during daylight. Households
with college graduates, larger households, and households who drive their own vehicles are more likely to
engage in activities that require travel. The number of household members older than 64 has a negative
impact upon engaging in out-of-home activities. An action day choice model for the first tour suggests
that households are more likely to buy medicine early but are more likely to pick up friends/relatives late.
Households evacuating late are more likely to conduct their activities late. Households with multiple
tours tend to make their first tour early. About 10% of households chain their single activity chains with
their ultimate evacuation trips. The outcomes of this paper can be used in demand generation for traffic
simulations.

iv
The dissertation finally uses the behavioral findings and develops an agent-based travel demand model
system for hurricane evacuation simulation, which is capable of generating the comprehensive household
activity-travel plans. The system implements econometric and statistical models that represent travel and
decision-making behavior throughout the evacuation process. The system considers six typical evacuation
decisions: evacuate-stay, accommodation type choice, evacuation destination choice, mode choice,
vehicle usage choice and departure time choice. It explicitly captures the shadow evacuation population.
In addition, the model system captures the pre-evacuation preparation activities using an activity-based
approach.
A demonstration study that predicts activity-travel patterns using model parameters estimated for the
Miami-Dade area is discussed. The simulation results clearly indicate the model system produced the
distribution of choice patterns that is consistent with sample observations and existing literature. The
model system also identifies the proportion of the shadow evacuation population and their geographical
extent. About 23% of the population outside the designated evacuation zone would evacuate. The shadow
evacuation demand is mainly located within 3.1 miles (5 km) of the coastline. The output demand of the
model system works with agent-based traffic simulation tools and conventional trip-based simulation
tools.
The agent-based travel demand model system is capable of generating activity plans that works with
agent-based traffic simulation tools and conventional trip-based simulation tools. It will facilitate the
hurricane evacuation management.

v
ACKOWLEDGEMENT
I am indebted to a great number of people who generously offered advice, inspiration and friendship
throughout my time at Virginia Tech.
I am sincerely grateful to my advisor, Professor Pamela Murray-Tuite, for her considerable guidance and
support that helped me through each step of completing my doctoral studies. Her profound knowledge
and professional instructions helped me with understanding the subject, tackling the difficulties I have
encountered. My career has been strongly influenced by her dedication to excellent research work and her
passion for the field of transportation engineering.
Special thanks go to the members of my doctoral advisory committee for their participation and
constructive inputs. I would like to show my gratitude to Professor Kris Wernstedt and Professor
Kathleen Hancock who taught me knowledge and skills in their classes immensely useful during the
course of my doctoral studies. Their kind encouragement, valuable comments and criticism help me
develop my scholarly thinking. My deep gratitude also goes to Professor Hesham Rakha, for his insightful
comments and kind support throughout my graduate studies.
I have benefited from the constructive interactions with Dr. Satish Ukkusuri and Dr. Hugh Gladwin in the
NSF evacuation research project. I also would like to thank my colleagues and friends Zhuojin Wang and
Sirui Liu for their immeasurable assistance in the early stage of my graduate studies.
Last, I would like to express my thanks to my parents, my fiancée Xin Peng and my family who have
been supportive of all the decisions I have made at all the times in my life.
vi
CONTENTS
Abstract ........................................................................................................................................................ iii
Ackowledgement .......................................................................................................................................... v
List of Figures .............................................................................................................................................. ix
List of Tables ................................................................................................................................................ x
CHAPTER 1 INTRODUCTION ............................................................................................................... 1
1.1 Background ................................................................................................................................... 1
1.2 Households’ Decision-Making in the Evacuation Process ........................................................... 3
1.3 The Agent-Based Simulation and the Activity-Based Approach .................................................. 5
1.4 Objectives, Highlights of Contributions, Assumptions and Scope of the Dissertation ................. 7
1.5 Organization of the Dissertation ................................................................................................... 8
CHAPTER 2 LITERATURE REVIEW ................................................................................................... 9
2.1 Evacuate-Stay Decisions ............................................................................................................... 9
2.1.1 Common Influential Factors ............................................................................................... 10
2.1.2 Discussion ........................................................................................................................... 13
2.2 Accommodation Type, Destination Choice, and Departure Time .............................................. 13
2.2.1 Accommodation Type Choice............................................................................................. 13
2.2.2 Destination Choice .............................................................................................................. 14
2.2.3 Departure Time Choice ....................................................................................................... 15
2.2.4 Discussion ........................................................................................................................... 18
2.3 Summary ..................................................................................................................................... 18
CHAPTER 3 THE ECONOMETRIC FORMULATION AND ESTIMATION RESULTS OF THE
EVACUATE-STAY CHOICE MODEL ................................................................................................. 20
3.1 The Mathematical Formulation of the Mixed Logit Model ........................................................ 20
3.2 The Estimation Results of the Evacuate-Stay Model .................................................................. 22
3.2.1 Descriptive Analysis ........................................................................................................... 22
3.2.2 The Random-Parameter Logit Model for Evacuate-Stay Decision .................................... 24
3.3 Examination of The Geographical Extent of Shadow Evacuation .............................................. 27
3.4 Summary ..................................................................................................................................... 33
CHAPTER 4 A STATISTICAL ANALYSIS OF THE NUMBER OF HOUSEHOLD VEHICLES
USED FOR HURRICANE IVAN EVACUATION ............................................................................... 35
Abstract ................................................................................................................................................... 35
4.1 Introduction ................................................................................................................................. 36
4.2 Literature Review ........................................................................................................................ 37

vii
4.3 Overview of the Data .................................................................................................................. 39
4.3.1 Variable Selection ............................................................................................................... 40
4.3.2 Research Hypotheses .......................................................................................................... 40
4.4 Descriptive Statistical Analysis .................................................................................................. 42
4.4.1 Sample Characteristics ........................................................................................................ 42
4.5 Regression Analysis .................................................................................................................... 47
4.5.1 Modeling Methodology ....................................................................................................... 48
4.5.2 Model Estimation Results ................................................................................................... 49
4.5.3 Comparison between Models .............................................................................................. 53
4.6 Conclusions and Future Directions ............................................................................................. 57
4.6.1 Future Directions................................................................................................................. 58
Acknowledgements ................................................................................................................................. 59
CHAPTER 5 PRE-EVACUATION ACTIVITIES FOR HURRICANE EVACUATION: AN
ANALYSIS OF BEHAVIORAL INTENTIONS FROM MIAMI BEACH, FLORIDA .................... 60
Abstract ................................................................................................................................................... 60
5.1 Introduction ................................................................................................................................. 61
5.2 Overview of the Data and Descriptive Statistical analysis ......................................................... 63
5.3 Descriptive Analysis ................................................................................................................... 64
5.3.1 Tour Characteristics, Activity Type and Sequence ............................................................. 64
5.3.2 Tour Travel Mode ............................................................................................................... 69
5.3.3 Tour Scheduling .................................................................................................................. 69
5.3.4 Activity Chaining with Evacuation Trip ............................................................................. 71
5.3.5 Tour Stop Locations ............................................................................................................ 71
5.4 Behavioral Modeling for Pre-Evacuation Activities ................................................................... 72
5.4.1 Out-of-Home Activity Participation Choice ....................................................................... 73
5.4.2 Action Day Choice for the 1st Tour for Out-of-Home Activities ........................................ 78
5.5 Conclusions and Future Directions ............................................................................................. 81
5.5.1 Future Directions................................................................................................................. 83
Acknowledgements ................................................................................................................................. 83
CHAPTER 6 THE SIMULATION MECHANISM AND IMPLEMENTATION OF THE AGENT-
BASED DEMAND MODEL SYSTEM ................................................................................................... 85
Abstract ................................................................................................................................................... 85
6.1 Introduction ................................................................................................................................. 86
6.2 Modeling Framework .................................................................................................................. 89

viii
6.2.1 Overall Agent-based Modeling Framework ........................................................................ 89
6.2.2 Evacuation Decision Module .............................................................................................. 95
6.2.3 Pre-Evacuation Activity Module ...................................................................................... 102
6.3 Simulation Implementation ....................................................................................................... 106
6.3.1 Simulation Algorithm for Generating Disaggregate Predictions ...................................... 106
6.3.2 Software Architecture ....................................................................................................... 108
6.4 Application to the Miami-Dade Area ........................................................................................ 108
6.5 Conclusions and Future Directions ........................................................................................... 113
Acknowledgements ............................................................................................................................... 114
CHAPTER 7 CONCLUSIONS, ENGINEERING SIGNIFICANCE, LIMITATIONS AND
FUTURE DIRECTIONS ....................................................................................................................... 115
7.1 Conclusions ............................................................................................................................... 115
7.2 Engineering Significance, Contributions and Limitations ........................................................ 119
7.3 Future Directions ...................................................................................................................... 120
REFERENCES ........................................................................................................................................ 122
ix
LIST OF FIGURES
Figure 3.1 The Probability of Evacuation under Different Distance Sensitivity Factor (DSF) for a
Potential Shadow Evacuation Household ................................................................................................... 29
Figure 3.2 The Geographical Distribution of the Evacuation Population, DSF = 100% (Darker red
indicates more evacuees) ............................................................................................................................ 30
Figure 3.3 The Geographical Distribution of the Evacuation Population, DSF = 40% (Darker red indicates
more evacuees)............................................................................................................................................ 31
Figure 3.4 The Geographical Distribution of the Evacuation Population, DSF = 0% (Darker red indicates
more evacuees)............................................................................................................................................ 32
Figure 4.1 Predicted Shares for the Two Regression Models ..................................................................... 55
Figure 4.2 The Simulated Share for the Entire Sample .............................................................................. 56
Figure 6.1 The Structure of the Evacuation Decision Module .................................................................... 92
Figure 6.2 The Structure of the Activity Generation Sub-Module ............................................................. 93
Figure 6.3 The Structure of the Passenger Household Assignment Sub-Module ....................................... 94
Figure 6.4 The Structure of the Activity Scheduling Sub-Module ............................................................. 95
Figure 6.5 The Geographical Distribution of the Evacuation Population (Darker red indicates more
evacuees) ................................................................................................................................................... 110
Figure 6.6 The Comparison between Simulated and Reported Departure Time Curve............................ 111
Figure 6.7 24-Hour Cumulative Vehicle Count for Tuesday under All-or-Nothing Assignment ............ 112

x
LIST OF TABLES
Table 2.1 Factors Tied to Feeling Unsafe ................................................................................................... 11
Table 2.2 Socio-Demographic and Economic Factors Associated with the Evacuate/Stay Decision ........ 12
Table 2.3 Summary of Influential Factors for Departure Time Choice ...................................................... 18
Table 3.1 Sample Characteristics of Explanatory Variables and Their Association with the Evacuation
Decision for Hurricane Ivan ........................................................................................................................ 23
Table 3.2 The Parameters of the Normally Distributed Random Coefficients ........................................... 25
Table 3.3 The Estimation Results of the Evacuate/Stay Choice Model...................................................... 26
Table 4.1 Summary of Findings of Vehicle Usage for Permanent Residents in Emergency Evacuation
Literature ..................................................................................................................................................... 38
Table 4.2 List of Variables and Descriptive Statistics ................................................................................ 42
Table 4.3 Cross Tabulation between Vehicle Usage Choice and Vehicle Ownership................................ 44
Table 4.4 Correlation Measures and Results of the Independence Tests for the Explanatory Variables.... 47
Table 4.5 Estimation Results of the Poission Regression Models .............................................................. 53
Table 5.1 Activity Combinations by Number of Tours .............................................................................. 66
Table 5.2 Activity Types at Tour Stops ...................................................................................................... 67
Table 5.3 The Mode Choice, Action Day and Action Time Range of the Tours ....................................... 68
Table 5.4 The Descriptive Statistics of Distance to Home of Tour Stops by Activity Type (In Miles) ..... 71
Table 5.5 Association between Individual Covariates and the Decision to Perform Out-of-home Activities
.................................................................................................................................................................... 76
Table 5.6 Estimation Results of the Model for Out-of-Home Activity Participation Choice ..................... 77
Table 5.7 Estimation Results for the Action Day Choice for Tour 1 .......................................................... 80
Table 6.1 The Estimation Results of the Evacuate/Stay Choice Model...................................................... 97
Table 6.2 The Estimation Results of the Accommodation Type Choice Model, Local/Out-of-Miami
Destination Choice Model, Departure Time Choice Model and Out-of-Home Activity Participation
Choice Model .............................................................................................................................................. 99
Table 6.3 Estimation Results of the Vehicle Usage Choice Model and Action Day Choice Model for the
First Tour .................................................................................................................................................. 101
Table 6.4 Comparison of Distributions of Evacuation Decisions ............................................................. 109

1
CHAPTER 1 INTRODUCTION
1.1 BACKGROUND
Hurricanes are the most costly and arguably the most frequent natural disasters in the United States
(National Science Board, 2007). Facing the profound danger, many residents of the coastal areas and
adjacent inland areas respond by relocating from their residences to sites they believe will be safer either
under the mandatory orders of the emergency agency or due to their own judgment. This evacuation
results in some of the worst traffic conditions, due to intense demand generated in a very short time
(Murray-Tuite et al., 2012b).
Hurricane evacuation is a highly complex and dynamic process, which is generally modeled by using
simulation-based tools (Barrett et al., 2000; Pel et al., 2012). These simulation models can be applied to
obtain better insights into the effects of traffic regulations and control measures designed for improving
the evacuation process (e.g., contra-flow lanes), by predicting travel times, average speeds, queue lengths,
and traffic flow rates as shown in previous studies by Murray-Tuite et al. (2012a) and Wolshon et al.
(2009). The first step of almost all simulation abstractions of the evacuation process requires an accurate
representation of the evacuation demand, which is governed by many factors such as hurricane trajectory,
hurricane warning system, and characteristics of the evacuees and their households (Baker, 1991a;
Carnegie and Deka, 2010; Gladwin et al., 2001; Urbina and Wolshon, 2003). These factors contribute to
households’ decision-making processes during evacuation and these decision outcomes transform into
evacuation demand. Though the ultimate evacuation trips constitute a large proportion of the evacuation
demand, the evacuation demand also includes trips derived from the pre-evacuation preparation activities,
which many evacuation simulation models fail to consider. These pre-evacuation preparation activities
can span several hours or even days and often involve multiple trips between various locations (Wolshon
et al., 2009). These trips generate local traffic that could affect evacuation time. It is therefore essential to
capture these pre-evacuation preparation activities in the simulation model.
2
This dissertation econometrically models several important evacuation decisions and explicitly considers
the pre-evacuation preparation activities in an integrated fashion using an agent-based modeling and
simulation approach. It is essential to understand the evacuees’ behavior comprehensively and thoroughly.
Such understanding will lead to increased accuracy of the demand representation for simulation models
and thus facilitate the development of well-justified evacuation scenarios to identify bottlenecks in the
transportation system and evaluate various traffic management strategies.
The demand is often described in two distinct forms depending on the nature of the simulation model,
namely origin-destination (OD) matrices for trip-based simulation models and activity plans used in
agent-based simulations. The OD matrices are generally obtained from the application of the traditional
four-step model (FSM) with appropriate modifications to the hurricane evacuation. While the
inadequacies of the FSM are well known (e.g., see McNally and Recker (1986)), the major critique of the
FSM has been the lack of valid representation of underlying travel behavior (McNally, 2007b). The
motivation of the activity-based approach is precisely to explicitly recognize and address this inability of
trip-based models to reflect underlying behavior. While trip-based approaches are satisfied with models
that generate trips, activity-based approaches focus on what generated the activities that subsequently
involve travel (McNally, 2007a). A more detailed discussion of the FSM and activity-based approach
along with agent-based simulation models will be provided in Section 1.3.
The remainder of this chapter is organized as follows. Section 1.2 identifies the decisions households
usually encounter throughout the evacuation process and the relationship between these different
decisions. This section also provides a brief discussion as to some important issues that have been ignored
by the existing literature. Section 1.3 continues the discussion of the FSM and activity-based approach
and explains why agent-based simulation with activity-based approach is suitable for hurricane
evacuation modeling, particularly for the modeling of pre-evacuation preparation activity travel. Section
3
1.4 identifies the specific research objectives, highlights of the contributions and scope of this dissertation.
Section 1.5 provides an overview the structure of the dissertation.
1.2 HOUSEHOLDS’ DECISION-MAKING IN THE EVACUATION PROCESS
Regardless of representation form, travel demand is derived from the desire for achieving different goals
like “going to a safer place” and participating in various activities such as “shopping for medicine before
evacuation”. This desire is the common thread of the entire evacuation process and is characterized by a
series of decisions that are generally made at the household level. The decisions generally fall into two
categories, namely the evacuation decisions and pre-evacuation activity travel decisions including activity
generation and scheduling. The first decision, probably the most important one, a household encounters is
to determine whether to evacuate. Some households may receive mandatory evacuation orders issued by
the emergency management agency while some may not. The households do not always comply with the
evacuation order; as Dash and Gladwin (2007) noted, “those expected to evacuate often do not, and those
who should not evacuate (at least in the estimation of emergency managers) often do” (pp. 72). Therefore,
the receipt of evacuation orders is not the only factor that contributes to the evacuate-stay decision.
Moreover, this suggests “shadow evacuation” often occurs. Shadow evacuation is defined as people
evacuating from outside the official evacuation zone (Zeigler et al., 1981). This phenomenon was
observed in many evacuations such as the Three-Mile Island nuclear disaster (e.g., see Cutter and Barnes
(1982)) and Hurricane Floyd. In Hurricane Floyd in 1999, most evacuees cited evacuating because of
notices from public officials. But the later survey results showed that "shadow evacuation" in low risk
areas not told by officials to evacuate was high in almost every location (Sorensen and Vogt, 2006).
However, most previous studies did not consider this phenomenon in the behavioral models. The
literature review in the next chapter will discuss more factors that affect the evacuate-stay decision.
If a household decides to evacuate, they then face a series of decisions. They need to determine the
evacuation accommodations, which generally can be a public shelter, a friend’s home, family members’

4
home or a hotel, among other choices. This decision is generally referred to as the choice of
accommodation type of the evacuation destination, or simply accommodation type choice. With the
accommodation type determined, they need to determine the travel mode, i.e., the evacuation mode
choice. If they would rely upon their personal vehicles, they need to determine how many vehicles to use,
referred to as the vehicle usage choice. While most existing studies recognize the fact that households
generally use more than one vehicle for evacuation, they fail to consider the contributing factors for this
decision. Chapter 4 elaborately discusses the vehicle usage choice for hurricane evacuation. A household
also needs to determine the ultimate evacuation destination in terms of a city or the travel distance and
direction, which are referred to as the evacuation destination choice. The household needs to decide when
they will depart from their home, which is called the departure time choice.
After a household determines their departure time and destination, they usually need time to make
necessary preparations for their ultimate evacuation trips. The preparation time can range from one hour,
several hours or even days (Lindell et al., 2005; Wolshon et al., 2009), some of which involves travel. The
purpose of these trips may include shopping, picking-up family members and friends as suggested in Liu
et al. (In Press). These trips are important to the estimation of the evacuation clearance time since they
may comprise a significant proportion of the traffic (Wilmot and Mei, 2004). However, these trips are
generally ignored in the evacuation modeling due to the lack of relevant data (Noltenius and Ralston,
2010; Wilmot and Mei, 2004). From the perspective of an activity-based approach, the generation and
scheduling of the pre-evacuation activity travel involves several dimensions of decision-making. The
household needs to determine the activities they need to pursue, the travel pattern for these activities
which refers to the sequence of the tours and stops. They also need to decide when to make the tour and
choose the destination for each stop among the candidate destinations. A household typically needs to
make the decisions aforementioned during the planning horizon defined as the duration from the start of
the modeling horizon until their chosen departure time for their evacuation trip.

5
After a household embarks on the ultimate evacuation trip, the most important decision is the routing
choice. A household’s route choice is usually made based on the distance to the destination of different
routes, past travel time experience, and household characteristics. Generally, the route choice can be
classified into three distinct patterns based on the timing of the choice namely, pre-trip route choice, en-
route route choice and hybrid route choice (Murray-Tuite et al., 2012b; Pel et al., 2012). Pre-trip route
choice assumes that evacuees’ determine their routes based on their experience prior to departure and
never switch to another route during the entire trip. Chiu and Mirchandani (2008) argued the evacuees’
tend to choose familiar routes, which is supported by Dow and Cutter (2002a) and Murray-Tuite et al.
(2012b). An application of this route choice pattern for a sufficient number of iterations will result in the
user equilibrium (Wardrop, 1952). Under the en-route choice assumption, evacuees would observe
prevailing traffic conditions as they travel and make route choices accordingly at every possible decision
point (e.g., intersection). Mitchell and Radwan (2006) applied this routing scheme in evacuation
simulation using the INTEGRATION simulation package (Rakha and Van Aerde, 2004). The hybrid
route choice captures the possibility that evacuees deviate from the route selected prior to departure when
they perceive another route to be better due to current conditions. This route choice model is used in
simulation packages such as DYNASMART (Mahamassani, 2001) and Dynus-T (Chiu et al., 2010).
1.3 THE AGENT-BASED SIMULATION AND THE ACTIVITY-BASED APPROACH
As discussed in previous sections, households typically encounter a series of related decisions. Agent-
based modeling and simulation (ABMS) is a useful approach to represent this dynamic and complicated
decision-making process. The ABMS methodology views systems as autonomous agents that can interact
with each other and with the artificial surrounding environment (North and Macal, 2007). In ABMS, an
agent is an entity with a set of attributes and behavioral characteristics. The attributes define an agent’s
identity and the behavioral characteristics define what an agent does (North and Macal, 2007). For
instance, if a household is modeled as an agent, some typical attributes include household size, number of
children, number of seniors, etc. Agents’ behavioral features can include decision rules to select actions,

6
adaptation capabilities to learn from experiences, perceptual capabilities to sense its surroundings, and
optional internal mechanisms to project the possible consequences of decisions (North and Macal, 2007).
The advantages of the ABMS framework over other approaches in evacuation modeling are threefold.
First, the agent is a useful abstraction capable of handling taste variation in decision-making. Second,
ABMS can capture the evacuation decisions and preparation activity travel in a consistent and integrated
manner. Finally, agents can interact with the external environment, such as hurricane characteristics and
corresponding evacuation policies like evacuation zone designation. These advantages are further
discussed in Chapter 6.
The activity plan, the output of the agent-based demand model system, describes the evacuation demand
derived from evacuation-related decisions (e.g., evacuate-stay, departure time and etc.) and decisions
regarding the pre-evacuation preparation activity travel. The activity plans for the pre-evacuation
preparation activity travel are typically produced using the activity-based demand modeling approach.
The activity-based approach is consistent with the output specifications of the activity plan in that it
focuses on the patterns of activity participation instead of individual trips. The travel that is required by
the activity participation can be understood and modeled only within the context of an activity
participation agenda. In other words, the activity-based approach deals directly with the more
fundamental desires for activities and schedules these activities according to decision entities’
characteristics (McNally, 2007a). The activity-based approach is applied in Chapter 5 to understand the
behavioral characteristics of the pre-evacuation activity travel. An example activity plan reads as follows.
For the 5-individual household stay home from midnight till 7 AM (they are sleeping) on Tuesday, then
drive to shopping at 8:20 AM and then embark on a five hour journey to their evacuation destination.

7
Though the activity plans assume a very distinct appearance from the OD matrices, the activity-based
approach can also produce OD matrices via appropriate aggregation, which is consistent with McNally’s
claim (2007a) that the conventional trip-based approach is a special case of the activity-based approach.
1.4 OBJECTIVES, HIGHLIGHTS OF CONTRIBUTIONS, ASSUMPTIONS AND SCOPE OF
THE DISSERTATION
The overall objective of this dissertation is to understand and capture the households’ evacuation behavior
with the purpose of integrating these behavioral findings into an agent-based demand model system.
Upon the identification of the possible improvements upon existing studies in Section 1.2, the highlights
of the contributions this dissertation makes are as follows:
This dissertation develops an evacuate-stay choice model that explicitly captures shadow-
evacuation demand, which leads to a more realistic representation of the evacuate-stay choice.
It also models the number of vehicles choice by statistically examining various explanatory
factors, which has never been done by existing literature.
It explicitly models pre-evacuation trips using the activity-based approach. The incorporation of
the pre-evacuation trips, which has never been explicitly modeled by previous studies, enhances
the accuracy of the representation of the demand patterns.
The proposed system is the first agent-based comprehensive evacuation demand model system. It
enjoys the flexibility of incorporating additional decisions and using different decision order. The
proposed system can provide demand input for both trip-based and agent-based traffic simulation
tools.
The scope of the dissertation corresponds to the above research tasks. Six evacuation decisions are
captured, namely the evacuate-stay choice, accommodation type choice, evacuation destination decision,
evacuation mode decision, vehicle usage choice and departure time choice. In this dissertation, it is
assumed that the children in a household are picked up as usual and this is not considered in the picking-
up activity later analyzed in Chapter 5 for the pre-evacuation activity travel. Households may perform
8
tours in addition to the ones analyzed in this dissertation to follow their daily routines. The tours reported
might be considered as the additional tours made for evacuation preparations. All the pre-evacuation
activity travel decisions related to these tours will be included in the research scope while the
specifications of the model components depend on the available survey data.
1.5 ORGANIZATION OF THE DISSERTATION
The remainder of the dissertation contains six chapters. Chapter 2 provides the review of the literature on
household evacuation decisions and a discussion of the gaps. The studies about evacuation due to events
other than hurricane are also included for certain decisions. Chapters 3 to 6 are organized according to the
two categories of households’ decisions, namely evacuation decisions and pre-evacuation activity travel
decisions. Chapter 3 presents the econometric formulation and estimation results of the evacuate-stay
choice model. Chapter 4 provides a paper entitled “A Statistical Analysis of the Number of Household
Vehicles Used for Hurricane Ivan Evacuation”, which has been accepted for presentation in the 93rd
Annual Meeting of the Transportation Research Board. Chapter 5 provides a paper entitled “Pre-
Evacuation Activities for Hurricane Evacuation: An Analysis of Behavioral Intentions from Miami Beach,
Florida”, which serves as the behavioral foundation for the pre-evacuation activity travel decisions. This
paper has also been accepted for presentation in the 93rd
Annual Meeting of the Transportation Research
Board. Chapter 6 presents a paper entitled “An Agent-based Travel Demand Model System for Hurricane
Evacuation Simulation”. It presents the behavioral models for evacuation decisions including
accommodation type choice, evacuation destination choice, evacuation mode choice and evacuation
departure time choice. It also identifies the interdependence between all six evacuation decisions and
sketches the simulation framework that uses the behavioral models and findings derived in Chapters 3 to
5 for generating activity plans. This paper has been presented at the Conference of Agent-based Modeling
and Simulation in October, 2013. Chapter 7 summarizes and concludes the dissertation by identifying the
major contributions.

9
CHAPTER 2 LITERATURE REVIEW
Evacuation modeling is a broad and very active research field. A comprehensive discussion of the topic of
evacuation modeling is beyond the scope of this chapter. Several papers provide relatively comprehensive
literature review for different branches of the evacuation modeling. The review paper by Pel et al. (2012)
provides an overview of the behavioral models used in trip-based simulation models from the perspective
of the conventional four-step model. They focused on how travelers’ decisions are predicted through trip-
based simulation regarding the choice to evacuate, departure time choice, destination choice, and route
choice. They supported the modeling of departure time choice in a disaggregate fashion as in this
dissertation instead of the use of departure curve and argued in favor of hybrid route choice models.
Murray-Tuite and Wolshon (2013b) surveyed research, model development and practice in highway-
based evacuation. Their review included modeling of evacuation travel demand, distribution and
assignment of evacuation demand to regional road networks to reach destinations, assignment of evacuees
to various modes of transportation, and evaluation of alternative management strategies to increase
capacity of evacuation networks or manage demand. They also highlighted some special considerations
such as hospitals and logistical difficulties.
The subsequent sections discuss the previous research efforts that are closely related to this dissertation.
Specifically, the literature review is organized according to the different decisions identified in the
previous chapter. First, the studies on evacuate-stay decision will be discussed in Section 2.1 and then
Section 2.2 will survey the researches on accommodation type choice, evacuation destination choice and
departure time choice. The literature on vehicle usage choice will be reviewed in Chapter 4 and that on
pre-evacuation activity travel is discussed in Chapter 5. Chapter 6 will discuss some agent-based
simulation applications in the literature. Section 2.3 provides concluding remarks for the chapter by
highlighting some of the gaps in the literature that are addressed in this dissertation.
2.1 EVACUATE-STAY DECISIONS
10
(Sections 2.1.1 and 2.1.2 are taken verbatim from the paper by Yin et al. (2012a) and is written by Dr.
Pamela Murray-Tuite.)
A large body of literature is devoted to identifying factors associated with the decision to evacuate/ stay
when a hurricane threatens an area. The studies typically involve conducting a survey of residents for
their anticipated behavior to a hypothetical hurricane scenario or their revealed behavior after a real
hurricane has struck. The goals of these studies are usually to identify the factors that are prevalent or
statistically significant to predicting the evacuate/stay outcome. From the social sciences perspective, the
study may end at that point, while studies involving transportation modeling may then take those factors
and models and apply them to the population to generate estimates of the total amount of evacuees. The
review will start with the common influential factors whose effects were investigated in the previous
studies. Section 2.1.2 will provide discussion as to what this dissertation considers as an improvement
upon the previous research efforts.
2.1.1 Common Influential Factors
The most common reason for evacuating is that the individuals/households do not feel safe remaining in
their homes (Arlikatti et al., 2006; Baker, 1979, 1991a; Bateman and Edwards, 2002; Fitzpatrick and
Mileti, 1991; Peacock et al., 2005). The perception of being at risk may be directly captured by a survey
question but is difficult to extend to the population, leading researchers to capture measures hypothesized
to relate to this perception, such as those shown in Table 2.1.

11
Table 2.1 Factors Tied to Feeling Unsafe
Factor
Effect on
Likelihood of
Evacuating
Sources
Receiving a warning Increases
(Baker, 1979, 1991a; Gladwin and Peacock, 1997;
Hasan et al., 2011; Lindell et al., 2005; Zhang et
al., 2007)
Distance to the hurricane
(closer) Increases (Carnegie and Deka, 2010)
Storm intensity Increases (Whitehead, 2000; Zhang et al., 2007)
Living in a mobile home Increases (Baker, 1991a; Hasan et al., 2011; Solis et al.,
2010; Whitehead, 2000; Wilmot and Mei, 2004)
Living in a low-lying area Increases (Baker, 1991a; Solis et al., 2010; Whitehead et al.,
2000)
Frequent experience Decreases (Anderson, 1968)
Previous experience Insignificant (Arlikatti et al., 2006; Dow and Cutter, 1998)
Previously experienced damage Increases (Peacock et al., 2005; Riad et al., 1999)
Previously evacuated Increases (Murray-Tuite et al., 2012b; Riad et al., 1999)
Duration of residence (longer) Decreases (Gladwin and Peacock, 1997)
As shown in Table 2.1, many of the factors have the intuitive effect. Official evacuation orders (issued
and received) alert the public to the threat and increase the likelihood of evacuation. Proximity to the
hurricane intensifies the threat and also increases the chances of being directly impacted, which
encourages evacuation, as does greater storm intensity. Mobile homes are more vulnerable to wind
damage while residences in low-lying areas are more vulnerable to storm surge and flooding, thus, these
residents are more likely to evacuate.
The effects of experience can be mixed (Lindell and Perry, 2000) and can depend on the type of
experience queried. Frequent experience has been found to decrease the likelihood of evacuating (e.g.
(Anderson, 1968)) due to the development of a “disaster culture”. This culture could also be associated
with living in the same area for a longer duration. Previous experience on its own often (but not always)
shows insignificant effects on the decision to evacuate/stay, suggesting that respondents are not likely to
consider officials to "cry wolf" - issue an evacuation order when it is not needed (Dow and Cutter, 1998).
However, if the home was previously damaged, the likelihood of evacuating increases as the previous
impacts increase the risk perception. Finally, if households previously evacuated, they are likely to

12
evacuate again in the future (Murray-Tuite et al., 2012a; Riad et al., 1999) perhaps due to inherent risk
perceptions.
Some of the inherent perceptions of risk and hazards may be tied to socio-demographic and economic
factors, such as those shown in Table 2.2, due to access to resources and social power (Peacock et al.,
2005). Social power is often tied to being male and white (Peacock et al., 2005), thus women and
minorities may inherently feel more threatened and have higher likelihoods of evacuating. However, race
is often correlated with income; greater income implies greater access to resources needed for evacuation.
Table 2.2 Socio-Demographic and Economic Factors Associated with the Evacuate/Stay Decision
Factor
Effect on
Likelihood of
Evacuating
Sources
Elderly headed households/
presence of elderly Decreases
(Dash and Gladwin, 2007; Gladwin and Peacock,
1997)
Age (older) Decreases (Lindell et al., 2005)
Gender (female) Increases (Bateman and Edwards, 2002; Lindell et al., 2005;
Peacock et al., 2005; Riad et al., 1999)
Children in the household Increases (Dash and Gladwin, 2007; Gladwin and Peacock,
1997)
Children in the household Insignificant (Baker, 1991a; Riad et al., 1999)
Race/Ethnicity (Caucasian) Increases (Gladwin and Peacock, 1997; Riad et al., 1999)
Race/Ethnicity (Caucasian) Insignificant (Bateman and Edwards, 2002)
Race/Ethnicity (Latino) Increases (Riad et al., 1999)
Income (higher) Increases (Elliott and Pais, 2006; Gladwin and Peacock, 1997;
Hasan et al., 2011)
Single adult household Increases (Riad et al., 1999)
Presence of pets in the
household Insignificant (Baker, 1991a)
Presence of pets in the
household Decreases (Solis et al., 2010; Whitehead, 2000)
Work obligations Decreases (Baker, 1991a)
Other factors reflect logistical challenges. For instance, older individuals may have medical or mobility
challenges that make it difficult for them to evacuate. The presence of children has somewhat mixed
effects since there is a desire to protect them (increasing the likelihood of evacuation) but larger families
may face logistical challenges. Single adult households, on the other hand, are more likely to evacuate as
they often do not face such challenges. Pets may either be insignificant or decrease the likelihood of
13
evacuating due to the difficulty in finding a destination that will accept them or in travelling with them.
Finally, work obligations naturally make individuals less likely to evacuate.
2.1.2 Discussion
The factors investigated in this dissertation largely draw from the factors identified in the previous
literature. This dissertation distinguishes itself from previous ones in that the shadow evacuation
phenomenon that discussed in Chapter 1 is considered explicitly.
2.2 ACCOMMODATION TYPE, DESTINATION CHOICE, AND DEPARTURE TIME
The review is organized into three sub-sections. Section 2.2.1 reviews the studies about accommodation
type choices, followed by destination choice including travel distance and direction in Section 2.2.2. The
last sub-section surveys the researches about departure time choice.
2.2.1 Accommodation Type Choice
The accommodation type at the destination city/town received repeated attention from behavioral
researchers and transportation engineers (Lindell and Prater, 2007b; Mesa-Arango et al., 2012). The
homes of friends and relatives are considered to be the most preferred accommodation type, followed by
hotels. Mei (2002) and Modali (2005) reported percentage ranges of the accommodation type choice in
various surveys. Specifically, 55%~69% of the respondents chose friends’ or relatives’ house, 13%~26%
hotels and 3%~12% public shelters. Similarly, Sorensen (2000) indicated that shelter use averages about
15% among the evacuees.
Econometric methods were used to identify the influential factors that contribute to the accommodation
type choice pattern. Murray-Tuite et al. (2012b) suggested that variables influencing the choice include
hazard severity, income, size of the evacuation, type of emergency, time of the evacuation, age, and
ethnicity (Mileti et al., 1992). Whitehead et al. (2000) reported that households are more likely to choose
the motel/hotel destination if they have higher incomes although the magnitude of the effect is small. For

14
each increase of $10,000 in income, the probability of choosing a motel/hotel increases by only 2%.
Respondents who live in mobile homes, who perceive medium to high flood risk, who have pets, who are
white and with more education are less likely to choose a motel/hotel, compared to staying with friends or
family (or other). Brodie et al. (2006) made similar observations by reporting that people with higher
income and education level are more likely to evacuate to hotels while people with less financial
resources tend to evacuate to shelters based on the revealed-preference survey on Katrina evacuees. A
later study (Carnegie and Deka, 2010) supported this finding by relating the socio-economic and
demographic characteristics to evacuation accommodation type choice using a stated-preference survey.
Similarly, Mesa-Arango et al. (2012) constructed a nested logit model and found that the variables
influencing the accommodation type choice include hurricane position at evacuation time, household
geographic location, race, income, preparation time, changes in evacuation plans, previous experiences
with major hurricanes, household members working during the evacuation, and evacuation notices.
2.2.2 Destination Choice
Though the travel distance is generally recognized as an important factor for destination type choice,
studies of the destination choice, i.e. travel distance and direction, are quite limited. Southworth (1991)
concluded that evacuees’ destination choice displayed the following characteristics: (1) They choose the
closest destination (in terms of distance or travel time) beyond the at-risk area; (2) They head for pre-
specified destinations according to an established evacuation plan; (3) They display some degree of
dispersion in their selection of destinations, depending on factors such as the location of friends and
relatives, characteristics of the hazard, and the traffic conditions on the network.
Echoing the first category of destination choice, Barrett et al. (2000) stated the destination choice was
affected by the perceived minimal travel cost without identifying specific factors. Murray-Tuite et al.
(2012b) studied the tendency of repeated choice in the travel distance for hurricanes Ivan and Katrina
only vaguely by discerning county/out-of-county destinations.

15
For the purpose of modeling hurricane evacuation, many previous studies modified the techniques that are
generally used for regular transportation planning like gravity models. Wilmot et al. (2006) compared the
ability of standard trip distribution models, namely the Gravity Model and Intervening Opportunity
Model (IOM), to reproduce the observed evacuation trips at the county level using data collected from
South Carolina following Hurricane Floyd. Later, Cheng (2007) proposed a scheme for calibrating the
friction factor used in the gravity model to incorporate the characteristics of the different destination
zones. Cheng et al. (2008) applied this adjusted friction factor together with the gravity model to estimate
the trip distribution for hurricane evacuation. They later integrated the gravity-based trip distribution
model with trip generation to obtain the dynamic origin-destination matrices that described the aggregate
trip-based travel distance and direction. Cheng and his colleagues reported that their models reproduced
the observed traffic volumes at major routes with the traffic assignment accomplished by TransCAD and
later their destination choice model was used in a simulation study of the Hurricane Katrina for the city of
New Orleans (Wolshon et al., 2009). However, they reported that traffic volumes on certain roads did not
match well to the observed ones.
Recognizing the inherently different characteristics of each household, Huang (2011) applied the
Geographically Weighted Regression model to predict the travel distance and identified income and
number of children as influential factors.
2.2.3 Departure Time Choice
(This sub-section is taken verbatim from the paper by Yin et al. (2012b) and is written by Weihao Yin)
Most of the previous studies related to departure time focused on developing aggregate empirical
distributions of the departure time, which describes the rate of vehicles’ entry into the emergency
planning network. This distribution, or response curve, explicitly offers the percentage of departures in
each time interval of the planning horizon (Pel et al., 2012). These studies assumed a variety of shapes for

16
the departure time distributions. A widely-accepted distribution is the sigmoid curve which is similar to
the cumulative normal distribution (Radwan et al., 1985; Yazici and Ozbay, 2008). The sigmoid curve,
commonly used for hurricane evacuation modeling (e.g., (Wolshon et al., 2009)), is characterized by two
parameters, namely the response rate and half loading time. The response rate sets the slope of the curve
and low values for this parameter lead to a more uniform departure profile (Pel et al., 2012). The half
loading time dictates the time at which half of the total evacuees depart. These two parameters need to be
calibrated to achieve realistic representation of the departure behavior. Other notable examples in
different application scenarios include the instantaneous departure in short-notice evacuation (Chiu and
Mirchandani, 2008), uniform distribution (Liu et al., 2006) and Weibull distribution (Lindell, 2008) in
hurricane evacuation, Rayleigh distribution (Tweedie et al., 1986) and exponential distribution (Hobeika
et al., 1994) in nuclear disaster, Poisson distribution in wildfire evacuation (Cova and Johnson, 2002), and
piece-wise linear curve in flooding (Southworth and Chin, 1987).
A few studies investigated the effects of various household and/or personal characteristics on the
evacuation timing behavior. Sorensen (1991) made one of the earliest attempts to explain evacuation
timing behavior by using path analysis for an evacuation in response to the hazardous chemical incident.
Factors considered included three socio-demographic characteristics, namely age, household size and
residence type. The analysis found that neither age nor family size influenced the evacuation timing
behavior. The residence type variable was found to have statistically significant but weak impact upon the
timing of warning receipt and subsequently the evacuation timing. Face-to-face warning dissemination
was found to decrease the mobilization time before evacuation. A later study (Barrett et al., 2000)
mentioned the possible effect of different covariates such as productivity, comfort, and perceived safety
upon the departure timing choice but did not investigate these factors. They also recognized the possible
connection between the departure time choice and destination choice. Lindell et al. (2002) highlighted the
regional difference in the departure timing choice attributed to risk levels and traffic conditions.

17
In addition to the studies that examined the departure time choice alone, other studies considered the
departure time choice together with other dimensions of the evacuation decision-making process. A
notable study by Fu and Wilmot (2004) developed a sequential logit choice model, where they assumed
that each household examined the surrounding conditions when a hurricane approaches. The model
simultaneously considered evacuate/stay and departure timing decisions with dynamic hurricane
characteristics, such as speed and household’s distance to the hurricane track. Other factors included the
residence type and evacuation warning receipt. Fu and Wilmot (2006) later adopted a hazard-based
modeling approach to understand decisions of whether to evacuate or not and when to evacuate as a joint
model. They found that a mandatory evacuation order shortened the duration until evacuation and wind
speed did the same. Later, Wilmot and his colleagues adopted the theory of risk attitude in economics to
jointly model the evacuate/stay decision and departure time (Dixit et al., 2012). In addition, they
compared the sequential-logit approach to the nested logit approach for the evacuate/stay decision and
departure time (Gudishala and Wilmot, 2012b). Their studies investigated the dynamic aspect of the
decision-making process by incorporating time-dependent covariates. Factors including length of time
spent in a region, evacuation warning type, and the presence of children were found to affect the
evacuation decisions. Echoing these findings, the households that depart late, considered the “evacuation
tail” (Wolshon et al., 2010), were found to need disproportionally longer pre-evacuation preparation time.
Recently, Hasan et al. (2013a) adopted a hazard-based model with random parameters to capture the
possible heterogeneity among the evacuation population. They found that the variables related to
household location, destination characteristics, socio-economic characteristics, and evacuation notice
were key determinants of the departure time. A summary of influential factors for departure time choice is
provided in Table 2.3.

18
Table 2.3 Summary of Influential Factors for Departure Time Choice
Factor Effect on Likelihood of an
Early Evacuation Sources
Socio-Demographic Characteristics
Age Not significant (Sorenson, 1991)
Presence of Children Increase (Hasan et al., 2011a), (Huang, 2011)a
Presence of Senior Citizens Not significant (Sorenson, 1991)
Household Size Not significant (Sorenson, 1991)
Single Family Home Increase (Sorenson, 1991)
Mobile Home Decrease (Hasan et al., 2011a)
Residential Region Mixed (Lindell et al., 2002)
Low Income Decrease (Hasan et al., 2011a), (Gudishala and
Wilmot, 2012), (Huang, 2011)a
High Education Level Decrease (Hasan et al., 2011a)
Evacuation-related Characteristics
Mandatory Evacuation Order Increase
(Fu and Wilmot, 2004; Hasan et al.,
2011a), (Gudishala and Wilmot,
2012)
Evacuation to a Shelter Decrease (Hasan et al., 2011a)
Long Evacuation Preparation Time Decrease (Hasan et al., 2011a; Wolshon et al.,
2010)
Storm Characteristics
Small Hurricane Distance Increase (Fu and Wilmot, 2004, 2006)
High Hurricane Speed Increase (Fu and Wilmot, 2004, 2006) a The study that identified the corresponding factor as influential one for evacuation distance
2.2.4 Discussion
While mathematically simple, the response curve approaches are typically used for short evacuation (e.g.,
several hours) (Fu and Wilmot, 2006) and do not allow the incorporation of the socio-demographic
characteristics of the evacuees (Pel et al., 2012). In addition, aggregate response curves sometimes fail to
reproduce the multiple-S shape of the evacuation departures observed in many hurricane evacuations.
Precisely due to these reasons, this dissertation adopts the disaggregate approach to model the households’
departure time choice directly.
2.3 SUMMARY
To summarize, a large body of previous studies has focused on evacuation behaviors and provided rich
and valuable contributions to the field. However, there are still some gaps that need to be filled for the
decisions reviewed in this chapter. The dissertation is motivated to capture the shadow-evacuation
demand. In addition, this dissertation adopts a disaggregate approach to model the households’ departure

19
time choice and integrate this choice with other evacuation decisions and pre-evacuation activity travel
decisions.

20
CHAPTER 3 THE ECONOMETRIC FORMULATION AND
ESTIMATION RESULTS OF THE EVACUATE-STAY CHOICE
MODEL
This chapter presents the econometric formulation and empirical estimation results of the evacuate-stay
choice. The evacuate-stay decision, probably the most important one for people affected by a hurricane,
has been studied extensively by both social scientist and transportation researchers. Many factors are
involved in the decision to evacuate (Gladwin et al., 2001). These factors include not only emergency
management practices (e.g., evacuation warning) but household socioeconomic and demographic
characteristics (Murray-Tuite and Wolshon, 2013b). As mentioned in Chapter 1, households may or may
not comply to evacuation orders issued by the emergency management agency, which results in the
“shadow evacuation” phenomenon. This stochastic component in the decision-making process is captured
by the specification of a random-parameter binary logit model. More specifically, information on
households’ receipt of evacuation recommendations and their socioeconomic characteristics are used to
develop a better understanding of household evacuation behavior.
This chapter is organized as follows. Section 3.1 presents the econometric formulation, followed by the
presentation and discussion of the results of descriptive analysis of the Hurricane Ivan data and the
empirical estimation results in Section 3.2. Section 3.3 introduces the distance sensitivity factor that can
be used to construct scenarios with different geographical extent of shadow evacuation. Section 3.4
summarizes the major findings in this chapter.
3.1 THE MATHEMATICAL FORMULATION OF THE MIXED LOGIT MODEL
The dichotomous outcome of the evacuate-stay decision is well captured by the binary logit model as
discussed in Hasan et al. (2011) and Yin et al. (2012a).( See Section 2.1 of Chapter 2 for a comprehensive
review.) Recognizing the fact that the shadow evacuation population generally resides outside of the
designated evacuation zones and usually do not receive any evacuation notice, their evacuate-stay
decisions typically depend on their perceived risk. The perceived risk generally varies from one
21
household to another. This inherent taste variation, as suggested by Train (2002), can be captured using a
random coefficient for those households who do not receive any evacuation notice. In addition,
households who live in areas far from the coast should typically perceive less risk than those who live
close to the coast. To account for this parameter heterogeneity due to different distance to the coast in the
underlying population, the random coefficient can be related to the household’s distance to coast.
The binary logit model with random parameters is usually referred to as the mixed logit model, which
here takes the random coefficient interpretation. Some parameters associated with the covariates are not
deterministic but random variables whose values follow certain probability distributions. A particular
covariate can exhibit heterogeneous effect in the underlying population. When the evacuate-stay decision
is considered, the two alternatives each household encounter are “evacuate” and “stay”. The probability of
evacuation, represented by alternative “1”, is expressed by Eq.(3.1).
[ ] ( ) (3.1)
where () represents the logistic distribution, is the covariate vector for explanatory variables like
household characteristics and is the coefficient vector associated with the covariate vector . The major
distinction of the mixed logit model used here from the regular binary logit model is the inclusion of
covariates for the mean of the random parameters. To allow the mean of the certain random coefficients
in vector to vary across households, the coefficient vector can be parameterized as Eq. (3.2)
according to Greene (2012).
( ) (3.2)
where is a vector that stores covariates related to the mean of the random parameter vector and is
the fixed coefficients for these covariates, is a non-negative definite diagonal matrix and some of its
diagonal elements could be zero for deterministic parameters and is a normal random vector with zero

22
mean and unit variance (Greene, 2012). The mixed logit model is usually estimated by simulated
maximum likelihood as suggested in Train (2002).
3.2 THE ESTIMATION RESULTS OF THE EVACUATE-STAY MODEL
The model is estimated using the Hurricane Ivan survey data. Telephone interviews were conducted with
3,200 households from four states, namely Florida, Alabama, Mississippi, and Louisiana after Hurricane
Ivan made landfall near Gulf Shores in 2004. Information collected included household socio-
demographics, past hurricane experience, and evacuation decisions. Florida International University's
Institute for Public Opinion Research conducted these surveys in English and Spanish with the assistance
of a Computer Assisted Telephone Interviewing system.
3.2.1 Descriptive Analysis
Table 3.1 shows the sample characteristics and the association of covariates with the evacuation decision.
The households’ distances to the coast are calculated using their home coordinates and then normalized
by the maximum distance to derive the relative distance to the coast, denoted by “[reldist]”.

23
Table 3.1 Sample Characteristics of Explanatory Variables and Their Association with the Evacuation
Decision for Hurricane Ivan
Variables Sample Meana
Crude Oddsb
Adjusted Oddsb Likelihood Effect
(Adjusted Odds)
[evac] = 1 44.31% / / /
Socio-Demographics
[bizown] = 1 17.84% 0.831 (0.085)* 0.785 (0.105)*
[mobile] = 1 6.12% 2.566 (0.435)*** 3.476 (0.755)***
[childu17] 0.673 1.194 (0.044)*** 1.148 (0.053)**
[inco80k] = 1 28.70% 1.211 (0.117)** 1.284 (0.147)**
[lthighsc] = 1 5.28% 0.656 (0.120)** 0.599 (0.143)**
[pgrad] = 1 16.50% 1.574 (0.166)*** 1.576 (0.218)**
[reldist] 0.369 0.683 (0.242)*** 0.663 (0.161)*
[pet] = 1 63.90% 0.782 (0.063)** 0.764 (0.081)**
[stateFL] = 1 40.10% 0.366 (0.031)*** 0.353 (0.044)***
Evacuation-Related
[haswkduty] = 1 32.80% 0.917 (0.076) 0.825 (0.088)
[winprotect] = 1 54.23% 0.784 (0.061)** 0.682 (0.069)*
[noevacnt] = 1 54.12% 0.209 (0.017)*** 0.141 (0.019)***
[nonmandnt] = 1 26.27% 1.793 (0.158)*** 0.400 (0.060)***
[mandnt] = 1 19.59% 5.772 (0.650)*** r a. Sample mean for the binary variable expresses the sample distribution. For example, there are 17.84% of the households who own
businesses.
b. Crude odds are derived from uni-variable logistic regression and adjusted odds from multi-variable logit model.
r: Reference category, “” indicates increased likelihood and “” indicates decreased likelihood.
Standard error of odds in parentheses. * ~ p < 0.01, ** ~ p < 0.05, *** ~ p < 0.001
A few socio-demographic factors exhibit statistically significant impact upon evacuation decision.
Households living in mobile homes, though there is only a limited number in the sample, are much more
likely to evacuate than those who do not. Similarly, households that own businesses are less likely to
evacuate possibly due to their concerns of protecting their businesses from post-storm looting.
Households that have pets are less likely to evacuate. Households with higher income and education
attainment are more likely to evacuate. The number of children under 17 also shows a positive impact
upon the evacuation implying that one more child under 17 years old increases the odds of evacuating.
In terms of window protection, the adjusted odds are 0.682 and statistically significant at the 0.1 level,
which suggests that households are less likely to evacuate after they used window protection. The work
duty (“[haswkduty]”) does not exhibit a statistically significant association with the evacuation decision

24
in the single-variable logit model and regular multi-variable logit model. Households that had a member
who had to work during the evacuation may have evacuated locally, evacuated without that member, or
that person may have disregarded that obligation. This covariate is examined again in the next section.
The evacuation notice had different impacts upon the households’ evacuation decisions. The households
that did not receive any evacuation notice ([noevacnt] = 1) are much less likely to evacuate than those
who received mandatory evacuation notice and the crude odds and adjusted odds are highly significant.
Households that received a non-mandatory evacuation notice are less likely to evacuate than those who
receive mandatory notices, which is evidenced by a adjusted odds of 0.4. The effect of the warning
messages will be further explored by using the subsequent random-parameter logit model.
3.2.2 The Random-Parameter Logit Model for Evacuate-Stay Decision
The selection of the variables is guided by the existing literature reviewed in Section 2.1. Normally
distributed random coefficients are associated with three variables: “[haswkdut]”, “[noevacnt],” and
“[nonmandn]”. Here, the normal distribution is used because the covariates’ effects vary around the mean
for the majority of the households and relatively large effects only show for a few households. Since the
random parameters capture the heterogeneity among the household population, random parameters are
first associated with all covariates and then the random coefficients that show statistical insignificance are
set to be fixed parameters. The statistical significance of the mean and variance of the random parameter
associated with “[haswkdut]” leads to its inclusion in the model. The random coefficients of the latter two
variables capture households’ different perceived risk of the approaching hurricane, which contributes to
their evacuate-stay decisions. The model parameters are estimated using NLOGIT 5 and the estimation
results are shown in Table 3.3.
The mean structure of the three random parameters (homogeneous mean or heterogeneous mean) is
determined by including explanatory variables as shown in Eq. (3.2). . The statistically insignificant
explanatory variables, represented by vector z in Eq. (3.2), in the mean of the random parameters are
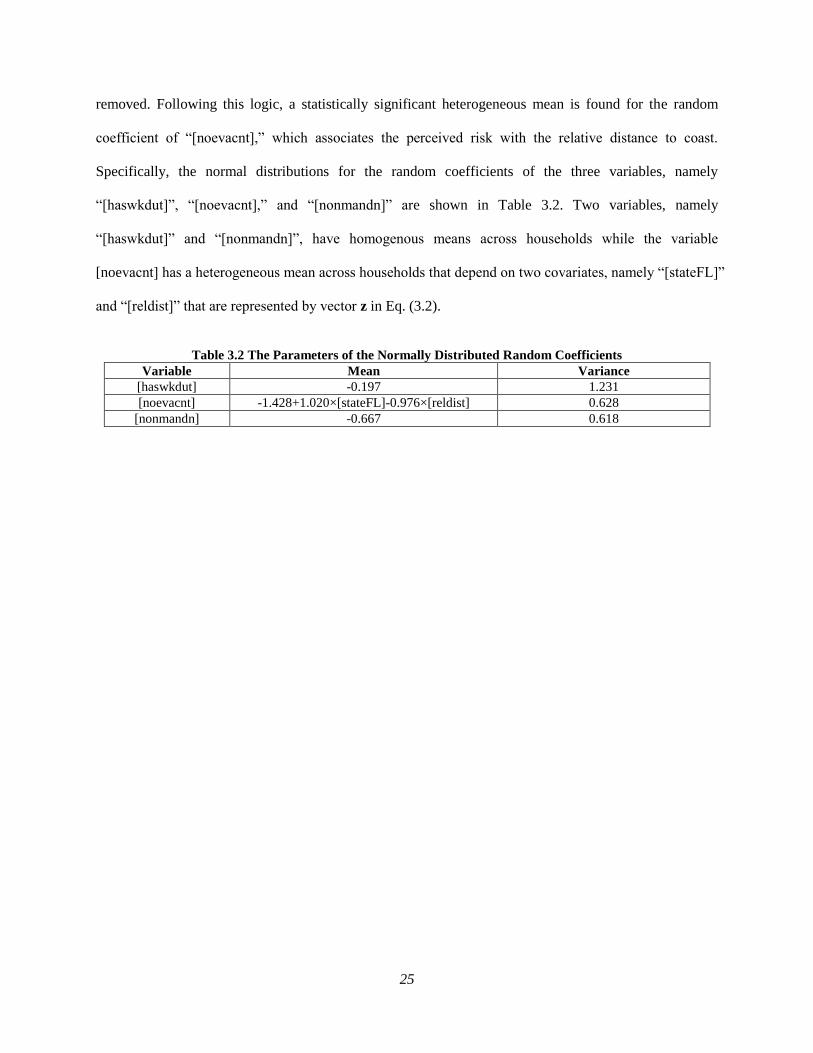
25
removed. Following this logic, a statistically significant heterogeneous mean is found for the random
coefficient of “[noevacnt],” which associates the perceived risk with the relative distance to coast.
Specifically, the normal distributions for the random coefficients of the three variables, namely
“[haswkdut]”, “[noevacnt],” and “[nonmandn]” are shown in Table 3.2. Two variables, namely
“[haswkdut]” and “[nonmandn]”, have homogenous means across households while the variable
[noevacnt] has a heterogeneous mean across households that depend on two covariates, namely “[stateFL]”
and “[reldist]” that are represented by vector z in Eq. (3.2).
Table 3.2 The Parameters of the Normally Distributed Random Coefficients
Variable Mean Variance
[haswkdut] -0.197 1.231
[noevacnt] -1.428+1.020×[stateFL]-0.976×[reldist] 0.628
[nonmandn] -0.667 0.618
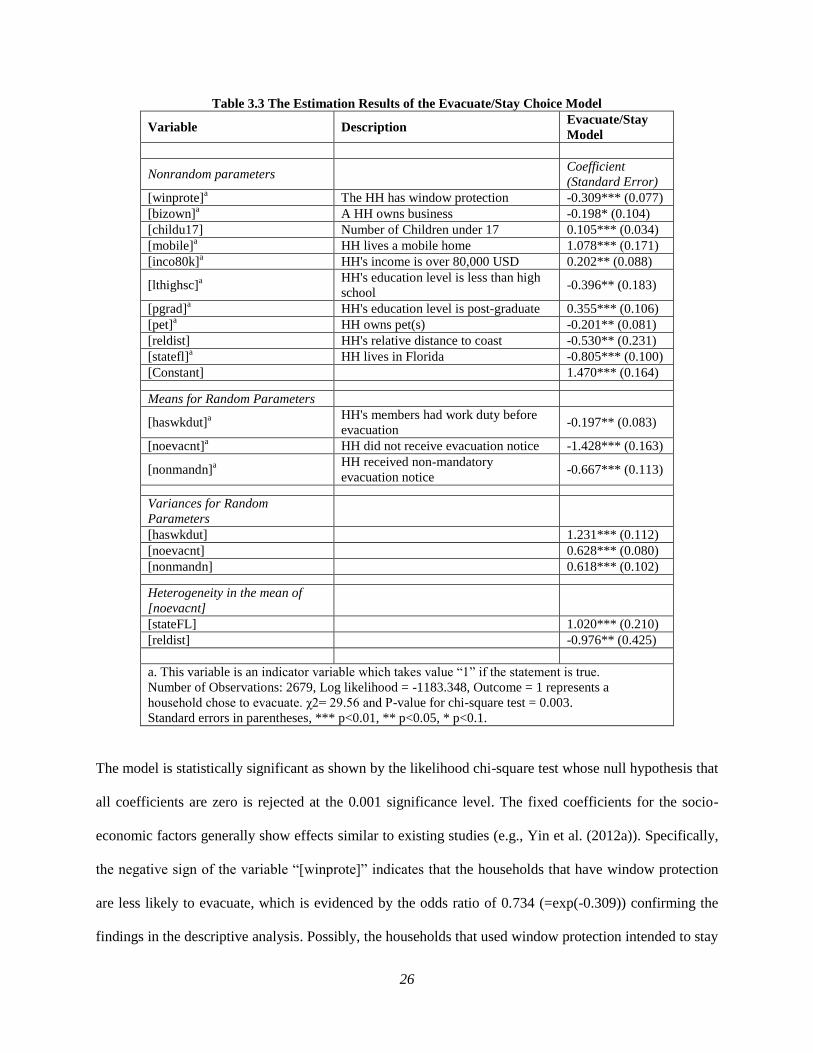
26
Table 3.3 The Estimation Results of the Evacuate/Stay Choice Model
Variable Description Evacuate/Stay
Model
Nonrandom parameters
Coefficient
(Standard Error)
[winprote]a
The HH has window protection -0.309*** (0.077)
[bizown]a A HH owns business -0.198* (0.104)
[childu17] Number of Children under 17 0.105*** (0.034)
[mobile]a HH lives a mobile home 1.078*** (0.171)
[inco80k]a HH's income is over 80,000 USD 0.202** (0.088)
[lthighsc]a
HH's education level is less than high
school -0.396** (0.183)
[pgrad]a HH's education level is post-graduate 0.355*** (0.106)
[pet]a HH owns pet(s) -0.201** (0.081)
[reldist] HH's relative distance to coast -0.530** (0.231)
[statefl]a HH lives in Florida -0.805*** (0.100)
[Constant]
1.470*** (0.164)
Means for Random Parameters
[haswkdut]a
HH's members had work duty before
evacuation -0.197** (0.083)
[noevacnt]a HH did not receive evacuation notice -1.428*** (0.163)
[nonmandn]a
HH received non-mandatory
evacuation notice -0.667*** (0.113)
Variances for Random
Parameters
[haswkdut]
1.231*** (0.112)
[noevacnt]
0.628*** (0.080)
[nonmandn]
0.618*** (0.102)
Heterogeneity in the mean of
[noevacnt]
[stateFL]
1.020*** (0.210)
[reldist]
-0.976** (0.425)
a. This variable is an indicator variable which takes value “1” if the statement is true.
Number of Observations: 2679, Log likelihood = -1183.348, Outcome = 1 represents a
household chose to evacuate. χ2= 29.56 and P-value for chi-square test = 0.003.
Standard errors in parentheses, *** p<0.01, ** p<0.05, * p<0.1.
The model is statistically significant as shown by the likelihood chi-square test whose null hypothesis that
all coefficients are zero is rejected at the 0.001 significance level. The fixed coefficients for the socio-
economic factors generally show effects similar to existing studies (e.g., Yin et al. (2012a)). Specifically,
the negative sign of the variable “[winprote]” indicates that the households that have window protection
are less likely to evacuate, which is evidenced by the odds ratio of 0.734 (=exp(-0.309)) confirming the
findings in the descriptive analysis. Possibly, the households that used window protection intended to stay

27
while those that did not want to stay dismissed the necessity to apply measures to protect the home.
Similarly, households that own businesses are less likely to evacuate as evidenced by the negative
coefficient of covariate “[bizown]” -0.198, possibly due to their concerns of protecting their businesses
from post-storm looting. A similar effect is observed for households who own pets. Households that have
pets are less likely to evacuate possibly due to their accommodation concerns given to the pets’.. In
addition, households in mobile residences are more likely to evacuate with the odds ratio of 2.938
(=exp(1.078)); these residences are more vulnerable to hurricane damage. As expected, households with
higher income and education attainment are more likely to evacuate since these households generally
have better access to resources necessary for evacuation such as means of transportation. Specifically, the
odds ratios for households with income over than $80,000 are approximately 1.3 times as likely to
evacuate and those households with post-graduate degrees holders are almost 1.5 as likely to evacuate.
The number of children under 17 also shows a positive impact upon the evacuation. The odds ratio is
exp(0.105) = 1.11 implying that one more child under 17 years old increases the odds of evacuating.
The effect of an evacuation notice is clearly consistent with existing literature. Households that do not
receive mandatory evacuation notices are less likely to evacuate. The household-level heterogeneity of the
random coefficient for the variable “[noevacnt]” allows households who do not receive any evacuation
notice to assume different distributions for the random parameter depending on their distance to coast as
show in Table 3.2. Specifically, the sign of the relative distance to coast is -0.976 for the mean of the
random parameter of variable “[noevacnt]”, suggesting that the likelihood of evacuation for households
that did not receive any evacuation notice decreases as their distance to coast increase on average.
3.3 EXAMINATION OF THE GEOGRAPHICAL EXTENT OF SHADOW EVACUATION
For the purpose of evacuation planning, the emergency planning agency may need to examine different
shadow evacuation scenarios in terms of the geographical extent. For instance, in no-notice evacuation,
shadow evacuation may occur in the region that fall within a specific distance (e.g., 3 mile) of the
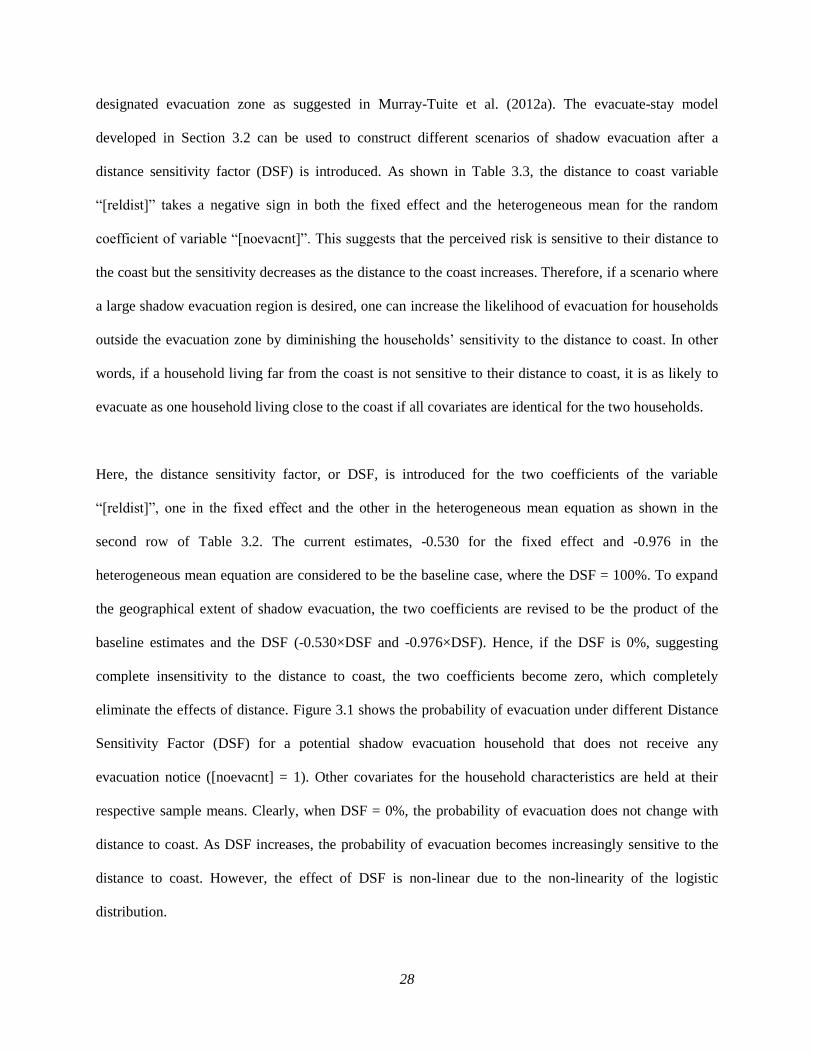
28
designated evacuation zone as suggested in Murray-Tuite et al. (2012a). The evacuate-stay model
developed in Section 3.2 can be used to construct different scenarios of shadow evacuation after a
distance sensitivity factor (DSF) is introduced. As shown in Table 3.3, the distance to coast variable
“[reldist]” takes a negative sign in both the fixed effect and the heterogeneous mean for the random
coefficient of variable “[noevacnt]”. This suggests that the perceived risk is sensitive to their distance to
the coast but the sensitivity decreases as the distance to the coast increases. Therefore, if a scenario where
a large shadow evacuation region is desired, one can increase the likelihood of evacuation for households
outside the evacuation zone by diminishing the households’ sensitivity to the distance to coast. In other
words, if a household living far from the coast is not sensitive to their distance to coast, it is as likely to
evacuate as one household living close to the coast if all covariates are identical for the two households.
Here, the distance sensitivity factor, or DSF, is introduced for the two coefficients of the variable
“[reldist]”, one in the fixed effect and the other in the heterogeneous mean equation as shown in the
second row of Table 3.2. The current estimates, -0.530 for the fixed effect and -0.976 in the
heterogeneous mean equation are considered to be the baseline case, where the DSF = 100%. To expand
the geographical extent of shadow evacuation, the two coefficients are revised to be the product of the
baseline estimates and the DSF (-0.530×DSF and -0.976×DSF). Hence, if the DSF is 0%, suggesting
complete insensitivity to the distance to coast, the two coefficients become zero, which completely
eliminate the effects of distance. Figure 3.1 shows the probability of evacuation under different Distance
Sensitivity Factor (DSF) for a potential shadow evacuation household that does not receive any
evacuation notice ([noevacnt] = 1). Other covariates for the household characteristics are held at their
respective sample means. Clearly, when DSF = 0%, the probability of evacuation does not change with
distance to coast. As DSF increases, the probability of evacuation becomes increasingly sensitive to the
distance to coast. However, the effect of DSF is non-linear due to the non-linearity of the logistic
distribution.
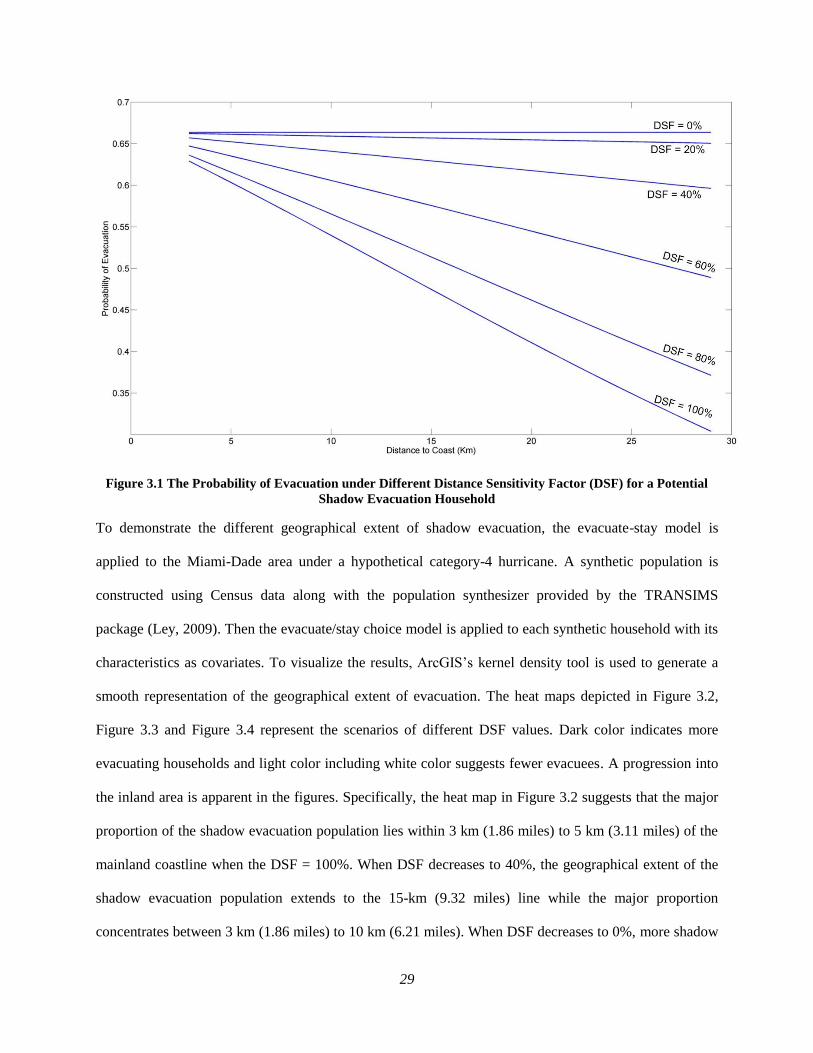
29
Figure 3.1 The Probability of Evacuation under Different Distance Sensitivity Factor (DSF) for a Potential
Shadow Evacuation Household
To demonstrate the different geographical extent of shadow evacuation, the evacuate-stay model is
applied to the Miami-Dade area under a hypothetical category-4 hurricane. A synthetic population is
constructed using Census data along with the population synthesizer provided by the TRANSIMS
package (Ley, 2009). Then the evacuate/stay choice model is applied to each synthetic household with its
characteristics as covariates. To visualize the results, ArcGIS’s kernel density tool is used to generate a
smooth representation of the geographical extent of evacuation. The heat maps depicted in Figure 3.2,
Figure 3.3 and Figure 3.4 represent the scenarios of different DSF values. Dark color indicates more
evacuating households and light color including white color suggests fewer evacuees. A progression into
the inland area is apparent in the figures. Specifically, the heat map in Figure 3.2 suggests that the major
proportion of the shadow evacuation population lies within 3 km (1.86 miles) to 5 km (3.11 miles) of the
mainland coastline when the DSF = 100%. When DSF decreases to 40%, the geographical extent of the
shadow evacuation population extends to the 15-km (9.32 miles) line while the major proportion
concentrates between 3 km (1.86 miles) to 10 km (6.21 miles). When DSF decreases to 0%, more shadow
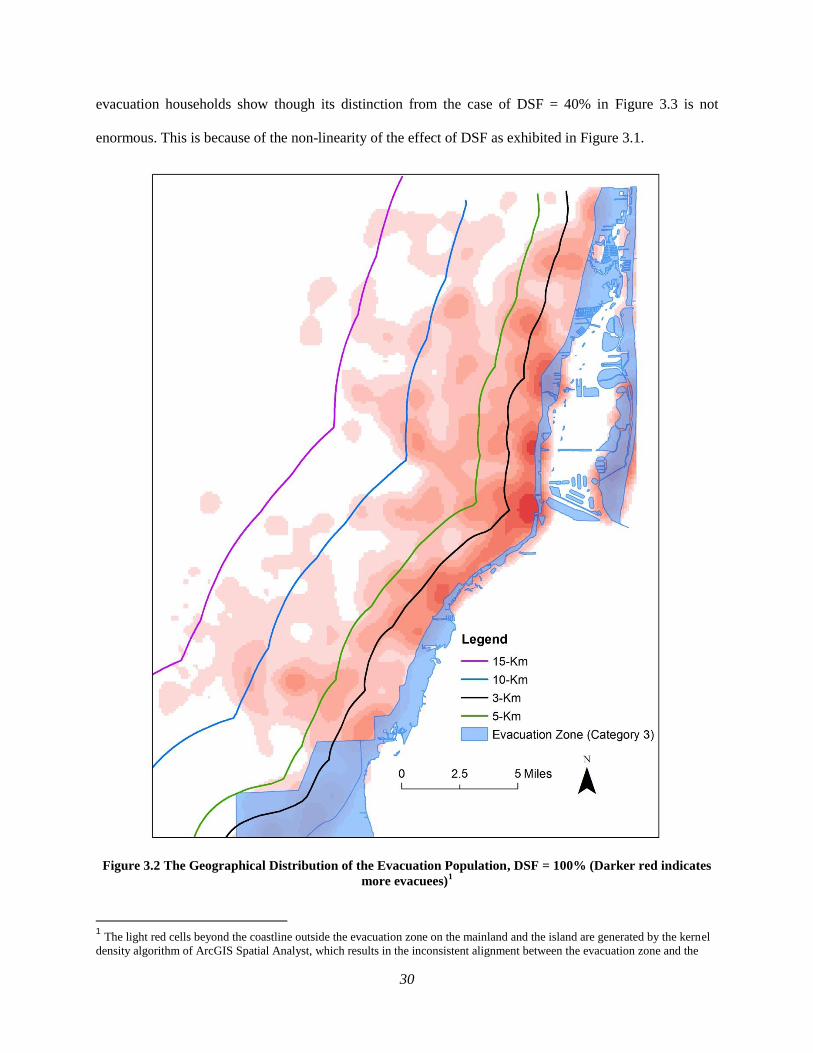
30
evacuation households show though its distinction from the case of DSF = 40% in Figure 3.3 is not
enormous. This is because of the non-linearity of the effect of DSF as exhibited in Figure 3.1.
Figure 3.2 The Geographical Distribution of the Evacuation Population, DSF = 100% (Darker red indicates
more evacuees)1
1 The light red cells beyond the coastline outside the evacuation zone on the mainland and the island are generated by the kernel
density algorithm of ArcGIS Spatial Analyst, which results in the inconsistent alignment between the evacuation zone and the
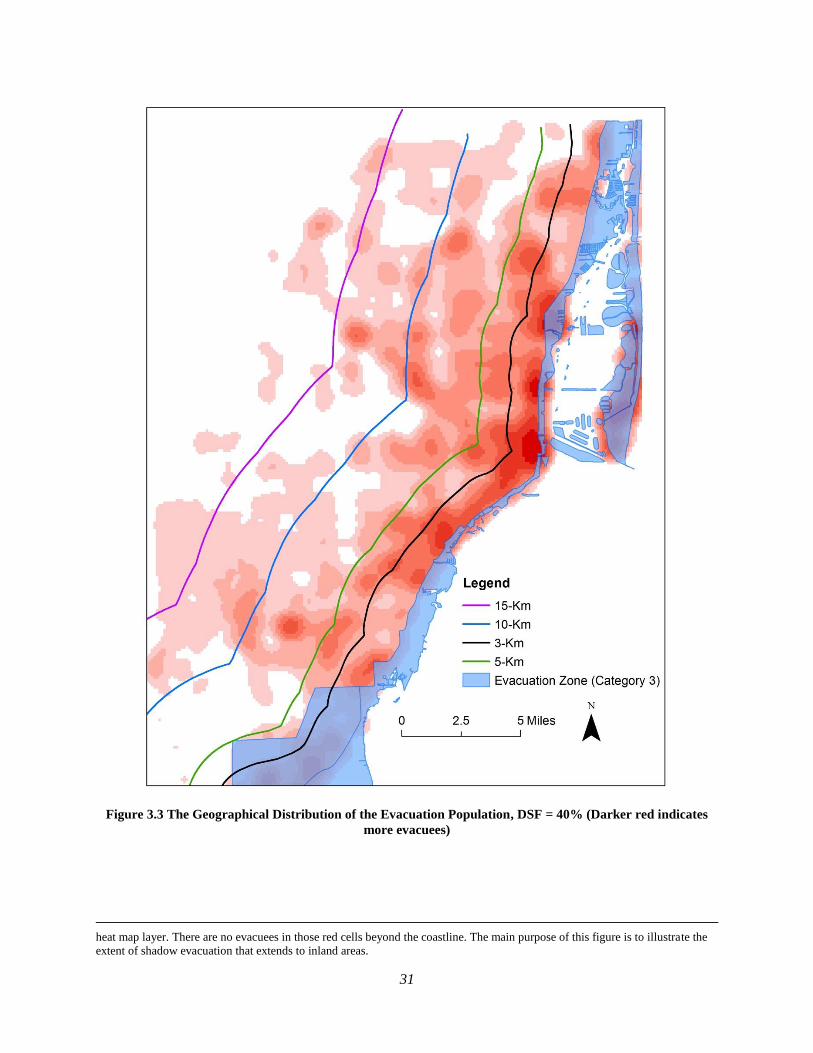
31
Figure 3.3 The Geographical Distribution of the Evacuation Population, DSF = 40% (Darker red indicates
more evacuees)
heat map layer. There are no evacuees in those red cells beyond the coastline. The main purpose of this figure is to illustrate the
extent of shadow evacuation that extends to inland areas.

32
Figure 3.4 The Geographical Distribution of the Evacuation Population, DSF = 0% (Darker red indicates
more evacuees)
33
3.4 SUMMARY
This chapter is among the first attempts to examine households’ evacuate/stay choice by adopting a
random-coefficient binary logit model with the capability of capturing the shadow evacuation. Random
coefficients are associated with the variables representing the receipt of non-mandatory evacuation
notices and the absence of evacuation notices. The statistical significance of the random coefficients
explains the shadow evacuation phenomenon. In addition, the effects of multiple socio-demographic
factors and evacuation-related covariates are investigated.
This study provides useful insights for a better understanding of household hurricane evacuation decision
and provides practical emergency management implications. Several important factors are found to
influence a household’s decision to evacuate or stay at home. For forecasters and emergency managers, it
confirms a series of factors people have to consider in their evacuation decision. Specifically, the
households that have window protection are less likely to evacuate. Similarly, households that own
businesses are less likely to evacuate possibly due to their concerns of protecting their businesses from
post-storm looting. Households that have pets are less likely to evacuate. In addition, households in
mobile residences are more likely to evacuate. Due to their relatively abundant financial means,
households with higher income and education attainment are more likely to evacuate. The emergency
management agencies probably need to allocate more resources to attend the needs of the households who
are financially challenged. The number of children under 17 also shows a positive impact upon the
evacuation.
In addition, the model provides econometric evidences supporting that households may respond in a
heterogeneous manner if they receive a voluntary evacuation notice or they do not receive any evacuation
notice. The study suggests that households that do not receive any evacuation notice are generally less
likely to evacuate. Recognizing the fact that households’ perceived risk is possibly related to their
distance to the coast, it is found that the likelihood of evacuation for households that do not receive any

34
evacuation notice decreases as their distance to coast increase on average. The distance sensitivity factor,
or DSF, is introduced to construct the different scenarios of geographical extent of shadow evacuation.
The study provides implications for both emergency management and evacuation modeling. The
emergency management agencies should understand that the geographical extent of shadow evacuation
may be extensive and thus should be prepared for the additional demand generated from the low-risk
areas and relevant traffic management strategies and plans should be designed. The model offers the
emergency management agencies the flexibility to investigate different levels of shadow evacuation when
necessary. The household-level model can be easily implemented in an agent-based modeling and
simulation framework and this model is later integrated with other evacuation choices into the demand
model system described in Chapter 6.
35
CHAPTER 4 A STATISTICAL ANALYSIS OF THE NUMBER OF
HOUSEHOLD VEHICLES USED FOR HURRICANE IVAN
EVACUATION
This chapter presents a paper that has been accepted for presentation in the 93rd
Annual Meeting of the
Transportation Research Board, 2014. It was co-authored by Weihao Yin, Pamela Murray-Tuite, Satish
Ukkusuri and Hugh Gladwin.
ABSTRACT
The objective of this paper is to identify the contributing factors to households’ choice of the number of
vehicles used for evacuation and develop predictive models of this choice that explicitly consider the
constraint imposed by the number of vehicles owned by the household. This constraint is not
accommodated by ordered response models. Data comes from a post-storm survey for Hurricane Ivan.
The two models developed are variants of the regular Poisson regression model: the Poisson model with
exposure and right-censored Poisson regression. The right-censored Poisson model is preferred due to its
inherent capabilities, better fit to the data, and superior predictive power. The multivariable model and
individual variable analyses are used to investigate seven hypotheses. Households traveling longer
distances or evacuating later are more likely to use fewer vehicles. Households with prior hurricane
experience, greater numbers of household members between 18 and 80, and pet owners are more likely to
use a greater number of vehicles. Income and distance from the coast are insignificant in the multivariable
models, although their individual effects have statistically significant linear relationship. However, the
Poisson based models are non-linear. The method for using the right-censored Poisson model for
producing the desired share of vehicle usage is also provided for the purpose of generating individual
predictions for simulation.
KEYWORDS
Evacuation; hurricane; vehicle usage; number of vehicles; right-censored Poisson model

36
4.1 INTRODUCTION
Predicting hurricane evacuation traffic is a complex process that involves a series of models that attempt
to replicate household decisions as well as the interactions of demand and infrastructure. Accurate
demand representations are essential inputs to traffic simulation to estimate clearance times or other
performance measures and to evaluate evacuation management strategies. Evacuation demand is
governed by many factors, such as hurricane trajectory and household characteristics (Baker, 1991b;
Carnegie and Deka, 2010; Gladwin et al., 2001; Urbina and Wolshon, 2003). A large body of work
focuses on identifying which households would evacuate (see for example summaries in (Murray-Tuite
and Wolshon, 2013a) and (Sorensen, 2000)), but the number of households evacuating does not directly
translate into vehicle volumes. While some segments of the population rely on transit or emergency
management agencies for evacuation transportation, private vehicles remain the preferred method of
transportation. Some households take more than one vehicle, as observed in many post-storm surveys
(Dow and Cutter, 2002b) (Lindell et al., 2005). Traffic simulation models can account for households
taking multiple vehicles, but the rationale for the household decisions is not well researched (Dow and
Cutter, 2002b). Additionally, a method for generating the individual prediction of household vehicle
usage based on household characteristics is needed for traffic simulation applications. This paper is
among the few to provide insights on the connections between household characteristics and the number
of vehicles used for evacuation. The models presented here quantify the effects of household
characteristics on vehicle usage in evacuations, which facilitates predictive analysis for future hurricane
evacuation studies.
Despite its ordinal nature, vehicle usage (number of vehicles used) cannot be simply modeled using the
discrete choice models for an ordered response. These models, such as the ordered logit model, assume
that each decision-making entity, here a household, encounters an identical choice set. However, this
assumption is violated in our context because the number of vehicles used cannot exceed the number of
vehicles available to (owned or leased by) the household. Since not all households have the same numbers

37
of vehicles, the households have different choice sets. This paper presents two variants of the Poisson
regression model, namely the Poisson regression with exposure and right-censored Poisson regression, for
the vehicle usage choice based on a post-storm survey for Hurricane Ivan. These two models account for
the vehicle ownership constraint upon vehicle usage via different statistical specifications, which are
estimated and compared to offer insights on the effects of contributing factors and prediction capabilities.
In addition to the investigation of various factors related to the vehicle usage choice, this paper briefly
discusses how to generate individual predictions that well conform to a desired distribution of number of
vehicles used. This approach improves Cova and Johnson’s (2002) method by considering individual
heterogeneity based on the estimated regression model.
This paper is divided into six additional sections. The next section reviews literature on vehicle usage
during evacuations. The subsequent section provides an overview of the Hurricane Ivan data. The fourth
presents descriptive statistical analyses and seven hypotheses to guide the multivariable statistical analysis.
The fifth section outlines the modeling methodology along with a discussion of the estimation results.
The last section provides conclusions and future directions.
4.2 Literature Review
Households’ vehicle usage choice rarely has been strictly modeled for evacuations. Some studies did not
present their methods for estimating the number of evacuating vehicles per household while others
reported the average from survey results (2007c). Though existing research identifies the importance of
having the household together as a condition for evacuating, it does not necessarily mean that households
will evacuate in a single vehicle (Dow and Cutter, 2002b). Table 4.1 summarizes the literature’s major
findings related to vehicle usage in evacuation. While the averages or ranges shown in the table can be
useful for quick assumptions, greater precision and identifying influencing factors can lead to better
predictions of traffic conditions. For example, at the widest range, given 1,000,000 households, the

38
number of vehicles ranges from 1,100,000 to 2,150,000, with clear implications for traffic conditions and
clearance times.
Table 4.1 Summary of Findings of Vehicle Usage for Permanent Residents in Emergency Evacuation
Literature
Study The Number of Vehicles
Used (Mean or Range) Method Emergency
Radwan et al. (1985)
Sorensen (2000)
All vehicles in the
Households Subjective Assumption Natural Disaster
Cova and Johnson (2002) Random Simulation by
Poisson Distribution Simulation Wild Fire
Ruch and Schumann
(1997); (Ruch and
Schumann, 1998)
1.35, 1.41 Stated-Preference Survey
Corpus Christi Area
and
Houston/Galveston
Area Hurricane
Lindell et al. (2002) Lindell
(2008) 1.62 Stated-Preference Survey
Texas Gulf Coast
Area Hurricane
PBSJ Inc. (1999) 1.21 ~ 1.54 Revealed-Preference Survey Hurricane Georges
Dash and Morrow (2000) 1.70 Revealed-Preference Survey Hurricane Georges
(Florida Keys)
Prater et al. (2000) 1.34 Revealed-Preference Survey Hurricane Bret
Dow and Cutter (2002b) 1.26 Revealed-Preference Survey Hurricane Floyd
Lindell et al. (2011);
Lindell et al. (2005) 1.10 ~ 2.15 Revealed-Preference Survey Hurricane Lili
Siebeneck and Cova (2008) 1.15 ~ 1.85 Revealed-Preference Survey Hurricane Rita
Wu et al. (2012) 1.42 (0.12 Trailers) Revealed-Preference Survey Hurricane Katrina &
Rita
The existing literature generally analyzed the sample characteristics based on stated-preference or
revealed-preference surveys administered after the storm. Exceptions include Radwan et al. (1985) and
Sorensen (2000) who assumed that all household vehicles would be used, which might overestimate the
number of vehicles since many households own more than two. Another notable exception is the study by
Cova and Johnson (2002), who modeled the number of evacuating vehicles using a Poisson distribution
with the mean for the number of evacuating vehicles per residential household equal to the number of
vehicles owned, which results in a distribution with a mode of 2 and a range from 0 to 6. However, they
did not consider individual heterogeneity in the mean.
Several studies provided the sample average (always more than one) and range for the vehicle usage
based on revealed-preference surveys. In addition to the average, Dow and Cutter (2002b) explored the

39
relationship between certain household characteristics and vehicle usage based on Pearson correlation and
observed a statistically significant correlation between vehicle usage and household size and income.
They found that larger households are more likely to take more than one car. The same relationship was
found between household income and vehicle usage with a relatively lower statistical significance.
Similar observations were made by Lindell et al. (2011) using the Pearson correlation measure: younger
evacuees who were married and had larger households with children and higher incomes tended to take
more vehicles and were more likely to take a trailer, based on a survey for Hurricane Lili. They also
found that evacuees living closer to the coast take more vehicles. Later, they (Wu et al., 2012) conducted
similar research for Hurricanes Katrina and Rita and found that evacuees took 1.42 vehicles on average,
consistent with Lindell and Prater (2007a).
Some authors also considered vehicle usage choice by transient dwellers such as tourists. Lindell (2008)
assumed that transient dwellers would be less likely than permanent residents to have multiple vehicles
available, so they are assumed to use only one vehicle for evacuation. Hobeika et al. (1994) noted that
some tourists arrived and departed the risk area in tour buses.
While the previous studies provided valuable insights into the vehicle usage choice, they mainly
employed uni-variable qualitative technique without considering their confounding effects simultaneously.
This study contributes to the literature by using a multi-variable statistical technique, which uncovers the
relationship between vehicle usage and various factors in a quantitative fashion.
4.3 OVERVIEW OF THE DATA
This study’s data are from a survey of households in Florida, Alabama, Mississippi, and Louisiana after
Hurricane Ivan made landfall near Gulf Shores, Alabama, in September 2004. Telephone interviews were
conducted with 3,200 households from these four states. Information collected included household socio-
demographics, past hurricane experience, and evacuation preparations and decisions.

40
Since vehicle usage for evacuation is the dependent variable of interest, only the 1,443 households that
evacuated were selected from the original sample. After the records with missing values for key
covariates, such as travel distance to the evacuation destination, vehicle ownership, and the dependent
variables were discarded, 853 records remained for subsequent descriptive analysis and model estimation.
4.3.1 Variable Selection
The existing literature provides some guidance for variable selection such as household income (2002b)
(2011), household size (2011), and households’ distance to the coast (2011), which will be considered
here in addition to other variables. The independent variables fall into two general categories: household
characteristics and evacuation-related characteristics. The independent variables are shown in Table 4.2
and their effects will be discussed in the following analysis.
4.3.2 Research Hypotheses
To augment previous studies, we examine the following hypotheses to guide the subsequent multi-
variable regression analysis.
H1: Households that travel longer distance are more likely to use fewer vehicles. This hypothesis is based
on the household’s preference to stay together during the evacuation as suggested by Sorensen (2000);
more vehicles may increase the risk of being scattered in traffic. Furthermore, longer distances may
require multiple drivers.
H2: Households who evacuate late are statistically more likely to use fewer vehicles. Despite Lindell et
al.’s [19] findings that evacuation decision time was not significantly correlated with vehicle usage, they
were considering the influence of the use of relying on others for transportation rather than the number of
vehicles. Previous studies (e.g., (Hasan et al., 2013b; Murray-Tuite and Wolshon, 2013a; Murray-Tuite et
al., 2012)) have shown that more households depart closer to the day of hurricane landfall, which often
results in severe congestion. Households may prefer to travel together in highly congested situations.
H3: Households’ previous hurricane experience contributes to their vehicle usage choices; those with
prior experience are statistically more likely to use a greater number of vehicles. Experienced households

41
may bring more personal items or evacuation supplies, which requires more space. They may also have
experienced vehicle damage if they left vehicles at home in previous hurricanes, making them more likely
to try to protect these personal assets.
H4: The number of household members between 18 and 80 is positively related to the number of vehicles
taken on the evacuation. Previous studies suggested that larger households are more likely to take more
than one car (Dow and Cutter, 2002b; Lindell et al., 2011). This study uses a variable related to driving-
aged adults, considering that they would be the most likely to drive household vehicles in stressful
environments, such as evacuations.
H5: Household income is positively related to the number of household evacuation vehicles chosen.
Previous studies found such a correlation between household income and vehicle usage (Lindell et al.,
2011).
H6: Pet-owning households are statistically more likely to evacuate with more vehicles than households
without pets. Pets require their own space and supplies and are anticipated to increase the number of
vehicles a household chooses to use.
H7: Households living farther from the coast are less likely to take more vehicles that those living close
to the coast. A previous study found a negative linear correlation between the number of vehicles and the
distance to the coast (Lindell et al., 2011).

42
Table 4.2 List of Variables and Descriptive Statistics
Variable Description Mean Std. Dev.
[numvehu] The number of vehicles used for evacuation 1.3810 0.6653
Evacuation-related Characteristics
[logdist] The log of the travel distance to the evacuation destination 4.5166 1.5540
[dur] The stay duration in hours until evacuationa 51.1208 18.8522
[mandnt] Whether the household received a mandatory evacuation notice 0.3283 0.4699
[nonmandnt] Whether the household received a non-mandatory evacuation notice 0.3177 0.4659
[noevacnt] Whether the household received no evacuation notice 0.3540 0.4785
[friend] Whether the household went to a friend/relative's house for evacuation 0.6225 0.4850
[hotel] Whether the household went to a hotel for evacuation 0.2227 0.4163
[shelter] Whether the household went to a public shelter for evacuation 0.0234 0.1514
Socio-economic Characteristics
[numveh] The number of vehicles owned by the household 2.1290 0.7915
[bizown] Whether the household owned any businesses 0.1618 0.3685
[hurrexp] Whether the household had any hurricane experience before Ivan 0.7890 0.4083
[mobile] Whether the household lived in a mobile home 0.0868 0.2816
[hhsize] The household size 3.0645 1.5780
[childu17] The number of children under 17 years old 0.7292 1.1029
[oldo80] The number of people over 80 years old 0.0891 0.3343
[num18to80] The number of people between 18 and 80 years old 2.2462 1.2335
[rent] Whether the household lived in a rented property 0.0856 0.2799
[white] Whether the householder is white 0.8734 0.3327
[income]b
The household's income 3.6190 1.0959
[edu]c
The household's highest educational attainment 3.4385 1.1248
[pet] Whether the household had any pets 0.6307 0.4829
[distcoast]d The household’s distance to coast 150.9456 97.9736
[stateAL] Whether the household lived in Alabama 0.1430 0.3503
[stateFL] Whether the household lived in Florida 0.2720 0.4452
[stateLA] Whether the household lived in Louisiana 0.3400 0.4740
[stateMS] Whether the household lived in Mississippi 0.2450 0.4304
a. The earliest hour specified in the survey 12:00 AM, Monday September 13, 2004 is used as the reference
time to count the duration of stay until evacuation. It is the amount of time in hours between the reference time
and household’s departure time for evacuation.
b. The [income] variable has 5 levels, coded as “1” to “5” which indicates “<15,000”, “15,000 to 24,999”,
“25,000 to 39,999”, “40,000 to 79,999” and “>= 80,000”. Separate indicator variables are used.
c. The [edu] variable has 5 levels, coded as “1” to “5”, which indicates “less than high school”, “high school
graduate”, “less than college”, “college graduate”, and “post graduate”. Separate indicator variables are used.
d. The distance to coast is calculated using the coordinates of the household. The unit is kilometer (1 km = 0.61
mile).
4.4 DESCRIPTIVE STATISTICAL ANALYSIS
The descriptive statistical analysis starts with an examination of the sample characteristics of the
explanatory variables. Then, the association between vehicle usage and these variables are investigated
using statistical tests.
4.4.1 Sample Characteristics

43
Columns 3 and 4 of Table 4.2 provide the summary statistics of the variables. Among the households in
the sample, the average number of vehicles used is 1.38, which is similar to previous literature.
The evacuation warning distribution was almost evenly split. A slightly higher percentage of households
(32.83%) received a mandatory evacuation notice while 31.77 percent received a voluntary notice. The
majority of the households (62.25%) sought accommodations in friends’ or relatives’ homes while 22.27
percent went to hotels and 2.34 percent chose public shelters.
Most of the households owned their houses; only approximately 8% lived in rented properties. Mobile
home residents, though limited (8.68%), were captured as well. In terms of income level, on average,
households earned over 40,000 USD. In terms of respondents’ geographical distribution, Louisiana had
the most respondents followed by Florida.
Association between Vehicle Usage Choice and the Explanatory Variables
The cross tabulation of vehicle ownership and vehicle usage choice for Hurricane Ivan is shown in Table
4.3. Similar to previous studies’ observations, 66.71% of the households used only one vehicle, 25.91%
used two vehicles, and 6.10% used more than 3 vehicles. Only 42.32% of the households used all the
vehicles they owned, suggesting that the assumption of using all the household’s vehicles is not reflective
of reality.

44
Table 4.3 Cross Tabulation between Vehicle Usage Choice and Vehicle Ownership
Number of Vehicles Owned by Households
Number of
Vehicles Used 1 2 3 4 5 7 Total
0 3 7 1 0 0 0 11
35.00% 82.00% 12.00% 0.00% 0.00% 0.00% 1.29%
1 144 329 80 11 4 1 569
16.88% 38.57% 9.38% 1.29% 0.47% 0.12% 66.71%
2 0 169 38 12 2 0 221
0.00% 19.81% 4.45% 1.41% 0.23% 0.00% 25.91%
3 0 0 39 4 1 0 44
0.00% 0.00% 4.57% 0.47% 0.12% 0.00% 5.16%
4 0 0 0 5 0 0 5
0.00% 0.00% 0.00% 0.59% 0.00% 0.00% 0.59%
5 0 0 0 0 3 0 3
0.00% 0.00% 0.00% 0.00% 0.35% 0.00% 0.35%
Total 147 505 158 32 10 1 853
17.23% 59.20% 18.52% 3.75% 1.17% 0.12% 100.00%
Table 4.4 provides the correlation measures and results of independence tests between the vehicle usage
choice and explanatory variables. Due to the ordinal-scale nature and non-normality of the dependent
variable (vehicle usage), Spearman correlation is used instead of the Pearson correlation and the Kruskal
Wallis test is used in place of the chi-square test to investigate the independence as suggested by Corder
and Foreman (2009). The Spearman rank-order correlation measures the relationship between one
ordinal-scale dependent variable (vehicle usage) and one ordinal-scale independent variable (e.g.,
household size) or ratio-scale variable like travel distance (Corder and Foreman, 2009). The Kruskal
Wallis test is the non-parametric version of one-way analysis of variance (ANOVA) which permits two or
more groups for independent categorical variables such as income level (Corder and Foreman, 2009;
UCLA: Statistical Consulting Group, 2013).
4.4.1.1 Evacuation-Related Characteristics
The negative Spearman correlation -0.0987, statistically significant at the 0.05 significance level, between
the logarithm of the travel distance to the evacuation destination and the number of vehicles used
indicates households travelled with fewer vehicles if they went farther, possibly for reasons argued for
Hypothesis 1. The correlations between types of evacuation warning received and the number of vehicles
used also show various magnitudes of statistical significance. Specifically, the difference in the number of

45
vehicles used between those receiving mandatory notices and those not receiving the mandatory notice is
statistically significant at the 0.05 level, which points to the effect of risk level. The types of
accommodations also affect the number of vehicles used. The difference between the households going to
friends’ or relatives’ homes and those going other elsewhere is statistically significant at the 0.05 level.
Households seeking shelter at friends’ or relatives’ homes brought an average of 1.34 vehicles, which is
less than the average 1.45 vehicles used by households going to hotels. The households going to shelters
had the lowest vehicle average, 1.30. Parking space considerations might contribute to this difference.
Table 4.4 also shows a positive correlation between the number of vehicles used and the stay duration
until evacuation though the effect lacks statistical significance in the uni-variable Spearman correlation
analysis. However, later multivariable analysis shows statistical significance.
4.4.1.2 Household Characteristics
Households with hurricane experience exhibit statistically significant different behavior in terms the
number of vehicles chosen for evacuation from first-time evacuees. The households with prior experience
used 1.41 vehicles on average, 0.15 vehicles more than those who evacuated for the first time due to
Hurricane Ivan. Perhaps the experienced evacuees tend to bring more items, which require more space.
Confirming the findings of Dow and Cutter (2002b), the greater the household size, the more likely the
household was to take more than one vehicle, as evidenced by the highly statistically significant
correlation 0.14. Closer examination of the sample reveals that 37.64% of the households with three or
four people took more than two vehicles. The number of household members aged between 18 and 80 is
also positively related to the number of vehicles used, as expected. The number of senior citizens over 80
years old exhibits a negative correlation with the number of vehicles used with a relatively low statistical
significance of 0.1. The number of children under 17 years old is insignificantly correlated with the
dependent variable. The pet-owning households show a highly significant difference from those who did
not own pets; pet owners use 0.22 vehicles more on average than those who did not own pets. The
difference in vehicle usage between households with different income levels is statistically insignificant

46
for both the continuous ([incomep]) and discrete versions of the income variable. This does not
necessarily contradict Dow and Cutter (2002b) since a different sample and different statistical tests are
used. Dow and Cutter (2002b) used the Pearson correlation coefficient, but this paper takes the ordinal-
scale nature of vehicle usage into consideration and thus uses the Kruskal Wallis test. The identical
observation can be made about the households with different educational attainment. But the test for the
indicator variables generated for education attainment shows that the difference between households with
post-graduate degree holders and those who do not is statistically significant. Households with post-
graduate degree holders used 0.12 fewer vehicles on average than those without. The households living
farther from the coast are more likely to take fewer vehicles, consistent with Lindell et al.’s finding
(Lindell et al., 2011). The differences due to geographical locations are statistically significant for
households in LA and MS at the significance level of 0.1; households in these two states used
approximately 0.1 more vehicles (1.43 vehicles) than residents in the other two states on average (1.34
vehicles for FL and AL).
Though the univariate statistical testing shed some light on the relationships between the explanatory
variables and the vehicle usage choice, they fail to offer quantitative assessment, which will be achieved
via the subsequent regression modeling.

47
Table 4.4 Correlation Measures and Results of the Independence Tests for the Explanatory Variables
Variable Correlation
Measure Correlation Test Significance Correlation Test Method
[logdist] -0.0987 0.0039** Spearman Correlation
[dur] 0.0073 0.8324 Spearman Correlation
[mandnt] / 0.0048** Kruskal Wallis
[nonmandnt] / 0.0911* Kruskal Wallis
[noevacnt] / 0.0893* Kruskal Wallis
[bizown] / 0.1875 Kruskal Wallis
[hurrexp] / 0.0115** Kruskal Wallis
[mobile] / 0.0896* Kruskal Wallis
[hhsizei] 0.1385 0.0000*** Spearman Correlation
[childu17i] 0.0232 0.4979 Spearman Correlation
[oldo80i] -0.0616 0.0722* Spearman Correlation
[num18to80] 0.2368 0.0000*** Spearman Correlation
[rent] / 0.4956 Kruskal Wallis
[white] / 0.6031 Kruskal Wallis
[income] / 0.4387 Kruskal Wallis
[incu15k]a 0.2505 Kruskal Wallis
[inc15to25k]a 0.2088 Kruskal Wallis
[inc25to40k]a 0.4945 Kruskal Wallis
[inc40to80k]a 0.7491 Kruskal Wallis
[inco80k]a 0.3410 Kruskal Wallis
[incomep] 0.0412 0.2295 Spearman Correlation
[edu] / 0.1104 Kruskal Wallis
[lthighsch]b 0.4908 Kruskal Wallis
[highsch]b 0.0668 Kruskal Wallis
[ltcol]b 0.1291 Kruskal Wallis
[colgrad]b 0.9477 Kruskal Wallis
[pgrad]b 0.0239** Kruskal Wallis
[pet] / 0.0001*** Kruskal Wallis
[friend] / 0.0431** Kruskal Wallis
[hotel] / 0.2204 Kruskal Wallis
[shelter] / 0.2485 Kruskal Wallis
[distcoast] -0.0717 0.0362** Spearman Correlation
[stateAL] / 0.2643 Kruskal Wallis
[stateFL] / 0.5454 Kruskal Wallis
[stateLA] / 0.0744* Kruskal Wallis
[stateMS] / 0.0926* Kruskal Wallis
* ~ p < 0.1, ** ~ p < 0.05, *** ~ p < 0.01
a. The indicator variables for the categories of variable [income] (less than $15,000; $15,000-$25,000;
$25,000-$40,000; $40,000-$80,000; more than $80,000)
b. [incomep] is an artificially created continuous version of the categorical variable income. Its value is
the median of the respective categories.
c. The indicator variables for the categories of variable [edu] (less than high school; high school
graduate; some college; college graduate; post-college graduate)
4.5 REGRESSION ANALYSIS
The unique characteristic of the dependent variable - the number of vehicles used being constrained by
the number of vehicles owned - is handled via two different approaches: Poisson regression with exposure

48
(PR-E) and right-censored Poisson regression (PR-C). The PR-E model explicitly includes the vehicle
ownership as a regressor with a unity coefficient. Households that own more vehicles will be given higher
probabilities of using more vehicles by the PR-E model. A household could be predicted to use more
vehicles than they own since the PR-E specification may associate non-zero probabilities for numbers
greater than the number of vehicles owned. The PR-C model will always give zero probabilities to
numbers greater than the number of vehicles owned, by construction.
4.5.1 Modeling Methodology
Let denote the number of vehicles used for household i. Then the probability of the random variable Y
that denotes the number of vehicles used is given by Eq.(4.1) for a regular Poisson model.
( )
(4.1)
where is the covariate vector for household i and is the expected number of vehicles used (Greene,
2012). The parameter is related to the covariates by a log-linear formulation as shown in Eq.(4.2),
(4.2)
where β is the parameter vector (Greene, 2012). The partial effects of the covariates with respect to the
expected number of vehicles used is therefore given by Eq.(4.3).
[ ]
(4.3)
It is natural to expect that a household that owns more vehicles would be more likely to use more vehicles
than a household that owns fewer vehicles. While the number of vehicles owned can be simply used as a
covariate in a regular Poisson regression model, another way of introducing this type of individual
heteroscedasticity is to use the so-called exposure time specification (Greene, 2012; Long and Freese,
2006). Suppose the number of vehicles owned by the household is , then the expected number of
vehicles used is revised as Eq.(4.4).
( ) (
) (4.4)
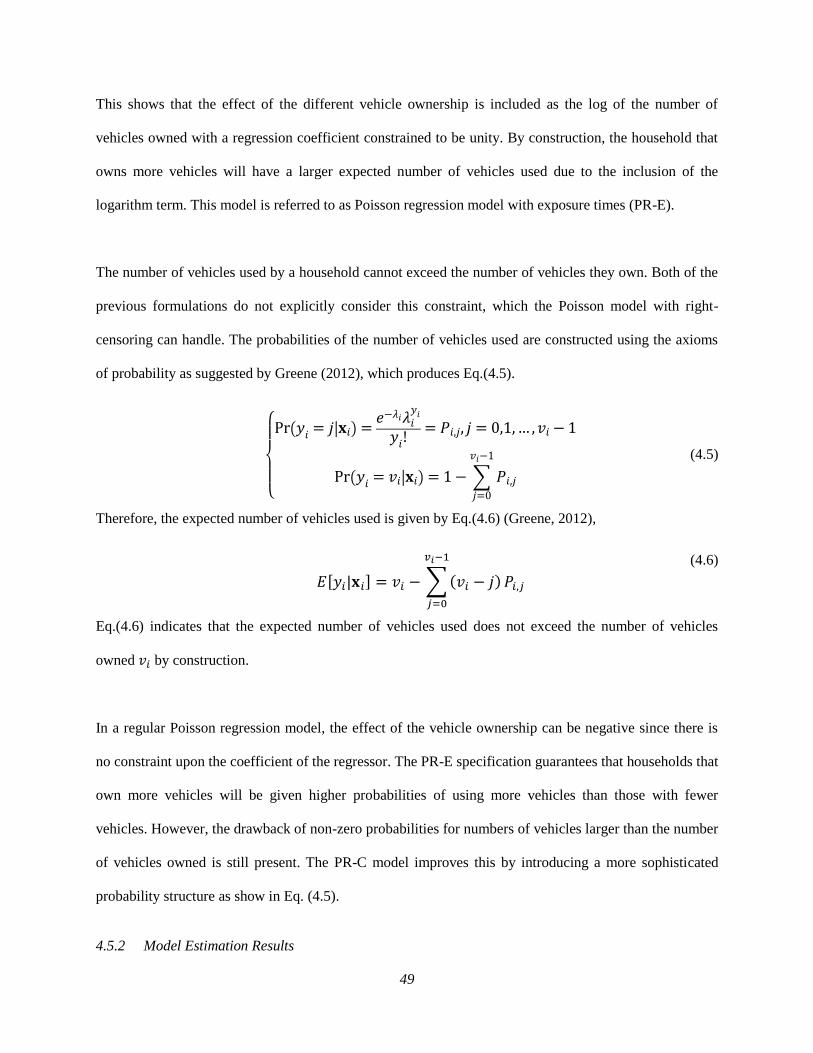
49
This shows that the effect of the different vehicle ownership is included as the log of the number of
vehicles owned with a regression coefficient constrained to be unity. By construction, the household that
owns more vehicles will have a larger expected number of vehicles used due to the inclusion of the
logarithm term. This model is referred to as Poisson regression model with exposure times (PR-E).
The number of vehicles used by a household cannot exceed the number of vehicles they own. Both of the
previous formulations do not explicitly consider this constraint, which the Poisson model with right-
censoring can handle. The probabilities of the number of vehicles used are constructed using the axioms
of probability as suggested by Greene (2012), which produces Eq.(4.5).
{
( | )
( | ) ∑
(4.5)
Therefore, the expected number of vehicles used is given by Eq.(4.6) (Greene, 2012),
[ ] ∑( )
(4.6)
Eq.(4.6) indicates that the expected number of vehicles used does not exceed the number of vehicles
owned by construction.
In a regular Poisson regression model, the effect of the vehicle ownership can be negative since there is
no constraint upon the coefficient of the regressor. The PR-E specification guarantees that households that
own more vehicles will be given higher probabilities of using more vehicles than those with fewer
vehicles. However, the drawback of non-zero probabilities for numbers of vehicles larger than the number
of vehicles owned is still present. The PR-C model improves this by introducing a more sophisticated
probability structure as show in Eq. (4.5).
4.5.2 Model Estimation Results

50
The two Poisson regression models (PR-E and PR-C) are estimated using maximum likelihood estimation
in Stata. The estimation sample is a random sub-sample which contains 757 observations (90%) of the
original sample and the remaining 96 observations serve to examine the models’ prediction capabilities.
The estimation results are shown in Table 4.5. Not all of the explanatory variables shown in Table 4.2 are
included since the variables statistically insignificant at the 0.1 level are removed from models based on
stepwise likelihood ratio tests. Both models are statistically significant as shown by the likelihood chi-
square test whose null hypothesis that all coefficients are zero is rejected at the 0.001 significance level.
The partial effect for an indicator variable, such as [hurrexp], is computed using discrete change while
that for a continuous variable, such as travel distance ([logdist]) and stay duration until evacuation ([dur]),
is computed using the partial derivative method given in Eq.(4.3). The partial effect for each observation
is computed and then averaged to derive the average partial effect (APE) shown in Table 4.5. These APEs
aid the discussion of the hypotheses.
H1: Households that travel longer distance are more likely to use fewer vehicles.
The travel distance to the evacuation destination shows a negative effect upon the vehicle usage in both
formulations. Specifically, a unit change of the logarithm of the travel distance, i.e., extending the travel
distance by about 2.7 times, leads to about 0.05 fewer vehicles in both the exposure formulation and the
right-censored Poisson model, which supports H1.
H2: Households who evacuate late are statistically more likely to use fewer vehicles.
The stay duration until evacuation shows a statistically significant effect upon the vehicle usage in the
regression analysis as opposed to the univariate association analysis. Generally, longer stay duration leads
to fewer vehicles used, consistent with H2. A one hour increase in stay duration corresponds to an
approximately 0.003 decrease in vehicle usage for the exposure formulation and the right-censored
Poisson formulation, holding every other covariate constant.
51
H3: Households’ previous hurricane experience contributes to their vehicle usage choices; those with
prior experience are more likely to use a greater number of vehicles.
Prior hurricane experience has a statistically significant positive effect upon vehicle usage at the 0.001
level for right-censored Poisson model, supporting H3, but not in the exposure formulation. Having
previous hurricane experience increases the number of vehicles used by approximately 0.14 in the right-
censored Poisson model.
H4: The number of household members between 18 and 80 is positively related to the number of vehicles
taken on the evacuation.
The number of people between 18 and 80 shows a statistically significant positive effect upon the vehicle
usage choice in the right-censored Poisson model but not in the exposure formulation at the 0.1
significance level. One more person between 18 and 80 leads to a 0.1267 vehicle increase in the right-
censored Poisson formulation. The Pearson correlation calculation reveals that the household size has a
positive linear correlation with the number of vehicles used, which is consistent with existing findings
(Dow and Cutter, 2002b; Lindell et al., 2011).
H5: Household income is positively related to the number of household evacuation vehicles chosen.
This hypothesis is not supported. Different from previous studies (Dow and Cutter, 2002b; Lindell et al.,
2011), the income variable in both models is insignificant at the 0.1 level. Related to vehicle ownership,
the effect of income is partly captured via the explicit treatment of vehicle ownership constraint upon the
vehicle usage choice in both formulations. A related variable, being a post-graduate degree holder,
decreases the number of vehicles used by about 0.1 in both the right-censored Poisson model and
exposure formulation. The potentially conflicting results may be due to the different statistical techniques.
The multi-variable modeling considers the ordinal nature of the number of vehicles used and explicitly
treats other confounding factors and the effect of vehicle ownership in a nonlinear fashion. The Pearson

52
correlation factor, used by previous studies (Dow and Cutter, 2002b; Lindell et al., 2011), treats the
number of vehicles as a continuous variable and investigates a linear relationship. The Pearson correlation
calculation for our sample is consistent with existing findings (Dow and Cutter, 2002b; Lindell et al.,
2011).
H6: Pet-owning households are statistically more likely to evacuate with more vehicles than households
without pets.
The support for this hypothesis depends on the model. Being a pet owner increases the number of
vehicles used by about 0.12 in the right-censored formulation, supporting H6, but is insignificant at the
0.1 level in the exposure formulation.
H7: Households living farther from the coast are less likely to take more vehicles that those living close
to the coast.
This hypothesis is not supported in the multivariable models. However, a negative statistically significant
Spearman correlation was obtained in the descriptive analysis, which suggests that households living
farther from the coast take fewer vehicles, consistent with Lindell et al. (Lindell et al., 2011).
Other socio-demographic factors also exhibit statistically significant impacts upon vehicle usage choice.
Living in a mobile home increases the number of vehicles used by 0.23 for right-censored Poisson and
0.27 for the exposure formulation. Statistically significant geographical distinctions show in both models.
Being a FL resident decreases the number of vehicles used by about 0.14 in the exposure formulation and
0.10 in the right-censored model, possibly because Florida did not suffer the strongest hurricane impact
among the four states.

53
Table 4.5 Estimation Results of the Poission Regression Models
Poisson with Exposure Right-Censored Poisson
Estimates Avg. Partial Effect Estimates Avg. Partial Effect
[numveh] e
Censoring Variable
(0.0000)
[logdist] -0.0372*** -0.0519 -0.0618*** -0.0531
(0.0117)
(0.0182)
[dur] -0.00238** -0.0030 -0.00367** -0.0031
(0.00089)
(0.00143)
[num18to80] /
0.148*** 0.1267
/
(0.0309)
[hurrexp] / 0.159*** 0.1369
/ (0.0554)
[incomep] / /
/
/
[pgrad] -0.0930** -0.109 -0.129** -0.1110
(0.0474)
(0.0559)
[pet] /
0.144*** 0.1235
/
(0.0477)
[mobile] 0.184*** 0.257 0.264*** 0.2263
(0.0463)
(0.0961)
[stateFL] -0.101*** -0.141 -0.119** -0.1021
(0.0373)
(0.0511)
Constant -0.102 / 0.515*** /
(0.094) / (0.156) /
Number of Observations 767
767
Log-Likelihood -942.739
-708.685
AIC 2.478
1.871
4.5.3 Comparison between Models
The models are compared from four aspects. First, the model fit is evaluated based on likelihood values
and Akaike information criterion (AIC). The right-censored Poisson regression model enjoys larger
likelihood value -708.685 and a lower AIC value 1.871, which suggests it is the superior model. The
models’ performance are also evaluated based on the predicted aggregate share as suggested by Train
(2002). The predicted shares of the two models along with the observed share for the hold-out sample are
depicted in Figure 4.1. Both models increase the accuracy of the predicted shares upon the constant-only
model. The censored Poisson model offers the best share prediction at all levels of the dependent variable,
except when the number of vehicles used is two. At this particular level, the Poisson model with exposure
slightly underestimates the share while the censored Poisson model overestimates the share. At the
disaggregate level, when the Poisson mean is used for predicting the number of vehicles used, the

54
censored Poisson model also provides better prediction performance in terms of root mean square error
(RMSE) and mean absolute error (MAE), two measures suggested by Bhat and Pulugurta (1998).
For certain evacuation traffic simulation applications, the simulation of households’ vehicle usage choices
is of major interest (for an example in regular planning, see Bhat et al. (2002)). However, due to the
inherent characteristics of the Poisson distribution, the simulated shares of the zero vehicles will be
usually overestimated, which is demonstrated in Figure 4.1. Even the censored Poisson model, which
offers the best performance, overestimates the percentage of the zero vehicles. Using Eq.(4.5), the
probability of using no vehicles is given by . For λ = 2, the percentage is 13.53%, which is higher than
the observed sample share (1.29%).
Considering this probability is decreasing with the expected number of vehicles used, when the expected
number of vehicles is less than 2, which is true for all estimated models, the percentage is even higher.
Hence, some adjustment, such as the one proposed in this paper, is needed to produce the desired share.
Here, both zero-vehicle and two-vehicle users are overestimated while the one-vehicle households are
underestimated. Hence, for simulation purposes, one can manually assign a portion of the predicted zero-
vehicle and two-vehicle users as one-vehicle users. Figure 4.2 shows the comparison between the original
predicted share and the adjusted simulated share. The conversion factor is computed using the sample
shares and the shares predicted by the censored Poisson model. Specifically, the proportion of the zero-
vehicle users converted to one-vehicle users is ( ) ( ) =
91.59% while that for two-vehicle users is ( ) ( )
28.40%. It can be seen that the sample shares are well reproduced.
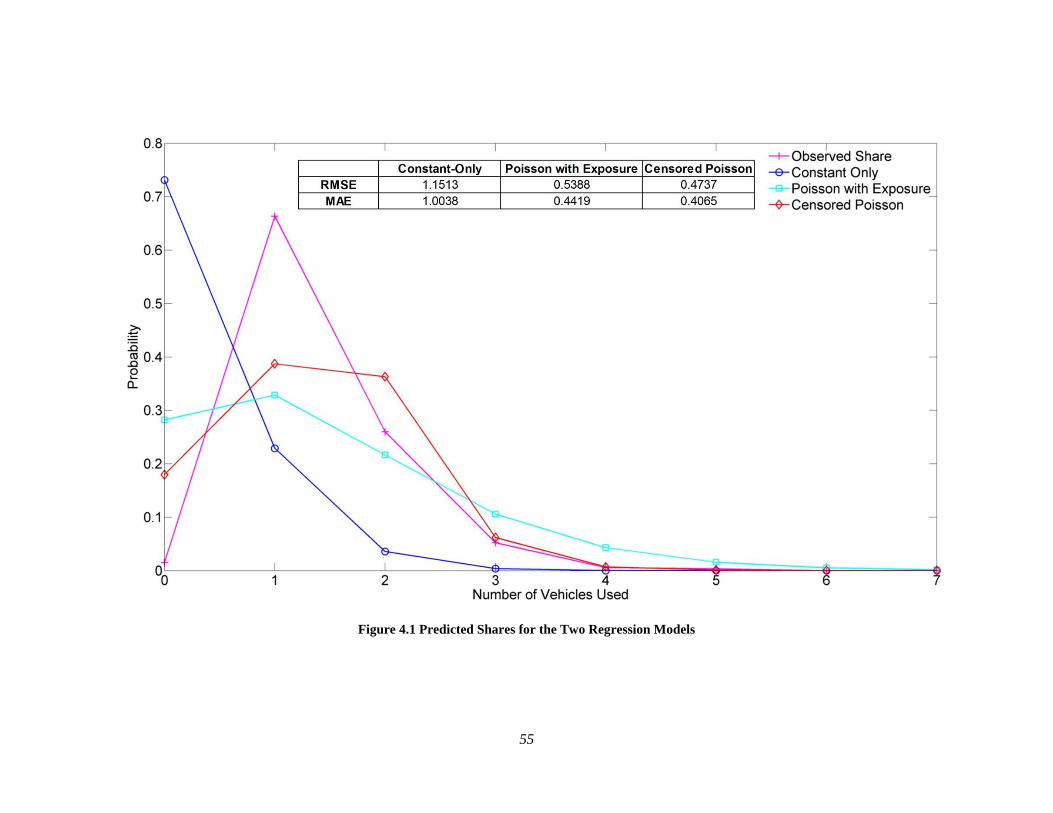
55
Figure 4.1 Predicted Shares for the Two Regression Models

56
Figure 4.2 The Simulated Share for the Entire Sample

57
4.6 CONCLUSIONS AND FUTURE DIRECTIONS
This paper presents two variants of the regular Poisson regression model for the vehicle usage choice
based on a post-storm survey for Hurricane Ivan: the Poisson model with exposure and right-censored
Poisson regression. The two models explicitly consider the fact that the number of vehicles used for
evacuation cannot exceed the number of vehicles owned by the household, which the ordered-response
models fail to accommodate.
Between the two models, the right-censored Poisson model is preferred. It has better measures of fit and
superior predictive power. Furthermore, by construction, it provides zero probabilities for numbers of
vehicles used exceeding the number of vehicles owned. Therefore, it should be chosen for developing
individual predictions of vehicle usage for simulation purposes. The model with the adjustment described
earlier is being used by the authors for evacuation demand simulation.
Since the right-censored Poisson model is the preferred model, the conclusions with respect to the
hypotheses are drawn using this model.
1. Households that travel longer distance are more likely to use fewer vehicles. The regression analysis
supports this hypothesis. Households may prefer to stay together during the evacuation and/or
multiple drivers may be needed per vehicle.
2. Households who evacuate late are statistically more likely to use fewer vehicles. This hypothesis is
supported by the PR-C model. Generally, longer stay duration leads to fewer vehicles used, possibly
because of congestion concerns.
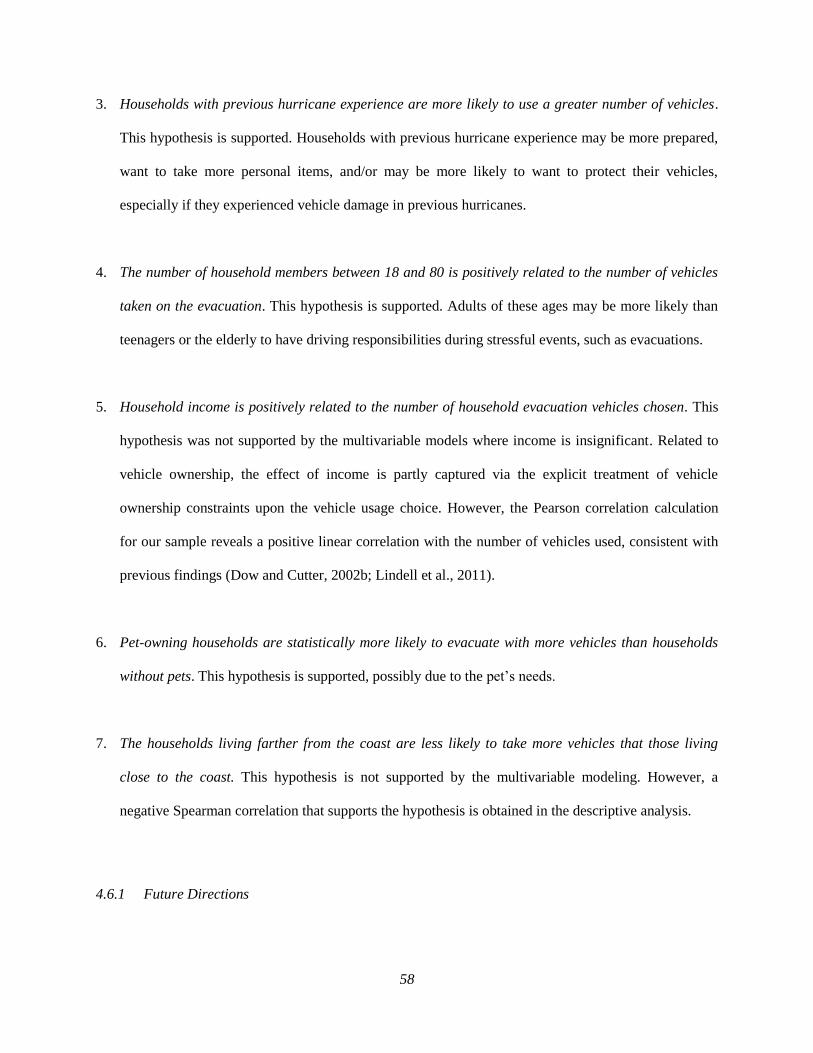
58
3. Households with previous hurricane experience are more likely to use a greater number of vehicles.
This hypothesis is supported. Households with previous hurricane experience may be more prepared,
want to take more personal items, and/or may be more likely to want to protect their vehicles,
especially if they experienced vehicle damage in previous hurricanes.
4. The number of household members between 18 and 80 is positively related to the number of vehicles
taken on the evacuation. This hypothesis is supported. Adults of these ages may be more likely than
teenagers or the elderly to have driving responsibilities during stressful events, such as evacuations.
5. Household income is positively related to the number of household evacuation vehicles chosen. This
hypothesis was not supported by the multivariable models where income is insignificant. Related to
vehicle ownership, the effect of income is partly captured via the explicit treatment of vehicle
ownership constraints upon the vehicle usage choice. However, the Pearson correlation calculation
for our sample reveals a positive linear correlation with the number of vehicles used, consistent with
previous findings (Dow and Cutter, 2002b; Lindell et al., 2011).
6. Pet-owning households are statistically more likely to evacuate with more vehicles than households
without pets. This hypothesis is supported, possibly due to the pet’s needs.
7. The households living farther from the coast are less likely to take more vehicles that those living
close to the coast. This hypothesis is not supported by the multivariable modeling. However, a
negative Spearman correlation that supports the hypothesis is obtained in the descriptive analysis.
4.6.1 Future Directions
59
Though this paper identifies contributing factors to vehicle usage choice in hurricane evacuation, the
underlying motivations for the vehicle usage choice are still unclear. For example, households taking two
or more cars may have job responsibilities that require one member to return sooner than others or they
simply want the flexibility to allow one member to return to cleanup while others stay with children.
Hence, one future direction is to investigate the motivations for taking multiple vehicles. Additionally, the
methodology used in this paper considers the ordinal nature of the vehicles. However, the vehicle types
(e.g., SUV, sedan) are not included. Households taking more than two cars may use large vehicles to
carry possessions. Thus, another possible future direction is to model vehicle characteristics and the
number of vehicles simultaneously.
ACKNOWLEDGEMENTS
This research was supported by National Science Foundation Award SES-0826873 for which the authors
are grateful. The Hurricane Ivan survey was supported by the USACE
(http://chps.sam.usace.army.mil/USHESdata/Assessments/2004Storms/Ivan/Ivan_Frame.htm [go to
Behavioral Data]) and directed by Betty Morrow and Hugh Gladwin. The authors also thank Dr. William
Greene and Dr. Kris Wernstedt for their advice on the Poisson regression models. However, the authors
are solely responsible for the findings in this document.
60
CHAPTER 5 PRE-EVACUATION ACTIVITIES FOR HURRICANE
EVACUATION: AN ANALYSIS OF BEHAVIORAL INTENTIONS
FROM MIAMI BEACH, FLORIDA
This chapter presents a paper that has been accepted for presentation in the 93rd
Annual Meeting of the
Transportation Research Board, 2014. It was co-authored by Weihao Yin, Pamela Murray-Tuite, Satish
Ukkusuri and Hugh Gladwin.
ABSTRACT
Hurricane evacuation demand studies typically focus on ultimate evacuation trips, however, households
often first undertake activities to prepare their homes and themselves for the evacuation. These activities
delay the evacuation process but are understudied. This paper presents a descriptive analysis of and
econometric models for households’ pre-evacuation activities based on behavioral intention data collected
for Miami Beach, Florida. The descriptive analysis shows that shopping - particularly food, gasoline,
medicine, and cash withdrawal - accounts for the majority of preparation activities, highlighting the
importance of maintaining a supply of these items. More than 90% of the tours are conducted by driving,
emphasizing the need to incorporate pre-evacuation activity travel into simulation studies. Households
perform their preparation activities early in a temporally concentrated manner and generally make the
tours during daylight. Households with college graduates, larger households, and households who drive
their own vehicles are more likely to engage in activities that require travel. The number of household
members older than 64 has a negative impact upon engaging in out-of-home activities. An action day
choice model for the first tour suggests that households are more likely to buy medicine early but are
more likely to pick up friends/relatives late. Households evacuating late are more likely to conduct their
activities late. Households with multiple tours tend to make their first tour early. About 10% of
households chain their single activity chains with their ultimate evacuation trips. The outcomes of this
paper can be used in demand generation for traffic simulations.
Keywords: evacuation; hurricane; demand; activities

61
5.1 INTRODUCTION
Transportation planning for hurricane evacuations largely depends on simulating the interaction between
evacuation traffic and transportation infrastructure. The simulation output’s quality depends on the input’s
accuracy, including the demand representation, which can be derived from studies of evacuation
behavioral patterns and households’ trip-related decisions. Most previous studies related to hurricane
evacuation demand focus on the ultimate evacuation trips, since they constitute a large proportion of the
demand, and households’ logistical decisions regarding the ultimate trips. Wu et al. (2012) summarize
major findings regarding the evacuation departure time, route, vehicle usage, and evacuation distance and
destination choices. In addition to the ultimate trip, evacuation-related demand includes trips derived from
pre-evacuation preparation activities. Pre-evacuation activities can span several hours or even days and
often involve multiple trips between various locations (Wolshon et al., 2009). This travel derived from
mobilization activities often occurs on local transportation infrastructure which can inhibit evacuating
traffic’s progress toward designated evacuation routes. The delay caused by pre-evacuation trips is neither
well understood nor well represented in hurricane evacuation models (Lindell et al., 2005). Ignoring these
trips may lead to underestimated evacuation time estimates (Wilmot and Mei, 2004) as well as incomplete
understanding of travel needs during an evacuation period. The objective of this paper is to develop
models and provide behavioral findings regarding hurricane pre-evacuation activity travel that can
address questions about types of activities and activity scheduling and provide pointers to representing
this demand in simulation studies.
In the no-notice evacuation context, activities before the ultimate evacuation trip, such as gathering family
members or meeting at home, have begun to be investigated (Liu et al., 2012, accepted-b; Ma et al., 2009;
Murray-Tuite and Mahmassani, 2003) and integrated into evacuation simulations (Lin et al., 2009; Liu et
al., accepted-a; Murray-Tuite and Mahmassani, 2004). However, the pre-evacuation trips for hurricanes
are infrequently investigated, despite their importance to the hurricane evacuation simulation models’
accuracies. Some early models, such as the WITNESS model (Farahmand, 1997) and MASSEVAC

62
(Hobeika and Kim, 1998), over-simplify pre-evacuation trips by assuming all households share the same
temporal evacuation delay and behavior. These models only considered mobilization activities through a
temporal loading distribution, which assigned evacuees’ departure times.
Noltenius and Ralston (2010) are among the few who studied pre-evacuation trip-making behavior for
hurricanes. They conducted a survey for Key West, Florida after Hurricane Wilma struck in October,
2005. They found that pre-evacuation trips show a dispersal of origins and destinations resulting in traffic
that flows in many directions, not just toward ultimate evacuation destinations (Noltenius, 2008). They
also examined trips chained with the ultimate departure and found households made several stops before
leaving. Some trips used the major evacuation route and contributed to the traffic congestion (Noltenius
and Ralston, 2010). However, their study is largely a descriptive analysis and does not strictly examine
links among activity participation decisions, evacuation decisions (e.g., timing for ultimate evacuation
trips), and socio-economic factors.
This study builds on the limited existing literature by (1) descriptively examining the pre-evacuation
activity travel behavior from the perspective of an activity-based approach, based on a behavioral
intention survey conducted in Miami Beach and (2) statistically modeling evacuating households’ activity
participation and scheduling decisions. The analysis provides insights into the characteristics associated
with the pre-evacuation activities. Activity-based models are widely used for regular planning purposes
(Pendyala and Ye, 2005), such as the modeling system developed by Bhat et al. (2000; 2001; 2002).
However, evacuation activity travel behavior is different from that under normal conditions. Regular
planning activity travel models generally focus on a 24-hour planning horizon while evacuation
preparation activities usually span days and involve activities that allow evacuees to effectively plan for
evacuation. In addition, the activities tend to performed in a more condensed manner due to the
evacuation needs.
63
The remainder of this paper is organized as follows. The next section provides an overview of the survey
data and a descriptive analysis of the households’ pre-evacuation activity participation behavior. Then we
statistically examine the effects of possible contributing factors to the households’ pre-evacuation
activity-travel choices. The last section summarizes the behavioral findings, discusses implications for
generating demand for traffic simulation, and identifies future research directions.
5.2 OVERVIEW OF THE DATA AND DESCRIPTIVE STATISTICAL ANALYSIS
This study’s data come from a household survey conducted in Miami Beach, Florida for a hypothetical
category-four hurricane forecast to make landfall early Thursday morning. Evacuation notices are issued
on Saturday at 10 am and people in evacuation zones should evacuate by 10 am Wednesday, which gives
households a five-day response period. Telephone interviews were conducted with 707 households, and
606 households indicated they would evacuate. Households were asked for details regarding the activities
they would engage in before they embark on the ultimate evacuation trip, including the activity’s purpose,
location, and action time (i.e., day and time range); travel mode; and whether the activity is chained with
the ultimate trip. In addition to pre-evacuation activities, the survey also included questions about the
households’ socio-demographics and evacuation decisions (e.g., evacuation departure timing,
accommodation type at the destination).
Through open ended questions, the survey requested up to five of the most important, travel-involving
activities that respondents would participate in prior to departing for their ultimate evacuation destinations.
However, most respondents included activities that do not involve travel such as “close windows and
shutters.” The reported activity information was reviewed to extract details for subsequent analysis using
an activity-based approach. The out-of-home activities reported to be performed on the same day and
same time range (i.e., early morning, morning, afternoon, and night) using the same mode of
transportation are assumed to be performed in one tour - a circuit that begins and ends at the same
location (Bhat and Singh, 2000). A tour is usually composed of several stops where the specific activities

64
are pursued. This assumption stems from the consideration that households would minimize the number
of tours especially in an evacuation. In addition, as later analysis will demonstrate, the activities
performed in a tour generally have similar characteristics. Most households reported that they would shop
for essential items, such as food, gas, and medicine, and withdraw cash in a tour. Therefore, there is
reason to believe that households would group these stops in one tour. In this way, the original responses
are organized into a tour-based representation of the pre-evacuation activity travel throughout the entire
planning horizon.
After eliminating observations with missing values for preferred evacuation departure time, activity types
and activity scheduling information, such as action day and time range, a sample of 462 evacuating
households was assembled for subsequent analysis. The resulting dataset’s demographics are similar to
those reported for the Miami Beach area by the Department of Planning and Zoning (2011) of Miami-
Dade in terms of Hispanic ethnicity (38.7% (Sample) vs. 36.4% (Census)) and average household income
($30,000 to $50,000 (Sample) vs. $43,957 (Census)), though the average household size is somewhat
higher (2.25 (Sample) vs. 1.87 (Census)).
5.3 DESCRIPTIVE ANALYSIS
The descriptive analysis pertains to several dimensions of pre-evacuation activity travel behavior
including the tour characteristics (number of tours and stops), the specific activities, mode choice,
scheduling choices, and stop locations.
5.3.1 Tour Characteristics, Activity Type and Sequence
The sample contains 235 households that reported at least one tour. The remaining 227 households
indicated they would only perform in-home activities before departure. Most households (91%, 214 out of
235) would make a single tour for their evacuation preparations and we inferred that 19 households would
make two tours. Only two households would make three one-stop tours and one would evacuate on

65
Tuesday and the other on Wednesday. Among the single-tour households, approximately 78% would
make one stop, which might serve two purposes as shown in Table 5.2. As expected, the number of stops
in a tour decreases as the number of tours increases. Among the 19 households making two tours, only
two would make two stops on both tours. Note that the households’ complete activity travel information
is not available. Therefore, households may perform tours in addition to the ones analyzed here to follow
their daily routines. The tours reported might be considered as the additional tours made for evacuation
preparations.
Table 5.1 shows the distribution of activity combinations by number of tours and Table 5.2 describes the
distribution of the activity sequences performed at the stops. Here, the activities are described by specific
purposes (e.g., food or gas purchase) instead of general categories like shopping since evacuation
preparation activities are largely shopping activities.
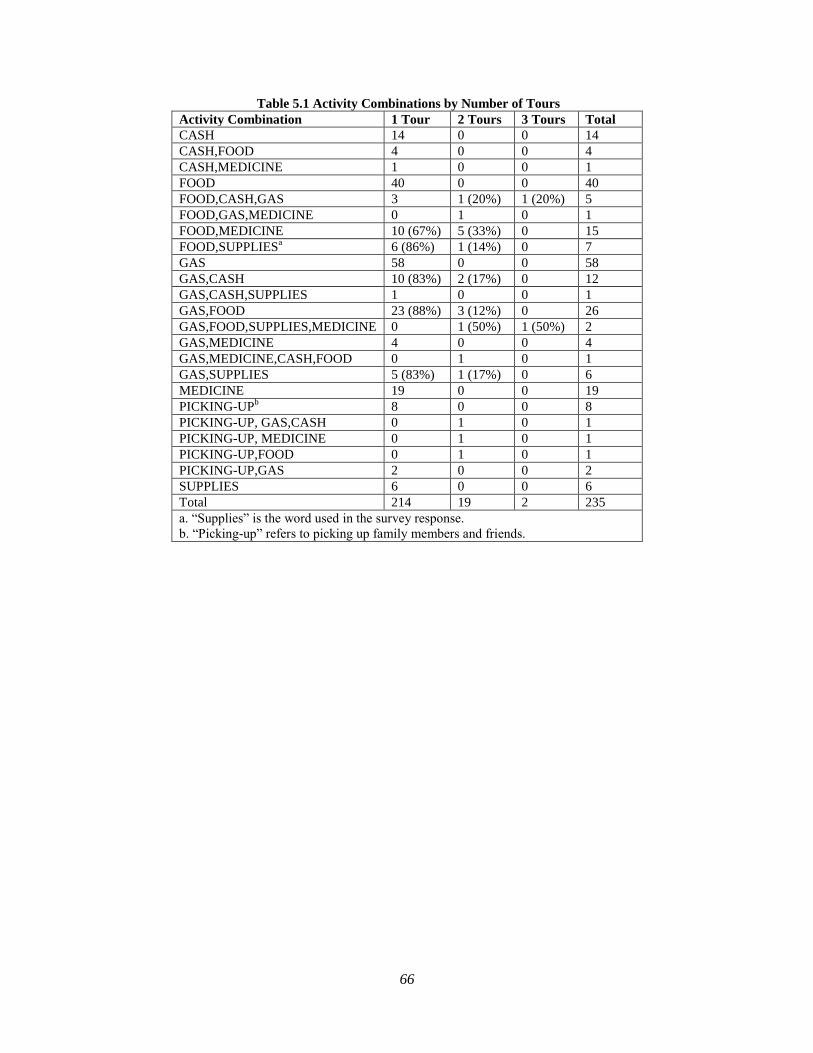
66
Table 5.1 Activity Combinations by Number of Tours
Activity Combination 1 Tour 2 Tours 3 Tours Total
CASH 14 0 0 14
CASH,FOOD 4 0 0 4
CASH,MEDICINE 1 0 0 1
FOOD 40 0 0 40
FOOD,CASH,GAS 3 1 (20%) 1 (20%) 5
FOOD,GAS,MEDICINE 0 1 0 1
FOOD,MEDICINE 10 (67%) 5 (33%) 0 15
FOOD,SUPPLIESa
6 (86%) 1 (14%) 0 7
GAS 58 0 0 58
GAS,CASH 10 (83%) 2 (17%) 0 12
GAS,CASH,SUPPLIES 1 0 0 1
GAS,FOOD 23 (88%) 3 (12%) 0 26
GAS,FOOD,SUPPLIES,MEDICINE 0 1 (50%) 1 (50%) 2
GAS,MEDICINE 4 0 0 4
GAS,MEDICINE,CASH,FOOD 0 1 0 1
GAS,SUPPLIES 5 (83%) 1 (17%) 0 6
MEDICINE 19 0 0 19
PICKING-UPb
8 0 0 8
PICKING-UP, GAS,CASH 0 1 0 1
PICKING-UP, MEDICINE 0 1 0 1
PICKING-UP,FOOD 0 1 0 1
PICKING-UP,GAS 2 0 0 2
SUPPLIES 6 0 0 6
Total 214 19 2 235
a. “Supplies” is the word used in the survey response.
b. “Picking-up” refers to picking up family members and friends.
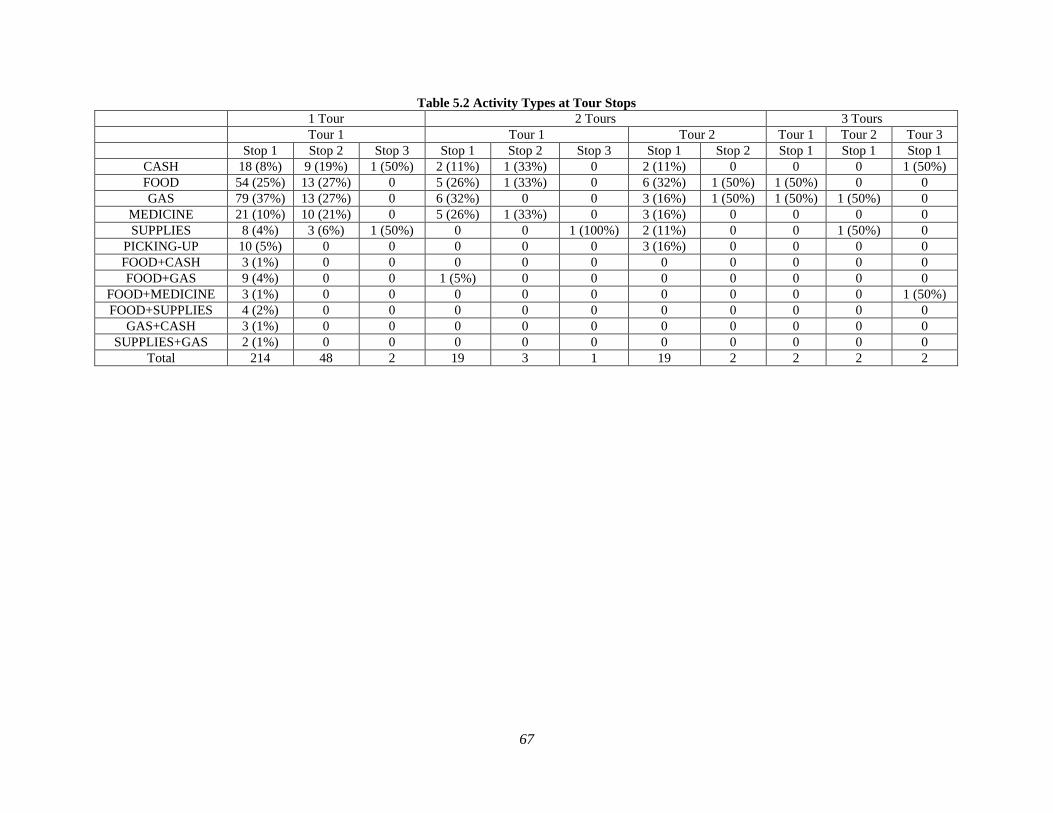
67
Table 5.2 Activity Types at Tour Stops
1 Tour 2 Tours 3 Tours
Tour 1 Tour 1 Tour 2 Tour 1 Tour 2 Tour 3
Stop 1 Stop 2 Stop 3 Stop 1 Stop 2 Stop 3 Stop 1 Stop 2 Stop 1 Stop 1 Stop 1
CASH 18 (8%) 9 (19%) 1 (50%) 2 (11%) 1 (33%) 0 2 (11%) 0 0 0 1 (50%)
FOOD 54 (25%) 13 (27%) 0 5 (26%) 1 (33%) 0 6 (32%) 1 (50%) 1 (50%) 0 0
GAS 79 (37%) 13 (27%) 0 6 (32%) 0 0 3 (16%) 1 (50%) 1 (50%) 1 (50%) 0
MEDICINE 21 (10%) 10 (21%) 0 5 (26%) 1 (33%) 0 3 (16%) 0 0 0 0
SUPPLIES 8 (4%) 3 (6%) 1 (50%) 0 0 1 (100%) 2 (11%) 0 0 1 (50%) 0
PICKING-UP 10 (5%) 0 0 0 0 0 3 (16%) 0 0 0 0
FOOD+CASH 3 (1%) 0 0 0 0 0 0 0 0 0 0
FOOD+GAS 9 (4%) 0 0 1 (5%) 0 0 0 0 0 0 0
FOOD+MEDICINE 3 (1%) 0 0 0 0 0 0 0 0 0 1 (50%)
FOOD+SUPPLIES 4 (2%) 0 0 0 0 0 0 0 0 0 0
GAS+CASH 3 (1%) 0 0 0 0 0 0 0 0 0 0
SUPPLIES+GAS 2 (1%) 0 0 0 0 0 0 0 0 0 0
Total 214 48 2 19 3 1 19 2 2 2 2

68
Table 5.3 The Mode Choice, Action Day and Action Time Range of the Tours
1 Tour 2 Tours 3 Tours
Mode Choice Tour 1 Tour 1 Tour 2 Tour 1 Tour 2 Tour 3
CAR 185 (86%) 17 (89%) 19 (100%) 2 (100%) 1 (50%) 2 (100%)
WALK 12 (6%) 2 (11%) 0 0 1 (50%) 0
TRANSIT 17 (8%) 0 0 0 0 0
Action Day
1 (Sat.) 63 (29%) 9 (47%) 1 (5%) 1 (50%) 0 0
2 (Sun.) 36 (17%) 8 (42%) 8 (42%) 1 (50%) 1 (50%) 0
3 (Mon.) 51 (24%) 1 (5%) 3 (16%) 0 1 (50%) 2 (100%)
4 (Tue.) 42 (20%) 1 (5%) 6 (32%) 0 0 0
5 (Wed.) 22 (10%) 0 1 (5%) 0 0 0
Action Time Range
Early Morning (12:00 am ~ 6: 00 am) 2 (1%) 0 0 0 0 0
Morning (6:00 am ~ 12: 00 pm) 163 (76%) 15 (79%) 11 (58%) 2 (100%) 1 (50%) 0
Afternoon (12:00 pm ~ 6: 00 pm) 39 (18%) 3 (16%) 8 (42%) 0 1 (50%) 1 (50%)
Night (6:00 pm ~ 12: 00 am) 10 (5%) 1 (5%) 0 0 0 1 (50%)
Total 214 (100%) 19 (100%) 19 (100%) 2 (100%) 2 (100%) 2 (100%)
69
Most households perform their preparation activities in one tour. Only three households reported four
activities, which would be performed in multiple tours. When households intend to pick up friends or
relatives and buy medicine or food, they make separate tours. Activities may be under-reported. For
example, 58 households report only one activity, fueling their vehicles, but in reality, may engage in other
activities.
Food or gas purchases are the most common activity type at stop 1 regardless of the number of tours
made. Buying medicine and withdrawing cash following the purchase of food or gas are also commonly
reported. Only 13 households reported they would pick up friends and/or relatives who may rely on
respondents’ vehicles for evacuation as suggested by Wu et al. (Wu et al., 2012). If the first stop serves
two purposes, households making only one tour would not make additional stops. In terms of the activity
sequence, many different permutations were reported, which is understandable since the activities
reported are all common and their sequence is subject to personal preferences.
5.3.2 Tour Travel Mode
Three modes were reported: driving, taking transit, and walking. Table 5.3 provides the distribution of
travel modes by number of tours. Driving is the dominant mode, underscoring the importance of
modeling the travel derived from these pre-evacuation activities since the vehicular traffic would exert
additional pressure on the local transportation network. Walking and transit are also chosen by some
single-tour households; possibly, households choose stores close to their homes to save time. Among the
13 cases of picking-up activities, driving was chosen by 12 while only one would use transit.
5.3.3 Tour Scheduling
Tour scheduling refers to the day and time households would perform their tours. Households have
different planning horizons for their pre-evacuation activities due to their varied evacuation departure

70
times. The planning horizon is the temporal duration from 12:00 AM Saturday2 (10 hours prior to
evacuation notice) until a household’s evacuation departure time. Households that leave early perform
activities in a relatively short period of time, while those leaving late have more scheduling options. Table
5.3 shows the distribution of the action days by number of tours.
More households would perform their preparation activities early, indicated by the decreasing percentage
for the first tour as hurricane landfall approaches. Approximately 70% of the households indicated they
would perform their first tour in the first three days if they have one tour. For those making two tours,
almost 90% would perform the tours in the first two days while both three-tour households perform the
first tour in the first two days. This suggests that households would like to start the evacuation preparation
early, which allows them more time to purchase necessary items and thus minimizes the risk of forgetting
essential items. More than 75% of the households (16 out of 21) who would make multiple tours perform
the second tour on the same day of or the day following the day of their first tour. Only four households
would wait two days until their second tours and one household would wait three days until the second
tour. This suggests that most households prefer to perform their out-of-home preparation activities in a
temporally concentrated manner. Other factors, such as the activity types and the length of the planning
horizon, are likely to contribute to the tour scheduling and are investigated in later multi-variable
statistical analysis.
Due to the survey design, the respondents indicated time ranges such as “Morning” and “Afternoon” for
their action time instead of precise times. Table 5.3 documents the distribution of the action time range by
number of tours.
2 A few respondents indicated that they would evacuate prior to the evacuation notice. The start of the planning
horizon was selected to capture all evacuees.
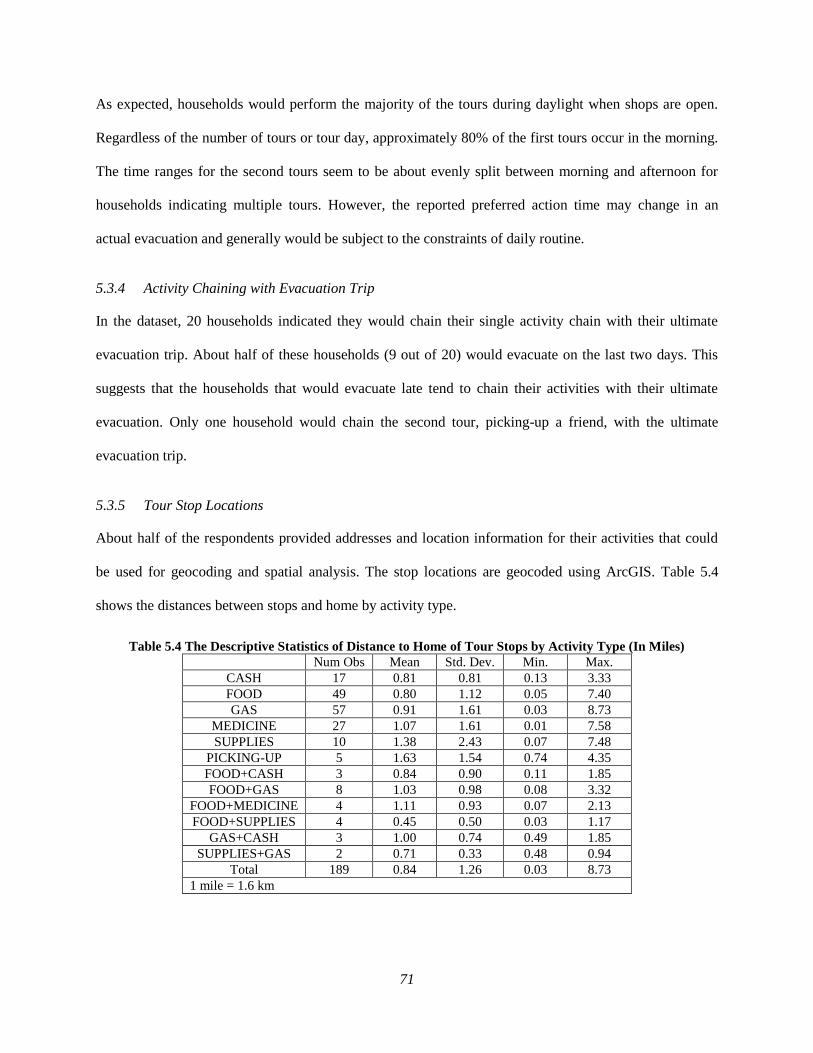
71
As expected, households would perform the majority of the tours during daylight when shops are open.
Regardless of the number of tours or tour day, approximately 80% of the first tours occur in the morning.
The time ranges for the second tours seem to be about evenly split between morning and afternoon for
households indicating multiple tours. However, the reported preferred action time may change in an
actual evacuation and generally would be subject to the constraints of daily routine.
5.3.4 Activity Chaining with Evacuation Trip
In the dataset, 20 households indicated they would chain their single activity chain with their ultimate
evacuation trip. About half of these households (9 out of 20) would evacuate on the last two days. This
suggests that the households that would evacuate late tend to chain their activities with their ultimate
evacuation. Only one household would chain the second tour, picking-up a friend, with the ultimate
evacuation trip.
5.3.5 Tour Stop Locations
About half of the respondents provided addresses and location information for their activities that could
be used for geocoding and spatial analysis. The stop locations are geocoded using ArcGIS. Table 5.4
shows the distances between stops and home by activity type.
Table 5.4 The Descriptive Statistics of Distance to Home of Tour Stops by Activity Type (In Miles)
Num Obs Mean Std. Dev. Min. Max.
CASH 17 0.81 0.81 0.13 3.33
FOOD 49 0.80 1.12 0.05 7.40
GAS 57 0.91 1.61 0.03 8.73
MEDICINE 27 1.07 1.61 0.01 7.58
SUPPLIES 10 1.38 2.43 0.07 7.48
PICKING-UP 5 1.63 1.54 0.74 4.35
FOOD+CASH 3 0.84 0.90 0.11 1.85
FOOD+GAS 8 1.03 0.98 0.08 3.32
FOOD+MEDICINE 4 1.11 0.93 0.07 2.13
FOOD+SUPPLIES 4 0.45 0.50 0.03 1.17
GAS+CASH 3 1.00 0.74 0.49 1.85
SUPPLIES+GAS 2 0.71 0.33 0.48 0.94
Total 189 0.84 1.26 0.03 8.73
1 mile = 1.6 km
72
The stop locations are fairly close to respondents’ homes, with less than 2 mile average distance. All pick-
up locations were reported to be in Miami Beach. Households generally travel farther for supplies and
picking-up activities. Some households (9 out of 235) travel relatively longer distances to major shopping
locations located outside Miami Beach to buy food, gas, medicine, or supplies. The distance between the
first stop and second stop for multi-stop tours has a mean of 0.90 miles with a standard deviation of 1.81
miles, suggesting that the stops are generally close to each other.
5.4 BEHAVIORAL MODELING FOR PRE-EVACUATION ACTIVITIES
Quantitative assessment of the effects of household characteristics and other relevant evacuation decisions
on the pre-evacuation activity participation behavior facilitates a detailed demand representation and
subsequent predictive analysis for hurricane evacuation simulations. Two decisions are investigated
further. First, the decision to engage in out-of-home activities (or not) is modeled using a binary logit
model. An ordered logit model was developed using the number of tours as the dependent variable;
however, due to the limited number of multi-tour households, the validity of the ordered logit
specification cannot be verified using Brant’s test for the parallel regression assumption suggested by
Greene and Hensher (2010). Therefore, the binary choice specification for whether to engage in out-of-
home activities is adopted.
Households’ choices of engaging in specific activities (e.g., buying food) listed in Table 5.1 are not
modeled econometrically due to limited numbers of cases for some activity combinations. However, the
activity combinations and sequences can be simulated using the distributions described in Table 5.1 and
Table 5.2 as discussed later for demand generation for traffic simulation.
Second, the action day choice for the first tour is examined using a discrete hazard-based duration model.
Ideally, the action timing expressed in minutes would be modeled as in Bhat et al. (2002) for regular
planning, if that level of post-storm data were available. The temporal resolution for the action timing

73
modeling adopted here is day instead of time ranges of specific days. The time ranges are not
econometrically modeled because the time range is not an accurate measuring unit that precisely describes
time. The time ranges for the intended activity action time are dominantly morning and afternoon and the
split between morning and afternoon exhibits limited variation by the number of tours and the day of the
tours. The distribution depicted in Table 5.3 serves reasonably well for generating specific action timing
ranges for evacuation demand modeling. In addition, due to insufficient observations (21 households
making multiple tours) the estimation of separate models for action days for the second and third tours is
not possible. However, the descriptive analysis shows that the temporal difference between the second
tour and the first tour is generally less than one day for the majority of households, which serves as the
behavioral foundation for demand simulation purposes. Hence, this paper only models the action day
choice for the first tour.
The households’ socio-demographic characteristics are investigated during the process of model
construction. The procedure proposed by Hosmer and Lemeshow (2000) is followed by first constructing
the uni-variable models to examine the effects of individual covariates. Then, a full model that contains
all covariates that bear practical and individual statistical significance is constructed and the insignificant
covariates are then removed based on likelihood ratio tests.
5.4.1 Out-of-Home Activity Participation Choice
As mentioned above, 235 households reported at least one tour and 227 households would only stay home
before departure. Since whether a household would engage in any activity that requires travel is a
dichotomous response, a binary logit model is used to investigate this decision. Let random variable Y
take the value “1” if the household participates in at least one out-of-home activity before evacuation
departure and “0” otherwise. Then the binary logit model specifies that the probability that a household
would participate in at least one out-of-home activity is given by Eq.(5.1) (Greene, 2012),

74
( )
( )
( )
(5.1)
where x is a vector of explanatory variables and β is the coefficient vector. The model parameters are
estimated using STATA by maximum likelihood estimation by treating each observation as a single draw
from a Bernoulli distribution with the probability specified in Eq.(5.1).
The available covariates fall into two categories: evacuation decisions and household characteristics as
listed in Table 5.5. Since existing literature does not provide guidance for the selection of the variables for
these particular decisions, the selection is led by the univariable odds ratio analysis.
5.4.1.1 Association between the Covariates and the Out-of-Home Activity Participation Choice
The households’ mode choice for evacuation has a statistically significant impact upon the out-of-home
activity participation choice. Driving their own vehicles (73.3%) is the dominant evacuation mode,
consistent with previous findings such as (Wu et al., 2012). Households that would evacuate in their own
vehicles are more likely to engage in out-of-home activities while households that would evacuate using
transit, carpools, or other modes are much less likely to perform activities that require travel. This is
possibly because their lack of mobility increases the difficulty of shopping and performing other out-of-
home activities.
Some socio-demographic characteristics are also statistically significant. Households with relatively low
income and limited education attainment are more likely to perform only in-home activities. The odds
ratios for households with income less than $10,000 and for those with less than high-school education
suggest that these households are almost twice as likely to perform only in-home activities. As expected,
households with relatively better economic conditions are more likely to engage in out-of-home activities,
evidenced by the larger-than-unity odds ratio for the single family home dwellers. In addition, a larger
household is more likely to engage in out-of-home activities possibly because they need more supplies for

75
their evacuation trip. More children under 12 years old and more adults between 19 and 64 years old lead
to increasing likelihood of engaging in out-of-home activities, which may be because the children have
more needs and households with more adults have the personnel to perform out-of-home activities. This is
further illustrated by the less-than-unity odds ratio of the number of household members over 64 years old.
One more over-64-years member leads to a 31% (100%×(1-0.697)) decrease in odds to perform any out-
of-home activity possibly due to mobility constraints faced by senior citizens.
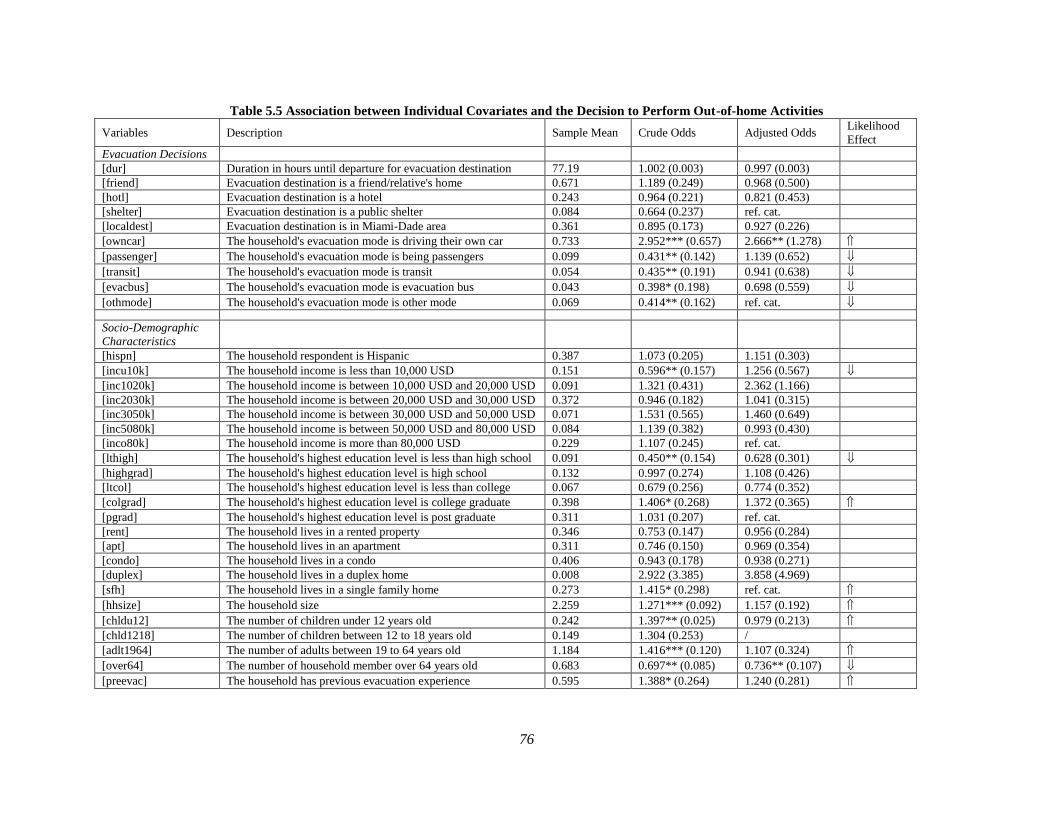
76
Table 5.5 Association between Individual Covariates and the Decision to Perform Out-of-home Activities
Variables Description Sample Mean Crude Odds Adjusted Odds Likelihood
Effect
Evacuation Decisions
[dur] Duration in hours until departure for evacuation destination 77.19 1.002 (0.003) 0.997 (0.003)
[friend] Evacuation destination is a friend/relative's home 0.671 1.189 (0.249) 0.968 (0.500)
[hotl] Evacuation destination is a hotel 0.243 0.964 (0.221) 0.821 (0.453)
[shelter] Evacuation destination is a public shelter 0.084 0.664 (0.237) ref. cat.
[localdest] Evacuation destination is in Miami-Dade area 0.361 0.895 (0.173) 0.927 (0.226)
[owncar] The household's evacuation mode is driving their own car 0.733 2.952*** (0.657) 2.666** (1.278)
[passenger] The household's evacuation mode is being passengers 0.099 0.431** (0.142) 1.139 (0.652)
[transit] The household's evacuation mode is transit 0.054 0.435** (0.191) 0.941 (0.638)
[evacbus] The household's evacuation mode is evacuation bus 0.043 0.398* (0.198) 0.698 (0.559)
[othmode] The household's evacuation mode is other mode 0.069 0.414** (0.162) ref. cat.
Socio-Demographic
Characteristics
[hispn] The household respondent is Hispanic 0.387 1.073 (0.205) 1.151 (0.303)
[incu10k] The household income is less than 10,000 USD 0.151 0.596** (0.157) 1.256 (0.567)
[inc1020k] The household income is between 10,000 USD and 20,000 USD 0.091 1.321 (0.431) 2.362 (1.166)
[inc2030k] The household income is between 20,000 USD and 30,000 USD 0.372 0.946 (0.182) 1.041 (0.315)
[inc3050k] The household income is between 30,000 USD and 50,000 USD 0.071 1.531 (0.565) 1.460 (0.649)
[inc5080k] The household income is between 50,000 USD and 80,000 USD 0.084 1.139 (0.382) 0.993 (0.430)
[inco80k] The household income is more than 80,000 USD 0.229 1.107 (0.245) ref. cat.
[lthigh] The household's highest education level is less than high school 0.091 0.450** (0.154) 0.628 (0.301)
[highgrad] The household's highest education level is high school 0.132 0.997 (0.274) 1.108 (0.426)
[ltcol] The household's highest education level is less than college 0.067 0.679 (0.256) 0.774 (0.352)
[colgrad] The household's highest education level is college graduate 0.398 1.406* (0.268) 1.372 (0.365)
[pgrad] The household's highest education level is post graduate 0.311 1.031 (0.207) ref. cat.
[rent] The household lives in a rented property 0.346 0.753 (0.147) 0.956 (0.284)
[apt] The household lives in an apartment 0.311 0.746 (0.150) 0.969 (0.354)
[condo] The household lives in a condo 0.406 0.943 (0.178) 0.938 (0.271)
[duplex] The household lives in a duplex home 0.008 2.922 (3.385) 3.858 (4.969)
[sfh] The household lives in a single family home 0.273 1.415* (0.298) ref. cat.
[hhsize] The household size 2.259 1.271*** (0.092) 1.157 (0.192)
[chldu12] The number of children under 12 years old 0.242 1.397** (0.025) 0.979 (0.213)
[chld1218] The number of children between 12 to 18 years old 0.149 1.304 (0.253) /
[adlt1964] The number of adults between 19 to 64 years old 1.184 1.416*** (0.120) 1.107 (0.324)
[over64] The number of household member over 64 years old 0.683 0.697** (0.085) 0.736** (0.107)
[preevac] The household has previous evacuation experience 0.595 1.388* (0.264) 1.240 (0.281)

77
The covariates that pass the 0.25 significance threshold (2000) are considered in the following multi-
variable modeling. The empirical results of the final model are shown in Table 5.6.
Table 5.6 Estimation Results of the Model for Out-of-Home Activity Participation Choice
Variable Coefficient Average Marginal Effect
Whether household has a college graduate 0.325* (0.198) 0.075* (0.046)
Household size 0.136* (0.0732) 0.032* (0.0167)
The number of household members older than 64 -0.273** (0.126) -0.063** (0 .028)
The evacuation travel mode is driving their own
car 0.919*** (0.231) 0.217*** (0.052)
Constant -0.893*** (0.268)
Number of Observations: 462, Log-Likelihood = -301.429, Outcome = 1 represents households
performing at least one out-of-home activity. χ2= 37.47 and P-value for chi-square test < 0.001
Pseudo R2 = 0.059; Area under ROC = 0.659
Standard errors in parentheses, *** p<0.01, ** p<0.05, * p<0.1
The model is statistically significant as shown by the likelihood chi-square test whose null hypothesis that
all coefficients are zero is rejected at the 0.001 significance level. The area under the Receiver Operating
Characteristic (ROC) curve measures the models’ discrimination capacity. is the value 0.659 suggests
acceptable, although not excellent, explanatory power (2000).
Table 5.6 also shows the average partial effect, which supplements the coefficient estimates in the
examination of individual covariates’ effects. The parameters of the model generally do not equal the
marginal effects due to the logit model’s non-linear nature. To examine the individual covariates’ effects
upon the probability of performing any out-of-home activities, we consider the marginal effects, which
depend on the specific covariate values. The marginal effects at every observation are evaluated and then
averaged to derive the average partial effect (APE), which is favored by current practice (Greene, 2012).
Four variables show statistically significant effects upon the out-of-home activity participation choice.
Households with college graduates are more likely to engage in activities that require travel. The APE
indicates that having college graduates increases the probability of engaging in out-of-home activities by
0.08 with other variables held unchanged. Larger households are more likely to participate in out-of-home
78
activities, evidenced by the positive APE suggesting one more person leads to an increase of the
probability of participating in out-of-home activities by 0.032, possibly because large households require
more evacuation related shopping activities. The number of people older than 64 has a negative impact
upon engaging in out-of-home activities. One more household member older than 64 decreases the
probability of participating in any out-of-home activity by 0.063 holding other variables constant. The
households who choose to drive their own vehicles are more likely to participate in out-of-home activities.
Though some households reported that they would not engage in any out-of-home activities, they may not
actually stay home until they evacuate. A more practical interpretation might be that they would not make
dedicated tours for evacuation preparation but they may still follow their daily routines.
5.4.2 Action Day Choice for the 1st Tour for Out-of-Home Activities
It is assumed that households have decided their evacuation departure times and they need to schedule
their tours for pre-evacuation activities in the planning horizon determined by the evacuation time. Since
the action day is a discrete time response, it is modeled via a discrete-time hazard-based survival model,
defined as the conditional probability of making the first tour at a time point given that the tour has not
been conducted in previous time steps. Discrete-time hazard-based survival models can be converted to
standard models for dichotomous responses such as the standard logit model (2012) (Eq.(5.1)). Let be
an indicator for making the first tour at time s for household i and , ,…, are dummy variables
for days from Saturday to Wednesday. Then the logit of the discrete-time hazard is given by Eq.(5.2),
{ ( )} (5.2)
where is a column vector storing the five dummy variables , ,…, and , ( ) is
the coefficient vector for the baseline hazard, x is a vector of explanatory variables, and β is the
coefficient vector for the explanatory variables.
Since dummy variables are used, this discrete-time hazard-based survival model has a non-parametric
nature and the intercept represents Saturday. The model can be estimated using maximum likelihood
79
estimation for a standard logit model should the dataset be expanded according to the procedure proposed
by Rabe-Hesketh and Skrondal (2012). In general, each household should be represented by a row of data
for each day the household could make the first tour. For example, if a household makes the first tour on
day 3, this record should be expanded into three replications and an indicator variable signifies the actual
day that the tour occurs.
A similar model-building procedure is used as for the out-of-home activity participation choice.
Individual uni-variable models are constructed for all the covariates listed in Table 5.5 but only the length
of the planning horizon, the tour’s activity types, and the number of tours are statistically significant at the
0.25 level and used in the multi-variable modeling. The effects of socio-demographic characteristics are
already captured by the types of activities the households decide to participate in, which have been
included as covariates in the multi-variable model. The statistical insignificance of socio-demographic
characteristics was observed in some of the activity scheduling models developed by Bhat et al. (2002)
for regular planning purposes.
The estimation results for the action day choice model for making the first tour are shown in Table 5.7.
Since the model formulation is converted to a standard logit specification, the measures of fit for standard
logit models are equally applicable here. The overall high statistical significance of the model is
evidenced by the likelihood chi-square test with a p-value less than 0.001. The area under the ROC curve
is 0.799 for the model, which suggests excellent explanatory power (2000).
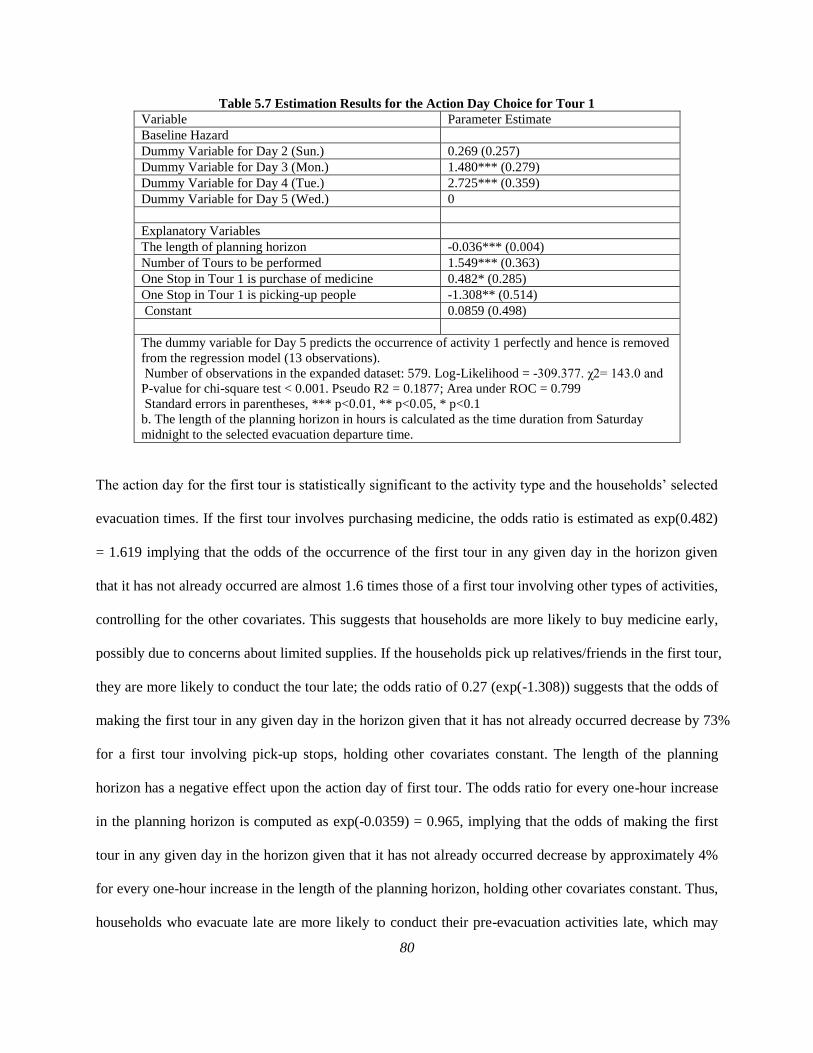
80
Table 5.7 Estimation Results for the Action Day Choice for Tour 1
Variable Parameter Estimate
Baseline Hazard
Dummy Variable for Day 2 (Sun.) 0.269 (0.257)
Dummy Variable for Day 3 (Mon.) 1.480*** (0.279)
Dummy Variable for Day 4 (Tue.) 2.725*** (0.359)
Dummy Variable for Day 5 (Wed.) 0
Explanatory Variables
The length of planning horizon -0.036*** (0.004)
Number of Tours to be performed 1.549*** (0.363)
One Stop in Tour 1 is purchase of medicine 0.482* (0.285)
One Stop in Tour 1 is picking-up people -1.308** (0.514)
Constant 0.0859 (0.498)
The dummy variable for Day 5 predicts the occurrence of activity 1 perfectly and hence is removed
from the regression model (13 observations).
Number of observations in the expanded dataset: 579. Log-Likelihood = -309.377. χ2= 143.0 and
P-value for chi-square test < 0.001. Pseudo R2 = 0.1877; Area under ROC = 0.799
Standard errors in parentheses, *** p<0.01, ** p<0.05, * p<0.1
b. The length of the planning horizon in hours is calculated as the time duration from Saturday
midnight to the selected evacuation departure time.
The action day for the first tour is statistically significant to the activity type and the households’ selected
evacuation times. If the first tour involves purchasing medicine, the odds ratio is estimated as exp(0.482)
= 1.619 implying that the odds of the occurrence of the first tour in any given day in the horizon given
that it has not already occurred are almost 1.6 times those of a first tour involving other types of activities,
controlling for the other covariates. This suggests that households are more likely to buy medicine early,
possibly due to concerns about limited supplies. If the households pick up relatives/friends in the first tour,
they are more likely to conduct the tour late; the odds ratio of 0.27 (exp(-1.308)) suggests that the odds of
making the first tour in any given day in the horizon given that it has not already occurred decrease by 73%
for a first tour involving pick-up stops, holding other covariates constant. The length of the planning
horizon has a negative effect upon the action day of first tour. The odds ratio for every one-hour increase
in the planning horizon is computed as exp(-0.0359) = 0.965, implying that the odds of making the first
tour in any given day in the horizon given that it has not already occurred decrease by approximately 4%
for every one-hour increase in the length of the planning horizon, holding other covariates constant. Thus,
households who evacuate late are more likely to conduct their pre-evacuation activities late, which may

81
be ascribed to more timing choices due to a longer planning horizon. As expected, the number of tours
has a positive effect upon the action day of the first tour; the odds ratio is estimated as exp(1.549) = 4.71
implying that an increase in number of tours substantially increases the odds of the first tour occurring on
a given day given that it has not already occurred, controlling for the other covariates. This suggests that
the households with multiple tours tend to make their first tour early possibly because it allows more time
to make subsequent tours.
5.5 CONCLUSIONS AND FUTURE DIRECTIONS
This paper presents an analysis of the households’ pre-evacuation activities for hurricane evacuation
based on behavioral intention data collected for Miami Beach, Florida. Descriptive analysis offers
insights into activity types of the tours, travel mode, and scheduling and activity locations in terms of
travel distance from home and between tour stops. Econometric models then identify the contributing
factors to the out-of-home activity participation choice and the action day choice of the first tour.
The descriptive analysis shows that shopping accounts for the dominant proportion of preparation
activities. The specific items reported include food, gasoline, medicine, and withdrawal of cash. Thus, it
is important to maintain a steady supply of these items or to increase these supplies before the evacuation.
In terms of tour making behavior, most households would make a single tour, but multiple tours are
observed. More than 90% of the tours are conducted by driving, which highlights the importance of
incorporating pre-evacuation activity travel into simulation studies. Since this traffic exerts additional
pressure on the local transportation network, traffic management strategies might be needed on major
roads and in areas where preparation activities concentrate. Furthermore, strategies implemented without
considering pre-evacuation activities may hinder the overall evacuation process unless carefully timed.

82
The tours’ action days indicate that households perform their preparation activities early, allowing them
more time to make purchases and minimizing the risk of forgetting essential items. More than 75% of the
households who would make multiple tours perform the second tour on the same day of or the day
following their first tour. Households would generally make the tours during daylight, as expected; 80%
of the first tours would be performed in the morning and the second tours are about evenly split between
morning and afternoon for households indicating multiple tours. About 10% of the households chain their
single activity chains with their ultimate evacuation trips. About half of these households would evacuate
on the last two days. Thus, households that would evacuate late tend to chain their activities with their
ultimate evacuation. The activity locations are fairly close to respondents’ homes though households
generally travel farther for supplies and picking-up activities. Only a few households travel longer
distances to major shopping locations located outside Miami Beach. The close distance between the first
and second stops suggests that the stops are generally close together.
Two decisions are investigated further. The participation in the activities that involve travel is
investigated via a binary logit model; four variables are statistically significant. Households with college
graduates, larger households, and households who drive their own vehicles are more likely to engage in
activities that require travel. The number of people older than 64 has a negative impact upon engaging in
out-of-home activities.
The action day for the first tour is examined using the discrete-time hazard-based survival model and is
statistically significantly related to the activity type, household’s selected evacuation time, and the
number of tours. If the first tour involves purchasing medicine, the households are more likely to buy
medicine early possibly due to concerns about limited supplies. If the households pick up relatives/friends
in the first tour, they are more likely to conduct the tour late. Households who evacuate late are more
83
likely to conduct their pre-evacuation activities late. Finally, households with multiple tours tend to make
their first tour early.
The behavioral findings regarding the pre-evacuation activities can be used, in conjunction with models
of other evacuation related decisions, to generate demand for traffic simulation applications and the
authors are currently pursuing this in an agent-based demand simulation model. Once the activity
planning horizon is calculated based on evacuation departure time determined by other behavioral models
such as the one in (Hasan et al., 2013a), the generation and scheduling of the evacuation-related activities
can be achieved via the distributions showed in the descriptive analysis and behavioral models in this
paper. The out-of-home activity participation choice model determines whether a household would
perform any out-of-home activities. Then the number of tours can be simulated using the descriptive
distribution. The specific activities and their sequence can then be simulated based on the activity type
distribution and the relationship between the number of tours and stops. The day for the first tour can then
be based on the action day choice model and the time ranges can be simulated using the frequency
distribution by number of tours. The background demand can be derived from traditional planning models.
5.5.1 Future Directions
Ideally, households’ complete activity travel sequences over the entire evacuation planning horizon would
be documented. However, it seems impractical to ask evacuees to keep a travel diary during an evacuation.
Therefore, novel data collection methods are needed to obtain a complete travel record in order to fully
model the pre-evacuation activities. In addition, if the hurricane characteristics are also available, the
activity scheduling may be modeled from a dynamic perspective such as the one proposed by Gudishala
and Wilmot (2012a).
ACKNOWLEDGEMENTS

84
The research presented in this paper was supported by National Science Foundation Award SES-0826873
for which the authors are grateful. However, the authors are solely responsible for the findings in this
document.
85
CHAPTER 6 THE SIMULATION MECHANISM AND
IMPLEMENTATION OF THE AGENT-BASED DEMAND MODEL
SYSTEM
This chapter presents a paper that is currently under peer review. It was co-authored by Weihao Yin and
Pamela Murray-Tuite
ABSTRACT
This paper develops an agent-based travel demand model system for hurricane evacuation simulation,
which is capable of generating the comprehensive household activity-travel plans. The system
implements econometric and statistical models that represent travel and decision-making behavior
throughout the evacuation process. The system considers six typical evacuation decisions: evacuate/stay,
accommodation type choice, evacuation destination choice, mode choice, vehicle usage choice and
departure time choice. It explicitly captures the shadow evacuation population. In addition, the model
system captures the pre-evacuation preparation activities using an activity-based approach.
A demonstration study that predicts activity-travel patterns using model parameters estimated for the
Miami-Dade area is discussed. The simulation results clearly indicate the model system produced the
distribution of choice patterns that is consistent with sample observations and existing literature. The
model system also identifies the proportion of the shadow evacuation population and their geographical
extent. About 23% of the population outside the designated evacuation zone would evacuate. The shadow
evacuation demand is mainly located within 5 km of the coastline. The output demand of the model
system works with agent-based traffic simulation tools and conventional trip-based simulation tools.
Keywords: Agent-based Simulation; Travel Demand; Hurricane Evacuation

86
6.1 INTRODUCTION
Hurricane evacuation is a highly complex and dynamic process, which is generally modeled using
simulation-based tools (Pel et al., 2012). Simulation abstractions of the evacuation process require
accurate representations of evacuation demand, which is governed by many factors, such as hurricane
trajectory, warning system, and household characteristics (Baker, 1991b; Gladwin et al., 2001; Murray-
Tuite and Wolshon, 2013b; Urbina and Wolshon, 2003). This paper presents an agent-based model
system that captures household evacuation travel decisions and converts them into activity plans.
During an evacuation, households encounter a series of related decisions: whether to evacuate, when, to
where, and by which mode, among other decisions. These decisions lead to the ultimate evacuation trips
which constitute a large proportion of the evacuation demand. However, the demand also includes trips
derived from pre-evacuation preparation activities, which can span several hours or days (Wolshon et al.,
2009). These activities generate local traffic that was ignored in most previous evacuation simulation
studies, possibly due to data unavailability, yet this local traffic contributes to overall congestion.
Therefore, pre-evacuation activity travel should be considered in the demand representation.
Agent-based modeling and simulation (ABMS) is a useful approach to represent this complicated
decision-making process. ABMS employs autonomous agents that can interact with the artificial
surrounding environment (North and Macal, 2007). An agent has a set of attributes and behavioral
characteristics. The attributes define an agent’s identity and the behavioral characteristics define what an
agent does (North and Macal, 2007). When a household is modeled as an agent, typical attributes include
household size, number of children, and number of seniors. Agents’ behavioral features can include
decision rules to select actions, adaptation capabilities to learn from experiences, perceptual capabilities
to sense surroundings, and optional internal mechanisms to project decisions’ potential consequences

87
(North and Macal, 2007). For evacuation decision modeling, the behavioral characteristics can be
constructed using econometric models and other findings from evacuation behavioral studies.
The advantages of the ABMS framework over other approaches in evacuation modeling are threefold.
First, the households have different characteristics which lead to different behaviors. Even if the
households have identical characteristics, they may choose different actions due to unobserved taste
variation (Train, 2002). The agent is a useful abstraction capable of handling such behavior, especially for
capturing shadow evacuation, largely due to households’ different perceptions of risk. However, an
aggregate demand modeling technique, usually applied in trip-based simulation models, generally fails to
recognize taste variation. Second, ABMS can capture the evacuation decisions and preparation activity
travel in a consistent and integrated manner. Households, the agents, are the actual entities that make
evacuation decisions and they are also the trip-makers that conduct pre-evacuation travel and the ultimate
evacuation trips. In comparison, the analysis units of conventional trip-based simulation models are
individual trips generated at the level of traffic analysis zones (TAZs). This discrepancy renders coherent
modeling of decision-making and trip-making behavior difficult, if not impossible. Finally, agents can
interact with the external environment, such as hurricane characteristics. The external environment
abstraction in the ABMS framework allows incorporation of these aspects of the evacuation process.
Therefore, the ABMS framework is particularly suitable for simulating households’ behaviors and
exploring emergent collective phenomena in evacuation (Zhang et al., 2009).
In prior evacuation ABMS studies, the agent assumes different appearances in different transport
simulation applications. Some studies (e.g., those using the microscopic simulation package VISSIM)
define agents as cars that follow a certain car-following logic (PTV, 2011). Adopting this convention,
Chen et al. (2006) evaluated various evacuation scenarios for Florida Keys using VISSIM. They
generated evacuation demand at the level of evacuation zones. Other studies that considered cars as

88
agents focused on evacuation route choice. For example, Handford and Rogers (2011) considered agents’
familiarity with local routes. Zhang et al. (2009) explicitly dealt with the risk-taking preference for
evacuees in route choice by categorizing the households as “normal” and “greedy” agents in hurricane
evacuation.
A few studies considered decision-making entities as agents, an alternative to defining cars to be agents.
Notable examples include Wolshon et al. (2009),Montz et al. (2011) and Montz and Zhang (2013) who
applied the ABS package TRANSIMS (Ley, 2009) to hurricane evacuation. Though the households were
modeled as agents, the households’ decisions and behavior were still treated at the aggregate level. A
simplifying assumption was made regarding the evacuation trips and departure time: the departure time
distribution was not associated to evacuees’ characteristics, rather departure time was assigned based on a
zone-level sequential logit model (Montz et al., 2011). A similar approach was used with regard to
destination choice and they did not consider pre-evacuation preparation activities explicitly.
ABMS has also been used in pedestrian evacuation (e.g., Lämmel et al. (2010), Liu et al. (2008)). Santos
and Aguirre (2004) provided a comprehensive review of the simulation-based evacuation models for
pedestrian evacuation in buildings. Though the applications of ABS to hurricane evacuation are limited,
ABS has received attention in general transportation planning for daily commutes (e.g., Balmer et al.
(2006), Balmer et al. (2009)).
This paper applies the ABMS approach to develop a model system that generates evacuation demand,
including pre-evacuation preparation activities in addition to a series of evacuation decisions. This paper
makes the following contributions:
The proposed system is the first comprehensive agent-based evacuation demand model system. It
differs from previous TRANSIMS applications in that it relies on stochastic simulation with
agents completely characterized by household-level behavioral models and findings. It flexibly

89
represents evacuation decisions by allowing different behavioral model specifications and
modeling order;
It explicitly captures shadow-evacuation demand, leading to a more realistic representation of the
evacuate-stay choice;
It statistically considers the choice of the number of evacuation vehicles through explanatory
factors;
It explicitly models pre-evacuation trips using an activity-based approach. The incorporation of
the pre-evacuation trips enhances the accuracy of the demand representation; and
The output of the model system is evacuation demand represented by activity plans, which can be
used for both agent-based traffic simulation tools, such as TRANSIMS and MATSIM, and
mesocopic trip-based simulation tools, such as Dynus-T (Chiu et al., 2010).
The survey data used for developing the model components come from three surveys: a post-Hurricane
Ivan, hypothetical hurricane in Miami, and post-Hurricane Wilma survey. Details of the surveys can be
found in previous papers using the data (e.g., Hurricane Ivan – (Hasan et al., 2013a); Miami survey – (Yin
et al., 2013b); Hurricane Wilma – (Noltenius, 2008)).
The remainder of this paper is divided into four sections. Section 2 presents the modeling framework and
discusses the specific modules of the model system. Section 3 discusses the implementation of the
simulation-based model system. Section 4 presents a sample application to the Miami-Dade area and the
last section draws conclusions.
6.2 MODELING FRAMEWORK
6.2.1 Overall Agent-based Modeling Framework
To develop an agent-based representation of the households’ travel demand in the evacuation process, it is
essential to recognize that this demand is derived from the desire to achieve goals like “going to a safer

90
place” and to participate in various activities such as “shopping for medicine before evacuation.” This
goal achievement and activity participation are the common threads of the entire evacuation process and
are characterized by a series of decisions that are generally made by a household, represented by an agent.
An agent’s behaviors are described by several related econometric or statistical models.
The simulation framework consists of two related modules: the evacuation decision module, shown in
Figure 6.1, and the pre-evacuation activity module, depicted in Figure 6.2 ~ 6.4. The evacuation decision
module captures important decisions that a household generally would make during the evacuation
process, as identified by Murray-Tuite and Wolshon (2013b). In total, six decisions are captured in the
modeling framework. A household would sequentially decide whether to evacuate for the approaching
hurricane, choose the accommodation type, and determine the evacuation destination, evacuation mode,
and departure time for their ultimate evacuation trip. If a household would use personal vehicles as the
evacuation mode, they also need to choose the number of vehicles that would be taken. The pre-
evacuation activity module captures households’ decisions about engaging in preparation activities such
as purchase of food, gas, and supplies. The decision outcomes of the evacuation decision module affect
the preparation activities for the upcoming evacuation, which is captured by the pre-evacuation activity
module. Specifically, the departure time is translated into the activity planning horizon during which a
household would perform various evacuation preparation activities that may require travel. Other decision
outcomes may also be used in different components of the pre-evacuation activity module, which will
become clear in the following discussion.
The pre-evacuation activity module adopts an activity-based approach, which views the pre-evacuation
activity-travel in a tour-stop perspective. Activity-based models are widely used for regular planning
purposes (Pendyala and Ye, 2005), such as the modeling system developed by Bhat et al. (2000; 2001;
2002). However, evacuation activity travel behavior is different from that under normal conditions.
91
Regular planning activity travel models generally focus on a 24-hour planning horizon while evacuation
preparation activities usually span days and involve activities that allow evacuees to effectively plan for
evacuation. During a day or two prior to departure a household may perform the activities that are
performed in a week under regular conditions due to the evacuation needs. The pre-evacuation activity
module consists of three sub-modules: an activity generation sub-module, passenger household
assignment sub-module, and an activity scheduling sub-module. The activity generation sub-module
captures households’ decisions about whether to engage in any out-of-home preparation activities. If a
household participates in such activities, it simulates households’ decisions of the number of tours and the
activities that would be pursued in these tours, such as fueling automobiles and picking up friends. The
decision outcomes of the activity generation sub-module are then used in the passenger household
assignment sub-module. Since some households rely upon their friends or relatives to reach their
evacuation destinations, this sub-module matches these passenger households with households that have
picking-up responsibilities generated by the activity generation sub-module. The third module, the
activity scheduling sub-module, then assigns specific action days, times and locations to these activities
via simulation.
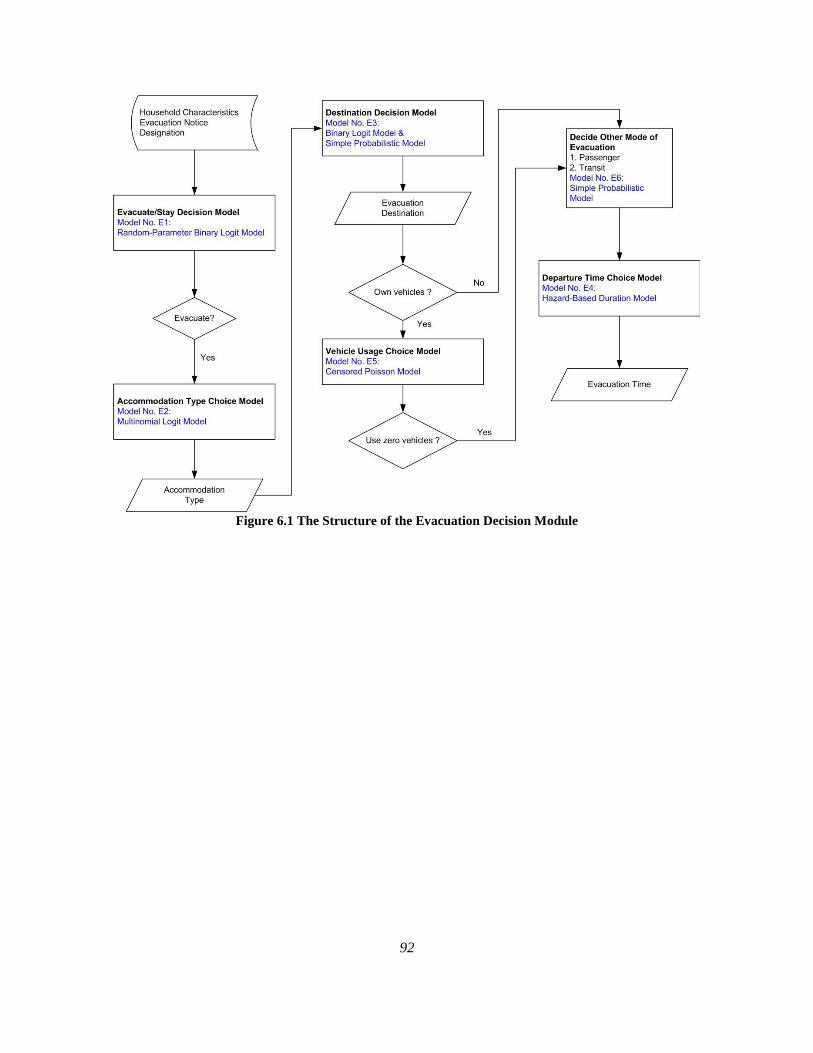
92
Figure 6.1 The Structure of the Evacuation Decision Module

93
Figure 6.2 The Structure of the Activity Generation Sub-Module

94
Figure 6.3 The Structure of the Passenger Household Assignment Sub-Module
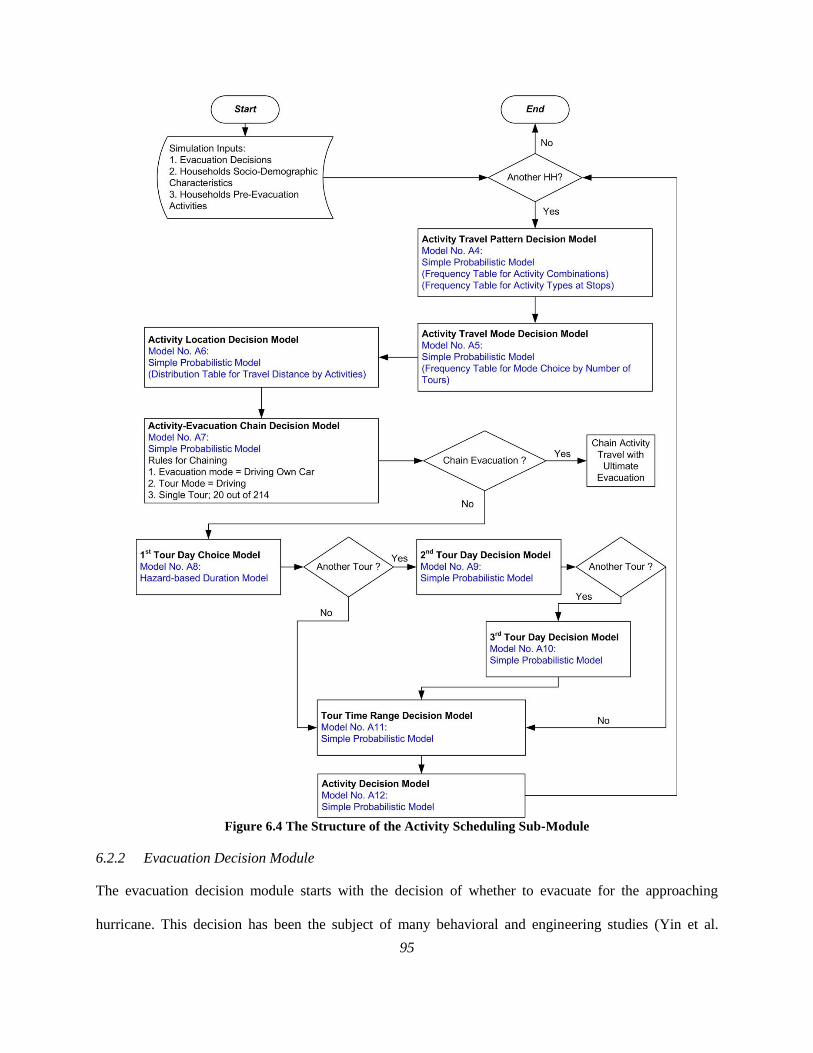
95
Figure 6.4 The Structure of the Activity Scheduling Sub-Module
6.2.2 Evacuation Decision Module
The evacuation decision module starts with the decision of whether to evacuate for the approaching
hurricane. This decision has been the subject of many behavioral and engineering studies (Yin et al.

96
(2012a); Murray-Tuite and Wolshon, 2013). To capture shadow evacuation, defined as people evacuating
from outside the official evacuation zone (Zeigler et al., 1981), a random-parameter logit model is
estimated using the post-Hurricane Ivan survey to determine agents’ behavior for the evacuate/stay
decision. The households’ distances to the coast are calculated using their home coordinates and then
normalized by the maximum distance to derive the relative distance to the coast, denoted by “[reldist]”.
Normally distributed random coefficients are associated with three variables: “[haswkdut]”, “[noevacnt],”
and “[nonmandn].” The random coefficients of the latter two variables capture households’ different
perceived risk of the approaching hurricane, which contributes to their evacuate/stay decisions. In
addition, a statistically significant heterogeneous mean is found for the random coefficient of “[noevacnt],”
which associates the perceived risk with the distance to coast. The estimation results are shown in Table
6.1.
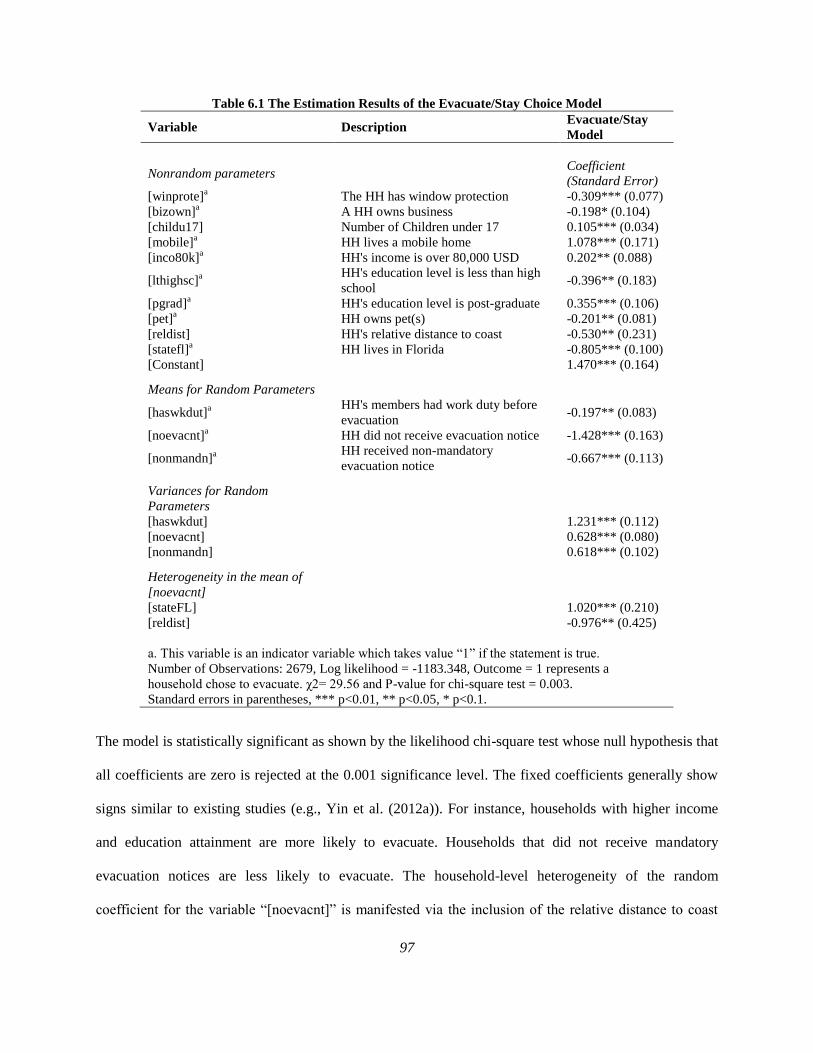
97
Table 6.1 The Estimation Results of the Evacuate/Stay Choice Model
Variable Description Evacuate/Stay
Model
Nonrandom parameters
Coefficient
(Standard Error)
[winprote]a
The HH has window protection -0.309*** (0.077)
[bizown]a A HH owns business -0.198* (0.104)
[childu17] Number of Children under 17 0.105*** (0.034)
[mobile]a HH lives a mobile home 1.078*** (0.171)
[inco80k]a HH's income is over 80,000 USD 0.202** (0.088)
[lthighsc]a
HH's education level is less than high
school -0.396** (0.183)
[pgrad]a HH's education level is post-graduate 0.355*** (0.106)
[pet]a HH owns pet(s) -0.201** (0.081)
[reldist] HH's relative distance to coast -0.530** (0.231)
[statefl]a HH lives in Florida -0.805*** (0.100)
[Constant]
1.470*** (0.164)
Means for Random Parameters
[haswkdut]a
HH's members had work duty before
evacuation -0.197** (0.083)
[noevacnt]a HH did not receive evacuation notice -1.428*** (0.163)
[nonmandn]a
HH received non-mandatory
evacuation notice -0.667*** (0.113)
Variances for Random
Parameters
[haswkdut]
1.231*** (0.112)
[noevacnt]
0.628*** (0.080)
[nonmandn]
0.618*** (0.102)
Heterogeneity in the mean of
[noevacnt]
[stateFL]
1.020*** (0.210)
[reldist]
-0.976** (0.425)
a. This variable is an indicator variable which takes value “1” if the statement is true.
Number of Observations: 2679, Log likelihood = -1183.348, Outcome = 1 represents a
household chose to evacuate. χ2= 29.56 and P-value for chi-square test = 0.003.
Standard errors in parentheses, *** p<0.01, ** p<0.05, * p<0.1.
The model is statistically significant as shown by the likelihood chi-square test whose null hypothesis that
all coefficients are zero is rejected at the 0.001 significance level. The fixed coefficients generally show
signs similar to existing studies (e.g., Yin et al. (2012a)). For instance, households with higher income
and education attainment are more likely to evacuate. Households that did not receive mandatory
evacuation notices are less likely to evacuate. The household-level heterogeneity of the random
coefficient for the variable “[noevacnt]” is manifested via the inclusion of the relative distance to coast
98
variable. This allows households who do not receive any evacuation notice to assume different
distributions for the random parameter depending on their distance to coast. Specifically, the sign of the
relative distance to coast is -0.976 for the mean of the random parameter of variable “[noevacnt]”,
suggesting that the likelihood of evacuation for households that did not receive any evacuation notice
decreases as their distance to coast increase on average. A later application to the Miami-Dade area
demonstrates this effect.
If a household decides to evacuate, then they need accommodations, which can be a shelter, a friend’s or
family members’ home, or a hotel, among other choices. Accommodation type choice is modeled by a
multinomial logit model with three alternatives: a friend’s/relative’s home, shelter, and hotel. Since the
later application is for the Miami-Dade area, the model is estimated using the corresponding behavioral
intention survey. The estimation results are shown in Table 6.2.

99
Table 6.2 The Estimation Results of the Accommodation Type Choice Model, Local/Out-of-Miami Destination Choice Model, Departure Time Choice
Model and Out-of-Home Activity Participation Choice Model
Variable Description Accommodation Type Choice Model
Local/out-of-
Miami
Destination
Choice Model
Departure Time
Choice Model
Out-of-Home
Activity
Participation
Choice Model
Hotelb Public Shelterb
[incu10k]a HH's income is less than 10,000 USD -1.144**(0.497)
[inc1020k]a HH’s income is between 10,000 to
20,000 USD 1.219***(0.441) 0.717*(0.400)
[hispn]a HH has Hispanic members -0.759***(0.273)
0.614**(0.236)
[rent]a HH rents the current home.
1.341***(0.400)
[friend]a A HH evacuates a friend/relative’s
home 1.425*** (0.270)
-
0.319***(0.118)
[shelter]a A HH evacuates a public shelter -0.358*(0.208)
[colgrad]a HH's education level is college
graduate 0.325*(0.198)
[pgrad]a HH's education level is post-graduate -0.726** (0.269)
[hhsize] 0.136*(0.0732)
[chldu12] Number of Children under 12 -0.501**(0.232)
[over64] Number of HH members over 64 years
old 0.143**(0.067) -0.273**(0.126)
[sfh]a HH lives in a single family house -0.812**(0.290)
[owncar]a HH uses their own vehicles to
evacuate 0.221*(0.120) 0.919***(0.231)
[constant] -0.647***(0.139) -2.990*** (0.330) -1.413**(0.273) -0.893***(0.268)
Number of
Observations 414 414 414 462
Log-
Likelihood -315.85 -229.2247 -2094.355 -301.429
χ2 statistic 42.88 57.99 16.44 37.47
P-value for
chi-square
test
<0.001 <0.001 0.002 <0.001
a. This variable is an indicator variable which takes value “1” if the statement is true.
b. Friend/Relative’s home is the reference category. Standard errors in parentheses, *** p<0.01, ** p<0.05, * p<0.1
100
The model is statistically significant at the 0.001 significance level. The coefficients indicate that
households with income less than 10,000 USD are less likely to go to a hotel compared to a
friend/relative’s home. Households living in rented properties are more likely to go to a public shelter
than to a friend/relative’s home.
After a household selects their accommodation type, they need to choose their evacuation destination.
This choice is captured by a two-step model using the Miami survey data. A household first decides
whether to evacuate to a local destination or one outside the Miami-Dade area. This choice is captured by
a binary logit model. If the household decides to go to a local destination, then a specific city is assigned
as their evacuation destination region based on a city-by-city frequency count from the Miami survey. If
they choose a non-local destination, they are assigned to one of the super destinations representing the
out-of-Miami destinations. The estimation results of the local/out-of-Miami destination choice model are
shown in Table 6.2. The model is statistically significant at the 0.001 significance level. The coefficients
suggest that households with income between 10,000 and 20,000 USD are more likely to go to a local
destination. Households choosing friend/relative’s homes as accommodations are more likely to go to a
local destination. On the other hand, households living in single family houses and those with post-
graduate degrees are less likely to choose a local destination and the likelihood of staying locally
decreases if a household has more children under 12 years old.
Following the evacuation destination choice, the household chooses their evacuation mode. Many studies
found that personal vehicles remain the dominant evacuation mode (e.g., Wu et al. (2012)). If a household
owns vehicles, a vehicle usage choice model estimates the number of vehicles used. The model explicitly
considers the factors contributing to households’ choice of the number of vehicles used and the constraint
imposed by the number of vehicles owned by the household. The right-censored Poisson model
developed by Yin et al. (2013a) using the Hurricane Ivan survey data is used here and the estimation
results are reproduced in Table 6.3. The variable “[dur]” in the vehicle usage choice model is derived

101
from a simulation using the observed sample departure curve. Later, the departure time choice model will
assign the ultimate departure time.
Table 6.3 Estimation Results of the Vehicle Usage Choice Model and Action Day Choice Model for the First
Tour
Variable Description Vehicle Usage
Choice Model
Action Day Choice
Model for the First
Tour
[numveh] The number of vehicles owned by the
household Censoring Variable
[logdist] The log of the travel distance to the
evacuation destination -0.0618***(0.0182)
[dur]b The stay duration in hours until
evacuation -0.00367**(0.00143) -0.036*** (0.004)
[num18to80] The number of people between 18
and 80 years old 0.148***(0.0309)
[hurrexp]a
The household had hurricane
experience before Ivan 0.159***(0.0554)
[pgrad]a -0.129**(0.0559)
[pet]a The household had pets 0.144***(0.0477)
[mobile]a
The household lived in a mobile
home 0.264***(0.0961)
[stateFL]a The household lived in Florida -0.119**(0.0511)
[day2] Dummy Variable for Day 2 (Sun.) 0.269 (0.257)
[day3] Dummy Variable for Day 3 (Mon.) 1.480*** (0.279)
[day4] Dummy Variable for Day 4 (Tue.) 2.725*** (0.359)
[day5]c Dummy Variable for Day 5 (Wed.)
[numtours] Number of Tours to be performed 1.549*** (0.363)
[med]a One Stop in Tour 1 is purchase of
medicine 0.482* (0.285)
[pickup]a One Stop in Tour 1 is picking-up
people -1.308** (0.514)
Constant 0.515***(0.156) 0.0859 (0.498)
Number of
Observations 767 579
Log-
Likelihood -708.685 -309.377
a. This variable is an indicator variable which takes value “1” if the statement is true.
b. For the action day choice model, this variable represents the length of the planning horizon in hours,
calculated as the time duration from Saturday midnight to the selected evacuation departure time.
c. The dummy variable for Day 5 predicts the occurrence of tour 1 perfectly and hence is removed from
the regression model (13 observations).
Standard errors in parentheses, *** p<0.01, ** p<0.05, * p<0.1
If a household does not own vehicles, they either rely on public transit or their friends’ evacuation
vehicles. This assignment is based on a frequency table derived from the Miami survey.

102
The final decision is the departure time, which is captured by a semi-parametric hazard-based duration
model, or the well-known Cox model (Greene, 2012). Since the baseline hazard of the Cox model is a
non-parametric specification, this offers great flexibility for capturing the shape of the departure curve,
which generally is a multiple S-curve due to concentrated departures in the morning and afternoon. The
profile of the departure curve will become clear in the application section. The model, shown in Table 6.2,
is estimated using the Miami survey data.
The model is statistically significant at the 0.05 significance level. The estimated coefficients suggest that
households evacuating to a shelter or a friend’s or relative’s home are more likely to evacuate late
compared to those evacuating a hotel. Households using their own vehicles are more likely to evacuate
earlier compared to those relying upon transit or those needing picking-up. More household members
over 64 years old contribute to increased likelihood of early departure.
This concludes the evacuation decision module. The specific sequence of decisions is imposed here based
on the available survey data. The simulation framework is not constrained by the model specification and
can take other behaviorally justifiable decision orders.
6.2.3 Pre-Evacuation Activity Module
The pre-evacuation activity module is developed using the Miami survey in which households were asked
for details regarding the activities they would engage in before they embark on the ultimate evacuation
trip, including the activity’s purpose, location, and action time (i.e., day and time range); travel mode; and
whether the activity is chained with the ultimate trip. Through open ended questions, the survey requested
the most important, travel-involving activities that respondents would participate in prior to departing for
their ultimate evacuation destinations though in-home activities were also reported. These data have been

103
analyzed and the findings are reported in Yin et al. (2013b). Here the general logic, as depicted in Figure
6.2, Figure 6.3 and Figure 6.4 for activity generation and scheduling is described.
The planning horizon of a household is the time duration from the start of the planning horizon until their
evacuation departure. The pre-evacuation activity module adopts the generation-scheduling paradigm
used in some regular planning applications such as Bhat et al. (2004). The activity generation sub-module
starts with the model that captures households’ decision as to whether to engage in any out-of-home
activities. This model is necessary since many respondents reported only in-home activities despite the
request of reporting activities involving travel. The binary logit model developed in Yin et al. (2013b),
shown in Table 6.2, suggests that larger households and those with college graduates are more likely to
engage in activities that require travel; households choosing to drive their own vehicles are more likely to
participate in out-of-home activities; and the number of people older than 64 has a negative impact upon
engaging in out-of-home activities.
If a household performs out-of-home activities, they then decide the number of tours they would make.
Since the number of households making two or more tours is limited, the number of tours is not modeled
econometrically. In addition, to ensure that the simulated number of tours can be completed within the
household’s planning horizon, a simple probabilistic model based on the frequency distribution between
number of tours and evacuation day is used. This approach reflects the observation that households
evacuating late are more likely to make multiple tours. After the number of tours is determined, the
activity generation sub-module (Figure 6.2) assigns the specific activities pursued in these tours based on
the frequency distribution of activity combination by number of tours. Specifically, the number of tours is
used as the input and the activity combination is simulated based on the frequency distribution
corresponding to that particular number of tours. For example, if a household would make two tours, the
possible activity combinations are those with non-zero percentages. For example, two possible activity
104
combinations for making two tours include purchase of food, gasoline, and medicine and the other
involves just gasoline and withdrawal of cash.
After all households have been assigned activity combinations, the passenger assignment sub-module
pairs the households whose evacuation mode is passenger with those assigned picking-up activities. The
sub-module first identifies all the passenger households and treats each one according to their evacuation
destination. Since the Miami survey data suggested that the households living on Miami Beach would
only pick up others living on Miami Beach, the sub-module also include the home location as one
decision criterion. For instance, if a passenger household lives on Miami Beach, the sub-module initially
searches for those on the island who evacuate to an identical evacuation destination and are assigned
picking-up activities. If such households exist, one household is randomly selected as the picking-up
household for this passenger household. If no household matches these criteria, the sub-module then
searches for those on the island who evacuate to an identical evacuation destination and have only in-
home activities. If the choice set formed by these households is not empty, a random selection is
conducted. Otherwise, the passenger household is paired with a household who does not evacuate for the
hurricane and resides at the passenger household’s evacuation destination. Similar steps are taken for
households living off Miami Beach and going to an out-of-Miami destination. After all the passenger
households are matched with picking-up households, the activity combinations are updated for those
households that were not assigned picking-up activities initially. The updated activity combination for
each household is the input for the subsequent scheduling.
The activity scheduling sub-module (Figure 6.4) first assigns the activity travel pattern, including the
number of stops for each tour and the specific activities pursued at each stop. The input to this model is
the number of tours and activity combinations selected in the previous sub-modules. The distinct activity
patterns are identified based on the survey responses. For instance, if a household’s activity combination
is withdrawal of cash and purchase of food for a single tour, three distinct activity travel patterns exist in
105
the survey. The tour-maker from the household might first make a stop to withdraw cash and then go to
buy food or make the stops in the opposite sequence or make only one stop for cash and food together.
The counts for these distinct travel patterns are used as a simple probabilistic model for simulation
purposes.
After the activity travel pattern has been decided, the travel mode for each tour is needed. The tour mode
choice is based on the frequency table using number of tours and activity combinations as decision factors.
If purchase of gas is among the activities pursued in a tour, the mode is driving. The survey also
suggested that the mode for a picking-up tour is driving.
Following mode choice, an activity location is assigned for each stop based on the activity type pursued at
that stop number. About half of the respondents provided addresses and location information for their
activities and these locations were geocoded using ArcGIS. The distances between stops and home by
activity type is used to simulate the travel distance between stops. The stop locations are fairly close to
respondents’ homes, with less than 2-miles average distance. The distance between the first and second
stops for multi-stop tours has a mean of 0.90 miles and a standard deviation of 1.81 miles. The locations
that are within half a mile of the simulated travel distance compose the choice set from which a random
selection is made. The location of a picking-up activity is the passenger household’s home.
Some households may chain their tours with the ultimate evacuation trips. This decision is captured by
the activity-evacuation chain decision model. The rules are developed from the observations involving the
activity-evacuation chaining behavior of the Miami survey. Approximately 10% of the households who
would make a single tour in their own vehicles would chain the activities with the ultimate evacuation trip.
If the activity travel is chained with the ultimate evacuation, the action time is the evacuation departure
time and no additional scheduling is necessary. If the activity travel is not chained with evacuation, the
action day of the first tour is decided by the first-tour day choice model taking the form of a hazard-based

106
discrete duration model. The action day for the first tour is statistically significantly related to the activity
type and the households’ selected evacuation times. For a complete discussion of the model, see Yin et al.
(2013b). If a household makes more than one tour, 75% of the households (16 out of 21) perform the
second tour on the same day of or the day following the day of their first tour. The third tour is uniformly
one day after the second tour. The tour time range is assigned according to the frequency distribution
found in Yin et al. (2013b). After the tour time range is determined, a specific time is simulated using a
uniform distribution constructed based on the time range. For example, if a household makes a tour in the
morning, the action time is randomly selected from 8 am to 12 pm.
The last piece of the activity scheduling sub-module is the activity duration decision model, which takes
the form of a truncated normal distribution. The duration for shopping activities is assumed to follow
N(25, 15) with a minimum of 10 minutes and a maximum of 60 minutes. The distribution for the duration
of picking-up activity is assumed to follow N(57, 76) with a minimum of 45 minutes and a maximum of
120 minutes, based on Noltenius (2008).
These three sub-modules form the pre-evacuation activity module. The outputs of this module are the
activity plans that describe the activity travel prior to evacuation departure and the ultimate evacuation
trips. A sample activity plan is: a person makes a two-stop tour on Monday at 2:23 pm by driving. The
first stop is purchase of food and the second stop is fuelling the vehicle. The household evacuates on
8:20am Tuesday to an out-of-Miami location by driving.
6.3 SIMULATION IMPLEMENTATION
The implementation of the agent-based travel demand model system includes two components: the
simulation algorithms for generating disaggregate predictions and the software architecture to coordinate
the modules.
6.3.1 Simulation Algorithm for Generating Disaggregate Predictions

107
The modeling system’s primary goal is to produce simulated activity-travel plans by stepping through
each module outlined in the previous sections to predict the corresponding choice outcome. There are two
aspects to the prediction process: the generation of disaggregate predictions for each individual
component model and the integration of the decision outcomes into one final activity-travel plan.
One approach for predicting individual decision outcomes involves selecting the alternative with the
highest probability for each of the model components with discrete outcomes and using expected value
predicted by the model for a continuous choice variable. However, this methodology introduces
systematic bias in the outcome of each modeling step (Bhat and Misra, 2001) and contradicts the
probabilistic nature of the decision model (Train (2002)). Consequently, the cumulative prediction errors
for a large model system such as the one proposed can be quite significant.
An alternative approach involves a full decision tree in which the probabilities of all the alternatives are
carried over to the root node (Bhat et al., 2004). The chosen set of alternatives can be subsequently
determined by extracting the path with the highest path probability in the decision tree (Bhat et al., 2004).
But, this approach can be computationally intensive for many decision outcomes. More importantly,
decision trees cannot handle models with continuous choice outcomes.
The general simulation mechanism adopted here resembles the one proposed by Bhat et al. (2004) which
eliminates the bias of the first approach while avoiding the computational complexity of the latter
approach. In the case of discrete choices, the chosen alternative is determined by identifying the
distribution of the alternatives whose probabilities are predicted by the model component based on
relevant covariate values derived from households’ characteristics and previous decisions. Subsequently,
a random draw is taken from the uniform distribution, and depending on the magnitude of this number,
the corresponding alternative is declared as the chosen alternative. For the continuous choice instances,
the choice is determined by a random draw from the probabilistic distribution of the choice variable

108
defined by the associated econometric or statistical model. Thus, the chosen continuous outcome is not
identical for all observationally similar decision makers.
The econometric specifications for the model components include regular and random-parameter binary
logit models, a multinomial logit model, continuous and discrete hazard-based duration models, a right-
censored Poisson model, and simple probabilistic models. The algorithms for identifying the probability
distribution of the choice outcomes for the commonly-used models, namely the regular binary logit
models, multinomial logit model, and simple probabilistic models are established in Bhat et al. (2001) and
are used here. The method for simulating probabilities of choice alternatives for the random-parameter
binary logit model is outlined in Train (2002) and Greene (2012). The algorithm for the right-censored
Poisson model is described in Yin et al. (2013a). The algorithm for the continuous hazard-based duration
model can be found in Bender et al. (2005) and Austin (2012) and an identical method can be used for its
discrete counterpart once the cumulative hazard function is computed using the method developed by
Rabe-Hesketh and Skrondal (2012).
6.3.2 Software Architecture
The model system was developed using the object-oriented (OO) paradigm. Through the process of OO
analysis, a number of major entities involved in the simulation of activity-travel plans were identified.
The system architecture includes the input/output database, the data entities such as household, person,
tour and stops, and modeling modules like the econometric models. A GIS engine, namely, Spatialite, is
also embedded to provide the geospatial query capability required for the activity stop location decision
model. The program is written in C++. On average, it takes about 0.3 seconds to generate the activity
plan for one household.
6.4 APPLICATION TO THE MIAMI-DADE AREA
The model system is applied to the Miami-Dade area for a hypothetical category-4 hurricane, which
would make landfall on Wednesday. The evacuation warning would be issued at 8:00 AM Saturday. The
overall planning period is from 12:00 AM Saturday to 12:00 PM Thursday. The reason for including the

109
period before the evacuation notice and after landfall is that some survey respondents indicated that they
would evacuate in these two periods. A synthetic population generator provided in the TRANSIMS
package (Ley, 2009) was used to translate the aggregate demographics to a disaggregate population of
households and individuals within the household for the Miami-Dade region. Then the evacuation zones
are identified based on the data provided by the Miami-Dade emergency management agency. Using
these inputs, the program generates the travel demand.
The comparison between the distributions of the evacuation decisions for the simulation and the survey
response is documented in Table 6.4.
Table 6.4 Comparison of Distributions of Evacuation Decisions
Decision Simulation Survey
Evacuate/Stay Evacuate: 88.98% (In Evacuation Zone),
Evacuate: 22.85% (Shadow Evacuation) Evacuate: 85.71%
Accommodation
Type
Friend: 65.82%, Hotel: 24.59%, Shelter:
9.59%
Friend: 67.15%, Hotel: 24.40%,
Shelter: 8.45%
Evacuation
mode
Car: 90.61%, Passenger: 5.89%, Transit:
3.49%
Car: 73.3%, Passenger: 9.9%, Transit:
16.8%
Local
Destination Local: 36.45% Local: 41.58%
Vehicle Usagea
1 Vehicles: 71.78%,
2 Vehicles: 21.51%,
3 Vehicles: 3.82%
4 Vehicles: 1.40%,
5 Vehicles: 1.47%
1 Vehicles: 66.71%,
2 Vehicles: 25.91%,
3 Vehicles: 5.16%,
4 Vehicles: 0.59%,
5 Vehicles: 0.35%
(a) The vehicle usage was not reported in the Miami survey. Hence the simulation results are
compared to the Hurricane Ivan survey.
The simulated proportion of the evacuation households is 88.98% in the evacuation zone, which is
slightly higher than the reported 85.71% of the Miami survey. The current program assumes full
penetration of the evacuation warning while some survey respondents suggested that they do not know
whether they are in an evacuation zone. The shadow evacuation percentage is 22.85%, which is close to
the average 26% reported by Sorensen and Vogt (2006). The geographical distribution of the evacuation
population is depicted in Figure 6.5. The heat map in Figure 6.5 suggests that the major proportion of the
shadow evacuation population lies within 1.86 to 3.11 miles of the mainland coastline.

110
Figure 6.5 The Geographical Distribution of the Evacuation Population (Darker red indicates more evacuees)
The simulated distribution of the accommodation type choice outcomes is very similar to that reported in
the Miami survey, evidenced by an absolute error less than 1%. The proportion of households that choose
their own vehicles as the evacuation mode is 90.61%, which is higher than that reported in the Miami
survey. But a similar percentage was reported in previous studies (Lindell et al., 2011; Wu et al., 2012).
The Miami survey reported approximately 15% of evacuees using transit, which is a lot higher than what
existing studies (Lindell et al., 2011; Wu et al., 2012) reported. The Hurricane Ivan survey results
indicated that all transit evacuees did not own vehicles. Unfortunately, the Miami survey did not ask
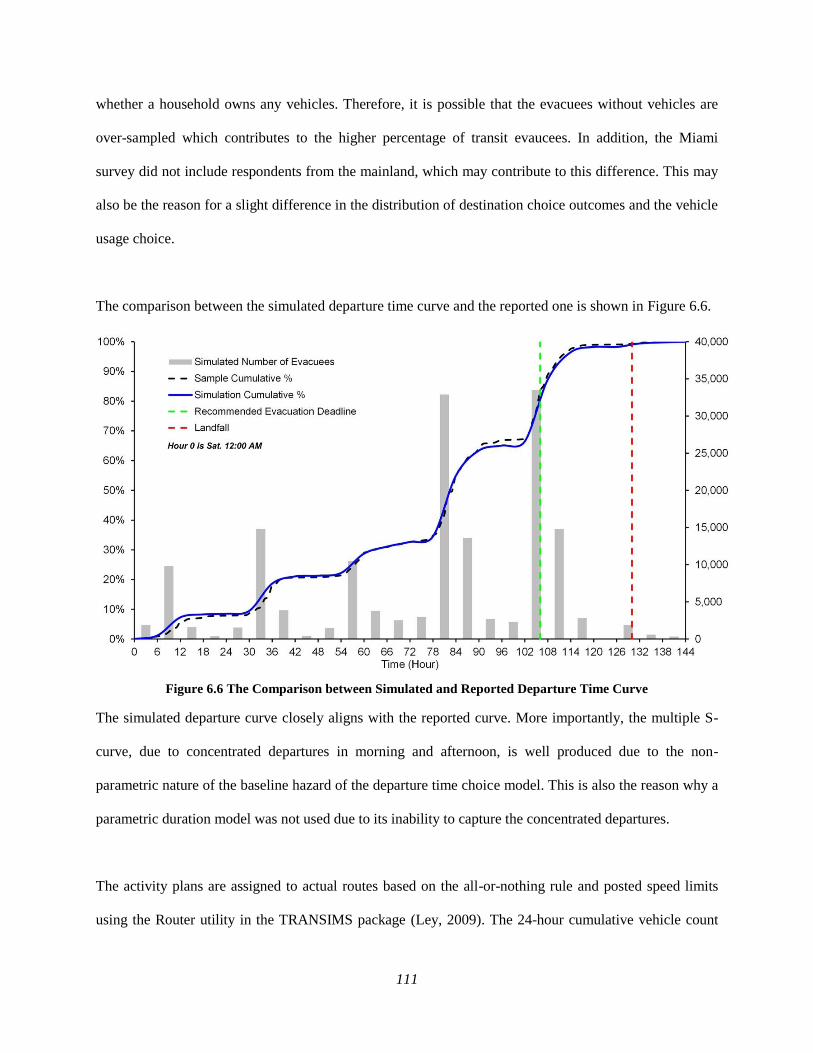
111
whether a household owns any vehicles. Therefore, it is possible that the evacuees without vehicles are
over-sampled which contributes to the higher percentage of transit evaucees. In addition, the Miami
survey did not include respondents from the mainland, which may contribute to this difference. This may
also be the reason for a slight difference in the distribution of destination choice outcomes and the vehicle
usage choice.
The comparison between the simulated departure time curve and the reported one is shown in Figure 6.6.
Figure 6.6 The Comparison between Simulated and Reported Departure Time Curve
The simulated departure curve closely aligns with the reported curve. More importantly, the multiple S-
curve, due to concentrated departures in morning and afternoon, is well produced due to the non-
parametric nature of the baseline hazard of the departure time choice model. This is also the reason why a
parametric duration model was not used due to its inability to capture the concentrated departures.
The activity plans are assigned to actual routes based on the all-or-nothing rule and posted speed limits
using the Router utility in the TRANSIMS package (Ley, 2009). The 24-hour cumulative vehicle count

112
on the fourth day, on which the highest evacuation departures occur, is shown in Figure 6.7. Clearly, the
major roads such as interstate 75 and 95, Palmetto Expressway, Florida Turnpike, S. Dixie Highway, and
the bridges connecting Miami Beach and the mainland carry considerable amounts of traffic. The authors
and their colleagues are currently simulating the generated demand using an agent-based traffic
simulation tool for the Miami-Dade region.
Figure 6.7 24-Hour Cumulative Vehicle Count for Tuesday under All-or-Nothing Assignment
113
6.5 CONCLUSIONS AND FUTURE DIRECTIONS
This paper presents an agent-based travel demand model system for hurricane evacuation simulation,
which is capable of generating comprehensive activity-travel plans for households. The system
implements econometric and statistical models that represent travel and decision-making behavior
throughout the evacuation process, and is flexible enough to adopt alternative behavioral models. It
generates the predicted activity-travel patterns for all households in the simulation sample. Traffic
assignment methods can be applied to determine traffic patterns on the network. The system considers six
typical evacuation decisions, namely evacuate/stay, accommodation type, evacuation destination, mode,
vehicle usage, and departure time in addition to the pre-evacuation activity generation and scheduling.
The model system possesses the following major strengths:
Unlike most previous models, this system explicitly captures the shadow evacuation population
and produces the percentage of shadow evacuation demand close to that reported in existing
studies.
The model system reproduces the desired temporal pattern for the evacuation departures and links
the departure time choice with household characteristics.
The model system is the first to explicitly capture the pre-evacuation preparation activities via the
generation-scheduling paradigm.
The simulation mechanism of the model system recognizes the taste variation and ensures that the
chosen outcome is not identical for all observationally similar decision makers, which is a major
distinction from the simulation models using a deterministic decision-maker matching algorithm
such as the demand module in TRANSIMS for regular planning (Ley, 2009).
A demonstration predicts activity-travel patterns using model parameters estimated for the Miami-Dade
area. The simulation results indicate the model system produced the distribution of choice pattern that is
consistent with sample observations and existing literature. The model system is also able to identify the
proportion of the shadow evacuation population and their geographical extent. Specifically,

114
approximately 23% of the population outside the designated evacuation zone would evacuate, which
echoes the findings in previous studies. The shadow evacuation demand is mainly located within 5 km
(3.11 miles) from the coastline. A static traffic assignment for the day with highest evacuation demand
shows that the major roads would carry significant amounts of evacuating traffic, as expected. The output
demand of the system works with agent-based traffic simulation tools as evidenced by the ongoing effort
of applying dynamic traffic assignment to determine travel demand patterns on the Miami-Dade network.
ACKNOWLEDGEMENTS
The research presented in this paper was supported by National Science Foundation Award SES-0826873
for which the authors are grateful. The Hurricane Ivan survey was supported by the USACE and directed
by Betty Morrow and Hugh Gladwin. The authors are also grateful for the Hurricane Wilma data that Dr.
Noltenius kindly provided. However, the authors are solely responsible for the findings in this document.

115
CHAPTER 7 CONCLUSIONS, ENGINEERING SIGNIFICANCE,
LIMITATIONS AND FUTURE DIRECTIONS
This chapter is organized into three sections. The first section draws conclusions about the main findings
of the dissertation. The second section discusses the engineering significance of the dissertation’s
contributions and a few limitations. The third section identifies potential directions for future research.
7.1 CONCLUSIONS
This dissertation investigates the evacuees’ behavior under hurricane evacuation conditions and develops
an agent-based travel demand model system for hurricane evacuation simulation using these behavioral
findings. The dissertation econometrically models several important evacuation decisions including
evacuate-stay, accommodation type choice, evacuation destination choice, evacuation mode choice,
departure time choice, and vehicle usage choice. In addition, it explicitly considers the pre-evacuation
preparation activities using an activity-based approach. The models are then integrated into a two-module
agent-based travel demand model system.
The dissertation first presents the evacuate-stay choice model using the random-coefficient binary logit
specification. The estimation results suggest that the households that have window protection are less
likely to evacuate. Similarly, households that own businesses are less likely to evacuate. In addition,
households in mobile residences are more likely to evacuate. Some socio-demographic factors also
contribute to the decision. For instance, households with higher income and education attainment are
more likely to evacuate. The number of children under 17 also shows a positive impact upon the
evacuation. Households that have pets are less likely to evacuate. The model uses heterogeneous mean of
the random parameter across households to capture shadow evacuation. It is found that the likelihood of
evacuation for households that do not receive any evacuation notice decreases as their distance to coast
increases on average. Recognizing the observation that the perceived risk is sensitive to households’
distance to the coast and it decreases as the distance to the coast increases, the distance sensitivity factor,

116
or DSF, is introduced to construct different scenarios of the geographical extent of shadow evacuation.
The study provides implications for both emergency management and evacuation modeling. The
emergency management agencies should understand that the geographical extent of shadow evacuation
may be extensive and thus should be prepared for the additional demand generated from the low-risk
areas and relevant traffic management strategies and plans should be designed.
The dissertation then presents statistical analysis of the vehicle usage choice. Two variants of the regular
Poisson regression model are explored for the vehicle usage choice based on a post-storm survey for
Hurricane Ivan: the Poisson model with exposure and right-censored Poisson regression. The two models
explicitly consider the fact that the number of vehicles used for evacuation cannot exceed the number of
vehicles owned by the household, which the ordered-response models fail to accommodate. Between the
two models, the right-censored Poisson model is preferred due to its capability of assigning zero
probabilities to the number of vehicle used larger than the number of vehicles owned, its better measures
of fit and superior predictive power. Using the right-censored Poisson model, it is found that
1. Households that travel longer distances are more likely to use fewer vehicles;
2. Households who evacuate late are statistically more likely to use fewer vehicles;
3. Households with previous hurricane experience are more likely to use a greater number of
vehicles;
4. The number of household members between 18 and 80 years old is positively related to the
number of vehicles taken on the evacuation;
5. Household income has no statistically significant impact upon the number of household
evacuation vehicles chosen (recall that the model specification accounts for the number of
vehicles owned by the household);
6. Pet-owning households are statistically more likely to evacuate with more vehicles than
households without pets; and
117
7. The households living farther from the coast are less likely to take more vehicles that those living
close to the coast.
The dissertation then presents an analysis of the households’ pre-evacuation activities for hurricane
evacuation based on behavioral intention data collected for Miami Beach, Florida using descriptive
analysis and econometric modeling.
Descriptive analysis offers insights into activity types of the tours, travel mode, and scheduling and
activity locations in terms of travel distance from home and between tour stops. It shows that shopping
accounts for the dominant proportion of preparation activities. The specific items reported include food,
gasoline, medicine, and withdrawal of cash, which underscores the importance of steady supply of these
items. In terms of tour making behavior, most households would make a single tour, but multiple tours
are observed. More than 90% of the tours are conducted by driving, which highlights the necessity of
including these activities into the evacuation demand modeling. The tours’ action days indicate that
households perform their preparation activities early. More than 75% of the households who would make
multiple tours perform the second tour on the same day of or the day following their first tour.
Households would generally make the tours during daylight. About 10% of the households chain their
single activity chains with their ultimate evacuation trips. The activity locations are fairly close to
respondents’ homes though households generally travel farther for supplies and picking-up activities. The
close distance between the first and second stops suggests that the stops are generally close together,
which can be used for location choice in activity generation and scheduling.
Econometric models then identify the contributing factors to the out-of-home activity participation choice
and the action day choice of the first tour. The participation in the activities that involve travel is
investigated via a binary logit model. Households with college graduates, larger households, and
households who drive their own vehicles are more likely to engage in activities that require travel. The

118
number of people older than 64 has a negative impact upon engaging in out-of-home activities. The action
day for the first tour is examined using the discrete-time hazard-based survival model and is statistically
significantly related to the activity type, household’s selected evacuation time, and the number of tours. If
the first tour involves purchasing medicine, the households are more likely to buy medicine early possibly
due to concerns about limited supplies. If the households pick up relatives/friends in the first tour, they
are more likely to conduct the tour late. Households who evacuate late are more likely to conduct their
pre-evacuation activities late. Finally, households with multiple tours tend to make their first tour early.
The dissertation then integrates the behavioral findings and models into an agent-based travel demand
model system for hurricane evacuation simulation, which is capable of generating comprehensive
activity-travel plans for households. The system implements econometric and statistical models that
represent travel and decision-making behavior throughout the evacuation process, and is flexible enough
to adopt alternative behavioral models. It generates the predicted activity-travel patterns for all
households in the simulation sample. Traffic assignment methods can be applied to determine traffic
patterns on the network. The model system possesses the following major strengths:
Unlike most previous models, this system explicitly captures the shadow evacuation population
and produces the percentage of shadow evacuation demand close to that reported in existing
studies.
The model system reproduces the desired temporal pattern for the evacuation departures and links
the departure time choice with household characteristics.
The model system is the first to explicitly capture the pre-evacuation preparation activities via the
generation-scheduling paradigm.
The simulation mechanism of the model system recognizes taste variation and ensures that the
chosen outcome is not identical for all observationally similar decision makers.

119
A demonstration predicts activity-travel patterns using model parameters estimated for the Miami-Dade
area. The simulation results indicate the model system produced the distribution of choice patterns that is
consistent with sample observations and existing literature. The model system is also able to identify the
proportion of the shadow evacuation population and their geographical extent. Specifically,
approximately 23% of the population outside the designated evacuation zone would evacuate, which
echoes the findings in previous studies. The shadow evacuation demand is mainly located within 5 km
(3.11 miles) from the coastline
7.2 ENGINEERING SIGNIFICANCE, CONTRIBUTIONS AND LIMITATIONS
This dissertation contributes to the fields of evacuation modeling and transportation engineering.
The dissertation is among the first to develop the evacuate-stay choice model using the random-
coefficient binary logit specification. It includes households’ distance to the coast into the
heterogeneous mean of the random parameter across households to capture shadow evacuation.
Combined with the distance sensitivity factor, the model is capable of deriving different shadow-
evacuation levels which can be used by an emergency management agency to evaluate different
evacuation scenarios thus facilitating the devising an evacuation plan that considers the additional
demand due to the shadow evacuation phenomenon.
This study is the first to statistically investigate the evacuees’ vehicle usage choice with explicit
consideration given to the vehicle ownership constraint. In addition, a simulation method to
generate the individual vehicle usage predictions is proposed. Improving the existing studies
which mainly rely upon sample observations, it helps to facilitate a more accurate translation of
household evacuation demand to vehicle travel demand. One limitation is that the vehicles usage
choice model does not consider the vehicle types such as trailers and SUVs. It is helpful to
estimate the quantity of these vehicles because the trailers occupy more space and usually travel
slowly and may increase congestion on the evacuation routes. Accurate estimates of the number

120
of trailers that are likely to be taken are helpful to emergency management to devise a traffic
management plan to facilitate the evacuation traffic.
The dissertation is among the first to provide insights into households’ pre-evacuation activity
travel using an activity-based approach. Based on behavioral intention data collected for Miami
Beach, Florida, this dissertation presents a descriptive analysis of and econometric models for
households’ pre-evacuation activities. It investigates the transportation aspects of activity
generation and scheduling (number of tours, tour timing etc.). In addition, it bears emergency
preparation implications. The descriptive analysis shows that shopping - particularly food,
gasoline, medicine, and cash withdrawal - accounts for the majority of preparation activities,
highlighting the importance of maintaining a supply of these items. These findings can offer
better understanding of the travel derived from pre-evacuation preparations and thus enhance the
accuracy of the demand representation. One limitation lies in the lack of complete activity travel
information throughout the evacuation cycle. It would be helpful to examine the responsibility
sharing among household members if such data are available.
The simulation mechanism of the model system recognizes the stochastic nature of the
households and ensures that the simulated outcome for a particular model component is not
identical for all observationally similar households, which is a major distinction from the
simulation models using a deterministic decision-maker matching algorithm such as the demand
module in TRANSIMS for regular planning (Ley, 2009).
The agent-based travel demand model system is capable of generating activity plans that works
with agent-based traffic simulation tools as evidenced by the ongoing effort of applying dynamic
traffic assignment to determine travel demand patterns on the Miami-Dade network and
conventional trip-based simulation tools. It will facilitate hurricane evacuation management.
7.3 FUTURE DIRECTIONS
121
In addition to the future directions identified in previous chapters, there are other directions that can be
explored. For the evacuate/stay decision, one possible direction is to investigate other important
dimensions of the evacuation behavioral modeling such as the evacuation destination choice and
departure timing jointly with the random parameter logit model for evacuate/stay decision. Such an effort
may be challenging due to the difficulty of model estimation.
After the integration of the demand model system with an agent-based traffic simulation tool, another
interesting and important application of the agent-based evacuation model system is to investigate how to
facilitate the travel of emergency management personnel using agent-based modeling and simulation with
the aim of improving humanitarian and disaster mitigation efforts to enhance the resiliency and
sustainability of communities facing environmental challenges. This will contribute to a comprehensive
abstraction of all the participants in the evacuation process. In addition, with relevant data, it is also
important to examine the responsibility sharing between household members during their pre-evacuation
mobilization.

122
REFERENCES
Anderson, J., 1968. Cultural Adaptation to Threatened Disasters. Human Organization(27), 298-307.
Arlikatti, S., Lindell, M., Prater, C., Zhang, Y., 2006. Risk Area Accuracy and Hurricane Evacuation
Expectations of Coastal Residents. Environment and Behavior 38(2), 226-247.
Austin, P.C., 2012. Generating survival times to simulate Cox proportional hazards models with time-
varying covariates. Statistics in Medicine 31(29), 3946-3958.
Baker, E., 1979. Predicting Response to Hurricane Warnings: A Reanalysis of Data from Four Studies.
Mass Emergencies 4, 9-24.
Baker, E., 1991a. Hurricane Evacuation Behavior. International Journal of Mass Emergencies and
Disasters 9(2), 287-310.
Baker, E.J., 1991b. Hurricane Evacuation Behavior. International Journal of Mass Emergencies and
Disasters 9(2), 287-310.
Balmer, M., Axhausen, K., Nagel, K., 2006. Agent-Based Demand-Modeling Framework for Large-Scale
Microsimulations. Transportation Research Record 1985, 125-134.
Balmer, M., Rieser, M., Meister, K., Charypar, D., Lefebvre, N., Nagel, K., 2009. MATSIM-T:
Architecture and Simulation Times, in: Bazzan, A., Klügl, F. (Eds.), Multi-Agent Systems for Traffic and
Transportation Engineering. Information Science Reference, Hershey, NY, pp. 57-78.
Barrett, B., Ran, B., Pillai, R., 2000. Developing a Dynamic Traffic Management Modeling Framework
for Hurricane Evacuation. Transportation Research Record 1733, 115-121.
Bateman, J., Edwards, B., 2002. Gender and Evacuation: A Closer Look at Why Women Are More
Likely to Evacuate for Hurricanes. Natural Hazards Review 3(3), 107-117.
Bender, R., Augustin, T., Blettner, M., 2005. Generating Survival Times to Simulate Cox Proportional
Hazards Models. Statistics in Medicine 24, 1713-1723.
Bhat, C., Guo, J., Srinivasan, S., Sivakumar, A., 2004. Comprehensive Econometric Microsimulator for
Daily Activity-Travel Patterns. Transportation Research Record 1894, 57-66.

123
Bhat, C., Misra, R., 2001. A Comprehensive and Operational Econo-metric Modeling Framework for
Analysis of the Activity-Travel Patterns of Nonworkers., The 9th World Conference on Transport
Research, Seoul, Korea.
Bhat, C., Pulugurta, V., 1998. A Comparison Of Two Alternative Behavioral Choice Mechanisms for
Household Auto Ownership Decisions. Transportation Research Part B: Methodology 32(1), 61-75.
Bhat, C., Singh, S., 2000. A Comprehensive Daily Activity-Travel Generation Model System for Workers.
Transportation Research Part A: Policy and Practice 34(1), 1-22.
Bhat, C., Srinivasan, S., Guo, J., 2001. Activity Based Travel Demand Modeling for Metropolitan Areas
in Texas. Center for Transportation Research, The University of Texas at Austin, Austin, TX.
Bhat, C., Srinivasan, S., Guo, J., 2002. Activity-Based Travel Demand Modeling for Metropolitan Areas
in Texas: Data Sources, Sample Formation, and Estimation Results. University of Texas at Austin, Austin,
TX.
Brodie, M., Weltzien, E., Altman, D., Blendon, R., Benson, J., 2006. Experiences of Hurricane Katrina
Evacuees in Houston Shelters: Implications for Future Planning. American Journal of Public Health
96(8), 1402-1408.
Carnegie, J., Deka, D., 2010. Using Hypothetical Disaster Scenarios to Predict Evacuation Behavioral
Response, The 89th Transportation Research Board Annual Meeting. Transportation Research Board,
Washington D.C.
Chen, X., Meaker, J., Zhan, B., 2006. Agent-Based Modeling and Analysis of Hurricane Evacuation
Procedures for the Florida Keys. Natural Hazards 38, 321-338.
Cheng, G., 2007. Friction Factor Function Calibration for Hurricane Evacuation Trip Distribution,
Transportation Research Board 86th Annual Meeting. Transportation Research Board, Washington D.C.
Cheng, G., Wilmot, C., Baker, E., 2008. A Destination Choice Model for Hurricane Evacuation,
Transportation Research Board 86th Annual Meeting. Transportation Research Board, Washington D.C.
Chiu, Y.-C., Mirchandani, P.B., 2008. Online Behavior-Robust Feedback Information Routing Strategy
for Mass Evacuation. IEEE Transactions on Intelligent Transportation Systems 9(2), 264-274.
124
Chiu, Y.-C., Zhou, L., Song, H., 2010. Development and calibration of the Anisotropic Mesoscopic
Simulation model for uninterrupted flow facilities. Transportation Research Part B: Methodological
44(1), 152-174.
Corder, G., Foreman, D., 2009. Nonparametric Statistics for Non-Statisticians : A Step-by-Step Approach.
Wiley, Hoboken, N.J.
Cova, T., Johnson, J., 2002. Microsimulation of Neighborhood Evacuations in the Urban-Wildland
Interface. Environment and Planning A 34(12), 2211 – 2229.
Cutter, S., Barnes, K., 1982. Evacuation behavior and Three Mile Island. Disasters 6(2), 116-124.
Dash, N., Gladwin, H., 2007. Evacuation Decision Making and Behavioral Responses: Individual and
Household. Natural Hazards Review 8(3), 69-77.
Dash, N., Morrow, B., 2000. Return delays and evacuation order compliance:: the case of Hurricane
Georges and the Florida Keys. Global Environmental Change Part B: Environmental Hazards 2(3), 119-
128.
Department of Planning and Zoning, 2011. 2010 Census Data Demographics of Commission Districts in
Miami-Dade. Department of Planning and Zoning, Miami-Dade, FL.
Dixit, V., Wilmot, C., Wolshon, B., 2012. Modeling Risk Attitudes in Evacuation Departure Choices,
91st Annual Meeting of the Transportation Reserach Board. Transportation Reserach Board, Washington
D.C.
Dow, K., Cutter, S., 1998. Crying wolf: Repeat responses to hurricane evacuation orders. Coastal
Management 26(4), 237-252.
Dow, K., Cutter, S., 2002a. Emerging Hurricane Evacuation Issues: Hurricane Floyd and South Carolina.
Natural Hazards Review 3(1), 12-18.
Dow, K., Cutter, S.L., 2002b. Emerging Hurricane Evacuation Issues: Hurricane Floyd and South
Carolina. Natural Hazards Review 3(1), 12-18.
Elliott, J., Pais, J., 2006. Race, Class, and Hurricane Katrina: Social differences in human responses to
disaster. Social Science Research 35(2), 295-321.
125
Farahmand, K., 1997. Application of Simulation Modeling to Emergency Population Evacuation, in:
Andradottir, S., Healy, K., Withers, D., Nelson, B. (Eds.), 1997 Winter Simulation Conference, Atlanta,
GA, pp. 1181-1188.
Fitzpatrick, C., Mileti, D., 1991. Motivating Public Evacuation. International Journal of Mass
Emergencies and Disasters 9(2), 137-152.
Fu, H., Wilmot, C., 2004. Sequential Logit Dynamic Travel Demand Model for Hurricane Evacuation.
Transportation Research Record 1882, 19-26.
Fu, H., Wilmot, C., 2006. Survival Analysis-based Dynamic Travel Demand Models for Hurricane
Evacuation. Transportation Research Record 1964, 211-218.
Gladwin, C., Gladwin, H., Peacock, W., 2001. Modeling Hurricane Evacuation Decisions with
Ethnographic Methods. International Journal of Mass Emergencies and Disasters 19(2), 117-143.
Gladwin, H., Peacock, W., 1997. Warning and Evacuation: A Night for Hard Houses, in: Peacock, W.G.,
Morrow, B.H., Gladwin, H. (Eds.), Hurricane Andrew: Ethnicity, gender, and the sociology of disasters.
International Hurricane Center, Miami, pp. 52-72.
Greene, W., 2012. Econometric Analysis. Prentice Hall, Upper Saddle River, New Jersey.
Greene, W., Hensher, D., 2010. Modeling Ordered Choices: A Primer. Cambridge University Press, New
York.
Gudishala, R., Wilmot, C., 2012a. Comparison of Time-Dependent Sequential Logit and Nested Logit for
Modeling Hurricane Evacuation Demand. Transportation Research Record 2312, 134-140.
Gudishala, R., Wilmot, C., 2012b. Comparison of Time-Dependent Sequential Logit and Nested Logit
Models for Hurricane Evacuation Demand, 91st Annual Meeting of the Transportation Reserach Board.
Transportation Reserach Board, Washington D.C.
Handford, D., Rogers, A., 2011. Modelling Driver Interdependent Behaviour in Agent-Based Traffic
Simulations for Disaster Management
Advances on Practical Applications of Agents and Multiagent Systems, in: Demazeau, Y., Pechoucek, M.,
Corchado, J., Pérez, J. (Eds.). Springer Berlin / Heidelberg, pp. 163-172.

126
Hasan, S., Mesa-Arango, R., Ukkusuri, S., 2013a. A Random-parameter Hazard-based Model to
Understand Household Evacuation Timing Behavior. Transportation Research Part C: Emerging
Technologies 27, 108-116.
Hasan, S., Mesa-Arango, R., Ukkusuri, S., 2013b. A random parameter hazard based model to understand
the temporal dynamics of household evacuation timing behavior. Transportation Research Part C 27,
108-116.
Hasan, S., Ukkusuri, S., Gladwin, H., Murray-Tuite, P., 2011. Behavioral Model to Understand
Household-Level Hurricane Evacuation Decision Making. Journal of Transportation Engineering 137(5),
pp 341-348.
Hobeika, A., Kim, C., 1998. Comparison of Traffic Assignments in Evacuation Modeling. IEEE
Transactions on Engineering Management 45(2), 192-198.
Hobeika, A., Kim, S., Beckwith, R., 1994. A Decision Support System for Developing Evacuation Plans
around Nuclear Power Stations. Interfaces 24(5), 22-35.
Hosmer, W., Lemeshow, S., 2000. Applied Logistic Regression. John Wiley & Sons, New York, NY.
Lämmel, G., Grether, D., Nagel, K., 2010. The Representation and Implementation of Time-dependent
Inundation in Large-scale Microscopic Evacuation Simulations. Transportation Research Part C:
Emerging Technologies 18(1), 84-98.
Ley, H., 2009. TRANSIMS Training Course at TRACC. Argonne National Laboratory, Chicago, IL.
Lin, D.-Y., Eluru, N., Waller, S.T., Bhat, C.R., 2009. Evacuation Planning Using the Integrated System of
Activity-Based Modeling and Dynamic Traffic Assignment. Transportation Research Record: Journal of
the Transportation Research Board(2132), pp 69-77.
Lindell, M., 2008. EMBLEM2: An empirically based large scale evacuation time estimate model.
Transportation Research Part A: Policy and Practice 42(1), 140-154.
Lindell, M., Kang, J., Prater, C., 2011. The Logistics of Household Hurricane Evacuation. Natural
Hazards 58, 1093–1109.

127
Lindell, M., Lu, J.-C., Prater, C., 2005. Household Decision Making and Evacuation in Response to
Hurricane Lili. Natural Hazards Review 6(4), 171-179.
Lindell, M., Perry, R., 2000. Household Adjustment to Earthquake Hazard: A Review of Research.
Environment and Behavior 32(4), 461-501.
Lindell, M., Prater, C., 2007a. Critical Behavioral Assumptions in Evacuation Time Estimate Analysis for
Private Vehicles: Examples from Hurricane Research and Planning. Journal of Urban Planning and
Development 133(1), 18-29.
Lindell, M., Prater, C., 2007b. A Hurricane Evacuation Management Decision Support System (EMDSS).
Natural Hazards 40(3), 627-634.
Lindell, M., Prater, C., Wu, J., 2002. Hurricane Evacuation Time Estimates for the Texas Gulf Coast.
Texas A&M University, College Station, TX.
Lindell, M.K., Prater, C.S., 2007c. Critical Behavioral Assumptions in Evacuation Time Estimate
Analysis for Private Vehicles: Examples from Hurricane Research and Planning. Journal of Urban
Planning and Development 133(1), 18-29.
Liu, S., Murray-Tuite, P., Schweitzer, L., 2012. Analysis of child pick-up during daily routines and for
daytime no-notice evacuations. Transportation Research – A 46, 48-67.
Liu, S., Murray-Tuite, P., Schweitzer, L., accepted-a. Incorporating Household Gathering and Mode
Decisions in Large-Scale No-Notice Evacuation Modeling. Computer-Aided Civil and Infrastructure
Engineering.
Liu, S., Murray-Tuite, P., Schweitzer, L., accepted-b. Uniting Multi-Adult Households During
Emergency Evacuation Planning Disasters.
Liu, S., Murray-Tuite, P., Schweitzer, L., In Press. Uniting Multi-Adult Households During Emergency
Evacuation Planning. Disasters Journal.
Liu, Y., Lai, X., Chang, G., 2006. Two-Level Integrated Optimization System for Planning of Emergency
Evacuation. Journal of Transportation Engineering 132(10), 800-807.

128
Liu, Y., Okada, N., Takeuchi, Y., 2008. Dynamic Route Decision Model-based Multi-agent Evacuation
Simulation - Case Study of Nagata Ward, Kobe. Journal of Natural Disaster Science 28, 91-98.
Long, S., Freese, J., 2006. Regression Models for Categorical Dependent Variables Using Stata. Stata
Press, College Station, TX.
Ma, Y., Krometis, J., Sen, A., 2009. Radiological Emergency Evacuation Trip Generation Model
Developed from Telephone Survey, p. 19p.
Mahamassani, H., 2001. Dynamic Network Traffic Assignment and Simulation Methodology in
Advanced System Management Applications. Network and Spatial Economics 1(3-4), 267-292.
McNally, M., 2007a. The Activity-Based Approach. Pergamon, Oxford, UK.
McNally, M., 2007b. The Four Step Model. Pergamon, Oxford, UK.
McNally, M., Recker, W., 1986. On the Formation of Household Travel/Activity Patterns: A Simulation
Approach. University of California, Irvine, Irvine, CA.
Mei, B., 2002. Development of Trip Generation Models for Hurricane Evacuation, Department of Civil
and Environmental Engineering. Louisiana State University, Baton Rouge, LA.
Mesa-Arango, R., Hasan, S., Ukkusuri, S., Murray-Tuite, P., 2012. A Household-Level Model for
Hurricane Evacuation Destination Type Choice Using Hurricane Ivan Data. Natural Hazards Review.
Mileti, D., Sorensen, J., O'Brien, P., 1992. Toward an Explanation of Mass Care Shelter Use in
Evacuations. International Journal of Mass Emergencies and Disasters 10(1), 25-42.
Mitchell, W., Radwan, E., 2006. Heuristic Prioritization of Emergency Evacuation Staging to Reduce
Clearance Time, The 85th Annual Meeting of the Transportation Research Board. Transportation
Research Board, Washington D.C.
Modali, N., 2005. Modeling Destination Choice and Measuring the Transferability of Hurricane
Evacuation Patterns, Department of Civil and Environmental Engineering. Louisiana State University,
Baton Rouge, LA.
129
Montz, T., Dixit, V., Wolshon, B., 2011. Best of Both Worlds: Combining Demand and Simulation
Models for Hurricane Evacuation, The 90th Annual Meeting of the Transportation Research Board.
Transportation Research Board, Washington D.C.
Montz, T., Zhang, Z., 2013. Calibration and Validation of a Regional-Level TrafficModel for Hurricane
Evacuation, The 92nd Annual Meeting of the Transportation Research Board. Transportation Research
Board, Washington D.C.
Murray-Tuite, P., Park, B., Hancock, K., Nava, E., Yin, W., Ghanipoor Machiani, S., Jahangiri, A., Liu,
S., Jones, T., Lee, J., So, J., Wolshon, B., Chiu, Y.-C., 2012a. Evacuation Transportation Analysis for the
Northern Virginia Region. The Virginia Center for Transportation Innovation and Research,
Charlottesville, Virginia.
Murray-Tuite, P., Wolshon, B., 2013a. Evacuation Transportation Modeling: An Overview of Research,
Development, and Practice Transportation Research - Part C 27, 25-45.
Murray-Tuite, P., Wolshon, B., 2013b. Evacuation Transportation Modeling: An Overview of Research,
Development, and Practice. Transportation Research Part C: Emerging Technologies 27, 25-45.
Murray-Tuite, P., Yin, W., Ukkusuri, S., Gladwin, H., 2012. Changes in Evacuation Decisions between
Hurricanes Ivan and Katrina, 91st Annual Meeting of the Transporation Research Board, Washington,
D.C.
Murray-Tuite, P., Yin, W., Ukkusuri, S., Gladwin, H., 2012b. Changes in Evacuation Decisions Between
Hurricanes Ivan and Katrina, Transportation Research Board 91st Annual Meeting. Transportation
Research Board, Washington, D.C.
Murray-Tuite, P.M., Mahmassani, H.S., 2003. Model of Household Trip Chain Sequencing in an
Emergency Evacuation. Transportation Research Record 1831, 21-29.
Murray-Tuite, P.M., Mahmassani, H.S., 2004. Transportation Network Evacuation Planning with
Household Activity Interactions. Transportation Research Record 1894, 150-159.
National Science Board, 2007. Hurricane Warning: The Critical Need for a National Hurricane Research
Initiative. National Science Foundation, Arlington, VA.
130
Noltenius, M., 2008. Capturing Pre-Evacuation Trips and Associative Delays: A Case Study of the
Evacuation of Key West, Florida for Hurricane Wilma, Department of Geography. The University of
Tennessee, Knoxville, Knoxville, TN.
Noltenius, M., Ralston, B., 2010. Pre-evacuation Trip Behavior. Springer Science, Netherlands.
North, M., Macal, C., 2007. Managing Business Complexity: Discovering Strategic Solutions with Agent-
Based Modeling and Simulation. Oxford University Press, New York, NY.
PBSJ Inc., 1999. Hurricane Georges Assessment: Review of Hurricane Evacuation Studies Utilization
And Information Dissemination. Federal Emergency Management Agency, Tallahassee, Florida.
Peacock, W., Brody, S., Highfield, W., 2005. Hurricane risk perceptions among Florida's single family
homeowners. Landscape and Urban Planning 73(2-3), 120-135.
Pel, A., Bliemer, M., Hoogendoorn, S., 2012. A Review on Travel Behaviour Modelling in Dynamic
Traffic Simulation Models for Evacuations. Transportation 39(1), 97-123.
Pendyala, R.M., Ye, X., 2005. Contributions to Understanding Joint Relationships Among Activity and
Travel Variables, in: Timmermans, H. (Ed.), Progress in Activity-Based Analysis. Pergamon, Oxford, UK,
pp. 1-24.
Prater, C., Wenger, D., Grady, K., 2000. Hurricane Bret Post-Storm Assessment: A Review of the
Utilization of Hurricane Evacuation Studies and Information Dissemination. Texas A&M Univ. Hazard
Reduction and Recovery Center, College Station TX.
PTV, 2011. VISSIM 5.30-04 User Manual, Karlsruhe, Germany.
Rabe-Hesketh, S., Skrondal, A., 2012. Multilevel and Longitudinal Modeling Using Stata Vol. II:
Categorical Responses, Counts and Survival. Stata Press, College Station, TX.
Radwan, A., Hobeika, A., Sivasailam, D., 1985. Computer Simulation Model for Rural Network
Evaluation under Natural Disasters. ITE Journal 55(9), 25-30.
Rakha, H., Van Aerde, M., 2004. INTEGRATION User's Guide. Van Aerde & Associates, Kingston,
Canada.
131
Riad, J., Norris, F., Ruback, R., 1999. Predicting Evacuation in Two Major Disasters: Risk Perception,
Social Influence, and Access to Resources. Journal of Applied Social Psychology 29(5), 918-934.
Ruch, C., Schumann, G., 1997. Corpus Christi Study Area Hurricane Contingency Planning Guide. Texas
A&M Univ. Hazard Reduction and Recovery Center, College Station, TX.
Ruch, C., Schumann, G., 1998. Houston/Galveston Study Area Hurricane Contigency Planning Guide.
Texas A&M Univ. Hazard Reduction and Recovery Center, College Station, TX.
Santos, G., Aguirre, B., 2004. A Critical Review Of Emergency Evacuation Simulation Models. Disaster
Research Center, University of Delaware.
Siebeneck, L., Cova, T., 2008. An Assessment of the Return-Entry Process for Hurricane Rita 2005.
International Journal of Mass Emergencies and Disasters 26, 91–111.
Solis, D., Thomas, M., Letson, D., 2010. An Empirical Evaluation of the Determinants of Household
Hurricane Evacuation Choice. Journal of Development and Agricultural Economics 2(3), 188-196.
Sorensen, J., 2000. Hazard Warning Systems: Review of 20 Years of Progress. Natural Hazards Review
1(2), 119-125.
Sorensen, J., Vogt, B., 2006. Interactive Emergency Evacuation Guidebook, Chemical Stockpile
Emergency Preparedness Program, Oak Ridge, TN.
Southworth, F., 1991. Regional Evacuation Modeling: A State-of-the-Art Review. Center for
Transportation Analysis, Oak Ridge National Laboratory, Oak Ridge, Oak Ridge, TN.
Southworth, F., Chin, S.-M., 1987. Network evacuation modelling for flooding as a result of dam failure.
Environment and Planning A 19(11), 1543 – 1558.
Train, K., 2002. Discrete Choice Methods with Simulation. Cambridge University Press, New York, NY.
Tweedie, S., Rowland, J., Walsh, S., Rhoten, R., Hagle, P., 1986. A Methodology for Estimating
Emergency Evacuation Times. The Social Science Journal 23(2), 189-204.
UCLA: Statistical Consulting Group, 2013. What statistical analysis should I use? UCLA, Los Angeles,
CA.

132
Urbina, E., Wolshon, B., 2003. National Review of Hurricane Evacuation Plans and Policies: a
Comparison and Contrast of State Practices. Transportation Research Part A: Policy and Practice 37(3),
257-275.
Wardrop, J., 1952. Some Theoretical Aspects of Road Traffic Research. Proceedings of the Institution of
Civil Engineers, Part II 1(36), 352-362.
Whitehead, J., 2000. One Million Dollars a Mile?: The Opportunity Costs of Hurricane Evacuation.
Whitehead, J., Edwards, B., Van Willigen, M., Maiolo, J.R., Wilson, K., Smith, K.T., 2000. Heading for
Higher Ground: Factors Affecting Real and Hypothetical Hurricane Evacuation Behavior. Environmental
Hazards 2(4), 133-142.
Wilmot, C., Mei, B., 2004. Comparison of Alternative Trip Generation Models for Hurricane Evacuation.
Natural Hazards Review 5(4), 170-178.
Wilmot, C., Modali, N., Chen, B., 2006. Modeling Hurricane Evacuation Traffic: Testing the Gravity and
Intervening Opportunity Models as Models of Destination Choice in Hurricane Evacuation. Louisiana
Transportation Research Center, Baton Rouge.
Wolshon, B., Jones, J., Walton, F., 2010. The Evacuation Tail and Its Effect on Evacuation Decision
Making. Journal of Emergency Management 8(1), 37-46.
Wolshon, B., Lefante, J., Naghawi, H., Montz, T., Dixit, V., Renne, J., Haughey, P., Dufour, W., 2009.
Application of TRANSIMS for the Multimodal Microscale Simulation of the New Orleans Emergency
Evacuation Plan. Louisiana State University, Baton Rouge, LA.
Wu, H.-C., Lindell, M., Prater, C., 2012. Logistics of hurricane evacuation in Hurricanes Katrina and Rita.
Transportation Research Part F: Traffic Psychology and Behaviour 15(4), 445-461.
Yazici, M., Ozbay, K., 2008. Evacuation Modelling in the United States: Does the Demand Model Choice
Matter? Transport Reviews 28(6), 757-779.
Yin, W., Murray-Tuite, P., Ukkusuri, S., 2012a. Panel Regression Models to Understand the Changes in
Evacuate/Stay Decisions between Hurricanes Ivan and Katrina, The 2nd International Conference on
Evacuation Modeling, Evanston, IL.
133
Yin, W., Murray-Tuite, P., Ukkusuri, S., Gladwin, H., 2012b. Understanding the Evacuation Destination
Distance and Departure Time Choices: A Joint Modeling Approach, The 92nd Annual Meeting of the
Transportation Research Board, Washington D.C.
Yin, W., Murray-Tuite, P., Ukkusuri, S., Gladwin, H., 2013a. A Statistical Analysis of the Number of
Household Vehicles Used for Hurricane Ivan Evacuation. Virginia Tech, Falls Church, VA.
Yin, W., Murray-Tuite, P., Ukkusuri, S., Gladwin, H., 2013b. Pre-Evacuation Activities for Hurricane
Evacuation: An Analysis of Behavioral Intentions from Miami Beach, Florida. Virginia Tech, Falls Churh,
VA.
Zeigler, D., Brunn, S., Johnson, J., 1981. Evacuation from a Nuclear Technological Disaster.
Geographical Review 71(1), 1-16.
Zhang, B., Chan, W., Ukkusuri, S., 2009. Agent-Based Modeling for Household Level Hurricane
Evacuation, in: Rossetti, M.D., Hill, R.R., Johansson, B., Dunkin, A., Ingalls, R.G. (Eds.), 2009 Winter
Simulation Conference. IEEE, Austin, TX, pp. 2778-2784.
Zhang, F., Morss, R., Sippel, J., Beckman, T., Clements, N., Hampshire, N., Harvey, J., Hernandez, J.,
Morgan, Z., Mosier, R., Wang, S., Winkley, S., 2007. An In-Person Survey Investigating Public
Perceptions of and Responses to Hurricane Rita Forecasts along the Texas Coast. Weather and
Forecasting 22(6), 1177-1190.