an all-island approach to mapping bovine tuberculosis in ireland
TRANSCRIPT

Irish Veterinary Journal Volume 62 Number 3192
PEER R
EvIEW
ED
INtrODuCtIONDespite ongoing control efforts, bovine tuberculosis (TB; caused by Mycobacterium bovis infection) remains an important public and animal health issue throughout the island of Ireland, which includes the jurisdictions of Northern Ireland and the Republic of Ireland. In Northern Ireland, the control of TB commenced in 1935, with the slaughter of clinically affected animals, and a compulsory eradication scheme was established in 1959 (Abernethy et al. 2006). In Ireland, an eradication programme commenced in 1954 (More and Good, 2006). These programmes are each currently directed by several European Union Directives, including European Council Directive 64/432 (including successive amendments and corrigenda), which provides
detailed information about intra-community trade in bovine animals for breeding, production or slaughter, including, with relevance to bovine TB:
The definition of an ‘officially TB-free herd’ and the •circumstances under which this herd-based status is retained, suspended or withdrawn;How a MS (or region of a MS) can achieve officially •TB-free status, and the circumstances under which this area-based status is retained, suspended or revoked; and,The rules relating to intra-community trade, including •health certificate and checks on origin and destination (Anon. 1964; Reviriego Gordejo and Vermeersch 2006).
COrrESPONDING AutHOr:Guy McGrathCentre for Veterinary Epidemiology and Risk Analysis, Veterinary Sciences CentreUCD School of Agriculture, Food Science and Veterinary Medicine, University College Dublin, Belfield, Dublin 4, IrelandE-mail: [email protected]: 00353 1 716 6143Fax: 00353 1 716 6147
kEywOrDS: Bovine tuberculosis, epidemiology, geographic information systems, GIS, mapping, Northern Ireland, Republic of Ireland, TB
An all-island approach to mapping bovine tuberculosis in IrelandMcGrath G1, Abernethy D2, Stringer L2,3 and More SJ1
1 Centre for Veterinary Epidemiology and Risk Analysis, Veterinary Sciences Centre,UCD School of Agriculture, Food Science and Veterinary Medicine, University College Dublin, Belfield, Dublin 4, Ireland2 Veterinary Epidemiology Unit, Department of Agriculture and Rural Development, Dundonald House, Belfast BT4 3SF, Northern Ireland3 Institute of Veterinary, Animal and Biomedical Sciences, Massey University, PB 11222, Palmerston North, New Zealand
Irish Veterinary JournalVolume 62 Number 3 192-197, 2009
AbStrACtThis study used techniques in Geographical Information Systems (GIS) to explore the spatial patterns of bovine tuberculosis (TB) in the whole island of Ireland over an 11-year period. This is the first time that data pertaining to TB from the Republic of Ireland and Northern Ireland have been collated and examined in an all-Ireland context. The analyses were based on 198,156 point locations representing active farms with cattle in Northern Ireland and the Republic of Ireland between the years 1996 and 2006. The results consist of a series of maps giving a visual representation of cattle populations and associated detected bTB levels on the island of Ireland over this time interval.

PEER R
EvIEW
ED
Irish Veterinary Journal Volume 62 Number 3 193
In both Ireland and Northern Ireland, there is substantial laboratory and epidemiological input into the eradication programme (Denny and Wilesmith 1999; Pollock and Neill 2002; Griffin et al. 2005; Costello et al. 2006). There have been similarities, but also differences, in eradication measures for bovine tuberculosis in Northern Ireland (north) and the Republic of Ireland (south) (Anon. 2004a,b; Abernethy et al. 2006; More and Good 2006), which share a lengthy common border. Cattle-related measures are similar in both jurisdictions, focusing on surveillance (the detection of new cases, through field and factory surveillance) and control (the resolution of existing cases, through herd restriction, reactor removal, ongoing testing, etc.). During the 1950s and early 1960s throughout the island, progress in these programmes was good, leading to a substantial decrease in animal incidence. However, in both jurisdictions, eradication has proved elusive. A range of factors have been identified as constraints to eradication (Abernethy et al. 2006; More and Good 2006), relating to both wildlife and cattle.Wildlife-related measures are a key component of the eradication programme in the south, but not the north. Reactive (targeted) badger culling was undertaken in Ireland during the 1980s, as focused studies in counties Cork, Galway, Kilkenny, Offaly and Longford (More and Good 2006), and the 1990s (O’Boyle 1997, 1998, 1999, 2001; O’Boyle et al. 2003), before being formally incorporated into the national eradication programme on January 1, 2004 (O’Keeffe 2006). The role of badgers in bTB epidemiology in Ireland has been increasingly understood, based on results from the east Offaly (Ó Máirtín et al. 1998a,b; Kelly et al. 2008) and four area projects (Griffin et al. 2005).Geographical Information Systems (GIS) enable data to be visualised and examined spatially. At a simple level, data representing locations of interest or an event can be visualised in space as point maps. Data occupying an area such as a county or electoral division can be represented as a polygon with a defined shape. Count data can be assigned to these shapes and visualised through colouring or shading as a choropleth map (Cromley and Cromley 1996). Disease data are commonly recorded at a point level and then assigned to an area and represented as a choropleth map (for eg., More 2006; Centers for Disease Control and Prevention 2007; More and Collins 2008).The aim of this project is to use GIS to explore the spatio-temporal patterns of bTB reactors in the whole island over an 11-year period using techniques that incorporate methodologies of both point-process and polygon based visualisation.
MAtErIAlS AND MEtHODSFarm dataIn total, 198,156 point locations representing all active farms with cattle in Northern Ireland and the Republic of Ireland between 1996 and 2006 were compiled into a single spatial coverage. The technique used for determining the point representation for farms differs
between Northern Ireland and the Republic of Ireland:The Department of Agriculture and Rural Development, •Northern Ireland (DARDNI) uses a system whereby the point location of the home farm is recorded in the Animal and Public Health Information System (APHIS), the national database for animal disease and movement control; and,In the Republic of Ireland, the Land Parcel •Identification System (LPIS), a spatial database created by the Department of Agriculture, Fisheries and Food (DAFF) to manage European Union Area Aid claims, contains the location of the farm areas claimed by 95% of all farms. The centre of gravity or centroid of the largest fragment of land of each farm is calculated and used as a point representation of that farm.
There were certain discrepancies between the Northern Ireland and Republic of Ireland data through time before 1999. The LPIS data were first compiled in 1999. Herd numbers that changed or went dormant between 1996 and 1998 do not exist in the southern spatial database. These missing herd numbers comprise of less than 2% of the total number of herds over this period allowing these years to be included in the study.
Disease dataThe number of tuberculosis tests and the number of disclosed tuberculosis standard reactor animals were summarised by farm for each of the study years. In each administration, a standard reactor at the single comparative intradermal skin test is defined, in accordance with Annex A of Directive 64/432/EEC (Anon. 1964), as ‘a positive bovine reaction which is more than 4 mm greater than the avian reaction’.
GIS methodologiesTwo different GIS methodologies were employed to visualise the spatial patterns in tuberculosis over time and are described, as follows:The first method involved transforming the point locations representing farms from Cartesian co-ordinates (X, Y) into a continuous surface. This technique is known as kernel smoothing and uses a bivariate probability density function (or kernel) to allocate a density distribution at each location, based on the selected bandwidth or search radius (Bailey and Gatrell 1995). Two surfaces were generated for each year, one representing the number of animals tested (Figure 1) and the other the number of standard reactors (Figure 2). The output values for these surfaces were per square kilometre. The disease surface (standard reactors) was then divided by the population surface (number of animal tests) to create a relative risk surface for each year (Figure 3). This work was conducted using ArcGIS 9.1 (ESRI, Redlands, CA, USA). The reactor and population surfaces were separately generated (using the Spatial Analyst extension – kernel density) using a 15 kilometre search radius and a grid size of 250 metres. A 10 kilometre search radius was used for the enumerator

Irish Veterinary Journal Volume 62 Number 3194
PEER R
EvIEW
ED
raster surface to eliminate the edge effect associated with dividing raster surfaces of matching extents. Then, the relative risk surface was calculated (using 3D Analyst, Raster Math, Divide function), and the output surface was masked to a coverage of the coast of Ireland. The relative risk surface gives a better spatial representation of the disease than a surface generated from a point-based annual incidence map.The second method involved the generation of a uniform surface of 5,662 hexagons covering the area of the island of Ireland, each hexagon having a cross-sectional width of 5 km (a circle with a diameter of 4.3 km would fit inside a hexagon). Hexagons were generated using custom script in ArcGIS 9.1 (ESRI, Redlands, CA, USA). Whole hexagons were clipped to the outline of Ireland. Each hexagon was assigned a unique identification number (ID), and all farm points were associated with hexagons using a point in polygon analyses. Data were summed by hexagon ID in Microsoft Access (Microsoft Corporation, Redmond, WA, USA) and joined back into the hexagon coverage in the GIS. Dividing an area into hexagons or triangles (a hexagon being derived from six triangles) is more efficient than using squares (White et al. 1992). All neighbouring cells are equidistant from a centre cell in all directions. In a grid consisting of squares, there is distance decay
Figure 1: Density map of the TB-tested cattle population each year on the island of Ireland for the years 1996 to 2006.
Figure 2: Density map of TB standard reactors detected each year on the island of Ireland for the years 1996 to 2006.
Figure 3: Density map of animal-level TB risk each year on the island of Ireland during 1996 to 2006. Animal-level TB risk was calculated each year as a relative risk surface after overlaying the density map of TB standard reactors over the density map of cattle population tested for TB.

PEER R
EvIEW
ED
Irish Veterinary Journal Volume 62 Number 3 195
where the horizontal and vertical distance to neighbouring cells is less than the diagonal distance (Nekola and White 1999). All farms were assigned to the hexagon in which their point representation fell. The animal test and standard reactor information associated with all farms were then summarised for each hexagon and displayed as thematic maps (Figures 4 and 5). A measure of relative risk was represented by dividing the summarised disease data with the summarised population data in each hexagon and expressed as a percentile (Figure 6).
rESultSThe density maps are presented in Figures 1-3, and the thematic maps in Figures 4-6. The location of non-agricultural land, predominantly mountain, bog urban area and water bodies are evident in Figure 1 and Figure 4 (areas in white representing areas of very low or no cattle population). Figure 1 presents a simple overall picture of the distribution of the cattle population on the island over time. Changes in overall population between the years presented are not dramatic, yet there are significant changes to population distribution. Figure 3 shows the spatial and temporal distribution of reactors normalised by the underlying cattle population (relative risk). Figure 6 gives a clearer indication of the areas of high relative risk as the intervals are more easily represented visually.
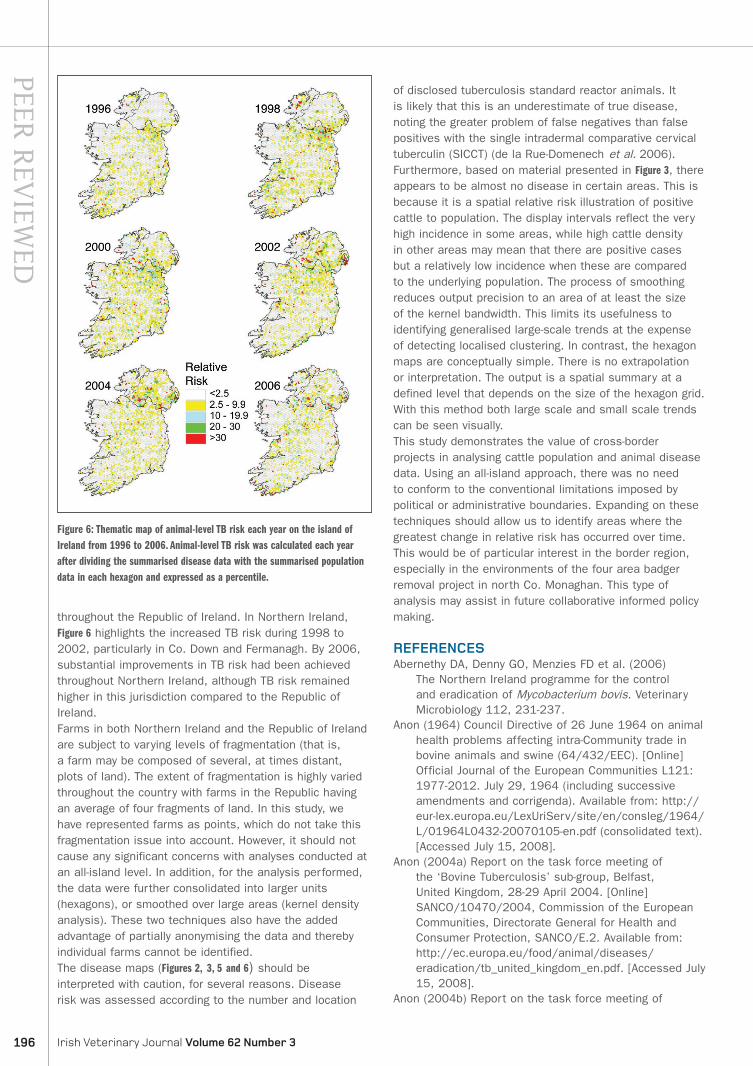
DISCuSSIONThis is the first time that data from the island of Ireland have been collated to examine spatial patterns of the cattle population and of bovine tuberculosis across the whole island. Disease statistics are usually aggregated and displayed by administrative boundaries, which may obscure any underlying spatial patterns spanning boundaries. Additionally, until now there have been differences in both the calculation and presentation of disease statistics in each jurisdiction, thereby limiting comparison. As illustrated in Figure 3, a high level of animal-level TB risk was present in south Co. Armagh (Northern Ireland) and Co. Monaghan (Republic of Ireland) during 1998. Using smoothed surfaces or fixed sized area units to represent disease in a population makes it very straightforward to discern localised patterns in space and time, especially in the context of attempting to represent data from two adjoining countries with a shared non-biosecure border.Differences exist between the two jurisdictions. As illustrated in Figure 6, there has been some improvement in animal-level TB risk in the Republic of Ireland throughout the period 1996 to 2006. Within this period, the situation was worst in 1998, with TB risk highest in the border counties, including Co. Monaghan. In 2006, TB risk was at a lower level, but remained widely dispersed,
Figure 4: Thematic map of the TB-tested cattle population each year on the island of Ireland from 1996 to 2006. Cattle population data from each farm were assigned to the relevant hexagon, based on the location of its point representation.
Figure 5: Thematic map of TB standard reactors detected each year on the island of Ireland from 1996 to 2006. TB reactor data from each farm were assigned to the relevant hexagon, based on the location of its point representation.
Irish Veterinary Journal Volume 62 Number 3196
PEER R
EvIEW
ED
throughout the Republic of Ireland. In Northern Ireland, Figure 6 highlights the increased TB risk during 1998 to 2002, particularly in Co. Down and Fermanagh. By 2006, substantial improvements in TB risk had been achieved throughout Northern Ireland, although TB risk remained higher in this jurisdiction compared to the Republic of Ireland.Farms in both Northern Ireland and the Republic of Ireland are subject to varying levels of fragmentation (that is, a farm may be composed of several, at times distant, plots of land). The extent of fragmentation is highly varied throughout the country with farms in the Republic having an average of four fragments of land. In this study, we have represented farms as points, which do not take this fragmentation issue into account. However, it should not cause any significant concerns with analyses conducted at an all-island level. In addition, for the analysis performed, the data were further consolidated into larger units (hexagons), or smoothed over large areas (kernel density analysis). These two techniques also have the added advantage of partially anonymising the data and thereby individual farms cannot be identified.The disease maps (Figures 2, 3, 5 and 6) should be interpreted with caution, for several reasons. Disease risk was assessed according to the number and location
of disclosed tuberculosis standard reactor animals. It is likely that this is an underestimate of true disease, noting the greater problem of false negatives than false positives with the single intradermal comparative cervical tuberculin (SICCT) (de la Rue-Domenech et al. 2006). Furthermore, based on material presented in Figure 3, there appears to be almost no disease in certain areas. This is because it is a spatial relative risk illustration of positive cattle to population. The display intervals reflect the very high incidence in some areas, while high cattle density in other areas may mean that there are positive cases but a relatively low incidence when these are compared to the underlying population. The process of smoothing reduces output precision to an area of at least the size of the kernel bandwidth. This limits its usefulness to identifying generalised large-scale trends at the expense of detecting localised clustering. In contrast, the hexagon maps are conceptually simple. There is no extrapolation or interpretation. The output is a spatial summary at a defined level that depends on the size of the hexagon grid. With this method both large scale and small scale trends can be seen visually. This study demonstrates the value of cross-border projects in analysing cattle population and animal disease data. Using an all-island approach, there was no need to conform to the conventional limitations imposed by political or administrative boundaries. Expanding on these techniques should allow us to identify areas where the greatest change in relative risk has occurred over time. This would be of particular interest in the border region, especially in the environments of the four area badger removal project in north Co. Monaghan. This type of analysis may assist in future collaborative informed policy making.
rEfErENCESAbernethy DA, Denny GO, Menzies FD et al. (2006)
The Northern Ireland programme for the control and eradication of Mycobacterium bovis. Veterinary Microbiology 112, 231-237.
Anon (1964) Council Directive of 26 June 1964 on animal health problems affecting intra-Community trade in bovine animals and swine (64/432/EEC). [Online] Official Journal of the European Communities L121: 1977-2012. July 29, 1964 (including successive amendments and corrigenda). Available from: http://eur-lex.europa.eu/LexUriServ/site/en/consleg/1964/L/01964L0432-20070105-en.pdf (consolidated text). [Accessed July 15, 2008].
Anon (2004a) Report on the task force meeting of the ‘Bovine Tuberculosis’ sub-group, Belfast, United Kingdom, 28-29 April 2004. [Online] SANCO/10470/2004, Commission of the European Communities, Directorate General for Health and Consumer Protection, SANCO/E.2. Available from: http://ec.europa.eu/food/animal/diseases/eradication/tb_united_kingdom_en.pdf. [Accessed July 15, 2008].
Anon (2004b) Report on the task force meeting of
Figure 6: Thematic map of animal-level TB risk each year on the island of Ireland from 1996 to 2006. Animal-level TB risk was calculated each year after dividing the summarised disease data with the summarised population data in each hexagon and expressed as a percentile.

PEER R
EvIEW
ED
Irish Veterinary Journal Volume 62 Number 3 197
the ‘Bovine Tuberculosis’ sub-group, Kilkenny, Ireland Kingdom, 09-10 June 2004. [Online] SANCO/10605/2004, Commission of the European Communities, Directorate General for Health and Consumer Protection, SANCO/E.2. Available from: http://ec.europa.eu/food/animal/diseases/eradication/tb_ireland_en.pdf. [Accessed July 15, 2008].
Bailey TC, Gatrell AC (1995) Interactive Spatial Data Analysis, Longman Group Limited, London. Pp 159-161.
Centres for Disease Control and Prevention (2007) [Online] National Center for Health Statistics, monitoring the nation’s health. Available from: http://www.cdc.gov/nchs/fastats/map_page.htm. [Accessed December 6, 2007].
Costello E Flynn, O Quigley, F O’Grady et al. (2006) Genotyping of Mycobacterium bovis isolates from badgers in four areas of the Republic of Ireland by restriction fragment length polymorphism analysis. Veterinary Record 159, 619-623.
Cromley EK, Cromley RG (1996) An analysis of alternative classification schemes for medical atlas mapping. European Journal of Cancer 32, 1551-1559.
de la Rua-Domenech R, Goodchild AT, Vordermeier HM et al. (2006). Ante mortem diagnosis of tuberculosis in cattle: A review of the tuberculin tests, γ-interferon assay and other ancillary diagnostic techniques. Research in Veterinary Science 81, 190-210.
Denny GO, Wilesmith JW (1999) Bovine tuberculosis in Northern Ireland: a case-control study of herd risk factors. Veterinary Record 144, 305-310.
Griffin JM, Williams DH, Kelly GE et al. (2005) The impact of badger removal on the control of tuberculosis in cattle herds in Ireland. Preventive Veterinary Medicine 67, 237-266.
Kelly G, Condon J, More SJ et al. (2008) A long term observational study of the impact of badger removal on herd restrictions due to bovine TB in the Irish midlands during 1989-2004. Epidemiology and Infection doi,10.1017/S0950268807000027
More SJ (ed). (2006) National maps, bovine tuberculosis. Biennial report, 2004-2005, Centre for Veterinary Epidemiology and Risk Analysis, University College Dublin, Dublin. Pp 38-40.
More SJ, Collins DM (eds). (2008) National maps, bovine tuberculosis. Biennial report, 2006-2007, Centre for Veterinary Epidemiology and Risk Analysis, University College Dublin, Dublin. Pp 32-35.
More SJ, Good M (2006) The tuberculosis eradication programme in Ireland: a review of scientific and policy advances since 1998. Veterinary Microbiology 112, 239-251.
Nekola JC, White PS (1999) The distance decay of similarity in biogeography and ecology. Journal of Biogeography 26, 867-878.
O’Boyle I (1997) Review of badger (Meles meles) research licenses in 1997. In: Selected Papers 1997. Tuberculosis Investigation Unit, University College Dublin, Dublin. Pp 37-40.
O’Boyle I (1998) Review of badger (Meles meles) research licenses in 1998. In: Selected Papers 1998.
Tuberculosis Investigation Unit, University College Dublin, Dublin. Collins JD, Hammond RF (eds). Pp 10-14.
O’Boyle I (1999) Review of badger (Meles meles) research licenses in 1999. In: Selected Papers 1999. Tuberculosis Investigation Unit, University College Dublin, Dublin. Collins JD, Hammond RF (eds). Pp 15-21.
O’Boyle I (2001) Review of badger (Meles meles) research licenses in 2000 and 2001. In: Selected Papers 2000-2001. Veterinary Epidemiology and Tuberculosis Investigation Unit, University College Dublin, Dublin. Collins JD, Hammond RF (eds). Pp 19-25.
O’Boyle I, Costello E, Power EP et al. (2003) Review of badger (Meles meles) research licenses in 2002. In: Selected Papers 2002-2003. Veterinary Epidemiology and Tuberculosis Investigation Unit, University College Dublin, Dublin. Collins JD, Hammond RF (eds).Pp 13-18.
O’Keeffe JJ (2006) Description of a medium term national strategy toward eradication of tuberculosis in cattle in Ireland. In: Biennial report, 2004-2005, Centre for Veterinary Epidemiology and Risk Analysis, University College Dublin, Dublin. More SJ (ed). Pp 101-105.
Ó Máirtín D, Williams DH, Dolan L et al. (1998a) The influence of selected herd factors and a badger-intervention tuberculosis-control programme on the risk of a herd-level trade restriction to a bovine population in Ireland. Preventive Veterinary Medicine 35, 79-90.
Ó Máirtín D, Williams DH, Griffin JM et al. (1998b) The effect of a badger removal programme on the incidence of tuberculosis in an Irish cattle population. Preventive Veterinary Medicine 34, 47-56.
Pollock JM, Neill SD (2002) Mycobacterium bovis infection and tuberculosis in cattle. Veterinary Journal 163, 115-127.
Reviriego Gordejo FJ, Vermeersch JP (2006) Towards eradication of bovine tuberculosis in the European Union. Microbiology 112, 101-109.
White D, Kimerling JA and Overton WS (1992) Cartographic and geometric components of a global sampling design for environmental monitoring. Cartography and Geographic Information Systems 19, 5-22.