an allometric algorithm for fractal-based cobb-douglas...
TRANSCRIPT
1
An Allometric Algorithm for Fractal-based Cobb-Douglas
Function of Geographical Systems
XXXXXXXXX1, XXX XXXXXX
2
(1.***************************************************************************;
2.******************************************************)
Abstracts:The generalized Cobb-Douglasproduction functionhas been derived from a general
input-output relationbased onfractality assumptions. It proved to be a usefulself-affine model for
geographical analysis. However, the ordinary least square calculation is always an
ineffectualmethod forthe Cobb-Douglas modeling because ofthe multicollinerityin the logarithmic
linear regression. In this paper, a novel approach is proposed tobuild the geographical
Cobb-Douglas models.Combiningthe concept of allometric scaling withthe linear regression
technique, we obtain a simple algorithm that can be employed toestimate the parameters of the
Cobb-Douglas function. As a case, the algorithm and models are applied to the public
transportation of China’s cities, and the results validate the allometric algorithm. A conclusion can
be drawn that the allometric analysis is an effective way of modeling geographical systems with
the general Cobb-Douglas function. This study is significant for integrating the notions
ofallometry, fractals, and scaling into a new framework to form a quantitative methodology of
spatial analys is.
Keywords :allometric growth; Cobb-Douglas function; fractal; fractal dimension; geographical
system; scaling analysis; Urban transportation of China
1 Introduction
The well-knownproduction function is proposed by Cobb and Douglas (1928)and consolidated
by many economists. Today, the Cobb-Douglas function proved to be a tool of geographical

2
analys isbecause geographical systems are always associated with economic systems(Chen, 2008;
Chen and Lin, 2009).In fact, many geographical theoriessuch ascentral place theorycame from
economics. By geographical assumptions, the generalized Cobb-Douglas production model can be
derived in a simple way by using the ideasfrom fractals and scaling. Thus fractal concept and the
production function were combined to form a new model.This model may be significant to
geographical information analys is in the future. Fractals are everywhere (Barnsley, 1988; Batty,
2008; Mandelbrot, 1983), and fractal dimension is related to information entropy (Ryabko, 1986).
Fractal geometry can be employed to reveal spatial information ofgeographical systems, especially,
cities as systems and systems of cities (Batty, 2005;Batty and Longley, 1988;Batty and Longley,
1994; Benguiguiet al, 2000; Chen, 2012; Chen and Wang, 2013; Frankhauser, 1990;Frankhauser,
1994; Frankhauser, 1998; Feng and Chen, 2010; Liu and Chen, 1995; Liu and Chen, 2000; Liu and
Chen, 2003; Luo and Chen, 2002; Thomas et al, 2007; Thomas et al, 2008; White and Engelen,
1993; White and Engelen, 1994). What is more, the general Cobb-Douglas function can be
generalized to modeling natural systems, e.g., ecological systems (Chen, 2011).
A good mathematical model is always based on an effective algorithm. However, the ordinary
least square (OLS) method cannot be used to estimate the parameter values of the fractal-based
Cobb-Douglas modelin many cases because of logarithmic multicollinearity. In other words, there
are allometric scaling relationships between any two independent variables, which are employed
to make models. On the other hand, the allometricscaling is one ofthebasic laws in geography.
Itcan be utilized to make spatial analyses for many geographical systems (Batty et al, 2008; Batty
and Longley, 1994; Chen, 2008; Chen, 2010; Lee, 1989; Liu and Chen, 2004; Liu and Chen, 2005;
Lo and Welch, 1977;Longley et al, 1991 Narol and Bertalanffy, 1956; Tobler, 1969).The key to
solving the problem of the Cobb-Douglas modeling rests with the allometry. In this paper, the
allometric analysis is adopted to develop a new approach to evaluating the parameters of the
general production function. The other parts are organized as follows. In Section 2, the allometric
scaling is demonstrated to be way of estimating the parameters of the Cobb-Douglas model. In
Section 3, the model based on theallometric algorithm is applied to the public transportation of
Chinese cities, and the empirical results validatethe theoretical derivation. Finally, in Section 4, the
related questions are discussed, and the paper is concluded with several pieces of comments.

3
2Mathematical models
2.1 New form of the production function
In geographyas well aseconomics, themathematical models similar to the Cobb-Douglas
production functions are widely employed to describe the relationship of one output to many
inputs.Suppose that there are melementsXi in a geographical system,and each elementaffects the
output Yto someextent (i=1,2,…,m). An assumption can be made as follows:the geographical
system is a fractal system in a broad sense.That is, the relationships between the inputs represented
byelements Xi and the output Y satisfy some self-similar or self-affine conditions (Chen,
2008).Becauseall the elements contribute to the output of thegeographical system, the output as
response to the elements can be generallyexpressedas follows
),,,( 21 mXXXkfY ,(1)
inwhich k is aproportionality coefficient. Taking the complete differential of equation (1) yields
i
m
i i
m
i
i
i
XX
YX
X
fkY ddd
11
.(2)
This result is easy to understand by the knowledge of complete differential in higher
mathematics.Dividing equation (2) on both sides withYgives
m
i i
ii
m
i i
ii
i X
X
X
X
Y
X
X
Y
Y
Y
11
d]
d)[(
d . (3)
The precondition of equation (3) is that the system depicted by equation (1) is of fractal structure.
If and only if the system is of self-similar or self-affine structure, the parameter σiwill be a
constant. According to our assumption aforementioned, the fractal parameterσican be defined by
iii
i
i
iX
Y
XX
YY
Y
X
X
Y
ln
ln
/
/
.(4)
This parameter is in fact an elastic coefficient. Apparently,equation (4)reflectsa partial scaling
relation, just indicating that the outputY depends to scale on the element Xiregardless of other
elements.Equation (3)can be equivalently expressedas
m
i
ii XY1
lndlnd . (5)

4
Then taking integral on both sides of this equation (5)yields
m
i
i
m
i
iiiXXY
11
lndlndlnd .(6)
Apparently, from equation (6) it follows
CXYm
i
ii
1
lnln
,(7)
whereC refers to the integral constant. A simple mathematical transform of equation (7)yields
m
i
iiXKY
1
(8)
which is just the generalized Cobb-Douglas function indicative of self-affine patterns (Chen, 2008;
Chen and Lin, 2009).In the function,the constant K=expCrefers to the output coefficient. If m=2 as
given, then equation (8) can be reduced to the common Cobb-Douglas function
21
21
XKXY ,(9)
whereX1 and X2 represent capital and labor respectively.In a city system, X1 and X2 can represent
population size and land-use area.
The traditional production function is a special case of the generalized production function. It is
clear that equation (8)denotes a complete relation, while equation (4)represents a partial relation.
In this case, ifequation (8)is true, we cannotintegrateequation (4)over Xi.Otherwise a
contradictionwill take place if we take integral of equation (4). Now supposethat only Xi
influencesY with other elements are invariable.Then the equation dlnY=σidlnXican be derived from
equation (4), and integrating this relation gives the following power function
i
ii XCY
.(10)
This is a generalizedallometricfunction(Bettencourt, 2013; Bettencourt et al, 2007; Chen, 2008;
Chen and Zhou, 2003). There is a logical contradiction between equation (8)andequation (10).
Comparing equation (10) with equation (8)shows why equation (4)cannot be taken
integralwhenequation (10)holds. Evidently, we can get a multivariate linear regression equationby
taking logarithmson both sides ofequation (8);in the same way, a univariatelinearregression
equationcan be gotten by taking logs of equation (10). According to the knowledge of
statisticsrelated, if a response variable depends on many explanatory variables, but only one of
5
whichis considered, then the estimationresults of the parameters of theregressionequation will
greatly deviates from the true values.In short,equation (10)will be trueif and only if others
elements Xj (j≠i) are all fixed.
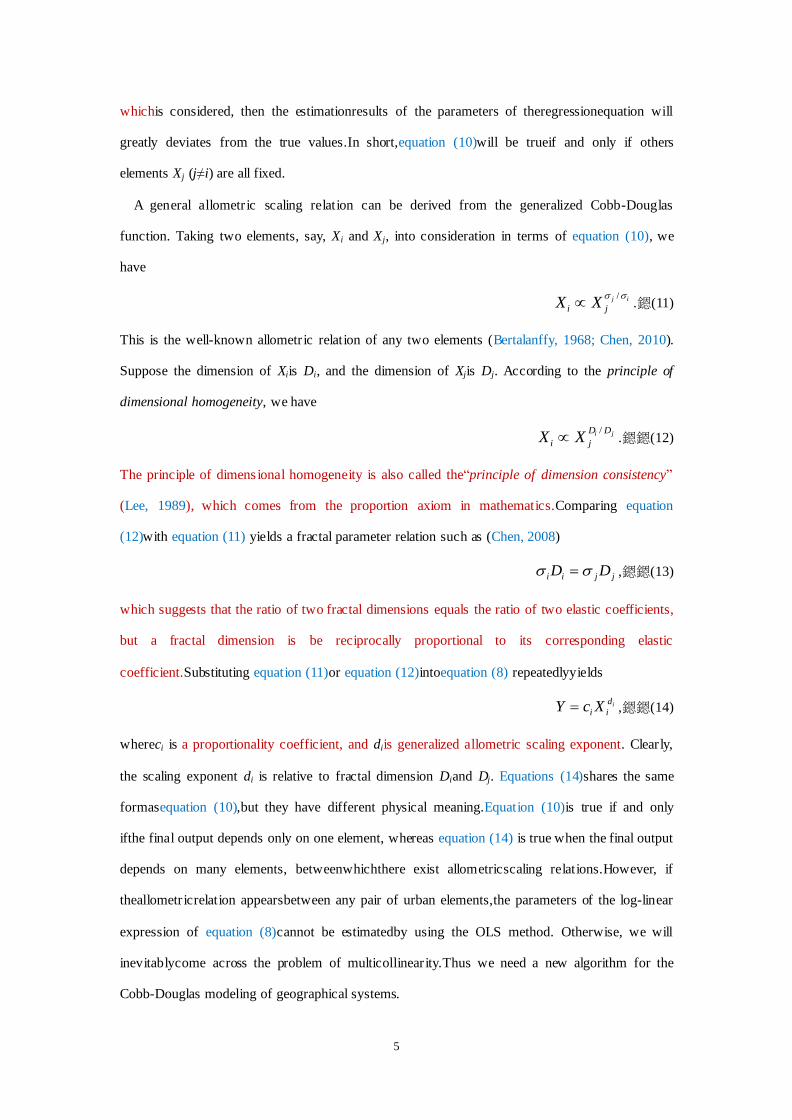
A general allometric scaling relation can be derived from the generalized Cobb-Douglas
function. Taking two elements, say, Xi and Xj, into consideration in terms of equation (10), we
have
ij
ji XX /
.(11)
This is the well-known allometric relation of any two elements (Bertalanffy, 1968; Chen, 2010).
Suppose the dimension of Xiis Di, and the dimension of Xjis Dj. According to the principle of
dimensional homogeneity, we have
ji DD
ji XX/
.(12)
The principle of dimens ional homogeneity is also called the“principle of dimension consistency”
(Lee, 1989), which comes from the proportion axiom in mathematics.Comparing equation
(12)with equation (11) yields a fractal parameter relation such as (Chen, 2008)
jjii DD ,(13)
which suggests that the ratio of two fractal dimensions equals the ratio of two elastic coefficients,
but a fractal dimension is be reciprocally proportional to its corresponding elastic
coefficient.Substituting equation (11)or equation (12)intoequation (8) repeatedlyyields
id
ii XcY ,(14)
whereci is a proportionality coefficient, and diis generalized allometric scaling exponent. Clearly,
the scaling exponent di is relative to fractal dimension Diand Dj. Equations (14)shares the same
formasequation (10),but they have different physical meaning.Equation (10)is true if and only
ifthe final output depends only on one element, whereas equation (14) is true when the final output
depends on many elements, betweenwhichthere exist allometricscaling relations.However, if
theallometricrelation appearsbetween any pair of urban elements,the parameters of the log-linear
expression of equation (8)cannot be estimatedby using the OLS method. Otherwise, we will
inevitablycome across the problem of multicollinearity.Thus we need a new algorithm for the
Cobb-Douglas modeling of geographical systems.

6
2.2Allometric algorithm
The fractal-based Cobb-Douglas equation can be formally solved by the OLS algorithm, but the
results may be unacceptable. Taking natural logarithm on both sides of equation (8) gives
mm XXXKY lnlnlnlnln 2211 , (15)
which is clearly a multivariable linear equation. It seems as if the technique of multivariate linear
regression can be employed to estimate the values of model parameters. However, the independent
variables are always related to one another in practice so that the parameters cannot be properly
evaluated because of multicollinearity. A discovery is that the allometric analys is can be used to
solve the generalized Cobb-Douglas equations. Let i=1, 2, …,m.Then multiplying equation (14)by
equation (14) again and againyields
mdm
mdmdmm
mXXXcccY//
2
/
12121 .(16)
This suggests a partial scaling relation. In fact, multiplyingXiby a scale factor λ gives
)()( ii XYXY i ,(17)
which suggest a self-affine fractal structure (Chen and Lin, 2009). Comparing equation (16) with
equation (8)shows
m
d ii .(18)
An allometric algorithm can be presented for solving the generalized production model.In fact,
equations (14) and (16) indicate a new approach to estimating model parameters, and equation (18)
suggests a simple method of evaluating the partial scaling exponents. In short, by means of the
allometric scaling relations between each independent variable and the dependent variable, we
canreplace the multiplelog-linear regressionwith a set of simplelog-linear regressions toestimate
the model parameters and then build the Cobb-Douglas model.
2.3Fractal meaning of model parameters
It is necessary to demonstrate that the parameters of the Cobb-Douglas model are associated
with fractal dimens ion. The Hausdorff dimension has been proved to be equivalent to the
Shannon’s information entropy (Ryabko, 1986). Revealing the dimension meaning of the model
7
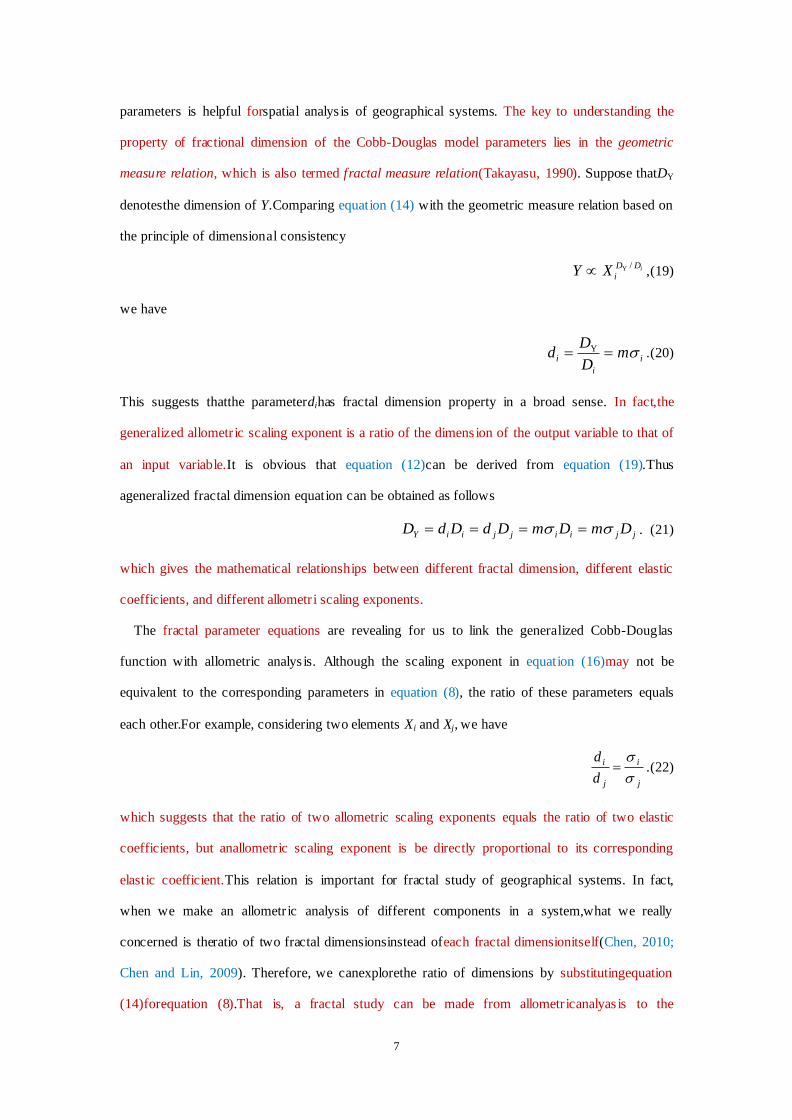
parameters is helpful forspatial analys is of geographical systems. The key to understanding the
property of fractional dimension of the Cobb-Douglas model parameters lies in the geometric
measure relation, which is also termed fractal measure relation(Takayasu, 1990). Suppose thatDY
denotesthe dimension of Y.Comparing equation (14) with the geometric measure relation based on
the principle of dimensional consistency
iDD
iXY/Y ,(19)
we have
i
i
i mD
Dd Y .(20)
This suggests thatthe parameterdihas fractal dimension property in a broad sense. In fact,the
generalized allometric scaling exponent is a ratio of the dimens ion of the output variable to that of
an input variable.It is obvious that equation (12)can be derived from equation (19).Thus
ageneralized fractal dimension equation can be obtained as follows
jjiijjiiY DmDmDdDdD . (21)
which gives the mathematical relationships between different fractal dimension, different elastic
coefficients, and different allometri scaling exponents.
The fractal parameter equations are revealing for us to link the generalized Cobb-Douglas
function with allometric analys is. Although the scaling exponent in equation (16)may not be
equivalent to the corresponding parameters in equation (8), the ratio of these parameters equals
each other.For example, considering two elements Xi and Xj, we have
j
i
j
i
d
d
.(22)
which suggests that the ratio of two allometric scaling exponents equals the ratio of two elastic
coefficients, but anallometric scaling exponent is be directly proportional to its corresponding
elastic coefficient.This relation is important for fractal study of geographical systems. In fact,
when we make an allometric analysis of different components in a system,what we really
concerned is theratio of two fractal dimensionsinstead ofeach fractal dimensionitself(Chen, 2010;
Chen and Lin, 2009). Therefore, we canexplorethe ratio of dimensions by substitutingequation
(14)forequation (8).That is, a fractal study can be made from allometricanalyas is to the
8
Cobb-Douglas modelling.
The main points of the mathematical process can be summarized as follows (Chen and Lin,
2009). First, the Cobb-Douglas function is a fractal model indicating self-affinity. Second, the
model parameters are relative to the fractal dimension in a broad sense. Third, the relationships
between one element and other elements follow the law of allometric growth. Last but not the least,
if the input-output relations of a geographical system can be characterized with the Cobb-Douglas
function, we can investigate the system by usingonly a few variables, which can simplify the
analytical process to a great extent.
3Empirical analysis
3.1 Materials and methods
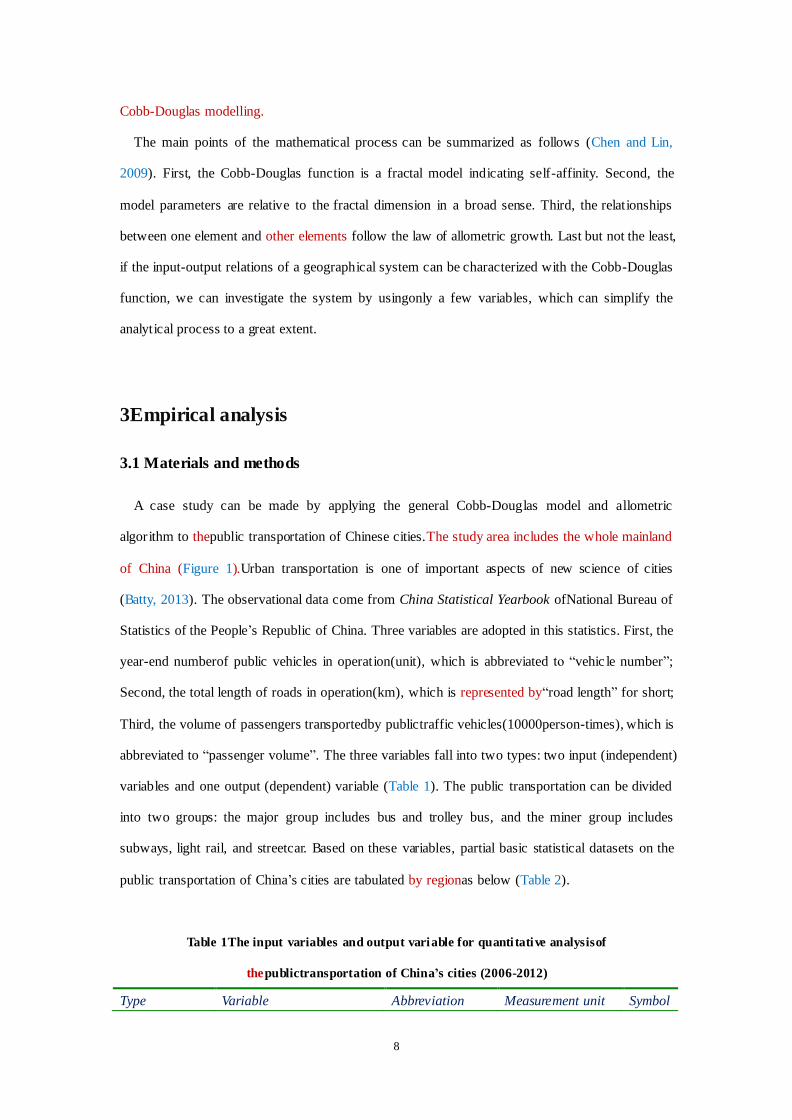
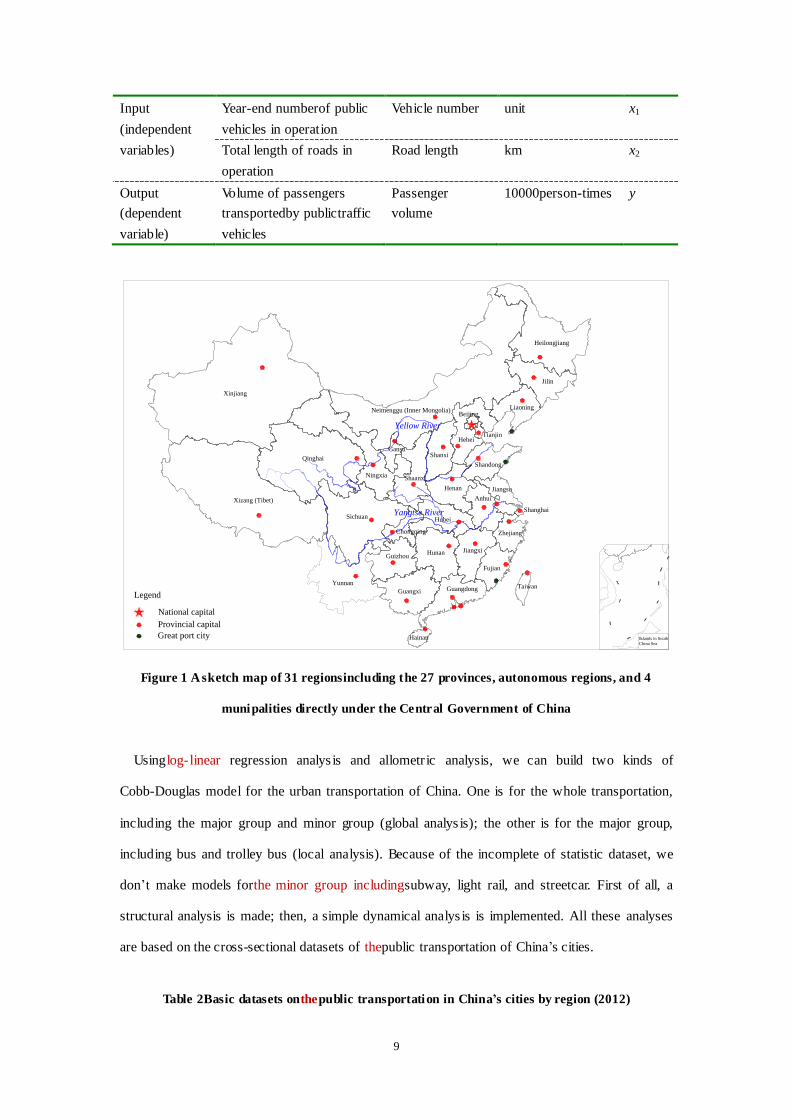
A case study can be made by applying the general Cobb-Douglas model and allometric
algorithm to thepublic transportation of Chinese cities.The study area includes the whole mainland
of China (Figure 1).Urban transportation is one of important aspects of new science of cities
(Batty, 2013). The observational data come from China Statistical Yearbook ofNational Bureau of
Statistics of the People’s Republic of China. Three variables are adopted in this statistics. First, the
year-end numberof public vehicles in operation(unit), which is abbreviated to “vehic le number”;
Second, the total length of roads in operation(km), which is represented by“road length” for short;
Third, the volume of passengers transportedby publictraffic vehicles(10000person-times), which is
abbreviated to “passenger volume”. The three variables fall into two types: two input (independent)
variables and one output (dependent) variable (Table 1). The public transportation can be divided
into two groups: the major group includes bus and trolley bus, and the miner group includes
subways, light rail, and streetcar. Based on these variables, partial basic statistical datasets on the
public transportation of China’s cities are tabulated by regionas below (Table 2).
Table 1The input variables and output variable for quanti tative analysisof
thepublictransportation of China’s cities (2006-2012)
Type Variable Abbreviation Measurement unit Symbol
9
Input
(independent
variables)
Year-end numberof public
vehicles in operation
Vehicle number unit x1
Total length of roads in
operation
Road length km x2
Output
(dependent
variable)
Volume of passengers
transportedby publictraffic
vehicles
Passenger
volume
10000person-times y
Figure 1 A sketch map of 31 regionsincluding the 27 provinces, autonomous regions, and 4
munipalities directly under the Central Government of China
Usinglog-linear regression analys is and allometric analysis, we can build two kinds of
Cobb-Douglas model for the urban transportation of China. One is for the whole transportation,
including the major group and minor group (global analys is); the other is for the major group,
including bus and trolley bus (local analysis). Because of the incomplete of statistic dataset, we
don’t make models forthe minor group includingsubway, light rail, and streetcar. First of all, a
structural analysis is made; then, a simple dynamical analys is is implemented. All these analyses
are based on the cross-sectional datasets of thepublic transportation of China’s cities.
Table 2Basic datasets onthepublic transportation in China’s cities by region (2012)
Islands in South
China Sea
National capital
Provincial capital
Great port city
Legend
Yellow River
Yangtse River
Xinjiang
Xizang (Tibet)
Neimenggu (Inner Mongolia)
Heilongjiang
Jilin
LiaoningBeijing
Tianjin
Shanghai
Chongqing
Sichuan
Yunnan
Guangxi Guangdong
Hainan
Taiwan
Fujian
Zhejiang
Jiangsu
Shandong
Hebei
Henan
Shanxi
ShaanxiNingxia
Gansu
Qinghai
Hubei
Hunan Jiangxi
Anhui
Guizhou

10
Region Global datasets(public transportation) Local datasets(bus and trolley bus)
Vehicle
number
Road
length
Passenger
volume
Vehicle
number
Road
length
Passenger
volume
Beijing 25831 19989 761578 22146 19547 515416
Tianjin 9031 12870.7 129951 8405 12732 118721
Hebei 16493 18812 203954 16493 18812 203954
Shanxi 7851 13369 124838 7851 13369 124838
Inner Mongolia 5586 10650 96349 5586 10650 96349
Liaoning 20968 21520.8 428367 20500 21384 401457
Jilin 10912 11254.5 170561 10532 11200 165336
Heilongjiang 14364 15087 223956 14364 15087 223956
Shanghai 19825 23658.2 507933 16695 23190 280360
Jiangsu 30956 49903.2 470233 30380 49793 427578
Zhejiang 23060 40606 311024 22892 40558 310463
Anhui 11992 10535 212719 11992 10535 212719
Fujian 11823 15627 224703 11823 15627 224703
Jiangxi 7852 11648 127961 7852 11648 127961
Shandong 32869 44682 398268 32869 44682 398268
Henan 18137 18337 263718 18137 18337 263718
Hubei 16982 17354.1 338901 16670 17298 330613
Hunan 13148 14132 272165 13148 14132 272165
Guangdong 53089 87797 1003098 50729 87384 739359
Guangxi 7430 9323 142505 7430 9323 142505
Hainan 2614 5600 43306 2614 5600 43306
Chongqing 8540 8959 201331 7982 8828 176968
Sichuan 19628 19179.5 357333 19388 19140 347025
Guizhou 5031 5305 132200 5031 5305 132200
Yunnan 8187 16329 148409 8187 16329 148409
Tibet 396 834 7139 396 834 7139
Shaanxi 10948 9206.9 254599 10840 9187 248687
Gansu 5214 4907 102846 5214 4907 102846
Qinghai 2067 1937 39135 2067 1937 39135
Ningxia 3042 4813 37441 3042 4813 37441
Xin jiang 8155 7568 151397 8155 7568 151397
Source: National Bureau of Statistics of the People’s Republic of China (2013). China Statistical Yearbook.
Beijing: China Statistics Press
3.2Results
For comparison, let’s examine the wrong approach to modeling the urban transportation in the
first place. If the multivariablelog-linearregression is employed to estimate the model parameters,
the results will be deviant. For the global modeling (public transportation), the mathematical

11
expression is as follows
3663.0
2
3306.1
19052.26ˆ xxy , (23)
where x1 refers to vehicle number, x2 to road length, and y-hat to passenger volume. The hat
symbol “^” indicates “predicted value”. For thelocal modeling (bus and trolley bus), the model is
3690.0
2
2959.1
17876.36ˆ xxy , (24)
in which the notation is the same as in equation (23). The main statistics for these models are
displayed in Table 3. Obviously, based on the statistics, the levels of confidence of the two
modelsare both greater than 99%. However, the scaling exponents are abnormal because the
elasticity of x2 vs y is minus. If the models are true, it will suggest that the length of roads makes a
negative contribution towards the traffic volume of passengers. This case cannot take place in the
real world. The deviantparameter values mean that the multivariablelinear regression is improper
and it is necessary to adopt a valid approach to evaluating model parameters.
Table 3Mainstatistics based on the multiple linear regressionsfor two types of models on the
publictrans portation ofChina’s cities (2012)
Item Global modeling (public
transportation)
Local modeling (bus and
trolley bus)
Type Object Statistic P values (sig.) Statistic P values (sig.)
Multiple R2 model 0.9606 -- 0.9703 --
Standard errors model 0.2009 -- 0.1642 --
F statistics model 341.5719 2.1518*10-20
457.8210 4.1012*10-22
t statistics
Constant 8.6391 2.1902*10-9 11.5756 3.4669*10
-12
x1 10.5482 2.9246*10-11
12.3132 8.0917*10-13
x2 -2.7743 0.0097 -3.3900 0.0021
Note: The standard error s is for the linear regression prediction; P value or sig. implies the corresponding
significance of F and t statistics, i.e., a kind of probability for null hypothesis.
In contrast, if we employ the allometric analys isbased on the simple linear regressionto estimate
model parameters, the result will be different and convincing. The relationship between vehicle
number as well as road length and passenger volume follows the law of allometric scaling (Figure
2, Figure 3). This is a kind of cross-sectional allometric growth (Chen, 2010). Using equations
(14)to make log-linear regression analyses, we can estimate the parameter values of the

12
Cobb-Douglas function easily. According to the mathematical process from equations (14) to
equations (16), two allometric models can be integrated into a Cobb-Douglas model. The first step
is to calculate the allometric scaling exponents, and the second step, evaluate the parameters of the
general production function. For the global modeling (public transportation), the allometric
modelsare as below:
9972.0
13409.18ˆ xy , (25)
9604.0
28673.20ˆ xy . (26)
The values of the goodness of fit are R2=0.9498 and R
2=0.8042, respectively (Figure 2).
Multiplying equation (25) by equation (26)yields the global modelling result:
4802.0
2
4986.0
15633.19ˆ xxy . (27)
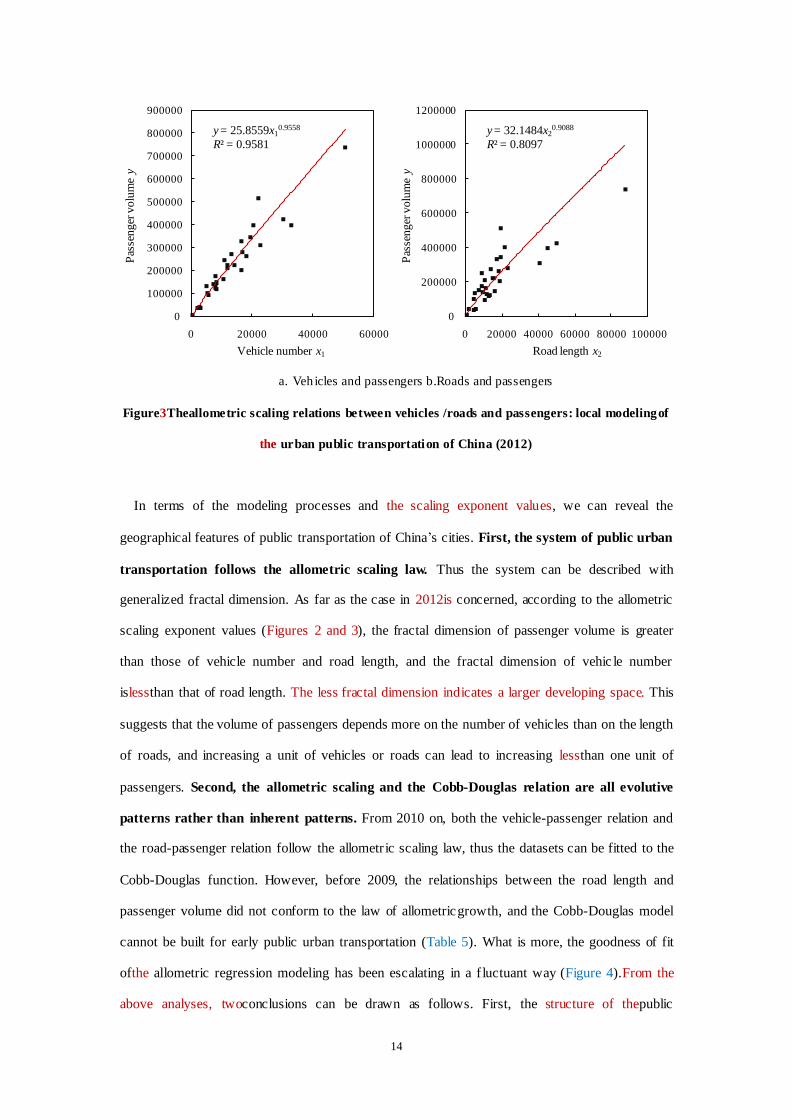
For thelocal modeling (bus and trolley bus), the allometric models are as follows
9558.0
18559.25ˆ xy . (28)
9088.0
21484.32ˆ xy . (29)
The determination coefficient values are R2=0.9581 and R
2=0.8097, respectively (Figure 3).
Multiplying equation (28) by equation (29)gives the local modelling result in the following form
4544.0
2
4779.0
18310.28ˆ xxy . (30)
So far, we have finished the process of mathematical modelling from theallometric scaling
relations to the Cobb-Douglas function. The two models, equations (27) and (30), are fair and
reasonable, and thus acceptable. Inthe models, a proportionality coefficient of the Cobb-Douglas
model is the geometrical average of allometric proportionality coefficients, and each cross elastic
coefficient is the corresponding allometric scaling exponent divided by the number of independent
variables (Table 4).
Before using the parameter values to explain the system of China’s public urban transportation,
we clarify the relationships between the parameters and the geographical system. Generally
speaking, it is measurement that makes a link between mathematical models and empirical
phenomena (Taylor, 1983). In theory, each system can be made a measurement, and thus we have
one or more measure values (e.g. length, area, size, density); each measure corresponds to a
dimension, and thus we have one or more dimension values (e.g. 1, 2, 3, 1.262, 1.585). If a system

13
has a characteristic scale, the dimension will be an integer (0, 1, 2, 3) and give no useful
information, and we can use the measure values to make an analysis; on the contrary, if a system
has no characteristic scale, the measure values will be uncertain, and we can use the dimension
values to make an analysis (Chen, 2008). In the latter case, the dimension will be a fractional
value instead of an integral number. In this case study, the spatial measures that we employ are
vehicle number, road length, and passenger volume, as indicated above. Because of human
geographical systems bear no characteristic scale, we had better utilize fractal dimens ions or
scaling exponents based on these measures to make analyses. The relationships between the
scaling exponents, elastic coefficient, and fractal dimension are shown by equations (13), (20),
(21), and (22), which have been explained above.The best approach to understanding the
mathematical models and parameters is the mathematical process. According to these equations,
we can understand the fractal parameters; and using these fractal parameters, especially the scaling
exponents, we can research into a geographical system.
a. Vehicles and passengers b.Roads and passengers
Figure2Theallometric scaling relations between vehicles /roads and passengers: global modeling
of the urban public trans portation of China (2012)
y = 18.3409x10.9972
R² = 0.9498
0
200000
400000
600000
800000
1000000
1200000
0 20000 40000 60000
Pas
senger
volu
me
y
Vehicle number x1
y = 20.8673x20.9604
R² = 0.8042
0
200000
400000
600000
800000
1000000
1200000
1400000
0 20000 40000 60000 80000 100000
Pas
seng
er v
olu
me
y
Road length x2
14
a. Vehicles and passengers b.Roads and passengers
Figure3Theallometric scaling relations between vehicles /roads and passengers: local modelingof
the urban public transportation of China (2012)
In terms of the modeling processes and the scaling exponent values, we can reveal the
geographical features of public transportation of China’s cities. First, the system of public urban
transportation follows the allometric scaling law. Thus the system can be described with
generalized fractal dimension. As far as the case in 2012is concerned, according to the allometric
scaling exponent values (Figures 2 and 3), the fractal dimension of passenger volume is greater
than those of vehicle number and road length, and the fractal dimension of vehic le number
islessthan that of road length. The less fractal dimension indicates a larger developing space. This
suggests that the volume of passengers depends more on the number of vehicles than on the length
of roads, and increasing a unit of vehicles or roads can lead to increasing lessthan one unit of
passengers. Second, the allometric scaling and the Cobb-Douglas relation are all evolutive
patterns rather than inherent patterns. From 2010 on, both the vehicle-passenger relation and
the road-passenger relation follow the allometric scaling law, thus the datasets can be fitted to the
Cobb-Douglas function. However, before 2009, the relationships between the road length and
passenger volume did not conform to the law of allometricgrowth, and the Cobb-Douglas model
cannot be built for early public urban transportation (Table 5). What is more, the goodness of fit
ofthe allometric regression modeling has been escalating in a f luctuant way (Figure 4).From the
above analyses, twoconclusions can be drawn as follows. First, the structure of thepublic
y = 25.8559x10.9558
R² = 0.9581
0
100000
200000
300000
400000
500000
600000
700000
800000
900000
0 20000 40000 60000
Pas
senger
volu
me
y
Vehicle number x1
y = 32.1484x20.9088
R² = 0.8097
0
200000
400000
600000
800000
1000000
1200000
0 20000 40000 60000 80000 100000
Pas
senger
volu
me
y
Road length x2

15
transportation of China’s cities has been improvedyear after year; second, it is more efficient
tooptimize vehicles than to increase loads of Chinese urban transportation.
Table 4Parameters and mainstatistics based on allometric scaling for two types of models
onpublictrans portation ofChina’s cities (2012)
Parameter and statistic Global modeling (public
transportation)
Local modeling (bus and
trolley bus)
x1v.s.y x2v.s.y x1v.s.y x2v.s.y
Proportionality coefficientc 18.3409 20.8673 25.8559 32.1484
Scaling exponentd 0.9972 0.9604 0.9558 0.9088
Determination coefficient R2 0.9498 0.8042 0.9581 0.8097
Cross elastic coefficientσ 0.4986 0.4802 0.4779 0.4544
Table 5Parameters and statistics of allometricmodels on public trans portation ofChina’s cities
(2006-2012)
Model parameter 2006 2007 2008 2009 2010 2011 2012
Vehicle
and
passenger
c 3.8349 11.3699 42.1560 12.1662 6.1807 20.6520 18.3409
d 1.1445 1.0344 0.9083 1.0393 1.1115 0.9841 0.9972
R2 0.8393 0.9137 0.7235 0.8471 0.9240 0.9524 0.9498
Road
and
passenger
c 1112.9227 4890.0248 7285.5613 3182.1909 13.5510 21.4487 20.8673
d 0.5763 0.4150 0.3908 0.4609 1.0025 0.9573 0.9604
R2 0.3358 0.3151 0.2682 0.2322 0.8084 0.8064 0.8042
Note: Before 2006, the datasets are not incomplete, that is, there is no observational data for the total length of
roads in operation.
Figure4A histogram of the goodness of fit for the allometric scaling relations between
vehicle/road and passenger (2006-2012)
0.0
0.2
0.4
0.6
0.8
1.0
1.2
2006 2007 2008 2009 2010 2011 2012
Goodnes
s of fi
t
Year
Vehicle/passenger Road/passenger

16
4Discussion and conclusions
The Cobb-Douglas production function comes from economical problems, but it can be applied
to many kinds of systems such as city systems and ecosystems (Chen, 2008; Chen, 2011; Chen
and Lin, 2009). In other words, the Cobb-Douglas function is a universal model, which can be
used to describe the input-output relations of natural and social systemsin various fields. In this
sense, the abovementioned results of derivation can be generalized to other fields, and the
precondition is that the systemswhich will be studied haveself-affine fractality. Compared with the
previous works (Chen and Lin, 2009), the novelty of this study is thata simple allometric
algorithm is advanced to estimate the parameters of the Cobb-Douglas models for geographical
analys is. The case of public transportation of cities shows the effect of this algorithm. The
limitation of this study lies ina lack of dynamical analysis based on time series despite the
estimated values of the allometric scaling exponent based on the temporal dimension.
From the theoretical derivation and empirical evidence, the main conclusions of this studycan
be reached as follows. First, the allometric scaling is associated with the Cobb-Douglas
function. The cross elastic coefficients of the generalized production function are correlated with
the allometric scaling exponents. The allometric analysis provides an efficient approach to
estimating the parameters of the Cobb-Douglas model. Second,bothfractal dimension and
scaling exponent are important indexes for the geographical analysis using the
Cobb-Douglas function. An allometric scaling exponent is a ratio of generalized fractal
parameters. If the fractal dimension cannot be directly evaluated for a geographical system, the
scaling exponents can be used as substitutes. Third, fractal geometry, allometric scaling, and
the production function can be integrated into a new framework . Based on this framework,
we can develop aneffective method for spatial analysis of geographical systems. It is hard to
explain every question in a few lines of words.Due to limited space, the related problems remain
to be solved in future studies.

17
Acknowledgment
*****************************************************************************
***************.
References
Barnsley MF (1988).Fractal Everywhere. San Diego, CA: Academic Press
Batty M (2005).Cities and Complexity: Understanding Cities with Cellular Automata, Agent -Based
Models, and Fractals. London, England: The MIT Press
Batty M (2008).The size, scale, and shape of cities.Science, 319: 769-771
Batty M(2013).The New Science of Cities. Cambridge,MA: MIT Press
Batty M, Carvalho R, Hudson-Smith A, Milton R, Smith D, Steadman P (2008).Scaling and allometry
in the building geometries of Greater London.The European Physical Journal B - Condensed
Matter and Complex Systems, 63(3): 303-314
Batty M, Longley PA (1985). The morphology of urban land use. Environment and Planning B:
Planning and Design, 15(4): 461-488
Batty M, Longley PA (1994). Fractal Cities: A Geometry o f Form and Function . London: Academic
Press
Benguigui L, Czamanski D, Marinov M, PortugaliJ (2000). When and where is a city fractal?
Environment and Planning B: Planning and Design, 27(4): 507–519
Bertalanffy L von (1968).General System Theory: Foundations, Development, and Applications . New
York: George Braziller
Bettencourt LMA (2013). The origins of scaling in cit ies.Science, 340: 1438-1441
Bettencourt LMA, Lobo J, Helbing D, Kühnert C, West GB (2007). Growth, innovation, scaling, and
the pace of life in cities.Proceeding of the National Academy of Sciences of the United States of
America, 104(17): 7301-7306
Chen YG (2008). Fractal Urban System: Scaling, Symmetry, and Spatial Complexity . Beijing:
Scientific Press [In Chinese]
Chen YG (2010). Characterizing growth and form of fractal cities with allometric scaling

18
exponents.Discrete Dynamics in Nature and Society, Volume 2010, Article ID 194715, 22 pages
Chen YG (2011). Mathematical Methods for Geography. Beijing: Scientific Press[In Chinese]
Chen YG (2012). Fractal d imension evolution and spatial replacement dynamics of urban growth.
Chaos, Solitons& Fractals, 45 (2): 115–124
Chen YG, Lin JY (2009). Modeling the self-affine structure and optimizat ion conditions of city systems
using the idea from fractals. Chaos, Solitons& Fractals, 41(2): 615-629
Chen YG, Wang JJ (2013). Mult ifractalcharacterization of urban form and growth: the case of Beijing.
Environment and Planning B: Planning and Design, 40(5):884-904
Chen YG, Zhou YX (2003). A study of fractional dimension on the relat ionship between population
sizes and economic outputs of cities.Economic Geography, 23(4): 476-481 [In Chinese]
Cobb CW, Douglas PH (1928). A theory of production. American Economic Review, 18(1): 139–165
Feng J, Chen YG (2010). Spatiotemporal evolution of urban form and land use structure in Hangzhou,
China: evidence from fractals. Environment and Planning B: Planning and Design , 37(5):
838-856
Frankhauser P (1990). Aspects fractals des structures urbaines. L’EspaceGéographique, 19(1): 45-69
Frankhauser P (1994). La Fractalité des Structures Urbaines (The Fractal Aspects of Urban Structures) .
Paris: Economica
Frankhauser P (1998). The fractal approach: A new tool for the spatial Analysis of urban
agglomerat ions.Population: An English Selection , 10(1): 205-240 [New Methodological
Approaches inthe Social Sciences]
Lee Y (1989). An allmetric analysis of the US urban system:1960–80. Environment and Planning A,
21(4): 463–476
Liu JS, Chen YG (1995). A fractal studyon the spatial structureof systems of towns in Northeast
China.ScientiaGeographicaSinica, 15(2): 136-143[In Chinese]
Liu JS, Chen YG (2000). Researches on the fractional dimensions of the spatial structure of the urban
system as fractals in Northeast China.Human Geography, 15(6): 9-16[In Chinese]
Liu JS,Chen YG (2003).Mult ifractal measures based on man-land relationships of the spatial structure
of the urban system in Henan.ScientiaGeographicaSinica,23(6):713-720[In Chinese]
Liu JS, Chen YG (2004). The spatial complexity of the law of allometric growthand urban population
density.Journal of Northeast Normal University, 36(4): 139-148[In Chinese]

19
Liu JS, Chen YG (2005). An allometric analysis of the Shandong urban system using ideas from
fractals.ScientiaGeographicaSinica, 25(2): 135-141[In Chinese]
Lo CP, Welch R (1977). Chinese urban population estimates. Annals of the Association of American
Geographers, 67(2): 246-253
Longley PA, Batty M, Shepherd J(1991). The size, shape and dimension of urban settlements.
Transactions of the Institute of British Geographers (New Series),16(1): 75-94
Luo HY, Chen YG (2002). On the methods of characterizing urban land -use form using fractal
dimension. Journal of Northeast Normal University (Natural Science Edition) , 34(4): 107-113 [In
Chinese]
Mandelbrot BB (1983). The Fractal Geometry of Nature. New York: W. H. Freeman and Company
Naroll RS, Bertalanffy L von (1956). The principle of allometry in bio logy and social sciences.General
Systems Yearbook , 1(part II): 76-89
Nordbeck S (1971). Urban allometric growth.GeografiskaAnnalerB, 53(1): 54-67
RyabkoBYa (1986). Noise-free coding of combinatorial sources, Hausdorff dimension and Kolmogorov
complexity. ProblemyPeredachiInformatsii, 22(3), 16-26
Takayasu H (1990) .Fractals in the Physical Sciences. Manchester: Manchester University Press
Taylor PJ (1983). Quantitative Methods in Geography. Prospect Heights, Illinois: Waveland Press
Thomas I, Frankhauser P, Biernacki C (2008). The morphology of built -up landscapes in Wallonia
(Belgium): A classification using fractal indices. Landscape and Urban Planning , 84(2): 99-115
Thomas I, Frankhauser P, De Keersmaecker M -L (2007). Fractal dimension versus density of built-up
surfaces in the periphery of Brussels. Papers in Regional Science, 86(2): 287-308
ToblerWR (1969). Satelliteconfirmationof settlementsizecoefficients.Area, 1(3):30-34
White R, Engelen G (1994). Cellu lar automata and fractal urban form: a cellular modeling approach to
the evolution of urban land-use patterns. Environment and Planning A, 25(8): 1175-1199
White R, Engelen G (1994). Urban systems dynamics and cellular automata: fractal structures between
order and chaos. Chaos, Solitons& Fractals, 4(4): 563-583