an analysis of capital expenses and performance trade-offs among ims cscf deployment options
TRANSCRIPT

� An Analysis of Capital Expenses andPerformance Trade-Offs Among IMS CSCF Deployment OptionsAnne Lee and Carlos Urrutia-Valdés
Service providers around the world are deploying or planning to deploy the IP Multimedia Subsystem (IMS) in their core networks. IMS allows thedelivery of new multimedia applications that can enhance the user’sexperience and bring in new revenue for the operators. These operators arenow faced with deciding how to best deploy the various IMS functionalelements in their networks. In this paper, the authors provide a survey ofthe various options available to the operators and present an analysis of some of those deployment options. In particular, the paper addressesquestions around the advantages and disadvantages of centralizing ordistributing control functions such as the call session control function (CSCF)in terms of capital expenditure (CAPEX) costs and latency trade-offs.Without the proper deployment strategy, there can be major differences inthe overall cost of the network and therefore it is important to performsuch an analysis. Initial recommendations and general observations aregiven that can assist network planners and operators to more efficientlydevelop an IMS deployment strategy. Further analysis and study thatincludes operational expenditure (OPEX) costs should also be factored intothe final decision. © 2008 Alcatel-Lucent.
parameters—namely, capital expenditure (CAPEX)
costs and latency with respect to the call session con-
trol functions (CSCFs).
Other factors must also be considered in making
final decisions including operational expenditure
(OPEX) costs, security, impacts of decisions on regula-
tory features, local services, and other parameters. For
an overall network solution, analysis is needed as well
on all IMS functional entities in addition to the CSCFs.
These other factors are not included as a part of this
paper’s investigation. They are left for future study.
IntroductionCommercial launch of IP Multimedia Systems
(IMS) commenced in 2007 for both wireless and wire-
line networks. As operators plan their IMS networks,
they must decide how many sites will be required for
initial deployment as well as projected needs as the
network evolves and matures. They must also decide
how the functional elements of the IMS will be dis-
tributed among these sites.
Many factors must be considered from both tech-
nical and business perspectives. The purpose of this
paper is to provide analysis for a subset of these
Bell Labs Technical Journal 12(4), 21–32 (2008) © 2008 Alcatel-Lucent. Published by Wiley Periodicals, Inc. Publishedonline in Wiley InterScience (www.interscience.wiley.com) • DOI: 10.1002/bltj.20264
22 Bell Labs Technical Journal DOI: 10.1002/bltj
Deployment OptionsIMS consists of a number of functional entities,
and how they are packaged from a product offering
perspective is up to the vendors and their customers.
Where these functional entities should sit in a net-
work with respect to each other and with respect to
the elements of the packet core, e.g., serving GPRS
support node (SGSN), gateway GPRS support node
(GGSN), home agent (HA), foreign agent (FA), packet
data serving node (PDSN), and bearer manager (BM),
requires both technical and business evaluation.
Incumbent operators currently have sites deplo-
yed for their legacy telecommunications equipment,
i.e., switches, digital subscriber line access multiplex-
ers (DSLAMs), mobile switching centers (MSCs),
home location registers (HLRs), xGPRS supporting
nodes (xGSNs), and base stations. From a business
perspective, operators will need to decide whether to
re-use these sites, re-use information technology (IT)
sites, or build new sites for the IMS elements. There
may be company organizational structure implica-
tions associated with some sites. There may be busi-
ness requirements to co-locate IMS elements and
legacy equipment, e.g., the HLR and home subscriber
server (HSS). These and all other factors must be
taken into consideration to plan the organization of
the IMS network.
Thus far, experience has shown that operators are
currently following a two-tier or three-tier approach
to organizing their end-to-end system elements. There
is no single perfect solution. Even with current legacy
equipment, operators use differing network deploy-
ment architectures.
There are a number of dimensions to an n-tier
deployment model. Each tier or grouping of elements
represents a set of boxes that would be deployed together
in the same physical geographical office. Generally, the
higher level tiers (e.g., tier 1) consist of the elements to
be centralized geographically. There would be a rela-
tively smaller number of physical locations for this tier,
while the lower-level tiers (e.g., tier 3) would be dis-
tributed to a larger number of physical locations.
From a control function perspective, the higher
tiers contain control elements that have end-to-end
and overall control responsibilities while the lower
tiers contain control elements that support localized
as well as bearer-related intelligence. There can be
exceptions to this rule.
The following two subsections describe a hypo-
thetical two-tier model and a hypothetical three-tier
Panel 1. Abbreviations, Acronyms, and Terms
3G—Third generation3GPP—3rd Generation Partnership ProjectAS—Application serverBHS—Busy hour sessionBM—Bearer managerCAPEX—Capital expenditureCSCF—Call session control functionDSLAM—Digital subscriber line access
multiplexerFA—Foreign agentGGSN—Gateway GPRS supporting nodeGPRS—General packet radio serviceHA—Home agentHLR—Home location registerHSS—Home subscriber serverI-CSCF—Interrogating CSCFIM—Instant messagingIMS—IP Multimedia SubsystemIP—Internet Protocol
IPsec—IP securityIT—Information technologyITU—International Telecommunication UnionMSC—Mobile switching centerOPEX—Operational expenditurePDSN—Packet data serving nodePoC—Push-to-talk over cellularP-CSCF—Proxy CSCFQoS—Quality of serviceRAB—Radio access bearerS-CSCF—Serving CSCFSDO—Standards development organizationSGSN—Serving GPRS support nodeSIP—Session Initiation ProtocolUE—User equipmentVLAN—Virtual local area networkVoIP—Voice over IPxGSN—xGPRS supporting nodes
DOI: 10.1002/bltj Bell Labs Technical Journal 23
model including both IMS elements and legacy system
elements.
For the study discussed in the rest of this paper, a
three-tier model is used. A three-tier model was chosen
for the study as it was more complex than the two-tier
model. Analysis methods with this model could then
more easily be retrofitted for the two-tier model.
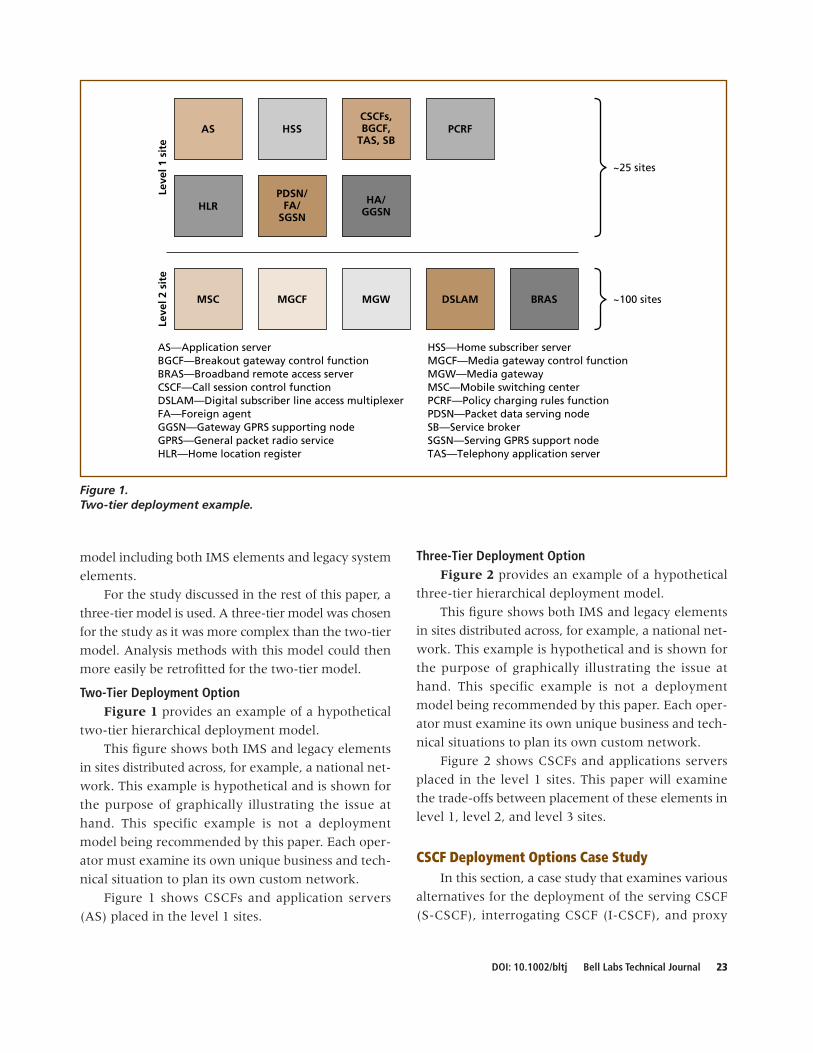
Two-Tier Deployment OptionFigure 1 provides an example of a hypothetical
two-tier hierarchical deployment model.
This figure shows both IMS and legacy elements
in sites distributed across, for example, a national net-
work. This example is hypothetical and is shown for
the purpose of graphically illustrating the issue at
hand. This specific example is not a deployment
model being recommended by this paper. Each oper-
ator must examine its own unique business and tech-
nical situation to plan its own custom network.
Figure 1 shows CSCFs and application servers
(AS) placed in the level 1 sites.
Three-Tier Deployment OptionFigure 2 provides an example of a hypothetical
three-tier hierarchical deployment model.
This figure shows both IMS and legacy elements
in sites distributed across, for example, a national net-
work. This example is hypothetical and is shown for
the purpose of graphically illustrating the issue at
hand. This specific example is not a deployment
model being recommended by this paper. Each oper-
ator must examine its own unique business and tech-
nical situations to plan its own custom network.
Figure 2 shows CSCFs and applications servers
placed in the level 1 sites. This paper will examine
the trade-offs between placement of these elements in
level 1, level 2, and level 3 sites.
CSCF Deployment Options Case StudyIn this section, a case study that examines various
alternatives for the deployment of the serving CSCF
(S-CSCF), interrogating CSCF (I-CSCF), and proxy
CSCFs,BGCF,
TAS, SBHSSAS PCRF
HA/GGSN
PDSN/FA/
SGSN
Leve
l 1 s
ite
Leve
l 2 s
ite
HLR
MSC MGCF MGW
~25 sites
~100 sitesBRASDSLAM
AS—Application serverBGCF—Breakout gateway control functionBRAS—Broadband remote access serverCSCF—Call session control functionDSLAM—Digital subscriber line access multiplexerFA—Foreign agentGGSN—Gateway GPRS supporting nodeGPRS—General packet radio serviceHLR—Home location register
HSS—Home subscriber serverMGCF—Media gateway control functionMGW—Media gatewayMSC—Mobile switching centerPCRF—Policy charging rules functionPDSN—Packet data serving nodeSB—Service brokerSGSN—Serving GPRS support nodeTAS—Telephony application server
Figure 1.Two-tier deployment example.

24 Bell Labs Technical Journal DOI: 10.1002/bltj
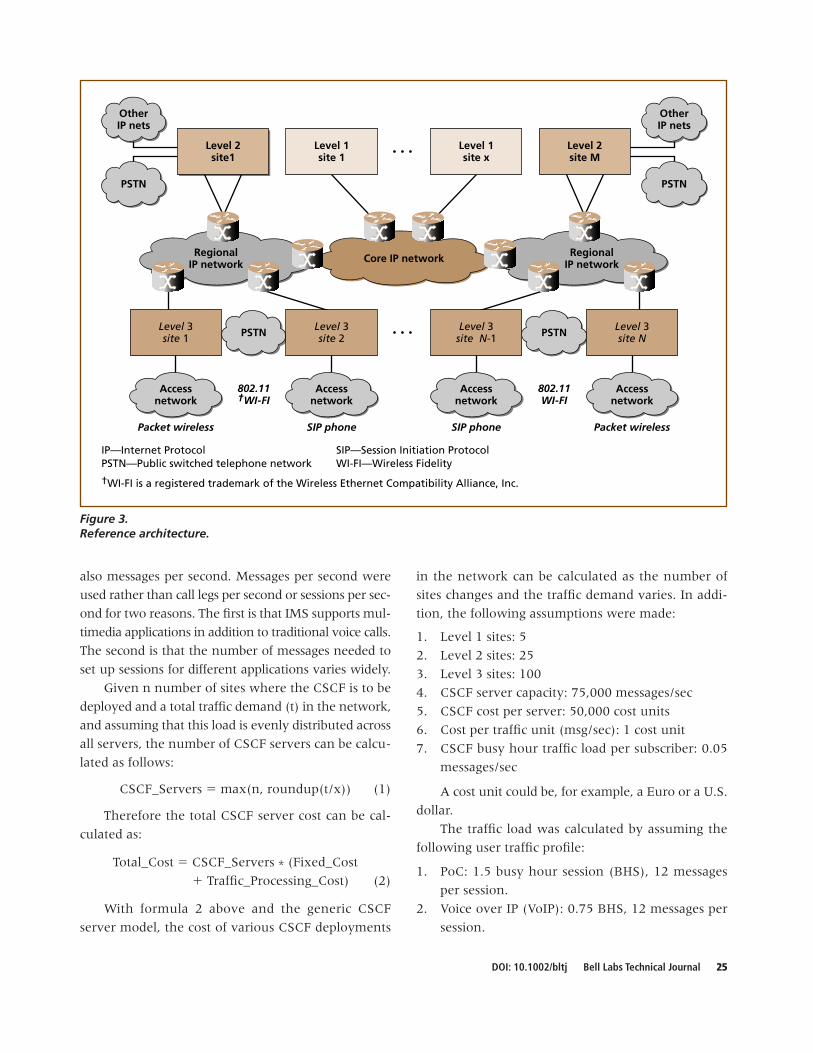
CSCF (P-CSCF) as defined by [2, 3] is presented.
Figure 3 shows the reference architecture for the case
study.
The architecture refers to a generic hierarchical
network consisting in this case of three levels. There
can be multiple level 1 sites (1 to x), multiple level 2
sites (1 to M), and multiple level 3 sites (1 to N). In
this particular architecture, how should the operator
deploy the S-CSCF, I-CSCF and P-CSCF? Should these
functions be deployed in the level 1, level 2, or the
level 3 sites? Given that the answer depends on many
factors including cost, performance, operations, and
regulatory issues, this paper focuses on the two major
aspects that can be more readily quantified: cost and
performance. In subsequent sections, each of these
aspects is considered.
Cost AnalysisIn order to analyze the cost implications of
deploying the S-CSCF, I-CSCF, and P-CSCF at the var-
ious sites, a generic cost model was created for a CSCF
server assuming for simplicity’s sake that all three
types of CSCF were deployed in the same server. The
generic CSCF server cost model is as follows:
CSCF server cost model:
Fixed_Cost � Traffic_Processing_Cost
Where Traffic_Processing_Cost �
Traffic_Units_ Processed *
Cost_Per_Traffic_Unit
CSCF server capacity: x messages/sec
Since the CSCF server capacity is in messages per
second, the traffic unit employed for the cost analysis is
CSCFs,BGCF,
TAS, SBHSSAS PCRF
PDGLe
vel 1
sit
eLe
vel 3
sit
eLe
vel 2
sit
eHA/
GGSN
MSC HLR
PDSN/FA/
SGSNMGCF MGW
~5 sites
~100 sites
~25 sites
AS—Application serverBGCF—Breakout gateway control functionCSCF—Call session control functionFA—Foreign agentGGSN—Gateway GPRS supporting nodeGPRS—General packet radio serviceHA—Home agentHLR—Home location registerHSS—Home subscriber server
MGCF—Media gateway control functionMGW—Media gatewayMSC—Mobile switching centerPCRF—Policy charging rules functionPDG—Packet data gatewayPDSN—Packet data serving nodeSB—Service brokerSGSN—Serving GPRS support nodeTAS—Telephony application server
Figure 2.Three-tier deployment example.
DOI: 10.1002/bltj Bell Labs Technical Journal 25
also messages per second. Messages per second were
used rather than call legs per second or sessions per sec-
ond for two reasons. The first is that IMS supports mul-
timedia applications in addition to traditional voice calls.
The second is that the number of messages needed to
set up sessions for different applications varies widely.
Given n number of sites where the CSCF is to be
deployed and a total traffic demand (t) in the network,
and assuming that this load is evenly distributed across
all servers, the number of CSCF servers can be calcu-
lated as follows:
CSCF_Servers � max(n, roundup(t/x)) (1)
Therefore the total CSCF server cost can be cal-
culated as:
Total_Cost � CSCF_Servers * (Fixed_Cost
� Traffic_Processing_Cost) (2)
With formula 2 above and the generic CSCF
server model, the cost of various CSCF deployments
in the network can be calculated as the number of
sites changes and the traffic demand varies. In addi-
tion, the following assumptions were made:
1. Level 1 sites: 5
2. Level 2 sites: 25
3. Level 3 sites: 100
4. CSCF server capacity: 75,000 messages/sec
5. CSCF cost per server: 50,000 cost units
6. Cost per traffic unit (msg/sec): 1 cost unit
7. CSCF busy hour traffic load per subscriber: 0.05
messages/sec
A cost unit could be, for example, a Euro or a U.S.
dollar.
The traffic load was calculated by assuming the
following user traffic profile:
1. PoC: 1.5 busy hour session (BHS), 12 messages
per session.
2. Voice over IP (VoIP): 0.75 BHS, 12 messages per
session.
Packet wireless
Core IP network
802.11WI-FI
802.11†WI-FI
Packet wirelessSIP phone SIP phone
Level 1site 1
Level 1site x
IP—Internet ProtocolPSTN—Public switched telephone network
SIP—Session Initiation ProtocolWI-FI—Wireless Fidelity
†WI-FI is a registered trademark of the Wireless Ethernet Compatibility Alliance, Inc.
PSTN PSTN
OtherIP nets
PSTN
Level 2site M
OtherIP nets
PSTN
Level 3site 1
Level 3site N
Accessnetwork
Accessnetwork
Accessnetwork
Accessnetwork
RegionalIP network
RegionalIP network
Level 2site1
Level 3site 2
Level 3site N-1
Figure 3.Reference architecture.

26 Bell Labs Technical Journal DOI: 10.1002/bltj
3. Instant messaging (IM): 6 IMs per BH, 2 messages
per IM.
4. Presence status changes: 2 per BH, 2 messages per
status change.
5. Re-registration refreshes: 2 per hour, 2 messages
per refresh.
The above traffic profile yields a total of 41.25
messages per hour per subscriber. Note that to calcu-
late the load on the CSCF, messages are counted in
both directions (receive and transmit) so when the
user sends a message it is counted on the receiving
side of the P-CSCF and then on the transmitting side;
the same occurs in the S-CSCF. Therefore one mes-
sage from the user equipment (UE) in our study gen-
erates four in the CSCF (the P-CSCF and S-CSCF are
assumed to be in the same server). The total number
of messages in the CSCF is then 165 messages per
subscriber during busy hour or approximately 0.05
messages per second. For a more detailed example of
how to calculate the message load on the CSCF, the
reader is referred to [6].
These are representative costs and traffic
demands and are presented here as examples only.
With these assumptions, a sensitivity analysis using
16 cases was performed by varying the number of
sites on which the CSCF servers were deployed from
a completely centralized architecture (CSCF servers
deployed in one level 1 site) to a completely distrib-
uted architecture (CSCF servers at every level 3 site)
and by varying the number of subscribers (and thus
the traffic demand) from 500 thousand to 10 million
(assuming they are evenly distributed across all
servers.) The CSCF deployment cases are shown in
Table I.
Using formulas 1 and 2, and the cost and traffic
assumptions already shown, the cost of each of the
16 cases was computed and the results normalized
over the cost of deploying the CSCF servers at one
site. These results are shown in Figure 4.
Figure 4 shows that for a network consisting of
500K subscribers (a relatively small network deploy-
ment), the cost of deploying the CSCF servers at
100 sites (all level 3 sites) is 67 times higher than the
cost of deploying the CSCF servers at one single site
(a centralized deployment.) However, as the sub-
scriber count grows (increasing the total traffic
demand) the cost differentials decrease so that for a
network deployment of 10M subscribers, the cost of
deploying CSCF servers at 100 sites has been reduced
to just 6 times the cost of deploying them at one sin-
gle site. To understand why this is so, the number of
servers deployed for each of the cases (shown in
Table II) is examined.
For 500,000 subscribers, only one CSCF server is
required, so by forcing the deployment to cover 100
sites, the network is over-provisioned, the CAPEX is
much higher, and each server is destined to be under-
utilized. As demand increases, the minimum number
Subscribers
Sites 500 thousand 2 million 5 million 10 million
1 Case 1 Case 5 Case 9 Case 13
5 Case 2 Case 6 Case 10 Case 14
25 Case 3 Case 7 Case 11 Case 15
100 Case 4 Case 8 Case 12 Case 16
CSCF—Call session control function
Table I. CSCF deployment cases for cost sensitivity analysis.
Subscribers 1 site 5 sites 25 sites 100 sites
500,000 1 5 25 100
2,000,000 4 5 25 100
5,000,000 4 5 25 100
10,000,000 7 7 25 100
Table II. Total CSCF servers deployed in the network.
CSCF—Call session control function

DOI: 10.1002/bltj Bell Labs Technical Journal 27
of required servers increases, thus causing the differ-
ences in CAPEX to decrease.
The effect that server capacity would have on the
overall cost was also examined. For this, we chose to
model cases 4 and 8 from Table I. These cases were
chosen because they represent the largest cost differ-
entials. For these two cases, the CSCF server capacity
was varied from 75,000 msgs/sec (original assump-
tion) to 10,000 msgs/sec, and again the relative cost of
deploying the CSCF servers at 100 sites to the cost
of deploying it at one single site was calculated. The
results are shown in Figure 5.
The results show that the cost differential decreases
as the server capacity decreases. This is because now
at each site a smaller server is deployed, which is a more
efficient use of resources when the traffic demands at
each site are smaller (i.e., the network is not over-
provisioned, as is in the case of deploying 100 CSCF
servers with 75,000 msgs/sec capacity.)
Summary of cost analysis. It can be concluded from
this analysis that in general for a small network
deployment, it is more cost efficient to centralize
resources. These resources (i.e., CSCF servers) can
then be distributed as demand grows. However, if the
resources being deployed are extremely modular, an
operator could still deploy them in a more distributed
fashion and then grow each server at each site as
demand grows.
Performance AnalysisIn this section, the performance implications of
deploying the CSCF at the various sites are examined.
Once again for simplicity’s sake, all three types of
CSCF were assumed to be contained within the same
server. The performance of a system can be measured
in different ways (e.g., jitter, transmission delay, pro-
cessing delay).
For this case study, only the transmission delay
(i.e., latency) of the signaling messages as they travel
back and forth from the user equipment to the CSCF
and to the application server involved in the session
was considered. Other delays, such as queueing and
processing delays, should not vary due to location of
the servers. Our assumption is that even if servers
were more centralized than distributed, the same
number of servers would be used and hence queue
sizes and processing impacts should be the same in
either scenario.
CSCF—Call session control function
67
26
12
6
0
10
20
30
40
50
60
70
80
0 20 40 60 80 100 120
Number of sites
Tota
l CSC
F co
st n
orm
aliz
ed o
ver
1 si
te 2M Subs500K Subs
5M Subs10M Subs
Figure 4.Results of cost analysis.

28 Bell Labs Technical Journal DOI: 10.1002/bltj
Because different applications have different
latency requirements, one with very stringent latency
requirements was chosen. This application is push-
to-talk over cellular (PoC), which requires a short call
set-up latency as perceived by the user [1, 4].
In order to analyze the effect of the CSCF place-
ment on the overall PoC set-up latency, the following
assumptions were made with regard to the transmis-
sion delays in the IP network of the reference archi-
tecture shown in Figure 3.
RegionalIP network
RegionalsiteSwitch site Data center
Accessnetwork
CoreIP network
Air IF RAN
100 msec 35 msec 10 msec 20 msec
IF—InterfaceIP—Internet ProtocolRAN—Radio access network
Figure 6.Possible transmission latencies per network type.
CSCF—Call session control function
Relative cost - 100 sites
18
67
29
67
9
17
5
26
0
20
40
60
80
5,000 10,000 25,000 75,000
CSCF server capacity (msgs/sec)
Co
st u
nit
s
500K Subs
2M Subs
Figure 5.Relative cost as a function of server capacity.

DOI: 10.1002/bltj Bell Labs Technical Journal 29
The assumed transmission latencies are shown
in Figure 6. However, for specific operators these
numbers can vary depending on the structure of their
transport networks and therefore are presented here
by way of example only.
It is also necessary to have an understanding of
the signaling flow required for the set-up of a PoC
session. We focus in particular on the portion of the
session set-up from the moment the user presses
the PoC button on the handset (or the moment the
user uses any other means to signal the user equip-
ment that he or she wants to initiate a session) to the
moment the handset (UE) plays a “chirp” indicating to
the user that he or she can start talking. That portion
of the signaling flow using the Session Initiation
Protocol (SIP) [5] as described in [1] is shown
in Figure 7 for the case where both users are served
by the same PoC AS. It is also assumed that the CSCF
does not cache the filter criteria during the registration
process, to show the impact of not doing so in the
overall latency.
“Talk burst confirm delay” is defined as the time
required for the signaling messages to flow back and
forth in the network from the moment the PoC but-
ton is pushed to the playing of the chirp by the UE.
Please note that this time does not include the
latency introduced at each IMS function (e.g., CSCF,
HSS, AS) due to the processing or queuing of the
message since this time is not dependent upon
the placement of such functions in the network. In
other words, the processing time and queuing time
of a message at the CSCF are the same irrespective of
whether the CSCF is placed at a level 1, level 2, or
level 3 site.
Based on the signaling flow shown, the “talk burst
confirm delay” can be calculated by using formula 3:
(UE_CSCF, 2*CSCF_HSS, 2*CSCF _AS,max(AS_UE, UE_CSCF)) (3)
Where:
UE_CSCF: One-way transmission latency between
UE and CSCF
a
Media
PoC ASUE-1 UE-2 CSCF HSS
INVITE
100 Trying
INVITE
200 OK
200 OK
ACKTalk burstconfirmsent
Assume UE2 hasautomatic answeroption and POC AScan buffer themedia.
Request filtercriteria
PoC AS buffers mediaand waits forconfirmation from UE2before sending packets.
User pushes PoCbutton to establishsession.
UE plays chirp afterreceiving both 200 OKand talk burst confirm.
AS—Application serverCSCF—Call session control functionHSS—Home subscriber server
PoC—Push-to-talk over cellularUE—User equipment
Figure 7.PoC session initiation signaling flow example.

30 Bell Labs Technical Journal DOI: 10.1002/bltj
CSCF_HSS: One-way transmission latency between
CSCF and HSS
CSCF_AS: One-way transmission latency between
CSCF and AS
AS_UE: One-way transmission latency between
AS and UE
Assuming that the HSS and the PoC AS are always
located at the level 1 site and using the transmission
latencies shown in Figure 6, the various transmis-
sion latencies required by formula 3 can be derived.
These transmission latencies will vary depending
upon the location in which the CSCF is deployed. The
results are shown in Table III.The talk burst confirm latency can then be
calculated for the three different scenarios under
consideration—a CSCF at a level 1 site, a CSCF at a
level 2 site, or a CSCF at a level 3 site. The results are
shown in Table IV.
Summary of latency analysis. The results show that
as the CSCF is placed farther away from the level 1
site, the talk burst confirm latency increases. This is
due to the fact that there is a lot of signaling required
among the CSCF, the HSS, and the PoC AS, so the
farther away these functions are from each other
the longer the signaling messages need to travel.
Open Mobile Alliance PoC requirements [4] state
that the talk burst confirm (also called the “right to
speak” indication) delay should typically be less than
2 seconds. 3rd Generation Partnership Project (3GPP)
PoC standards [1] estimate that setting up the signal-
ing connection and establishing the radio access
bearer (RAB) require in the best case scenario 1500
milleseconds. Therefore, the transmission delay due to
placing the CSCF at the level 3 site would leave only
16 percent of the remaining delay budget for the pro-
cessing and queueing delays at each IMS node. Hence
it is advantageous, from the latency perspective only, to
place the CSCF servers closer to the HSS and PoC AS.
Also note that as the CSCF or other control func-
tions are moved away from the level 1 site, firewalling
and extending virtual local area network (VLANs) or
Internet Protocol security (IPsec) tunnels among the
different sites may be necessary.
ConclusionMany factors must be taken into consideration in
IMS network planning. There is “no one size fits all”
for network operators. IMS CSCFs can be placed in
level 1 sites, level 2 sites, or level 3 sites. If a distrib-
uted architecture is the decided goal for the long term,
then placing CSCFs in the level 2 or level 3 sites to
begin with may be the right choice. This must be bal-
anced with the choice of site placement for the appli-
cation servers with delay-sensitive features.
As our case study has shown, for small network
deployments, locating the CSCF in a small number of
sites is the most cost-effective option from a CAPEX
perspective. As the network grows, the cost differen-
tial among different deployment options is markedly
reduced. For this reason, in general, it is recom-
mended that during the initial deployment of IMS
networks, the CSCF be deployed in the minimum
number of sites required and as the network grows,
this function may be distributed in more sites. Over
time and as the network grows, the CAPEX cost dif-
ferences are not going to be significant.
It is also noted that co-locating control functions
(e.g., CSCF, HSS) would minimize signaling delays.
This may be important for delay-sensitive applica-
Level 1 Level 2 Level 3 site site site
Talk burst confirm 330 390 420latency (msec)
Table IV. Talk-burst confirm transmission latencies.
One-way CSCF placementlatencies (msec) Level 1 site Level 2 site Level 3 site
UE_CSCF 165 145 135
CSCF_HSS 0 20 30
CSCF_AS 0 20 30
AS_UE 165 165 165
Table III. One-way transmission latencies as a functionof the placement of the CSCF.
AS—Application serverCSCF—Call session control functionHSS—Home subscriber serverUE—User equipment
DOI: 10.1002/bltj Bell Labs Technical Journal 31
tions. However, to properly arrive at an “optimum”
deployment strategy, other considerations, such as
OPEX costs and operational and regulatory issues, also
need to be taken into account. Because service
providers operate their networks very differently, and
because regulatory issues differ greatly from region
to region, it is difficult to generalize and quantify rec-
ommendations in those areas. The authors hope to
continue their research in these areas to build up the
existing body of knowledge in IMS networks and con-
tinue helping service operators determine the most
“optimal” IMS deployment strategy for their individ-
ual situations.
AcknowledgmentsThe authors would like to thank Bell Labs col-
league John Zhao for providing insights into issues
related to the IP network during this study.
References[1] 3rd Generation Partnership Project, “3GPP
Enablers for Open Mobile Alliance (OMA) Push-to-Talk over Cellular (PoC) Services, Stage 2(Release 6),” 3GPP TS 23.979, v6.2.0, June 2005,�http://www.3gpp.org/ftp/Specs/html-info/23979.htm�.
[2] 3rd Generation Partnership Project, “NetworkArchitecture (Release 7),” 3GPP TS 23.002,v7.1.0, Mar. 2006, �http://www.3gpp.org/ftp/Specs/html-info/23002.htm�.
[3] 3rd Generation Partnership Project, “IPMultimedia (IM) Session Handling, IM CallModel, Stage 2 (Release 7),” 3GPP TS 23.218,v.7.1.0, Mar. 2006, �http://www.3gpp.org/ftp/Specs/html-info/23218.htm�.
[4] Open Mobile Alliance, “Push to Talk overCellular Requirements,”Approved Version 1.0, OMA-RD-PoC-V1_0-20060609-A, June 9, 2006.�http://www.openmobilealliance.org�.
[5] J. Rosenberg, H. Schulzrinne, G. Camarillo, A Johnston, J. Peterson, R. Sparks, M. Handley,and E. Schooler, “SIP: Session InitiationProtocol,” IETF RFC 3261, June 2002, �http://www.apps.ietf.org/rfc/rfc3261.txt�.
[6] C. Urrutia-Valdès, A. Mukhopadhyay, and M. El-Sayed, “Presence and Availability WithIMS: Applications Architecture, Traffic Analysis,
and Capacity Impacts,” Bell Labs Tech. J., 10:4(2006), 101–107.
(Manuscript approved September 2007)
ANNE LEE is a distinguished member of technical staffand a Bell Labs Fellow at Alcatel-Lucent inNaperville, Illinois. She has led a team ofsystems engineers in defining requirementsand working with standards developmentorganizations (SDOs) for a multi-access
IMS system since 1999, recently transitioning to a newly formed Global Competency Center. She alsopreviously formed and led a cross-functional team indeveloping IMS/SIP applications and quality of service(QoS) demos and trials. She has been granted patentsand has published papers related to IMS. Ms. Lee holdsa B.S. in electrical engineering and an M.S. in computerscience from the Illinois Institute of Technology inChicago.
CARLOS URRUTIA-VALDÉS is a member of technicalstaff in the Network Modeling Departmentat Bell Labs in Murray Hill, New Jersey. Hiscurrent work focuses on the modeling andanalysis of multimedia applications, wirelesstechnologies, and IMS networks. He has
published several papers on third generation (3G)networks and IMS. He has patents pending in the areasof wireless backhaul optimization and next-generationapplications. His current research interests are in theareas of application and traffic modeling and the end-to-end design of wireless and wireline networks.Mr. Urrutia-Valdés holds a B.S. degree in electricalengineering from Florida International University inMiami, and an M.S. degree in computer engineeringfrom the University of Southern California in LosAngeles. �