an analysis of college tuition rates - biuyahavi1/projects/sg2011t3_rep.pdfan analysis of college...
TRANSCRIPT
Explaining the High Cost of Higher Education: An Analysis of College Tuition Rates
Adriana Avakian, Jun Kim, Kate Reilly, Martin Reilly, Chris Tsonis
10/11/2011

1
Executive Summary Introduction College tuition payments are one of the largest purchases an individual can make during their lifetime, second only to purchasing a house. As tuition payments steadily rise, prospective students want to ensure that their investment in their education is a good value. The purpose of this model is to characterize factors that explain a university’s tuition in relation to the tuition of the University of Maryland. This insight would allow students of the University of Maryland to assess the value of their education as well as understand which factors contribute to difference in tuition prices. The data was obtained from: http://mathforum.org/workshops/sum96/data.collections/datalibrary/data.set6.html, a Drexel University site last updated in August of 2008. The total sample size is 1302 schools and there are 22 variables included. Project Goal To explain why college and university tuition rates vary greatly by answering the following question: What are the key characteristics of a school that lead to a higher tuition rate? Finally, we seek to determine whether the University of Maryland offers a high value for the price of tuition. Analysis Results Considering all of the available variables, percentage of faculty with PhD's, whether a university is public or private, graduation rate, and student to faculty ratio had the most significant impact on tuition rates. We also found that SAT scores do have a slight effect on tuition rates. Specifically, high graduation rates, low student to faculty ratio, private universities, high percentage of professors with PhD's, and high SAT scores have significant impact on increasing tuition rates above the University of Maryland's rates. The University of Maryland tuition amount is approximately in the center of the range in the dataset of tuition rates (51% above, 49% below). Of the institutions that have higher tuition prices than the University of Maryland, these universities had higher percentage of faculty members with PhD's and higher total SAT scores than the rest of the dataset. However, the University of Maryland was above the upper quartile in both of these categories compared to all schools. The linear regression model that we formulated indicates that the University of Maryland is a great value; the tuition price that the model explains is significantly higher than the amount the University of Maryland actually charges for tuition. The dataset included institutions whose characteristics varied in wide ranges; tuition prices ranged from as high as $25,750 for a semester at Middlebury College to as low as $1,044 for a semester at Grambling State University. The student to faculty ratio ranged from 2.3 at Prescott College to 91.8 at Northwood University. Acceptance ratios varied from 100% acceptance at Thomas More College of Liberal Arts or 99.1% acceptance at Southwestern Adventist College to a staggering low of 15.4% at Princeton University. Our model indicates that the University of Maryland's percentage of faculty to PhD ratio, graduation rate, and student to faculty ratio are actually creating a higher value ($12,799/semester) than the tuition price being charged ($8,724/semester).

2
Conclusion Our modeling confirmed our hypothesis that the University of Maryland is a good value for the price of tuition compared to other leading institutions, using the factors in the data set that determine tuition price. Universities clustered based on the similarity of variables utilized indicate to us that University of Maryland's tuition price is more than fair even if the cluster is a diverse group. There are such vast differences between so many characteristics of universities but we were able to conclude from our model, that even though tuition prices continue to rise and each tuition payment is a substantial payment for a young adult, students at the University of Maryland are receiving great value for their money. It is welcoming to know that students could be paying more than they currently are. Technical Summary Pre-Processing Due to the fact that there were some inconsistencies throughout the dataset, our team needed to sift through the data and delete rows in which there was incomplete data, where key data didn’t apply (such as the US Naval Academy, since there is no tuition rate), and where the data was questionable (such as the case of Texas A&M University, where the Percentage of Professors with PhD’s was 103%). Once the data was cleaned up, we added additional columns to make the data easier to understand. Since each school was listed by state, we created a “Region” column to see if there was a particular similarity among regions of the country. Since the Math and Verbal SAT scores were separated, we created one overall SAT Score column that combined these two scores. In addition, we created a “Percent Accepted” column by dividing the number of students accepted by the number that had applied. Most importantly, we created a column called “Tuition Comparison” which labeled schools with tuition’s that were higher than the University of Maryland as “Above”, and those below as such. This would be the categorical variable around which our analysis would be shaped. Data Analysis Based on the variables available in the data set, we initially came up with some questions and hypotheses that we wanted to answer. Are prospective students willing to pay more in tuition for a higher percentage of professors with PhDs or a lower student to faculty ratio? Do higher graduation rates justify higher tuition rates? After thinking of numerous questions, we created the hypothesis (using personal experience) that the University of Maryland is a good value for the price of tuition compared to other leading institutions, using the factors in this dataset that determine tuition price. We then ran a linear regression in Spotfire Miner using the scrubbed data. For the first run, we eliminated the following variables based on our hypothesis: ACT, In-State Tuition (we chose out-of-state tuition as our tuition for comparison), room, board, book costs, additional fees, and personal expenses. Once we ran the regression, we identified the predictor with the highest p-value and eliminated it. We repeated this procedure until all of the predictors had p-values under .05. We ended up with the following variables: Graduation Rate, Student/Faculty Ratio, Math SAT, Percent of Faculty with PhDs, Public/Private. After graphing the residuals against the fitted values and testing each

3
predictor, we determined that the data was normally distributed around 0 and therefore it did fit a linear model (see below graphs).
Once we determined the data fit a linear model, we started our exploratory data analysis. We experimented by comparing different predictors using scatter plots, box plots, bar graphs and line graphs in Spotfire. By pitting one predictor against another, we were able to see specific relationships, such as a low student to faculty ratio and a high graduation rate or high percentage of professors with PhDs helps to explain higher tuition rates (see slides). It is not a surprise that the schools that accept the lowest percentage of applicants, on average, tend to charge higher tuition rates and accept a higher percentage of students within the top 10% of their class (see below graph).

4
In addition, the below graph shows that as schools charge higher tuitions, they tend to have enrolled a higher percentage of students from the top 25% of high school students.
We ran a cluster analysis through Spotfire Miner and determined there are 12 clusters; the University of Maryland is in the smallest size cluster with 18 colleges (see below scatter plot, University of Maryland is in the orange cluster). We found that the University of California at Berkeley was contained within the same cluster as the University of Maryland. Furthermore, reviewing the colleges in this cluster, we discovered that the University of Maryland's out of state tuition was not only lower than the average tuition, but also almost ten thousand dollars lower than Boston Universities tuition. Our group was intrigued that this cluster contained several universities that we believed were very different from the University of Maryland. Within the cluster which contains the University of Maryland, the student to faculty ratio is between 10:1 and 20:1 ratio (the average overall ratio for all schools is 14:1, the maximum is 1:40 at Indiana Wesleyan University, the minimum is 1:2.5 at University of Charleston). In all of the dataset, no US News ranked school has a student to faculty ratio above 1:23. The graduation rates vary widely in this cluster, from a low of 48% at Arizona State University to a high of 87% at University of Michigan.
5
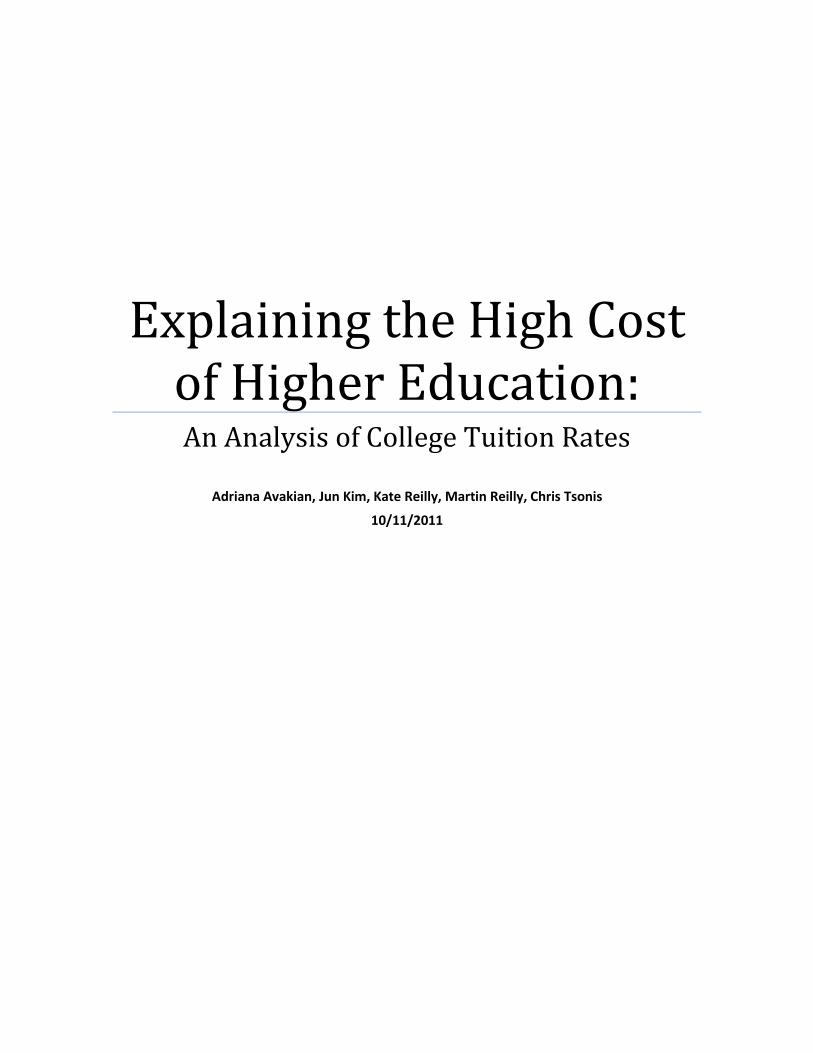
State universities can be a low-cost alternative to private schools, but only if you live in-state.
Our group anticipates being asked by the class about university and college national rankings. Instead of looking to US News rankings to provide information pertaining to school value, a student should understand what factors have the greatest impact on tuition rates. In explaining its methodology for its ranking system, US News indicates that 22.5% of the weight given to rankings is “undergraduate academic reputation” which consists of top academics (such as presidents, provosts, and deans) to account for intangibles like faculty dedication to teaching. US News also gives weight to alumni giving rate (5%) and amount of per-student spending by a university (10%) on facilities other than sports related or dorms. These are poor variables to use in evaluating schools and we believe our model more accurately explains tuition rates in the United States. Schools should be evaluated on the performance of the institution and students, not reputation. (http://www.usnews.com/education/best-colleges/articles/2011/09/12/how-us-news-calculates-the-college-rankings-2012?PageNr=3)

6
Appendix A
Linear Regression (2)
DEPENDENT VARIABLE: OUT-OF-STATE TUITION
Coefficient Estimates
Variable Estimate Std.Err. t-Statistic Pr(|t|)
(Intercept) -3,306.10 1,156.34 -2.86 4.47E-3
Public (1)/ Private (2)(2) 1,837.02 145.39 12.64 0.00
Public (1)/ Private (2)(1) -1,837.02 145.39 -12.64 3.98E-31
Math SAT 18.52 2.60 7.11 5.08E-12
% fac. w/PHD 35.00 8.45 4.14 4.22E-5
stud./fac. ratio -121.13 29.76 -4.07 5.62E-5
Graduation rate 40.16 7.90 5.08 5.70E-7
Analysis of Variance
Source DF Sum of Squares Mean Square F Pr(F)
Regression 5 4,019,290,763.70 803,858,152.74 153.68 0.00
Public (1)/ Private (2) 1 1,917,865,540.26 1,917,865,540.26 366.65 0.00
Math SAT 1 1,775,630,579.44 1,775,630,579.44 339.46 0.00
% fac. w/PHD 1 99,372,612.02 99,372,612.02 19.00 1.66E-5
stud./fac. ratio 1 91,334,192.90 91,334,192.90 17.46 3.59E-5
Graduation rate 1 135,087,839.09 135,087,839.09 25.83 5.70E-7
Error 409 2,139,408,029.10 5,230,826.48
Total 414 6,158,698,792.80
Multiple R-Squared: 0.65
Threshold correlation: 0.50
Term Importance
Source Sum of Squares F Pr(F)
Public (1)/ Private (2) 835,111,316.25 159.65 0.00
Math SAT 264,712,852.95 50.61 5.08E-12
Graduation rate 135,087,839.09 25.83 5.70E-7
% fac. w/PHD 89,663,438.32 17.14 4.22E-5
stud./fac. ratio 86,685,272.89 16.57 5.62E-5
Correlated Coefficients
Coefficients Correlation
Math SAT and % fac. w/PHD -0.53

7
Appendix B Using the variables public/private, graduation rate, in-state tuition, student to faculty ratio, and percentage of faculty members with PhD's, we were able to create a complex classification tree that is 90% accurate in defining whether the school is more or less expensive than UMD. The first node is public/private, after that, it shows a complex relationship between graduation rate and % of profs with PhDs. In a separate classification tree we created, it could be inferred that a private school, or a public school where the graduation rate is above 80% where 90% of professors have PhDs are both more expensive.
Classification Tree (2)
Columns: Role: Type: Levels:
Tuition Comparison dependent categorical Below Above
Public (1)/ Private (2) independent categorical 2 1
% fac. w/PHD independent continuous
stud./fac. ratio independent continuous
Graduation rate independent continuous
in-state tuition independent continuous
Predicting Tuition Comparison: (1 Trees)
Tree Structure:
[1] [2] - ( in-state tuition < 8,715.00 ) --> Below (588) [4] - ( % fac. w/PHD < 76.50 ) --> Below (399) [5] - ( % fac. w/PHD >= 76.50 ) --> Below (189) [10] - ( in-state tuition < 2,715.00 ) --> Below (108) [11] - ( in-state tuition >= 2,715.00 ) --> Below (81) [22] - ( in-state tuition >= 6,305.00 ) --> Below (15) [23] - ( in-state tuition < 6,305.00 ) --> Above (66) [46] - ( Graduation rate < 37.00 ) --> Below (4) [47] - ( Graduation rate >= 37.00 ) --> Above (62) [94] - ( stud./fac. ratio >= 16.15 ) --> Below (31) [188] - ( stud./fac. ratio < 17.45 ) --> Below (9) [189] - ( stud./fac. ratio >= 17.45 ) --> Below (22) [378] - ( stud./fac. ratio >= 20.05 ) --> Below (6) [379] - ( stud./fac. ratio < 20.05 ) --> Above (16) [758] - ( Graduation rate >= 54.50 ) --> Below (12) [1516] - ( stud./fac. ratio >= 18.35 ) --> Below (4) [1517] - ( stud./fac. ratio < 18.35 ) --> Above (8) [759] - ( Graduation rate < 54.50 ) --> Above (4) [95] - ( stud./fac. ratio < 16.15 ) --> Above (31) [190] - ( in-state tuition < 4,051.50 ) --> Above (22) [380] - ( stud./fac. ratio < 14.90 ) --> Above (18) [760] - ( stud./fac. ratio >= 13.85 ) --> Below (5) [761] - ( stud./fac. ratio < 13.85 ) --> Above (13) [381] - ( stud./fac. ratio >= 14.90 ) --> Above (4) [191] - ( in-state tuition >= 4,051.50 ) --> Above (9) [3] - ( in-state tuition >= 8,715.00 ) --> Above (528)
Tree #1

8