an analysis of github's collaborative software network
TRANSCRIPT
CS 224W Final Project
An Analysis of GitHub’s Collaborative Software NetworkGroup 50: Nikhil Khadke (nkhadke), Ming Han Teh (minghan), Sharon Tan (sharonxh)December 10, 2012
1 Introduction
Social coding tools such as GitHub [1] and Bitbucket [2] have transformed the way software is developed collaboratively and openly on the World Wide Web. While there had been analysis of software collaboration networks using social network theory in the past (e.g. SourceForge [3], [4]), we believe that our work, to the best of our knowledge, is the first to examine the impact of a sociallypowered software collaboration network (i.e. GitHub) using social network theory. Specifically, we explore the GitHub network by characterizing it as a multilayered collaboration graph and analyzing its network properties. We use this information to motivate a model that characterizes the collaboration graph and attempt to use this model to predict links in the collaboration network.
1.1 Problem Statement
We define the link prediction problem [5]: Given a snapshot of a network at time t, we aim to predict the edges that will be added to the network during the interval from time t to a given future time t’. We tackle the prediction problem on two types of collaboration hard and soft. We model soft collaboration (informal patchbased contributions) by the Pull Request graph and aim to predict the added edges in this network based on some trained model. Similarly, we model hard collaboration (consistent collaboration via a listed collaborator) by the User graph and aim to predict the added edges in that network. We believe that by predicting links accurately we can can gain valuable insight into the mechanisms behind collaborative software development.
1.2 Contributions
The contributions of this paper are (1) an analysis of the network properties of the GitHub collaboration network, (2) a model that predicts the probability of a link in (a) the Pull Request network (weak collaboration) and (b) in the User network (strong collaboration), and (3) an evaluation of the models above on their corresponding networks.
2 Review of relevant prior work
Madey et al. [4] observed powerlaw relationships in the sizes of SourceForge projects that hinted at preferential attachment within the SourceForge network. Gao et al. [3] expanded on this work by conducting network analysis of the SourceForge.net community, using structural analysis to reveal macro network properties. LibenNowell et al. [5] studied link prediction problems in coauthorship networks. Based on the timecentric nature of their data, their method involves selecting training time intervals and test intervals, surveying a wide range of predictors, and comparing the respective outputs expected with the real network. We solve a similar link prediction problem albeit with a different methodology. Lu et al. [10] summarized recent progress about link prediction algorithms, emphasized the contributions from physical perspectives and approaches, and introduced the applications of these methods in network analysis. Cui et al. [11] explored link prediction in citation networks, representing the network as a multilayer graph, and used these results to rank important papers. Lauterbach et al. [6] analyzed the CouchSurfing network using kfold cross validated logistic regression to find predictive factors that indicate if a user will vouch for another or not. Our paper similarly takes a descriptive study approach in describing the important features of the GitHub collaboration network. Finally, Dabbish et al. described a qualitative study of transparency and collaboration on GitHub [9], providing insight into the key methods of collaboration that we later use to define our heuristics for collaboration.

3 Data Collection
3.1 Dataset Description
Our primary data source is the GitHub Archive [7] data that is available publicly for querying via Google BigQuery [12]. This data is available under the githubarchive:github.timelinetable in Google BigQuery. Because all data is stored in a columnar large table, any explicit relational information is lost, and we had to spend time understanding what the columns corresponded to. We used Google BigQuery to extract the nodes and edges of a graph by filtering data on event types. For example, appropriate filtering with respect to FollowEvents provides us with the raw data for the Follower Graph. Our primary assumptions as we constructed these collaboration graphs were that our chosen events were indicators of collaboration, as these events only occurred from one collaborator to another. A more rigorous way of checking actual collaboration would be to crawl the entire GitHub domain and parse out collaborator information. This is not within our scope because of the time constraints we faced. We assume that collecting a few months of GitHub timeline data available from the GitHub Archive data set is a representative sample of the entire GitHub network.
3.2 Data Processing
Once a dataset has been obtained using Google BigQuery, we exported the data over to Google Cloud Storage in CSV (Comma Separated Values) format. We then downloaded the CSV file, do some preprocessing, and finally imported the data into MySQL tables. Here we were able to exploit relational operators from different data types to create edge lists for different graphs, which we could then run our analysis on.
3.3 Data Sanitization
In our initial data analysis, we printed out the top 10 nodes with the highest degree and found an outlier node, labelled “TryGit”, with disproportionate values. This node had a special repository that users could push to, without actually being listed as collaborators. This is an exception to our initial assumption, so we omitted this data point from our data set.
4 Software Collaboration Model and Link Prediction
4.1 Notion of Hard and Soft Collaboration
Typically, previous literatures have modelled various collaboration networks as a single network with a binary interpretation of collaboration [5] (i.e. two parties are either collaborators, or not). We believe that this specific model can be strengthened in the case of software collaboration, by viewing collaboration as decomposable into hard collaboration and soft collaboration. We model soft collaboration as informal patchbased contributions by pull requests and hard collaboration as a consistent formal collaboration via listed collaborators. We chose this notion of collaboration because in both our analysis and previous research [9] of the GitHub collaboration dynamic, we found distinctive activity along various levels of collaboration. Commits from listed collaborators and incorporating incoming code contributions via pull requests were listed as critical forms of collaboration, in contrast to alternative methods like mailing list code contributions. We also have access to these two heuristics in our data set. Our hope is that characterizing the collaboration as such will strengthen our link prediction model and allow us to reason better about the network properties of GitHub’s software collaboration network.
4.2 Underlying Network Model: MultiLayer Network
We represent GitHub’s software collaboration network as a multilayered network, consisting of various related graphs where in each graph, a node corresponds to a GitHub user. The two primary graphs that represent the hard collaboration and soft collaboration networks are:
i. User Graph: We place an undirected edge between two nodes if the corresponding users are listed as collaborators in some repository. This graph represents the hard collaboration network.
ii. Pull Request Graph: We place a directed edge from node A, to node B, if the user B accepts at least one pull request from user A. This graph represents the soft collaboration network.

The remaining layers of the network are GitHub features of each node that themselves form separate networks. Though the activities in each graph may not be directly user to user, we construct the edges such that we can maintain the vertex space for all graphs as the set of GitHub users. These layers consist of:
iii. Follower Graph: We place a directed edge from a node A, to node B, if the user A follows user B.iv. Watch Graph: We place a directed edge from a node A, to node B, if the user A watches a repository owned by
user B.v. Fork Graph: We place a directed edge from a node A, to node B, if the user A forks a repository owned by user B.
4.3 Link Prediction
4.3.1 Underlying Network Model
Typically, previous attempts in modelling information propagation or link prediction in complex networks relied on a simple but reasonably expressive and powerful probabilistic model, where each node spreads its information or links to its neighboring nodes with a some fixed probability [15]. Even with a well chosen value, it seems limiting to use a static p p pvalue to model the behavior of all the nodes in the network. In our case, we want to accurately characterize and predict the structure and links in the GitHub collaboration network. As a result, we believe that the value for each node should be p dependent on the following features of the collaboration network its local neighborhood properties, global network properties and multilayer network features. In an effort to strengthen this probability value, we propose to consider the features of p the individual source and target nodes, in addition to edge features between these source and target nodes. We elaborate these features in the section below:
4.3.2 Feature Selection
We model to be dependent on the following features:p
Local node neighborhood properties:
Feature Justification
max_degree (u,v) The maximum degree of nodes u and v, where there exists an edge between u and v. For directed graph, the degree is a node is a the sum of the in degree and out degree.
We believe that the maximum degree provides a rough upper bound on the importance of a contributor collaboration pair in their respective collaboration networks.
jaccard_coefficient (u,v) The Jaccard coefficient of nodes u and v measure the similarity between two nodes by measuring the ratio of size of the intersection of features of u and v with the size of the union of features of u and v. We define “features” (the Jaccard metric) as the neighbours of both nodes.
This is a fairly standard metric for measuring internodal similarity. We believe that it sufficiently measures how closely the two users are related to each other.
clustering_coefficient (v) The clustering coefficient of a
given node v measures how connected v’s neighbors are.
We suspect that the clustering around a given contributor
may correlate with the a contributor being linked to some other contributor.
Global graph properties:
Feature Justification
PageRank (u, alpha) for alpha { 0.01, 0.15, 0.50 } 2 We used these alpha values after experimenting with
Measures the relative importance of each node, where alpha is the damping factor [13].
values 0.01, 0.05, 0.15, 0.35, 0.50 and finding that the chosen alpha values were the most predictive. We also believe that PageRank is a relevant metric in finding the importance of a given contributor in the collaboration network.
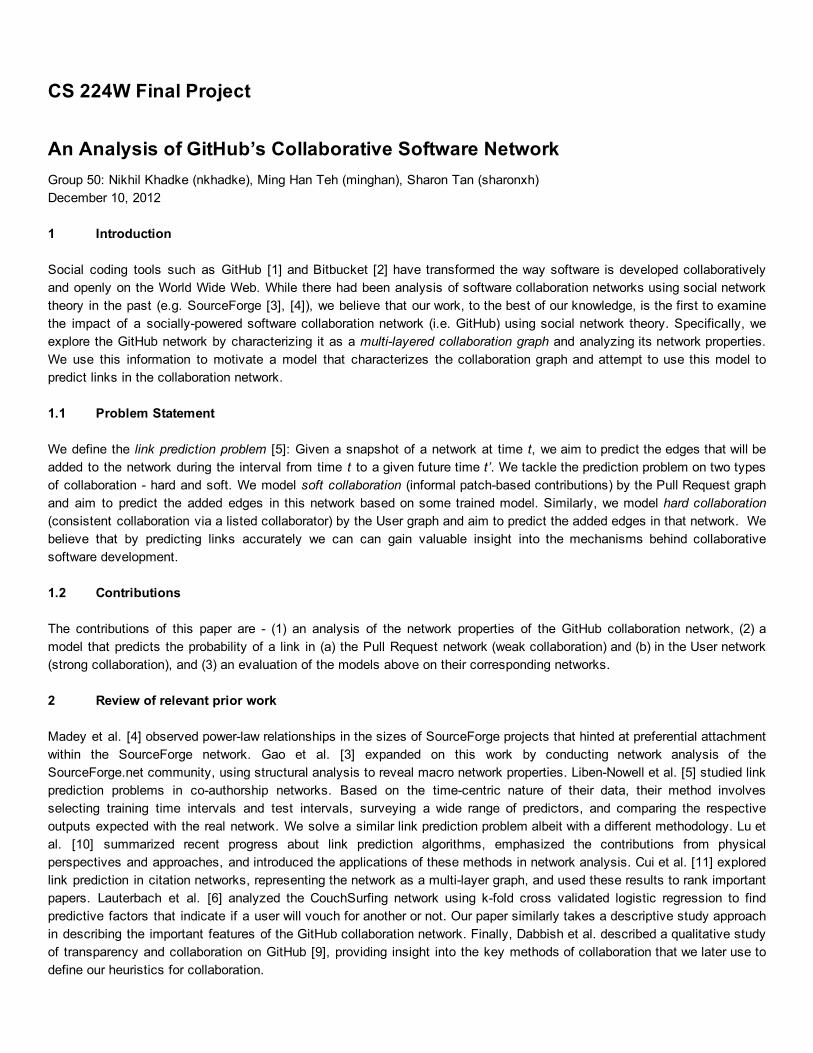
Multi Layer graph properties:
Feature Justification
following_weight (u,v) 0 if neither nodes u nor v follows each other,1 if only one of u or v follows the other,2 if u follows v and v follows u.
A following B signifies an interest in B’s activities. This may increase the chances of them being collaborators.
watching_weight (u,v) 0 if neither nodes u nor v watches each other’s repository,1 if only one of u or v watches the other’s repository,2 if u watches v’s repository and v watches u’s repository.
If A watches one of B’s repositories, this increases the chance of A collaborating with B on B’s repository since A has an interest in the development of that particular repository.
forking_weight (u,v) 0 if neither nodes u nor v has forked from each other’s repository,1 if only one of u or v has forked the other’s repository,2 if u has forked v’s repository and v has forked u’s repository.
If A forks from one of B’s repositories, this means that A is interested in furthering B’s work on his own. This might lead to A contributing his changes back to B’s project in future, or even becoming official collaborators.
connected_in_pr (u,v) 0 if neither edge (u,v) nor edge (v,u) exists in the directed pull request graph,1 if only one of either (u,v) or (v,u) exists in the pull request graph,2 if both edges (u,v) and (v,u) exist in the pull request graph.
The fact that A and B have collaborated unofficially (in the soft collaboration network) may spur official collaboration (in the hard collaboration network) between them.
connected_in_user (u,v) 1 if (u,v) exists in the undirected user graph,0 otherwise.
The fact that A and B have collaborated officially (in the hard collaboration network) may spur informal collaboration (in the soft collaboration network) between them.
4.3.3 Link Prediction Modelling
We collected a total of 4 months data (04/01/2012 to 08/01/2012), which we name , and 7 months data (04/01/2012 to D4 11/01/2012), which we name , to build the various graph networks as described earlier in section 4.2 and do structural D7 analysis. Based on these respective data sets, we sampled a subset of edges to create the training and testing data called and respectively. We made sure that our testing data does not overlap with our training data.t4 t7
Formally, in our link prediction problem, we want to train a model on , and use the model to predict an edge in that does t4 t7 not already exist in . We now describe the model used to train and predict links:t4
Formally, we can represent the relationship of each feature for a given edge with nodes u and v, from an input feature x 2 ß set as follows:ß

(x) x x g = P
iËi i +
P
j
Íj j + P
k° xk k
where represent a family of weights for local node neighborhood properties, global graph properties, and multi layer ; Í; °Ë graph properties respectively.
Hence, we can then model , which is the probability of an edge between two given nodes u and v via running logistic p regression on the input features described above as:
p = 1
1 + eÀg(x)
Since we deal with two collaboration types, we make concrete here the features we use for each collaboration network:
Common Features:i. max_degreeii. PageRank for values 0.01, 0.15 and 0.50iii. following_weightiv. watching_weightv. forking_weight
Specific Features
Soft Collaboration Features● connected_in_user
Hard Collaboration Features● connected_in_pr● jaccard● clustering_coeff
Note that we ran logistic regression on each collaboration network separately.
5 Network Structure Analysis
5.1 Structural Analysis
We only included users that were active from the time interval we sampled. While we estimated the actual number of user accounts to be at least 950,000, many of those users were not active. We present the structural properties for the and D4
graph sets in Table 1 and Table 2 respectively.D7
Table 1: Structural Properties of Graph SetD4
All the following graphs have 367206 nodes each.
User Graph Pull RequestGraph
Follow Graph Watch Graph Fork Graph
Type Undirected Directed Directed Directed Directed
No. of Edges 122433 65873 358672 919253 260404
ClusteringCoefficient
0.0923 0.00632 0.0367 0.0121 0.00946
Table 2: Structural Properties of Graph SetD7
All the following graphs have 539716 nodes each.

User Graph Pull RequestGraph
Follow Graph Watch Graph Fork Graph
Type Undirected Directed Directed Directed Directed
No. of Edges 231359 112072 646381 1742922 531546
ClusteringCoefficient
0.102 0.00719 0.0449 0.0140 0.0133
5.1.1 Clustering CoefficientsFrom the table above, we notice the clustering coefficient is relatively small in all cases, which is typical for a realworld network of such size.
Between and , the clustering coefficients grow significantly for all our graphs. New collaborators have a higher D4 D7 tendency to be added within preexisting clusters, and then increasing the density of ties within these clusters. In the ‘User’ Graph, this is to be expected since when a node A is added to a repository, edges are drawn between node A and all the other nodes who are already members of the repository. However, for the other graphs, the increased clustering coefficients are not as trivially explained. This, along with the fact that the number of edges approximately doubled from to , D4 D7
suggests that the networks are in early stages of evolution, similar to those analyzed by Leskovec et. al [14]. This makes the link prediction problem a nontrivial one to solve.
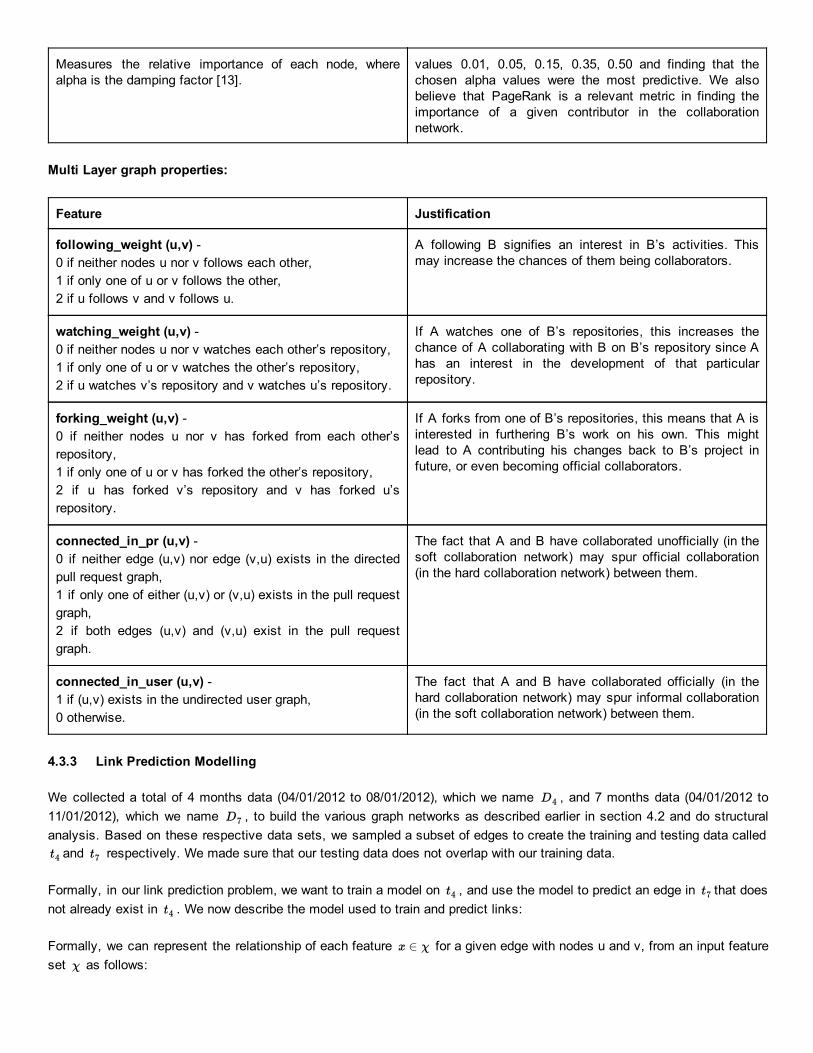
5.1.2 Degree and Component DistributionsStructural plots for the Graph Set are shown in Figure 1 and Figure 2. We have only included plots for only the D7 D7
Graph Set because the Graph Set is a subset of the Graph Set, and so the plots are very similar.D4 D7
From the loglog plots in Figure 1 and 2, we can see that the degree distribution of all 5 graphs mostly follow a power law distribution. The largest deviation from a power law function in the User Graph, which shows two peaks at node degrees more than 100. This is probably because GitHub is a niche network that has super users who tend to use the platform for personal and enterprise development (causing a spike in the degree of these users). Although they are members of many repositories, they may not exhibit proportionately extreme behavior in terms of their frequency of accepting or submitting pull requests, following, and watching. This intuition is supported by the degree distribution plots of the Follower, Watch and Pull Request network, where there are no such peaks.
Looking at the component plots, we realize two key insights. Firstly, there is a large proportion of isolated nodes, which indicate users who are isolated developers. Secondly, we notice the existence of single large component in all three graphs. Loosely, this represents the essence of a selforganizing system where there exists a robust core, similar to the BowTie Structure of the Internet [8].
At a glance, we can also see that the Follower and Watch graphs are significantly denser than the User and Pull Request graphs. Our intuition is that this can be explained by referring to the different categories of GitHub users novice and active users. Novice users do not actively create and contribute to code, but follow or watch nodes or repositories that catch their interest. In contrast, GitHub also features a smaller dynamic community of active users who tend to be professional developers. They interact on GitHub more intensively and productively, via such methods like joining repositories and submitting pull requests.
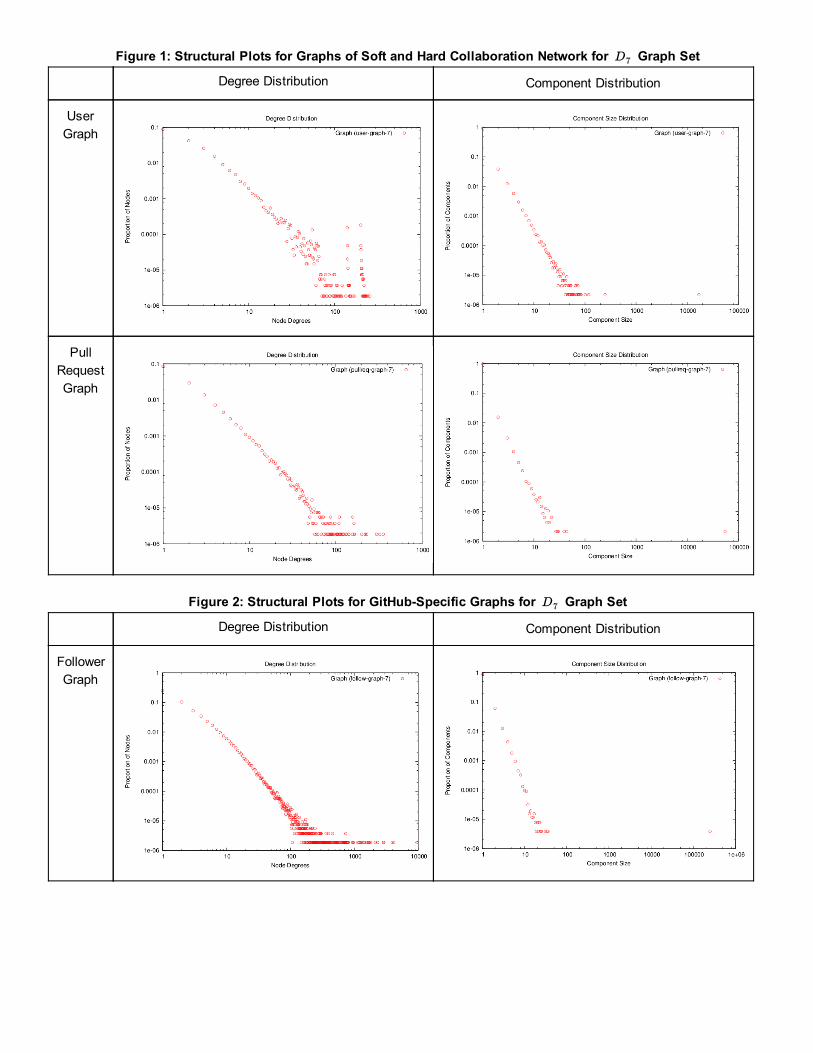
Figure 1: Structural Plots for Graphs of Soft and Hard Collaboration Network for Graph SetD7
Degree Distribution Component Distribution
UserGraph
PullRequestGraph
Figure 2: Structural Plots for GitHubSpecific Graphs for Graph SetD7
Degree Distribution Component Distribution
FollowerGraph
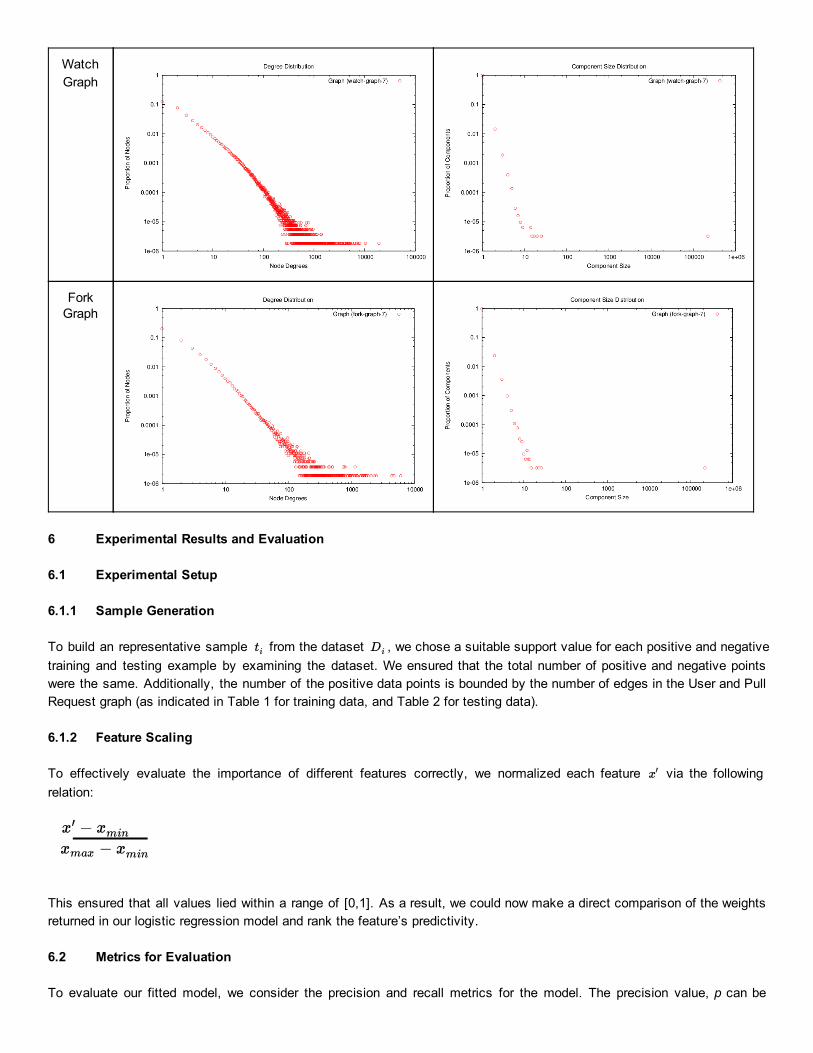
WatchGraph
ForkGraph
6 Experimental Results and Evaluation
6.1 Experimental Setup
6.1.1 Sample Generation
To build an representative sample from the dataset , we chose a suitable support value for each positive and negative ti Di training and testing example by examining the dataset. We ensured that the total number of positive and negative points were the same. Additionally, the number of the positive data points is bounded by the number of edges in the User and Pull Request graph (as indicated in Table 1 for training data, and Table 2 for testing data).
6.1.2 Feature Scaling
To effectively evaluate the importance of different features correctly, we normalized each feature via the following x0 relation:
x À x0min
x À xmax min
This ensured that all values lied within a range of [0,1]. As a result, we could now make a direct comparison of the weights returned in our logistic regression model and rank the feature’s predictivity.
6.2 Metrics for Evaluation
To evaluate our fitted model, we consider the precision and recall metrics for the model. The precision value, p can be
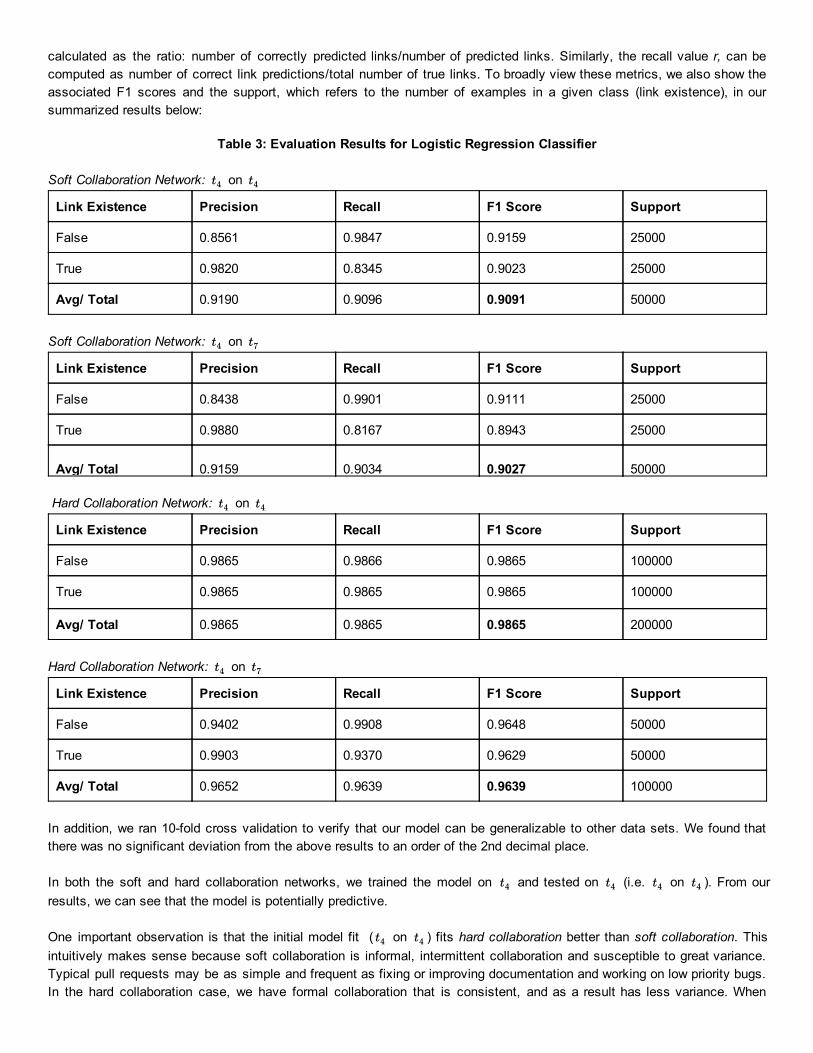
calculated as the ratio: number of correctly predicted links/number of predicted links. Similarly, the recall value r, can be computed as number of correct link predictions/total number of true links. To broadly view these metrics, we also show the associated F1 scores and the support, which refers to the number of examples in a given class (link existence), in our summarized results below:
Table 3: Evaluation Results for Logistic Regression Classifier
Soft Collaboration Network: on t4 t4
Link Existence Precision Recall F1 Score Support
False 0.8561 0.9847 0.9159 25000
True 0.9820 0.8345 0.9023 25000
Avg/ Total 0.9190 0.9096 0.9091 50000
Soft Collaboration Network: on t4 t7
Link Existence Precision Recall F1 Score Support
False 0.8438 0.9901 0.9111 25000
True 0.9880 0.8167 0.8943 25000
Avg/ Total 0.9159 0.9034 0.9027 50000
Hard Collaboration Network: on t4 t4
Link Existence Precision Recall F1 Score Support
False 0.9865 0.9866 0.9865 100000
True 0.9865 0.9865 0.9865 100000
Avg/ Total 0.9865 0.9865 0.9865 200000
Hard Collaboration Network: on t4 t7
Link Existence Precision Recall F1 Score Support
False 0.9402 0.9908 0.9648 50000
True 0.9903 0.9370 0.9629 50000
Avg/ Total 0.9652 0.9639 0.9639 100000
In addition, we ran 10fold cross validation to verify that our model can be generalizable to other data sets. We found that there was no significant deviation from the above results to an order of the 2nd decimal place.
In both the soft and hard collaboration networks, we trained the model on and tested on (i.e. on ). From our t4 t4 t4 t4 results, we can see that the model is potentially predictive.
One important observation is that the initial model fit ( on ) fits hard collaboration better than soft collaboration. This t4 t4 intuitively makes sense because soft collaboration is informal, intermittent collaboration and susceptible to great variance. Typical pull requests may be as simple and frequent as fixing or improving documentation and working on low priority bugs. In the hard collaboration case, we have formal collaboration that is consistent, and as a result has less variance. When
listed as a formal collaborator, there is an implicit responsibility to contribute and actively maintain the repository. Additionally, it is much tougher and rarer for an arbitrary contributor to be accepted as a formal collaborator. This leads to smaller variance, making it easier for the model to be more predictive.
The above analysis also applies to the result for on (i.e. training data on and testing on ).t4 t7 t4 t7
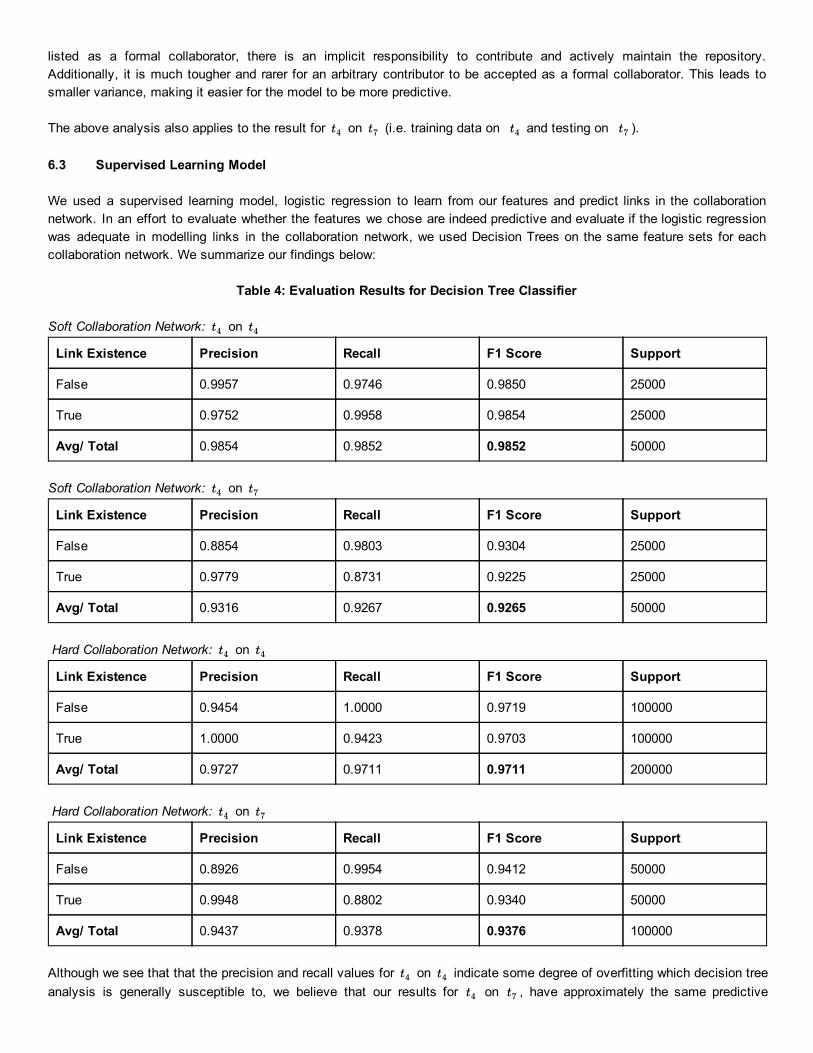
6.3 Supervised Learning Model
We used a supervised learning model, logistic regression to learn from our features and predict links in the collaboration network. In an effort to evaluate whether the features we chose are indeed predictive and evaluate if the logistic regression was adequate in modelling links in the collaboration network, we used Decision Trees on the same feature sets for each collaboration network. We summarize our findings below:
Table 4: Evaluation Results for Decision Tree Classifier
Soft Collaboration Network: on t4 t4
Link Existence Precision Recall F1 Score Support
False 0.9957 0.9746 0.9850 25000
True 0.9752 0.9958 0.9854 25000
Avg/ Total 0.9854 0.9852 0.9852 50000
Soft Collaboration Network: on t4 t7
Link Existence Precision Recall F1 Score Support
False 0.8854 0.9803 0.9304 25000
True 0.9779 0.8731 0.9225 25000
Avg/ Total 0.9316 0.9267 0.9265 50000
Hard Collaboration Network: on t4 t4
Link Existence Precision Recall F1 Score Support
False 0.9454 1.0000 0.9719 100000
True 1.0000 0.9423 0.9703 100000
Avg/ Total 0.9727 0.9711 0.9711 200000
Hard Collaboration Network: on t4 t7
Link Existence Precision Recall F1 Score Support
False 0.8926 0.9954 0.9412 50000
True 0.9948 0.8802 0.9340 50000
Avg/ Total 0.9437 0.9378 0.9376 100000
Although we see that that the precision and recall values for on indicate some degree of overfitting which decision tree t4 t4 analysis is generally susceptible to, we believe that our results for on , have approximately the same predictive t4 t7
strength in both the soft and hard collaboration networks. This indicates that logistic regression is adequate to model the link prediction problem.
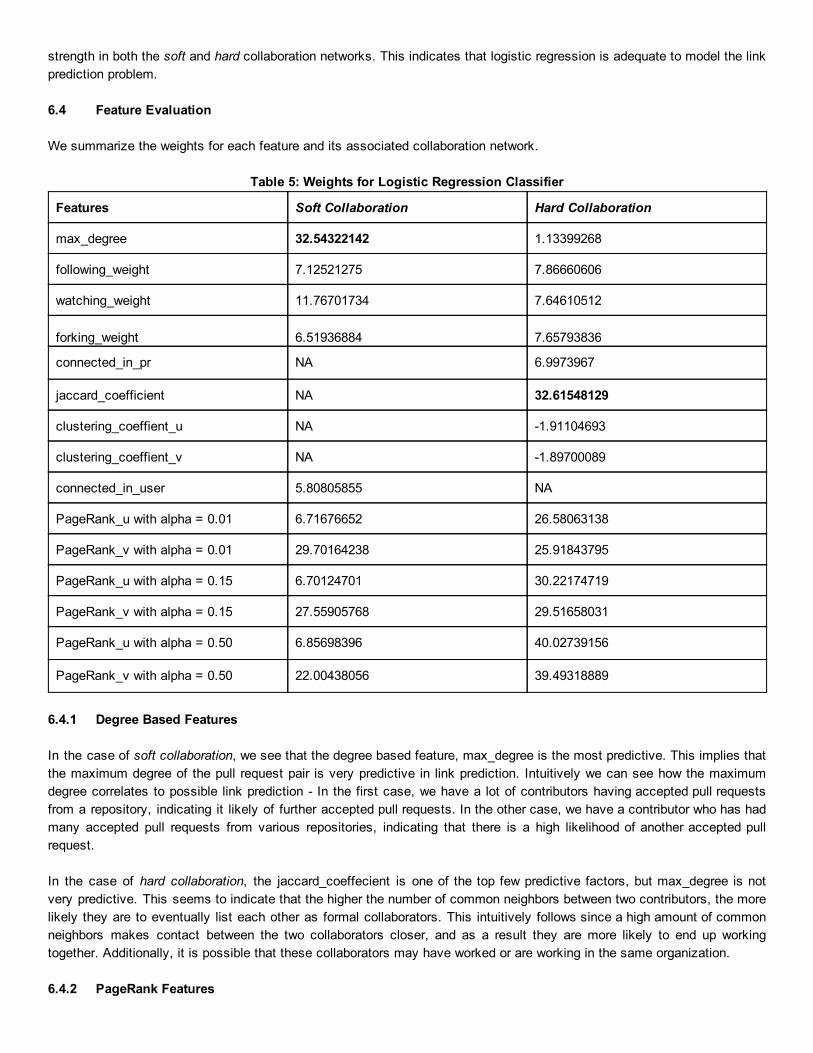
6.4 Feature Evaluation
We summarize the weights for each feature and its associated collaboration network.
Table 5: Weights for Logistic Regression Classifier
Features Soft Collaboration Hard Collaboration
max_degree 32.54322142 1.13399268
following_weight 7.12521275 7.86660606
watching_weight 11.76701734 7.64610512
forking_weight 6.51936884 7.65793836
connected_in_pr NA 6.9973967
jaccard_coefficient NA 32.61548129
clustering_coeffient_u NA 1.91104693
clustering_coeffient_v NA 1.89700089
connected_in_user 5.80805855 NA
PageRank_u with alpha = 0.01 6.71676652 26.58063138
PageRank_v with alpha = 0.01 29.70164238 25.91843795
PageRank_u with alpha = 0.15 6.70124701 30.22174719
PageRank_v with alpha = 0.15 27.55905768 29.51658031
PageRank_u with alpha = 0.50 6.85698396 40.02739156
PageRank_v with alpha = 0.50 22.00438056 39.49318889
6.4.1 Degree Based Features
In the case of soft collaboration, we see that the degree based feature, max_degree is the most predictive. This implies that the maximum degree of the pull request pair is very predictive in link prediction. Intuitively we can see how the maximum degree correlates to possible link prediction In the first case, we have a lot of contributors having accepted pull requests from a repository, indicating it likely of further accepted pull requests. In the other case, we have a contributor who has had many accepted pull requests from various repositories, indicating that there is a high likelihood of another accepted pull request.
In the case of hard collaboration, the jaccard_coeffecient is one of the top few predictive factors, but max_degree is not very predictive. This seems to indicate that the higher the number of common neighbors between two contributors, the more likely they are to eventually list each other as formal collaborators. This intuitively follows since a high amount of common neighbors makes contact between the two collaborators closer, and as a result they are more likely to end up working together. Additionally, it is possible that these collaborators may have worked or are working in the same organization.
6.4.2 PageRank Features

In the case of soft collaboration, for a pull request pair (u,v) where a contributor u has submitted a pull request that has been accepted by v, the PageRank value of v is very predictive of further links. We also note that this prediction is strengthened with lower alpha values. The PageRank values of u seem to remain approximately equally not relatively predictive. This indicates that the importance of the person in the software network who decides to allow/accept the pull request is predictive of further accepted pull requests. The fact that smaller alpha values are more predictive indicate that the properties of the global network are very important in predicting future links.
In the case of hard collaboration, our results show that the PageRank values of nodes are the most predictive of further links. We also note that this prediction is strengthened with higher alpha values. The PageRank values of both nodes seem to remain approximately equally predictive, as the edges between the nodes are undirected. These results indicate that the importance of the person in the software network is predictive of future collaboration. The fact that smaller alpha values are less predictive indicate that the properties of the global network are less important in predicting future links.
6.4.3 Multi Layered and GitHub Specific Features
In both cases of soft collaboration and hard collaboration, we find that multi layered features are generally not relatively predictive. This tends to indicate that collaboration in network does not really predict collaboration in the other. This result is an important result, because it reaffirms the fact that there are distinctive forms of collaboration, each with its associated set of properties and predictive factors.
It is surprising to note however, that the GitHub specific features are generally not predictive as well. Based on the structural analysis above, one explanation for this is that there are a large proportion of users who do not contribute code on GitHub, but may still watch, follow, or attempt to fork from active users.
7 Conclusion and Further Work
In conclusion, we have presented important network properties of the GitHub collaborative software network. We have described and analyzed a reasonably accurate model that predicts links in the soft collaboration and hard collaboration networks based on a multilayer network properties and both local and global network properties. In the case of soft collaboration, our model was able to predict new links with an accuracy of 0.9027, and in the case of hard collaboration our model had a corresponding accuracy of 0.9639. We also presented and evaluated our model and its features in both networks, highlighting important trends such as the importance of PageRank and degreerelated features and the weakerthanexpected predictive strength of multi layered features.
In our project, we only used two snapshots of the network. In the future, it would be interesting to strengthen this approach by considering the application of the model to smaller timesteps and larger amount snapshots. This would allow us to mine more features such as the intensity/rate of pull requests or collaborations. Additionally, we could actually crawl the GitHub page to extract real time collaboration information to strengthen the data we have.
8 Acknowledgments
We would like to thank Professor Leskovec and the TAs of CS224W’12 for all their guidance and advice over the course of this quarter.
9 References
[1] GitHub: Social Coding, http://github.com/, accessed Nov 15, 2012
[2] Bitbucket, http://bitbucket.org/, accessed Oct 21, 2012
[3] Gao Yongqin, and Greg Madey. "Network analysis of the SourceForge.net community." Open Source Development, Adoption and Innovation (2007): 187200

[4] Gregory R. Madey, Vincent W. Freeh, and Renee O. Tynan. “The Open Source Software Development Phenomenon: An Analysis Based on Social Network Theory”. In proceeding of Americas Conference on Information Systems (AMCIS ‘02), Dallas, TX, August 2002
[5] David LibenNowell and Jon Kleinberg. “The link prediction problem for social networks”. In Proceedings of the twelfth international conference on Information and knowledge management (CIKM '03), ACM, New York, NY, USA, 2003, , 556559. DOI=10.1145/956863.956972 http://doi.acm.org/10.1145/956863.956972
[6] Debra Lauterbach, Hung Truong, Tanuj Shah, and Lada Adamic (2009) “Surfing a Web of Trust: Reputation and Reciprocity on CouchSurfing.com”. In Proceedings of the 2009 International Conference on Computational Science and Engineering Volume 04 (CSE '09), Vol. 4. IEEE Computer Society, Washington, DC, USA, 346353. DOI=10.1109/CSE.2009.345 http://dx.doi.org/10.1109/CSE.2009.345
[7] GitHub Archive, http://www.githubarchive.org/, accessed Nov 15, 2012
[8] David Easley and Jon Kleinberg. Networks, Crowds, and Markets: Reasoning About a Highly Connected World. Cambridge University Press, 2010. Chapter 13
[9] Laura Dabbish, Colleen Stuart, Jason Tsay, and Jim Herbsleb. (2012) “Social coding in GitHub: Transparency and collaboration in an open software repository.” In Proceedings of the ACM Conference on ComputerSupported Cooperative Work (CSCW 2012), Bellevue, WA. ACM Press, NY: 12771286
[10] Linyuan Lü and Tao Zhou. (2011) “Link prediction in complex networks: A survey”, Physica A 390 (2011) 11501170 http://arxiv.org/abs/1010.0725
[11] Jingyu Cui, Fan Wang, and Jinjian Zhai. (2010) “Networks as a Multilayer Graph: Link Prediction and Importance Ranking”. In CS224W 2010 Project Reports. http://snap.stanford.edu/class/cs224w2010/proj2010/05_ProjectReport.pdf, accessed Nov 20, 2012
[12] Google BigQuery Google BigQuery Google Developers, https://developers.google.com/bigquery/, accessed Dec 9, 2012
[13] Larry Page, Sergey Brin, Rajeev Motwani, and Terry Winograd. (1999) The PageRank Citation Ranking: Bringing Order to the Web. Technical Report. Stanford InfoLab
[14] Jure Leskovec, Lars Backstrom, Ravi Kumar, and Andrew Tomkins. (2008) “Microscopic evolution of social networks". In Proceedings of the 14th ACM SIGKDD international conference on Knowledge discovery and data mining (KDD '08). ACM, New York, NY, USA, 462470. DOI=10.1145/1401890.1401948 http://doi.acm.org/10.1145/1401890.1401948
[15] Paul Erdős and Alfréd Rényi. (1960) "On the evolution of random graphs". Publications of the Mathematical Institute of the Hungarian Academy of Sciences 5: 17–61