an analysis of punitive damages in california courts, · pdf filean analysis of punitive...
TRANSCRIPT
An Analysis of Punitive Damagesin California Courts, 1991-2000
byJ. Clark Kelso
&Kari C. Kelso, Ph.D.
Capital Center for Government Law & PolicyUniversity of the Pacific
McGeorge School of Law
Table of Contents
Chapter 1. Executive Summary ...................................................................................... 1
Chapter 2. Analysis of California Punitive Damage Verdicts, 1991-2000 .................. 4
A. Introduction ....................................................................................................... 4
B. Analysis of Punitive Damage Awards in California Courts, 1991-2000 .......... 5
1. Descriptive Statistics on Sample of Punitive Damage Verdicts ............ 6
2. Examination of Punitive Damage Verdicts by Type of Case ................ 8
3. Examination of Punitive Damage Verdicts by Year ............................ 14
4. Examination of Punitive Damage Verdicts by County ........................ 17
5. Examination of Punitive Damage Verdicts by Defendant Type .......... 20
6. Examination of Punitive Damage Awards by Jury or Judge ............... 21
About the Authors
Project Director and Primary Author
The Project Director and Primary Author, Professor J. Clark Kelso, is aProfessor of Law and Director of the Capital Center for Government Law & Policy at theUniversity of the Pacific McGeorge School of Law. Professor Kelso is the leadingacademic authority on the administration of justice in California’s courts. Recipient ofthe Judicial Council’s 1998 Bernard E. Witkin Amicus Curiae award, which is given toan individual other than a member of the judiciary for outstanding contributions toCalifornia’s courts, Professor Kelso has been appointed as the Administrative Office ofthe Court’s Scholar in Residence for 2001. Professor Kelso is well known within theLegislative and Executive Branches as well, most recently having served as California’sActing Insurance Commissioner after the resignation of former Commissioner ChuckQuackenbush. Subsequent to his service with the Department of Insurance, GovernorGray Davis appointed Professor Kelso to serve on the board of the California EarthquakeAuthority, which he chairs.
Quantitative Researcher
The Quantitative Researcher for this project is Dr. Kari C. Kelso. Dr.Kelso received her Ph.D. from the University of Texas at Austin in OrganizationalCommunication where she received extensive training in both qualitative andquantitative research methodologies. Her doctoral dissertation, “Conformity andVariation Within the Legal System: An Organizational Communication Analysis,”examined processes by which uncertainty in organizational and social behavior isreduced through the communication of standards or rules of law that make sense ofevents. Dr. Kelso is a part-time professor at California State University, Sacramento. Dr. Kelso has previously collaborated with Professor Clark Kelso as co-author of twoempirical studies of California jury verdicts in medical malpractice and insurance badfaith. See J. Clark Kelso & Kari C. Kelso, Jury Verdicts in Medical Malpractice Casesand the MICRA Cap (August 1999); J. Clark Kelso & Kari C. Kelso, Jury Verdicts inInsurance Bad Faith Cases (August 1999).
1This study was supported by a grant from the Civil Justice Association of California (“CJAC”). CJAC is one of the leading proponents of punitive damage and civil justice reform in California. In orderto ensure our independence and the integrity of our results, the Capital Center did not consult with CJACregarding the methodology for the study. Instead, we employed the same quantitative methodologies weused in our two prior reports on verdicts in medical malpractice and insurance bad faith cases, neither ofwhich was supported by outside funding. See J. Clark Kelso & Kari C. Kelso, Jury Verdicts in MedicalMalpractice Cases and the MICRA Cap (August 1999); J. Clark Kelso & Kari C. Kelso, Jury Verdicts inInsurance Bad Faith Cases (August 1999). The statistical analysis we report here is similar to the typeof analysis employed by other scholars and researchers who study verdicts and punitive damages. See,e.g., Carol J. DeFrances & Marika F.X. Litras, Civil Trial Cases and Verdicts in Large Counties, 1996(Bureau of Justice Statistics, Sept. 1999); Erik Moller, Trends in Civil Jury Verdicts Since 1985 (Rand1996); Carol J. DeFrances, et al., Civil Jury Cases and Verdicts in Large Counties, 1992 (Bureau ofJustice Statistics, July 1995).
1
Chapter 1.Executive Summary
For the past twenty years or so, the business community, some academicscholars and many political and community leaders have expressed serious concernsabout what appears to be a rise in the number of punitive damages awards, a rise in theamount of punitive damages awarded, and a rise in the number of cases where punitivedamages are claimed. The topic has been studied and debated repeatedly over the yearswith the business community and some scholars contending, on the one hand, that asurge of punitive damage awards is having an adverse impact upon the economy andmany trial attorneys and other scholars contending, on the other hand, that there has notbeen a substantial increase in punitive damage awards and that the tort system isfunctioning as it should with punitive damages limited primarily to appropriate cases. This study by the Capital Center for Government Law and Policy is intended tocontribute to the debate by examining punitive damage judgments in California from1991 to 2000. 1
There is no official, governmental source of information about all punitivedamage awards in California; the data simply is not collected. We therefore turned to aprivate source of information, collecting data for our study from verdicts reported inWestlaw’s database for the California Jury Verdict Reporter. According to Westlaw,this database contains jury verdict and judgment summaries supplied through anagreement between West Publishing Company and Trials Digesting Publishing, Inc.,from 1991, when Trials Digest began publication, to the present. Jury verdict reports forthe database are gathered from attorneys who have tried cases in the superior courts andin the U.S. District Courts in California. Because the database is dependent upon
2“Compensatory damages” are intended to compensate a person for actual loss or harmsuffered as a consequence of unlawful acts or omissions. See Civil Code §§ 3281 & 3282. Themeasure for compensatory damages depends upon the type of harm involved. For example, in apersonal injury case, compensatory damages will often include past and future medical expenses,lost wages, and pain and suffering. In a case involving damage to property, compensatorydamages will often include such things as the decrease in market value of the property, repaircosts, damages for loss of use of the property. “Punitive damages” are intended to punish thedefendant and to deter others by making an example of the defendant. See Civil Code § 3294(a).
2
voluntary reports by attorneys, it does not represent a comprehensive database of all juryverdicts, although the size of the database makes it likely that the sample collected isfairly representative of verdicts in California (although representative, the databaseclearly underestimates the total number of punitive awards and the total amount ofpunitive damages awarded by California juries).
The sample for the study consisted of 489 cases in which punitive damageshad been awarded by a California court between January 1, 1991, and December 31,2000. In cases where punitive damages are awarded, punitive damages account for anoverwhelming proportion of all damages awarded. In the sample, punitive damagesaccounted for approximately 88.4% of the total amount of compensatory and punitivedamages awarded to plaintiffs. 2 In other words, in cases where punitive damages wereawarded, the total amount of punitive damages awarded was 7.6 times greater than thetotal amount of compensatory damages awarded. In slightly over half of the cases, thepunitive award is equal to or less than the compensatory award. However, in theremaining cases, the punitive award is substantially larger than the compensatory award,and in a small number of cases, the punitive award is extremely large compared to thecompensatory award.
There is a distinctive set of “high punitive damage cases” (“HPDCs”)where the average punitive awards and the ratio between the punitive and compensatoryawards are substantially greater than in non-HPDC cases. See Tables 4-6. The set ofHPDCs is limited to four causes of action: product liability, insurance bad faith, unfaircompetition and trespass / nuisance.
Finally, there has been an increase in punitive awards during the 1990sbased on a comparison of awards in the first half of the decade with awards in the secondhalf of the decade. Moreover, punitive damages have been rising more quickly inHPDCs than in non-HPDCs, as shown, among other things, by substantially greaterincreases in the ratios of punitive to compensatory awards in HPDCs. See Tables 7through 10.

3
The results in this report suggest that those who are concerned about highor rising punitive damage awards should focus their attention on a well-defined subset oftort and business cases where punitive damages appear to predominate. The statisticsreported here do not, by themselves, support a conclusion about whether punitivedamages in HPDCs are too high, too low, or just about right. However, in light of theapparent increases in punitive awards in these cases over the course of the 1990s and theoverwhelming predominance of punitive damages in these cases, further inquiry into thecauses and consequences of punitive damages in HPDCs appears warranted.
4
Chapter 2. Analysis of California Punitive Damage Verdicts, 1991-2000
A. Introduction
For the past twenty years or so, the business community, some academicscholars and many political and community leaders have expressed serious concernsabout what appears to be a rise in the number of punitive damages awards, a rise in theamount of punitive damages awarded, and a rise in the number of cases where punitivedamages are claimed. The topic has been studied and debated repeatedly over the yearswith the business community and some scholars contending, on the one hand, that asurge of punitive damage awards is having an adverse impact upon the economy andmany trial attorneys and other scholars contending, on the other hand, that there has notbeen a substantial increase in punitive damage awards and that the tort system isfunctioning as it should with punitive damages limited primarily to appropriate cases. See Marc Galanter, Shadow Play: The Fabled Menace of Punitive Damages, 1998Wisconsin Law Review 1 (introducing a major symposium issue on punitive damages).
There has been a prolonged effort by the business community to engage theSupreme Court of the United States in reviewing punitive damage awards, but that efforthas been only partly successful. Although punitive damage awards are subject to reviewunder the due process clause of the United States Constitution, the standard employed bythe Supreme Court is essentially the same standard employed by virtually all stateappellate courts in reviewing punitive damage awards. See BMW of North America, Inc.v. Gore, 517 U.S. 559 (1996). There is no evidence that the possibility of Supreme Courtreview has had any substantial impact upon the incidence or amount of punitive damagesbeing awarded by juries or approved by state courts.
Punitive damage reform has come almost exclusively from the legislativebranch, and that reform has originated at the state level. The reforms vary from state tostate and include increasing the standard of proof, procedural reforms such asbifurcation, imposing caps on the amount of punitive damages, and providing that someportion of punitive damage awards be paid to the state instead of to the plaintiff.
The public policy discussion about punitive damages has reachedsomething of a stalemate at this point. Both sides have staked out their positions, and foreach thrust in the public debate, there is a ready-made parry. Proponents of punitivedamage reform point to the occasional large and, they assert, unpredictable punitive
3The threat of punitive damages may drive up settlement amounts because of the uncertaintyassociated with both the likelihood of a punitive award and, most importantly, the large variance inpunitive damages if an award is made. Because of the risk of very large punitive judgments, defendantsmay be more willing to settle for increased sums in order to avoid placing other assets at risk. Whethersettlement amounts are being driven up in a substantial number of cases depends in part upon theincidence of punitive damage claims (as opposed to the incidence of punitive damage verdicts). Severalrecent studies suggest that in some jurisdictions, there is a high incidence of punitive damage claimswhich might provide a mechanism for the threat of punitive damages to drive up settlement amounts. SeeJohn H. Sullivan, “New State Data Confirms Runaway Abuse of Punitive Damages,” published in TheLegal Backgrounder (Washington Legal Foundation, Feb. 7, 1997) (reprinted atwww.cjac.org/research/punitivedamages.pdf) (discussing recent studies).
5
awards; opponents of reform point to statistics suggesting a small incidence of punitivedamages in tort litigation overall and greater predictability in the amount of punitivedamages than is commonly supposed. Proponents of reform assert that the threat ofpunitive damages drives settlement amounts upward and adversely affects businessjudgments about risk; 3 opponents of reform point out that such claims are speculativesince there are virtually no empirical studies which have rigorously examined theseissues. There has even been debate about the most basic question of whether theexistence of punitive damages has any deterrent effect on business behavior.
B. Analysis of Punitive Damage Awards in California Courts, 1991-2000.
There is no official, governmental source of information about all punitivedamage awards in California; the data simply is not collected. We therefore turned to aprivate source of information, collecting data for our study from verdicts reported inWestlaw’s database for the California Jury Verdict Reporter. According to Westlaw,this database contains jury verdict and judgment summaries supplied through anagreement between West Publishing Company and Trials Digesting Publishing, Inc.,from 1991, when Trials Digest began publication, to the present. Jury verdict reports forthe database are gathered from attorneys who have tried cases in the superior courts andin the U.S. District Courts in California. Because the database is dependent uponvoluntary reports by attorneys, it does not represent a comprehensive database of all juryverdicts, although the size of the database makes it likely that the sample collected isfairly representative of verdicts in California (although representative, the databaseclearly underestimates the total number of punitive awards and the total amount ofpunitive damages awarded by California juries).
We reviewed all cases in the database from January 1991 to December2000 where the words “punitive” or “exemplary” appeared in the verdict report. Afterremoving cases with missing data and cases where punitive damages had not been
4 The total verdict amount includes only compensatory and punitive damages and excludescollateral recoveries such as for attorneys fees and interest. The figures reported in this study do notreflect post-verdict motions, appeals or settlements which may have resulted in a decrease incompensatory or punitive awards. For example, the single largest punitive award made by a jury in thesample was the $4.2 billion punitive damage award in Anderson v. General Motors Corp., whichinvolved injuries suffered in an automobile accident where the fuel tank burst into flames severelyinjuring the plaintiffs. That $4.2 billion punitive damage award was reduced by the trial court to $1.2billion. While the presence in the sample of such very large awards which were subsequently reducedwill affect the values reported for the mean total and mean punitive awards and for the mean ratio ofpunitive to compensatory awards, statistical outliers will generally not affect the figures reported formedian and trimmed mean awards (for definitions of these terms, see footnotes 3 through 5). Forexample, if we were to have used the $1.2 billion figure in calculating the figures in Table 1, the sum ofall damages would be $4,232,427,218, the sum of punitive damages would be $3,391,565,454, the meantotal verdict would be $8,655,270, and the mean punitive award would be $6,935,717. However, themedian and trimmed mean figures would not change at all.
5 Substituting $1.2 billion for the $4.2 billion punitive award made in Anderson v. GeneralMotors Corp. reduces the 88.4% figure cited in the text to 80%.
6
awarded, we were left with a sample of 489 cases where punitive damages had beenawarded.
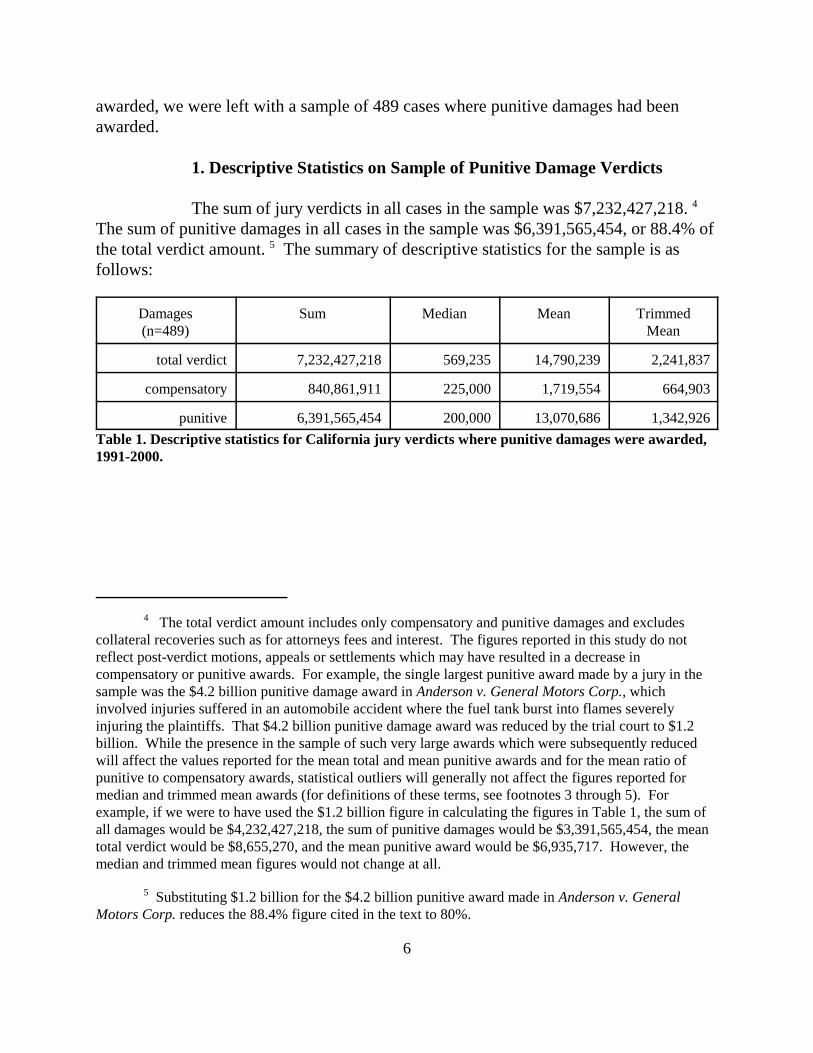
1. Descriptive Statistics on Sample of Punitive Damage Verdicts
The sum of jury verdicts in all cases in the sample was $7,232,427,218. 4 The sum of punitive damages in all cases in the sample was $6,391,565,454, or 88.4% ofthe total verdict amount. 5 The summary of descriptive statistics for the sample is asfollows:
Damages(n=489)
Sum Median Mean TrimmedMean
total verdict 7,232,427,218 569,235 14,790,239 2,241,837
compensatory 840,861,911 225,000 1,719,554 664,903
punitive 6,391,565,454 200,000 13,070,686 1,342,926
Table 1. Descriptive statistics for California jury verdicts where punitive damages were awarded,1991-2000.
6 The “mean” is a measure of the central tendency of a sample. It is the arithmetic average ofthe sample which is calculated by dividing the sum of the cases by the number of cases.
7 The “median” is the value above and below which half the cases fall (i.e., the 50th percentile). The median is a measure of central tendency not sensitive to outlying values in a skewed sample.
8 The trimmed mean figures are calculated after discarding the highest and lowest 5% of thesample. Trimmed means better reflect the central tendency of the data and are appropriate to use when asample is highly skewed (and thus non-normal). The sample of damage judgments is highly skewed in apositive direction as a result of a small number of extremely large judgments.
7
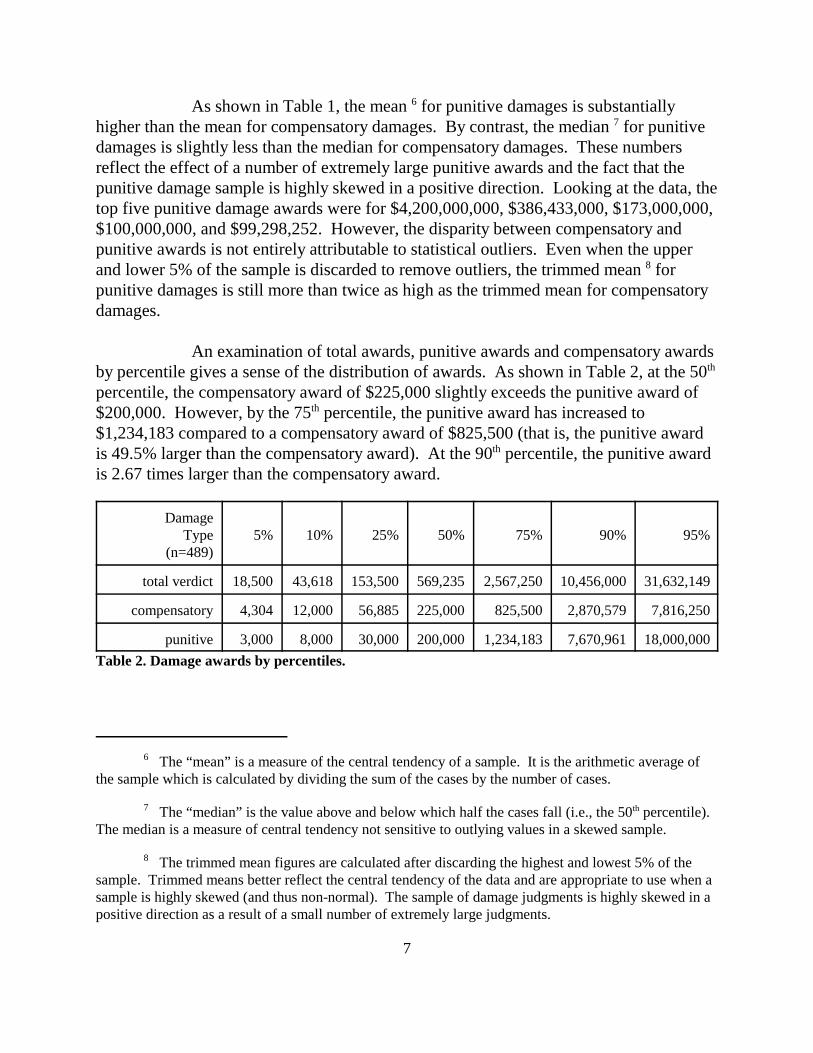
As shown in Table 1, the mean 6 for punitive damages is substantiallyhigher than the mean for compensatory damages. By contrast, the median 7 for punitivedamages is slightly less than the median for compensatory damages. These numbersreflect the effect of a number of extremely large punitive awards and the fact that thepunitive damage sample is highly skewed in a positive direction. Looking at the data, thetop five punitive damage awards were for $4,200,000,000, $386,433,000, $173,000,000,$100,000,000, and $99,298,252. However, the disparity between compensatory andpunitive awards is not entirely attributable to statistical outliers. Even when the upperand lower 5% of the sample is discarded to remove outliers, the trimmed mean 8 forpunitive damages is still more than twice as high as the trimmed mean for compensatorydamages.
An examination of total awards, punitive awards and compensatory awardsby percentile gives a sense of the distribution of awards. As shown in Table 2, at the 50th
percentile, the compensatory award of $225,000 slightly exceeds the punitive award of$200,000. However, by the 75th percentile, the punitive award has increased to$1,234,183 compared to a compensatory award of $825,500 (that is, the punitive awardis 49.5% larger than the compensatory award). At the 90th percentile, the punitive awardis 2.67 times larger than the compensatory award.
DamageType
(n=489)5% 10% 25% 50% 75% 90% 95%
total verdict 18,500 43,618 153,500 569,235 2,567,250 10,456,000 31,632,149
compensatory 4,304 12,000 56,885 225,000 825,500 2,870,579 7,816,250
punitive 3,000 8,000 30,000 200,000 1,234,183 7,670,961 18,000,000
Table 2. Damage awards by percentiles.
8
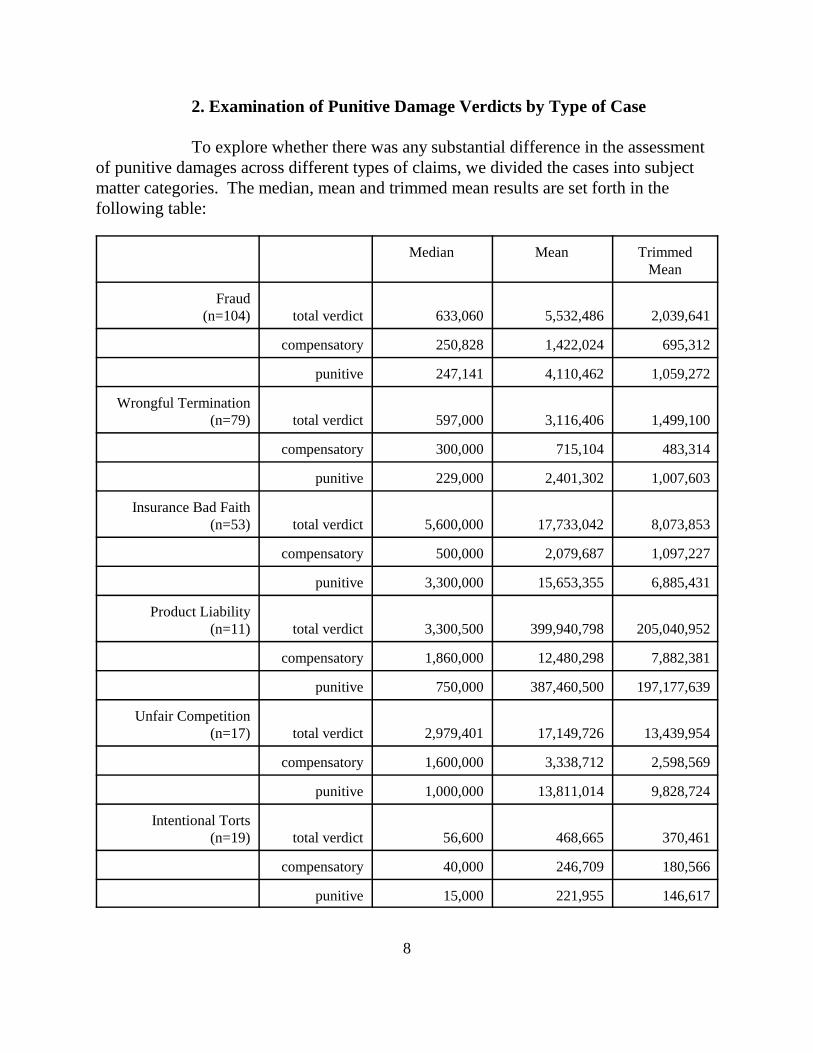
2. Examination of Punitive Damage Verdicts by Type of Case
To explore whether there was any substantial difference in the assessmentof punitive damages across different types of claims, we divided the cases into subjectmatter categories. The median, mean and trimmed mean results are set forth in thefollowing table:
Median Mean TrimmedMean
Fraud(n=104) total verdict 633,060 5,532,486 2,039,641
compensatory 250,828 1,422,024 695,312
punitive 247,141 4,110,462 1,059,272
Wrongful Termination(n=79) total verdict 597,000 3,116,406 1,499,100
compensatory 300,000 715,104 483,314
punitive 229,000 2,401,302 1,007,603
Insurance Bad Faith(n=53) total verdict 5,600,000 17,733,042 8,073,853
compensatory 500,000 2,079,687 1,097,227
punitive 3,300,000 15,653,355 6,885,431
Product Liability(n=11) total verdict 3,300,500 399,940,798 205,040,952
compensatory 1,860,000 12,480,298 7,882,381
punitive 750,000 387,460,500 197,177,639
Unfair Competition(n=17) total verdict 2,979,401 17,149,726 13,439,954
compensatory 1,600,000 3,338,712 2,598,569
punitive 1,000,000 13,811,014 9,828,724
Intentional Torts(n=19) total verdict 56,600 468,665 370,461
compensatory 40,000 246,709 180,566
punitive 15,000 221,955 146,617
9 The “other” category includes the following types of cases: medical and professionalmalpractice, vehicle negligence, premises liability, breach of fiduciary duty, employee solicitation, arson,foreclosure, wrongful death, breach of contract, construction defect, false arrest, false imprisonment, dogbite, defamation, invasion of privacy, conversion, negligence, partnership dissolution, intellectualproperty, elder abuse neglect, trade secret misappropriation, maritime, and intentional infliction ofemotional distress.
9
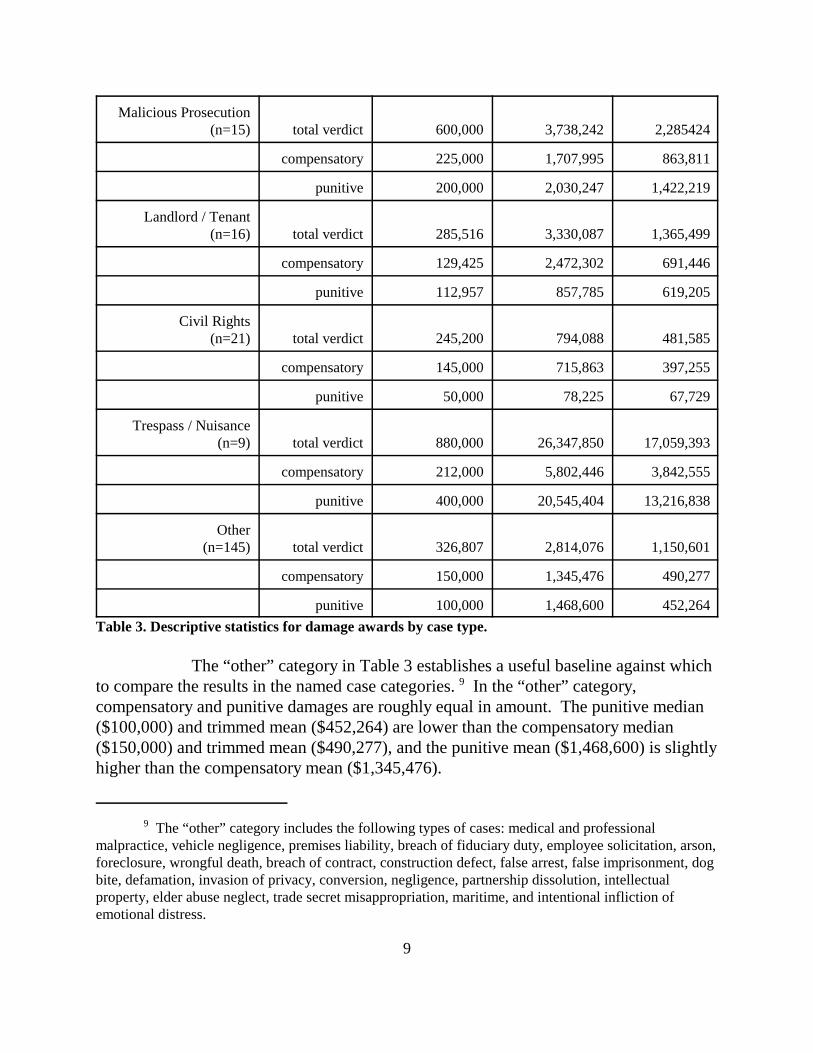
Malicious Prosecution(n=15) total verdict 600,000 3,738,242 2,285424
compensatory 225,000 1,707,995 863,811
punitive 200,000 2,030,247 1,422,219
Landlord / Tenant(n=16) total verdict 285,516 3,330,087 1,365,499
compensatory 129,425 2,472,302 691,446
punitive 112,957 857,785 619,205
Civil Rights(n=21) total verdict 245,200 794,088 481,585
compensatory 145,000 715,863 397,255
punitive 50,000 78,225 67,729
Trespass / Nuisance(n=9) total verdict 880,000 26,347,850 17,059,393
compensatory 212,000 5,802,446 3,842,555
punitive 400,000 20,545,404 13,216,838
Other(n=145) total verdict 326,807 2,814,076 1,150,601
compensatory 150,000 1,345,476 490,277
punitive 100,000 1,468,600 452,264
Table 3. Descriptive statistics for damage awards by case type.
The “other” category in Table 3 establishes a useful baseline against whichto compare the results in the named case categories. 9 In the “other” category,compensatory and punitive damages are roughly equal in amount. The punitive median($100,000) and trimmed mean ($452,264) are lower than the compensatory median($150,000) and trimmed mean ($490,277), and the punitive mean ($1,468,600) is slightlyhigher than the compensatory mean ($1,345,476).
10Although the median, means and trimmed means for punitive damages for these categories arelower than the compensatory median, mean and trimmed mean, these statistical measures are intended toreflect only the central tendency of the sample. In each of the categories, there are punitive damageawards in particular cases that are substantially greater than the compensatory award in the same case.
10
By contrast, the median, mean and trimmed mean punitive awards in the“insurance bad faith” and “trespass / nuisance” categories are higher than thecompensatory awards in those cases. In insurance bad faith cases, the median, mean andtrimmed mean punitive damage awards range from 6.3 to 7.5 times higher thancompensatory awards. In trespass / nuisance cases (which includes toxic contaminationcases), the median, mean and trimmed mean punitive damage awards range from 1.9 to3.5 times higher than compensatory awards. The fact that the median punitive award inthese two categories is higher than the median compensatory award indicates thatpunitive damages in these two categories of cases are higher than compensatory damagesin a majority of the cases within each category.
The median punitive award is lower than the median compensatory awardin every other case category. Of the remaining categories, “intentional torts,” “maliciousprosecution,” “landlord / tenant,” and “civil rights” are closest in profile to the awards inthe “other” category. In the malicious prosecution category, punitive mean and trimmedmean ($2,030,247 and $1,422,219) are only slightly larger than the compensatory meanand trimmed mean ($1,707,995 and $863,811). In the other three categories, the median,mean and trimmed mean for punitive damages are lower than the compensatory median,mean and trimmed mean. 10
In the remaining categories, “fraud,” “wrongful termination,” “productliability,” and “unfair competition,” although the median punitive award is lower than themedian compensatory award, the mean and trimmed mean punitive award is substantiallyhigher than the mean and trimmed mean compensatory award.
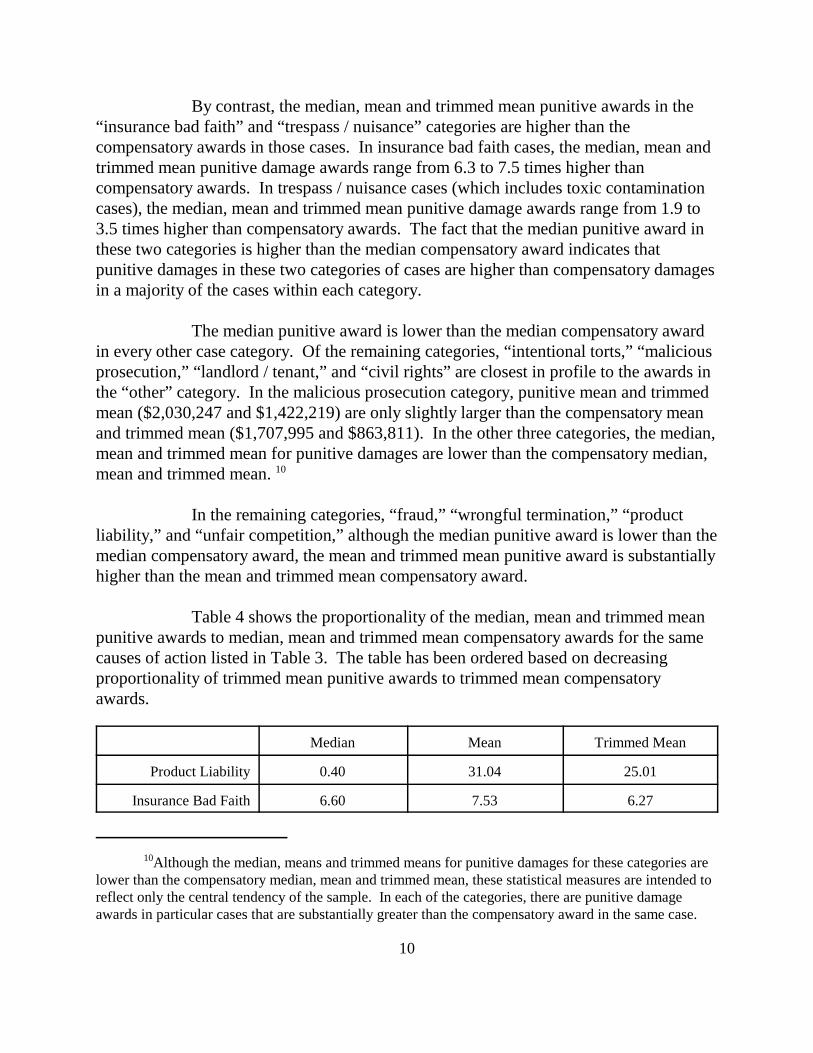
Table 4 shows the proportionality of the median, mean and trimmed meanpunitive awards to median, mean and trimmed mean compensatory awards for the samecauses of action listed in Table 3. The table has been ordered based on decreasingproportionality of trimmed mean punitive awards to trimmed mean compensatoryawards.
Median Mean Trimmed Mean
Product Liability 0.40 31.04 25.01
Insurance Bad Faith 6.60 7.53 6.27
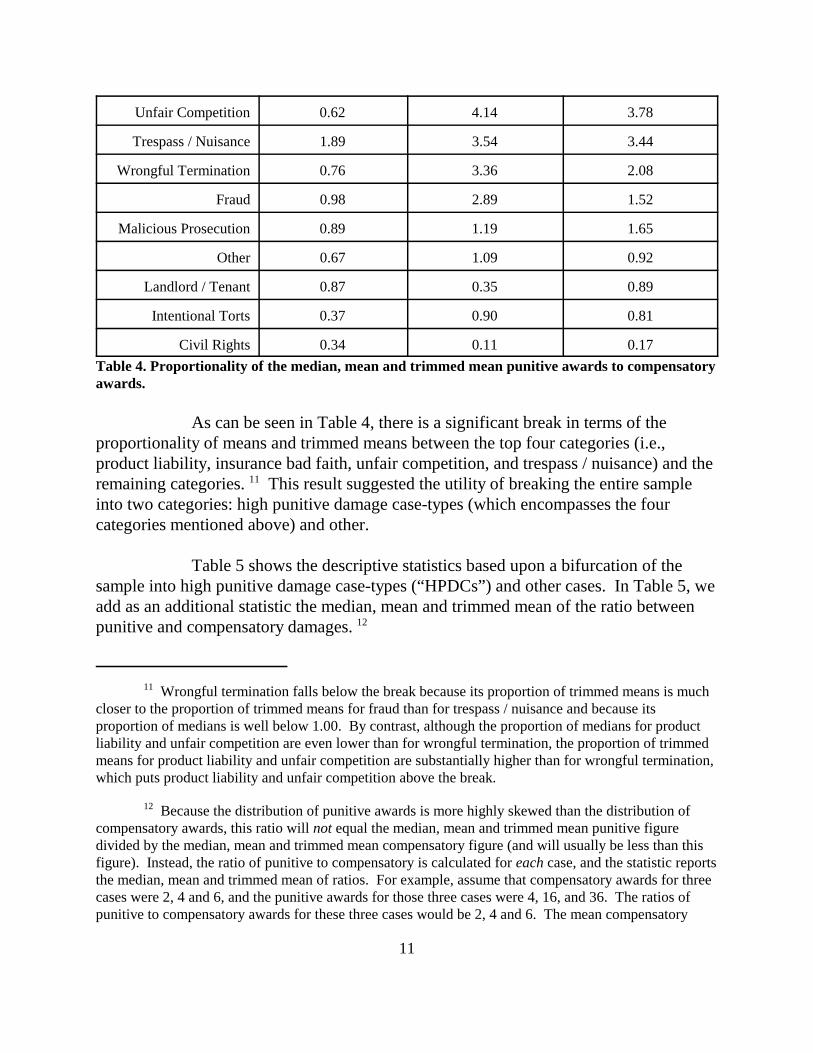
11 Wrongful termination falls below the break because its proportion of trimmed means is muchcloser to the proportion of trimmed means for fraud than for trespass / nuisance and because itsproportion of medians is well below 1.00. By contrast, although the proportion of medians for productliability and unfair competition are even lower than for wrongful termination, the proportion of trimmedmeans for product liability and unfair competition are substantially higher than for wrongful termination,which puts product liability and unfair competition above the break.
12 Because the distribution of punitive awards is more highly skewed than the distribution ofcompensatory awards, this ratio will not equal the median, mean and trimmed mean punitive figuredivided by the median, mean and trimmed mean compensatory figure (and will usually be less than thisfigure). Instead, the ratio of punitive to compensatory is calculated for each case, and the statistic reportsthe median, mean and trimmed mean of ratios. For example, assume that compensatory awards for threecases were 2, 4 and 6, and the punitive awards for those three cases were 4, 16, and 36. The ratios ofpunitive to compensatory awards for these three cases would be 2, 4 and 6. The mean compensatory
11
Unfair Competition 0.62 4.14 3.78
Trespass / Nuisance 1.89 3.54 3.44
Wrongful Termination 0.76 3.36 2.08
Fraud 0.98 2.89 1.52
Malicious Prosecution 0.89 1.19 1.65
Other 0.67 1.09 0.92
Landlord / Tenant 0.87 0.35 0.89
Intentional Torts 0.37 0.90 0.81
Civil Rights 0.34 0.11 0.17
Table 4. Proportionality of the median, mean and trimmed mean punitive awards to compensatoryawards.
As can be seen in Table 4, there is a significant break in terms of theproportionality of means and trimmed means between the top four categories (i.e.,product liability, insurance bad faith, unfair competition, and trespass / nuisance) and theremaining categories. 11 This result suggested the utility of breaking the entire sampleinto two categories: high punitive damage case-types (which encompasses the fourcategories mentioned above) and other.
Table 5 shows the descriptive statistics based upon a bifurcation of thesample into high punitive damage case-types (“HPDCs”) and other cases. In Table 5, weadd as an additional statistic the median, mean and trimmed mean of the ratio betweenpunitive and compensatory damages. 12
award for this three case sample would be 4, the mean punitive award would be 18.7, and the mean ratiowould be 4.0, even though the mean punitive figure of 18.7 is 4.67 times greater than the meancompensatory figure of 4.0.
12
Damages Sum Median Mean Trimmed Mean
HPDC(n=90) total verdict 5,867,876,018 3,326,484 65,198,622 9,492,512
compensatory 356,486,834 772,500 3,960,965 1,672,319
punitive 5,511,389,220 2,125,000 61,237,658 7,581,585
ratio of punitiveto compensatory
3.51 11.19 9.05
Other(n=399) total verdict 1,364,551,196 440,000 3,419,928 1,229,903
compensatory 484,375,079 200,000 1,213,973 493,038
punitive 880,176,121 133,286 2,205,955 634,366
ratio of punitiveto compensatory
0.87 4.95 1.76
Table 5. Descriptive statistics for “high punitive damage case-types” and other cases.
The are substantial differences between HPDCs and other cases. Althoughthere are 4.43 times as many other cases as HPDC cases, the total sums awarded inHPDC cases in the sample is 4.30 times higher than the total sums awarded in othercases. The sum of compensatory damages in other cases ($484,375,079) is slightly largerthan the sum of compensatory damages in HPDC cases ($356,486,834). But the lowersum of compensatory awards in HPDC cases is more than offset by the sum of punitiveawards in HPDC cases, which is 6.26 times higher than the sum of punitive awards inother cases.
The median, mean and trimmed mean of compensatory damages in HPDCcases is substantially higher than in other cases. The median is 3.86 times higher, themean is 3.26 times higher and the trimmed mean is 3.39 times higher. The differencesbetween punitive damages in HPDC cases and punitive damages in other cases is muchgreater. The median is 15.94 times higher, the mean is 27.76 times higher and thetrimmed mean is 11.95 times higher.
13As noted above in footnote 10, these statistical measures reflect the central tendency of thesample. Even within the “other” category, there are individual cases where punitive damages aresubstantially in excess of compensatory damages. Indeed, in 17% of the “other” cases, punitive damagesare more than 3 times greater than compensatory damages, and in 7% of the cases, punitive damages aremore than 10 times greater than compensatory damages.
13
The ratios of punitive to compensatory damages within the other casescategory indicate that punitive damages in most of these cases are roughly equal to orless than compensatory damages, and that even when the extremely high awards aretaken into account, the ratio of punitive to compensatory is still relatively small. Thus,the median ratio is 0.87, the mean ratio is 4.95, and the trimmed mean ratio is 1.76. 13
By contrast, the ratios of punitive damages to compensatory damages inHPDC cases indicates that punitive damages in most of these cases are between 3 and 4times greater than compensatory awards, and that there are a substantial number ofpunitive awards that are much higher than compensatory awards. Thus, the median ratiois 3.51, the mean ratio is 11.19, and the trimmed mean ratio is 9.05.
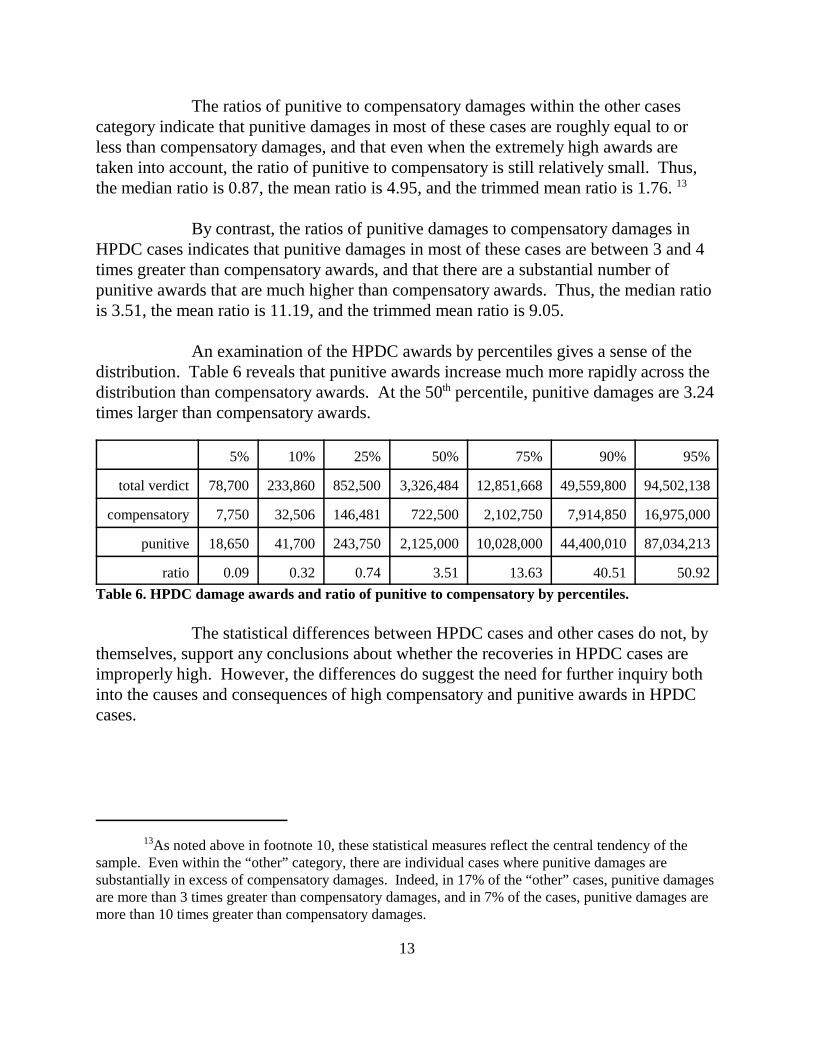
An examination of the HPDC awards by percentiles gives a sense of thedistribution. Table 6 reveals that punitive awards increase much more rapidly across thedistribution than compensatory awards. At the 50th percentile, punitive damages are 3.24times larger than compensatory awards.
5% 10% 25% 50% 75% 90% 95%
total verdict 78,700 233,860 852,500 3,326,484 12,851,668 49,559,800 94,502,138
compensatory 7,750 32,506 146,481 722,500 2,102,750 7,914,850 16,975,000
punitive 18,650 41,700 243,750 2,125,000 10,028,000 44,400,010 87,034,213
ratio 0.09 0.32 0.74 3.51 13.63 40.51 50.92
Table 6. HPDC damage awards and ratio of punitive to compensatory by percentiles.
The statistical differences between HPDC cases and other cases do not, bythemselves, support any conclusions about whether the recoveries in HPDC cases areimproperly high. However, the differences do suggest the need for further inquiry bothinto the causes and consequences of high compensatory and punitive awards in HPDCcases.
14
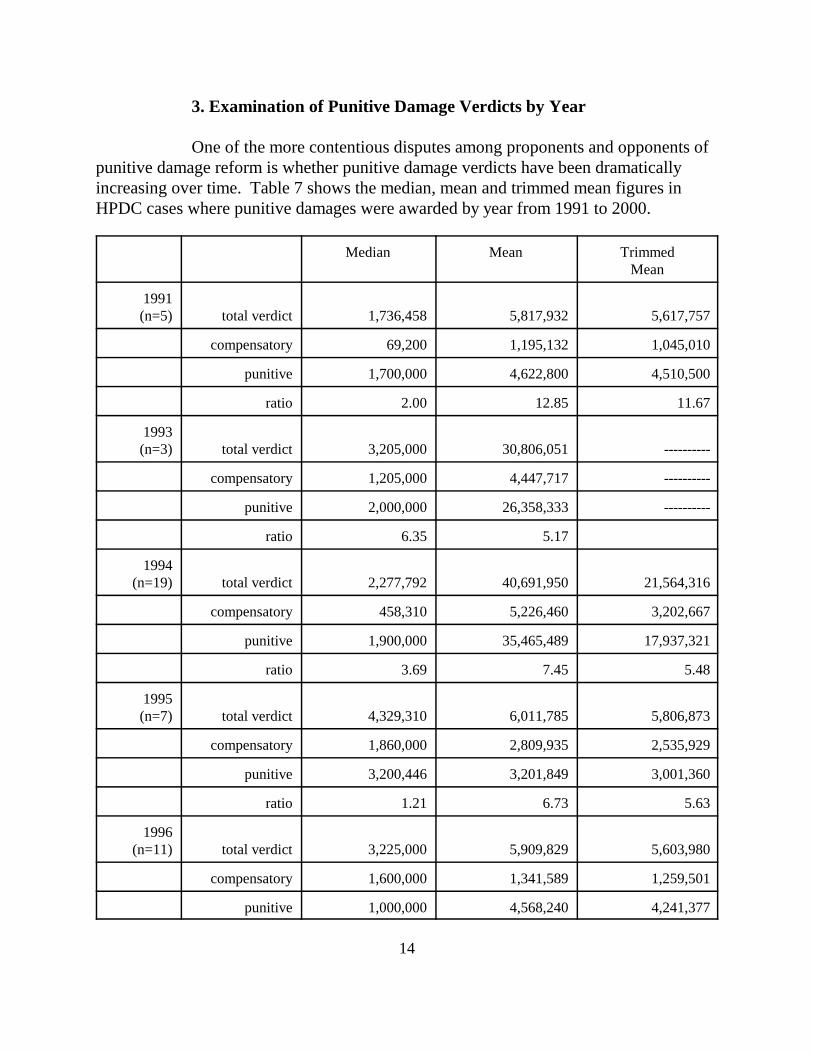
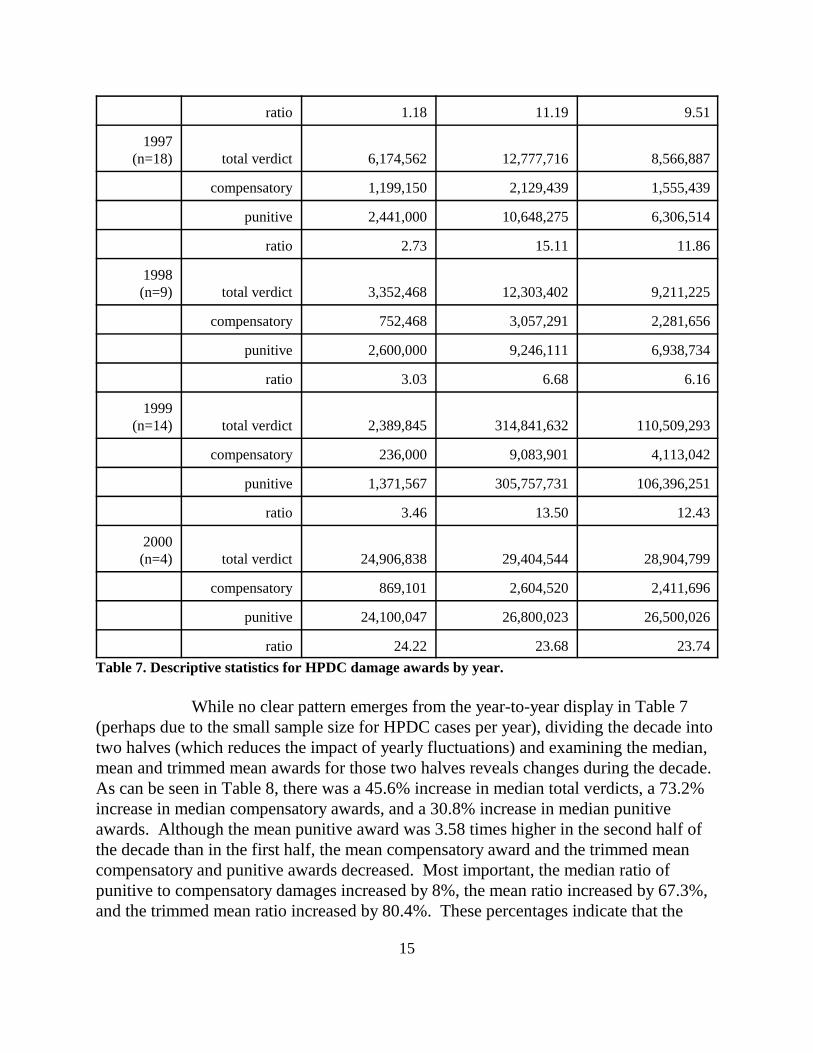
3. Examination of Punitive Damage Verdicts by Year
One of the more contentious disputes among proponents and opponents ofpunitive damage reform is whether punitive damage verdicts have been dramaticallyincreasing over time. Table 7 shows the median, mean and trimmed mean figures inHPDC cases where punitive damages were awarded by year from 1991 to 2000.
Median Mean TrimmedMean
1991(n=5) total verdict 1,736,458 5,817,932 5,617,757
compensatory 69,200 1,195,132 1,045,010
punitive 1,700,000 4,622,800 4,510,500
ratio 2.00 12.85 11.67
1993(n=3) total verdict 3,205,000 30,806,051 ----------
compensatory 1,205,000 4,447,717 ----------
punitive 2,000,000 26,358,333 ----------
ratio 6.35 5.17
1994(n=19) total verdict 2,277,792 40,691,950 21,564,316
compensatory 458,310 5,226,460 3,202,667
punitive 1,900,000 35,465,489 17,937,321
ratio 3.69 7.45 5.48
1995(n=7) total verdict 4,329,310 6,011,785 5,806,873
compensatory 1,860,000 2,809,935 2,535,929
punitive 3,200,446 3,201,849 3,001,360
ratio 1.21 6.73 5.63
1996(n=11) total verdict 3,225,000 5,909,829 5,603,980
compensatory 1,600,000 1,341,589 1,259,501
punitive 1,000,000 4,568,240 4,241,377
15
ratio 1.18 11.19 9.51
1997(n=18) total verdict 6,174,562 12,777,716 8,566,887
compensatory 1,199,150 2,129,439 1,555,439
punitive 2,441,000 10,648,275 6,306,514
ratio 2.73 15.11 11.86
1998(n=9) total verdict 3,352,468 12,303,402 9,211,225
compensatory 752,468 3,057,291 2,281,656
punitive 2,600,000 9,246,111 6,938,734
ratio 3.03 6.68 6.16
1999(n=14) total verdict 2,389,845 314,841,632 110,509,293
compensatory 236,000 9,083,901 4,113,042
punitive 1,371,567 305,757,731 106,396,251
ratio 3.46 13.50 12.43
2000(n=4) total verdict 24,906,838 29,404,544 28,904,799
compensatory 869,101 2,604,520 2,411,696
punitive 24,100,047 26,800,023 26,500,026
ratio 24.22 23.68 23.74
Table 7. Descriptive statistics for HPDC damage awards by year.
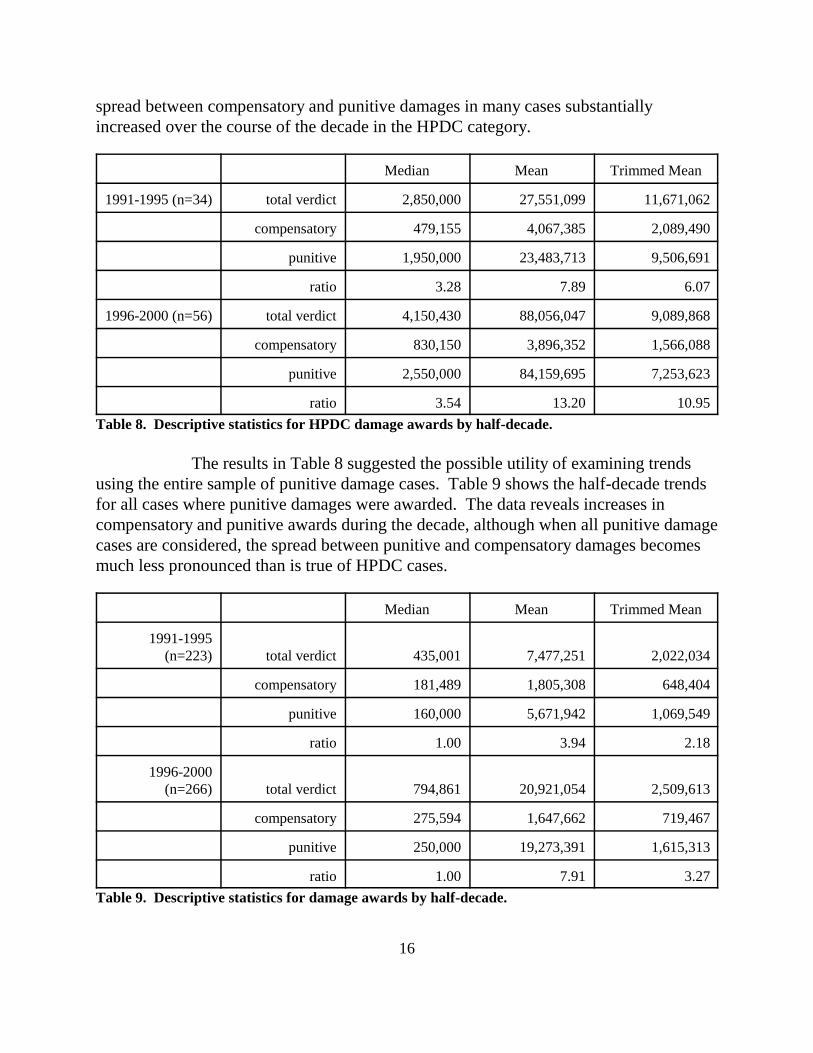
While no clear pattern emerges from the year-to-year display in Table 7(perhaps due to the small sample size for HPDC cases per year), dividing the decade intotwo halves (which reduces the impact of yearly fluctuations) and examining the median,mean and trimmed mean awards for those two halves reveals changes during the decade. As can be seen in Table 8, there was a 45.6% increase in median total verdicts, a 73.2%increase in median compensatory awards, and a 30.8% increase in median punitiveawards. Although the mean punitive award was 3.58 times higher in the second half ofthe decade than in the first half, the mean compensatory award and the trimmed meancompensatory and punitive awards decreased. Most important, the median ratio ofpunitive to compensatory damages increased by 8%, the mean ratio increased by 67.3%,and the trimmed mean ratio increased by 80.4%. These percentages indicate that the
16
spread between compensatory and punitive damages in many cases substantiallyincreased over the course of the decade in the HPDC category.
Median Mean Trimmed Mean
1991-1995 (n=34) total verdict 2,850,000 27,551,099 11,671,062
compensatory 479,155 4,067,385 2,089,490
punitive 1,950,000 23,483,713 9,506,691
ratio 3.28 7.89 6.07
1996-2000 (n=56) total verdict 4,150,430 88,056,047 9,089,868
compensatory 830,150 3,896,352 1,566,088
punitive 2,550,000 84,159,695 7,253,623
ratio 3.54 13.20 10.95
Table 8. Descriptive statistics for HPDC damage awards by half-decade.
The results in Table 8 suggested the possible utility of examining trendsusing the entire sample of punitive damage cases. Table 9 shows the half-decade trendsfor all cases where punitive damages were awarded. The data reveals increases incompensatory and punitive awards during the decade, although when all punitive damagecases are considered, the spread between punitive and compensatory damages becomesmuch less pronounced than is true of HPDC cases.
Median Mean Trimmed Mean
1991-1995(n=223) total verdict 435,001 7,477,251 2,022,034
compensatory 181,489 1,805,308 648,404
punitive 160,000 5,671,942 1,069,549
ratio 1.00 3.94 2.18
1996-2000(n=266) total verdict 794,861 20,921,054 2,509,613
compensatory 275,594 1,647,662 719,467
punitive 250,000 19,273,391 1,615,313
ratio 1.00 7.91 3.27
Table 9. Descriptive statistics for damage awards by half-decade.
17
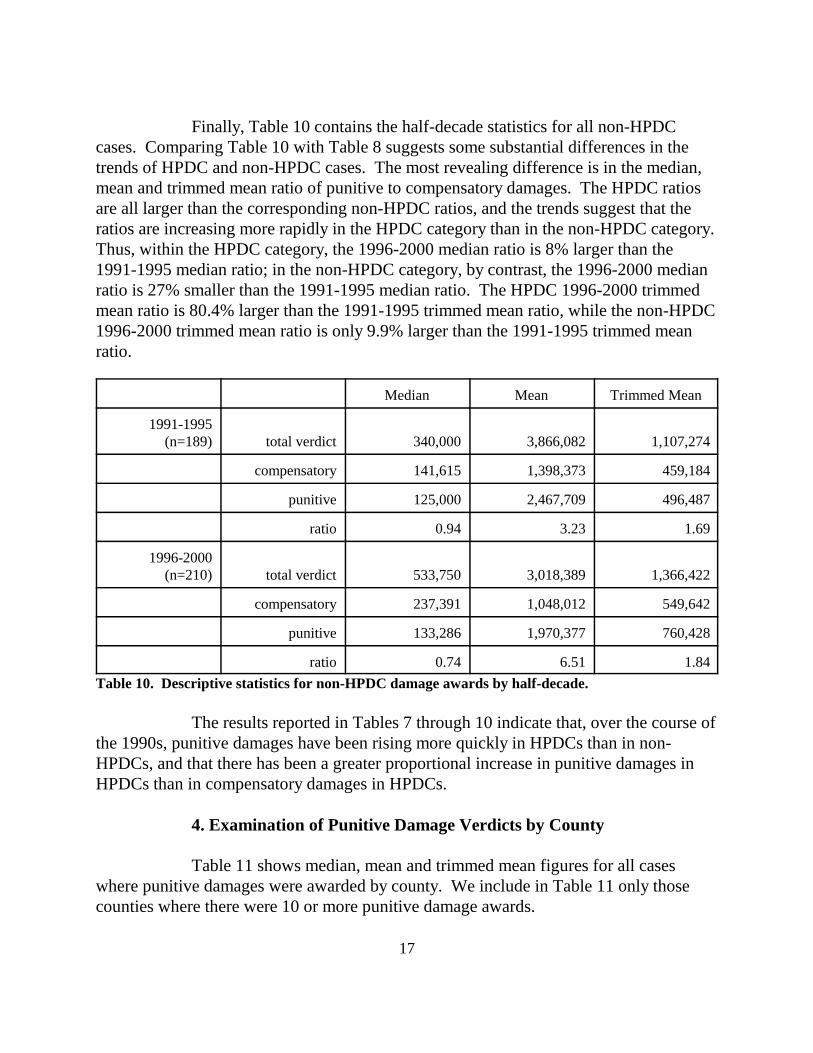
Finally, Table 10 contains the half-decade statistics for all non-HPDCcases. Comparing Table 10 with Table 8 suggests some substantial differences in thetrends of HPDC and non-HPDC cases. The most revealing difference is in the median,mean and trimmed mean ratio of punitive to compensatory damages. The HPDC ratiosare all larger than the corresponding non-HPDC ratios, and the trends suggest that theratios are increasing more rapidly in the HPDC category than in the non-HPDC category. Thus, within the HPDC category, the 1996-2000 median ratio is 8% larger than the1991-1995 median ratio; in the non-HPDC category, by contrast, the 1996-2000 medianratio is 27% smaller than the 1991-1995 median ratio. The HPDC 1996-2000 trimmedmean ratio is 80.4% larger than the 1991-1995 trimmed mean ratio, while the non-HPDC1996-2000 trimmed mean ratio is only 9.9% larger than the 1991-1995 trimmed meanratio.
Median Mean Trimmed Mean
1991-1995(n=189) total verdict 340,000 3,866,082 1,107,274
compensatory 141,615 1,398,373 459,184
punitive 125,000 2,467,709 496,487
ratio 0.94 3.23 1.69
1996-2000(n=210) total verdict 533,750 3,018,389 1,366,422
compensatory 237,391 1,048,012 549,642
punitive 133,286 1,970,377 760,428
ratio 0.74 6.51 1.84
Table 10. Descriptive statistics for non-HPDC damage awards by half-decade.
The results reported in Tables 7 through 10 indicate that, over the course ofthe 1990s, punitive damages have been rising more quickly in HPDCs than in non-HPDCs, and that there has been a greater proportional increase in punitive damages inHPDCs than in compensatory damages in HPDCs.
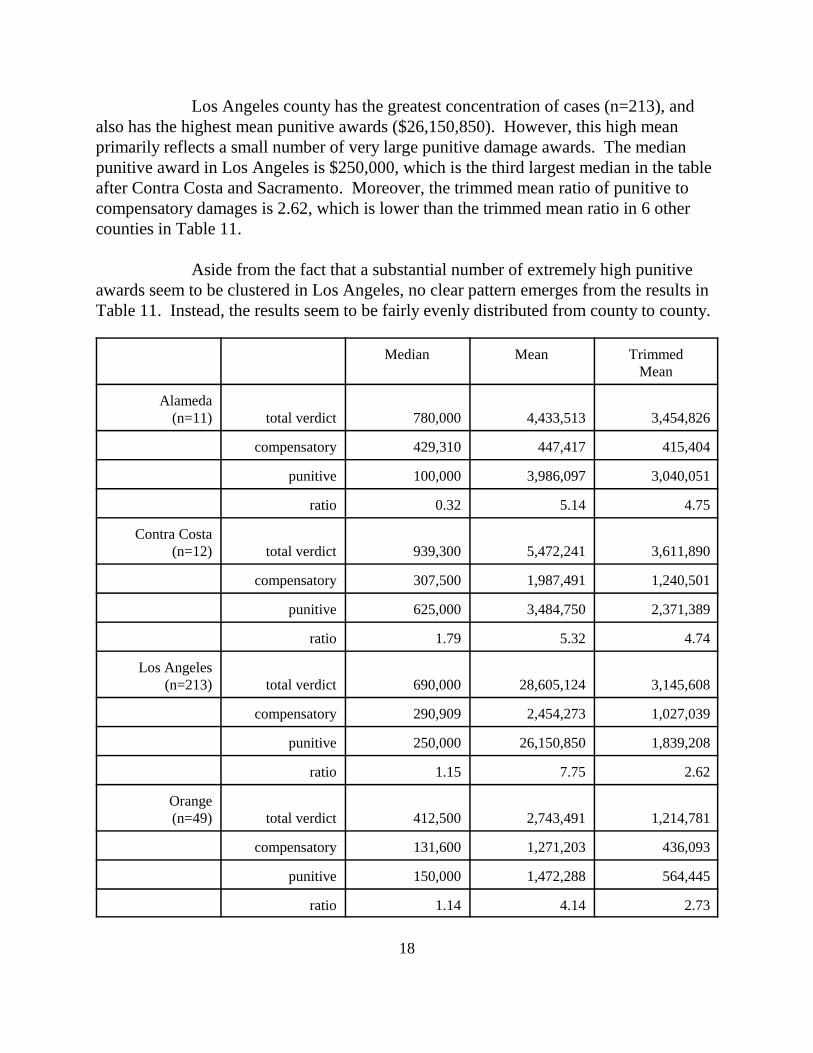
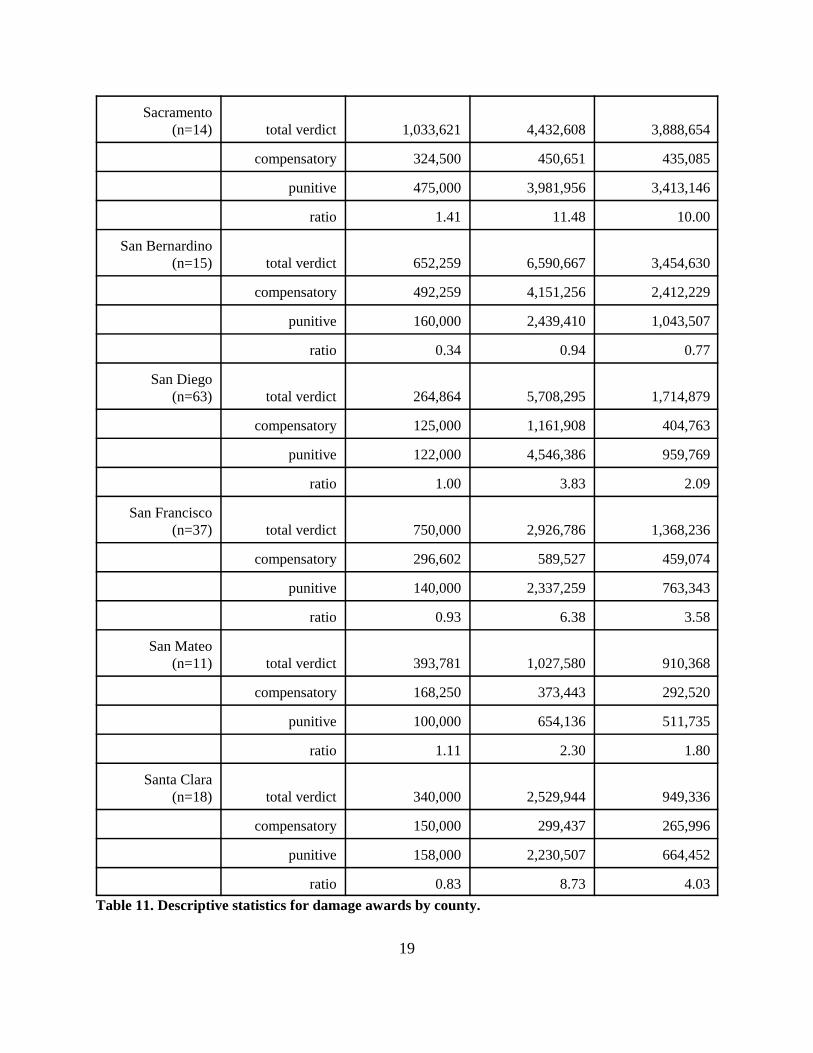
4. Examination of Punitive Damage Verdicts by County
Table 11 shows median, mean and trimmed mean figures for all caseswhere punitive damages were awarded by county. We include in Table 11 only thosecounties where there were 10 or more punitive damage awards.
18
Los Angeles county has the greatest concentration of cases (n=213), andalso has the highest mean punitive awards ($26,150,850). However, this high meanprimarily reflects a small number of very large punitive damage awards. The medianpunitive award in Los Angeles is $250,000, which is the third largest median in the tableafter Contra Costa and Sacramento. Moreover, the trimmed mean ratio of punitive tocompensatory damages is 2.62, which is lower than the trimmed mean ratio in 6 othercounties in Table 11.
Aside from the fact that a substantial number of extremely high punitiveawards seem to be clustered in Los Angeles, no clear pattern emerges from the results inTable 11. Instead, the results seem to be fairly evenly distributed from county to county.
Median Mean TrimmedMean
Alameda(n=11) total verdict 780,000 4,433,513 3,454,826
compensatory 429,310 447,417 415,404
punitive 100,000 3,986,097 3,040,051
ratio 0.32 5.14 4.75
Contra Costa(n=12) total verdict 939,300 5,472,241 3,611,890
compensatory 307,500 1,987,491 1,240,501
punitive 625,000 3,484,750 2,371,389
ratio 1.79 5.32 4.74
Los Angeles(n=213) total verdict 690,000 28,605,124 3,145,608
compensatory 290,909 2,454,273 1,027,039
punitive 250,000 26,150,850 1,839,208
ratio 1.15 7.75 2.62
Orange(n=49) total verdict 412,500 2,743,491 1,214,781
compensatory 131,600 1,271,203 436,093
punitive 150,000 1,472,288 564,445
ratio 1.14 4.14 2.73
19
Sacramento(n=14) total verdict 1,033,621 4,432,608 3,888,654
compensatory 324,500 450,651 435,085
punitive 475,000 3,981,956 3,413,146
ratio 1.41 11.48 10.00
San Bernardino(n=15) total verdict 652,259 6,590,667 3,454,630
compensatory 492,259 4,151,256 2,412,229
punitive 160,000 2,439,410 1,043,507
ratio 0.34 0.94 0.77
San Diego(n=63) total verdict 264,864 5,708,295 1,714,879
compensatory 125,000 1,161,908 404,763
punitive 122,000 4,546,386 959,769
ratio 1.00 3.83 2.09
San Francisco(n=37) total verdict 750,000 2,926,786 1,368,236
compensatory 296,602 589,527 459,074
punitive 140,000 2,337,259 763,343
ratio 0.93 6.38 3.58
San Mateo(n=11) total verdict 393,781 1,027,580 910,368
compensatory 168,250 373,443 292,520
punitive 100,000 654,136 511,735
ratio 1.11 2.30 1.80
Santa Clara(n=18) total verdict 340,000 2,529,944 949,336
compensatory 150,000 299,437 265,996
punitive 158,000 2,230,507 664,452
ratio 0.83 8.73 4.03
Table 11. Descriptive statistics for damage awards by county.
20
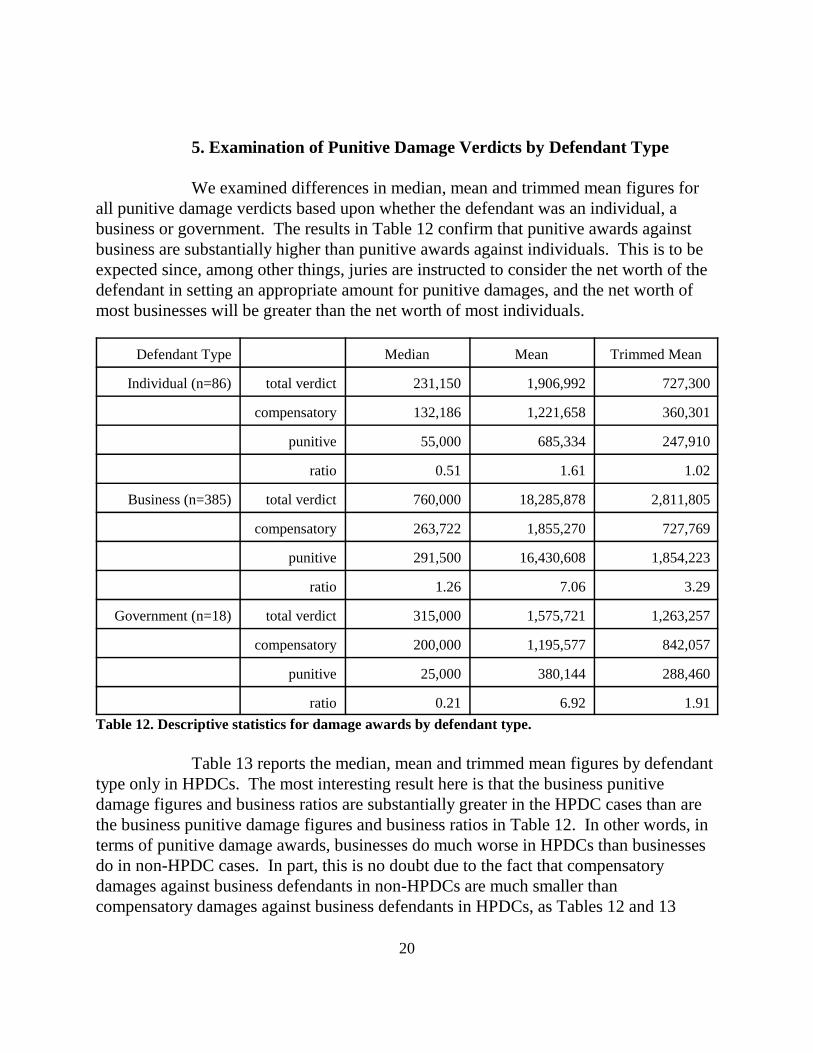
5. Examination of Punitive Damage Verdicts by Defendant Type
We examined differences in median, mean and trimmed mean figures forall punitive damage verdicts based upon whether the defendant was an individual, abusiness or government. The results in Table 12 confirm that punitive awards againstbusiness are substantially higher than punitive awards against individuals. This is to beexpected since, among other things, juries are instructed to consider the net worth of thedefendant in setting an appropriate amount for punitive damages, and the net worth ofmost businesses will be greater than the net worth of most individuals.
Defendant Type Median Mean Trimmed Mean
Individual (n=86) total verdict 231,150 1,906,992 727,300
compensatory 132,186 1,221,658 360,301
punitive 55,000 685,334 247,910
ratio 0.51 1.61 1.02
Business (n=385) total verdict 760,000 18,285,878 2,811,805
compensatory 263,722 1,855,270 727,769
punitive 291,500 16,430,608 1,854,223
ratio 1.26 7.06 3.29
Government (n=18) total verdict 315,000 1,575,721 1,263,257
compensatory 200,000 1,195,577 842,057
punitive 25,000 380,144 288,460
ratio 0.21 6.92 1.91
Table 12. Descriptive statistics for damage awards by defendant type.
Table 13 reports the median, mean and trimmed mean figures by defendanttype only in HPDCs. The most interesting result here is that the business punitivedamage figures and business ratios are substantially greater in the HPDC cases than arethe business punitive damage figures and business ratios in Table 12. In other words, interms of punitive damage awards, businesses do much worse in HPDCs than businessesdo in non-HPDC cases. In part, this is no doubt due to the fact that compensatorydamages against business defendants in non-HPDCs are much smaller thancompensatory damages against business defendants in HPDCs, as Tables 12 and 13
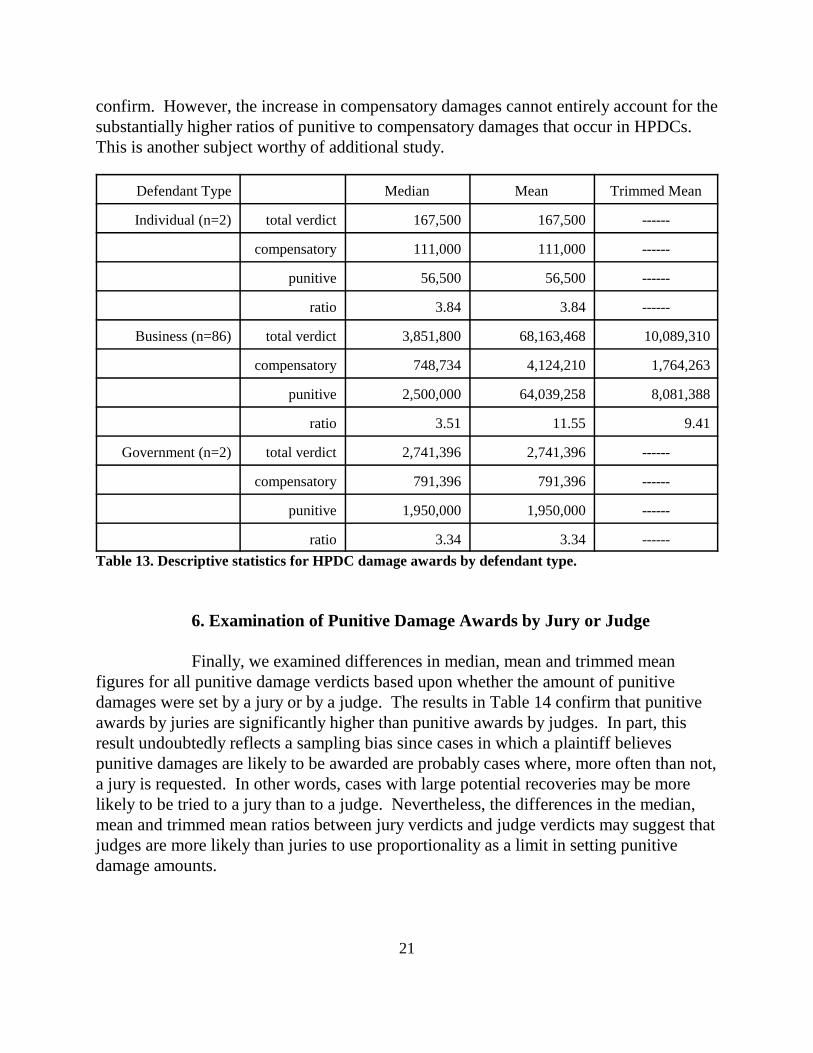
21
confirm. However, the increase in compensatory damages cannot entirely account for thesubstantially higher ratios of punitive to compensatory damages that occur in HPDCs. This is another subject worthy of additional study.
Defendant Type Median Mean Trimmed Mean
Individual (n=2) total verdict 167,500 167,500 ------
compensatory 111,000 111,000 ------
punitive 56,500 56,500 ------
ratio 3.84 3.84 ------
Business (n=86) total verdict 3,851,800 68,163,468 10,089,310
compensatory 748,734 4,124,210 1,764,263
punitive 2,500,000 64,039,258 8,081,388
ratio 3.51 11.55 9.41
Government (n=2) total verdict 2,741,396 2,741,396 ------
compensatory 791,396 791,396 ------
punitive 1,950,000 1,950,000 ------
ratio 3.34 3.34 ------
Table 13. Descriptive statistics for HPDC damage awards by defendant type.
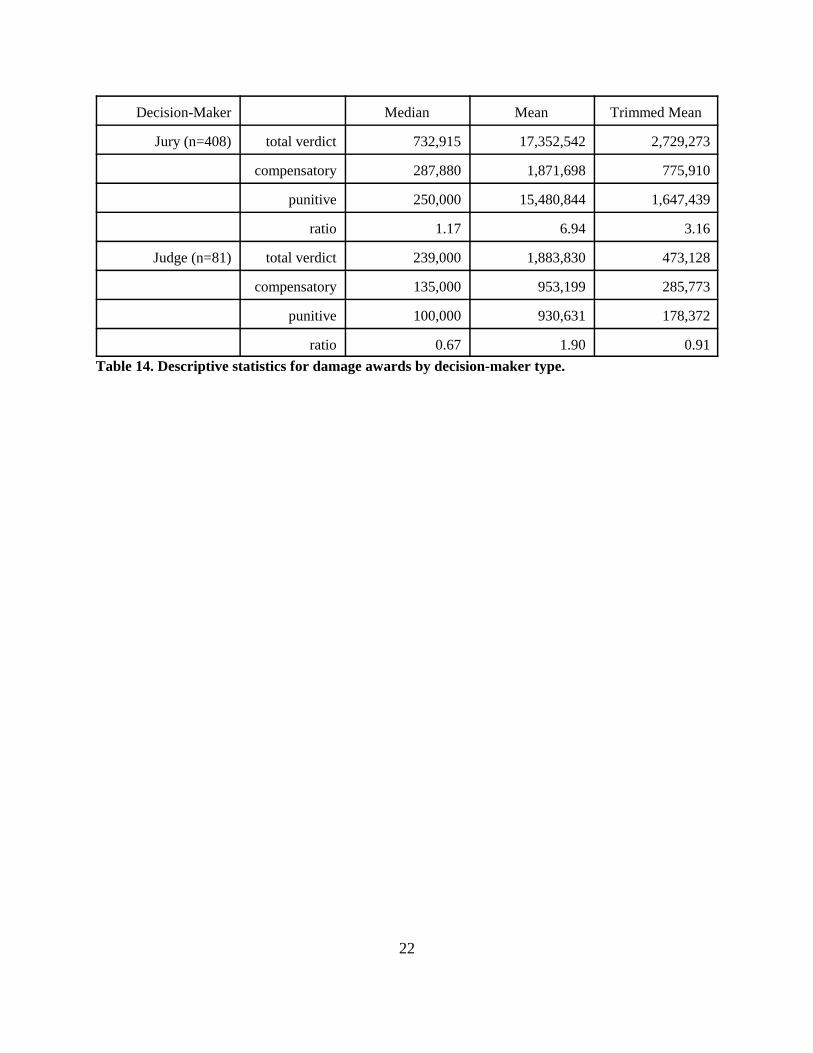
6. Examination of Punitive Damage Awards by Jury or Judge
Finally, we examined differences in median, mean and trimmed meanfigures for all punitive damage verdicts based upon whether the amount of punitivedamages were set by a jury or by a judge. The results in Table 14 confirm that punitiveawards by juries are significantly higher than punitive awards by judges. In part, thisresult undoubtedly reflects a sampling bias since cases in which a plaintiff believespunitive damages are likely to be awarded are probably cases where, more often than not,a jury is requested. In other words, cases with large potential recoveries may be morelikely to be tried to a jury than to a judge. Nevertheless, the differences in the median,mean and trimmed mean ratios between jury verdicts and judge verdicts may suggest thatjudges are more likely than juries to use proportionality as a limit in setting punitivedamage amounts.
22
Decision-Maker Median Mean Trimmed Mean
Jury (n=408) total verdict 732,915 17,352,542 2,729,273
compensatory 287,880 1,871,698 775,910
punitive 250,000 15,480,844 1,647,439
ratio 1.17 6.94 3.16
Judge (n=81) total verdict 239,000 1,883,830 473,128
compensatory 135,000 953,199 285,773
punitive 100,000 930,631 178,372
ratio 0.67 1.90 0.91
Table 14. Descriptive statistics for damage awards by decision-maker type.