an analysis of the quality of the health data in the panel study of income dynamics
TRANSCRIPT

Technical Series Paper #07-04
An Analysis of the Quality of the Health Data in the Panel Study of Income Dynamics
Patricia Andreski, Katherine McGonagle, & Robert Schoeni
Survey Research Center - Institute for Social Research University of Michigan
Updated November 6, 2007
This project was supported by funding from the National Institute on Aging (R01-AG019802).

AN ANALYSIS OF THE QUALITY OF THE HEALTH DATA IN THE PANEL STUDY OF INCOME DYNAMICS
Patricia Andreski, Katherine McGonagle, and Bob Schoeni
updated November 6, 2007
I. INTRODUCTION In recent years the Panel Study of Income Dynamics (PSID) has expanded the set of health
related questions. Currently nearly 18 minutes of the 80-minute questionnaire is devoted to health status, health conditions, health behaviors, health insurance, and health care expenditures. These additions have uniquely positioned the PSID to enhance our understanding of the life course effects of early and mid-life circumstances on health, economic well-being, and mortality in later life. The PSID is poised to become the only data ever collected on life course and multigenerational health in a long-term panel representative of the full U.S. population.
The objective of this report is to provide an initial assessment of the quality of the health data that have been collected thus far. Specifically, the report compares estimates of health in the PSID with estimates from the most widely used nationally representative health survey, the National Health Interview Survey (NHIS). The PSID and NHIS are compared on three dimensions: the extent of item non-response, prevalence of various health outcomes, and parameter estimates of the effects of socio-demographic factors on health status.
We begin the report by briefly summarizing the health information that has been collected throughout the 39-year history of the PSID, which is quite extensive. The subsequent section discusses measures of health that will be compared between the two surveys, with a focus on the specific question wording for each measure. The estimates in each survey are then discussed. In general, we find that the two surveys align fairly closely.
II. OVERVIEW OF HEALTH DATA IN THE PSID The PSID began to expand its health content in the 1990s. As shown in Table 1, a wide
array of data on health status, health conditions, health insurance, health behaviors, and health care costs are currently being collected. However, several health-related questions have been asked at various points in the more distant past, with some items collected in each and every year since the survey began in 1968. The data have been relatively underutilized, offering the unique opportunity to study changes in health, and the causes and effects of health on various socio-economic outcomes.
As an example, height, weight, smoking, and alcohol consumption were collected in 1986, and then beginning in 1999 they have been asked in each wave through the collection of 2007 data (being collected through the calendar year 2007). These data allow assessments of changes in these outcomes over a 20+-year period, which is not possible in any other national panel dataset. Moreover, because the PSID identifies respondents who die between waves, mortality over the 39-year history can be examined for over 5,000 panel members who have become decedents. A measure of emotional distress in the past 30 days (K6; Kessler et al. 2003) that is also included in the NHIS was added to the PSID in 2001 and 2003, and has been continued as of 2007. In sum, the PSID is best known for research on the dynamics of income, employment, and poverty. However, the PSID has tremendous potential to examine many health-related questions.
III. THE SURVEYS We compare data collected from the PSID over four waves, 1999, 2001, 2003, and 2005
with the same years of the NHIS (2007 data from the 35th of the PSID is being collected as of this writing). The NHIS consists of a nationally representative sample of the civilian
1

noninstitutionalized population. The survey collects basic health and demographic information for all household members. More detailed health information is collected for one sample adult aged 18 or older and one sample child aged 0-17 per family.
The PSID is a nationally representative panel study that began in 1968. Families were interviewed annually until 1997, and biennially thereafter. A sample of immigrants was added in 1997 to make the sample representative of families who arrived in the US after the PSID began in 1968. Most of the health questions are asked of the head and wife. The sample of heads and wives is representative of the national adult population.
It is beyond the scope of this report to examine each and every one of the dozens of health-related measures; therefore, we focus on several of the most salient items. Fourteen items are compared. The health status measures examined include height, weight, work limitation, 30-day emotional distress, six specific conditions (stroke, hypertension, diabetes, cancer, myocardial infarction, and asthma), and self-rated general health (excellent, very good, good, fair, and poor). In addition, whether the person currently smokes, has ever smoked, and whether they have health insurance are compared between the two surveys.
Table 2 reports the exact question wording used in each of the two surveys. The questions are almost identical for most measures, particularly for height, weight, work limitation, 30-day emotional distress, health conditions, and self-rated general health. NHIS explicitly asks respondents their height and weight without their shoes, so we might expect to see slightly higher values in the PSID. For doctor diagnosed conditions, NHIS includes not only doctors but “other health professionals,” which might also lead to a slightly higher prevalence in the NHIS. The NHIS’s question on work limitation includes “emotional problems” as a cause, while PSID does not, although it does include “nervous condition.”
Smoking and health insurance are not as similar in the two surveys. The NHIS has a threshold of 100 cigarettes in order for someone to be considered having ever smoked, while the PSID does not. For current smoking behavior, the PSID simply asks whether they smoke now. The NHIS asks people how often they smoke cigarettes, with one option being “not at all;” we code people with this response as not currently smoking.
All statistics shown in the report utilize the weights available in each survey. IV. RESULTS Based on the data from three waves of data collected from the NHIS and PSID in 1999,
2001, 2003, and 2005, the analysis addresses three issues: comparisons of non-response rates; comparisons of prevalence estimates; comparability of parameter estimates in multivariate models. In this section we report our findings on each issue in turn.
Item Non-Response Table 3 reports estimates of item non-response in PSID and NHIS, 1999-2005. Item non-
response includes responses of “not ascertained” (NA), “refused” (RF), or “don’t know” (DK). In addition, NHIS occasionally uses the code “not available” for unknown observations. All unknowns are coded separately in NHIS. Contrary to NHIS, PSID usually gives the same code to NA and RF. To make comparison meaningful we combined together NA, RF and “not available” observations in NHIS. Note also that the question on smoking was excluded from this analysis since there is no direct correspondence between NHIS and PSID on these measures.
Across the four waves of data collected 1999, 2001, 2003, and 2005, we find that item non-response is low in the PSID, with never more than 1% of the sample not providing answers. The only exception is for weight, which had an item non-response rate ranging from 2.2% in 1999 to 3.1% in 2003. However, in the NHIS the non-response rate for weight, and most other measures, was much higher, ranging from 8.4% in 1999 to 4.5% in 2003. The low item non-response in the PSID is likely due to the fact that many of the PSID respondents have been
2

interviewed for many years, and they have been convinced that the study leads to valuable research and their identity will be kept secure.
Estimates of health status, health behaviors, and health insurance Table 4 reports the estimates of health measures in the two surveys. Despite the slight
differences in question wording, estimates of smoking, health insurance coverage, and obesity are very similar between NHIS and PSID. Rates of obesity in the adult population are nearly identical in the two studies across all four waves of data collection, ranging from 21-25 percent. Figure 1 examines the estimates more closely by providing estimates of the full distribution of height and weight in 2005. Both PSID and NHIS measures are based on self-report. For each measure, the two distributions are very similar.
The share whose is not work limited is higher in the NHIS consistently across all four waves, which is not what would be expected given the slight differences in the questions. In general, the prevalence of the specific conditions aligns fairly closely. There is a substantial increase in the percent of the adult population reporting asthma between 1999 and 2001 in both studies, although the rise in 2001 is higher in the NHIS. The rates of hypertension are nearly identical in the two studies and show a modest increase as they rise from 22 percent to between 26 -27 percent 1999-2005. Rates of serious mental illness as assessed by the K6 are nearly identical in 2001 while PSID finds a substantial increase in 2003, compared to NHIS.
The PSID finds fewer people reporting themselves in excellent health relative to the NHIS. While 29-32 percent of the adult population is in excellent health according to the NHIS, the estimate is only approximately 19-23 percent according to PSID.
We investigated several potential explanations for this difference. First, we compared the demographic characteristics of the weighted populations. As shown in Table 5, the gender and racial composition of the samples are quite similar. However, the PSID is slightly older. Therefore, we examined age-specific estimates of self-rated general health status, with the results reported in Table 6. Age differences do not explain the disparity in self-reported general health status; within every age group, the PSID sample has a lower proportion that is in excellent health.
The NHIS is a single cross-section, while most PSID respondents have been interviewed for many years. To explore whether repeated measurement of health status somehow affected reporting, we tabulated this measure using the 1984 data, which was the first year this question was asked. We also reported estimates using the 1994 data to investigate whether there was any drift over time in the response to the questions. As shown in Table 7, the distribution of responses is virtually unchanged over the period.
As a final test, we compared the two surveys with a third widely used survey, the Health and Retirement Survey (HRS). We restricted the sample to the population 51-61, with the estimates for each of the three surveys reported in Table 8. We find that the PSID and HRS align fairly closely. It is the NHIS that is somewhat of an outlier. It is unclear what is causing the differences across the surveys, particularly since all three use the identical question. Additional analyses should be conducted to understand the source of these disparities.
Multivariate models Table 9 contains results from 6 separate logistic regression models for each wave of PSID
and NHIS. The dependent variable in each model is in indicator for whether the person is in fair or poor health. The explanatory factors include age, race, sex, marital status, and education. The parameter estimates for age, marital status, education, and “other” race are very similar in the two surveys. The differences between blacks and whites, and the differences between men and women do not align as closely, especially in 1999, with somewhat larger disparities estimated in the PSID. In sum, the models lead to fairly similar estimates, although the racial and gender differences merit further investigation.
3

Table 10 reports change in health status between 2003 and 2005 measured along three
dimensions: poor/fair health, work limitation, and obesity. Estimates are provided for heads and wives of all ages, and separately for people under and over age 51. As expected, the prevalence of work limitations and being in fair or poor health is much higher for older people. Moreover, older people have higher onset and less recovery than younger populations. Furthermore, there is substantial change between waves even among the younger (pre-HRS) populations. Among the younger population, nearly 6% who were not in fair/poor health in 2003 fell into fair/poor health by 2005, while at the same time nearly 41% of those who were in fair/poor health recovered. Similar magnitudes of change were experienced as measured by work limitations. Relative to self-reported general health and work limitations, the onset of obesity is higher, and recovery lower. In sum, a substantial share of the PSID sample experiences important changes in health status within the two-year period between interviews, even among the younger population, implying that it is important to assess health status in each wave. Although not all dimensions of health status measured in the PSID probably change as quickly, designing the instrument to skip those persons or items not likely to have frequent changes would result in very modest savings.
V. CONCLUSIONS The PSID and the NHIS are very different surveys. The NHIS consists of a fresh cross-
section of roughly 100,000 individuals each year. The PSID has been interviewing the same core families since 1968, as well as the children in these families once they leave their parent’s homes. Despite these differences, the health-related measures in the two surveys align fairly closely. Moreover, multivariate estimates of the relationship between health status and several socio-demographic factors are in close agreement.
Our interpretation of this initial evidence is that the quality of the health-related information
collected in the PSID is relatively high. However, continued monitoring and assessment is required to ensure that the survey accurately assesses the most salient health factors.
4

Item PSID NHISHeight How tall [are you/is he/is she]? How tall are you without shoes?Weight About how much [do you/does he/does she] weigh? How much do you weigh without shoes?Health limits work [Do you/Does he/Does she] have any physical or nervous
condition that limits the type of work or the amount of work [you/he/she] can do?
Are/(Other than the persons mentioned), are any of these family members{PERSONS 18+} limited in the kind OR amount of work {you/they} can do because of a physical, mental or emotional problem?
Conditions Has a doctor ever told [you/him/her] that [you have/he has/she has] or had any of the following...
Have you EVER been told by a doctor or other health professional that you had/have...
A stroke? A stroke?High blood pressure or hypertension? Hypertension,also called high blood pressure?Diabetes or high blood sugar? Diabetes or sugar diabetes?Cancer or a malignant tumor, excluding skin cancer? Cancer or a malignancy of any kind?A heart attack? A heart attack (also called myocardial infarction)?Asthma? Asthma?
Self-rated general health Would you say [your/his/her] health in general is excellent, very good, good, fair, or poor?
Would you say {subject's name } health in general is excellent, very good, fair, or poor?
Smoking Did [you/he/she] ever smoke cigarettes? Have you smoked at least 100 cigarettes in your ENTIRE LIFE?
[Do you/Does Q56] smoke cigarettes? Do you NOW smoke cigarettes every day,some days or not at all?
Insurance In 1997 or 1998, was anyone in the family covered by health insurance or some other kind of health care plan? (Including health insurance obtained through employment or purchased directly as well as government programs like Medicare and Medicaid that provide medical care or help pay medical bills.) For how many months in 1998[were you/was he/was she] covered?
{Are you/Is anyone} covered by health insurance or some other kind of health care plan? INSTRUCTIONS:Read if necessary: include health insurance obtained through employment or purchsed directly as well as government programs like medicare and medicaid that provide medical care or help pay medical bills.
Table 2. Comparison of Question Wording in the 1999 PSID and 1999 NHIS
5

Table 3. Item Non-response Rates (%) in PSID and NHIS, 1999, 2001, 2003 and 2005
PSID 1999
NHIS 1999 PSID 2001
NHIS 2001 PSID 2003 NHIS 2003 PSID 2005 NHIS 2005
DK NA,RF DK NA,RF DK NA,RF DK NA,RF DK NA,RF DK NA,RF DK NA,RF DK NA,RF
Self-rated General Health
.03
.19
.15
.32
.04
.96
.15
.33
.02
.58
.12
.45
.06
.40
.10
.24
Health Limits Work .01 .21 .07 .84
.03
.96
.04
.17
.07
.59
.04
.14
.10
.44
.06
.05
Height .50 .60 .34 5.90 .63 1.96 .57 1.01 .70 1.08 .53 1.32 .56 .44 .60 1.34
Weight .82 1.35 1.21 7.22 1.38 1.95 1.43 2.62 1.52 1.58 1.63 2.85 1.36 1.42 1.43 2.73
Conditions
Asthma .00 .19 .06 .02 .10 .96 .08 .03 .03 .57 .10 .03 .05 .44 .06 .04
Cancer .02 .19 .04 .03 .09 .96 .10 .04 .02 .57 .09 .03 .06 .45 .06 .04
Diabetes .00 .19 .04 .03 .09 .96 .06 .04 .07 .57 .05 .02 .04 .45 .04 .03
Hypertension .07 .19 .08 .04 .09 .96 .10 .05 .07 .58 .15 .07 .06 .44 .11 .06
Myocardial Infarction .00 0.19 .03 .03
.07
.96
.01
.04
.06
.57
.13
.04
.07
.28
.09
.04
Stroke .05 0.19 .05 .03 .06 .96 .07 .04 .07 .56 .10 .04 .04 .44 .09 .04
Health Insurance
.06
0.00
.13
.22
.00
.00
.59
.55
.16
.00
.53
.67
.06
.01
.57
.50
Note: DK=don’t know; NA=not appropriate; RF=refused. The PSID sample consists of all heads and wives, and the NHIS sample consists of people 18 years or older
6

Table 4. Health Status, Health Behaviors, and Health Insurance Coverage (%) in the PSID and NHIS, 1999, 2001, 2003 and 2005
PSID 1999
NHIS 1999
PSID 2001
NHIS 2001
PSID2003
NHIS 2003
PSID 2005
NHIS 2005
Smoking
Currently smoke 20 23 21 23 20 21 19 21
Never smoked 52 53 53 55 53 56 53 57
Has Health Insurance 87 87 87 85 87 84 85 83
Obese (BMI > 30) 22 22 21 22 22 23 23 25
30-Day Distress (K6) -- -- 3.2 3.1 3.9 3.1 -- --
Health doesn’t limit amount/kind of work
82 88 81 89 82 89 82 89
Health Conditions
Asthma 2.8 2.1 7.6 11.8 8.6 9.7 9.6 10
Cancer 4.6 6.5 5.0 6.9 5.3 6.6 6.9 7.4
Diabetes 7.1 5.4 7.7 6.5 8.3 6.6 9.1 7.5
Hypertension 21.8 22.6 23.0 23.5 25.4 25.2 27.5 25.8
Myocardial Infarction
3.7 2.9 3.7 3.4 3.5 3.2 4.3 3.3
Stroke 7.4 8.5 3.1 2.4 3.0 2.5 3.7 2.4
Self-Rated General Health
Excellent 23 32 22 31 22 29 19 29
Very Good 33 32 35 32 35 32 33 32
Good 29 25 28 25 28 26 30 27
Fair 11 8 11 9 11 9 13 9
Poor 4 3 4 3 4 3 5 3
Note: The PSID sample consists of all heads and wives, and the NHIS sample consists of people 18 years or older. Weights are used for estimates from both surveys.
7
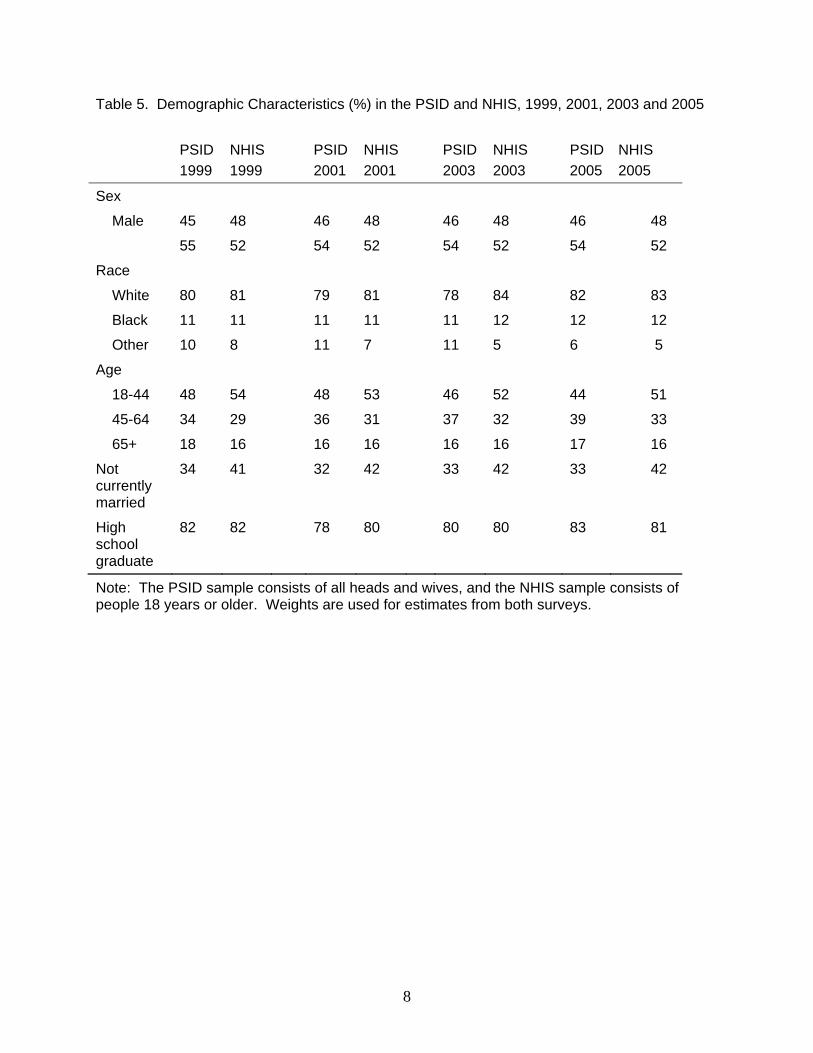
Table 5. Demographic Characteristics (%) in the PSID and NHIS, 1999, 2001, 2003 and 2005
PSID 1999
NHIS 1999
PSID 2001
NHIS 2001
PSID 2003
NHIS 2003
PSID 2005
NHIS 2005
Sex
Male 45 48 46 48 46 48 46 48
55 52 54 52 54 52 54 52
Race
White 80 81 79 81 78 84 82 83
Black 11 11 11 11 11 12 12 12
Other 10 8 11 7 11 5 6 5
Age
18-44 48 54 48 53 46 52 44 51
45-64 34 29 36 31 37 32 39 33
65+ 18 16 16 16 16 16 17 16
Not currently married
34 41 32 42 33 42 33 42
High school graduate
82 82 78 80 80 80 83 81
Note: The PSID sample consists of all heads and wives, and the NHIS sample consists of people 18 years or older. Weights are used for estimates from both surveys.
8

Table 6. Self-Rated General Health Status by Age (%) in the PSID and NHIS, 2005
Age group Excellent Very Good Good Fair Poor
18-44 years
PSID 26 37 28 7 2
NHIS 38 34 22 5 1
45-64 years
PSID 17 33 32 13 5
NHIS 24 32 29 10 4
65-74 years
PSID 9 28 33 20 11
NHIS 16 27 34 17 6
75 years and over
PSID 8 20 31 27 14
NHIS 10 23 36 22 9
Note: The PSID sample consists of all heads and wives, and the NHIS sample consists of all people 18 and older. PSID and NHIS weights are used in calculating the estimates. Table 7. Self-Rated General Health Status (%) in the PSID, by Year
1999 1994 1984
Excellent 23 22 24
Very good 33 34 31
Good 29 28 27
Fair 11 11 12
Poor 4 5 5
Note: For each year, the sample consists of all heads and wives. PSID weights are used in calculating the estimates.
9

Table 8. Self-Rated General Health Status (%) in the PSID, HRS, and NHIS: 51-61 Year Olds
PSID 2005
HRS 2004
NHIS 2005
Excellent 17 16 23
Very good 32 29 31
Good 32 30 30
Fair 14 17 11
Poor 5 8 5
Note: The PSID sample consists of all heads and wives 51-61. Weights are used in calculating all estimates. Table 9. Logistic Regression of Being in Poor/Fair Health (Odds Ratio)
PSID 1999
NHIS 1999
PSID 2001
NHIS 2001
PSID 2003
NHIS 2003
PSID 2005
NHIS 2005
Age 1.044* 1.043* 1.044* 1.044* 1.030* 1.041* 1.044* 1.042*
Race
White (Reference Group)
Black 2.14* 1.79* 2.021* 1.838* 1.702* 1.674* 1.786* 1.605*
Other 1.44* 1.38* 1.337 1.347 1.128 .965 1.667 0.919
Female 1.16* 1.04* 1.149 1.073* 1.188* 1.093* 1.176* 1.082*
Not currently married
1.28* 1.30*
1.181* 1.306* 1.520* 1.319* 1.438* 1.340*
High school graduate
0.41* 0.36*
.385* .421* .331* .428* 0.350* 0.400*
Note: *Indicates statistical significance at the .01 level. The PSID sample consists of all heads and wives, and the NHIS sample consists of people 18 years or older.
10

Figure 1. Comparison of Estimates of Average Height and Weight in the PSID and NHIS, 2005
11

12

13
Table 10. Change in Health Status Between 1999 and 2001
Fair/poor health Work limitation Obese All ages Prevelance in 1999 13.9 17.2 18.3 Onset 7.6 9.5 6.8 Recovery 32.9 31.9 17.8 Less than 51 years old Prevelance in 1999 9.4 11.3 18.3 Onset 5.0 6.7 7.7 Recovery 42.9 39.1 16.8 51 and older Prevelance in 1999 22.5 28.4 18.3 Onset 13.2 16.3 5.0 Recovery 24.9 26.4 19.6
Note: Based on tabulations using the 1999 and 2001 PSID, with 1999 individual weights.