an analysis of time-related score … · an analysis of time-related score increments and/or...
TRANSCRIPT

AN ANALYSIS OF TIME-RELATED SCORE
INCREMENTS AND/OR DECREMENTS FOR GRE REPEATERS ACROSS
ABILITY AND SEX GROUPS
Donald Rock and
Charles Werts
GRE Board Research Report GREB No. 77-9R
March 1980
This report presents the findings of a research project funded by and carried out under the auspices of the Graduate
Record Examinations Board.

GRE BOARD RESEARCE REPORTS FORGENERAL AUDIENCE
Altman, R. A. and Wallmark, 11. H. A Summary of Data from the Graduate Programs and Admissions Manual. GRE Board Research Report GREB No. 74-lR, January 1975.
Baird, L. L. An Inventory of Documented Accompllshaents. GRE Board Research Report GREB No. 77-38, June 1979.
Baird, L. L. Cooperative Student Survey (The Graduates [$2.50 each], and Careers and Curricula). GRE Board Research Report GREB No. 70-4R, March 1973.
Burns, RI L. Graduate Admissions and Fellowship Selection Policies and Procedures (Part I and II). GRE Board Research Report GREB No. 69-5R, July 1970.
Centra, J. A. How Universities Evaluate Faculty Performance: A Survey of Department Heads. GRE Board Research Report GREB No. 75-5bR, July 1977. ($1.50 each)
Centra, J. A. Women, Men and the Doctorate. GRE Board Research Report GREB No. 71-lOR, September 1974. ($3.50 each)
Clark, M. J. The Assessment of Quality in Ph.D. Programs: A Preliminary Report on Judgments by Graduate Deans. GRE Board Research Report GREB No. 72-7aR, October 1974.
Clark, H. J. Conditions Influencing the Career Accompllshnents of Recent Ph.D.'s. GRE Board Research Report GREB No. 76-2R, June 1979.
Clark, H. J. Program Review Practices of University Departments. GRE Board Research Report GREB No. 75-5aR, July 1977. ($1.00 each)
Donlon, T. F. Annotated Bibliography of Test Speededness. June 1979.
Plaugher, R. LO The New Definitions of Test Fairness In Selection: Developments and Implications. GRE Board Research Report GREB No. 72-41, Hay 1974.
Fortna, R. 0. Annotated Bibliography of the Graduate Record Examinations= July 1979.
Frederiksen, N. and Ward, W= C- Measure8 for the Study of Creativity in Scientific Problem-Solving= mY 1978.
Hartnett, R. TO The Information Needs Of Prospective Graduate Students. GRE Board Research Report GREB NO. 77~8R, October 1979.
Hartnett, R. T. and Willingham; W. W. The Criterion Problem: What Measure of Success in Graduate Education? GRE Board Research Report GREB No. 77-4R, March 1979.
Knapp, J. and Hamilton, I- B. The Effect of Nonstandard Undergraduate Assessment and Reporting Practices on the Graduate School Aduissions Process. GRE Board Research Report GREB No. 76-14R, July 1978.
Lannholn, G. V. and Parry, M. E. Programs for Disadvantaged Students in Graduate Schools. GRE Board Research Report GREB No. 69-lR, January 1970.
Miller, R. and Wild, C. L. Restructuring the Graduate Record Examinations Aptitude Test. GRE Board Technical Report, June 1979.
Reilly, R. R. Critical Incidents of Graduate Student Performance. GRE Board Research Report GREB No. 70-5R, June 1974.
Rock, D., Wefts, C. An Analysis of Time
Rock I
Related Score Increments and/or Decre- ments for GRE Repeaters across Ability and Sex Groups. GRE Research Report CREB No. 77-9R, April 1979.
D. A. The Prediction of Doctorate Attainment in Psychology, Mathematics and Chemistry. GRE Board Research Report GREB No. 69-6aR, June 1974.
Schrader, W. B. Admissions Test Scores as Predictors of Career Achievement in Psychology. GRE Board Research Report GREB No. 76-lR, September 1978.
Wild, C. L. Summary of Research on Restructuring the Graduate Record Examinations Aptitude Test. February 1979.
Wild, C. L. and Durso, R. Effect of Increased Test-Taking Time on Test Scores by Ethnic Group, Age, and Sex. GRE Board Research Report GREB No. 76-6R, June 1979.
Wilson, K. M. The GRE Cooperative Validity Studies Project. GRE Board Research Report GREB No. 75-8R, June 1979.
Wiltsey, R. C. Doctoral Use of Foreign Languages: A Survey. GRE Board Research Report GREB No. 70-14R, 1972. (Highlights $1.00, Part I $2.00, Part II $1.50).
Witkin, H. A.; Moore, C. A.; Oltman, P. K.; Goodenough, D. R.; Friedman, F.; and Owen, D. R. A Longitudinal Study of the Role of Cognitive Styles in Academic Evolution During the College Years. GRE Board Research Report CREB No. 76-lOR, February 1977 ($5.00 each).

An Analysis of Time-related Score Increments and/or Decrements for GRE Repeaters Across Ability
and Sex Groups
Donald Rock
and
Charles Werts
GRE Board Research Report GREB No. 77;9R
March 1980
Copyright@1980 by Educational Testing Service. All rights reserved.
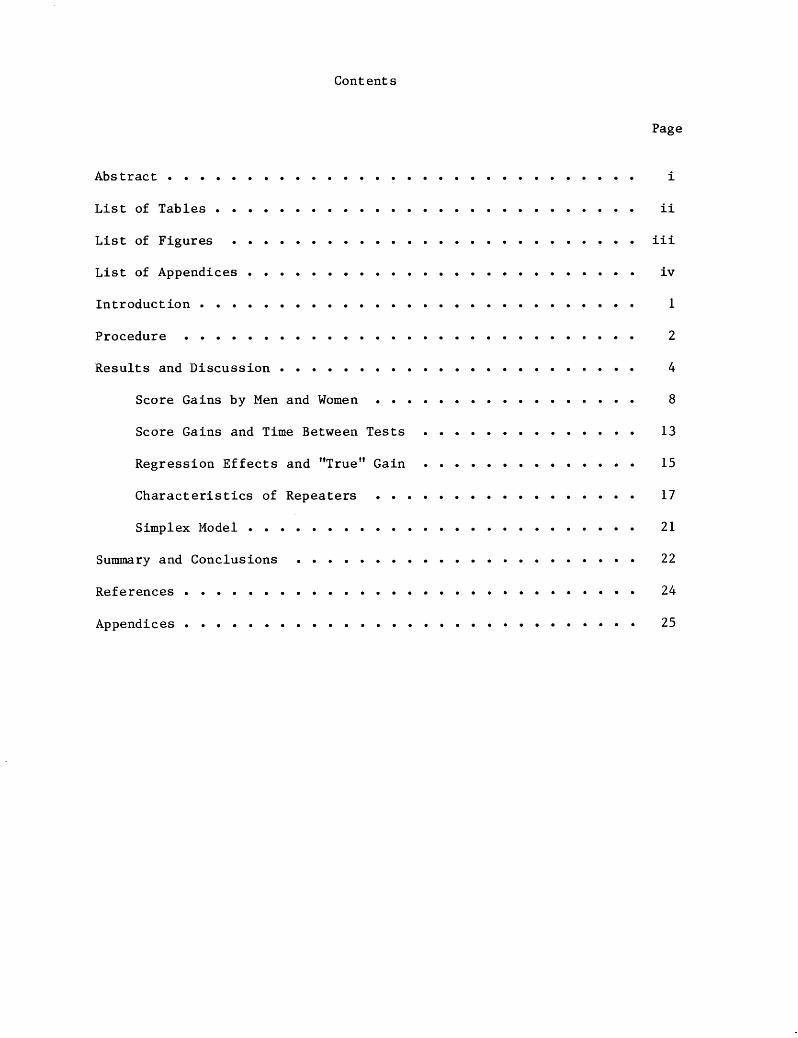
Contents
Page
Abstract .............................. i
Listof Tables ........................... ii
List of Figures .......................... iii
List of Appendices ......................... iv
Introduction ............................ 1
Procedure ............................. 2
Results and Discussion ....................... 4
Score Gains by Men and Women ................. 8
Score Gains and Time Between Tests .............. 13
Regression Effects and "True" Gain .............. 15
Characteristics of Repeaters ................. 17
Simplex Model ......................... 21
Summary and Conclusions ...................... 22
References ............................. 24
Appendices ............................. 25

Abstract
The purpose of this study was to obtain information on both the number of individuals who retest and their patterns of score gain (or decrement) by sex and ability. Individuals who retested only once were found to gain about 26 - 27 points on the verbal test and about 23 points on the quantitative test. This finding is tempered by the fact that repeaters are a self-selected group whose average scores were below the mean on initial testing; average gains on retest by a random sample of all test takers almost certainly would be somewhat less. Individuals who retested more than once were, on the average, of lower ability than the single retest individuals. The multiple retesters gained less on the average than the higher ability single retest individuals. The amount of verbal gain was positively related to the length of time between the initial test and the first retest. This result was interpreted primarily as an increase in knowledge and to a lesser extent an increase in test-taking skills. There was no relationship between time lapse and quantitative gains.

List of Tables
Page
Table 1: Mean and Total Gains for Verbal and Quantitative Scores by Administration Populations . . l . l l l l l l 3
Table 2: Mean and Total Gains for Verbal and Quantitative Scores by Sex and Administration Populations . . . . l . 13
Table 3: Regression of Retest Scores on Initial Scores and Time Lapse by Sex and Aptitude Areas . . . . . . . . . . 14
Table 4: Regression of Repeater Group Membership on Demographic Variables . . . . . . . . . . . . . . . . . 17
Table 5: Regressions of Verbal and Qua_ntitative Retest Scores on Initial Scores and Significant Demographic Variables . . 18
Table 6: Mean Scores on Initial Testing and Mean Gains on First Retesting for Selected Subgroups . . . . . l . l l l l . 20
ii

List of Figures
Page
Figure 1: Verbal mean score changes by number of repeated administrations . . . . . . . . . . . . . . . . . . . . 5
Figure 2: Quantitative mean score changes by number of repeated administrations . . . . . . . . . . . . . . . . 6
Figure 3: Verbal mean score changes for women by number of repeated administrations . . . . . . . . . . . . . . . . 9
Figure 4: Verbal mean score changes for men by number of repeated administrations . . . . . . . . . . . . . . . . 10
Figure 5: Quantitative mean score changes for women by number of repeated administrations . . . . . . . . . . . . . . 11
Figure 6: Quantitative mean score changes for men by number of repeated administrations . . . . . . . . . . . . . . 12
iii

List of Appendices
Page
Appendix A: Verbal Score Changes on Retesting by Level of Initial Score (Single Repeaters Only). . . . . . . . . . 25
Appendix B: Quantitative Score Changes on Retesting by Level of Initial Score (Single Repeaters Only) . . . . . . . . 27
Appendix C: Verbal Score Gains for Males by Time Lapse (Single Repeaters Only) . . . . l . . l . . l . . l . . 29
Appendix D: Verbal Score Gains for Females by Time Lapse (Single Repeaters Only) . . . . . . . . . . . . . . . . 30
Appendix E: Quantitative Score Gains for Males by Time Lapse (Single Repeaters Only) . . . . . . . . . . . . . . . . 31
Appendix F: Quantitative Score Gains for Females by Time Lapse (Single Repeaters Only) . . . . . . . . . . . . . . . . 32
Appendix G: Frequency Distribution of Verbal Gains on First Retesting . . . . . . . . . . . . . . . . . . . . . . . 33
Appendix H: Frequency Distribution of Quantitative Gains on First Retesting . . . . . . . . . . . . . . . . . . . . 34
Appendix I: Background Information Questions . . . . . . . . . . . . 35
Appendix J: Intercorrelations, Means, and Standard Deviations for the Variables Reported in Table 4 and Table 5 . . . . . . . . . . . . . . . . . . 37
Appendix K: Intercorrelations of Scores on Successive Retests for the Total Four-Administration Population . . 38
Appendix L: Intercorrelations of Verbal Scores on Successive Retests for the Four-Administration Population, by Sex . . . . . . . . . . . . . . . . . . a 39
Appendix M: Intercorrelations of Quantitative Scores on Successive Retests for the Four-Administration Population, by Sex . . . . . . . . . . . . . . . . . . . 40
iv

An Analysis of Decrements
Time-related Score Increments and/or for GRE Repeaters Across Ability
and Sex Groups
Donald Rock and Charles Werts
Introduction
The purpose of this study was to obtain information on (a) how many persons repeat the Graduate Record Examinations (GRE) Aptitude Test one time or more; (b) whether there is a time-related score decrement (or increment) for those who repeat; (c) whether the pattern of increment or decrement differs by sex and/or ability area (ability area may be understood to mean the measured verbal and quantitative aptitude areas); and (d) whether one-time repeaters differ from multiple repeaters in ability and/or sex group membership.
The information provided by answers to the questions listed above should help candidates decide whether or not, or under what conditions, they should repeat the test, and should help institutions interpret multiple test scores when making admissions decisions.
In 1958 Levine and Angoff investigated the effect of repetition on the Scholastic Aptitude Test for high school juniors and seniors. They found an average gain of ten points for the first retest, an additional gain of ten points for a second retest, and no gain for a third retest.
A number of other studies investigating the effects of repeating a test have been reviewed by Weiss (1961). Weiss concluded that (a) practice improves performance on tests of intelligence and scholastic aptitude; (b) the effects of a first and second practice for mental tests are significant, but thereafter the effect diminishes; (c) practice effects vary with the time interval between practice and final tests (significant practice effects are demonstrated for time intervals of two weeks to three months); and (d) practice effects interact with mental ability. The more intelligent test takers appear to benefit the most.
Campbell, Hilton, and Pitcher (1967) sent a questionnaire to those individuals who took tests in both the November 1962 and the January 1963 administrations of the Graduate Record Examinations. This questionnaire was designed to obtain such information as the students' reasons for taking the tests when they did, the amount of

-29
effort applied during each administration, and the relevance of courses taken during the interim. The questionnaire did not specifically ask if they attended a "coaching" school. Campbell et al. found an increase of 25 points on the verbal section and 16 points on the quantitative section. For those individuals who repeated an Advanced Test, the mean gain ranged from 21 points in mathematics to 32 points in physics. Campbell and his colleagues also found that those individuals who reported preparing for an Advanced Test did show greater gains. Their conclusion was that subject matter preparation probably led to a real knowledge increase, which in turn was reflected in higher repeated Advanced Test scores.
Since the studies cited above investigated gains across very short time spans, conclusions from these studies must, therefore, be somewhat limited. In the study reported here, time between testings will be treated as a major explanatory variable.
Procedure
A GRE history file containing full records for all persons who had registered for a GRE test between October 1974 and October 1978 was searched for records that had more than one set of scores on the Aptitude Test. Thus, all persons who took the Aptitude Test more than once between 1974 and 1978 are included in the study; in addition, the study includes the records of persons who took the test between 1971 and 1974 if they also registered for another GRE test after October 1974.
It was not possible to identify persons with long time gaps (e.g., more than a maximum of 7 years) between tests through the use of the GRE history file. The alternative was hand searches for scores on microfilm records, which was considered too expensive and time-consuming for this study. Therefore, the aspect of the study concerning the relationship of time between tests and test scores does not consider the long time intervals that were initially proposed, such as time intervals that might be characteristic of a person returning to graduate study 15 or 20 years after receiving the bachelor's degree. However, time intervals of 3 years or more are relatively rare in studies of adult performance on measures of academic aptitude, and it is thought that the results of this study are suggestive of those that would be obtained if samples with longer time intervals were used.
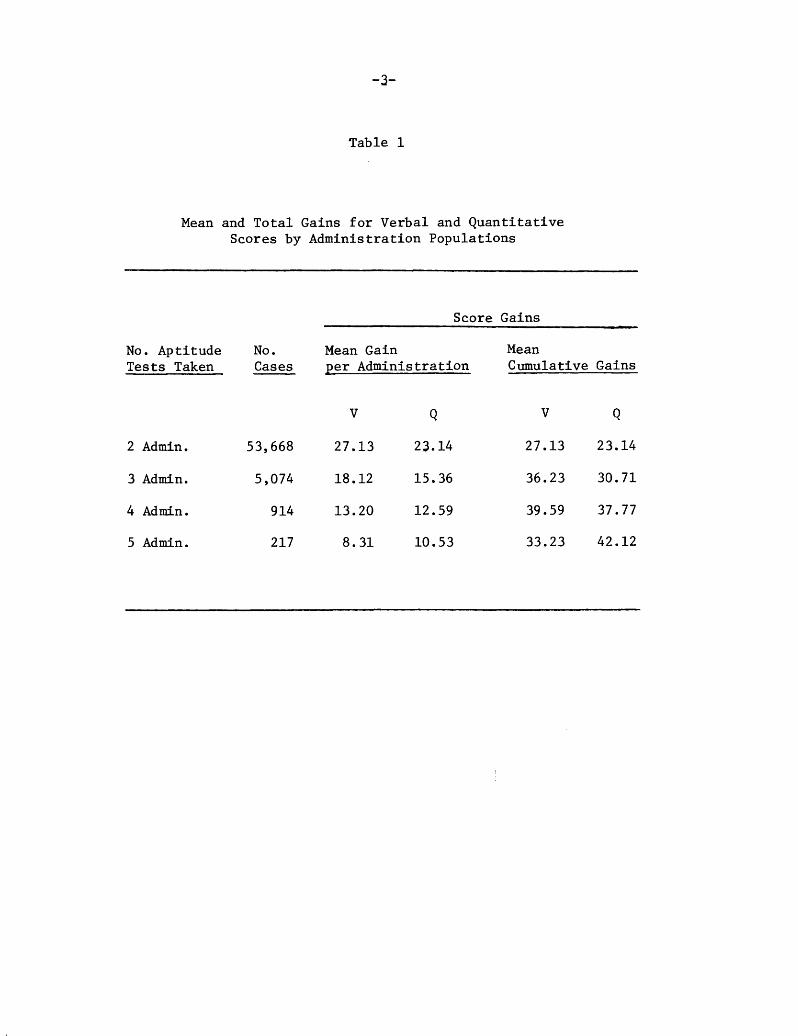
Table 1 gives the number of records that were identified with 2, 3, 4, or 5 sets of Aptitude Test scores on the 1974-78 GRE history tape. Unless indicated otherwise, these are the records that were used in all of the following analyses. Table 1 also reports
-3
Table 1
Mean and Total Gains for Verbal and Quantitative Scores by Administration Populations
Score Gains
No. Aptitude Tests Taken
2 Admin. 53,668
3 Admin. 5,074
4 Admin. 914
5 Admin. 217
No. Cases
Mean Gain Mean per Administration Cumulative Gains
V Q V Q
27.13 23.14 27.13 23.14
18.12 15.36 36.23 30.71
13.20 12.59 39.59 37.77
8.31 10.53 33.23 42.12
the average score by administration
gain on the Verbal and Quantitative Aptitude Tests population.
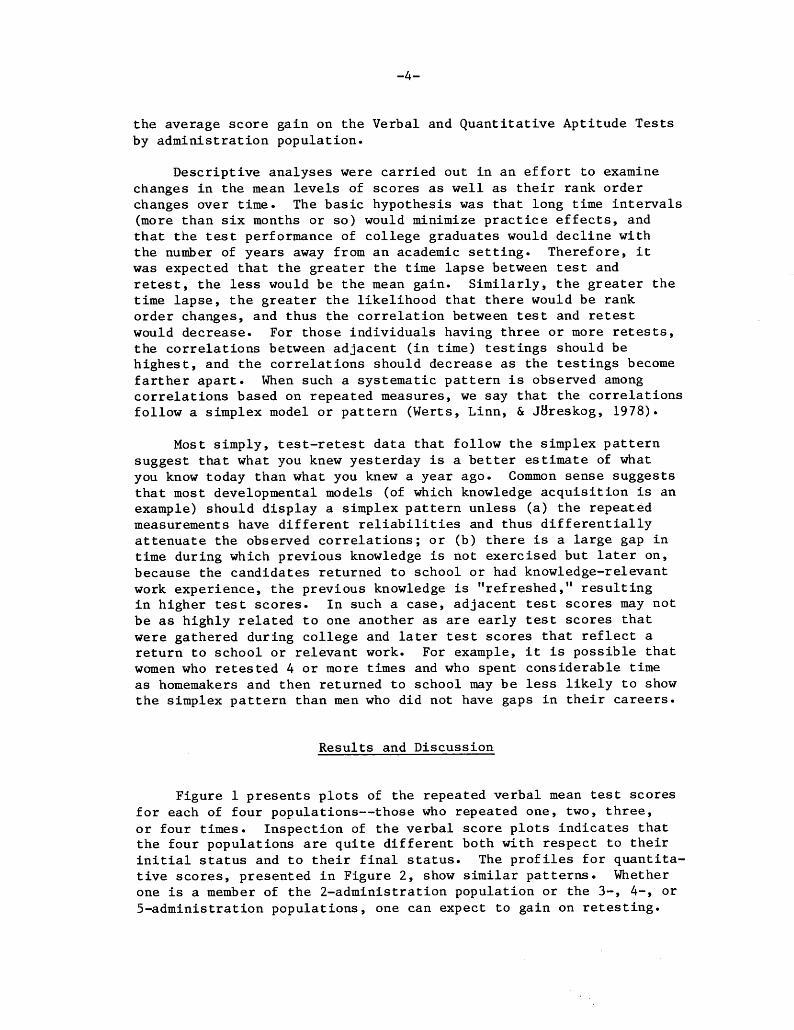
Descriptive analyses were carried out in an effort to examine changes in the mean levels of scores as well as their rank order changes over time. The basic hypothesis was that long time intervals (more than six months or so) would minimize practice effects, and that the test performance of college graduates would decline with the number of years away from an academic setting. Therefore, it was expected that the greater the time lapse between test and retest, the less would be the mean gain. Similarly, the greater the time lapse, the greater the likelihood that there would be rank order changes, and thus the correlation between test and retest would decrease. For those individuals having three or more retests, the correlations between adjacent (in time) testings should be highest, and the correlations should decrease as the testings become farther apart. When such a systematic pattern is observed among correlations based on repeated measures, we say that the correlations follow a simplex model or pattern (Werts, Linn, & JBreskog, 1978).
Most simply, test-retest data that follow the simplex pattern suggest that what you knew yesterday is a better estimate of what you know today than what you knew a year ago. Common sense suggests that most developmental models (of which knowledge acquisition is an example) should display a simplex pattern unless (a) the repeated measurements have different reliabilities and thus differentially attenuate the observed correlations; or (b) there is a large gap in time during which previous knowledge is not exercised but later on, because the candidates returned to school or had knowledge-relevant work experience, the previous knowledge is "refreshed," resulting in higher test scores. In such a case, adjacent test scores may not be as highly related to one another as are early test scores that were gathered during college and later test scores that reflect a return to school or relevant work. For example, it is possible that women who retested 4 or more times and who spent considerable time as homemakers and then returned to school may be less likely to show the simplex pattern than men who did not have gaps in their careers.
Results and Discussion
Figure 1 presents plots of the repeated verbal mean test scores for each of four populations--those who repeated one, two, three, or four times. Inspection of the verbal score plots indicates that the four populations are quite different both with respect to their initial status and to their final status. The profiles for quantita- tive scores, presented in Figure 2, show similar patterns. Whether one is a member of the 2-administration population or the 3-, 4-, or 5-administration populations, one can expect to gain on retesting.

-5-
500- Approximate population 492 ' mean on the verbal test*
383 n = 217
I I I I t
1 2 3 4 5 Administrations
*The approximate population mean is the mean of all test- takers in the early 1970's, as reported in test interpretation materials issued by the GRE program.
Figure 1. Verbal mean score changes by number of repeated administrations.

-6-
Approximate population mean on the quantitative test*
481 n = 5,074
= 914
441 n = 217
430
i 1 4 z k Administrations
*The approximate population mean is the mean of all test- takers in the early 1970's, as reported in test interpretation materials issued by the GRE program.
Figure 2. Quantitative mean score changes by number of repeated administrations.

However, the average gain per administration in both the verbal and quantitative areas decreases with the number of administrations (see Table 1 for mean gains). With respect to the verbal area, the total or cumulative gain is reasonably close across all administration populations; it just takes the 4- and 5-administration people much more time and practice to arrive at similar total gain. This is especially interesting since the initial status scores for the 4- and 5-administration people average about a standard deviation below the 2-administration people (see Figures 1 and 2). Classical reliability theory would suggest that the 4- and 5-administration people should show greater gains on retesting since they are so far below the population mean. This expectation is based on the fact that some part of the discrepancy between an individual's score and the mean of the population of which he or she is assumed to be a member is attributed to the unreliability of the instrument and to chance performance factors that do not replicate from one administra- tion to another. This is, of course, an over-simplification of the regression phenomenon. In addition, people who score below their group mean become more motivated to achieve at least equal to their peers. Thus one could pose a group social pressure hypothesis to partially explain regression toward group means to supplement the measurement theory. For both of these reasons, we would expect repeaters with the lowest initial test scores to show the largest gains; instead, the persons who repeated the test most often averaged the lowest initial scores and also had the lowest average gain from one administration to the next.
The question arises whether 2-administration individuals who had low initial test scores like those of the 4- and 5-administration individuals gain at the same low rate as the 4- and 5-administration individuals on retesting. The answer is no. For example, the average gain of 2-administration people whose initial test scores are in the 340-380 range is 29.6-32.7 points (see Appendix A). Similar findings apply to the quantitative area (see Appendix B). Clearly the administration subpopulations are different with respect to measured ability. In a sense, the initial scores of the 4- and 5-administra.tion people appear to be closer to their "true" scores than are the initial scores of the 2-administration individuals. It would seem that if a test taker is more than a standard deviation (about 125 points) below the population average at initial testing and does not gain about a quarter of a standard deviation on retest, he or she will probably show only modest gains on each succeeding testing.
What is the expected or mean gain on first retesting combining all administration populations? The expected verbal gain is 26.49, and the expected quantitative gain is 23.13. These are more accurate estimates of what might be expected with a single retesting than are the mean gains reported in Table 1 for the 2-administration group, as they minimize the bias resulting from self-selection

-8-
among the administration populations. The reader should note, however, that the bias is extremely trivial, since the number of 2-administration people is almost 9 times larger than the number who repeated the test more than once.
Whether the gains are primarily the result of practice effects or of small gains in knowledge acquisition cannot be conclusively resolved by the data. However, farther on we shall look at the relationship between time lapse and gain, which suggests that at least part of the gain is knowledge acquisition. These initial findings with respect to gain are consistent with the results reported by Campbell, Hilton, and Pitcher (1967). They found gains of 25 and 16 points for the verbal and quantitative areas respectively when retesting was done within three months. Appendices C through F show similar verbal gains (23-24 points) and slightly higher quantitative gains (24-25 points) after a similar time lapse.
Score Gains by Men and Women
Figures 3 through 6 present plots of initial and retest mean scores by sex and ability area. The profiles appear to be markedly the same for the two sexes. It is interesting to note that proportion- ately almost as many women as men retested once. However, the number of women becomes proportionately smaller in the multiple- retesting populations.
Table 2 summarizes the gains reported in Figures 3 - 6 by presenting the mean gain between administrations and the cumulative gain for each aptitude area by sex and administration population. For both sexes the average gain between retests decreases with the number of administrations. However, one must avoid over- interpreting the results of the 5-administration individuals since the population size is so small (73 women and 144 men). A comparison of the average gain for the two sexes suggests that men repeaters gain slightly more than women repeaters on both the verbal and quantitative examinations. If we assume that females have as much opportunity to develop their verbal skills between testings, then the l- to 3-point difference in average verbal score gain may simply be due to regression effects. That is, men repeaters average 42 to 151 points (depending on the administration population-- see Figure 4) below the verbal mean of the total male population at Initial testing, whereas women at initial testing average 27 to 123 points below their population mean (see Figure 3). Thus if the men are regressing on their population mean and similarly the women are regressing on their population mean, then one would expect a slightly greater gain for the men on retesting simply because of regression effects. It is also interesting to note that 2-administration women actually exceed their population mean on retesting in the quantitative area (see Figure 5).

-9-
500 494
300
n= 73
i : 1 z ; Administrations
*The approximate population mean is the mean of all test- takers in the early 1970's, as reported in the test interpretation materials issued by the GRE program.
Figure 3. Verbal mean score changes for women by number of repeated administrations.

-lO-
1 Approximate male mean on the verbal test*
/
476 n = 29,016
448 249
/
n= 3,068
= 624
n = 144
I h 1 z I Administrations
* The approximate population mean is the mean of all test- takers in the early 1970's, as reported in the test interpretation materials issued by the GEE program.
Figure 4. Verbal mean score changes for men by number of repeated administrations.

-ll-
9475 n = 24,652 1 Approximate female mean
on the quantitative test*
n = 73
361
i ; i t, ;
Administrations
*The approximate population mean is the mean of all test- takers in the early 1970's, as reported in the test interpretation materials issued by the GRE program.
Figure 5. Quantitative mean score changes for women by number of repeated administrations.

300
I / /
-12-
, Approximate male mean on the quantitative test*
624
7 n = 144
1 I I 1 I r 1 2 3 4 5
Administrations
*The approximate population mean is the mean of all test- takers in the early 1970's, as reported in the test interpretation materials issued by the GRE program.
Figure 6. Quantitative mean score changes for men by number of repeated administrations.

-13-
Table 2
Mean and Total Gains for Verbal and Quantitative Scores by Sex and Administration Populations
Mean gain between admin. Cumulative gain No. Admin. Verbal Quantitative Verbal Quantitative
M F M F M F M F
2 27.83 26.13 23.39 22.95 27.83 26.13 23.39 22.95 3 18.99 16.91 16.39 13.37 37.99 33.82 32.79 26.75 4 14.22 10.85 12.88 11.73 42.67 32.55 38.64 35.20 5 9.04 6.85 12.18 7.26 36.18 27.40 48.75 29.04
The fact that men tend to gain slightly more on the average than women on retesting in the quantitative area can also be explained by regression effects since the male administration populations are proportionately farther away from their total population mean than are the female administration populations. It is also possible that more men have an opportunity to maintain and/or develop their quantitative skills between testings. It should be noted, however, that the differential gain by sex, whether verbal or quantitative, is relatively trivial.
Score Gains and Time Between Tests
Both the Levine and Angoff study (1958) and the Weiss review (1961) suggest that gains tend to decrease after either the first or the second testing. For the most part their results were based on short time intervals and thus observed gains were more likely due to practice effects (e.g., improvement in test-taking skills) than to developmental acquisition of knowledge over time. In this section we will show that gains in GRE verbal scores for persons who repeat the test only once also increase as a function of the time span between test and retest. This suggests that the test scores are reflecting the developmental acquisition of verbal knowledge as well as showing gains resulting from possible short-term practice effects.
Table 3 presents the standardized regression weights when retest scores are regressed on both initial test scores and the time lapse between testings. The analysis was done on the 2-administration test takers. For verbal scores there is a small positive effect of

-14-
time lapse on gain. This is more prevalent for males than for females. That is, the partial regression weight, holding initial status constant, is positive and non-zero, indicating that larger gains are associated with longer time lapses between testings. Thus, in the verbal area, males are likely to show greater gains between initial and first retest scores as the time lapse increases between testings, regardless of initial test score. There is a similar statistically significant gain in female verbal scores with increasing time intervals, but it is somewhat smaller. These results are contrary to the initial research hypothesis of decreasing scores with long time intervals between tests; instead, they are consistent with a "growth" model of increasing knowledge over time.
Table 3
Regression of Retest Scores on Initial Scores and Time Lapse by Sex and Aptitude Areas
Independent Variables Dependent Variable
Men Women Standard Score Standard Score
Regression Weights Regression Weights
Verbal retest
Initial Verbal
# of months
.8801 .8825 R= .885 R= .883
.0417 .0245
Quantitative retest
Initial Quantitative
# of months
.8613 .8482 R= 0861 R= .848
-.OllO .0026

-15-
When initial quantitative scores are controlled, time lapse has no relationship to the retest scores, as indicated by the very small and nonsignificant partial regression weights in the lower part of Table 3. This finding is consistent with the idea that gain in mathematics achievement is less likely to occur with the simple passage of time unless one is practicing mathematical skills during that time lapse. These findings are consistent with the study by Owens (1966), who reported that verbal skill increases throughout the adult years, while quantitative skill is relatively stable.
Appendices C through F present mean gains for 2-administration men and women by aptitude area according to time-lapse intervals of 5 months to more than 3 years. This analysis was carried out to (a) detect any nonlinearity in the relationship between time lapse and gain on retesting, and (b) investigate the relative contribution of practice effects to gain. The regression analysis reported in Table 3, of course, assumed linearity. Inspection of Appendices C and D shows a relatively monotonic relationship between time lapse and verbal score gain for both sexes. That is, as the time lapse between testing increases, the gain in verbal test scores also increases. However, in the quantitative area there appears to be no simple relationship between time lapse and retest performance (cf. Appendices E and F). Males in the 2-administration population show the greatest gain in quantitative scores if they retest within five months. This suggests that in the quantitative area practice effects may be a more important determinant of gain for men than is the case in the verbal area. There does not appear to be a similar practice effect for women. This finding is consistent with Weiss' (1966) conclusion that practice effects interact with ability. That is, 2-administration men demonstrate more initial measured mathematics ability and also show greater gain when retested within five months.
Regression Effects and "True" Gain
How much of the 260 to 27-point average gain on the verbal retest and the 23-point average gain on the quantitative test can be ascribed to regression effects? The answer depends on the score level obtained on initial testing. At the extreme lower end of the test-score distribution one would expect a larger component of the gain to be due to regression effects, while at the mean there should not be any regression effects. That is, classical test theory (see Lord & Novick, 1968, p. 65) would suggest that an individual in the 300-310 verbal initial test range should gain about 13 points simply on the basis of regression effects. Inspection of Appendix A indicates that individuals in that range have a mean observed score gain of 32 points. Thus, it would seem that individuals at this tested ability level only show on the average a "true" gain of 19 points--"true" in the sense of a gain beyond that expected

-16-
from regression effects. Similarly, an individual with an initial score in the 400-410 range would be expected to gain about 6 points based on regression effects. Appendix A shows a gain of approximately 31 observed score points for such individuals, suggesting that their "true" gain is -about 25 score points.
Since the verbal gain for individuals at the population mean (and therefore no regression effects) is on the average 26 points, one might conclude that there is a slight tendency for the better prepared, as indicated by higher initial test scores, to show proportionately greater "true" gains than are shown by the less well prepared individuals. This hypothesis is supported by the fact that observed gains do not drop below 20 points until one gets to the 600 level on initial score, where we would expect such gains to be relatively unlikely since they must overcome regression effects towards a lower mean of approximately 490 (see Appendix A). It would seem that the higher-scoring candidates who decide to retest do so for good reason, and they profit from some of their mistakes on initial testing. This may also be true of the lower scoring candidates, but to a lesser extent.
Since the reliability coefficients of the verbal and quantitative tests are not quite the same (we have assumed a reliability of .93 for the verbal and .91 for the quantitative tests in our calculations here), one would expect the regression effect to be slightly greater for the quantitative test. There is a slighty larger observed average gain for the individuals who scored initially in the 300-400 range on the quantitative test, compared with score gains at this range on the verbal test (see Appendix B). However, because of the reliability difference, the true gain for these initially low- scoring individuals is about the same as for the comparable verbal scores. Conversely, the average gain for individuals above the overall quantitative mean is proportionately somewhat less than that found in the verbal area. In summary then, the "true" gain on retesting for low-scoring individuals in the quantitative area is approximately the same as for similar individuals in the verbal area, or about 20 points. However, the initially higher scoring individuals (590-600 range) on the quantitative tests have "true" gains in the 20-22 point area, whereas individuals scoring in this range in the verbal area gain 29-30 points.
A word of caution is in order concerning these estimates of "true" gain. We have assumed that the reliability of a test is relatively invariant throughout the range of observed scores. One would expect the test to be less reliable at the very low score ranges (because of more guessing) as compared with the 500-600 score range. Thus, our estimates of "true" gain in the 300-400 range may be slightly overestimated. In short, the very low-scoring repeaters may well have a larger error component in their gains than is being estimated above, which would reduce the amount of "true" gain that could be expected.

-17-
Characteristics of Repeaters
Appendices G and H present frequency distributions of gains on first retest for verbal and quantitative scores. The dis- tributions of gain are quite similar for each aptitude area, with approximately 70% of the repeaters showing some score gain on retest. These results are consistent with the hypothesis that repeaters are a self-selected group of test takers who have some reason to think that they can improve their scores.
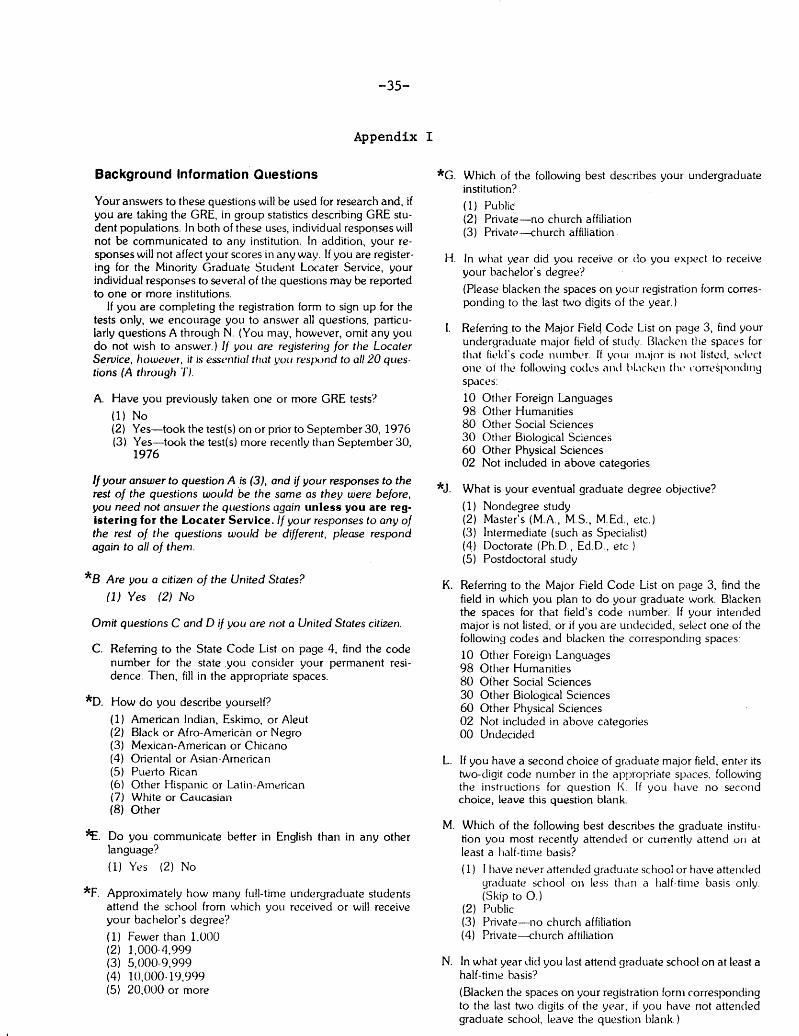
IIn an effort to identify biographical information that might differentiate single repeaters from multiple repeaters, responses to background information questions were used to predict group memberships (i.e., membership in the single repeating group VS. the multiple repeating group). Appendix I presents the background questionnaire items; asterisks identify the items that were included in the regression analysis. Table 4 presents the results of this stepwise regression.
Table 4
Regression of Repeater Group Membership on Demographic Variables
Independent Variables Standard Score Regression Weights to Predict Multiple Repeaters
Multiple Correlation
Initial Verbal Score -01272 Degree Aspirations .0833 R=.166
The stepwise selection procedure was concluded when either the increment in the multiple correlation was less than .Ol or the standard score regression weight was less than .08. These somewhat arbitrary decisions were implemented because the large sample size made statistical tests relatively meaningless. Inspection of the standardized weights suggests that, after controlling for measured ability, a multiple repeater is more likely to have a higher degree objective. Clearly there is considerable unexplained variance with respect to who becomes or does not become a multiple repeater, as indicated by a multiple correlation of only .295. Appendix J presents the intercorrelations, means, and standard deviations for the variables used in the analyses reported in Table 4 and Table 5.

-180
The biographical information was also used to predict changes in rank ordering from initial test to first retest. That is, are demographic variables related to whether an individual goes up or down from test to retest? Table 5 presents results of stepwise regressions of verbal and quantitative retest scores on initial scores and "significant" demographic variables.
Table 5
Regressions of Verbal and Quantitative Retest Scores on Initial Scores and Significant Demographic Variables
Independent Variables
Verbal Retest Quantitative Retest Standard Score Standard Score Regression Regression weights
weights
Initial Verbal Score Initial Quantitative Score U.S. citizen
(yes=l, no=Z)
.8525 .1252
.0785 R=.8891 .8051 R=.8708 .0880
The same criteria discussed above were used for inclusion of a variable in the final equation. As in the case of predicting repeater group membership, demographic information adds little to the prediction of rank-order changes on retesting. However, one interesting comparison between gains on the verbal and quanti- tative areas can be made. For the quantitative area, test takers are more likely to show slightly greater gains when controlling for initial status if they are not U.S. citizens (i.e., for the most part, they use English as a second language). The opposite appears to be true in the verbal area. That is, although the verbal regression for U.S. citizens was not quite "significant" by the stipulated criterion (0. OSl), it was negative in sign, indicating that non-U.S. citizens gain less than U.S. citizens on retesting in the verbal area. The reader should note that this is probably an underestimate of the effect of citizenship since the partial regression weight tends to underestimate the effect of a dichotomous variable when the split is extreme. In this case approximately 89% of the retesters are U.S. citizens, while only 11% report that they are non-U.S. citizens.

-19-
Because of such "slim splits" on some of the demographic variables and the resulting possible underestimate of their relation- ship to score gain, additional analyses of gains were carried out for these variables. Table 6 presents mean gains for selected subgroups whose effeyts were likely to be underestimated in the regression analysis.
Inspection of Table 6 indicates that there is a slight difference in favor of the U.S. citizens with respect to average gain on the verbal test. However, on the quantitative test the non-U.S. citizens average a gain 11 points higher than the gain of U.S. citizens. This result is, of course, consistent with results of the stepwise multiple regression analysis reported in Table 5. It is possible that there may be a quantitative "practice" effect for non-U.S. citizens in the sense that they may not be as familiar as U.S. citizens with the objective test format and item types= It is also likely that a slight improvement in language facility may be just enough to bring a foreign student's language capabilities to the minimum level necessary to perform well on the quantitative test. This gain is even more impressive when one considers that non-U.S. citizens' initial quantitative test scores average 22 points higher than the initial mean scores of U.S. citizens. Clearly, the non-U.S. citizen is an example of the type of individual who because of language limitations may well expect to gain on repeating the quantitative test.
Table 6 also shows that the Black mean score gain on first retest in the verbal area is approximately 10 points less than that of the White population and 6 points less than that of "Other" groups. One might expect that part of this disparity reflects the fact that the initial verbal mean score of Black repeaters is closer to the overall Black verbal mean score than is the case for White repeaters. That is, the Black repeaters' initial verbal score (365.06) is only about 5 points less than the overall Black mean. Thus, we might expect almost no regression effects for Black repeaters. However, members of the total repeater population with initial verbal scores near the mean verbal score for the total GRE population still gained approximately 26 points on retesting (e.g., Figure 1 and Appendix A). Therefore, the explanation of this differential gain on the basis of regression effects appears unlikely. What seems more likely is that the higher scoring repeaters are more likely to profit from their previous mistakes and thus show proportion- ately larger "true" gains on retesting--that is, larger gains
1 Since questionnaire data were available only for test takers in
1976-1978, the number of cases available for these analyses was much smaller than for earlier analyses.

Table 6
Mean Scores on Initial Testing and Mean Gains on First Retesting for Selected Subgroups
Groups
Verbal Quantitative
Mean Standard Mean Standard Score on Mean Gain Deviation Score on Mean Gain Deviation
N Initial on of the Initial on of the Testing Retesting Gains Testing Retesting Gains
I
U.S. Citizen 9838 474.71 23.80 56.34 492.33 20.38 66.59 7
Not U.S. Citizen 1247 341.38 21.33 62.71 514.60 31.30 73.60
White 8077 483.93 24.76 56.50 504.40 20.68 66.45
Black 684 365.06 14.77 55.99 360.96 18.87 67.02
Others 1138 425.81 21.05 58.17 489.48 23.17 69.34

-21-
independent of regression artifacts. Another possibility is that many Blacks may be encouraged by peers (or admissions officers) to repeat tests even though their initial test scores are reasonably representative of their present performance level on academic tasks of the types that are covered-by the tests.
Simplex Model
Up to this point, we have investigated changes in level or mean gains (with the exception of the regression analysis) when individuals repeat the GRE Aptitude Test. Appendices K, L, and M present the correlational tables that underlie the simplex model and that are concerned with changes in rank order over repeated retestings. Men and women with 4 administrations were combined in Appendix K; Appendices L and M show correlations by aptitude area within sex. Inspection of the correlations suggests that there is little or no change in rank order for the verbal testings. The small observed changes probably result from differences in time lapse among the individuals being retested. That is, one individual might have one year between his second and third testing, while another individual might have only 4 months. The earlier results from the regression analysis (Table 3 and Appendices C and D) suggest that individuals tend to gain more on verbal retesting with longer time lapses between testings.
The quantitative retest scores are only slightly less correlated with one another than are the verbal retest scores. In both the verbal and the quantitative area, when the sexes are combined, the pattern of correlations follows the simplex model with no reversals. That is, correlations adjacent in time are the highest, and as the testings become more distant, the correlations become smaller.
Inspection of Appendices K and L, however, shows reversals in the expected simplex pattern for females. The asterisks indicate three reversals in the quantitative area and one in the verbal area for females. There are no reversals for males. The extent of female reversals is small, and, considering the sample size (n = 290), any conclusions would at best be very tentative. The reversals, however, are consistent with the notion that females may show a deviation from simplex patterns (particularly in mathematics) because of less consistent opportunities to maintain their quantitative skills between retestings.
-22-
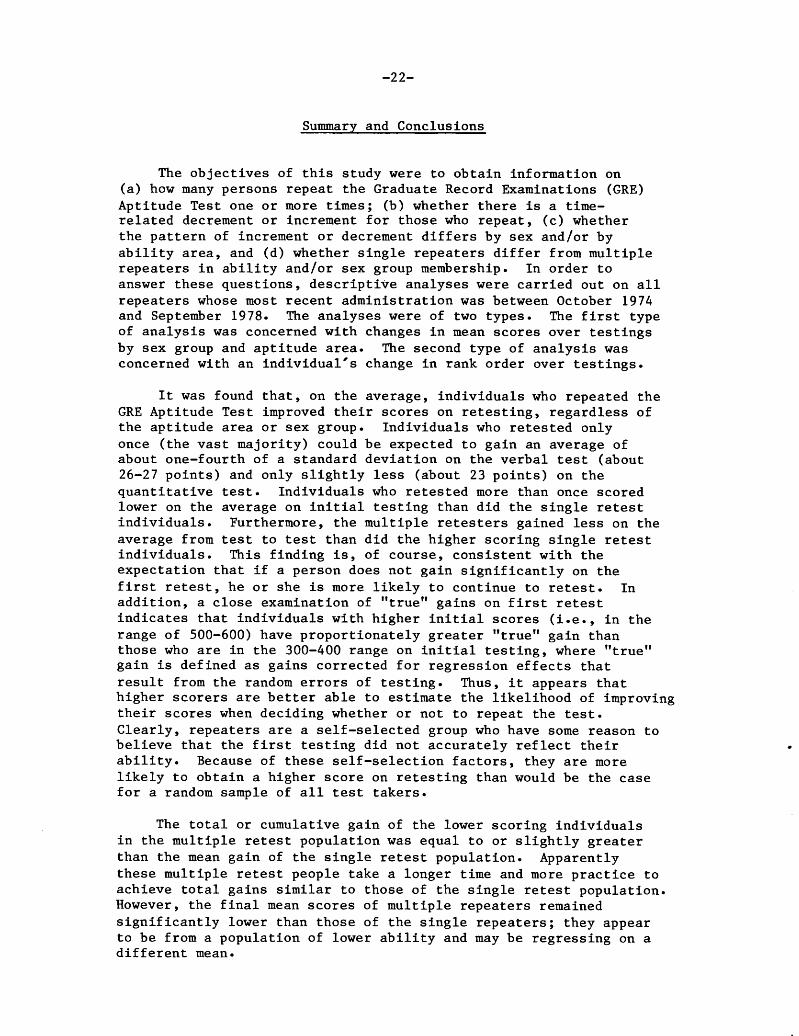
Summary and Conclusions
The objectives of this study were to obtain information on (a) how many persons repeat the Graduate Record Examinations (GRE)
Aptitude Test one or more times; (b) whether there is a time- related decrement or increment for those who repeat, (c) whether the pattern of increment or decrement differs by sex and/or by ability area, and (d) whether single repeaters differ from multiple repeaters in ability and/or sex group membership. In order to answer these questions, descriptive analyses were carried out on all repeaters whose most recent administration was between October 1974 and September 1978. The analyses were of two types. The first type of analysis was concerned with changes in mean scores over testings by sex group and aptitude area. The second type of analysis was concerned with an individual's change in rank order over tes tings.
It was found that, on the average, individuals who repeated the GRE Aptitude Test improved their scores on retesting, regardless of the aptitude area or sex group. Individuals who retested only once (the vast majority) could be expected to gain an average of about one-fourth of a standard deviation on the verbal test (about 26-27 points) and only slightly less (about 23 points) on the quantitative test. Individuals who retested more than once scored lower on the average on initial testing than did the single retest individuals. Furthermore, the multiple retesters gained less on the average from test to test than did the higher scoring single retest individuals. This finding is, of course, consistent with the expectation that if a person does not gain significantly on the first retest, he or she is more likely to continue to retest. In addition, a close examination of "true" gains on first retest indicates that individuals with higher initial scores (i.e., in the range of 500-600) have proportionately greater "true" gain than those who are in the 300-400 range on initial testing, where "true" gain is defined as gains corrected for regression effects that result from the random errors of testing. Thus, it appears that higher scorers are better able to estimate the likelihood of improving their scores when deciding whether or not to repeat the test. Clearly, repeaters are a self-selected group who have some reason to believe that the first testing did not accurately reflect their ability. Because of these self-selection factors, they are more likely to obtain a higher score on retesting than would be the case for a random sample of all test takers.
The total or cumulative gain of the lower scoring individuals in the multiple retest population was equal to or slightly greater than the mean gain of the single retest population. Apparently these multiple retest people take a longer time and more practice to achieve total gains similar to those of the single retest population. However, the final mean scores of multiple repeaters remained significantly lower than those of the single repeaters; they appear to be from a population of lower ability and may be regressing on a different mean.

-239
Both males and females demonstrated, with certain minor exceptions, the same overall patterns of gain. The average gains over retestings were slightly in favor of the males. This slight difference could be explained by regression toward different group means. That is, the initial test scores of male retesters were farther below the male population mean scores than were the corresponding scores for the females and thus one would expect greater gains for the males on the basis of regression effects. Women were proportionately less persistent than men with respect to continuing to retest. Both men and women single repeaters showed greater verbal gains when there were longer time lapses (up to 3 years or more) between testings, contrary to our initial hypothesis of some score loss with long time spans between testings. It was concluded that much of these retest gains in the verbal area reflected increased knowledge and not just practice effects. There was no apparent relationship between time lapse and quantitative gains. For men only, there was some indication that the amount of expected increase might decline with longer time intervals (e.g., more than 2 years) between tests, but there continued to be average gains at every time interval for both sexes.
Gains that could reasonably be attributed only to short-term practice effects appeared on the quantitative test, and only for men. That is, men in the single retest population showed the greatest gain in quantitative scores if retested within five months or less. This was not true for women.
Analysis of non4.S. citizens showed that they made greater gains on retesting in the quantitative area than did the U.S. citizens. There was little difference between U.S. and non-U.S. citizens with respect to verbal gains. Black repeaters showed less verbal gain on the average than did the White and "Other" repeaters. All racial groups showed about the same average retest gain on the quantitative test.
Tables were compiled that report the mean gain of single repeaters at various initial test score levels (see Appendices A and B). These may be of use to test takers in deciding whether or not to repeat the test, and to admissions directors in interpreting multiple test scores.
One should not conclude from the above findings that every GRE candidate if retested could expect to gain 20 to 27 points. Individuals who retest are self-selected in -many unknown ways. Many may decide to retest because they did not finish the first time they took the test, because of poor time scheduling, because they feel they made mistakes that they could rectify on re-examination, or because they feel they know more. In other words, they elect to take the test again because they have some reason to think that they can improve their scores. The results reported in this paper confirm their expectations.
-24-
References
Campbell, J. T., Hilton, T. L., & Pitcher, B. Effects of repeating on test scores of the graduate record examinations (GRE Special Report 67-l). Princeton, N.J.: Educational Testing Service, April 1967.
Levine, R. S., & Angoff, W. H. The effects of practice and growth on scores on the Scholastic Aptitude Test (ETS SR-58-6). Princeton, N.J.: Educational Testing Service, February 1958.
Lord, F. M., & Novick, M. Statistical theories of mental tests scores. Reading, Mass.: Addison-Wesley, 1968.
Owens, W. A. Age and mental abilities: A second adult follow- UP* Journal of Educational Psychology, 1966, 57, 311-325.
Weiss, R. A. The effects of practicing a test: A review of the literature (ETS RM-61-12). Princeton, N.J.: Educational Testing Service, November 1961.
Werts, C. E., Linn, R. L., 6 Jdreskog, K. G. A simplex model for analyzing academic growth. Educational and Psychological Measurement, 1977, 37, pp- 745-756.

-25-
Appendix A
Verbal Score Changes on Retesting by Level of Initial Score
(Single Repeaters Only)
Initial GE-V Score
200
210
220
230
240
250
260
270
280
290
300
310
320
330
340
350
360
370
380
390
400
410
420
430
440
450
460
470
480
N -
365
201
330
311
521
425
729
559
700
808
628
941
837
1110
857
1295
1221
1206
1636
1352
1835
1389
1681
1704
1802
1988
1777
2067
1584
Mean Gain
62.2
60.3
52.0
47.8
40.9
35.1
33.8
27.0
27.0
28.6
32.4
33.1
30.4
29.4
29.6
30.3
32.4
29.7
32.7
30.1
30.7
30.6
31.4
30.4
27.0
31.2
27.0
29.5
27.9
SD(N-1) Low High
51.0 0.0 330.0
67.3 -10.0 530.0
60.1 -20.0 540.0
57.8 -30.0 370.0
59.6 -40.0 440.0
52.9 -50.0 280.0
59.4 -60.0 470.0
54.8 -70.0 230.0
54.5 -80.0 240.0
62.1 -90.0 410.0
57.9 -100.0 340.0
56.5 -110.0 310.0
57.6 -120.0 390.0
57.1 -130.0 330.0
58.8 -130.0 220.0
57.9 -150.0 370.0
58.5 -160.0 280.0
56.4 -160.0 390.0
58.7 -180.0 360.0
58.2 -180.0 320.0
57.3 -200.0 220.0
57.2 -150.0 270.0
56.8 -140.0 250.0
59.0 -170.0 260.0
57.4 -180.0 340.0
56.5 -160.0 250.0
55.4 -200.0 270.0
57.6 -230.0 330.0
58.4 -170.0 260.0
Range of Score Changes


-27-
Appendix B
Quantitative Score Changes on Retesting by Level of Initial Score
(Single Repeaters Only)
Initial GRE-Q Score
200
210
220
230
240
250
260
270
280
290
300
310
320
330
340
350
360
370
380
390
400
410
420
430
440
450
460
470
480
N
343
213
293
208
344
377
418
277
479
565
707
749
895
799
860
707
1120
1224
1338
1492
1324
1281
1371
1750
1659
1657
1962
1497
1624
Mean Gain
58.3
54.0
52.6
53.2
46.0
47.0
52.5
38.1
42.6
37.5
39.8
36.2
36.4
38.2
37.4
37.8
32.8
34.3
35.0
34.9
31.3
33.7
30.5
26.6
28.0
27.3
28.5
28.2
22.0
SD(N-1) Low Hinh 61.9 0.0 390.0
56.7 -10.0 380.0
59.2 -20.0 400.0
67.9 -30.0 450.0
69.7 -40.0 420.0
62.2 -50.0 300.0
63.9 -60.0 330.0
63.2 -70.0 250.0
65.4 -80.0 310.0
63.8 -90.0 380.0
67.9 -100.0 330.0
66.1 -110.0 450.0
65.9 -120.0 280.0
64.5 -130.0 260.0
69.5 -140.0 330.0
65.6 -150.0 320.0
66.8 -160.0 340.0
66.0 -170.0 320.0
66.6 -180.0 270.0
66.0 -190.0 300.0
65.7 -160.0 330.0
65.6 -210.0 370.0
65.4 -180.0 270.0
61.9 -180.0 270.0
65.1 -180.0 270.0
63.4 -160.0 240.0
64.6 -200.0 280.0
64.8 -190.0 300.0
64.1 -180.0 250.0
Range of Score Changes

-28-
Appendix B (Continued)
Initial GRE-Cj Score
490
500
510
520
530
540
550
560
570
580
590
600
610
620
630
640
650
660
670
680
690
700
710
720
730
740
750
760
770
N -
1434
1808
1596
1706
1880
1205
1481
1524
1220
1460
1227
717
1020
1040
918
753
700
679
565
597
479
326
400
243
268
208
186
196
128
Mean Gain SD(N-1)
Range of Score Changes Low High
24.6 64.0 -180.0 260.0
19.4 63.0 -180.0 240.0
18.8 62.7 -310.0 280.0
18.4 65,9 -240.0 220,o
21.0 65.1 -290.0 250.0
18.0 62.5 -200.0 220.0
18.2 63.9 -220.0 230.0
15.7 65.6 -360.0 220.0
13.5 65.3 -290.0 200.0
10.9 63.8 -210.0 220.0
14.5 62.9 -340.0 210.0
4.1 60.9 -190.0 200.0
7.1 61.2 -180.0 200.0
6.5 62.4 -300.0 190.0
6.9 62.5 -280.0 190.0
8.3 58.4 -170.0 190.0
4.1 59.3 -170.0 180.0
10.9 59.8 -210.0 180.0
- 0.7 64.4 -470.0 160.0
2.2 57.1 -190.0 150.0
1.8 59.7 -490.0 140.0
4.0 59.6 -280.0 150.0
4.4 51.7 -190.0 140.0
- 8.2 54.1 -190.0 110.0
-12.0 57.4 -290.0 90.0
- 4.2 50.4 -180.0 90.0
- 3.6 48.9 -160.0 110.0
- 9.8 55.4 -230.0 90.0
-10.3 55.3 -440.0 80.0

-29-
Appendix C
Verbal Score Gains for Males by Time Lapse
(Single Repeaters Only)
Number of months between
test and retest
l- 5
6 - 10
11 - 15
16 - 20
21 - 25
26 - 30
31 - 35
36 +
N
10,122 23.8 56.5
6,551 26.6 57.4
5,066 28.7 56.0
1,941 30.1 60.0
2,912 35.4 59.1
1,372 37.1 57.9
494 37.2 68.8
538 36.2 63.3
Mean Gain SD(N-1)

-3o-
Appendix D
Verbal Score Gains for Females by Time Lapse
(Single Repeaters Only)
Number of months between
test and retest Mean
N Gain SD(N-1)
l- 5 9,558 23.7 55.9
6 - 10 5,736 25.3 56.1
11 - 15 4,214 28.1 56.0
16 - 20 1,454 28.9 60.2
21 - 25 1,961 30.2 58.6
26 - 30 1,010 32.1 57.1
31 - 35 327 30.5 59.7
36 + 402 27.3 56.0

-31-
Appendix E
Quantitative Score Gains for Males by Time Lapse
(Single Repeaters Only)
Number of months between
test and retest
l- 5
6 - 10
11 - 15
16 - 20
21- 25
26 - 30
31 - 35
36 +
N
10,122
6,551
5,066
1,941
2,912
1,372
494
538
Mean Gain
25.1
22.5
23.0
24.1
22.3
20.5
18.9
16.0
SD(N-1)
65.8
64.5
65.8
65.8
66.9
62.6
74.7
67.3

-32-
Appendix F
Quantitative Score Gains for Females by Time Lapse
(Single Repeaters Only)
Number of months between
test and retest
l- 5
6 - 10
11 - 15
16 - 20
21 - 25
26 - 30
31 - 35
36 +
N
9,558
5,736
4,214
1,454
1,961
1,010
327
375
Mean Gain
23.4
21.4
23.3
23.9
23.4
22.7
21.3
28.5
SD(N-1)
64.5
63.7
65.0
63.8
66.6
66.4
67.4
66.2

-33-
GRE REPEATER DATA
Appendix G
Frequency Distribution of Verbal Gains on First Retesting
SCORE IWERVALS F PC1 CF C-PCT
MORE THAN 200 171 0.3 59857 100.0 200.000 57 0.1 59686 99.7 190.000 82 0.1 59629 99.6 180.000 117 0.2 59547 99.5 170.000 169 0.3 59430 99.3 160.000 230 0.4 59261 99.0 150.000 380 0.6 59031 98.6 140.000 516 0.9 58651 98.0 130.000 751 1.3 58135 97.1 120.000 1003 1.7 57384 95.9 110.000 1269 2.1 56381 94.2 100.000 1621 2.7 55112 92.1
90.000 2101 3.5 53491 89.4 80.000 2463 4.1 51390 85.9 70.000 3093 5.2 48927 81.7 60.000 3552 5.9 45034 76.6 50.000 3817 6.4 42282 70.6 40.000 4163 7.0 38465 64.3 30.000 4253 7.1 34302 57.3 20.000 4403 7.4 30049 50.2 10.000 9052 6.8 25646 42.8
0.0 4046 6.0 21594 36.1 -10.000 3630 6.1 17540 29.3 -20.000 3131 5.2 13918 23.3 -30.000 2667 4.5 10787 18.0 -40.000 2125 3.6 8120 13.6 -50.000 1714 2.9 5995 10.0 -60.000 1360 2.3 4201 7.2 -70.000 913 1.5 2921 4.9 -80.000 673 1.1 2008 3.4 -90.000 488 0.8 1335 2.2
-100.000 295 0.5 047 1.4 -110.000 206 0.3 552 0.9 -120.000 112 0.2 346 0.6 -130.000 87 0.1 234 0.4 -140.000 55 0.1 147 0.2 -150.000 26 0.0 92 3.2 -160.000 17 0.0 66 0.1 -170.000 21 0.0 49 0.1 -180.000 10 0.0 28 0.0 -1Y0.000 2 0.0 18 0.0 -200.000 7 0.0 16 0.0
LESS THAN 200 9 0.0 9 0.0
TOTAL

-34- GRE REPEATER DATA
Appendix H
Frequency Distribution of Quantitative Gains on First Retesting
TOTAL
SCORE INTERVALS F PC1 CF C-PCT
MORE THAN 200 228 0.4 59857 100.0 200.000 107 0.2 59629 99.6 190.000 134 0.2 59522 99.4 180.000 192 0.3 59388 99.2 170.000 268 0.4 S9196 98.9 160.000 402 0.7 58928 98.4 150.000 473 0.8 S8526 97.8 140.000 666 1.1 58053 97.0 13LOOO 882 1.5 57387 95.9 120.000 1091 1.8 56505 94.4 110.000 1336 2.2 55414 92.6 100.000 1656 2.8 54078 90.3
90.000 2050 3.4 52422 87.6 80.000 2388 4.0 50372 84.2 70.000 2820 4.7 47984 80.2 60.000 3064 5.1 45164 75.5 50.000 3358 5.6 42100 70.3 40.000 3530 5.9 38742 64.7 30.000 3733 6.2 35212 58.8 20.000 3751 6.3 31479 52.6 10.000 3825 6.4 27728 46.3
0.0 3671 6.1 23903 39.9 -10.000 3417 5.7 20232 33.8 -20.000 3081 5.1 16815 28.1 -30.000 2770 4.6 13734 22.9 -40.000 2256 3.8 10964 18.3 -50.000 1965 3.3 8708 14.5 -60.000 1660 2.8 6743 11.3 -70.000 1308 2.2 5083 0.5 -80.000 999 1.7 3775 6.3 -90.000 822 1.4 2776 4.6
-100.000 592 1.0 1954 3.3 -110.000 414 0.7 1362 2.3 -120.000 288 0.5 940 1.6 -130.000 213 0.4 660 1.1 -140.000 147 0.2 447 0.7 -150.000 87 0.1 300 0.5 -160.000 69 0.L 213 0.4 -170.000 46 0.1 144 0.2 -180.000 37 0.1 98 0.2 -190.000 24 0.0 61 0.1 -200.000 7 0.0 37 0.1
LESS T&Q? 200 30 0.1 30 0.1
-35-
Appendix I
Background Information Questions
Your answers to these questions will be used for research and, if you are taking the GRE, in group statistics describing GRE stu- dent populations. In both of these uses, individual responses will not be communicated to any institution. In addition, your re- sponses will not affect your scores in any way. If you are register- ing for the Minority Graduate Student Locater Service, your individual responses to several of the questions may be reported to one or more institutions.
If you are completing the registration form to sign up for the tests only, we encourage you to answer all questions, particu- larly questions A through N. (You may, however, omit any you do not wish to answer.) If you are registering jar the Locater Service, howeuer, it 1s esscvVial lh0t lrou rtyhmd to all 20 ques- tions (A through 1‘).
A. Have you previously taken one or more GRE tests?
(1) No (2) Yes--took the test(s) on or prior to September 30, 1976 (3) Yes--took the test(s) more recently than September 30,
1976
ff your answer to question A ,is (3), and if your responses to the rest of the questions would be the same OS they were before, you need not answer the questions clgain unless you are reg- istering for the Locater Service. I/ your responses to any oj the rest of the questions would be different, please respond again to all of them.
*B Are you a citizen of the United States?
(I) Yes (2) No
Omit questions C and D if you are not a United States citizen.
C. Referring to the State Code List on page 4, find the code number for the state ,you consider your permanent resi- dence. Then, fill in the appropriate spaces.
*D. How do you describe yourself?
9.
*kF.
(1) (2) (3) (4) (5) (6) (7) (8)
American Indian, Eskimo, or Aleut Black or Afro-American or Negro Mexican-American or Chicano Oriental or Asian-American Puerto Rican Other Hispanic or Latin-American White or Caucasian Other
Do you communicate better in English than in any other language’!
(1) Yes (2) No
Approximately how many full-time undergraduate students attend the school from which you received or will receive your bachelor’s degree?
(1) Fewer than 1,000 (2) 1 ,ooo-4,999 (3) 5,000-9,999 (4) 10,000- 19,999 (5) 20,000 or more
*kG.
H.
1.
*J.
K.
L.
M
N.
Which of the following best describes your undergraduate institution?
(1) Public (2) Private-no church affiliation (3) Privat+-church affiliation
In what year did you receive or do you expect to receive your bat helor’s degree?
(Please blacken the spaces on your registration form corres- ponding to the last two digits of the year.)
Referring to the Major Field Code List on page 3, find your undergraduate major field of study. Blacktn the spaces for that fit~l~l’s code nirmhcv If ynut myor is 1101 listed, sc+yct one’ o! tile follo\ving codes alit1 t)l,\ckcll thrl ~.orre$polldlrig spXrs:
10 Other Foreign Languages 98 Other Humanities 80 Other Social Sciences 30 Other Biological Sciences 60 Other Physical Sciences 02 Not included in above categories
What is your eventual graduate degree objective?
(1) Nondegree study (2) Master’s (M.A., M.S., M.Ed., etc.) (3) Intermediate (such as Specialist) (4) Doctorate (Ph.D., Ed.D., etc ) (5) Postdoctoral study
Referring to the Major Field Code List on page 3, find the field in which you plan to do your graduate work. Blacken the spaces for that field’s code number. If your intended major is not listed, or if you are undecided, select one of the following codes and blacken the corresponding spaces.
10 Other Foreign Languages 98 Other Humanities 80 Other Social Sciences 30 Other Biological Sciences 60 Other Physical Sciences 02 Not included in above categories 00 Undecided
If you have a second choice of gr‘iduate major field, enter its two-digit code number in the appropriate spcjces, following the instructions for question K If you hdvc no second choice, leave this question blank.
Which of the following best describes the graduate institu- tion you most recently attended or currently attend 011 at least a half-tiine basis?
(1) I h‘jve never attended yraduilte school or have attended yrnduate school on less th,in a Ilalf-time basis only. (Skip to 0.)
(2) Public (3) Private-no church affiliation (4) Private-church aftiliation
In what year did you last attend graduate school on at least a half-tinle basis?
(Blacken the spaces on your registration form corresponding to the last two digits of the year, if you have nof attended graduate school, leave the question blank.)

-3b-
Appendix I (Continued)
*o
* P.
Q
In coursta< in your undergraduate major field only, what grade abfjrage have you received so far? (If your college cloes not use letter yr~~des. please mark the letter grade that is the closest equivalent to your grade average.)
(1) D or lower (2) c- (3) c
(4) B- (5) B (6) A- (7) A
Considering only yo\lr last two college years, approximately what overall grade average have you re,ceived? (If your col- lege does not use letter grades, please mark the letter grade that is the closest equivalent to your grade average.)
(1) D or lower (2) C-
(3) c (4) B- (5) B (6) A- (7) A
1s there any geographic region in which you would not want to or could not attend graduate school? (Mark more than one response, if applicable. )
(1) (2)
(3)
(4)
(5)
Any region would be acceptable New England (Connecticut, Maine, Massachusetts, New llampshire. Rhode Island, Vermont) Mid-Atlantic (Delaware, District of Columbia, Maryland, New (Jersey. New York, Pennsylvania) South (Alabama, Arkansas, Florida, Georgia, Kentucky, Louisiana, Mississippi, North Carolina, South Carolina, Tennessee, Virginia. West Virginia) Midwest (Illinois. Indiana, Iowa, Kansas, Michigan, Minnesota, Missouri, Nebraska. North Dakota, Ohio, South Dakota. Wisconsin)
23 Spanish 24 Speech
SOClALSCtENCES 77 An-erbcan Studlec HI Anthropology 82 Rrrsinrss and Commerce X7 Cnmmurications 84 Fconomics X5 Cducatton CincludinR M A
in Teachrnp,) 01 Edlrcational Administration 03 Educatlnnal Psychology 70 C?nKraphy 92 Covrrnment V? Guidance and CounselinK 86 lliztoy 87 Indu*,triil Relations
and Pf=rwnnrI RR Intfrnatlonal Rclatrnns 19 Int~rnallzm
H9 Law
*RR.
*S.
T.
(6) Southwest (Arizona, California, Nevada, New Mexico, Oklahoma, Texas)
(7) West (Alaska. Colorado, Hawail. Idaho, Montana, Oregon, Utah, Washington, Wyoming)
About how many hours per week did you spend working for wages during your most recent school year?
(1) 0 (2) l-5 (3) 6-10 (4) 1 l-20 (5) More than 20
About how many hours per week did you spend in com- munity (noncollege) activities during your most recent school year?
(1) 0 (2) l-5 (3) 6-10 (4) 11-20 (5) More than 20
For which of the following achievements have you received an honor, award. prize, or other recognition? (Mark more than ape if applicable.)
(1) (2)
(3)
(4)
(5)
(7) (8)
Student government or organization Preprofessional-an award or prize for fieldwork or pub- lication of a scholarly article or book Community service-election or appointment to a community service unit, activity. or group Literary---editing the college paper, yearbook, or literary magazine or having a poem, story, or article published in a public paper or magazine Artistic-+ high rating in a music contest, a part in a play, opera, or show, or an award in an art competition Athletic-a letter in athletics None of the above categories
Major Field Code List
90 Library Science 91 Physical Education 92 Political Science 93 Psychology 94 Public Administration 55 Slavic Studirs 79 Social Psycholow 95 Social Work 96 Sociology 97 Urban Development
(regional planning)
BIOLOGICAL SCIENCES 31 Agriculture 32 Anatomy 05 AudioloRy 71 Racteriology 14 Riochemistry 75 Riolow 16 PiophyGcs 37 Botany 38 Dentistry
39 Entomology 40 Forestry 06 Genetics 41 Home Fconomics 75 Hospital and Health
Srrviccs AdmInistratIon
42 Medicine 07 Microbiology 43 Nursing 77 Nutrition 44 Occupational Therapy 45 Optometry 46 Osteopathy 08 Parasitology 56 Pathology 0 1 Pharmacology 47 Pharmacy 4R Phvsccal Therapy 49 Phy<ioloCn
SO Pirhllc Health 51 Vctrrrnary Mrdicine
57 7ook’gy
PHYSICALSCIENCES 54 Applied Mathematics 61 Astronomy 67 Chemistry 78 Computer Sciences 67 rnglneering. Aeronautical 64 Engineering, Chemical 65 Engineering, Civil 66 Engineering. Electrical 67 Engineering, Industrial 68 Engineering, Mechanical 69 Engineering, Other 71 Geology 72 Mathematics 73 Metallurgy 74 Minmg 75 Oceanography 76 Physics 59 Statistics
*The asterisked items above were used in the stepwise regression analysis. The coding of the nominal item responses varied depending on the hypothesis being tested.

GRP 1.00
DV - .07
DQ - .06
Vl - .13
v2 - .15
Ql - .09
Q2 - .12
B .04
D .05
E .04
F .04
G - .03
J .04
0 - .06
P - .02
R 107
S .03
Mean
Standard Deviation
Group
ti
2nd Testing minus 1st Testing
Appendix J
Intercorrelations, Means, and Standard Deviations for the Variables Reported in Table 4 and Table 5
GRP DV DQ Vl v2 Q1 42 B D E F G J 0 P R S
1.00
.05 1.00
- .ll .04
.36 .07
.09 - .20
.ll .32
- .Ol .05
- .04 .Ol
- .03 .04
- .Ol - .Ol
.02 .02
.03 - .Ol
.06 .oo
.05 .oo
- .03 - .Ol
- .02 .oo
1.00
.89 1.00
.43 .44
.44 .46
- .38 - .36
- .29 - .30
- .34 - .34
- .Ol - .02
.15 .16
.28 .28
.29 .31
.28 .29
- .03 - .04
- .07 - .07
1.00
.86
.06
- .21
.04
.02
.06
.23
.24
.23
- .14
- .lO
1.00
.09 1.00
- .20 .29 1.00
.07 .67 .31 1.00
.Ol - .04 - .04 - .Ol 1.00
.06 - .05 .oo - .04 - .55 1.00
.21 - .05 - .02 - .05 - .05 .06 1.00
.23 - .08 - .14 - .08 - .oo .03 .25 1.00
.23 - .06 - .15 - .06 - .oo .Ol $28 ,68 1.00
- .14 - .ll .07 - .07 .03 - ,05 .09 - ,04 - .Ol 1.00
- .09 - .oo .09 .Ol .03 - .02 .04 - .03 .oo ,18 1.00
.lO 25.75 21.86 451.49 477.24 478.26 500.12 1.11 .18 1.09 3.39 1.36 3.26 5.34 5.43 3.15 2.18
.30 56.98 64.87 114.58 122.31 121.99 126.34 .32 .39 .29 1.28 .48 1.05 1.08 1.04 1.56 1.07

-38-
Appendix R
Intercorrelations of Scores on Successive Retests for the
Total Four-Administration Population
Test Admin- istration 1
2 .8591
3 .8532
4 .8267
S.D. 113.7977
Test Admin- istration
2
3
4
S.D.
1
.8211
.8136
.8096
121.0100
Verbal Scores (N=217)
2 3 4
.8678
.8420 .8633
111.0935 106.0310 99.5342
Quantitative Scores (N=217)
2 3
.8624
.8410 .8602
117.8918 111.8673 111.4044

-39-
Appendix L
Intercorrelations of Verbal Scores on Successive Retests
for the Four-Administration Population, by Sex
Test Admin- istration
2
3
4
S.D.
Test Admin- istration
2
3
4
S.D.
Male (N=144)
1 2 3 4
.8565
.8427
.8257
112.2126
.8581
.8417 .8618
110.5748 105.7340 98.5127
Female (N=73)
2 3 4 1
.8550
.8699* .8840
.8295 .8393 .8623
116.3298 111.0404 104.5958 99.8689
*Does not follow the simplex pattern.

-4o-
Appendix M
Intercorrelations of Quantitative Scores on Successive Retests
for the Four-Administration Population, by Sex
Test Male (N=144) Admin- istration 1 2 3 4
2 .8024
3 .7819 .8510
4 .7790 .8338 .8409
S.D. 115.5759 114.8604 108.6614 108.1553
Test Admin- istration
2
3
4
S.D.
1 3
.8351
.8513* .8649
.8417 .8321* .8788
123.2027 116.2732 111.1621 109.6137
*Does not follow the simplex pattern.

GRE BOARD RESEARCH REPORTS OF A TECHNICAL NATURE
Boldt, R. R. Comparison of a Bayesian and a Least Squares Method of Educational Prediction. GRE Board Professional Report GREB No. 70-3P, June 1975.
Campbell, J. T. and Belcher, L. H. Word Associations of Students at Predominantly White and Predominantly Black Colleges. GRE Board Professional Report GREB No. 71-6P, December 1975.
Carlson, A. B.; Reilly, R. R.; Mahoney, M. H* and Casserly, P. L. The Dicelopment and Pilot Testing of Criterion Rating Scales. GRE Board Professional Report GREB No. 73-lP, October 1976.
Carlson, A. B.; Evans, F.R.; and Kuykendall, N. M. The Feasibility of Common Criterion Validity Studies of the GRE. GRE Board Professional Report GREB No. 71-lP, July 1974.
Donlon, T. I?. An Exploratory Study of the Implications of Test Speededness. GRE Board Professional Report GREB No. 76-9P, March 1980.
Donlon, T. F.; Reilly, R. R.; and McKee, J. D. Development of a Test of Global VS. Articulated Thinking: The Figure Location Test. GRE Board Professional Report GREB No. 74-9P, June 1978.
Echternacht, G. Alternate Methods of Equating GRE Advanced Tests. GRE Board Professional Report GREB No. 69-2P, June 1974.
Echternacht, G. A Comparison of Various Item Option Weightfng Schemes/A Note on the Variances of Empirically Derived Option Scoring Weights. GRE Board Professional Report GREB No. 71-17P, February 1975.
Echternacht, G. A Quick Method for Determining Test Bias. GRE Board Professional Report GREB No. 70-8P, July 1974.
Evans, F. R. The GRE-Q Coaching/Instruction Study. GRE Board Professional Report GREB No. 71-5aP, September 1977.
Predericksen, N. and Ward, W. C. Develop- ment of Measures for the Study of Creativity. GRE Board Professional Report GREB No. 72-2P, June 1975.
Levine, M. V. and Drasgow, F. Appropriate- ness Measurement with Aptitude Test Data and Eslmated Parameters. GRE Board Professional Report GREB No. 75-3P, March 1980.
McPeek, M.; Altman, R. A.; Wallmark, M.; and Wingersky, B. C. An Investigation of the Feasibility of Obtaining Additional Subscores on the GRE Advanced Psychology Test. GRE Board Profes- sional Report GREB No. 74-4P, April 1976.
Powers, D. E.; Swlnton, S.; Thayer, De; and Yates, A. A Factor Analytic Investigation of Seven Experimental Analytical Item Types. GRE Board Professional Report GREB NO* 770lP, June 1978.
Powers, D. E.; Swinton, S. S.; and Carlson, A. B. A Factor Analytic Study of the GRE Aptitude Test. GRE Board Professional Report GREB NO. 75-llP, September 1977.
Reilly, R. R. and Jackson, R. Effects of Empirical Option Weighting on Reliability and Validity of the GRE. GRE Board Professional Report GREB No. 71-9P, July 1974.
Reilly, R. R. Factors in Graduate Student Performance. GRE Board Professional Report GREB No. 71-2P, July 1974.
Rock, D. A. The Identification of Population Moderators and Their Effect on the Prediction of Doctorate Attainment. GRE Board Professional Report GREB No. 69-6bP, February 1975.
Rock, D. A. The "Test Chooser": A Different Approach to a Prediction Weighting Scheme. GRE Board Professional Report GREB No. 70-2P, November 1974.
Sharon, A. T. Test of English as a Foreign Language as a Moderator of Graduate Record Examinations Scores in the Prediction of Foreign Students' Grades In Graduate School. GRE Board Profes- sional Report GREB No. 70-lP, June 1974.
Swinton, S. S. and Powers, D. E. A Factor Analytic Study of the Restructured GRE Aptitude Test. GRE Board Professional Report GREB No. 77-6P, February 1980.
Ward, W. C.; Frederiksen, N.; and Carlson, S. B. Construct Validity of Free- Response and Machine-Storable Versions of 8 Test of Scientific Thinking. GRE Board Professional Report GREB No. 74-8P, November 1978.
Ward, W. C. and Frederiksen, N. A Study of the Predictive Validity of the Tests of Scientific Thinking. GRE Board Professional Report GREB No. 74-6P, October 1977.