an analysis of women faculty attitudes, perceptions and
TRANSCRIPT

University of Nebraska - LincolnDigitalCommons@University of Nebraska - Lincoln
Library Philosophy and Practice (e-journal) Libraries at University of Nebraska-Lincoln
Summer 6-13-2018
An Analysis of Women Faculty Attitudes,Perceptions and Experiences of Information AccessCompetencyJeyshankar -. Ramalingam -Dept. of Library and Information Science, Alagappa University, Tamil Nadu, India
Vellaichamy AlagarsamyDept. of Library and Information Science, Alagappa University, Tamil Nadu, India, [email protected]
Follow this and additional works at: http://digitalcommons.unl.edu/libphilprac
Part of the Library and Information Science Commons
Ramalingam, Jeyshankar -. - and Alagarsamy, Vellaichamy, "An Analysis of Women Faculty Attitudes, Perceptions and Experiences ofInformation Access Competency" (2018). Library Philosophy and Practice (e-journal). 1860.http://digitalcommons.unl.edu/libphilprac/1860

AN ANALYSIS OF WOMEN FACULTY ATTITUDES,
PERCEPTIONS AND EXPERIENCES OF INFORMATION
ACCESS COMPETENCY
Dr. R. Jeyshankar
Assistant Professor, Department of Library & Information Science
Alagappa University, Karaikudi-630 003, Email: [email protected]
&
A.Vellaichamy
Research Scholar, Department of Library & Information Science
Alagappa University, Karaikudi-630 003, Email: [email protected]
0. ABSTRACT
The paper aims to present the awareness of library rules, use of library services and
information access competency of the women faculty members (Mother Teresa
Women’s University and its affiliated colleges) was investigated for their opinions and
experiences about assorted techniques of information access. Data were collected
through questionnaire method. Copies of the questionnaires were distributed to 87.59%
of population i.e. 254 out of 290 women faculty members in their staff rooms with the
permission and assistance of the registrar/principal. This study showed that 242
(95.2%) respondents agree/strongly agree that ‘they can access printed and electronic
reference sources’. 235 (92.5%) respondents agree/strongly agree that ‘they can read
the text and understand the main idea from the text’. 210 (82.7%) respondents
agree/strongly agree that ‘they can restate the text in their own words and present data
accurately’. While 83% (213) of the respondents agree/strongly agree that ‘they can
identify similar information from both print and electronic resources’, This study was
conducted on a single group and in a certain academic institutions namely Mother
Teresa Women’s University and its affiliated colleges. Therefore findings and
conclusions may not be applicable and reasonable to be generalized for all the groups
i.e. guest lectures and teaching assistants. This study empirically validated the ten
information access competency variables. The study also investigated the faculty age
and experience, in addition to education level and academic discipline, as new affects.
Keywords – Library services, Information resources, education, library rules, faculty
members, Information access competencies and Information Literacy
1. INTRODUCTION
The educational institutions have an opportunity, and a challenge, to prepare
faculty to meet the demands of the Information Age. The faculty members need to
identify what graduates should know and be able to do. Recipients of a quality
education share certain attributes like critical thinking, problem solving, a global vision
and a multicultural perspective, preparedness for work, and good citizenship. The terms
skills, knowledge, competencies and such other terms are used synonymously in this
study. These terms differ only slightly in meaning from one another. Specifically,
‘Skills’ refers to do something well, arising from talent, training or practice. The
‘Knowledge’ refers to acquaintance with facts, truths, profession or with a particular
subject or branch of learning. The ‘Competence’ refers to the quality or state of having
sufficient skills, knowledge and requirements to do a certain job.
2. REVIEW OF LITERATURE
Literature reviews are the backbone of almost every academic piece of writing.
Condensed overviews of relevant literature allow for grounding the authors’ research
on the state of the art of existing research, thus highlighting the particular scholarly
contribution to the research field. Literature reviews help to narrow down the research
topic as well as explaining and justifying research objectives, overall research design,
and methodology used (Hart, 1998). The study investigates the information literacy
instruction practices, attitudes and perceptions of university faculty at York University.
The study found that majority of respondents support collaboration between faculty and
librarians in teaching information literacy. The study concludes that Faculty who have
organised IL instruction overwhelmingly indicate some benefit in terms of improving
students’ research skills (Bury, 2011). Faculties in the libraries and other university
staff, such as writing centre’s and copyright offices, have expertise in these
competencies that could enhance instruction provided by the faculty (Weiner, 2014).
The discipline, type of institution, and organizational culture may influence the ways in
which faculty collaborate and the extent to which they collaborate (Eddy 2010, p. 55;
McGuinness 2006, p. 575).
There are few studies of faculty to learn what they are teaching in relation to
information literacy (Bury 2011; Garritano and Culp 2010; McGuinness 2006).
Academic staffs are skilled users of the Internet only as far as its application in research
activities is concerned. It is an essentially in the area of literature and

supporting/baseline data searching. They seem not to be as skilled in the use of the
Internet to enhance teaching activities, such as delivering additional lecture notes, and
sending files to students (Ojedokun & Owolabi, 2003). A major reason for studying
teachers’ attitude towards computer use is that it is a major predictor for future
computer use in the classroom (Myers & Halpin, 2002). The success of student learning
with computer technology will depend largely on the attitudes of teachers, and their
willingness to embrace the technology (Teo, 2006). Gaining an appreciation of the
teachers’ attitudes towards computer use may provide useful insights into technology
integration and acceptance and usage of technology in teaching and learning. Some
examples of these are perceived usefulness, knowledge about computers (Yuen, Law &
Chan, 1999), computer confidence (Rovai & Childress, 2002), training (Tsitouridou &
Vryzas, 2003), Information and Communication Technology (Timothy & Olufunke,
2015).
The importance of the internet for information retrieval to support research
activities in research institutes is acknowledged worldwide. One of the problems facing
the development of ICT in schools include the fact that there is limited infrastructural
facilities, difficulties in infusing Internet use into the curriculum and also lack of
appropriate teacher development (Yusuf & Balogun, 2011). Building knowledge of
faculty needs and expectations seemed especially important in the context of a large
and growing information literacy program and majority of this instruction is provided
in response to individual faculty requests for information literacy sessions as part of
courses they are teaching, achieving more strategic integration of IL within core
programs initiated by instructional librarians is also a top priority (Bury, 2011).
Popoola (2017) in his study shows that there was a significant difference in faculty
awareness of available library information products and services. In addition, they did
not have sufficient knowledge of those library products and services pertinent to their
teaching and research activities. The survey also revealed that the level of knowledge of
faculty staff had positive relationship with the frequency of use, consultation with the
librarians, faculty status and membership of library related committees.
Woo (2004) organized an online user survey to evaluate the performance of the
main library and the six branch libraries of University of Hong Kong to identify any
performance gaps and to find out user preferences for print and electronic materials.
The study showed that majority of the respondents preferred to use online journals than
print versions, but on the other hand about 71.8 percent users opted to use printed

books over the electronic mode. Findings of the web based survey of agricultural
faculty in Iran revealed that computer and internet skills affected the faculty’s use of
electronic information resources. Research work is the major reasons for using
electronic information resources (Papzan & Yaghoubi, 2008). On other hand faculty of
C.V. Raman College of Engineering make frequent use of the Internet for study and
research work (Satpathy & Rout, 2010). About 93.54% of the faculty members access
and use information for research purpose followed by 87.09% teachers use information
to prepare class lectures. Around 83.87% faculty members access and use information
for writing research papers and articles (Singh & Kumar, 2013).
3. OBJECTIVES OF THE STUDY
i. To survey the academic profile of the faculty members of Mother Teresa
Women’s University, Kodaikanal, Dindigul District, Tamilnadu, its
constituent colleges and affiliated colleges;
ii. To survey the extent of awareness and use of library resources and services
by the respondents under survey;
iii. To survey the level of awareness about library rules and organisational
structure; and
iv. To assess the information access competencies / skills of the respondents
under study.
4. HYPOTHESES OF THE STUDY
i. There is no association between designation and working sector of the
respondents and their awareness and utilization of library services.
ii. There is no association between designation of the respondents and the use
of library services.
iii. There is no significant difference between designation and working sector
of the respondents and their information access competencies / skills.
5. RESEARCH METHODS
A structured questionnaire was the main research tool of data collection. The
sample was drawn from Mother Teresa Women’s University and its constituent and
Affiliated Colleges. Simple random sampling method has been applied in order to
assess the women faculty members’ perception about the attitudes, perceptions and
experiences of information access competency. 254 questionnaires were received from

the respondents out of 290 (response rate of 87.59%). The highest, response rate comes
from the MTWU with 95.00 per cent, followed by Autonomous colleges affiliated to
MTWU with 92.50 per cent, Self Financing Colleges with 83.64 per cent and
constituent Colleges of MTWU with 83.33 per cent. The statistical techniques such as
simple percentage, chi-square, Mann Whitney U Test, Kruskal Wallis Test, were used
wherever necessary, to interpret the collected data. The results of the present study are
thus based purely on the responses made in the questionnaire returned by the
respondents only.
6. ANALYSIS AND DISCUSSION
Institution-wise Distribution of the Respondents
Table 1 - Institution-wise Distribution of Respondents
Name of the Institution Respondents Cumulative
Percent Frequency Percent
Jayaraj Annapackiam College for Women 51 20.08 20.08
Mother Teresa Women’s University (MTWU) 38 14.96 35.04
Sakthi College of Arts and Science for Women 27 10.63 45.67
Arulmigu Palaniyandavar Arts College for Women 23 9.06 54.72
Govt. Arts College, Nilakottai 19 7.48 62.20
Nadar Saraswathi College of Arts & Science 18 7.09 69.29
M.V.Muthiah Govt. Arts College for Women 17 6.69 75.98
Sri Adi Chunchangiri Women’s College 17 6.69 82.68
St.Antony's College of Arts and Science for women 16 6.30 88.98
Thiravium College of Arts and Science for Women 14 5.51 94.49
Mother Teresa Women’s University College 9 3.54 98.03
Women’s University College of Education 5 1.97 100.00
Total 254 100.0
Table 1 show the institution-wise distribution of respondents. 254 respondents
are drawn from 12 institutions. Only 38 (14.96%) respondents are from Mother Teresa
Women’s University and the rest are from its affiliated colleges and constituent
colleges. 54.72% (139) of the respondents are from just 4 colleges and the rest (115)
are from 7 other colleges. A majority of 51 (20.08%) respondents are from Jayaraj
Annapackiam College followed by Mother Teresa Women’s University (MTWU) with
38 (14.96%) respondents and Sakthi College with 27 (10.63%) respondents. Two
government affiliated colleges – MVM College and Govt. Arts College, Nilakottai –

have contributed 36 respondents for the study. One B.Ed college – WUCE- has just 5
respondents participating in this survey. There are five colleges which have 14-19
respondents each in the study. Two colleges have less than 10 respondents – MTWUC
with 9 and WUCE with 5 respondents.
Designation and Working Sector-wise Distribution of Respondents
Table 2 discloses the designation and working sector-wise distribution of the
respondents. Out of 12 institutions, 5 are government, 5 are self-financing and 2 are
aided educational institutions. While there are 92 (36.2%) respondents from self-
financing colleges, 88 (34.6%) respondents are from Government University and
government colleges. 74 (29.1%) respondents are hailed from just two self-financing
colleges. 163 (64.2%) respondents are assistant professors and 81 (31.9%) respondents
are associate professors while just 10 (3.9%) respondents are professors. Thus, majority
of the respondents of this study are Assistant Professors.
Table 2 - Working Sector-wise Distribution of Respondents
Status of Institution Number of
Institutions Frequency Percent Cumulative Percent
Govt 05 88 34.6 34.6
Aided 02 74 29.1 63.8
Self-finance 05 92 36.2 100.0
Total 12 254 100.0
Designation Frequency Cumulative Freq. Percent Cumulative Percent
Assistant Professor 163 163 64.2 64.2
Associate Professor 81 244 31.9 96.1
Professor 10 254 3.9 100.0
Total 254
100.0
Use of Library Services
It is revealed that 225 respondents availed the circulation service, 235 availed
the reference service, 217 utilized reprographic services, 243 used Current Awareness
Service, 223 made use of newspaper clipping services and 213 utilized internet surfing
service. 148 respondents used library referral services, 189 used library abstracting and
indexing services, 135 utilized inter library loan service, 129 used bulletin board
services, 162 utilized email alert services, 182 made use of document delivery service,
142 used library OPAC/ Web OPAC, 129 utilized technical enquiry services and 180
respondents made use of electronic journal access services. While 119 respondents

don’t use library inter-library loan service, 106 don’t use referral services, 125 don’t
use bulletin board services, 112 don’t use library OPAC / Web OPAC and 125
respondents don’t use technical enquiry service of the library.
Chi-Square Analysis of Library Services
Associate Professors and Professors (AP&P): Out of 91 Associate Professors
and Professors (AP&P), 86 used circulation service of the library, 89 utilized reference
services, 85 made use of reprographic services, 89 used Current Awareness Services,
53 utilized inter library loan services, 60 made use of referral services, 76 utilized
abstracting/indexing services and 82 Associate Professors and Professors used
newspaper clipping service of the library concerned. Bulletin board service is made use
of by 49 Associate Professors and Professors, email alert service by 69 AP&P,
document delivery service by 74 AP&P, OPAC by 55 AP&P, internet surfing service
by 84 AP&P, technical enquiry service by 53 AP&P and electronic journal access
service by 72 Associate Professors and Professors.
Table 3: Chi-Square Analysis of Library Services utilized by the respondents
Variables RES
Designation
Total Chi df p-
value Assistant
Professor
Associate
Prof. &
Professor
Circulation Yes 139 86 225 4.918 1 .027
No 24 5 29
Reference Service Yes 146 89 235 5.718 1 .017
No 17 2 19
Reprographic Service Yes 132 85 217 7.244 1 .007
No 31 6 37
CAS Yes 154 89 243 1.557 1 .212
No 9 2 11
Inter Library Loan Yes 82 53 135 1.477 1 .224
No 81 38 119
Referral Services Yes 88 60 148 3.427 1 .064
No 75 31 106
Abstracting/Indexing
Services Yes 113 76 189 6.176 1 .013
No 50 15 65
Newspaper Clipping
Services Yes 141 82 223 .709 .1 .400
No 22 9 31 Bulletin Board
Services Yes 80 49 129 .531 1 .466

No 83 42 125
E-mail Alert Service Yes 93 69 162 8.905 1 .003
No 70 22 92
Document Delivery
Service Yes 108 74 182 6.522 1 .011
No 55 17 72
OPAC / Web OPAC Yes 87 55 142 1.183 1 .277
No 76 36 112
Internet surfing
Service Yes 129 84 213 7.479 1 .006
No 34 7 41
Technical Enquiry
Service Yes 76 53 129 3.153 1 .076
No 87 38 125
Electronic Journals
Access Yes 108 72 180 4.680 1 .031
No 55 19 74
Assistant Professors: Out of 163 Assistant Professors, 139 used circulation service of
the library, 146 utilized reference services, 132 made use of reprographic services, 154
used Current Awareness Services, 82 utilized inter library loan services, 88 made use of
referral services, 113 utilized abstracting/indexing services and 141 Assistant
Professors used newspaper clipping service of the library concerned. Bulletin board
service is made use of by 80 Assistant Professors, e-mail alert service by 93 Assistant
Professors, document delivery service by 108 Assistant Professors, OPAC by 87
Assistant Professors, internet surfing service by 129 Assistant Professors, technical
enquiry service by 76 Assistant Professors and electronic journal access service by 108
Assistant Professors.
Chi-Square Analysis: To test whether there is a significant association between the
utilization of library services and designation of the respondents, a chi-square test was
conducted. The test reveals that
a) The p-value for the variables, CAS, interlibrary loan, referral services,
newspaper clipping services, bulletin board services, OPAC/Web OPAC and
technical enquiry service is more than 0.05 and thus the null hypothesis is
accepted. There is no association between designation of the respondents and
the use of aforesaid library services.
b) The p-value for the variables circulation, reference service, reprographic
service, abstracting/indexing services, e-mail alert services, document delivery
services, internet surfing service, and electronic journal access service is less

than 0.05 – the level of significance. So, the null hypothesis is rejected and the
alternative hypothesis is accepted. There is a significant association between the
designation of the respondents and their utilization of these library services.
Table 4: Awareness of Library Vs. Designation of the Respondents
Variables Response
Designation
Assistant
Professor
Associate
Professor &
Professor
Total %
Aware of Library
Rules
Not Aware 6 5 11 4.33
Very Less Extent 27 20 47 18.50
Less Extent 40 21 61 24.02
Some Extent 48 22 70 27.56
Large Extent 42 23 65 25.59
Know Collection
Details
Not Aware 4 1 5 1.97
Very Less Extent 16 6 22 8.66
Less Extent 30 12 42 16.54
Some Extent 64 43 107 42.13
Large Extent 49 29 78 30.71
Search in OPAC
Not Aware 17 4 21 8.27
Very Less Extent 15 10 25 9.84
Less Extent 32 19 51 20.08
Some Extent 66 36 102 40.16
Large Extent 33 22 55 21.65
Aware of Library
Service
Not Aware 28 9 37 14.57
Very Less Extent 43 26 69 27.17
Less Extent 33 26 59 23.23
Some Extent 47 24 71 27.95
Large Extent 12 6 18 7.09
Know Organization
Structure
Not Aware 43 26 69 27.17
Very Less Extent 46 25 71 27.95
Less Extent 11 13 24 9.45
Some Extent 50 22 72 28.35
Large Extent 13 5 18 7.09
As far as search in library OPAC is concerned, 102 (40.16%) respondents are
aware of it to some extent and 55 (21.65%) respondents are aware of it to a larger
extent. 21 (8.27%) respondents are not aware of search in library OPAC. 71 (27.95%)
respondents are aware of library services to some extent and 69 (27.17%) of them are
aware of library services to a very less extent. 18 (7.09%) respondents are aware of
library services to a larger extent. 28.35% (72) of the respondents know about the
organizational structure of the library to some extent while 71 (27.95%) respondents
are aware of it to a very less extent and 69 (27.17%) respondents are not at all aware of
it. The overall analysis shows that the Associate Professors and the Professors are
aware of library rules, library collection, OPAC search and library services little better
than Assistant Professors.
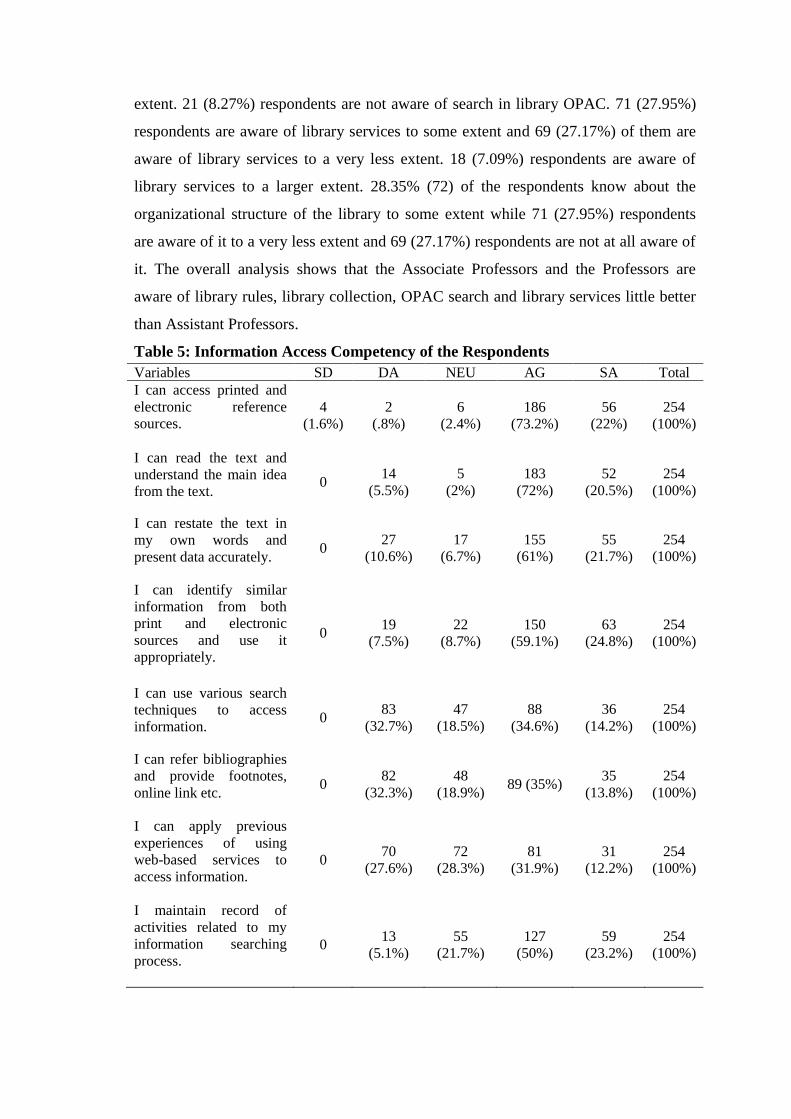
Table 5: Information Access Competency of the Respondents
Variables SD DA NEU AG SA Total
I can access printed and
electronic reference
sources. 4
(1.6%)
2
(.8%)
6
(2.4%)
186
(73.2%)
56
(22%)
254
(100%)
I can read the text and
understand the main idea
from the text. 0
14
(5.5%)
5
(2%)
183
(72%)
52
(20.5%)
254
(100%)
I can restate the text in
my own words and
present data accurately. 0
27
(10.6%)
17
(6.7%)
155
(61%)
55
(21.7%)
254
(100%)
I can identify similar
information from both
print and electronic
sources and use it
appropriately.
0 19
(7.5%)
22
(8.7%)
150
(59.1%)
63
(24.8%)
254
(100%)
I can use various search
techniques to access
information. 0
83
(32.7%)
47
(18.5%)
88
(34.6%)
36
(14.2%)
254
(100%)
I can refer bibliographies
and provide footnotes,
online link etc. 0
82
(32.3%)
48
(18.9%) 89 (35%)
35
(13.8%)
254
(100%)
I can apply previous
experiences of using
web-based services to
access information.
0 70
(27.6%)
72
(28.3%)
81
(31.9%)
31
(12.2%)
254
(100%)
I maintain record of
activities related to my
information searching
process. 0
13
(5.1%)
55
(21.7%)
127
(50%)
59
(23.2%)
254
(100%)

I will keep in mind the
problems faced and
benefits gained in the
previous experiences
while making an alternate
search for information.
1 (.4%) 3 (1.2%) 28 (11%) 154
(60.6%)
68
(26.8%)
254
(100%)
I know the scope, content
and organisation of
information sources like
bibliography, research
database etc.
1 (.4) 15
(5.9%)
23
(9.1%)
146
(57.5%)
69
(27.2%)
254
(100%)
Note. Source: Primary Data. SD = Strongly Disagree; DA = Disagree; NE = Neutral;
AG = Agree; SA = Strongly Agree.
Table 5 shows the information access competencies of the respondents. 186
(73.2%) respondents agree and 56 (22%) respondents strongly agree that ‘they can
access printed and electronic reference sources’. 183 (72%) respondents agree and 52
(20.5%) respondents strongly agree that ‘they can read the text and understand the main
idea from the text’. 155 (61%) respondents agree and 55 (21.7%) respondents strongly
agree that ‘they can restate the text in their own words and present data accurately’.
While 59.1% (150) of the respondents agree and 24.8% (63) of the respondents
strongly agree that ‘they can identify similar information from both print and electronic
resources’, 50% (127) of the respondents agree and 23.2% (59) of the respondents
strongly agree that ‘they can maintain record of activities related to their information
searching process’. 154 (60.6%) respondents agree and 68 (26.8%) respondents
strongly agree that ‘they can keep in mind the problems faced and benefits gained in
the previous experiences while making an alternate search for information’.
146 (57.5%) respondents agree and 69 (27.2%) strongly agree that ‘they know
the scope, content and organisation of information sources like bibliography, research
database etc’. While 88 (34.6%) respondents agree, 36 (14.2%) strongly agree that
‘they can use various search techniques’. 82 (32.3%) respondents disagree that ‘they
can refer bibliographies and provide footnote'.’ While 88 (34.6%) respondents disagree
that ‘they can use various search techniques to access information’, 70 (27.6%)
respondents disagree that ‘they can apply previous experiences of using web based
services to access information’. Except with these three skills, other skills don’t have
much responses showing disagreement of the respondents.

Table 6: Tests of Normality for the factor “Information Access Competency”
Variable
Tests of Normality
Kolmogorov-
Smirnova Shapiro-Wilk
Statistic df Sig. Statistic df Sig.
I can access printed and electronic
reference sources. .369 254 .000 .602 254 .000
I can read the text and understand the
main idea from the text. .380 254 .000 .655 254 .000
I can restate the text in my own words
and present data accurately. .357 254 .000 .762 254 .000
I can identify similar information from
both print and electronic sources and use
it appropriately.
.333 254 .000 .778 254 .000
I can use various search techniques to
access information. .230 254 .000 .843 254 .000
I can refer bibliographies and provide
footnotes, online link etc. .231 254 .000 .844 254 .000
I can apply previous experiences of using
web-based services to access
information.
.202 254 .000 .866 254 .000
I maintain record of activities related to
my information searching process. .275 254 .000 .847 254 .000
I will keep in mind the problems faced
and benefits gained in the previous
experiences while making an alternate
search for information.
.305 254 .000 .775 254 .000
I know the scope, content and
organisation of information sources like
bibliography, research database etc.
.321 254 .000 .785 254 .000
To test the normality of data, one sample K-S test and Shapiro-Wilk test were
conducted for all the 10 variables placed under the factor ‘Information Access
Competency’. The p-values for all the 10 variables are less than 0.05. Thus, the null
hypothesis is rejected and the alternative hypothesis is accepted i.e. the research data is
not normally distributed. So, the non-parametric tests need to be conducted on these
variables.
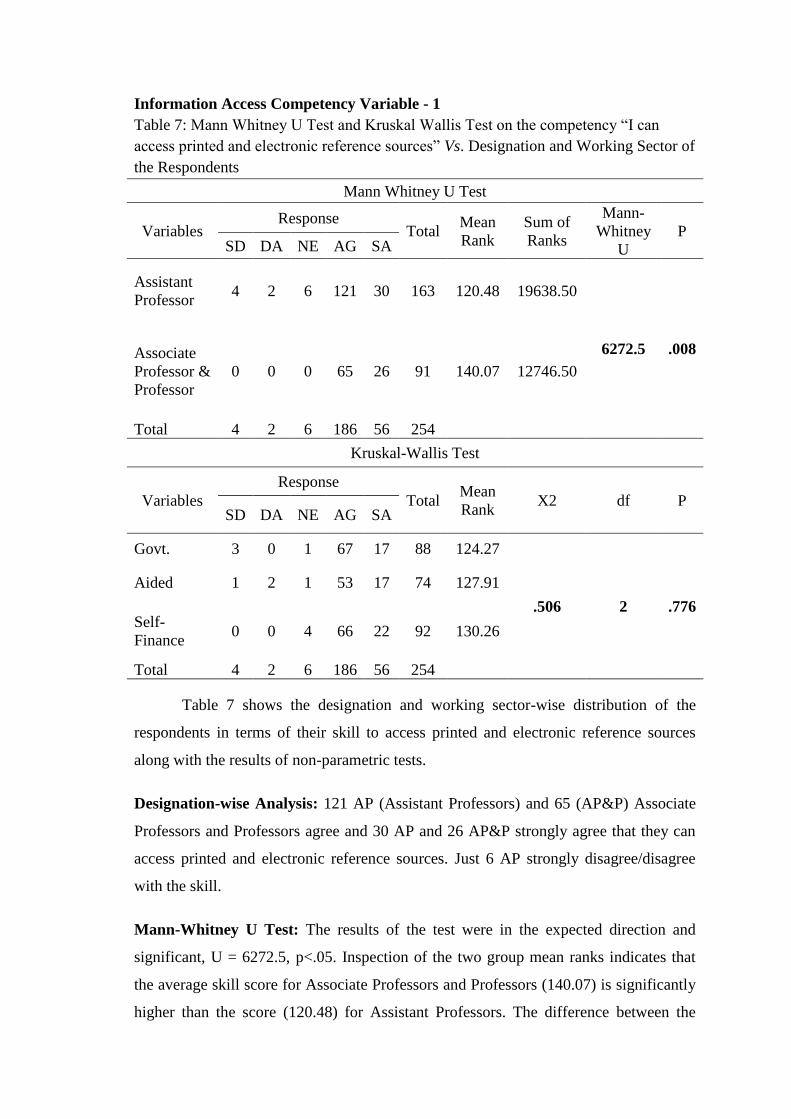
Information Access Competency Variable - 1
Table 7: Mann Whitney U Test and Kruskal Wallis Test on the competency “I can
access printed and electronic reference sources” Vs. Designation and Working Sector of
the Respondents
Mann Whitney U Test
Variables Response
Total Mean
Rank
Sum of
Ranks
Mann-
Whitney
U
P SD DA NE AG SA
Assistant
Professor 4 2 6 121 30 163 120.48 19638.50
6272.5 .008 Associate
Professor &
Professor
0 0 0 65 26 91 140.07 12746.50
Total 4 2 6 186 56 254
Kruskal-Wallis Test
Variables
Response
Total Mean
Rank X2 df P
SD DA NE AG SA
Govt. 3 0 1 67 17 88 124.27
.506 2 .776
Aided 1 2 1 53 17 74 127.91
Self-
Finance 0 0 4 66 22 92 130.26
Total 4 2 6 186 56 254
Table 7 shows the designation and working sector-wise distribution of the
respondents in terms of their skill to access printed and electronic reference sources
along with the results of non-parametric tests.
Designation-wise Analysis: 121 AP (Assistant Professors) and 65 (AP&P) Associate
Professors and Professors agree and 30 AP and 26 AP&P strongly agree that they can
access printed and electronic reference sources. Just 6 AP strongly disagree/disagree
with the skill.
Mann-Whitney U Test: The results of the test were in the expected direction and
significant, U = 6272.5, p<.05. Inspection of the two group mean ranks indicates that
the average skill score for Associate Professors and Professors (140.07) is significantly
higher than the score (120.48) for Assistant Professors. The difference between the
mean ranks is 19.59. The null hypothesis is rejected and alternative hypothesis is
accepted. Thus, there is a significant difference between AP and AP&P in their skills to
access printed and electronic reference sources.
Working Sector-wise Analysis: 67 GSR (Government Sector Respondents), 53 ASR
(Aided Sector Respondents and 66 SSR (Self-financing Sector Respondents) agree and
17 GSR, 17 ASR and 22 SSR strongly agree that they can access printed and electronic
reference sources. Only 3 ASR and 3 GSR disagree/ strongly disagree with the skill.
Kruskal-Wallis test: The Kruskal-Wallis test reveals that there is no significant effect
of working sector of the respondents on their skill ‘‘I can access printed and electronic
reference sources’ (X2 (2, N = 254) = .506, p > .05). The mean ranks for the skill is
124.27 for government sector respondents, 127.91 for aided sector respondents and
130.26 for self-financing sector respondents. Inspection of the group means also
suggests that there is no significant difference between working sector of the
respondents and the aforesaid skill. Thus, null hypothesis is accepted.
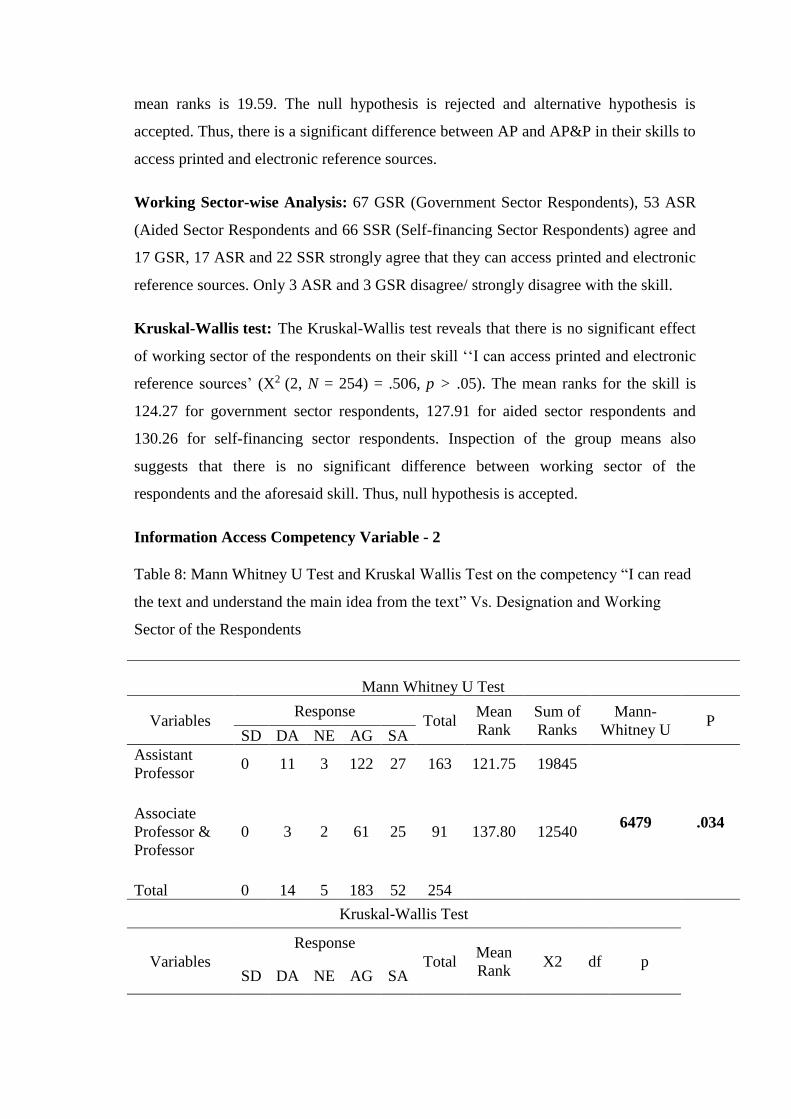
Information Access Competency Variable - 2
Table 8: Mann Whitney U Test and Kruskal Wallis Test on the competency “I can read
the text and understand the main idea from the text” Vs. Designation and Working
Sector of the Respondents
Mann Whitney U Test
Variables Response
Total Mean
Rank
Sum of
Ranks
Mann-
Whitney U P
SD DA NE AG SA
Assistant
Professor 0 11 3 122 27 163 121.75 19845
6479 .034 Associate
Professor &
Professor
0 3 2 61 25 91 137.80 12540
Total 0 14 5 183 52 254
Kruskal-Wallis Test
Variables
Response
Total Mean
Rank X2 df p
SD DA NE AG SA

Govt. 0 5 2 65 16 88 124.35
1.548 2 .461
Aided 0 4 3 53 14 74 123.82
Self-Finance 0 5 0 65 22 92 133.47
Total 0 14 5 183 52 254
Note. Source: Primary Data. SD = Strongly Disagree; DA = Disagree; NE = Neutral;
AG = Agree; SA = Strongly Agree.
Table 8 shows the designation and working sector-wise distribution of the
respondents in terms of their skill to read the text and understand the main idea from
the text along with the results of non-parametric tests.
Designation-wise Analysis: 122 AP and 61 AP&P agree while 27 AP and 25 AP&P
strongly agree that ‘they can read the text and understand the main idea from the text’.
Only 14 (11 AP and 3 AP&P) disagree with this skill. No respondent strongly
disagrees with this skill.
Mann-Whitney U Test: The results of the test were in the expected direction and
significant, U = 6479, p<.05. Inspection of the two group mean ranks indicates that the
average skill score for Associate Professors and Professors (137.80) is significantly
higher than the score (121.75) for Assistant Professors. The difference between the
mean ranks is 16.05. The null hypothesis is rejected and alternative hypothesis is
accepted. Thus, there is a significant difference between AP and AP&P in their skills to
read the text and understand the main idea from the text.
Working Sector-wise Analysis: While 65 GSR, 53 ASR and 65 SSR agree, 16 GSR,
14 ASR and 22 SSR strongly agree that they can read the text and understand the main
idea from the text. While 5 respondents are neutrally skilled, 14 respondents (5 GSR, 4
ASR and 5 SSR) disagree with the skill. No one strongly disagrees with this skill.
Kruskal-Wallis test: The Kruskal-Wallis test reveals that there is no significant effect
of working sector of the respondents on their skill ‘‘I can read the text and understand
the main idea from the text’ (X2 (2, N = 254) = 1.548, p > .05). The mean ranks for the
skill is 124.35 for government sector respondents, 123.82 for aided sector respondents
and 133.47 for self-financing sector respondents. Inspection of the group means also

suggests that there is no significant difference between working sector of the
respondents and the aforesaid skill. Thus, null hypothesis is accepted.
Information Access Competency Variable - 3
Table 9: Mann Whitney U Test and Kruskal Wallis Test on the competency “I can
restate the text in my own words and present data accurately.” Vs. Designation and
Working Sector of the Respondents
Mann Whitney U Test
Variables Response
Total Mean
Rank
Sum of
Ranks
Mann-
Whitney
U
P SD DA NE AG SA
Assistant
Professor 0 16 14 101 32 163 124.63 20314
6948 .339 Associate
Professor &
Professor
0 11 3 54 23 91 132.65 12071
Total 0 27 17 155 55 254
Kruskal-Wallis Test
Variables
Response
Total Mean
Rank X2 df P
SD DA NE AG SA
Govt. 0 11 5 55 17 88 123.90
8.555 2 .014
Aided 0 13 8 39 14 74 113.59
Self-Finance 0 3 4 61 24 92 142.13
Total 0 27 17 155 55 254
Note. Source: Primary Data. SD = Strongly Disagree; DA = Disagree; NE = Neutral;
AG = Agree; SA = Strongly Agree.
Table 9 shows the designation and working sector-wise distribution of the respondents
in terms of their skill to restate the text in their own words and present data accurately.
Designation-wise Analysis: 101 AP and 54 AP&P agree while 32 AP and 23 AP&P
strongly agree that they can restate the text in their own words and present data
accurately. While 17 respondents are neutrally skilled, 27 respondents disagree with
this skill. No respondent strongly disagrees with this skill.
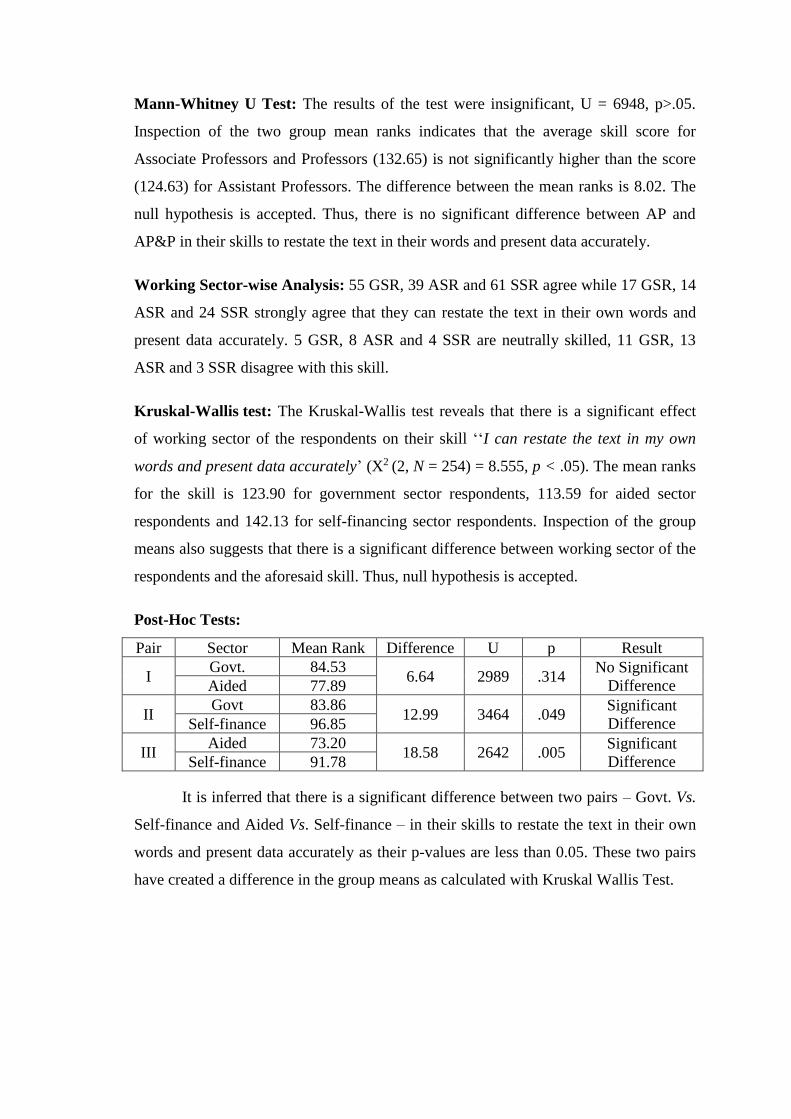
Mann-Whitney U Test: The results of the test were insignificant, U = 6948, p>.05.
Inspection of the two group mean ranks indicates that the average skill score for
Associate Professors and Professors (132.65) is not significantly higher than the score
(124.63) for Assistant Professors. The difference between the mean ranks is 8.02. The
null hypothesis is accepted. Thus, there is no significant difference between AP and
AP&P in their skills to restate the text in their words and present data accurately.
Working Sector-wise Analysis: 55 GSR, 39 ASR and 61 SSR agree while 17 GSR, 14
ASR and 24 SSR strongly agree that they can restate the text in their own words and
present data accurately. 5 GSR, 8 ASR and 4 SSR are neutrally skilled, 11 GSR, 13
ASR and 3 SSR disagree with this skill.
Kruskal-Wallis test: The Kruskal-Wallis test reveals that there is a significant effect
of working sector of the respondents on their skill ‘‘I can restate the text in my own
words and present data accurately’ (X2 (2, N = 254) = 8.555, p < .05). The mean ranks
for the skill is 123.90 for government sector respondents, 113.59 for aided sector
respondents and 142.13 for self-financing sector respondents. Inspection of the group
means also suggests that there is a significant difference between working sector of the
respondents and the aforesaid skill. Thus, null hypothesis is accepted.
Post-Hoc Tests:
Pair Sector Mean Rank Difference U p Result
I Govt. 84.53
6.64 2989 .314 No Significant
Difference Aided 77.89
II Govt 83.86
12.99 3464 .049 Significant
Difference Self-finance 96.85
III Aided 73.20
18.58 2642 .005 Significant
Difference Self-finance 91.78
It is inferred that there is a significant difference between two pairs – Govt. Vs.
Self-finance and Aided Vs. Self-finance – in their skills to restate the text in their own
words and present data accurately as their p-values are less than 0.05. These two pairs
have created a difference in the group means as calculated with Kruskal Wallis Test.
Information Access Competency Variable - 4
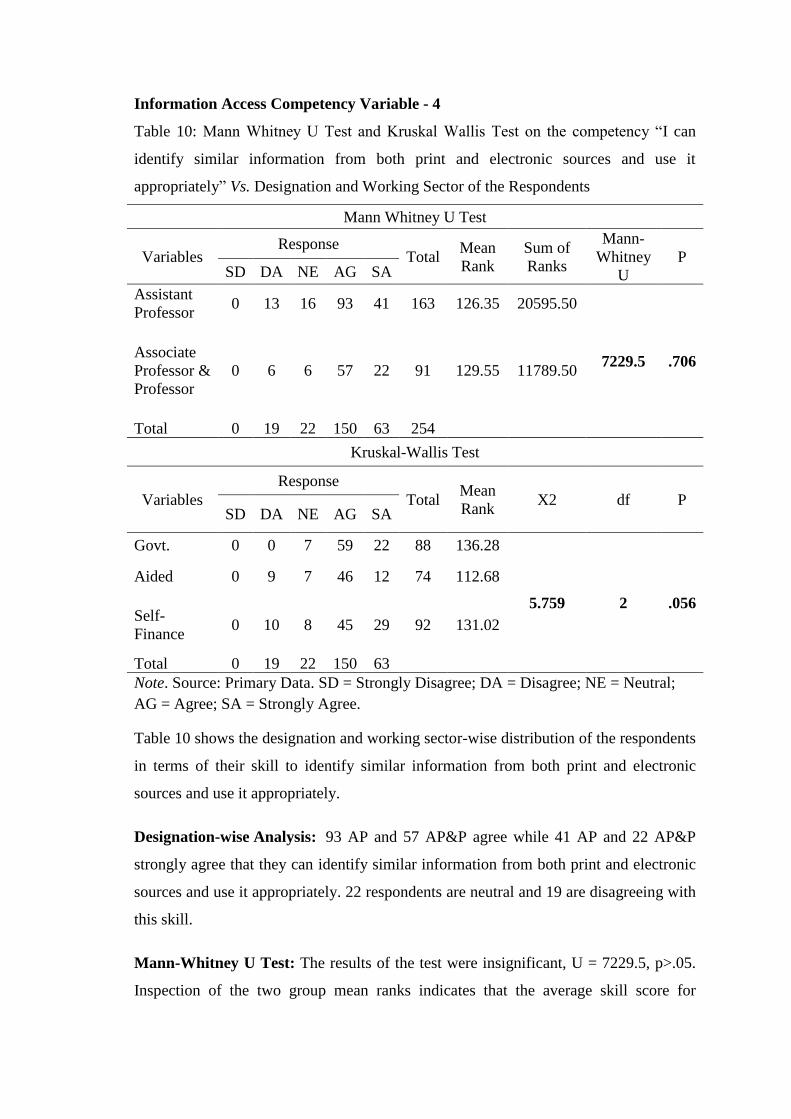
Table 10: Mann Whitney U Test and Kruskal Wallis Test on the competency “I can
identify similar information from both print and electronic sources and use it
appropriately” Vs. Designation and Working Sector of the Respondents
Mann Whitney U Test
Variables Response
Total Mean
Rank
Sum of
Ranks
Mann-
Whitney
U
P SD DA NE AG SA
Assistant
Professor 0 13 16 93 41 163 126.35 20595.50
7229.5 .706 Associate
Professor &
Professor
0 6 6 57 22 91 129.55 11789.50
Total 0 19 22 150 63 254
Kruskal-Wallis Test
Variables
Response
Total Mean
Rank X2 df P
SD DA NE AG SA
Govt. 0 0 7 59 22 88 136.28
5.759 2 .056
Aided 0 9 7 46 12 74 112.68
Self-
Finance 0 10 8 45 29 92 131.02
Total 0 19 22 150 63
Note. Source: Primary Data. SD = Strongly Disagree; DA = Disagree; NE = Neutral;
AG = Agree; SA = Strongly Agree.
Table 10 shows the designation and working sector-wise distribution of the respondents
in terms of their skill to identify similar information from both print and electronic
sources and use it appropriately.
Designation-wise Analysis: 93 AP and 57 AP&P agree while 41 AP and 22 AP&P
strongly agree that they can identify similar information from both print and electronic
sources and use it appropriately. 22 respondents are neutral and 19 are disagreeing with
this skill.
Mann-Whitney U Test: The results of the test were insignificant, U = 7229.5, p>.05.
Inspection of the two group mean ranks indicates that the average skill score for

Associate Professors and Professors (129.55) is not significantly higher than the score
(126.35) for Assistant Professors. The difference between the mean ranks is 3.2. The
null hypothesis is accepted. Thus, there is no significant difference between AP and
AP&P in their skills to identify similar information from both print and electronic
sources and use it appropriately.
Working Sector-wise Analysis: 58 GSR, 46 ASR and 45 SSR agree while 22 GSR, 12
ASR and 29 SSR strongly agree that they can identify similar information from both
print and electronic sources and use it appropriately. 9 ASR and 10 SSR disagree while
no respondent disagrees with this skill.
Kruskal-Wallis test: The Kruskal-Wallis test reveals that there is no significant effect
of working sector of the respondents on their skill ‘‘I can identify similar information
from both print and electronic sources and use it appropriately’’ (X2 (2, N = 254) =
5.759, p > .05). The mean ranks for the skill is 136.28 for government sector
respondents, 112.68 for aided sector respondents and 131.02 for self-financing sector
respondents. Inspection of the group means also suggests that there is no significant
difference between working sector of the respondents and the aforesaid skill. Thus, null
hypothesis is accepted.
Information Access Competency Variable - 5
Table 11: Mann Whitney U Test and Kruskal Wallis Test on the competency “I can use
various search techniques to access information” Vs. Designation and Working Sector
of the Respondents
Mann Whitney U Test
Variables Response
Total Mean
Rank
Sum of
Ranks
Mann-
Whitney
U
P SD DA NE AG SA
Assistant
Professor 0 55 29 57 22 163 126.15 20562.5
7196.5 .682 Associate
Professor &
Professor
0 28 18 31 14 91 129.92 11822.5
Total 0 83 47 88 36 254
Kruskal-Wallis Test

Variables
Response
Total Mean
Rank X2 df P
SD DA NE AG SA
Govt. 0 21 14 37 16 88 143.41
9.117 2 .010
Aided 0 21 17 28 8 74 128.09
Self-
Finance 0 41 16 23 12 92 111.80
Total 0 83 47 88 36 254
Note. Source: Primary Data. SD = Strongly Disagree; DA = Disagree; NE = Neutral;
AG = Agree; SA = Strongly Agree.
Designation-wise Analysis: While 57 AP and 31 AP& P agree, 22 AP and 14 AP&P
strongly agree that they can use various search techniques to access information. But 29
AP and 18 AP&P are neutral While 55 AP and 28 AP&P disagree that they can use
various search techniques to access information. No respondent disagrees with this
skill.
Mann-Whitney U Test: The results of the test were insignificant, U = 7196.5, p>.05.
Inspection of the two group mean ranks indicates that the average skill score for
Associate Professors and Professors (129.92) is not significantly higher than the score
(126.15) for Assistant Professors. The difference between the mean ranks is 3.77. The
null hypothesis is accepted. Thus, there is no significant difference between AP and
AP&P in their skills to use various search techniques to access information.
Working Sector-wise Analysis: 37 GSR, 28 ASR and 23 SSR agree while 16 GSR, 8
ASR and 12 SSR strongly agree that they can use various search techniques to access
information. But 21 GSR, 21 ASR and 41 SSR disagree while 14 GSR, 17 ASR and 16
SSR are neutral in their skill to use various search techniques to access information. No
respondent disagrees with this skill.
Kruskal-Wallis test: The Kruskal-Wallis test reveals that there is a significant effect
of working sector of the respondents on their skill ‘‘I can use various search techniques
to access information’’ (X2 (2, N = 254) =9.117, p < .05). The mean ranks for the skill
is 143.41 for government sector respondents, 128.09 for aided sector respondents and
111.80 for self-financing sector respondents. Inspection of the group means also
suggests that there is a significant difference between working sector of the respondents
and the aforesaid skill. Thus, null hypothesis is accepted.
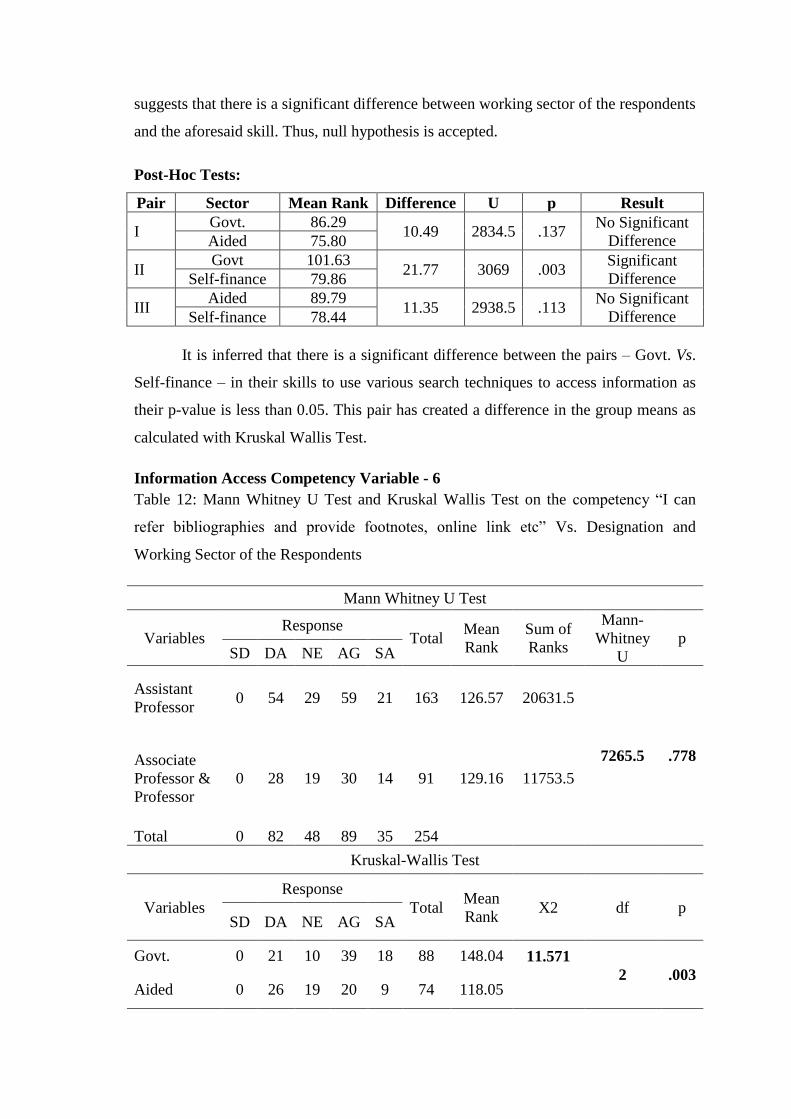
Post-Hoc Tests:
Pair Sector Mean Rank Difference U p Result
I Govt. 86.29
10.49 2834.5 .137 No Significant
Difference Aided 75.80
II Govt 101.63
21.77 3069 .003 Significant
Difference Self-finance 79.86
III Aided 89.79
11.35 2938.5 .113 No Significant
Difference Self-finance 78.44
It is inferred that there is a significant difference between the pairs – Govt. Vs.
Self-finance – in their skills to use various search techniques to access information as
their p-value is less than 0.05. This pair has created a difference in the group means as
calculated with Kruskal Wallis Test.
Information Access Competency Variable - 6
Table 12: Mann Whitney U Test and Kruskal Wallis Test on the competency “I can
refer bibliographies and provide footnotes, online link etc” Vs. Designation and
Working Sector of the Respondents
Mann Whitney U Test
Variables Response
Total Mean
Rank
Sum of
Ranks
Mann-
Whitney
U
p SD DA NE AG SA
Assistant
Professor 0 54 29 59 21 163 126.57 20631.5
7265.5 .778 Associate
Professor &
Professor
0 28 19 30 14 91 129.16 11753.5
Total 0 82 48 89 35 254
Kruskal-Wallis Test
Variables
Response
Total Mean
Rank X2 df p
SD DA NE AG SA
Govt. 0 21 10 39 18 88 148.04 11.571
2 .003 Aided 0 26 19 20 9 74 118.05
Self-
Finance 0 35 19 30 8 92 115.46
Total 0 82 48 89 35 254
Note. Source: Primary Data. SD = Strongly Disagree; DA = Disagree; NE = Neutral;
AG = Agree; SA = Strongly Agree.
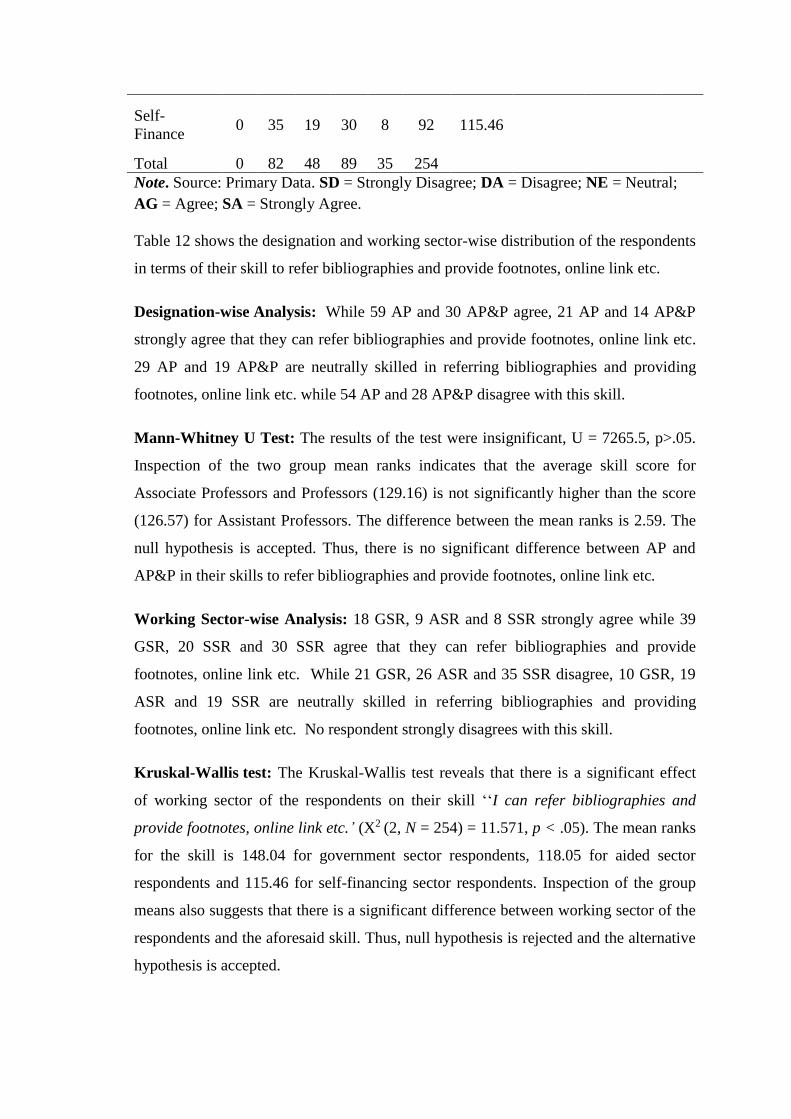
Table 12 shows the designation and working sector-wise distribution of the respondents
in terms of their skill to refer bibliographies and provide footnotes, online link etc.
Designation-wise Analysis: While 59 AP and 30 AP&P agree, 21 AP and 14 AP&P
strongly agree that they can refer bibliographies and provide footnotes, online link etc.
29 AP and 19 AP&P are neutrally skilled in referring bibliographies and providing
footnotes, online link etc. while 54 AP and 28 AP&P disagree with this skill.
Mann-Whitney U Test: The results of the test were insignificant, U = 7265.5, p>.05.
Inspection of the two group mean ranks indicates that the average skill score for
Associate Professors and Professors (129.16) is not significantly higher than the score
(126.57) for Assistant Professors. The difference between the mean ranks is 2.59. The
null hypothesis is accepted. Thus, there is no significant difference between AP and
AP&P in their skills to refer bibliographies and provide footnotes, online link etc.
Working Sector-wise Analysis: 18 GSR, 9 ASR and 8 SSR strongly agree while 39
GSR, 20 SSR and 30 SSR agree that they can refer bibliographies and provide
footnotes, online link etc. While 21 GSR, 26 ASR and 35 SSR disagree, 10 GSR, 19
ASR and 19 SSR are neutrally skilled in referring bibliographies and providing
footnotes, online link etc. No respondent strongly disagrees with this skill.
Kruskal-Wallis test: The Kruskal-Wallis test reveals that there is a significant effect
of working sector of the respondents on their skill ‘‘I can refer bibliographies and
provide footnotes, online link etc.’ (X2 (2, N = 254) = 11.571, p < .05). The mean ranks
for the skill is 148.04 for government sector respondents, 118.05 for aided sector
respondents and 115.46 for self-financing sector respondents. Inspection of the group
means also suggests that there is a significant difference between working sector of the
respondents and the aforesaid skill. Thus, null hypothesis is rejected and the alternative
hypothesis is accepted.

Post-Hoc Tests:
Pair Sector Mean Rank Difference U p Result
I Govt. 90.23
19.11 2488 .007 Significant
Difference Aided 71.12
II Govt 102.31
23.11 3008.5 .002 Significant
Difference Self-finance 79.20
III Aided 84.43
1.67 3335.5 .816 No Significant
Difference Self-finance 82.76
It is inferred that there is a significant difference between two pairs – Govt. Vs.
Aides and Govt. Vs. Self-finance - in their skills to refer bibliographies and provide
footnotes, online link etc., as their p-values are less than 0.05. These two pairs have
created a difference in the group means as calculated with Kruskal Wallis Test.
Information Access Competency Variable - 7
Table 13: Mann Whitney U Test and Kruskal Wallis Test on the competency “I can
apply previous experiences of using web-based services to access information” Vs.
Designation and Working Sector of the Respondents
Mann Whitney U Test
Variables Response
Total Mean
Rank
Sum of
Ranks
Mann-
Whitney
U
P SD DA NE AG SA
Assistant
Professor 0 44 48 55 16 163 126.15 20563
7197 .684 Associate
Professor &
Professor
0 26 24 26 15 91 129.91 11822
Total 0 70 72 81 31 254
Kruskal-Wallis Test
Variables
Response
Total Mean
Rank X2 df P
SD DA NE AG SA
Govt. 0 22 25 28 13 88 132.66
.733 2 .693
Aided 0 20 23 23 8 74 125.41
Self-Finance 0 28 24 30 10 92 124.24
Total 0 70 72 81 31 254

Note. Source: Primary Data. SD = Strongly Disagree; DA = Disagree; NE = Neutral;
AG = Agree; SA = Strongly Agree.
Table 13 shows the designation and working sector-wise distribution of the respondents
in terms of their skill to apply previous experiences of using web-based services to
access information.
Designation-wise Analysis: While 55 AP and 26 AP&P agree, 16 AP and 15 AP&P
strongly agree that they can apply previous experiences of using web-based services to
access information. 48 AP and 24 AP&P are neutrally skilled in applying previous
experiences of using web-based services to access information while 44 AP and 26
AP&P disagree with this skill.
Mann-Whitney U Test: The results of the test were insignificant, U = 7197, p>.05.
Inspection of the two group mean ranks indicates that the average skill score for
Associate Professors and Professors (129.91) is not significantly higher than the score
(126.15) for Assistant Professors. The difference between the mean ranks is 3.76. The
null hypothesis is accepted. Thus, there is no significant difference between AP and
AP&P in their skills to apply previous experiences of using web-based services to
access information.
Working Sector-wise Analysis: 13 GSR, 8 ASR and 10 SSR strongly agree while 28
GSR, 23 SSR and 30 SSR agree that they can apply previous experiences of using web-
based services to access information. While 22 GSR, 20 ASR and 28 SSR disagree, 25
GSR, 23 ASR and 24 SSR are neutrally skilled applying previous experiences of using
web-based services to access information. No respondent strongly disagrees with this
skill.
Kruskal-Wallis test: The Kruskal-Wallis test reveals that there is no significant effect
of working sector of the respondents on their skill ‘‘I can apply previous experiences of
using web-based services to access information’’ (X2 (2, N = 254) = .733, p > .05). The
mean ranks for the skill is 132.66 for government sector respondents, 125.41 for aided
sector respondents and 124.24 for self-financing sector respondents. Inspection of the
group means also suggests that there is no significant difference between working
sector of the respondents and the aforesaid skill. Thus, null hypothesis is accepted.

Information Access Competency Variable - 8
Table 14: Mann Whitney U Test and Kruskal Wallis Test on the competency “I
maintain record of activities related to my information searching process” Vs.
Designation and Working Sector of the Respondents
Mann Whitney U Test
Variables Response
Total Mean
Rank
Sum of
Ranks
Mann-
Whitney
U
P SD DA NE AG SA
Assistant
Professor 0 9 39 84 31 163 121.01 19725
6359 .041 Associate
Professor &
Professor
0 4 16 43 28 91 139.12 12660
Total 0 13 55 127 59 254
Kruskal-Wallis Test
Variables
Response
Total Mean
Rank X2 df P
SD DA NE AG SA
Govt. 0 2 26 38 22 88 125.52
.332 2 .847 Aided 0 4 21 28 21 74 125.81
Self-Finance 0 7 8 61 16 92 130.75
Total 0 13 55 127 59 254
Note. Source: Primary Data. SD = Strongly Disagree; DA = Disagree; NE = Neutral;
AG = Agree; SA = Strongly Agree.
Table 14 shows the designation and working sector-wise distribution of the respondents
in terms of their skill to maintain record of activities related to their information
searching process.
Designation-wise Analysis: 84 AP and 43 AP&P agree while 31 AP and 28 AP&P
strongly agree that they can maintain record of activities related to their information
searching process. The skills of 39 AP and 16 AP&P are neutral. Just 9 AP and 4
AP&P disagree with this skill.
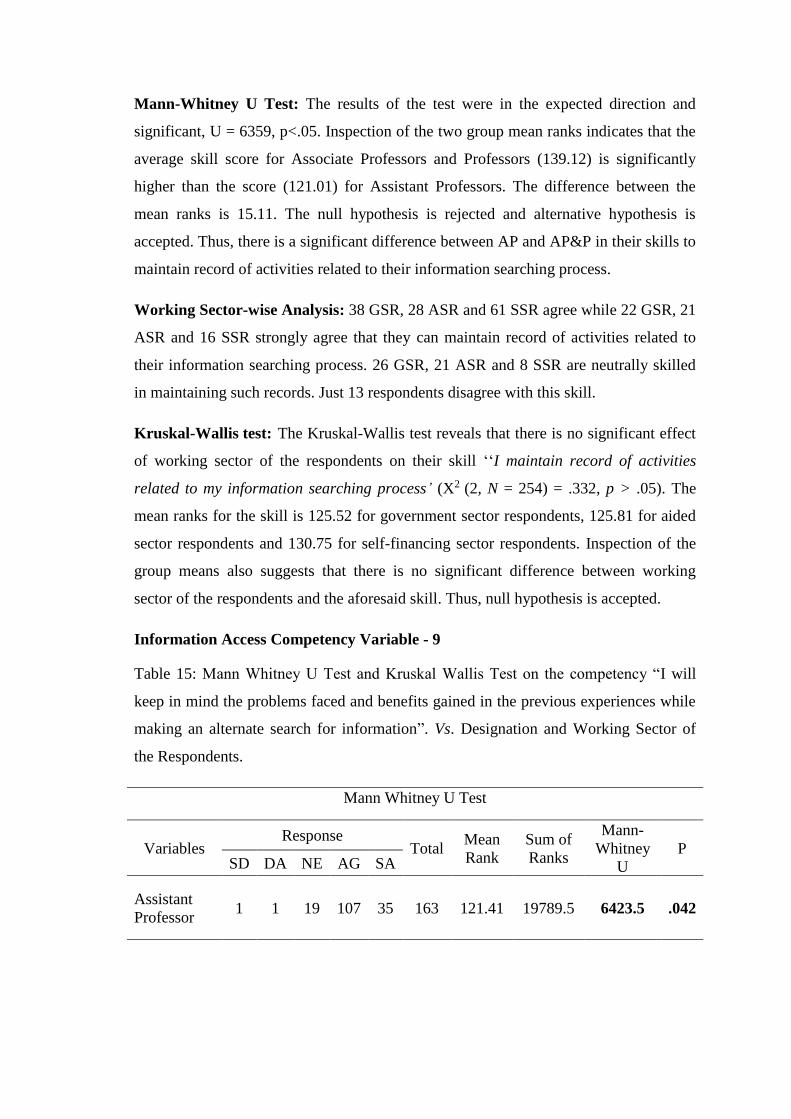
Mann-Whitney U Test: The results of the test were in the expected direction and
significant, U = 6359, p<.05. Inspection of the two group mean ranks indicates that the
average skill score for Associate Professors and Professors (139.12) is significantly
higher than the score (121.01) for Assistant Professors. The difference between the
mean ranks is 15.11. The null hypothesis is rejected and alternative hypothesis is
accepted. Thus, there is a significant difference between AP and AP&P in their skills to
maintain record of activities related to their information searching process.
Working Sector-wise Analysis: 38 GSR, 28 ASR and 61 SSR agree while 22 GSR, 21
ASR and 16 SSR strongly agree that they can maintain record of activities related to
their information searching process. 26 GSR, 21 ASR and 8 SSR are neutrally skilled
in maintaining such records. Just 13 respondents disagree with this skill.
Kruskal-Wallis test: The Kruskal-Wallis test reveals that there is no significant effect
of working sector of the respondents on their skill ‘‘I maintain record of activities
related to my information searching process’ (X2 (2, N = 254) = .332, p > .05). The
mean ranks for the skill is 125.52 for government sector respondents, 125.81 for aided
sector respondents and 130.75 for self-financing sector respondents. Inspection of the
group means also suggests that there is no significant difference between working
sector of the respondents and the aforesaid skill. Thus, null hypothesis is accepted.
Information Access Competency Variable - 9
Table 15: Mann Whitney U Test and Kruskal Wallis Test on the competency “I will
keep in mind the problems faced and benefits gained in the previous experiences while
making an alternate search for information”. Vs. Designation and Working Sector of
the Respondents.
Mann Whitney U Test
Variables Response
Total Mean
Rank
Sum of
Ranks
Mann-
Whitney
U
P SD DA NE AG SA
Assistant
Professor 1 1 19 107 35 163 121.41 19789.5 6423.5 .042

Associate
Professor &
Professor
0 2 9 47 33 91 138.41 12595.5
Total 1 3 28 154 68 254
Kruskal-Wallis Test
Variables
Response
Total Mean
Rank X2 df P
SD DA NE AG SA
Govt. 1 0 11 50 26 88 129.69
.813 2 .666
Aided 0 2 12 40 20 74 121.86
Self-
Finance 0 1 5 64 22 92 129.94
Total 1 3 28 154 68 254
Note. Source: Primary Data. SD = Strongly Disagree; DA = Disagree; NE = Neutral;
AG = Agree; SA = Strongly Agree.
Table 15 shows the designation and working sector-wise distribution of the
respondents in terms of their skill to apply previous experiences of using web-based
services to keep in mind the problems faced and benefits gained in the previous
experiences while making an alternate search for information.
Designation-wise Analysis: 107 AP and 47 AP&P agree while 35 AP and 33 AP&P
strongly agree that they can apply previous experiences of using web-based services to
keep in mind the problems faced and benefits gained in the previous experiences while
making an alternate search for information. 19 AP and 9 AP&P are neutral while just 3
respondents disagree with this skill.
Mann-Whitney U Test: The results of the test were in the expected direction and
significant, U = 6423.5, p<.05. Inspection of the two group mean ranks indicates that
the average skill score for Associate Professors and Professors (138.41) is significantly
higher than the score (121.41) for Assistant Professors. The difference between the
mean ranks is 17. The null hypothesis is rejected and alternative hypothesis is accepted.
Thus, there is a significant difference between AP and AP&P in their skills to keep in
mind the problems faced and benefits gained in the previous experiences while making
an alternate search for information.

Working Sector-wise Analysis: 50 GSR, 40 ASR and 64 SSR agree while 26 GSR, 20
ASR and 22 SSR strongly agree that they can keep in mind the problems faced and
benefits gained in the previous experiences while making an alternate search for
information. 11 GSR, 12 ASR and 5 SSR have neutral level skill in this regard. Only 3
respondents have disagreed with this skill.
Kruskal-Wallis test: The Kruskal-Wallis test reveals that there is no significant effect
of working sector of the respondents on their skill ‘I will keep in mind the problems
faced and benefits gained in the previous experiences while making an alternate search
for information’ (X2 (2, N = 254) = .813, p > .05). The mean ranks for the skill is
129.69 for government sector respondents, 121.86 for aided sector respondents and
129.94 for self-financing sector respondents. Inspection of the group means also
suggests that there is no significant difference between working sector of the
respondents and the aforesaid skill. Thus, null hypothesis is accepted.
Information Access Competency Variable - 10
Table 16: Mann Whitney U Test and Kruskal Wallis Test on the competency “I know
the scope, content and organisation of information sources like bibliography, research
database etc.” Vs. Designation and Working Sector of the Respondents
Mann Whitney U Test
Variables Response
Total Mean
Rank
Sum of
Ranks
Mann-
Whitney U P
SD DA NE AG SA
Assistant
Professor 1 7 16 95 44 163 128.10 20879.5
7319.5 .846 Associate
Professor &
Professor
0 8 7 51 25 91 126.43 11505.5
Total 1 15 23 146 69 254
Kruskal-Wallis Test
Variables
Response
Total Mean
Rank X2 df P
SD DA NE AG SA
Govt. 1 2 9 50 26 88 132.00
11.322 2 .003 Aided 0 11 12 35 16 74 106.66
Self-Finance 0 2 2 61 27 92 139.96
Total 1 15 23 146 69 254
Note. Source: Primary Data. SD = Strongly Disagree; DA = Disagree; NE = Neutral;
AG = Agree; SA = Strongly Agree.
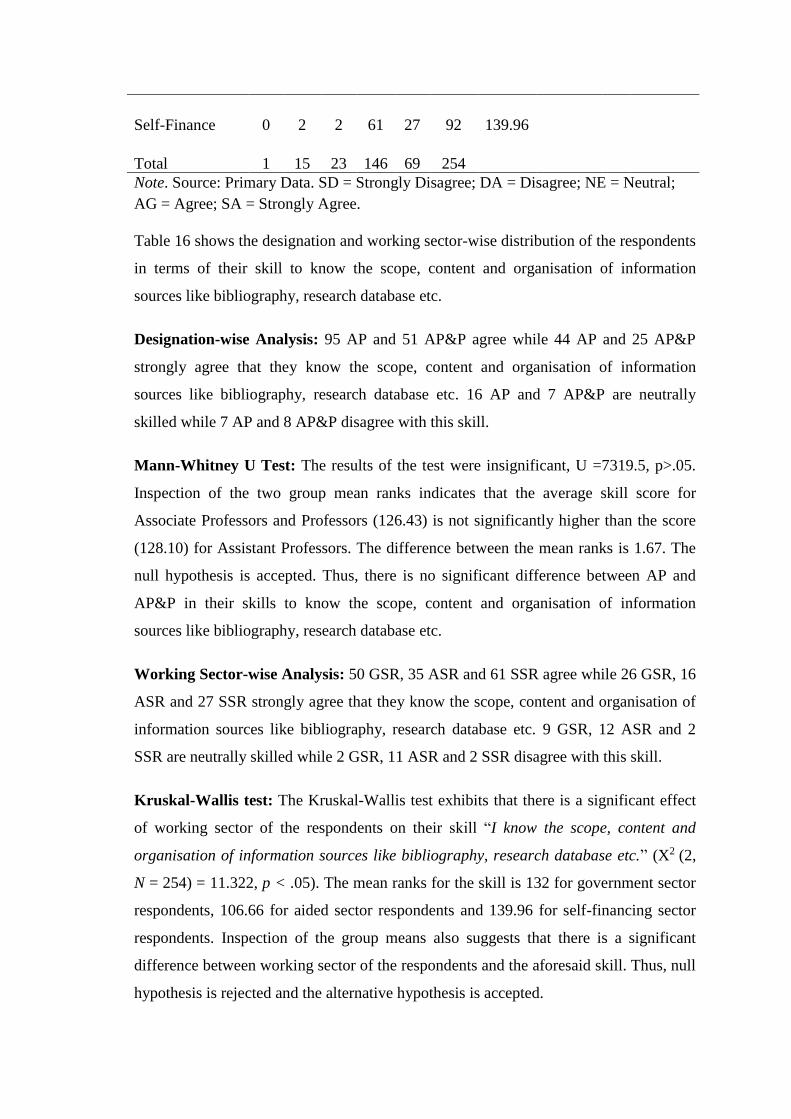
Table 16 shows the designation and working sector-wise distribution of the respondents
in terms of their skill to know the scope, content and organisation of information
sources like bibliography, research database etc.
Designation-wise Analysis: 95 AP and 51 AP&P agree while 44 AP and 25 AP&P
strongly agree that they know the scope, content and organisation of information
sources like bibliography, research database etc. 16 AP and 7 AP&P are neutrally
skilled while 7 AP and 8 AP&P disagree with this skill.
Mann-Whitney U Test: The results of the test were insignificant, U =7319.5, p>.05.
Inspection of the two group mean ranks indicates that the average skill score for
Associate Professors and Professors (126.43) is not significantly higher than the score
(128.10) for Assistant Professors. The difference between the mean ranks is 1.67. The
null hypothesis is accepted. Thus, there is no significant difference between AP and
AP&P in their skills to know the scope, content and organisation of information
sources like bibliography, research database etc.
Working Sector-wise Analysis: 50 GSR, 35 ASR and 61 SSR agree while 26 GSR, 16
ASR and 27 SSR strongly agree that they know the scope, content and organisation of
information sources like bibliography, research database etc. 9 GSR, 12 ASR and 2
SSR are neutrally skilled while 2 GSR, 11 ASR and 2 SSR disagree with this skill.
Kruskal-Wallis test: The Kruskal-Wallis test exhibits that there is a significant effect
of working sector of the respondents on their skill “I know the scope, content and
organisation of information sources like bibliography, research database etc.” (X2 (2,
N = 254) = 11.322, p < .05). The mean ranks for the skill is 132 for government sector
respondents, 106.66 for aided sector respondents and 139.96 for self-financing sector
respondents. Inspection of the group means also suggests that there is a significant
difference between working sector of the respondents and the aforesaid skill. Thus, null
hypothesis is rejected and the alternative hypothesis is accepted.

Post-Hoc Tests:
Pair Sector Mean Rank Difference U p Result
I Govt. 88.88
16.15 2607 .017 Significant
Difference Aided 72.73
II Govt 87.63
5.62 3795 .400 No Significant
Difference Self-finance 93.25
III Aided 71.43
21.78 2510.5 .001 Significant
Difference Self-finance 93.21
It is inferred that there is a significant difference between two pairs – Govt. Vs.
Aided and Aided Vs. Self-finance – in their skills to know the scope, content and
organisation of information sources like bibliography, research database etc. as their p-
values are less than 0.05. These two pairs have created a difference in the group means
as calculated with Kruskal Wallis Test.
7. DISCUSSION AND CONCLUSION
The present study has aimed at analyse the information access competencies of
the women faculty members of arts and science colleges affiliated to Mother Teresa
Women’s University, Kodaikanal along with other peripheral objectives like
understanding their use of library resources and services. Around 50% of the
respondents claim that they can use various search strategies to access information. The
similar results were given by Dorvlo (2016) in his study on information literacy among
post graduate students of the University of Ghana. Khalid Mahmood (2013) found out
that the respondents feel comfortable in using Internet search engines (e.g., Google,
Yahoo, etc.). Aggrey (2009) found out that most of the respondents had a good
knowledge about search engines. In the United Kingdom a survey by Cole and Kelsey
(2004) indicated that most of the participants were unable to use electronic databases
for searching. In another study conducted in the United States by Pravikoff et al.
(2005), most students were not sure of the ability to search for information using the
online databases.
About half of the respondents use various techniques to access information. In a
study conducted by Adeleke & Emeahara (2016), it was found that 75% of the
respondents were able to develop successful search strategies. Hassan and Khaiser
(2012) found that one third of the respondents can design an effective search strategy.
The study conducted by Pinto and Sales (2010) revealed that the variables respondents
consider they perform best in are: to search for and retrieve internet information

(search); the variables in which respondents report their poorest performance: to know
information search strategies (search). Rafique (2014) reported that the faculty
members are not able to device good searching strategies and to use proper subject
terminology in order to access needed information resources. Rafique (2014) revealed
through his study that the respondents were able to use search engines to locate the
required information (mean 3.42), can apply advance search options to limit their
search (3.01) and can use OPAC to locate library resources (1.78).
The present study reveals that 95 % of the respondents are able to access both
printed and electronic information sources. Lata and Sharma (2013) reported that
61.4% of the students and 81.82% of the faculty of PGIMER and 49.09% of the
students and 53.85% of the faculty members of the PBDSUHS rated their skills very
high in accessing information in print format. Adeleke & Emeahara (2016) found that
80% of the respondents were able to access electronic information resources. Hassan
and Khaiser (2012) found that two third of the respondents are able to identify different
types of potential sources of information.
Half of the respondents are able to revise the searching method, if required.
Hassan and Khaiser (2012) also found that more than half of the respondents are able to
refine their search strategies. Hassan and Khaiser (2012) found that two third of the
respondents are able to determine whether the initial query should be revised. Two
third of the respondents are able to apply previous experiences to access information.
This findings was also supported by Hassan and Khaiser (2012) who found that about
three fourth of the respondents can apply new and prior information to the planning of
research and innovation. More than 90% of the respondents are able to read the text and
understand the main idea from the text. Pinto and Sales (2010) pointed out that the
variable respondents consider they perform best in is to recognize the author’s ideas
within the text (evaluation).
The study makes it clear that the faculty members lack certain information
access competencies. The nature and level of deficiency differs from faculty member to
faculty member either in respect of their designation or in respect of their working
sector or in respect of their age groups. In certain areas, Assistant professors are good.
But in other areas, Associate Professors and Professors are good. In certain skills,
government sector respondents are better while in other skills self finance sector and

private sector respondents are better. In some information access competencies, young
faculty members are weak. But in other competencies, middle and aged faculty
members are weak. Thus, the deficiency rate and area get differed. So, each and every
college / university should find out these deficiencies by conducting some special
surveys and initiate certain solid need-specific programmes to help the faculty members
get rid of their deficiencies. As the faculty members become more and more
information literate, their students and the learning environment get glistened. Even the
faculty members should have a strong feeling that unless or otherwise, they become
information literate, they may not be able to face the challenges thrown by the
Information technology penetrated global information system of the day.
References
Adeleke, D. S., & Emeahara, E. N. (2016). Relationship between information literacy
and use of electronic information resources by postgraduate students of the
University of Ibadan. Library Philosophy and Practice (e-journal). Paper
1381.
Aggrey, S. B. (2009). Information literacy among second and third year medical
students of University of Ghana Medical School (unpublished) M.Phil
Thesis of the Department of Information studies. Legon: University of
Ghana. P. xvii, 135-141.
Bury, S. (2011). Faculty attitudes, perceptions and experiences of information literacy:
a study across multiple disciplines at York University, Canada. Journal of
information literacy, 5(1), 45-64.
Cole, I. J., & Kelsey, A. (2004). Computer and information literacy in post-qualifying
education. Nurse Education in Practice, 4 (3), 190-199.
Dorvlo, S. S., & Dadzie, P. S. (2016). Information Literacy among Post Graduate
Students of the University of Ghana. Library Philosophy and Practice, 1.
Eddy, P. L. 2010. Partnerships and collaborations in higher education. ASHE Higher
Education Report, 36(2):1-115.
Garritano, J. R., Culp, F. B., & Twiss-Brooks, A. (2010). Chemical information
instruction in academe: Who is leading the charge?. Journal of Chemical
Education, 87(3), 340-344.
Hart, C. (1998), Doing a Literature Review – Releasing the Social Science Research
Imagination, Sage Publications, London. Interactive Learning Environments,
14(1), 17-24.
Lata, S. & Sharma, S. (2013). Information literacy among faculty and students of
Postgraduate Institute of Medical Education and Research, Chandigarh and
Pt.B.D. Sharma University of Health Sciences, Rohtak. International Journal of
Information Dissemination and Technology, 3(4), 244-248.
Mahmood, K. (2013). Relationship of students’ perceived information literacy skills
with personal and academic variables. Libri, 63(3), 232-239.
McGuinness, C. (2006). What faculty think–exploring the barriers to information
literacy development in undergraduate education. The Journal of Academic
Librarianship, 32(6), 573-582.
Moghaddaszadeh, H., & Nikam, K. (2012). Attitudes of Faculty Members and
Research Scholars towards Information Literacy: A Study of Bangalore
University, Bangalore, India. International Journal of Information
Dissemination and Technology, 2(1), 12.
Myers, J. M. & Halpin, R. (2002). Teachers’ attitudes and use of multimedia
technology in the classroom: Constructivist-based professional development
training for school districts. Journal of Computing in Teacher Education,
18(4), 133-140
Nirmal Singh and Dhiraj kumar (2013), Information Access and Utilization by Faculty
of Guru Angad Dev Veterinary and Animal Sciences University
(GADVASU) in Electronic Era. International Research: Journal of Library &
Information Science, 3 (2), 226-239
Ojedokun, A. A., & Owolabi, E. O. (2003). Internet access competence and the use of
the Internet for teaching and research activities by University of Botswana
academic staff. African Journal of Library, Archives and Information Science,
13(1), 43-54.
Papzan, Abdol hamid and Yaghoubi, Jafar (2008), “Identifying electronic information
needs of agricultural faculty members”, in World Conference on Agricultural
Information andIT, available at: http://www.cabi.org/GARA/FullTextPDF/
2008/20083298079.pdf (accessed 26 December 2017).
Pinto, M., & Sales, D. (2010). Insights into translation students’ information literacy
using the IL-HUMASS survey. Journal of Information Science, 36(5), 618-
630.
Popoola, S. O. (2017). Faculty awareness and use of library information products and
services in Nigerian Universities. Malaysian Journal of Library & Information
Science, 13(1), 91-102.
Pravikoff, D. S., Tanner, A. B., and Pierce, S. T., (2005). “Readiness of US nurses for
evidence- based practice: many don’t understand or value research and had little
or no training to help them find evidence on which practice.” American
Journal of Nursing, 105 (9), 40-52.

Rafique, G. M. (2014). Information Literacy skills of Faculty members: A study of the
University of Lahore, Pakistan. Library philosophy and practice, Paper-1072.
Rovai, A. P. & Childress, M. D. (2002). Explaining and predicting resistance to
computer anxiety reduction among teacher education students. Journal of
Research on Technology in Education, 35(2), 226-235
Satpathy, Sunil Kumar and Rout, Biswanath (2010), “Use of e-resources by the faculty
members with special reference to CVRCE, Bhubaneswar”, DESIDOC Journal
of Library and Information Science, 30 (4), 11-16
Teo, T. (2006). Attitudes toward computers: A study of post-secondary students in
Singapore.
Timothy, A. S., & Olufunke, A. (2015). Assessment of information communication
technology availability, use and challenges by the staff of the Nigerian Institute
of Medical Research. American Journal of Medical Sciences and Medicine,
3(6), 79-83
Tsitouridou, M. & Vryzas, K. (2003). Early childhood teachers’ attitudes towards
computer and information technology: The case of Greece. Information
Technology in Childhood Education Annual, 1, 187-207
Vellaichamy, A., & Jeyshankar, R. (2017). Academic performances by the faculty
members of Mother Teresa Women's University and its affiliated colleges: an
evaluative study. Library Philosophy & Practice. (e-journal). 1589.
Vellaichamy, A., & Jeyshankar, R. (2017). An Assessment of women faculty members'
opinions about information literacy needs, search and evaluation competencies.
Library Philosophy & Practice. (e-journal). 1689.
Weiner, S. A. (2014). Who teaches information literacy competencies? Report of a
study of faculty. College Teaching, 62(1), 5-12.
Woo, H. (2005). The 2004 user survey at the University of Hong Kong libraries.
College & Research Libraries, 66(2), 115-135.
Yuen, H. K., Law, N., & Chan, H. (1999). Improving IT Training course for serving
teachers through course evaluation. Advanced Research in Computers and
Communications in Education: New Human Abilities for the Networked
Society, 1, 441
Yusuf, M. O., & Balogun, M. R. (2011). Student-Teachers' Competence and Attitude
towards Information and Communication Technology: A Case Study in a
Nigerian University. Contemporary Educational Technology, 2(1).