an analytical model of a deformable cantilever structure rocking on...
TRANSCRIPT

An analytical model of a deformable cantilever structure rocking ona rigid surface: experimental validation
Rico Truniger, Michalis F. Vassiliou*,† and Božidar Stojadinović
Institute of Structural Engineering (IBK), Swiss Federal Institute of Technology (ETHZ), Stefano-Franscini-Platz 5, 8093Zürich, Switzerland
SUMMARY
This paper describes an experimental program to examine the dynamic response of deformable cantileversrocking on a rigid surface. The primary goal of the tests is to verify and validate a dynamic rocking modelthat describes the behavior of these structures. The benchmark response data was obtained from shaking-table tests on deformable rocking specimens with different natural vibration frequencies and different aspectratios excited by analytical pulses and recorded ground motions. The responses computed using the modelare found to be in good agreement with the benchmark test results. Widely used impact, restitution anddamping assumptions are revisited based on the experiment results and the analytical model findings.Copyright © 2015 John Wiley & Sons, Ltd.
Received 24 October 2014; Revised 26 March 2015; Accepted 26 June 2015
KEY WORDS: seismic isolation; seismic modification; rocking; uplifting structures; earthquakeengineering; overturning
1. INTRODUCTION
Designing structures with safety factors against uplift smaller than one has been proposed as anearthquake response modification technique. The technique is based on the fact that comparativelylarge and sustained forces are needed to overturn physically large structures meaning, in turn, thatsuch structures are difficult to overturn by naturally occurring dynamic excitations. While manytheoretical models for rocking of rigid structures have been published, there are relatively fewtheoretical models for rocking of structures whose deformability cannot be neglected. Moreover,even fewer tests have been performed to experimentally examine the behavior of rocking structures[1–8]. These tests have shown that the response and, in particular, the energy dissipation mechanismsof a rocking structure are more complex than typically assumed.
This paper describes a series of experiments that were performed to validate an analytical model forrocking of deformable cantilever structures with massive columns and concentrated masses at the baseand the top of the cantilever developed in a companion paper [9]. Specimens with four differentfundamental vibration frequencies were mounted on two different uplifting bases and excited byanalytical pulses and real ground motions using a shaking table. The observations from the initialtests were used to examine the loss of energy during impact and to propose a new way toanalytically model this phenomenon. A description of the tests and the obtained test data is availablein [10]. The data can be used to assess other models for uplifting and rocking response ofdeformable cantilever structures.
*Correspondence to: Michalis F. Vassiliou, Institute of Structural Engineering (IBK), Swiss Federal Institute of Technol-ogy (ETHZ), Stefano-Franscini-Platz 5, 8093 Zürich, Switzerland.†E-mail: [email protected]
Copyright © 2015 John Wiley & Sons, Ltd.
EARTHQUAKE ENGINEERING & STRUCTURAL DYNAMICSEarthquake Engng Struct. Dyn. (2015)Published online in Wiley Online Library (wileyonlinelibrary.com). DOI: 10.1002/eqe.2609

2. SPECIMENS AND TEST SETUP
A specimen consists of a steel base plate, two columns made using steel threaded rods, and a steelweight at the top (Figure 1, Table I). The configuration of the specimen is deliberately similar to theconfiguration of the model of a deformable rocking column utilized in the companion paper [9]. Thetop weight and the base plates are attached to the columns using threaded holes and nuts. Twohorizontal stiffeners were mounted between the two columns, as shown in Figure 1, to increase theout-of plane horizontal stiffness and, thus, impede out-of-plane movement.
Four different column diameters are used to make specimens with fixed-base natural frequencies ofapproximately 1, 2, 3 and 4Hz. In addition, base plates with widths, bb, of 15 and 30 cm were used toinvestigate the influence of the specimen slenderness on the response. The four frequencies and twobase plate widths give eight different specimens. Dimensions and masses, together with values ofthe slenderness α and rocking parameter p [9] as well as the measured fixed-base natural frequenciesand damping ratios of the eight specimens, are listed in Table I. The column diameter, dc,corresponds to the outside diameter of the threaded rod, while the mass mc includes the twocolumns, two horizontal stiffeners and the nuts to mount them. The top weight consists of twoindividual plates. The mass of the top weight, mw, also includes the mass of the nuts needed toattach the plates to the columns and the mass of a small additional weight placed eccentrically onthe top of each specimen to balance it and compensate for the unavoidable manufacturingeccentricity. The fixed-base vibration characteristics were determined in 60-s long free vibrationtests. The natural frequencies, f, of the 1, 2 and 3-Hz specimens are independent of the base plate.There is, however, a considerable difference between the measured frequencies of the 4Hzspecimens with the long and the short base plates. An extra 1 kg mass was attached at the top of the4Hz Long Base specimen to balance it: this added mass can partly explain the difference in the
Table I. Dimensions, masses and vibration characteristics of the eight specimens.
SpecimenVibration char. Top weight Column Base plate
Rockingparameters
ffix ζ hw dw mw hc dc mc hb bb tb mb α p[Hz] [%] [mm] [mm] [kg] [mm] [mm] [kg] [mm] [mm] [mm] [kg] [ ] [Hz]
1Hz Long Base 0.94 0.26 125 145 14.72 1000 12 1.75 10 300 150 3.53 0.159 3.221Hz Short Base 1.00 0.16 125 145 14.72 1000 12 1.75 10 150 150 1.77 0.081 3.242Hz Long Base 2.07 0.28 125 145 14.96 1000 16 2.98 10 300 150 3.53 0.160 3.232Hz Short Base 2.05 0.40 125 145 14.96 1000 16 2.98 10 150 150 1.77 0.081 3.253Hz Long Base 3.11 0.60 125 145 15.16 1000 20 4.32 10 300 150 3.53 0.161 3.243Hz Short Base 3.12 0.35 125 145 15.16 1000 20 4.32 10 150 150 1.77 0.081 3.254Hz Long Base 3.84 1.32 125 145 16.65 1000 24 6.34 10 300 150 3.53 0.161 3.244Hz Short Base 4.34 0.76 125 145 15.58 1000 24 6.34 10 150 150 1.77 0.081 3.26
Figure 1. Left: two views of the 4Hz Long Base specimen. Middle: sketch of a specimen and its compo-nents. Right: placement of the infrared markers.
R. TRUNIGER, M. F. VASSILIOU AND B. STOJADINOVIĆ
Copyright © 2015 John Wiley & Sons, Ltd. Earthquake Engng Struct. Dyn. (2015)DOI: 10.1002/eqe

measured vibration periods. The damping ratio ζ changed during the free vibration test: the value givenin Table I is an average over the first 20 s of the test. Unexpectedly, the damping ratio depends on thebase plate width, being smaller for the short base specimens (except for the 2Hz case).
2.1. Specimen excitation and the shaking table
The rocking response of a specimen was induced by dynamics excitation of its support. This wasachieved by placing the specimens, one at the time, on the top of the ETH shaking table [11] steelplatform. The shaking table platform is a stiff steel box. It is placed on roller bearings and actuatedusing servo-hydraulic actuators to move only in one horizontal direction. The stroke of the table is250mm, and the maximum velocity is 225mm/s.
Each specimen was tested using 15 different symmetric Ricker wavelets, 12 different antisymmetricRicker wavelets and 3 earthquake records. A total of 240 tests were conducted.
A Ricker wavelet approximates the main pulse of pulse-type ground motions [12]. Typicalsymmetric and antisymmetric Ricker wavelets are shown in Figure 2. The acceleration amplitude,ap, and period, Tp, of a Ricker wavelet are discussed further in [13]. The Ricker wavelets used inthis study had the pulse periods Tp ranging from 0.25 s to 2 s and the acceleration amplitudes apranging from 0.04 g to 0.64 g. The values, normalized using the slenderness and the rockingparameter values of the short and long base specimens, are shown in the rocking spectrum plots inFigure 2. The lines shown in the rocking spectrum plots represent the maximum pulse velocity thatcan be applied by the ETH shaking table for the short and the long base specimens. While theselected specimens and wavelet excitations covered the spectrum parameter space well, it is clearthat the maximum table velocity limited the range of rocking response that could be investigated.For example, the 4Hz short base specimen can rock and overturn in both directions, while the 1HzLong Base specimen can rock, but cannot overturn (Figure 2).
Three different earthquake records were used to excite the specimens (Table II). The records werealso scaled down because of the limited maximum velocity of the shake table, but were stillsufficiently strong to induce rocking in all and overturn some of the specimens.
Figure 2. Symmetric and antisymmetric Ricker wavelets and the rocking spectra showing the tested casesand the pulse velocity limit imposed by the ETH shaking table.
DEFORMABLE COLUMN ROCKING ON A RIGID SURFACE: EXPERIMENTAL VALIDATION
Copyright © 2015 John Wiley & Sons, Ltd. Earthquake Engng Struct. Dyn. (2015)DOI: 10.1002/eqe

2.2. Test method
A layer of sandpaper was taped on the shake table platform to increase the friction between theplatform and the specimen base plate with the goal to minimize sliding and stepping of thespecimens during the rocking motion. To prevent damage in case of overturning, the top weight ofthe specimen was connected to the hook of the overhead crane with a loose light string that wasneither heavy nor tight enough to affect the response. Motion of the specimens was recorded for 20to 30 s after the start of the Ricker wavelet excitations, and for 60 s after the start of the earthquakeexcitations.
2.3. Data acquisition system
An Optotrak Certus System, manufactured by Northern Digital Inc., was used to track the position ofthe specimens during the tests. This system uses active infrared-emitting diodes as markers and atrinocular camera system to determine the position of the markers. Three markers were placed onthe specimen to measure its position (Figure 1, right): two markers placed on the base plate wereused to determine the rocking angle; the third marker, placed at the center of the top weight wasused to measure the elastic deformation of the column and the motion of the top of the specimen. Afourth marker was placed on the shaking table. The accuracy of the system was determined bymeasuring the position of a marker at rest over a long period of time. In the x- and y-directions inthe plane where rocking motion takes place, the accuracy was about 0.02mm. In the z-direction,perpendicular to the plane of motion, the accuracy was about 0.10mm.
The position sampling frequency was 500Hz. The highest measured uplifted vibration frequencywas 34Hz, which means that at least 15 position measurements per marker were taken during anoscillation in the uplifted state of a specimen. This is sufficient to capture the motion of thespecimen and measure its frequency. However, assessment of the damping ratio using thelogarithmic decrement methods is sensitive to the exact measurement of the amplitude and was,thus, less accurate. This could be one of the reasons for the consistent difference in damping ratiosfor the long and the short base specimens (Table I).
3. EXPERIMENT OUTCOMES AND OBSERVATIONS
The objective of the experimental campaign was to investigate the rocking response of a deformablecolumn with distributed mass and concentrated masses on its top and its base. Therefore, the testswhere the rocking angle amplitudes exceeded 10% of the specimen slenderness (0.1α) areconsidered in detail, while the tests without uplift or with overturning are used only to verify therocking spectra. Table III lists the 64 tests with Ricker wavelets where there was uplift but nooverturning, and the rocking angle amplitude exceeded 0.1α. The tests are numbered for reference.The results of the earthquake excitation tests are shown separately in a later section.
Typical test response is one where the specimen uplifts and rocks without overturning, withoutrotation about its vertical axis (twisting), out-of-plane motion, or stepping or sliding on the rockingsurface. The following deviations in specimen response were observed:
Table II. Earthquake records used in the tests.
Earthquake Record station SourceMagnitude
(Mw)Distance(km)
PGA(g)
PGV(m/s) ap (g) Tp (s)
Scalefactor
1971 SanFernando
Pacoima Dam164
PEER 6.6 11.9 1.23 1.13 0.30 1.35 0.102
1992 Erzican, Erzincan/NS PEER 6.9 13 0.52 0.84 0.32 2.00 0.2051995 Aigio OTE
Building/FNITSAK 6.2 20 0.50 0.43 0.44 0.60 0.407
R. TRUNIGER, M. F. VASSILIOU AND B. STOJADINOVIĆ
Copyright © 2015 John Wiley & Sons, Ltd. Earthquake Engng Struct. Dyn. (2015)DOI: 10.1002/eqe

Table III. List of tests with a Ricker wavelet excitation and measured rocking angle amplitudes largerthan 0.1α.
No. Specimen configuration Excitation type Tp [s] ap [g]
1 1Hz Long Base Antisymmetric Ricker 1.00 0.102 Symmetric Ricker 1.00 0.083 Symmetric Ricker 1.00 0.164 Symmetric Ricker 0.50 0.325 1Hz Short Base Antisymmetric Ricker 1.00 0.046 Antisymmetric Ricker 1.00 0.107 Antisymmetric Ricker 0.50 0.168 Antisymmetric Ricker 0.50 0.229 Symmetric Ricker 1.00 0.0410 Symmetric Ricker 1.00 0.0811 Symmetric Ricker 0.50 0.1612 Symmetric Ricker 0.50 0.2413 Symmetric Ricker 0.50 0.3214 2Hz Long Base Antisymmetric Ricker 0.50 0.1015 Antisymmetric Ricker 0.50 0.1616 Antisymmetric Ricker 0.50 0.2217 Symmetric Ricker 1.00 0.1618 Symmetric Ricker 0.50 0.1619 Symmetric Ricker 0.50 0.2420 Symmetric Ricker 0.50 0.3221 Symmetric Ricker 0.25 0.6422 2Hz Short Base Antisymmetric Ricker 0.50 0.1023 Antisymmetric Ricker 0.50 0.1624 Antisymmetric Ricker 0.50 0.2225 Antisymmetric Ricker 0.25 0.4426 Symmetric Ricker 1.00 0.0827 Symmetric Ricker 0.50 0.0828 Symmetric Ricker 0.50 0.1629 Symmetric Ricker 0.50 0.2430 Symmetric Ricker 0.25 0.3231 Symmetric Ricker 0.25 0.6432 3Hz Long Base Antisymmetric Ricker 0.50 0.1633 Antisymmetric Ricker 0.50 0.2234 Antisymmetric Ricker 0.25 0.4435 Symmetric Ricker 0.50 0.1636 Symmetric Ricker 0.50 0.2437 Symmetric Ricker 0.50 0.3238 Symmetric Ricker 0.25 0.6439 3Hz Short Base Antisymmetric Ricker 0.50 0.1040 Antisymmetric Ricker 0.50 0.1641 Antisymmetric Ricker 0.50 0.2242 Antisymmetric Ricker 0.25 0.4443 Symmetric Ricker 0.50 0.0844 Symmetric Ricker 0.50 0.1645 Symmetric Ricker 0.50 0.2446 Symmetric Ricker 0.25 0.3247 Symmetric Ricker 0.25 0.6448 4Hz Long Base Antisymmetric Ricker 0.50 0.2249 Antisymmetric Ricker 0.25 0.4450 Symmetric Ricker 0.50 0.2451 Symmetric Ricker 0.50 0.3252 Symmetric Ricker 0.25 0.6453 4Hz Short Base Antisymmetric Ricker 1.00 0.1054 Antisymmetric Ricker 0.50 0.1055 Antisymmetric Ricker 0.50 0.1656 Antisymmetric Ricker 0.50 0.2257 Antisymmetric Ricker 0.25 0.1658 Antisymmetric Ricker 0.25 0.22
(Continues)
DEFORMABLE COLUMN ROCKING ON A RIGID SURFACE: EXPERIMENTAL VALIDATION
Copyright © 2015 John Wiley & Sons, Ltd. Earthquake Engng Struct. Dyn. (2015)DOI: 10.1002/eqe

• Asymmetry of the response: An eccentricity of the center of gravity of the top mass with respect tothe center of the specimen base plate along the horizontal x-axis in the plane of rocking results inlonger rocking half cycles and larger rocking angle amplitudes in the direction of the eccentricity.Specimen eccentricity might occur because of the specimen geometry imperfections (the threadedholes in the base plate are not perfectly centered or perfectly perpendicular to the base plate bot-tom surface, the holes in the top weight are not perfectly centered) and because of possible plasticdeformations of the column. In Figure 3 (left), the x-direction position of marker 3 (Figure 1,right) is compared to the average value of the x-direction position of markers 1 and 2. The mea-surements were taken before the start of each test. Four out of the eight specimens have a negli-gible eccentricity of the top weight. The 10mm eccentricity of the 4Hz Long Base specimen is,however, large. An extra 1 kg weight was added on the top of this specimen to compensate for thislarge eccentricity. The geometric eccentricity measurements remain virtually the same for re-peated tests with the same specimen. Hence, the columns did not deform plastically during anyof the tests.
• Sliding: There was practically no sliding for the tests with short base specimens (Figure 3, mid-dle). For the long base specimen tests, maximum sliding was 1.7mm.
• Stepping and twisting: The maximum base plate rotation around the y-axis observed during a testwas taken as a measure of stepping (Figure 3, right). The measured twist angle was less than 0.4°in a majority of the tests, which was considered to be small and an indication that there was nostepping. Similar to the observations made for the sliding measurement, stepping was more prom-inent for the long base specimens.
3.1. General observations
Indicative measured response time histories of the normalized base rotation θ/α and the normalizedelastic column deformation u/ucr (where ucr is defined in equation (25) of [9]) for the selectedspecimens are plotted in Figures 4 and 5. The response obtained using the analytical modeldeveloped in the companion paper [9] is also shown. The following was observed during the tests:
Table III. (Continued)
No. Specimen configuration Excitation type Tp [s] ap [g]
59 Antisymmetric Ricker 0.25 0.4460 Symmetric Ricker 0.50 0.1661 Symmetric Ricker 0.50 0.2462 Symmetric Ricker 0.25 0.1663 Symmetric Ricker 0.25 0.3264 Symmetric Ricker 0.25 0.64
Figure 3. Eccentricity of the top weight with respect to the center of the base (left); measured sliding dis-placement (middle); and measured twist about the vertical axis (right).
R. TRUNIGER, M. F. VASSILIOU AND B. STOJADINOVIĆ
Copyright © 2015 John Wiley & Sons, Ltd. Earthquake Engng Struct. Dyn. (2015)DOI: 10.1002/eqe

• The influence of the column elastic deformations on the rocking angle is clear in the 1Hz ShortBase and the 2Hz Long Base tests. For the test with the 4Hz Short Base specimen, this influenceis minor, and the rocking angle time history is smooth;
• The elastic column oscillates with high frequency about an average displaced position. This aver-age displacement changes sign with every impact;
• The duration of the full contact phase upon impact decreases with an increase of the specimenfrequency;
• No damping is apparent in the uplifted oscillations of the 1Hz Short Base and Long Base speci-mens and the 2Hz Long Base specimen;
Figure 4. Indicative response time histories of the selected 1Hz and 2Hz specimens enumerated perTable III.
DEFORMABLE COLUMN ROCKING ON A RIGID SURFACE: EXPERIMENTAL VALIDATION
Copyright © 2015 John Wiley & Sons, Ltd. Earthquake Engng Struct. Dyn. (2015)DOI: 10.1002/eqe

• The ‘back and forth’ motion discussed in Figure 3 of [14] was not observed in any of the con-ducted tests.
Figure 6 plots the response recorded during Test 41 (Specimen 3Hz Short Base). The elasticdeformation time history is irregular. The amplitude of the uplifted oscillations is different for everyrocking half-cycle. Furthermore, the elastic deformation increases during the first rocking half-cycle,making the apparent damping negative. In order to find out if these irregularities are reproducible,the test was repeated. The time history of the second test is shown in red in Figure 6. In the second
Figure 5. Indicative response time histories of the selected 3Hz and 4Hz specimens enumerated perTable III.
R. TRUNIGER, M. F. VASSILIOU AND B. STOJADINOVIĆ
Copyright © 2015 John Wiley & Sons, Ltd. Earthquake Engng Struct. Dyn. (2015)DOI: 10.1002/eqe
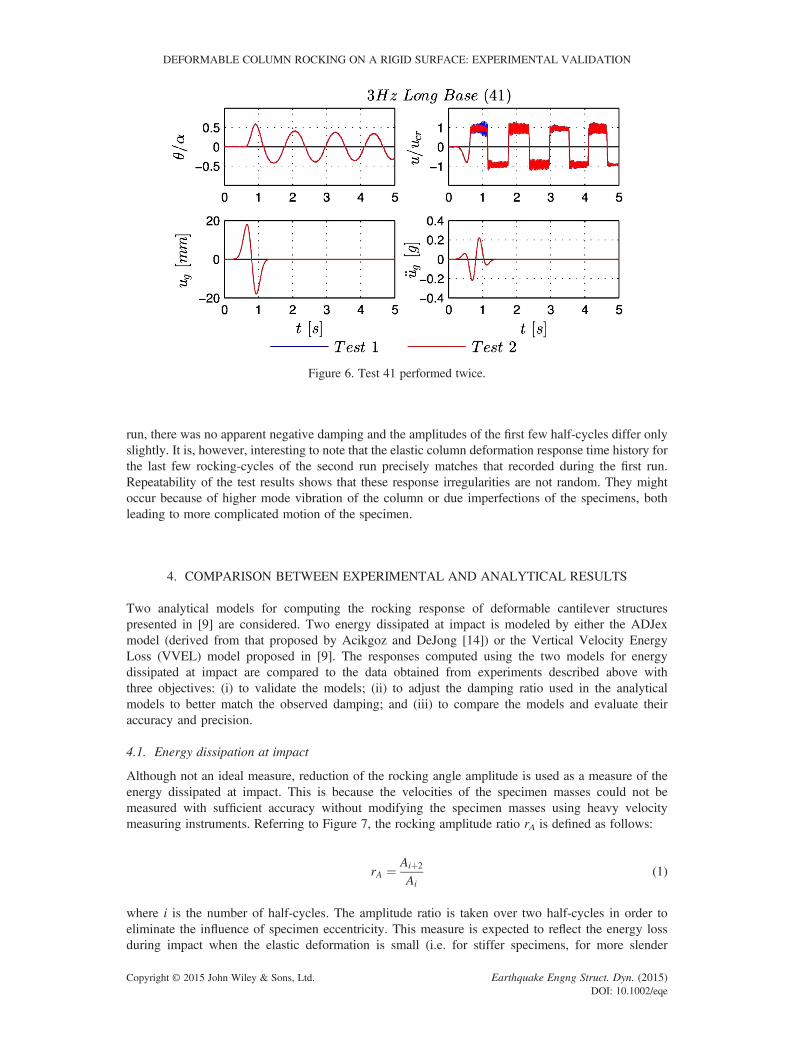
run, there was no apparent negative damping and the amplitudes of the first few half-cycles differ onlyslightly. It is, however, interesting to note that the elastic column deformation response time history forthe last few rocking-cycles of the second run precisely matches that recorded during the first run.Repeatability of the test results shows that these response irregularities are not random. They mightoccur because of higher mode vibration of the column or due imperfections of the specimens, bothleading to more complicated motion of the specimen.
4. COMPARISON BETWEEN EXPERIMENTAL AND ANALYTICAL RESULTS
Two analytical models for computing the rocking response of deformable cantilever structurespresented in [9] are considered. Two energy dissipated at impact is modeled by either the ADJexmodel (derived from that proposed by Acikgoz and DeJong [14]) or the Vertical Velocity EnergyLoss (VVEL) model proposed in [9]. The responses computed using the two models for energydissipated at impact are compared to the data obtained from experiments described above withthree objectives: (i) to validate the models; (ii) to adjust the damping ratio used in the analyticalmodels to better match the observed damping; and (iii) to compare the models and evaluate theiraccuracy and precision.
4.1. Energy dissipation at impact
Although not an ideal measure, reduction of the rocking angle amplitude is used as a measure of theenergy dissipated at impact. This is because the velocities of the specimen masses could not bemeasured with sufficient accuracy without modifying the specimen masses using heavy velocitymeasuring instruments. Referring to Figure 7, the rocking amplitude ratio rA is defined as follows:
rA ¼ Aiþ2
Ai(1)
where i is the number of half-cycles. The amplitude ratio is taken over two half-cycles in order toeliminate the influence of specimen eccentricity. This measure is expected to reflect the energy lossduring impact when the elastic deformation is small (i.e. for stiffer specimens, for more slender
Figure 6. Test 41 performed twice.
DEFORMABLE COLUMN ROCKING ON A RIGID SURFACE: EXPERIMENTAL VALIDATION
Copyright © 2015 John Wiley & Sons, Ltd. Earthquake Engng Struct. Dyn. (2015)DOI: 10.1002/eqe
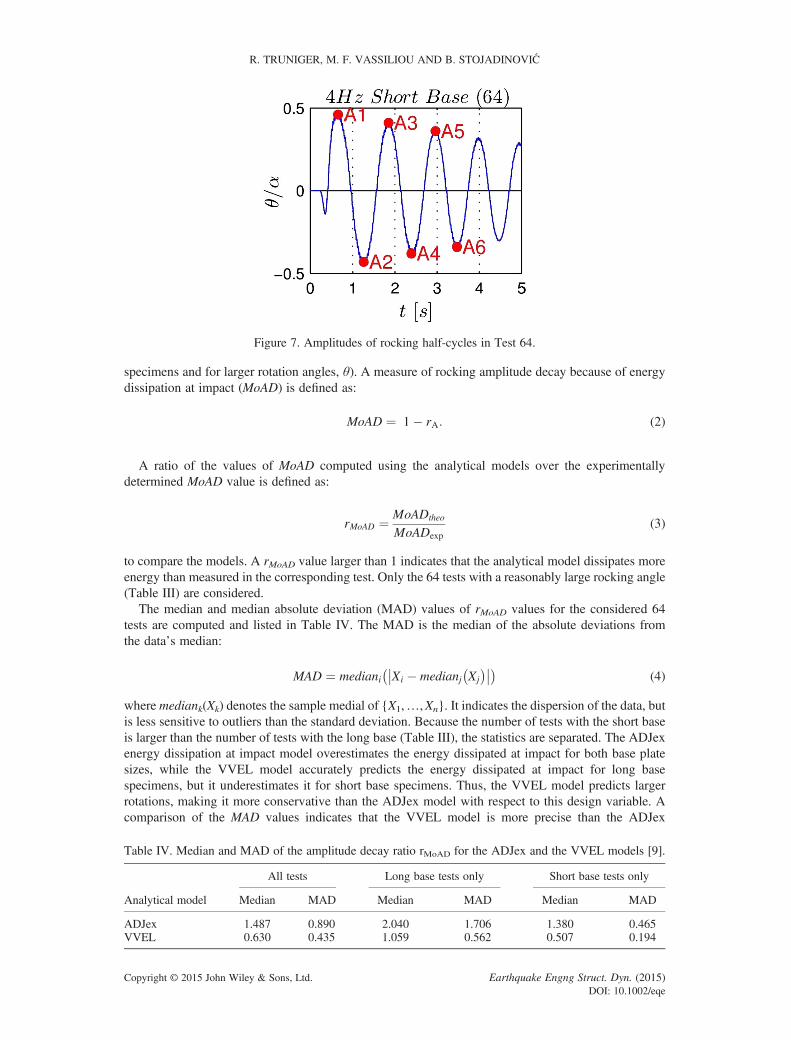
specimens and for larger rotation angles, θ). A measure of rocking amplitude decay because of energydissipation at impact (MoAD) is defined as:
MoAD ¼ 1� rA: (2)
A ratio of the values of MoAD computed using the analytical models over the experimentallydetermined MoAD value is defined as:
rMoAD ¼ MoADtheo
MoADexp(3)
to compare the models. A rMoAD value larger than 1 indicates that the analytical model dissipates moreenergy than measured in the corresponding test. Only the 64 tests with a reasonably large rocking angle(Table III) are considered.
The median and median absolute deviation (MAD) values of rMoAD values for the considered 64tests are computed and listed in Table IV. The MAD is the median of the absolute deviations fromthe data’s median:
MAD ¼ mediani Xi � medianj Xj
� ��� ��� �(4)
where mediank(Xk) denotes the sample medial of {X1,…,Xn}. It indicates the dispersion of the data, butis less sensitive to outliers than the standard deviation. Because the number of tests with the short baseis larger than the number of tests with the long base (Table III), the statistics are separated. The ADJexenergy dissipation at impact model overestimates the energy dissipated at impact for both base platesizes, while the VVEL model accurately predicts the energy dissipated at impact for long basespecimens, but it underestimates it for short base specimens. Thus, the VVEL model predicts largerrotations, making it more conservative than the ADJex model with respect to this design variable. Acomparison of the MAD values indicates that the VVEL model is more precise than the ADJex
Figure 7. Amplitudes of rocking half-cycles in Test 64.
Table IV. Median and MAD of the amplitude decay ratio rMoAD for the ADJex and the VVEL models [9].
All tests Long base tests only Short base tests only
Analytical model Median MAD Median MAD Median MAD
ADJex 1.487 0.890 2.040 1.706 1.380 0.465VVEL 0.630 0.435 1.059 0.562 0.507 0.194
R. TRUNIGER, M. F. VASSILIOU AND B. STOJADINOVIĆ
Copyright © 2015 John Wiley & Sons, Ltd. Earthquake Engng Struct. Dyn. (2015)DOI: 10.1002/eqe
model. Note, however, that the precision of the VVEL model predictions is still relatively low for thelong base tests compared to a fairly high prediction precision for the short base tests.
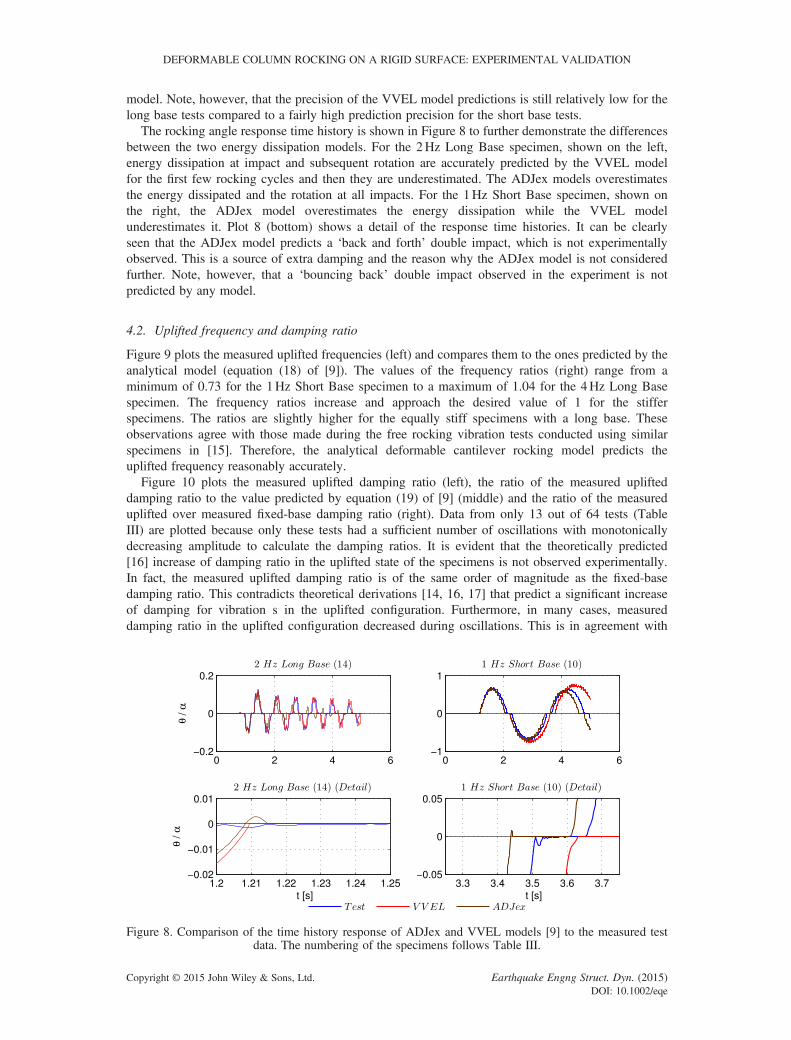
The rocking angle response time history is shown in Figure 8 to further demonstrate the differencesbetween the two energy dissipation models. For the 2Hz Long Base specimen, shown on the left,energy dissipation at impact and subsequent rotation are accurately predicted by the VVEL modelfor the first few rocking cycles and then they are underestimated. The ADJex models overestimatesthe energy dissipated and the rotation at all impacts. For the 1Hz Short Base specimen, shown onthe right, the ADJex model overestimates the energy dissipation while the VVEL modelunderestimates it. Plot 8 (bottom) shows a detail of the response time histories. It can be clearlyseen that the ADJex model predicts a ‘back and forth’ double impact, which is not experimentallyobserved. This is a source of extra damping and the reason why the ADJex model is not consideredfurther. Note, however, that a ‘bouncing back’ double impact observed in the experiment is notpredicted by any model.
4.2. Uplifted frequency and damping ratio
Figure 9 plots the measured uplifted frequencies (left) and compares them to the ones predicted by theanalytical model (equation (18) of [9]). The values of the frequency ratios (right) range from aminimum of 0.73 for the 1Hz Short Base specimen to a maximum of 1.04 for the 4Hz Long Basespecimen. The frequency ratios increase and approach the desired value of 1 for the stifferspecimens. The ratios are slightly higher for the equally stiff specimens with a long base. Theseobservations agree with those made during the free rocking vibration tests conducted using similarspecimens in [15]. Therefore, the analytical deformable cantilever rocking model predicts theuplifted frequency reasonably accurately.
Figure 10 plots the measured uplifted damping ratio (left), the ratio of the measured uplifteddamping ratio to the value predicted by equation (19) of [9] (middle) and the ratio of the measureduplifted over measured fixed-base damping ratio (right). Data from only 13 out of 64 tests (TableIII) are plotted because only these tests had a sufficient number of oscillations with monotonicallydecreasing amplitude to calculate the damping ratios. It is evident that the theoretically predicted[16] increase of damping ratio in the uplifted state of the specimens is not observed experimentally.In fact, the measured uplifted damping ratio is of the same order of magnitude as the fixed-basedamping ratio. This contradicts theoretical derivations [14, 16, 17] that predict a significant increaseof damping for vibration s in the uplifted configuration. Furthermore, in many cases, measureddamping ratio in the uplifted configuration decreased during oscillations. This is in agreement with
Figure 8. Comparison of the time history response of ADJex and VVEL models [9] to the measured testdata. The numbering of the specimens follows Table III.
DEFORMABLE COLUMN ROCKING ON A RIGID SURFACE: EXPERIMENTAL VALIDATION
Copyright © 2015 John Wiley & Sons, Ltd. Earthquake Engng Struct. Dyn. (2015)DOI: 10.1002/eqe
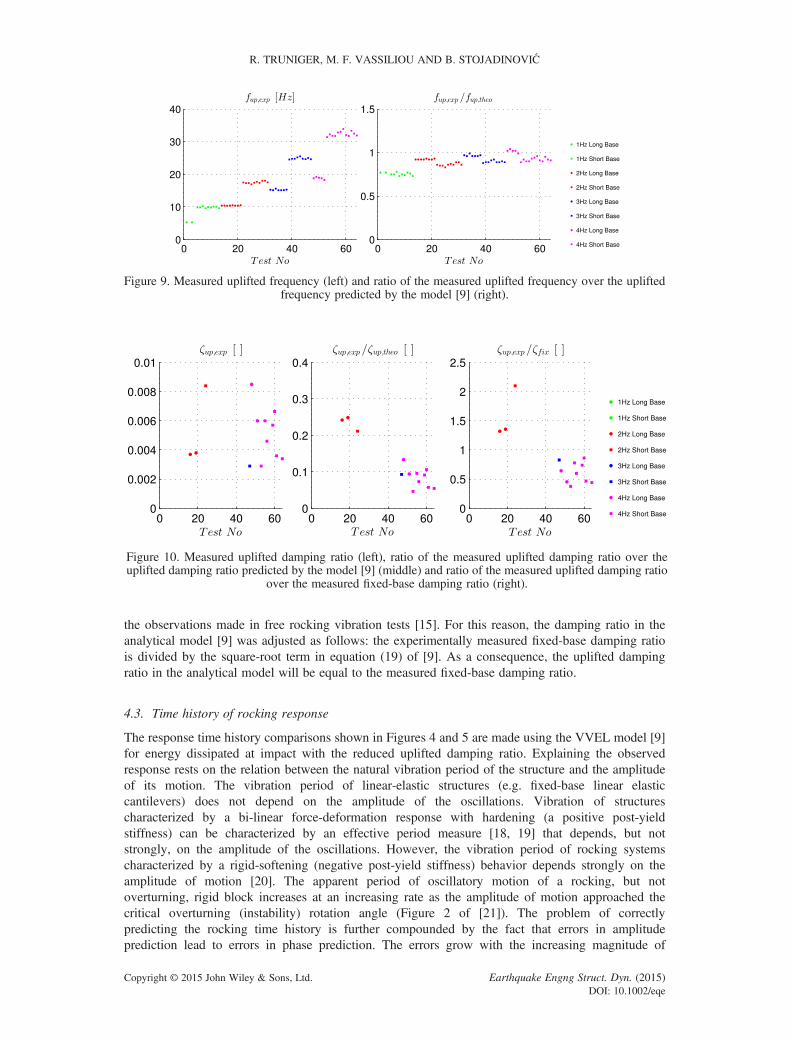
the observations made in free rocking vibration tests [15]. For this reason, the damping ratio in theanalytical model [9] was adjusted as follows: the experimentally measured fixed-base damping ratiois divided by the square-root term in equation (19) of [9]. As a consequence, the uplifted dampingratio in the analytical model will be equal to the measured fixed-base damping ratio.
4.3. Time history of rocking response
The response time history comparisons shown in Figures 4 and 5 are made using the VVEL model [9]for energy dissipated at impact with the reduced uplifted damping ratio. Explaining the observedresponse rests on the relation between the natural vibration period of the structure and the amplitudeof its motion. The vibration period of linear-elastic structures (e.g. fixed-base linear elasticcantilevers) does not depend on the amplitude of the oscillations. Vibration of structurescharacterized by a bi-linear force-deformation response with hardening (a positive post-yieldstiffness) can be characterized by an effective period measure [18, 19] that depends, but notstrongly, on the amplitude of the oscillations. However, the vibration period of rocking systemscharacterized by a rigid-softening (negative post-yield stiffness) behavior depends strongly on theamplitude of motion [20]. The apparent period of oscillatory motion of a rocking, but notoverturning, rigid block increases at an increasing rate as the amplitude of motion approached thecritical overturning (instability) rotation angle (Figure 2 of [21]). The problem of correctlypredicting the rocking time history is further compounded by the fact that errors in amplitudeprediction lead to errors in phase prediction. The errors grow with the increasing magnitude of
Figure 9. Measured uplifted frequency (left) and ratio of the measured uplifted frequency over the upliftedfrequency predicted by the model [9] (right).
Figure 10. Measured uplifted damping ratio (left), ratio of the measured uplifted damping ratio over theuplifted damping ratio predicted by the model [9] (middle) and ratio of the measured uplifted damping ratio
over the measured fixed-base damping ratio (right).
R. TRUNIGER, M. F. VASSILIOU AND B. STOJADINOVIĆ
Copyright © 2015 John Wiley & Sons, Ltd. Earthquake Engng Struct. Dyn. (2015)DOI: 10.1002/eqe
motion. This is why small amplitude rocking rotations are predicted more accurately than the largeones that occur when the rocking structure is close to overturning (Figure 4, test 29).
In Test 53 (Figure 5), the model fails to capture the normalized rotation θ/α time history. While themodel predicts only a minor uplift, the rocking angle amplitude measured in the test was close to thespecimen slenderness α; thus, the specimen was close to overturning. This large difference between themodel prediction and the experiment results occurred, in large part, because the excitation used, anantisymmetric Ricker wavelet with Tp=1.0 s and ap=0.10 g, places the tested specimen in a verysensitive part of the rocking spectrum, where a small difference in the acceleration amplitude canlead to a big difference in the rocking angle. This will be discussed further. Another significantsource of error in predicting the normalized rotation time history θ/α is the model for energy lossesbecause of impact. The VVEL model, adopted here, fits the test results for the long base specimenswell, but underestimates the test results for short base specimens. This is the reason why the timehistories of θ/α are generally more accurately predicted for the long base specimens.
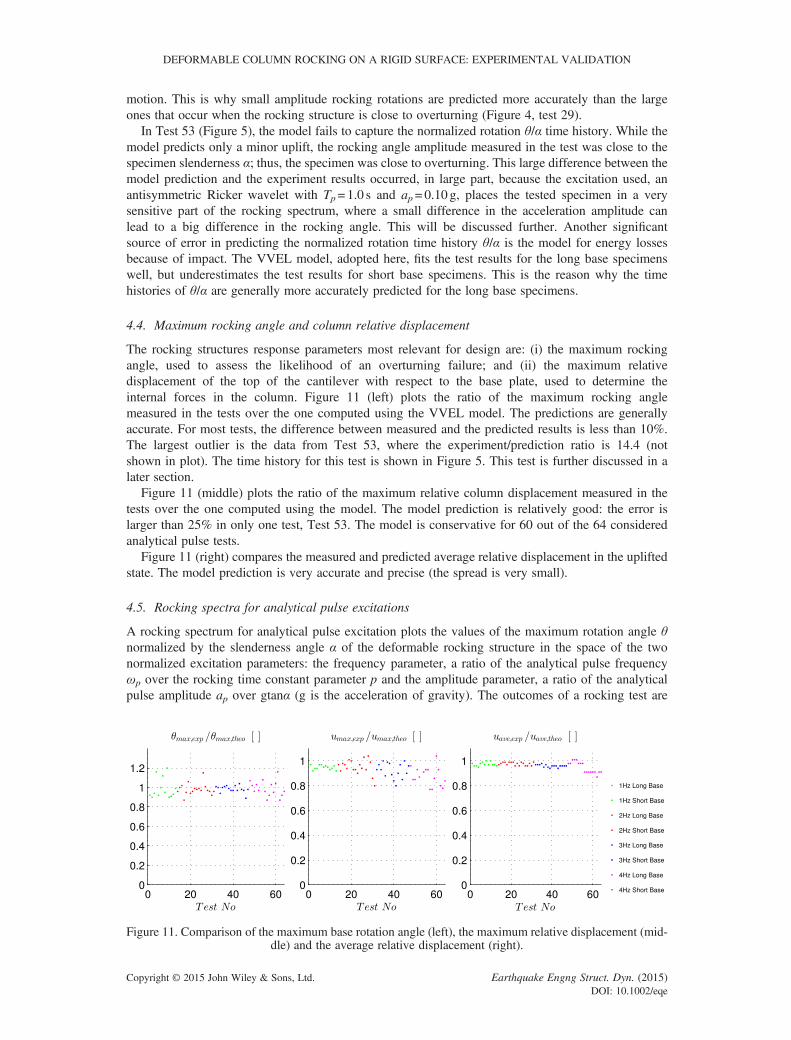
4.4. Maximum rocking angle and column relative displacement
The rocking structures response parameters most relevant for design are: (i) the maximum rockingangle, used to assess the likelihood of an overturning failure; and (ii) the maximum relativedisplacement of the top of the cantilever with respect to the base plate, used to determine theinternal forces in the column. Figure 11 (left) plots the ratio of the maximum rocking anglemeasured in the tests over the one computed using the VVEL model. The predictions are generallyaccurate. For most tests, the difference between measured and the predicted results is less than 10%.The largest outlier is the data from Test 53, where the experiment/prediction ratio is 14.4 (notshown in plot). The time history for this test is shown in Figure 5. This test is further discussed in alater section.
Figure 11 (middle) plots the ratio of the maximum relative column displacement measured in thetests over the one computed using the model. The model prediction is relatively good: the error islarger than 25% in only one test, Test 53. The model is conservative for 60 out of the 64 consideredanalytical pulse tests.
Figure 11 (right) compares the measured and predicted average relative displacement in the upliftedstate. The model prediction is very accurate and precise (the spread is very small).
4.5. Rocking spectra for analytical pulse excitations
A rocking spectrum for analytical pulse excitation plots the values of the maximum rotation angle θnormalized by the slenderness angle α of the deformable rocking structure in the space of the twonormalized excitation parameters: the frequency parameter, a ratio of the analytical pulse frequencyωp over the rocking time constant parameter p and the amplitude parameter, a ratio of the analyticalpulse amplitude ap over gtanα (g is the acceleration of gravity). The outcomes of a rocking test are
Figure 11. Comparison of the maximum base rotation angle (left), the maximum relative displacement (mid-dle) and the average relative displacement (right).
DEFORMABLE COLUMN ROCKING ON A RIGID SURFACE: EXPERIMENTAL VALIDATION
Copyright © 2015 John Wiley & Sons, Ltd. Earthquake Engng Struct. Dyn. (2015)DOI: 10.1002/eqe

represented by the magnitude of the normalized rotation angle as follows: (i) no uplift: θ/α=0; (ii)rocking without overturning; (iii) overturning in the positive direction; and (iv) overturning in thenegative direction.
The rocking spectra for the 1Hz Short Base specimen for an antisymmetric Ricker waveletexcitation and the 4Hz Short Base specimen for a symmetric Ricker wavelet excitation are plottedin Figure 12. Tests differing in the applied excitation (Table III) are indicated by ‘plus’ signs. An
Figure 12. Rocking spectra for the 1Hz Short Base specimen under antisymmetric Ricker wavelet excitationand for the 4Hz Short Base specimen under symmetric Ricker wavelet excitation; normalized rocking rota-
tion angle response time histories for the indicated tests.
R. TRUNIGER, M. F. VASSILIOU AND B. STOJADINOVIĆ
Copyright © 2015 John Wiley & Sons, Ltd. Earthquake Engng Struct. Dyn. (2015)DOI: 10.1002/eqe

additional test was conducted for the 1Hz Short Base specimen in order to examine the overturningzone between the two rocking-without-overturning zones in the rocking spectrum. The coordinatesfor this test, labeled as point 1 in Figure 12, are ωp /p=1.9 and ap /(gtanα) = 0.9.
Uplifts of the base were measured in all tests. For example, point 3 in Figure 12 shows a test wherethe measured maximum rocking angle was equal to about 0.0006α (as seen in the normalized rotationangle time history for this test shown in Figure 12), corresponding to the base plate edge uplift of about0.007mm. Compared to the 0.6mm thickness of the sandpaper placed under the specimen, this uplift issmall and may represent the deformation of the sandpaper layer itself. Therefore, a minimum rockingrotation angle amplitude threshold was chosen to identify the uplift event. This threshold was set at
Figure 13. Rocking spectra for all specimen configurations for symmetric Ricker wavelet excitations.
DEFORMABLE COLUMN ROCKING ON A RIGID SURFACE: EXPERIMENTAL VALIDATION
Copyright © 2015 John Wiley & Sons, Ltd. Earthquake Engng Struct. Dyn. (2015)DOI: 10.1002/eqe

0.01α for the short base specimens and at 0.0025α for the long base specimens. These values areequivalent to the base plate edge being 0.12mm (one fifth of the sandpaper thickness) above thesurface. With this definition of uplift, the specimen is considered to not have uplifted in the test 3 inFigure 12 (left). Therefore, the analytical model correctly predicted the outcome of this test.
A test point in Figure 12 is circled with a light circle if the outcome of the test was predictedcorrectly, and by a dark circle if the outcome was predicted incorrectly. Only one out of 13 testswas predicted incorrectly for the 1Hz Short Base specimen, while only two of 15 tests were
Figure 14. Rocking spectra for all specimen configurations for antisymmetric Ricker wavelet excitations.The time histories of the normalized rotation angle response for the 3Hz Short Base and 4Hz Short Base
tests are shown in Figure 15.
R. TRUNIGER, M. F. VASSILIOU AND B. STOJADINOVIĆ
Copyright © 2015 John Wiley & Sons, Ltd. Earthquake Engng Struct. Dyn. (2015)DOI: 10.1002/eqe
predicted incorrectly for the 4Hz Short Base specimen. Representative normalized rocking rotationangle response time histories recorded during the tests and predicted using the VVEL model for thespecimens identified by points 1 through 8 in the spectra in Figure 12 are also shown. The rest ofthe plots of Figure 12 show time histories of the response of indicative tests. Overturning wascorrectly predicted for tests shown by points 1, 7 and 8, including the direction of overturning.Rocking response was predicted very well for the test marked by point 2, but was not predicted tooccur for tests at points 4, 5 and 6.
The rocking spectra for all specimen configurations are summarized in Figure 13 for the symmetric and inFigure 14 for the antisymmetric Ricker wavelet excitations. The model predicts the outcome of theexperiments quite well, with only 20 out of 217 experiments predicted incorrectly. Uplift and rocking ofthe specimens were observed during 19 out of these 20 incorrect predictions. However, the measureduplift was very small, with the edge of the base plate never lifting more than 1mm above the specimen base.
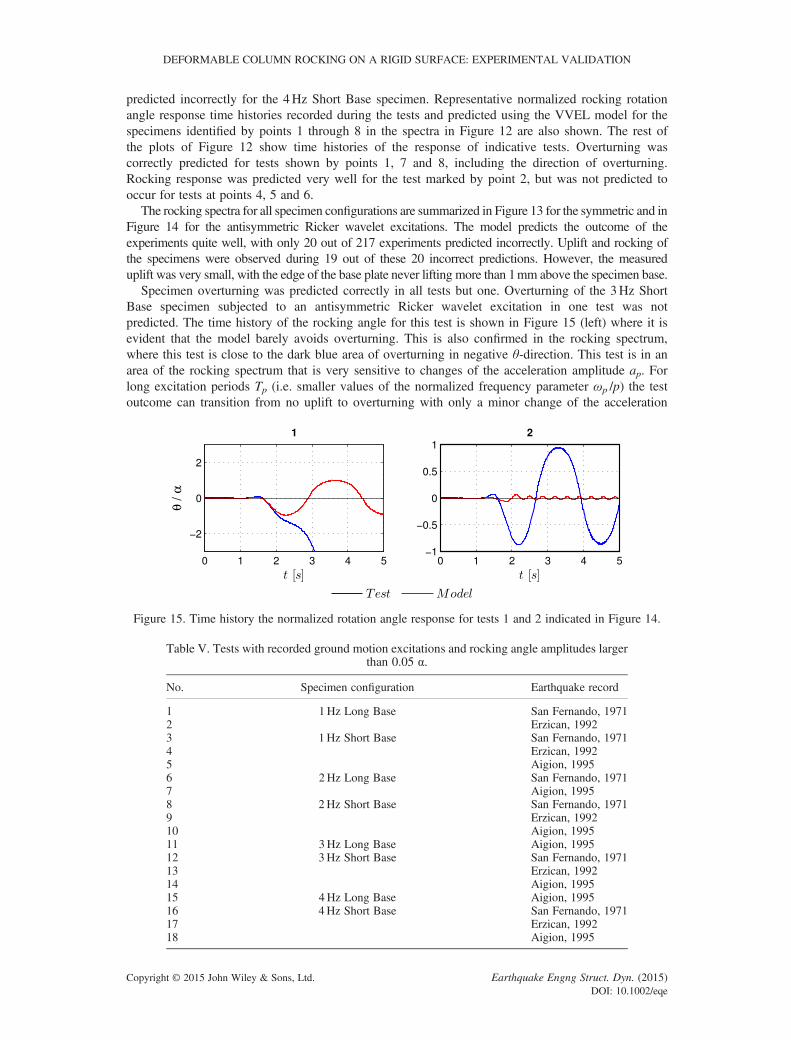
Specimen overturning was predicted correctly in all tests but one. Overturning of the 3Hz ShortBase specimen subjected to an antisymmetric Ricker wavelet excitation in one test was notpredicted. The time history of the rocking angle for this test is shown in Figure 15 (left) where it isevident that the model barely avoids overturning. This is also confirmed in the rocking spectrum,where this test is close to the dark blue area of overturning in negative θ-direction. This test is in anarea of the rocking spectrum that is very sensitive to changes of the acceleration amplitude ap. Forlong excitation periods Tp (i.e. smaller values of the normalized frequency parameter ωp /p) the testoutcome can transition from no uplift to overturning with only a minor change of the acceleration
Figure 15. Time history the normalized rotation angle response for tests 1 and 2 indicated in Figure 14.
Table V. Tests with recorded ground motion excitations and rocking angle amplitudes largerthan 0.05 α.
No. Specimen configuration Earthquake record
1 1Hz Long Base San Fernando, 19712 Erzican, 19923 1Hz Short Base San Fernando, 19714 Erzican, 19925 Aigion, 19956 2Hz Long Base San Fernando, 19717 Aigion, 19958 2Hz Short Base San Fernando, 19719 Erzican, 199210 Aigion, 199511 3Hz Long Base Aigion, 199512 3Hz Short Base San Fernando, 197113 Erzican, 199214 Aigion, 199515 4Hz Long Base Aigion, 199516 4Hz Short Base San Fernando, 197117 Erzican, 199218 Aigion, 1995
DEFORMABLE COLUMN ROCKING ON A RIGID SURFACE: EXPERIMENTAL VALIDATION
Copyright © 2015 John Wiley & Sons, Ltd. Earthquake Engng Struct. Dyn. (2015)DOI: 10.1002/eqe

amplitude. That is the reason why the model fails to capture the experimental response. This sensitivityis confirmed in Figure 15 (right), where the time history comparison for the previously mentioned Test53 is plotted. The specimen is close to overturning in the test, while model predicts only a minor uplift.
5. RESPONSE TO RECORDED GROUND MOTIONS
The response time histories recorded in tests where the specimens were excited using recorded groundmotions listed in Table III are compared to the predictions obtained using the model. The conductedtests during which the measured amplitude of the rocking angle exceeded 0.05α are enumerated in
Figure 16. Indicative response time histories for the scaled recorded ground motion excitations. The testnumbering follows that in Table V.
R. TRUNIGER, M. F. VASSILIOU AND B. STOJADINOVIĆ
Copyright © 2015 John Wiley & Sons, Ltd. Earthquake Engng Struct. Dyn. (2015)DOI: 10.1002/eqe

Table V. The responses in the indicative tests 2, 10 and 12 are shown in Figure 16, while the remainingtest outcomes are detailed in [15].
5.1. Time history of rocking response
The match between the measure response time histories and those obtained from the model is, ingeneral, much worse for the earthquake records compared to the Ricker wavelets. The prediction ofthe rocking angle for the 1Hz Long Base specimens (test 2 in Table V) is inaccurate, especially inthe second half of the shown response time history. Nevertheless, the maximum amplitude of therocking angle, which occurs during the dominant acceleration pulse in the ground motion, ispredicted accurately.
Interestingly, the phase of the rocking cycles is predicted correctly even towards the end of the timehistory shown, despite the difference in the rocking angle amplitudes. Also, there is a reasonably goodmatch between the measured and the predicted elastic oscillation without uplift portion of the response,despite the differences in the rocking angle time history.
The rocking angle response time history is matched very well for test No. 10 (with the 2Hz ShortBase specimen and the 1995 Aigion Earthquake excitation). Only in the second half of the timehistory, when the accelerations are very small, does the model slightly overestimate the rockingangle. This can be attributed to the underestimate of the energy dissipated at impact for short basespecimens that occurs in the VVEL model and is discussed in the companion paper [9]. The averagerelative column displacement is predicted correctly, while the amplitude of the uplifted oscillationsis generally overestimated.
The prediction of the response of test No. 12 with the 3Hz Short Base specimen and the 1971 SanFernando earthquake excitation was the worst among the tests listed in Table V. The estimate of themaximum rocking angle amplitude is off by a factor of 2.5. The time histories do not match. Thistest shows that an accurate prediction of the first major uplift is very important for a good match inthe entire time history.
5.2. Maximum rocking angle and relative column displacement
The ratio of the maximum rocking angle measured in the tests over the maximum rocking anglepredicted by the model is shown in Figure 17 (left) for the tests with recorded ground motionexcitations. The ratio is 1 for tests 3 and 4 where overturning was predicted correctly. For most testswhere the specimens rocked but did not overturn, the rocking rotation angle amplitude is predictedaccurately. Nevertheless, there are outliers with ratios over 2 or under 0.5. The predictions of therocking angle amplitude were the best for the 1995 Aigion earthquake and the worst for the 1971San Fernando earthquake records. The comparison for the maximum relative column displacementtest and prediction data is plotted in Figure 17 (right). The prediction is accurate for the majority ofthe tests, with the outliers being much less extreme than for the maximum base rotation. Themaximum base rotation response to recorded ground motions was predicted with an error smallerthan 30% in 14 out of the 17 cases. The maximum elastic displacement of the column was predictedwith an error smaller than 30% in 17 out of the 17 cases.
Figure 17. Comparison of maximum rocking angle (left) and maximum relative column displacement (right)for the tests with earthquake excitations.
DEFORMABLE COLUMN ROCKING ON A RIGID SURFACE: EXPERIMENTAL VALIDATION
Copyright © 2015 John Wiley & Sons, Ltd. Earthquake Engng Struct. Dyn. (2015)DOI: 10.1002/eqe

6. CONCLUSIONS
The use of rocking as a seismic response modification technique for deformable cantilever structures ishindered by the lack of a verified and validated analytical model. A series of experiments wereperformed to validate analytical models for rocking of deformable cantilever structures with massivecolumns and concentrated masses at the base and the top of the cantilever developed in acompanion paper [9]. Specimens with four different fundamental vibration frequencies, mounted ontwo different uplifting bases, were excited by analytical pulses and real ground motions using ashaking table. A total of 240 tests were conducted.
Two analytical models for computing the energy dissipated at impact during rocking response ofdeformable cantilever structures presented in [9] are the ADJex model (a modified model proposedby Acikgoz and DeJong [14]) and the Vertical Velocity Energy Loss (VVEL) model. Both modelswere verified. During the validation process (comparison of model predictions and measured data)the ADJex model was found to be less conservative than the VVEL model.
The increase of viscous damping during flexural vibrations of the column in the upliftedconfiguration proposed in [16] and adopted in [14, 17] was not experimentally observed. Instead, avery small damping value (smaller than the fixed base damping value, but consistent withexperimental observations) was adopted. This result challenges the ‘increased viscous dampingduring rocking’ assumption of all previous related studies.
The agreement between the measured and the computed responses for sinusoid pulse excitationswas very good, considering the highly non-linear nature of the problem, high sensitivity of therocking outcomes to the amplitude of excitation in some regions of the rocking spectrum and thechallenges of conducting the tests. The model predicted the uplifted frequency, the rocking angleand the uplifted average elastic displacement for recorder ground motions with errors smaller than30%.
Based on the outcomes of the verification and validation process presented in this paper, the modelwith the VVEL impact energy dissipation assumption can be recommended for simulation of theresponse of deformable cantilever columns to analytical and recorded ground motions. There is,however, room for refinement, particularly with respect to modeling the energy dissipated at impactand the damping of oscillations in the uplifted state. The test data [10] used in this paper can beused to verify and validate the improved models for uplifting and rocking response of deformablecantilever structures with concentrated and distributed masses.
REFERENCES
1. Lipscombe, PR, Pellegrino, S. Free rocking of prismatic blocks. Journal of Engineering Mechanics 1993;119(7):1387–1410.
2. Peña F, Prieto F, Lourenço PB, Campos Costa A, Lemos JV. On the dynamics of rocking motion of single rigid-block structures. Earthquake Engineering and Structural Dynamics 2007; 36(15):2383–2399.
3. Ma QT, Khan MH. Free vibration tests of a scale model of the South Rangitikei Railway Bridge. In Proceedingsof the New Zealand Society for Earthquake Engineering Annual Conference, Engineering an Earthquake Resil-ient NZ, 2008.
4. Konstantinidis D, Makris N. Experimental and analytical studies on the response of 1/4-scale models of freestandinglaboratory equipment subjected to strong earthquake shaking. Bulletin of Earthquake Engineering 2010;8(6):1457–1477.
5. Ma QTM. The mechanics of rocking structures subjected to ground motion (Doctoral dissertation, ResearchSpace@Auckland) 2010.
6. ElGawady MA, Ma Q, Butterworth JW, Ingham J. Effects of interface material on the performance of free rockingblocks. Earthquake Engineering and Structural Dynamics 2011; 40(4):375–392.
7. Baratta A, Corbi I, Corbi O. Towards a seismic worst scenario approach for rocking systems: analytical and exper-imental set-up for dynamic response. Acta Mechanica 2013; 224(4):691–705.
8. Zhang H, Brogliato B, Liu C. Dynamics of planar rocking-blocks with Coulomb friction and unilateral constraints:comparisons between experimental and numerical data. Multibody System Dynamics 2014; 32(1):1–25.
9. Vassiliou MF, Truniger R. Stojadinovic B. An analytical model of a deformable cantilever structure rocking on arigid surface: development and verification. Earthquake Engineering and Structural Dynamics 2015.
10. Truniger R. Experimental investigation of the response of flexible rocking oscillators to ground shaking, MasterThesis—Spring Semester 2014, ETH Zürich—Institute of Structural Engineering, 2014
R. TRUNIGER, M. F. VASSILIOU AND B. STOJADINOVIĆ
Copyright © 2015 John Wiley & Sons, Ltd. Earthquake Engng Struct. Dyn. (2015)DOI: 10.1002/eqe

11. Bachmann H, Baumann M, Lestuzzi P, Wenk T. Der neue ETH-Erdbebensimulator, Schweizer Ingenieur undArchitekt SI +A, Heft 4/99. Zürich; 1999
12. Ricker N. Further developments in the wavelet theory of seismogram structure. Bulletin of the Seismological Societyof America 1943; 33:197–228.
13. Vassiliou MF, Makris N. Analysis of the rocking response of rigid blocks standing free on a seismically isolatedbase. Earthquake Engineering and Structural Dynamics 2012; 41(2):177–196.
14. Acikgoz S, DeJong MJ. The interaction of elasticity and rocking in flexible structures allowed to uplift. EarthquakeEngineering and Structural Dynamics 2012; 41(15):2177–2194.
15. Truniger R. Experimental investigation of rocking of elastic columns, Projektarbeit Master—Spring Semester 2013,ETH Zürich—Institute of Structural Engineering, 2013.
16. Chopra AK, Yim SCS. Simplified earthquake analysis of structures with foundation uplift. Journal of Structural En-gineering 1985; 111(4):906–930.
17. Oliveto G, Caliò I, Greco A. Large displacement behaviour of a structural model with foundation uplift under impul-sive and earthquake excitations. Earthquake Engineering and Structural Dynamics 2003; 32:369–393.
18. Makris N, Kampas G. Estimating the “effective period” of bilinear systems with linearization methods, wavelet andtime-domain analyses: from inelastic displacements to modal identification. Soil Dynamics and Earthquake Engi-neering 2013; 45:80–88.
19. Makris N, G Kampas. The engineering merit of the “effective period” of bilinear isolation systems. Earthquakes andStructures 2013; 4(4):397–428.
20. Makris N, Konstantinidis D. The rocking spectrum and the limitations of practical design methodologies. EarthquakeEngineering and Structural Dynamics 2003; 32(2):265–289.
21. Housner GW. The behavior of inverted pendulum structures during earthquakes. Bulletin of the Seismological Soci-ety of America 1963; 53(2):403–417.
DEFORMABLE COLUMN ROCKING ON A RIGID SURFACE: EXPERIMENTAL VALIDATION
Copyright © 2015 John Wiley & Sons, Ltd. Earthquake Engng Struct. Dyn. (2015)DOI: 10.1002/eqe