an angle-dependent estimation of ct x-ray spectrum from rotational
TRANSCRIPT

An angle-dependent estimation of CT x-ray spectrum from rotationaltransmission measurements
Yuan Lina)
Carl E. Ravin Advanced Imaging Laboratories, Duke University Medical Center, Durham,North Carolina 27705 and Physics Department, Duke University, Durham, North Carolina 27708
Juan Carlos Ramirez-GiraldoSiemens Medical Solutions, Malvern, Pennsylvania 19355
Daniel J. GauthierPhysics Department, Duke University, Durham, North Carolina 27708
Karl StierstorferSiemens Healthcare, Forchheim 91301, Germany
Ehsan SameiCarl E. Ravin Advanced Imaging Laboratories, Duke University Medical Center, Durham,North Carolina 27705 and Physics Department, Duke University, Durham, North Carolina 27708
(Received 7 January 2014; revised 16 April 2014; accepted for publication 30 April 2014;published 21 May 2014)
Purpose: Computed tomography (CT) performance as well as dose and image quality is directlyaffected by the x-ray spectrum. However, the current assessment approaches of the CT x-ray spectrumrequire costly measurement equipment and complicated operational procedures, and are often limitedto the spectrum corresponding to the center of rotation. In order to address these limitations, theauthors propose an angle-dependent estimation technique, where the incident spectra across a widerange of angular trajectories can be estimated accurately with only a single phantom and a singleaxial scan in the absence of the knowledge of the bowtie filter.Methods: The proposed technique uses a uniform cylindrical phantom, made of ultra-high-molecular-weight polyethylene and positioned in an off-centered geometry. The projection data ac-quired with an axial scan have a twofold purpose. First, they serve as a reflection of the transmissionmeasurements across different angular trajectories. Second, they are used to reconstruct the crosssectional image of the phantom, which is then utilized to compute the intersection length of eachtransmission measurement. With each CT detector element recording a range of transmission mea-surements for a single angular trajectory, the spectrum is estimated for that trajectory. A data con-ditioning procedure is used to combine information from hundreds of collected transmission mea-surements to accelerate the estimation speed, to reduce noise, and to improve estimation stability.The proposed spectral estimation technique was validated experimentally using a clinical scanner(Somatom Definition Flash, Siemens Healthcare, Germany) with spectra provided by the manufac-turer serving as the comparison standard. Results obtained with the proposed technique were com-pared against those obtained from a second conventional transmission measurement technique withtwo materials (i.e., Cu and Al). After validation, the proposed technique was applied to measure spec-tra from the clinical system across a range of angular trajectories [−15◦, 15◦] and spectrum settings(80, 100, 120, 140 kVp).Results: At 140 kVp, the proposed technique was comparable to the conventional technique in termsof the mean energy difference (MED, −0.29 keV) and the normalized root mean square difference(NRMSD, 0.84%) from the comparison standard compared to 0.64 keV and 1.56%, respectively,with the conventional technique. The average absolute MEDs and NRMSDs across kVp settings andangular trajectories were less than 0.61 keV and 3.41%, respectively, which indicates a high level ofestimation accuracy and stability.Conclusions: An angle-dependent estimation technique of CT x-ray spectra from rotational transmis-sion measurements was proposed. Compared with the conventional technique, the proposed methodsimplifies the measurement procedures and enables incident spectral estimation for a wide range ofangular trajectories. The proposed technique is suitable for rigorous research objectives as well asroutine clinical quality control procedures. © 2014 American Association of Physicists in Medicine.[http://dx.doi.org/10.1118/1.4876380]
Key words: CT, spectral estimation, transmission measurements, x-ray spectrum
062104-1 Med. Phys. 41 (6), June 2014 © 2014 Am. Assoc. Phys. Med. 062104-10094-2405/2014/41(6)/062104/12/$30.00

062104-2 Lin et al.: An angle-dependent estimation of CT x-ray spectrum 062104-2
1. INTRODUCTION
With the improvements of the diagnostic imaging technolo-gies, there are increasing demands for the accurate knowl-edge of the x-ray spectrum produced by a particular x-raysource. For example, in dose and risk estimations for com-puted tomography (CT),1, 2 the x-ray spectrum is used inMonte Carlo simulations to determine the energy depositionin a patient body. In polyenergetic reconstruction3, 4 or dualenergy reconstruction,5 the x-ray spectrum can be used as apriori information to reduce beam hardening artifacts and toimplement quantitative imaging approaches. It is also desir-able to measure the x-ray spectrum for quality assurance pur-poses, as the spectrum of an x-ray source can drift from theexpected values due to repeated usage.6
Current spectral estimation techniques can be roughlycategorized into three approaches: (1) computer simulation,(2) spectroscopic measurements, and (3) transmission-basedmeasurements.
Computer-simulation-based approaches7–9 aim to estimategeneralized spectra based on basic physical parameters, suchas the kinetic energy of the incident electrons, the den-sity and the attenuation coefficient of the target material,and the target angle. The characteristic radiation is addedto the Bremsstrahlung continuum according to empiricalrelationships.8 These approaches can model fundamental me-chanics of the x-ray formation process, but are generally un-able to fully account for the hardware nuances of individualx-ray systems (e.g., the used condition of the x-ray tube andthe actual attenuation properties of the inherent filtrations andthe bowtie filters).
Spectroscopic measurement approaches10–15 assess thespectrum from a particular x-ray source using energy-resolved, photon-counting x-ray detectors (e.g., CdTedetectors12–14 or CdZnTe detectors15). While these ap-proaches generally give a more representative estimation ofthe actual spectrum (considering the limitation implied by theexperimental uncertainties), they are not suitable for routinemeasurements because they require expensive experimentaltools (e.g., dedicated detectors) and delicate experimental set-tings. For example, in the preparation phase, the detectormust be calibrated with radioactive elements (e.g., 241Am and133Ba) and the whole experimental setup needs to be alignedprecisely. In addition, the spectrum correction procedure15
requires a detailed understanding of the detector proper-ties, such that Monte Carlo simulation can be used to com-pute the response functions for each detector channel, withwhich the distorted spectrum can be corrected by strippingmethods.15, 16
A more practical way to the spectral estimation iscalled transmission-measurement-based approaches, whichuse transmission measurements of phantoms of known di-mensions and compositions.6, 17–19 These approaches are rela-tively simple and have been shown to provide satisfactory re-sults for various energy ranges of x-ray spectra.6, 17 However,both the phantom preparation and the measurement process ofthese approaches can be time consuming and potentially errorprone. For instance, in the phantom preparation, two or more
materials have to be used and each material has to be care-fully shaped and stacked-up into different thicknesses. In themeasurement process, all phantoms have to be sequentiallyexposed to x rays.
One of the major drawbacks of these approaches is that,without the knowledge of the bowtie filter (i.e., shape, compo-sition, and position), it is difficult to derive the incident spec-tra across the entire CT scan field of view (SFOV). Moreover,to obtain the transmission measurements, these approachesoften have to be implemented in a special service acquisitionmode, where the gantry is stationary.18 This operational modeis not always available to practicing medical physicists andrequires special service personnel from the manufacturer toaccess the scanner.
In this work, we propose a new transmission-measurement-based approach for clinical CT scanners.Using a single cylindrical phantom and a single axial scan,incident spectra across a wide range of angular trajectoriescan be estimated without the knowledge of the bowtie filtercharacteristics. The method still requires a certain level ofaccess to the raw data from the manufacturer. However,the measurements can be made without having the gantryin the stationary mode. In this paper, we first review themathematical model of the transmission-measurement-basedapproaches in Sec. 2.A and then introduce the proposedoff-centered scanning geometry and the data conditioningprocedure in Secs. 2.B and 2.C, respectively. This paperfurther details the experimental validation of the proposedtechnique in Sec. 2.D.
2. METHODS
2.A. Mathematical model
The transmission measurements can be expressed as anintegral equation as
Y (L) =∫
E
I (E)e−μ(E)LdE
=∫
E
N (E)η(E)Ee−μ(E)LdE, (1)
where Y(L) is the transmission measurement, I(E) is the pho-ton intensity at energy E, μ(E) is the attenuation coefficientof the phantom, and L is the x-ray intersection length throughthe phantom. As a conventional x-ray imaging CT system hasenergy-integrating detectors, I(E) can be further broken intothree components: the incident spectrum N(E) (the objectiveof the characterization), the detector response η(E), and thephoton energy E. In this work, ∫ I (E)dE is normalized toone, so the transmission measurement Y(L) is equivalent tothe transmission ratio.
Generally, the measurement expressed in Eq. (1) followsa compound Poisson distribution.20 Previously developed sta-tistical image reconstruction methods have used the assump-tion of simple Poisson statistics3, 21, 22 with acceptable results.In this work, we adopted the latter assumption, i.e., eachmeasurement Y(L) is assumed to follow a simple Poisson
Medical Physics, Vol. 41, No. 6, June 2014
062104-3 Lin et al.: An angle-dependent estimation of CT x-ray spectrum 062104-3
distribution with the mean intensity of∫E
I (E)e−μ(E)LdE as
Y (L) = Poisson
{∫E
I (E)e−μ(E)LdE
}, (2)
or
Ym = Poisson
{NS∑s=1
Am,sIs
}, m = 1, . . . , NM, (3)
in the discretization form, where NM is the total number oftransmission measurements, NS is the number of samplingsof the spectrum, Am, s is the system matrix element computedfrom the phantom attenuation, the phantom thickness, and thesize of the discretized spectral interval �E using the relation
Am,s = e−μsLm�E. (4)
Based on the simple Poisson assumption, the probabilityof obtaining Ym with the photon intensity spectrum Is can becomputed as
P (I|Y, A) =∏m
(∑s
Am,sIs
)Ym
(Ym)!e− ∑
s
Am,s Is
, (5)
where I = {I1, . . . , INS}T , Y = {Y1, . . . , YNM
}T , and A= {Am,s} ∈ RNM×NS . In order to estimate Is, one possible ap-proach is to maximize the log-likelihood objective function ofEq. (5) through
I = arg
{maxA,Y
ln P (I|A, z)
}
= arg
{maxA,Y
∑m
[Ym ln
(∑s
Am,sIs
)−
∑s
Am,sIs
]+ c
},
(6)
where c is a constant. As a logarithmic function is concave,based on Jensen’s inequality, Eq. (6) can be equivalently con-verted to
I = arg
{maxA,Y
∑m,s
[Ym ln(Am,sIs) − Am,sIs
] + c
}. (7)
Since this objective function is not quadratic, theExpectation-Maximization (EM) approach23, 24 is applied tosolve this maximization problem. The resulting iterativelymultiplicative update form is
I (k)s = I (k−1)
s∑m
Am,s
∑m
Am,sYm∑s ′
Am,s ′I(k−1)s ′
, (8)
where k indicates the kth iteration. For the EM method, themain features of the spectrum (such as the characteristic xrays of the x-ray tube and the K-edges of the detector) mustbe reflected in the initial guess (I (0)
s ).6, 18 After each iteration,the sum of
∑I (k)s is normalized to one. The iteration can be
terminated when the averaged error is smaller than a thresholdT as
1
NM
NM∑m=1
∣∣∣∣∣Ym −NS∑s=1
Am,sI(k)s
∣∣∣∣∣ ≤ T . (9)
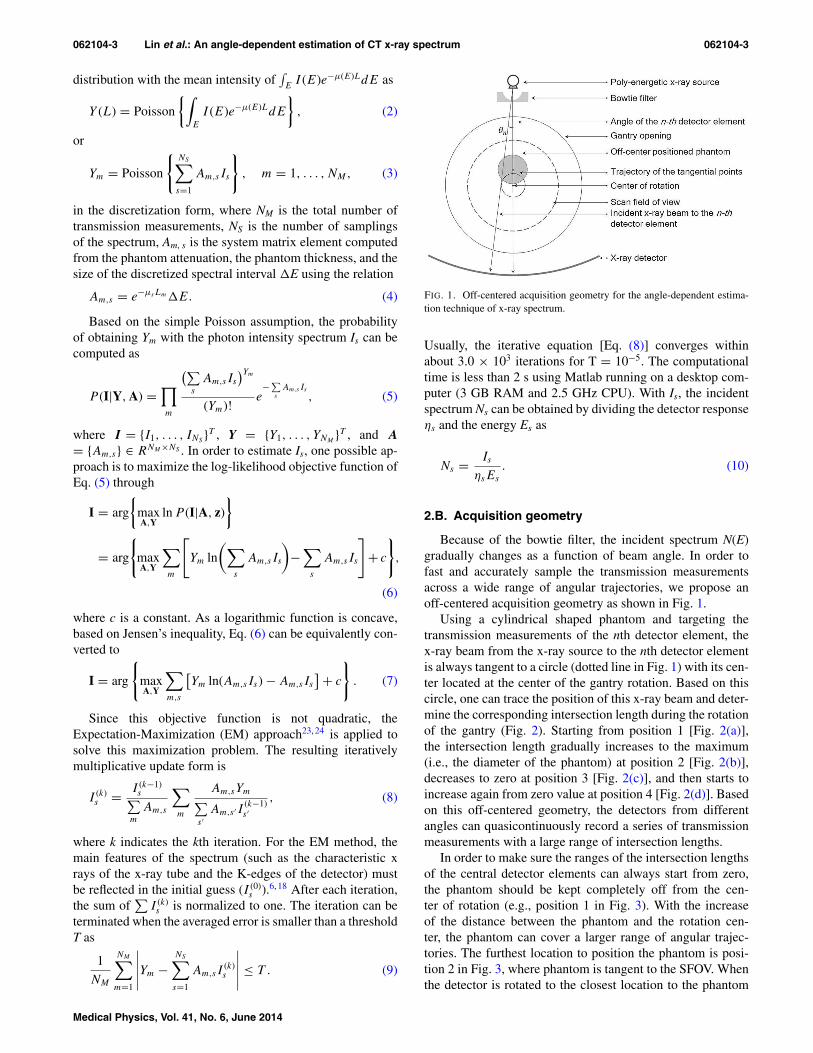
FIG. 1. Off-centered acquisition geometry for the angle-dependent estima-tion technique of x-ray spectrum.
Usually, the iterative equation [Eq. (8)] converges withinabout 3.0 × 10³ iterations for T = 10−5. The computationaltime is less than 2 s using Matlab running on a desktop com-puter (3 GB RAM and 2.5 GHz CPU). With Is, the incidentspectrum Ns can be obtained by dividing the detector responseηs and the energy Es as
Ns = Is
ηsEs
. (10)
2.B. Acquisition geometry
Because of the bowtie filter, the incident spectrum N(E)gradually changes as a function of beam angle. In order tofast and accurately sample the transmission measurementsacross a wide range of angular trajectories, we propose anoff-centered acquisition geometry as shown in Fig. 1.
Using a cylindrical shaped phantom and targeting thetransmission measurements of the nth detector element, thex-ray beam from the x-ray source to the nth detector elementis always tangent to a circle (dotted line in Fig. 1) with its cen-ter located at the center of the gantry rotation. Based on thiscircle, one can trace the position of this x-ray beam and deter-mine the corresponding intersection length during the rotationof the gantry (Fig. 2). Starting from position 1 [Fig. 2(a)],the intersection length gradually increases to the maximum(i.e., the diameter of the phantom) at position 2 [Fig. 2(b)],decreases to zero at position 3 [Fig. 2(c)], and then starts toincrease again from zero value at position 4 [Fig. 2(d)]. Basedon this off-centered geometry, the detectors from differentangles can quasicontinuously record a series of transmissionmeasurements with a large range of intersection lengths.
In order to make sure the ranges of the intersection lengthsof the central detector elements can always start from zero,the phantom should be kept completely off from the cen-ter of rotation (e.g., position 1 in Fig. 3). With the increaseof the distance between the phantom and the rotation cen-ter, the phantom can cover a larger range of angular trajec-tories. The furthest location to position the phantom is posi-tion 2 in Fig. 3, where phantom is tangent to the SFOV. Whenthe detector is rotated to the closest location to the phantom
Medical Physics, Vol. 41, No. 6, June 2014

062104-4 Lin et al.: An angle-dependent estimation of CT x-ray spectrum 062104-4
FIG. 2. (a)–(d) Schematic diagram of the change of the attenuation path of the x-ray beam from the x-ray source to the nth detector element during the CT scanin axial mode.
during the CT scan, scatter radiation can increase proportion-ally (see our Monte Carlo simulation results in Sec. 2.D). Asa scanned object is usually positioned in the center, the built-in model-based correction techniques25, 26 can effectively re-duce the scatter radiation via tabulated tables. Therefore, itwould be advantageous for the phantom to be positioned onlyslightly off-centered as in position 1 (Fig. 3), so that the scat-ter radiation pattern is more similar to that of the centeredphantom and the scatter radiation across all projections can bereadily corrected by the scanner’s built-in scatter correctiontechniques. Positioning the phantom in position 2 providesa wider sampling of the angular trajectories but a larger im-pact of scatter radiation on the measurements. Note that phan-tom located beyond position 2 (e.g., position 3 in Fig. 3) willfurther result in truncated projections and the cross sectionalimage cannot be accurately reconstructed for the derivationof the intersection lengths using conventional FBP method.Dedicated reconstruction algorithms for truncated projectionshave to be employed to extend the CT SFOV (Refs. 27 and28) for this case.
As the phantom is positioned within the SFOV and the CTscanner is operated in axial mode with the x rays continuouslyon for a full rotation, the collected transmission data can beused to reconstruct the cross-sectional image of the scanned
phantom. The voxel values that are larger than half of the at-tenuation of the scanned material can be set to unit one tofacilitate deriving the intersection lengths via the forward raytracing procedure. If the shape of the phantom is convex, a
FIG. 3. Possible off-centered positions. At position 1, the distance betweenthe center of the phantom and the rotation center is slightly larger than theradius of the phantom. At position 2, the phantom is tangent to the SFOV. Atposition 3, a part of the phantom is positioned outside of the SFOV.
Medical Physics, Vol. 41, No. 6, June 2014
062104-5 Lin et al.: An angle-dependent estimation of CT x-ray spectrum 062104-5
conventional backward ray tracing technique can be used todelineate the border of the phantom instead of using imagereconstruction.
The phantom should be made of a material with moder-ate attenuation properties. Materials with large attenuations(such as metals) could be small in size, but the accuracy ofthe intersection lengths derived from the reconstructed im-age will suffer large errors due to the limited resolution ofthe CT detectors (0.6 × 0.6 mm2 at isocenter). Materialswith small attenuations provide for a larger phantom enablingsmaller relative errors in intersection length measurement, butcan lead to increased scatter radiation to the detectors. Plas-tic materials, such as ultra-high-molecular-weight polyethy-lene [UHMWPE; chemical formula: (C2H4)nH2, density:0.937 g/cm3], have moderate attenuations. In this work, a160 mm diameter cylindrical phantom made of polyethylenewas used to reduce transmission to 0.1 for the maximum pathlength through the phantom for a typical 140 kVp beam.
2.C. Data conditioning procedure
The off-centered acquisition geometry can collect hun-dreds of transmission measurements across a wide range ofangular trajectories, which provides abundant experimentaldata. However, the large amount of data can make the esti-mation process time consuming, while the data are furthercontaminated by various sources of noise (such as quantumnoise, instrumentation noise, or stochastic variations due tothe phantom and the experimental condition). In order to ac-celerate spectral estimation speed, to reduce noise, and to im-prove estimation stability, the data are preprocessed beforespectral estimation.
Generally, the transmission measurements can be fittedwith polynomial functions. Equation (1) can be expanded ina Taylor series as
Y (L) =∫
E
I (E)e−μ(E)LdE
=∑
k
ckLk, (11)
where
ck =∫
E
I (E) [−μ(E)]k
k!dE. (12)
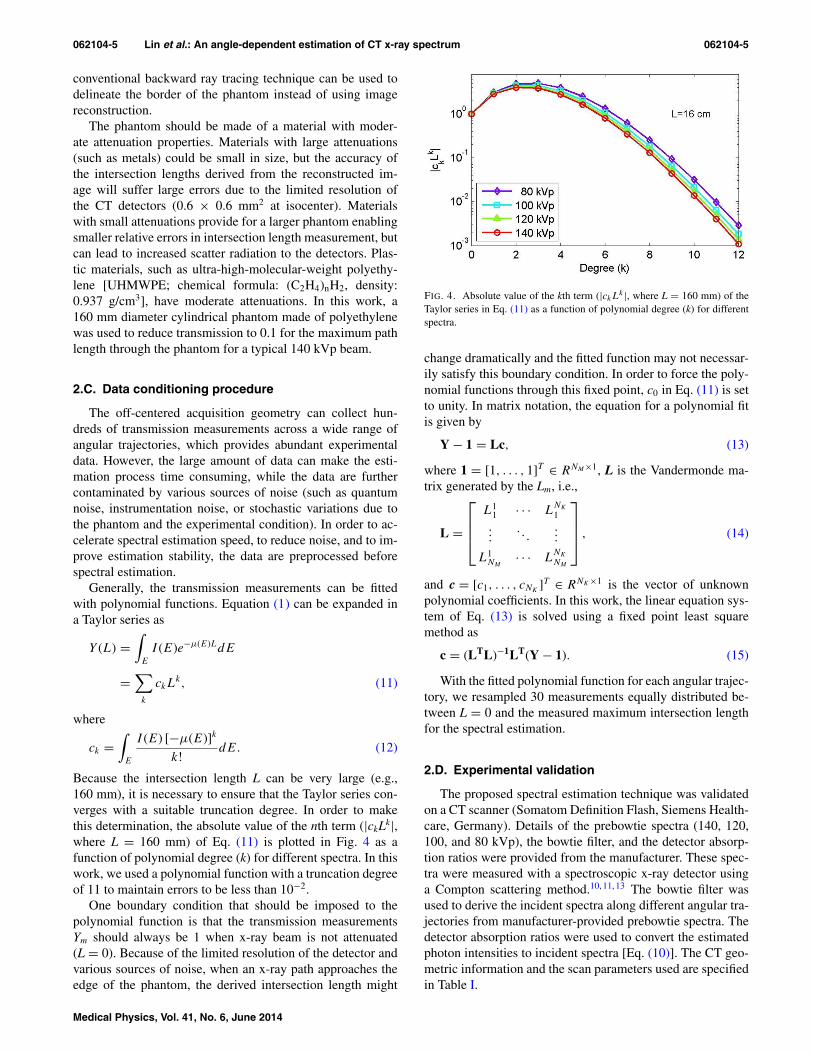
Because the intersection length L can be very large (e.g.,160 mm), it is necessary to ensure that the Taylor series con-verges with a suitable truncation degree. In order to makethis determination, the absolute value of the nth term (|ckLk|,where L = 160 mm) of Eq. (11) is plotted in Fig. 4 as afunction of polynomial degree (k) for different spectra. In thiswork, we used a polynomial function with a truncation degreeof 11 to maintain errors to be less than 10−2.
One boundary condition that should be imposed to thepolynomial function is that the transmission measurementsYm should always be 1 when x-ray beam is not attenuated(L = 0). Because of the limited resolution of the detector andvarious sources of noise, when an x-ray path approaches theedge of the phantom, the derived intersection length might
FIG. 4. Absolute value of the kth term (|ckLk |, where L = 160 mm) of the
Taylor series in Eq. (11) as a function of polynomial degree (k) for differentspectra.
change dramatically and the fitted function may not necessar-ily satisfy this boundary condition. In order to force the poly-nomial functions through this fixed point, c0 in Eq. (11) is setto unity. In matrix notation, the equation for a polynomial fitis given by
Y − 1 = Lc, (13)
where 1 = [1, . . . , 1]T ∈ RNM×1, L is the Vandermonde ma-trix generated by the Lm, i.e.,
L =
⎡⎢⎢⎣
L11 · · · L
NK
1...
. . ....
L1NM
· · · LNK
NM
⎤⎥⎥⎦ , (14)
and c = [c1, . . . , cNK]T ∈ RNK×1 is the vector of unknown
polynomial coefficients. In this work, the linear equation sys-tem of Eq. (13) is solved using a fixed point least squaremethod as
c = (LTL)−1LT(Y − 1). (15)
With the fitted polynomial function for each angular trajec-tory, we resampled 30 measurements equally distributed be-tween L = 0 and the measured maximum intersection lengthfor the spectral estimation.
2.D. Experimental validation
The proposed spectral estimation technique was validatedon a CT scanner (Somatom Definition Flash, Siemens Health-care, Germany). Details of the prebowtie spectra (140, 120,100, and 80 kVp), the bowtie filter, and the detector absorp-tion ratios were provided from the manufacturer. These spec-tra were measured with a spectroscopic x-ray detector usinga Compton scattering method.10, 11, 13 The bowtie filter wasused to derive the incident spectra along different angular tra-jectories from manufacturer-provided prebowtie spectra. Thedetector absorption ratios were used to convert the estimatedphoton intensities to incident spectra [Eq. (10)]. The CT geo-metric information and the scan parameters used are specifiedin Table I.
Medical Physics, Vol. 41, No. 6, June 2014

062104-6 Lin et al.: An angle-dependent estimation of CT x-ray spectrum 062104-6
TABLE I. CT geometric information and scan parameters used in this work.
Parameter name Value
Source-to-detector distance 1085.6 mmSource-to-object distance 595.0 mmGantry opening 780 mmNumber of detector columns 736Fan angle 49.95◦
Detector size at isocenter 0.60 × 0.60 mm2
Detector collimation 2 × 1 mmBowtie filter w3Tube current 500 mAsExposure time 1.0 sNumber of projections 1152 projections for the proposed technique
In order to reduce the potential influence of the quantumnoise, a high mAs setting (i.e., 500 mAs) was used. The ob-tained two-row data were then averaged with respect to eachcolumn to further suppress the quantum noise.
A comparative experiment was conducted between theconventional technique and the proposed technique. For theconventional technique,18 two materials (i.e., Al and Cu) wereselected. For each material, nine metal filters of differentthicknesses were used. The thicknesses of the metal filterswere selected to ensure uniformly distributed transmissionmeasurements within the [0.0, 1.0] range (Table II). Actualthicknesses of the metal filters were measured with a caliper.For this technique, the scanner was operated in the servicemode,18 i.e., both the x-ray tube and the detector remainedstationary. The metal filters were positioned in a proximatelocation to the x-ray tube to minimize the scatter radiationand the transmission measurements through the metal filterswere acquired sequentially along the central axis of the beam.
For the new technique, a cylindrical phantom29 with a 160mm diameter was used, which was made of uniform ultra-high-molecular-weight polyethylene. The experimental setupis shown in Fig. 5. First, the scanning section of this phantomwas extended beyond the patient table to avoid the influenceof the patient bed [Fig. 5(a)]. Second, this phantom was posi-tioned off center in the SFOV by adjusting vertically the pa-tient bed [Fig. 5(b)]. With the proposed technique, the scannerwas able to be operated in the axial mode. After measurement,raw data were exported from the scanner to an external com-puter, from which the transmission data were extracted forspectral estimation via a manufacturer-provided program. Thebeam-hardening corrections were excluded from the trans-mission data.
FIG. 5. Pictures of the experimental setup of the proposed technique. (a) Inthe first step, the scanning section of the phantom was extended beyond thepatient table to avoid the influence of the patient bed in the followed CT scan.(b) In the second step, the phantom was positioned off-center in the SFOV byadjusting vertically the patient bed.
To reduce the influence of the scatter radiation, a 2 × 1 mmcollimation was used. A Monte Carlo simulation with MC-GPU (Ref. 30) indicated that the scatter-primary ratios (SPRs)of position 1 in Fig. 3 were less than 0.008 for 140 kVp, con-sistent with the results of previous studies (Fig. 6).31, 32 Asthe SPRs of the transmission data were further reduced by thebuilt-in scatter correction strategies of Somatom Flash Defi-nition scanner26 (e.g., an antiscatter grid), we postulated thatthe actual SPRs of the transmission data in our study shouldbe less than that value estimated by the Monte Carlo simula-tion, and then inconsequential to the measurements. We fur-ther demonstrated in a secondary analysis that the distancebetween the phantom and the detector had negligible influ-ence on the transmission measurements (see Fig. 9).
The maximum fan angle of the estimated spectra dependson the phantom radius r and the distance d between the phan-tom center and the rotation center. If the x-ray path is requiredto pass through the phantom center to achieve the maximumintersection length of 2r (Fig. 7), the maximum fan anglewould be
ϕ = ±180◦
πarcsin
(d
SOD
), (16)
where SOD is the source-to-object distance (i.e., 595 mm). Inthat condition, based on our experimental setup (d = 80 mm,i.e., position 1 in Fig. 3), the angular trajectories would bewithin [θ114,θ622] = [−8◦, 8◦], where the subscript in θn in-dicates the detector index. However, our results (in Table IV)indicate that it is possible to obtain spectra with good accu-racy even if the maximum intersection length is reduced to r
TABLE II. Technical description of the Al and Cu filters at 140 kVp.
Material Density (g/cm3) 1 2 3 4 5 6 7 8 9
Al 2.700 L (mm) 1.000 3.000 5.000 7.500 10.500 14.500 20.500 25.500 40.500Transmission Y(L) 0.936 0.819 0.721 0.616 0.514 0.401 0.286 0.206 0.098
Cu 8.960 L (mm) 0.127 0.254 0.655 1.062 1.562 2.090 3.124 3.658 4.686Transmission Y(L) 0.864 0.761 0.546 0.415 0.303 0.229 0.140 0.112 0.074
Medical Physics, Vol. 41, No. 6, June 2014

062104-7 Lin et al.: An angle-dependent estimation of CT x-ray spectrum 062104-7
FIG. 6. Monte Carlo simulation results of the maximum scatter primary ratioas a function of rotation degree for three different phantom positions, i.e., thecentered position, the off-centered position 1 in Fig. 3, and the off-centeredposition 2 in Fig. 3. The geometry of the Somatom Definition Flash scannerwas simulated with a perfect detector (2 × 1 mm collimation) and withoutan antiscatter grid using Monte Carlo simulation code MC-GPU (Ref. 30). Acylindrical phantom made of polyethylene (160 mm in diameter and 250 mmin height) was imaged at 140 kVp (Ref. 31).
(Fig. 7). In that condition, the transmission measurements arereduced to about 0.2 and the maximum fan angle is extendedto
ϕ′ = ±180◦
πarcsin
(d + √
3r/2
SOD
). (17)
According to the above equation, the range of the angular tra-jectories was extended to [θ147,θ589] = [−15◦, 15◦] for thegeometry used in this experiment. The coverage of these re-sults is less than the CT scanner’s fan angle (i.e., [−25◦, 25◦]).The quarter detector offset was considered negligible assum-
FIG. 7. Schematic diagram to illustrate the maximum fan angles ϕ and ϕ′determined by the maximum intersection lengths of 2r and r, respectively.
ing the angle of the central detector element to be zero, i.e.,θ368 = 0◦.
The incident spectrum of the central detector element at140 kVp was estimated by the conventional and the pro-posed technique. The results were compared in terms of themean energy difference (MED) and the normalized root meansquare deviation (NRMSD). The MED was defined as themean energy of the estimated spectrum minus the mean en-ergy of the manufacturer-provided spectrum. The NRMSDwas defined as
NRMSD =√∑
s (Ns − N∗s )2/NE
max(N∗s ) − min(N∗
s ), (18)
where N∗s is the expected spectrum, Ns is the estimated
spectrum, and NE is the total number of the energybins. In addition, the incident spectra of the detector el-ements between −15◦ and 15◦ were estimated and werequantitatively compared with the incident spectra derivedfrom the manufacturer-provided spectra. Note that as themanufacturer-provided spectra cannot be assumed to be theactual gold standard, the MED and NRMSD may not be in-terpreted as metrics of absolute accuracy.
3. RESULTS
3.A. The conventional technique vs. the proposedtechnique
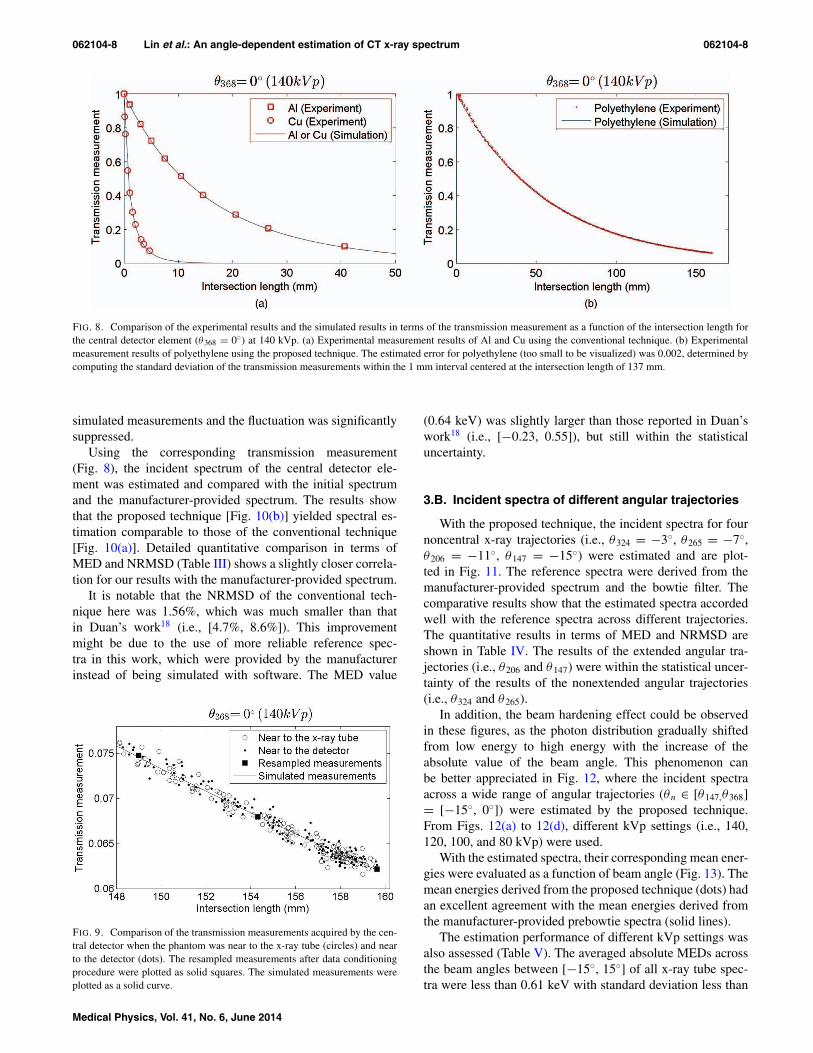
The transmission measurement results for the central de-tector element (θ368 = 0◦) at 140 kVp are plotted in Fig. 8.Figure 8(a) shows the results of the metal filters (i.e., Al andCu) using the conventional technique and Fig. 8(b) shows theresults of the polyethylene phantom using the proposed tech-nique. Due to the time consuming nature of the conventionaltechnique, only a single-kVp spot-validation at 140 kVp wasemployed. Both of the experimental results in Figs. 8(a) and8(b) yielded a good agreement with the simulation results(solid lines). However, due to the limited number of metal fil-ters, Fig. 8(a) included fewer measurements. In contrast, thelatter figure included more than 900 measurements, to whicha high-degree polynomial function could be fitted to reducethe influence of noise and to more accurately represent thetransmission measurements.
Figure 9 shows the transmission measurements acquiredby the central detector at different locations. The circles anddots indicate the data acquired when the phantom was near tothe x-ray tube and the detector, respectively. Due to the built-in scatter reduction techniques (e.g., antiscatter grid) and thenarrow collimation, the influence of the scatter radiation onthe measurements could be reduced to negligible levels; bothdatasets were close to the simulated data (solid line) with nonotable difference. The fluctuation of the measured transmis-sion measurements was mainly due to the quantum noise andthe finite size of the detector (0.6 × 0.6 mm2). The latterfactor could impact the accuracy of the derived intersectionlengths. With our data conditioning procedure, the resampledmeasurements (solid squares) had a good agreement with the
Medical Physics, Vol. 41, No. 6, June 2014
062104-8 Lin et al.: An angle-dependent estimation of CT x-ray spectrum 062104-8
FIG. 8. Comparison of the experimental results and the simulated results in terms of the transmission measurement as a function of the intersection length forthe central detector element (θ368 = 0◦) at 140 kVp. (a) Experimental measurement results of Al and Cu using the conventional technique. (b) Experimentalmeasurement results of polyethylene using the proposed technique. The estimated error for polyethylene (too small to be visualized) was 0.002, determined bycomputing the standard deviation of the transmission measurements within the 1 mm interval centered at the intersection length of 137 mm.
simulated measurements and the fluctuation was significantlysuppressed.
Using the corresponding transmission measurement(Fig. 8), the incident spectrum of the central detector ele-ment was estimated and compared with the initial spectrumand the manufacturer-provided spectrum. The results showthat the proposed technique [Fig. 10(b)] yielded spectral es-timation comparable to those of the conventional technique[Fig. 10(a)]. Detailed quantitative comparison in terms ofMED and NRMSD (Table III) shows a slightly closer correla-tion for our results with the manufacturer-provided spectrum.
It is notable that the NRMSD of the conventional tech-nique here was 1.56%, which was much smaller than thatin Duan’s work18 (i.e., [4.7%, 8.6%]). This improvementmight be due to the use of more reliable reference spec-tra in this work, which were provided by the manufacturerinstead of being simulated with software. The MED value
FIG. 9. Comparison of the transmission measurements acquired by the cen-tral detector when the phantom was near to the x-ray tube (circles) and nearto the detector (dots). The resampled measurements after data conditioningprocedure were plotted as solid squares. The simulated measurements wereplotted as a solid curve.
(0.64 keV) was slightly larger than those reported in Duan’swork18 (i.e., [−0.23, 0.55]), but still within the statisticaluncertainty.
3.B. Incident spectra of different angular trajectories
With the proposed technique, the incident spectra for fournoncentral x-ray trajectories (i.e., θ324 = −3◦, θ265 = −7◦,θ206 = −11◦, θ147 = −15◦) were estimated and are plot-ted in Fig. 11. The reference spectra were derived from themanufacturer-provided spectrum and the bowtie filter. Thecomparative results show that the estimated spectra accordedwell with the reference spectra across different trajectories.The quantitative results in terms of MED and NRMSD areshown in Table IV. The results of the extended angular tra-jectories (i.e., θ206 and θ147) were within the statistical uncer-tainty of the results of the nonextended angular trajectories(i.e., θ324 and θ265).
In addition, the beam hardening effect could be observedin these figures, as the photon distribution gradually shiftedfrom low energy to high energy with the increase of theabsolute value of the beam angle. This phenomenon canbe better appreciated in Fig. 12, where the incident spectraacross a wide range of angular trajectories (θn ∈ [θ147,θ368]= [−15◦, 0◦]) were estimated by the proposed technique.From Figs. 12(a) to 12(d), different kVp settings (i.e., 140,120, 100, and 80 kVp) were used.
With the estimated spectra, their corresponding mean ener-gies were evaluated as a function of beam angle (Fig. 13). Themean energies derived from the proposed technique (dots) hadan excellent agreement with the mean energies derived fromthe manufacturer-provided prebowtie spectra (solid lines).
The estimation performance of different kVp settings wasalso assessed (Table V). The averaged absolute MEDs acrossthe beam angles between [−15◦, 15◦] of all x-ray tube spec-tra were less than 0.61 keV with standard deviation less than
Medical Physics, Vol. 41, No. 6, June 2014

062104-9 Lin et al.: An angle-dependent estimation of CT x-ray spectrum 062104-9
FIG. 10. Comparison of the central spectrum derived from the manufacturer-provided prebowtie spectrum (solid line), the central spectrum estimated with Aland Cu using the conventional technique [dashed line in (a)], and the central spectrum estimated with polyethylene using the proposed technique [dashed line in(b)]. The same initial spectrum (dotted line) was used by the two techniques.
0.74 keV. The averaged NRMSDs were less than 3.41% withstandard deviation less than 2.02%. These quantities indi-cate the high estimation accuracy and stability of the pro-posed technique across different angular trajectories and kVpsettings.
With the decrease of the kVp, the averaged NRMSD in-creased. This is likely due to the decrease in the maximumnumber of photons in the spectrum, [i.e., max(N∗
s ) = 0.026,0.025, 0.022, 0.016 for 140, 120, 100, 80 kVp, respectively],which magnified the NRMSD values via the normalizationprocess in Eq. (18). In addition, with decreased kVp, morephotons were attenuated leading to increased contribution ofthe quantum noise and scatter radiation.31, 32
It was observed that the shape of the curves (Fig. 13) hadan angle-dependent pattern at higher kVp settings (i.e., 140,120, and 100 kVp). The mean energies along certain angu-lar trajectories were systematically smaller (e.g., −8◦ and 8◦)or larger (e.g., −6◦ and −1◦) than the simulated mean en-ergies. These patterns were probably caused by systematicerrors.
4. DISCUSSION
In this work, an angle-dependent estimation technique ofCT x-ray spectrum from rotational transmission measure-ments was presented. This method enables the estimationof the incident spectra across a wide range of angular tra-jectories with a single phantom and a single axial CT scanin the absence of the knowledge of the bowtie filter. Com-
TABLE III. Comparison of the two techniques in terms of MED andNRMSD for the incident spectrum of 140 kVp.
MED NRMSDBeam angle Method (keV) (%)
θ368 = 0◦ Conventional technique 0.64 1.56Proposed technique −0.28 0.84
pared with the previous techniques, the proposed techniquehas the following two important features: (1) estimation ofthe spectra with an off-centered geometry and (2) an effec-tive data conditioning procedure. With an off-centered ge-ometry, transmission measurements along different angulartrajectories can be collected with one rotation using the CTdetector elements. This acquisition geometry has three mer-its. First, the CT scanner can be operated in axial mode in-stead of in service mode, which is not always accessible in allCT scanners. Second, the axial mode scan greatly increasesthe data collection efficiency, as transmission measurementsacross a wide range of angular trajectories can be quasicon-tinuously collected within a short time. Finally, the collectedmeasurements can be used to reconstruct the cross sectionalimage of the phantom to facilitate deriving the intersectionlengths.
Because of the limited number of the measurements, theprevious techniques do not have the data conditioning pro-cedure. Therefore, diverse attenuation materials have to beadopted to reduce noise and to improve estimation stability. Incomparison, the proposed technique can collect hundreds oftransmission measurements for each angular trajectory. Withthe abundant transmission measurements, polynomial func-tions with the correct boundary condition can be used to fitthe data, which helps reduce the influence of the dramaticchange of the intersection lengths derived from the x-ray pathsnear the edge of the phantom. Therefore, this data condition-ing procedure reduces noise and improves both the estimationaccuracy and the estimation stability.
An experiment was conducted by comparing the conven-tional technique and the proposed technique. The results showthat, for the incident spectrum of the central beam, the MEDand the NRMSD of the proposed technique were both largelycomparable to those of the conventional technique. The inci-dent spectra across a wide range of angular trajectories werealso estimated. The quantitative results show that the aver-age absolute MED and averaged NRMSD of all kVp set-tings were smaller than 0.61 keV and 3.41%, respectively,
Medical Physics, Vol. 41, No. 6, June 2014

062104-10 Lin et al.: An angle-dependent estimation of CT x-ray spectrum 062104-10
FIG. 11. Comparison of the spectra derived from the manufacturer-provided prebowtie spectra (solid lines) and the spectra estimated with polyethylene (dashedlines) from different beam angles [(a) θ324 = −3◦, (b) θ265 = −7◦, (c) θ206 = −11◦, and (d) θ147 = −15◦]. The same initial spectrum (dotted line) was used.
which indicates the high accuracy and stability of the pro-posed technique across different angular trajectories and kVpsettings.
Two types of systematic errors might contribute to theangle-dependent pattern in Fig. 13. The first one is the in-herent systematic errors of the detector modules33, 34 (e.g.,gain error, nonlinearity error, and energy sensitivity differ-ence, etc.), as it is impossible to produce identical detectormodules in the manufacturing process. An additional possiblecause might be due to the unexpected deviation of the bowtiefilters. Other possible sources of error remain topics forfuture research.
TABLE IV. Comparison of the estimated spectra from different beam anglesin terms of MED and NRMSD for the incident spectrum of 140 kVp.
Maximum intersection MED NRMSDBeam angle length (mm) (keV) (%)
θ324 = −3◦ 160 −0.20 0.45θ265 = −7◦ 160 −0.49 0.76θ206 = −11◦ 148 −0.11 0.68θ147 = −15◦ 72 −0.27 0.93
In this work, the manufacturer-provided spectra were usedas reference spectra, which neglect the possible spectral char-acteristics of each individual x-ray system and thus cannot beused as a gold standard. Future studies may include validationexperiments (e.g., using the transmission measurements witha different material or more materials) to further quantify theaccuracy and stability of the proposed method.
There are several ways by which the method developed inthis study can be improved. First, one of the major sources oferror in our method is the limited resolution of the detector.This error can be reduced using the flying focal spot technique(FFS),35 which can improve the resolution from 0.6 × 0.6 to0.3 × 0.3 mm2. Second, while we use a high mAs setting anda data conditioning procedure to reduce the quantum noise,it is possible to further reduce the quantum noise by averag-ing multiple axial scans. Third, if we use position 2 in Fig. 3,the range of the angular trajectories can be extended to θn
∈ [θ17,θ719] = [−24◦, 24◦], which almost covers the wholedetector range, i.e., [−25◦, 25◦]. This extension however re-quires certain accommodations. In order to avoid the influ-ence of the scatter radiation for this position, we can only uti-lize the transmission measurements acquired near to the x-raytube for spectral estimation. Fourth, it is straightforward toextend the proposed method to estimate the spectra along the
Medical Physics, Vol. 41, No. 6, June 2014

062104-11 Lin et al.: An angle-dependent estimation of CT x-ray spectrum 062104-11
FIG. 12. Plot of the estimated spectra from different beam angles (θn ∈ [θ147, θ368] = [ − 15◦, 0◦]) with different kVp settings, i.e., (a) 140, (b), 120, (c) 100,and (d) 80 kVp. The jet color map was used to differentiate spectra along different angular trajectories.
FIG. 13. Plots of the mean energy of the incident spectrum as a functionof the beam angle (θn ∈ [θ147, θ589] = [ − 15◦, 15◦]). The solid lines werederived from the manufacturer-provided spectra; the dots were derived fromthe proposed technique. From top to bottom, the results were derived fromdifferent kVp settings, i.e., 140, 120, 100, and 80 kVp.
cone-angle (i.e., z direction). However, with the increase ofthe cone angle, the scatter radiation will also increase and canpotentially contaminate the transmission measurements andresult in unreliable estimated spectra. If the knowledge of thebowtie filter (i.e., the attenuation properties and the geometryinformation of the bowtie filter) is available, spectra can beestimated with a narrow fan-beam collimation and then usedto derive the spectra along the cone-angle with the knowledgeof the bowtie filter. Furthermore, the knowledge of the bowtiefilter can be incorporated into the system matrix [Eq. (3)],such that all measurements can be used to reconstruct a singleprebowtie spectrum. That spectrum can be used to derive thespectra along any angular trajectory. As this technique usesmore data and a prior known knowledge of the bowtie filter,it can potentially yield more precise estimation of the spectra.These possible extensions of the work will remain topics forfuture investigation.
TABLE V. Quantitative analysis in terms of the averaged absolute MED, the standard deviation of the MEDs, the averaged NRMSD, and standard deviation ofthe NRMSDs across the beam angles between [−15◦, 15◦] for different kVp settings.
Spectrum Averaged absolute Standard deviation Averaged Standard deviationBeam angle (kVp) MED (keV) of the MEDs (keV) NRMSD (%) of the NRMSDs (%)
[θ147,θ589] = [−15◦, 15◦] 140 0.53 0.66 0.89 0.64120 0.57 0.69 1.08 0.75100 0.59 0.71 1.60 1.04
80 0.61 0.74 3.41 2.02
Medical Physics, Vol. 41, No. 6, June 2014

062104-12 Lin et al.: An angle-dependent estimation of CT x-ray spectrum 062104-12
5. CONCLUSIONS
In this work, we proposed a novel angle-dependent es-timation technique of CT x-ray spectrum from rotationaltransmission measurements. In comparison with the conven-tional techniques, the proposed technique simplifies the mea-surement procedures, enables the incident spectral estimationability for a wide range of angular trajectories, and improvesthe estimation accuracy and stability. This technique can beapplied to both rigorous research objectives (e.g., dose esti-mation and image reconstruction) and routine clinical qualitycontrol procedures.
a)Electronic mail: [email protected]. Li, E. Samei, W. P. Segars, G. M. Sturgeon, J. G. Colsher, G. Toncheva,T. T. Yoshizumi, and D. P. Frush, “Patient-specific radiation dose and can-cer risk estimation in CT: Part I. Development and validation of a MonteCarlo program,” Med. Phys. 38, 397–407 (2011).
2G. Jarry, J. DeMarco, U. Beifuss, C. Cagnon, and M. McNitt-Gray, “AMonte Carlo-based method to estimate radiation dose from spiral CT:From phantom testing to patient-specific models,” Phys. Med. Biol. 48,2645–2663 (2003).
3I. A. Elbakri and J. A. Fessler, “Segmentation-free statistical image recon-struction for polyenergetic X-ray computed tomography with experimentalvalidation,” Phys. Med. Biol. 48, 2453–2477 (2003).
4P. M. Joseph and C. Ruth, “A method for simultaneous correction of spec-trum hardening artifacts in CT images containing both bone and iodine,”Med. Phys. 24, 1629–1634 (1997).
5C. Maaß, E. Meyer, and M. Kachelrieß, “Exact dual energy material de-composition from inconsistent rays (MDIR),” Med. Phys. 38, 691–700(2011).
6E. Y. Sidky, L. Yu, X. Pan, Y. Zou, and M. Vannier, “A robust method ofx-ray source spectrum estimation from transmission measurements:Demonstrated on computer simulated, scatter-free transmission data,” J.Appl. Phys. 97, 124701-1–124701-11 (2005).
7E. Storm, “Calculated bremsstrahlung spectra from thick tungsten targets,”Phys. Rev. A 5, 2328–2338 (1972).
8R. Birch and M. Marshall, “Computation of bremsstrahlung x-ray spectraand comparison with spectra measured with a Ge (Li) detector,” Phys. Med.Biol. 24, 505–517 (1979).
9J. M. Boone and J. A. Seibert, “An accurate method for computer-generating tungsten anode x-ray spectra from 30 to 140 kV,” Med. Phys.24, 1661–1670 (1997).
10G. Matscheko and R. Ribberfors, “A Compton scattering spectrometer fordetermining x-ray photon energy spectra,” Phys. Med. Biol. 32, 577–594(1987).
11M. Yaffe, K. Taylor, and H. Johns, “Spectroscopy of diagnostic x rays by aCompton-scatter method,” Med. Phys. 3, 328–334 (1976).
12S. Miyajima, “Thin CdTe detector in diagnostic x-ray spectroscopy,” Med.Phys. 30, 771–777 (2003).
13K. Maeda, M. Matsumoto, and A. Taniguchi, “Compton-scattering mea-surement of diagnostic x-ray spectrum using high-resolution SchottkyCdTe detector,” Med. Phys. 32, 1542–1547 (2005).
14R. H. Redus, J. A. Pantazis, T. J. Pantazis, A. C. Huber, and B. J. Cross,“Characterization of CdTe detectors for quantitative X-ray spectroscopy,”IEEE Trans. Nucl. Sci. 56, 2524–2532 (2009).
15S. Miyajima, K. Imagawa, and M. Matsumoto, “CdZnTe detector in diag-nostic x-ray spectroscopy,” Med. Phys. 29, 1421–1429 (2002).
16W. Seelentag and W. Panzer, “Stripping of X-ray bremsstrahlung spectraup to 300 kVp on a desk type computer,” Phys. Med. Biol. 24, 767–780(1979).
17R. G. Waggener, M. M. Blough, J. A. Terry, D. Chen, N. E. Lee, S. Zhang,and W. D. McDavid, “X-ray spectra estimation using attenuation measure-ments from 25 kVp to 18 MV,” Med. Phys. 26, 1269–1278 (1999).
18X. Duan, J. Wang, L. Yu, S. Leng, and C. H. McCollough, “CT scannerx-ray spectrum estimation from transmission measurements,” Med. Phys.38, 993–997 (2011).
19B. R. Archer and L. K. Wagner, “A Laplace transform pair model for spec-tral reconstruction,” Med. Phys. 9, 844–847 (1982).
20B. R. Whiting, P. Massoumzadeh, O. A. Earl, J. A. O’Sullivan, D. L. Sny-der, and J. F. Williamson, “Properties of preprocessed sinogram data inx-ray computed tomography,” Med. Phys. 33, 3290–3303 (2006).
21I. A. Elbakri and J. A. Fessler, “Statistical image reconstruction for polyen-ergetic X-ray computed tomography,” IEEE Trans. Med. Imaging 21, 89–99 (2002).
22J. Chung, J. G. Nagy, and I. Sechopoulos, “Numerical algorithms forpolyenergetic digital breast tomosynthesis reconstruction,” SIAM J. Imag-ing Sci. 3, 133–152 (2010).
23T. Hebert and R. Leahy, “A generalized EM algorithm for 3-D Bayesianreconstruction from Poisson data using Gibbs priors,” IEEE Trans. Med.Imaging 8, 194–202 (1989).
24P. J. Green, “Bayesian reconstructions from emission tomography datausing a modified EM algorithm,” IEEE Trans. Med. Imaging 9, 84–93(1990).
25J. Wiegert, M. Bertram, G. Rose, and T. Aach, “Model based scatter cor-rection for cone-beam computed tomography,” Proc. SPIE 5745, 271–282(2005).
26M. Petersilka, K. Stierstorfer, H. Bruder, and T. Flohr, “Strategies for scat-ter correction in dual source CT,” Med. Phys. 37, 5971–5992 (2010).
27R. Clackdoyle, F. Noo, J. Guo, and J. A. Roberts, “Quantitative recon-struction from truncated projections in classical tomography,” IEEE Trans.Nucl. Sci. 51, 2570–2578 (2004).
28J. Hsieh, E. Chao, J. Thibault, B. Grekowicz, A. Horst, S. McOlash, andT. Myers, “A novel reconstruction algorithm to extend the CT scan field-of-view,” Med. Phys. 31, 2385–2391 (2004).
29J. M. Wilson, O. I. Christianson, S. Richard, and E. Samei, “A methodol-ogy for image quality evaluation of advanced CT systems,” Med. Phys. 40,031908 (9pp.) (2013).
30A. Badal and A. Badano, “Accelerating Monte Carlo simulations of pho-ton transport in a voxelized geometry using a massively parallel graphicsprocessing unit,” Med. Phys. 36, 4878–4880 (2009).
31A. Malusek, M. P. Sandborg, and G. A. Carlsson, “Simulation of scatterin cone beam CT: Effects on projection image quality,” Proc. SPIE 5030,740–751 (2003).
32P. C. Johns and M. Yaffe, “Scattered radiation in fan beam imaging sys-tems,” Med. Phys. 9, 231–239 (1982).
33J. Wang, H. Lu, Z. Liang, D. Eremina, G. Zhang, S. Wang, J. Chen, andJ. Manzione, “An experimental study on the noise properties of x-ray CTsinogram data in Radon space,” Phys. Med. Biol. 53, 3327–3341 (2008).
34J. Hsieh, “Computed tomography: Principles, design, artifacts, and recentadvances,” Proc. SPIE (Bellingham, WA, 2003).
35T. G. Flohr, K. Stierstorfer, S. Ulzheimer, H. Bruder, A. N. Primak, andC. H. McCollough, “Image reconstruction and image quality evaluation fora 64-slice CT scanner with z-flying focal spot,” Med. Phys. 32, 2536–2547(2005).
Medical Physics, Vol. 41, No. 6, June 2014