an assessment of factors influencing the …reduces the amount of waste, helps to prevent water...
TRANSCRIPT
UNIVERSITY OF NOVA GORICA
GRADUATE SCHOOL
AN ASSESSMENT OF FACTORS INFLUENCING THE
RECYCLING BEHAVIOR AT HOUSEHOLD WASTE LEVEL
Azra VELAGIĆ
MASTER’S THESIS
Mentor: Dr. Romina Rodela
Nova Gorica, 2012


ii
ABSTRACT
As the population grows, the consumption of material goods increases which results in
tremendous quantities of waste. In order to reduce this amount, many policies and programs
seek to integrate a standard waste management approach with preventive measures i.e.
recycling. The introduction of recycling is gaining importance and attention is placed on
recycling behavior.
Recycling behavior is understood as the act of separating waste according to its structure or
material quality (e.g. paper, plastic, glass, metal, organic waste, batteries, textiles, bulky waste
etc.), including further manufacture of same materials and production of new ones.
Researchers have observed that recycling behavior is influenced by a number of factors (e.g.
society pressure, culture, demographic issues, concern, attitude, sufficient storage space…),
however, very little is known about the influence these factors have on the recycling behavior
of the residents in the Federation of Bosnia and Herzegovina (FBiH).
The main focus of this thesis is to investigate factors that influence recycling behavior at the
household waste level in FBiH. To this end it focuses on two cases, Novi Grad and Mostar.
The two cases were chosen on the basis of two elements: a) presence of a recycling program
at the household level and b) the presence of public communication campaigns (PCCs). In
Novi Grad both are available while Mostar neither is available. This thesis has five developed
research objectives as follows: 1) identification of motivational factors; 2) identification of
concerns; 3) assessment of attitudes towards recycling behavior; 4) assessment of the
influence that knowledge has on recycling behavior and 5) identification of local public
communication campaigns (PCCs) that have influence on knowledge and attitude towards
recycling. Results show that intrinsic and extrinsic motivational factors were identified in both
cases where intrinsic were more dominated in Novi Grad than in the Mostar case. When we
considered concerns, we found that respondents in Novi Grad reported a poor understanding
of economic opportunities of recycling for plastic waste among local authorities. In Mostar,
however, there was a poor collaboration between two existing utility companies. In terms of
attitudes, respondents in Novi Grad reported a positive and dynamic role of the utility
company and insufficient capacity for animal, industrial and medical waste. On the other
hand, in Mostar, respondents pointed out ethnical division between utility companies and
presence of few actors engaged in recycling. In both cases, results show that respondents were
experienced with paper, glass and wood being recyclable materials, but very few knew that
medical waste and chemical liquids are not recyclable. Among PCCs, TV was identified to be

iii
the most influential media source by respondents in both cases while friends and family
members to be the most influential social source by which respondents obtained the most
information on recycling. This thesis highlights the significance of recycling behavior and its
factors as well as their introduction to contextualized policy measures. It also shows some
differences among municipalities left from the civil war that are now manifested in the
recycling behavior as well as towards environmental protection in general.
KEYWORDS: Federation of Bosnia and Herzegovina, qualitative and quantitative data
analysis, recycling behavior
iv
TABLE OF CONTENTS
LIST OF TABLES ......................................................................................................................................... V
LIST OF FIGURES ...................................................................................................................................... VI
LIST OF ABBREVIATIONS AND SYMBOLS ......................................................................................... VII
1 INTRODUCTION ................................................................................................................................. 1
1.1 RESEARCH OBJECTIVES ..................................................................................................................... 2 1.2 THESIS STRUCTURE ............................................................................................................................ 3
2 A CONCEPTUAL FRAMEWORK ...................................................................................................... 4
2.1 RECYCLING BEHAVIOR AND RELATED CONCEPTS ............................................................................... 4 2.2 CONCLUSION .................................................................................................................................... 12
3 METHODOLOGICAL FRAMEWORK ............................................................................................ 13
3.1 RESEARCH DESIGN ........................................................................................................................... 13 3.2 METHODS OF DATA COLLECTION ..................................................................................................... 14 3.3 BACKGROUND TO THE CASES ............................................................................................................ 16 3.4 CONCLUSIONS .................................................................................................................................. 24
4 RESULTS AND DISCUSSION OF QUALITATIVE DATA ............................................................. 25
4.1 RESPONDENTS’ ATTITUDES TOWARDS RECYCLING ........................................................................... 25 4.2 CURRENT ISSUES WITH RECYCLING .................................................................................................. 29 4.3 IDENTIFICATION OF MOTIVATIONAL FACTORS ................................................................................. 32 4.4 CONCLUSIONS .................................................................................................................................. 34
5 RESULTS AND DISCUSSION FROM QUANTITATIVE DATA .................................................... 35
5.1 DEMOGRAPHIC DATA OF THE SAMPLE .............................................................................................. 35 5.2 WASTE DISPOSAL AND SEPARATION .................................................................................................. 37 5.3 ASSESSMENT OF PERCEIVED MOTIVATIONAL FACTORS .................................................................... 40 5.4 ASSESSMENT OF CONCERNS .............................................................................................................. 42 5.5 ASSESSMENT OF ATTITUDES TOWARD RECYCLING BEHAVIOR .......................................................... 44 5.6 EVALUATION OF KNOWLEDGE .......................................................................................................... 45 5.7 PUBLIC COMMUNICATION CAMPAIGNS ............................................................................................. 54
6 CONCLUSION .................................................................................................................................... 62
6.1 INTRODUCTION ................................................................................................................................. 62 6.2 LIMITATIONS OF THE THESIS ............................................................................................................ 64
REFERENCES ............................................................................................................................................. 65
ACKNOWLEDGMENT ............................................................................................................................... 73
APPENDIX IA .............................................................................................................................................. 75
APPENDIX IB .............................................................................................................................................. 77
APPENDIX II ............................................................................................................................................... 79
v
LIST OF TABLES
TABLE 1: LIST OF RESPONDENT GROUPS INTERVIEWED ........................................................... 14
TABLE 2: CURRENT TERRITORIAL DIVISION OF BIH ................................................................. 17 TABLE 3: LIST OF PUBLIC COMMUNICATION CAMPAIGNS IN NOVI GRAD .................................. 21
TABLE 4: VALUES FOR QUESTIONS ON MOTIVATION FOR RECYCLERS AND NON-RECYCLERS IN
NOVI GRAD ................................................................................................................... 41
TABLE 5: VALUES FOR QUESTIONS ON MOTIVATION FOR RECYCLERS AND NON-RECYCLERS IN
MOSTAR ........................................................................................................................ 42 TABLE 6: VALUES FOR QUESTIONS ON CONCERNS FOR RECYCLERS AND NON-RECYCLERS IN NOVI
GRAD ............................................................................................................................ 43 TABLE 7: VALUES FOR QUESTIONS ON CONCERNS FOR RECYCLERS AND NON-RECYCLERS IN
MOSTAR ........................................................................................................................ 43 TABLE 8: VALUES FOR QUESTION ON ATTITUDES TOWARDS RECYCLING BEHAVIOR .................. 45
TABLE 9: ANSWERS FOR QUESTION ON RECYCLABLE MATERIALS IN NOVI GRAD ..................... 46 TABLE 10: ANSWERS FOR QUESTION ON RECYCLABLE MATERIALS IN MOSTAR ........................ 46
TABLE 11: ANSWERS FOR QUESTION ON COMPOST IN NOVI GRAD ........................................... 47 TABLE 12: ANSWERS FOR QUESTION ON COMPOST IN MOSTAR ................................................ 47
TABLE 13: ANSWERS FOR QUESTION ON DISPOSAL OF RECYCLABLE MATERIALS IN NOVI GRAD 47 TABLE 14: ANSWERS FOR QUESTION ON DISPOSAL OF RECYCLABLE MATERIALS IN MOSTAR .... 48
TABLE 15: ANSWERS FOR QUESTION ON PROCESSES OF RECYCLING SYSTEM IN NOVI GRAD ..... 48 TABLE 16: ANSWERS FOR QUESTION ON PROCESSES OF RECYCLING SYSTEM IN MOSTAR .......... 48
TABLE 17: ANSWERS FOR QUESTION ON BENEFITS OF THE RECYCLING SYSTEM IN NOVI GRAD . 49 TABLE 18: ANSWERS FOR QUESTION ON BENEFITS OF THE RECYCLING SYSTEM IN MOSTAR ...... 49
TABLE 19: ANSWERS FOR QUESTION ON BENEFITS OF THE RECYCLING PAPER IN NOVI GRAD .... 49 TABLE 20: ANSWERS FOR QUESTION ON BENEFITS OF THE RECYCLING PAPER IN MOSTAR ........ 50
TABLE 21: ANSWERS FOR QUESTION ON DEGRADATION OF MATERIALS IN NOVI GRAD............. 50 TABLE 22: ANSWERS FOR QUESTION ON DEGRADATION OF MATERIALS IN MOSTAR ................. 50
TABLE 23: NUMBER OF CORRECTED ANSWERS ON QUESTION REGARDING RECYCLABLE
MATERIALS .................................................................................................................... 52
TABLE 24: NUMBER OF CORRECTED ANSWERS ON QUESTION REGARDING DISPOSAL OF
RECYCLABLE MATERIALS ............................................................................................... 52
TABLE 25: RELIABILITY OF THE KNOWLEDGE COMPOUND INDEX ............................................. 53 TABLE 26: ANSWERS FOR QUESTION ON MEDIA SOURCES IN NOVI GRAD ................................. 55
TABLE 27: ANSWERS FOR QUESTION ON MEDIA SOURCES IN MOSTAR ...................................... 55 TABLE 28: ANSWERS FOR QUESTION ON SOCIAL INFLUENCE IN NOVI GRAD ............................. 56
TABLE 29: ANSWERS FOR QUESTION ON SOCIAL INFLUENCE IN MOSTAR .................................. 56 TABLE 30: VALUES FOR QUESTION ON BROCHURES ACROSS THE RECYCLING BEHAVIOR IN NOVI
GRAD ............................................................................................................................ 57 TABLE 31: VALUES FOR QUESTION ON BROCHURES ACROSS THE RECYCLING BEHAVIOR IN
MOSTAR ........................................................................................................................ 58 TABLE 32: MEAN VALUE ON KNOWLEDGE THROUGH MEDIA SOURCE (TV) IN NOVI GRAD ........ 59
TABLE 33: T-TEST FOR KNOWLEDGE ON BENEFITS OF RECYCLING SYSTEM THROUGH TV IN NOVI
GRAD ............................................................................................................................ 59
TABLE 34: MEAN VALUE ON ATTITUDE THROUGH MEDIA SOURCE (INTERNET) IN MOSTAR ....... 60 TABLE 35: T-TEST FOR ATTITUDE ON WASTE SEPARATION VIA INTERNET IN MOSTAR ............... 60
vi
LIST OF FIGURES
FIGURE 1: MAP OF BOSNIA AND HERZEGOVINA ...................................................................... 16
FIGURE 2: MAP OF SARAJEVO CANTON .................................................................................. 19 FIGURE 3: MAP OF HERZEGOVINA – NERETVA CANTON .......................................................... 22
FIGURE 4: MAP OF SEVEN UNITS IN MOSTAR .......................................................................... 23 FIGURE 5: AGE RANGE EXPRESSED IN PERCENTAGES ............................................................... 35
FIGURE 6: RESIDENCE AREA EXPRESSED IN PERCENTAGES ....................................................... 36 FIGURE 7: HOUSEHOLD SIZE EXPRESSED IN PERCENTAGES....................................................... 36 FIGURE 8: EDUCATIONAL LEVELS EXPRESSED IN PERCENTAGES .............................................. 37
FIGURE 9: EMPLOYMENT EXPRESSED IN PERCENTAGES ........................................................... 37 FIGURE 10: FREQUENCY OF WASTE DISPOSAL EXPRESSED IN PERCENTAGES ............................. 38
FIGURE 11: WASTE SEPARATION RATES EXPRESSED IN PERCENTAGES ...................................... 38 FIGURE 12: STATED REASONS FOR NON-SEPARATION IN NOVI GRAD AND MOSTAR .................. 39
FIGURE 13: KNOWLEDGE LEVEL BETWEEN RECYCLERS AND NON RECYCLERS IN NOVI GRAD ... 51 FIGURE 14: KNOWLEDGE LEVEL BETWEEN RECYCLERS AND NON RECYCLERS IN MOSTAR ........ 51
vii
LIST OF ABBREVIATIONS AND SYMBOLS
BiH – Bosnia and Herzegovina
CLR Mostar – Center for local development Mostar
COOR - Center for Environmentally Sustainable Development
DB – District of Brčko
DPA - Dayton Peace Agreement
EB – European Bank
EC – European Commission
EU – European Union
FBiH – Federation of Bosnia and Herzegovina
HNK – Herzegovina – Neretva Canton
IFC – International Finance Cooperation
IMIC – International Multireligous Intercultural Centre
JP – Javno Preduzeće (Public Utility Company)
KEAP – Cantonal Environmental Action Plan
KJKP Rad – Cantonal Public Utility Company Rad
LEAP – Local Environmental Action Plan
MSW – Municipal Solid Waste
NEAP - National Environmental Action Plan
NEP - New Environmental Paradigm
NGO – Non-government organization
OGBH – Association « Education builds BiH »
OHR - Office of High Representative
PCCs – Public communication campaigns
PET – polyethylene terephthalate
PP – polypropylene
PVC – polyvinyl chloride
REC – Regional Environmental Centre
RS – Republika Srpska
SIDA – Swedish International Development Cooperation Agency
SPSS - Statistical Package for the Social Sciences
TRA - Theory of Reasoned Action
UNDP - United Nations Development Program
UNECE – United Nations Economic Commission for Europe
USAID – United States Agency for International Development
WB - World Bank
1
1 INTRODUCTION
As the human population continues to grow exponentially with a consumption of material
goods, issues pertaining to waste generation, disposal and recycling have become paramount
to the contemporary society (Seacat and Northrup, 2010). The latest published version
regarding municipal waste generation per capita in Europe was 509 kg in 2008 (European
Environmental Agency, 2011). Many landfills are already overloaded while new landfill sites
are not easily available (Gamba and Oskamp, 1994). This vast amount of waste brings up
questions on how to dispose of it properly and policies and programs seek to integrate a
standard waste management approaches with preventive measures i.e. recycling. Recycling
reduces the amount of waste, helps to prevent water contamination (Tietenberg, 1994), saves
raw materials, reduces our impact on climate change, reduces landfill costs, creates jobs and
helps toward sustainable living (Friends of the Earth, 2008). The need to systematically
introduce recycling practice is becoming more and more apparent. In this, with respect to the
implementation of recycling practice, it makes a substantial difference how waste is disposed,
or separated by the user. Recycling is a labor intensive practice and requires community
involvement (Chan, 1998) such as local residents, retailers and producers which in turn
depends in part on the services available (e.g. collection and transport schemes, infrastructure)
(Parliamentary Office of Science and Technology, 2005). It follows from this that there is a
need to assess and understand factors which influence public participation in recycling
projects (Vining et al., 1992). Public participation in recycling projects and programs is
critical in order to increase recycling rates (Perrin and Barton, 2001). National governments
and environmental agencies are now reorienting policy programs towards recycling and
related measures that place high priority on facilitating behavioral change and are encouraging
pro-environmental behavior as for instance is recycling behavior.
In this regard, recycling behavior is understood as the act of separating waste according to its
structure or material quality (e.g. paper, plastic, glass, metal, organic waste, batteries, textiles,
bulky waste etc.), including further manufacture of same materials and production of new
ones. Researchers have observed that recycling behavior is influenced by a number of factors
such as is society pressure, culture, demographic issues, environmental concern,
environmental attitude, convenience, effort and time required for recycling, sufficient storage
space, parental influence and local authority provision for good service (Li, 2003; Timlett and
Williams, 2008). Although a variety of factors have been identified in influencing recycling

2
behavior, little is known about the influence these factors have on the recycling behavior of
the residents in the Federation of Bosnia and Herzegovina (FBiH).
The Federation of Bosnia and Herzegovina along with the rest of the country has undertaken a
post-conflict reconstruction process and is currently aiming for accession into the European
Union (EU). There are reforms within the environmental sector which involve the adoption
and transposition of the EU acquis. In this regard waste management after the war effort went
into restoring the system to the pre-war standards. However, observers comment that waste
management did not reach good operational levels and is still facing several issues: it lacks in
infrastructure, has a large number of wild dumpsites, does not have a centralized database on
waste fees, has policy implementation deficits, a low cost recovery collection rate, a strong
urban-rural divide and difficulties in introducing new recycling practices (Shekdar 1999;
European Bank, 2007; Commission of the European Communities, 2009; United Nations
Economic Commission for Europe, 2011).
The main focus of this thesis is on the factors that influence recycling behavior at the
household waste level in FBiH. To this end it focuses on two cases, Novi Grad and Mostar.
The two cases were chosen on the basis of two elements: a) presence of a recycling program
at the household level and b) the presence of public communication campaigns (PCCs). In
Novi Grad both are available while Mostar neither are available. Such a difference can help in
the development of an understanding if, and how the chosen influencing factors (i.e.
motivational factors, concerns, attitudes, knowledge) can influence recycling behavior in the
selected cases.
1.1 Research Objectives
Having suggested that research on recycling behavior may offer opportunities for the
understanding of recycling practice, it is important now to specify what the specific objectives
of this thesis are. Therefore, research described in this thesis has five main objectives:
1. To identify what motivational factors support recycling behavior;
2. To identify concerns that the local community has in terms of adopting the recycling
behavior;
3. To assess current attitudes toward the recycling behavior;
4. To assess the influence of knowledge level, respondents have, on their recycling
behavior;
3
5. To identify whether locally available public communication campaigns have an
influence on knowledge, and on attitudes people have towards the recycling.
The first objective aims to identify which motivational factors support recycling behavior in
the chosen empirical cases. Understanding what motivates the residents of Mostar and Novi
Grad to recycle can help in designing more effective programs with good recruitment levels.
The second objective aims to identify concerns local communities may have in terms of
adopting recycling behavior. This information can help to identify possible barriers to
recycling and support when the interest is to identify workable solutions to current issues.
The third objective aims to assess attitudes toward recycling behavior. This information can
provide input for when the interest is to strengthen desirable attitudes in order to maintain the
recycling behavior; also it can inform government officials, policy makers and others about
the public's preferences about recycling program planning.
The fourth objective aims to assess the influence of knowledge, which the residents of Mostar
and Novi Grad have, on recycling behavior. This information can help in the design,
implementation and organization of pubic communication campaigns.
The fifth objective aims to identify whether public communication campaigns which were
delivered in local areas (i.e. Novi Grad) have influenced knowledge and attitudes towards
recycling.
1.2 Thesis structure
This thesis is made of six chapters. In Chapter Two a literature review covering the main
topics and concepts such as is recycling behavior, motivational factors, concerns, attitudes,
knowledge and public communication campaigns is given. The objective of this chapter is to
map out how these are understood in current literature that investigates recycling behavior. In
Chapter Three, methodological aspects are introduced and the two cases (Novi Grad and
Mostar) are presented. In Chapter Four, qualitative data are analyzed while Chapter Five
covers quantitative data. Chapter Six summarizes the research findings, considers the
significance and limitations of this research and gives some indications for further research.

4
2 A CONCEPTUAL FRAMEWORK
This chapter opens the enquiry by introducing established research that investigates recycling
behavior and by providing background detail about the conceptual constructs used in this
research.
2.1 Recycling behavior and related concepts
Recycling behavior is defined as the act of separating waste according to its structure or
material quality (e.g. paper, plastic, glass, metal, organic waste, batteries, textiles, bulky waste
etc.), including further manufacture of same materials and production of new items.
According to Barr and Gilg (2006; p.917) “recycling behavior constitutes a highly structured
and mechanized behavior, with individuals sorting and cleaning materials for recycling
collection”, while according to Menses & Palacio (2005) recycling behavior is a
multidimensional activity regarding the distribution of recycling tasks and roles within the
households (e.g. influencer, initiator, decision maker, vendor, persuader, enforcer and
rejecter).
Scholars have often understood recycling behavior to be a specific phenomenon that has been
classified in different ways. For instance, some literature within the domain of environmental
psychology understands recycling behavior as conservation behavior (Lee et al., 1995) where
recycling is seen as a repetitive practice of using and sorting the materials (e.g. paper) in a
way to save the resources (e.g. timber); as environmentally responsible behavior (Stern et al.,
1993; De Young, 2000) or as individual waste management behavior (Tucker, 2003). Other
literature, within the field of behavioral sciences, refers to an individual’s commitment or
obligation to recycling practice and labels it as altruistic behavior (De Young, 1986). In social
sciences research mostly focuses on the individual who recycles waste (e.g. sort, manufacture,
produce) in the context of a waste management program and terms it environmentally
beneficial behavior (Vining and Ebreo, 1990; 1992) where such behavior alters the structure
and dynamics of ecosystem or the biosphere; and disposal and sorting behavior (Lindén and
Carlson-Kanyama, 2003) as an act of sorting and disposing the materials in recycling practice.
Various scholars have found that there is, however, a number of constraints to recycling
behavior as even if people consider recycling as a “good thing to do” and express a desire to
participate in recycling, they do not always act accordingly. There may be “time and space
constraints” (Vining and Ebreo, 1990; Vining et al., 1992; Gamba and Oskamp, 1994;
5
Howenstine, 1993; Williams and Kelly, 2003; Martin et al., 2006; Nixon and Saphore, 2009),
or they may feel their actions would have little effect (DEFRA, 2001; MORI, 2002). Other
constraints to recycling behavior are: the long distance from where recycling centers are
located (Nixon and Saphore, 2009); delays in bag delivery or poor collection service
(Grodzińska-Jurczak et al., 2003); lack of incentives to recycle (Timlett and Williams, 2008);
the institutional context (Refsgaard and Magnussen, 2009); absence of recycling facilities
(McDonald and Ball, 1998); a recycling system that is not user friendly (Katzev et al., 1993);
low level of environmental awareness (Grodzińska-Jurczak et al., 2003); as well as lethargy
and disinterest from the public (Wilson and Williams, 2007).
The literature suggests that in order to develop an understanding of recycling behavior it is
important to first identify and understand factors that have an influence on it (e.g.
motivational factors, concerns etc.). Hopper and Nielsen (1991) stated that there is no need to
convince people that recycling is a good idea; rather we need to persuade them to behave
accordingly.
Motivational factors
Motivational factors are described as drivers that stimulate people or induce people in certain
tasks. For example, research has found that: a) user friendliness, b) spatial location of the
recycling containers and c) management support of the recycling program, are some of the
factors that can motivate people to engage in a recycling behavior (Katzev et al., 1993). Other
studies proved that recycling behavior is more likely to be adopted when individuals live in
the proximity of containers, when there is a degree of social influence and when there are
monetary rewards (Reid et al., 1976; Hopper and Nielson, 1991; Hornik et al., 1995). Hence,
scholars suggest that there are two major groups of motivational factors: intrinsic (e.g.
concern, attitude, knowledge) and extrinsic (e.g. rewards, sanctions, social influence, public
communication campaigns).
Intrinsic motivational factors refer to those that arise from within an individual. These drive
people to do things on the basis of pleasure and joy that the action gives (emotional base), or
because people feel it is the right thing to do (ethical base). Scholars that have conducted
research on motivation have focused on: locus of control defined as a person’s belief about
waste and what issues causes the good or bad results in his/her life (Pieters, 1991; Hornik et
al., 1995); personal satisfaction in avoiding waste and being more self-sufficient (i.e. a feeling
that actions count and are worthwhile); general satisfaction from participating in a program

6
(e.g. conservation of natural resources) where one’s actions seem to help the community and
the nation (De Young, 1986; Hornik et al., 1995). Also, it has been demonstrated that what
motivates people to undertake recycling behavior is commitment to the well-being of others
(e.g. Hopper and Nielsen, 1991; Oskamp et al., 1991; Vining and Ebreo, 1992) and concern
for the preservation of natural resources (Vining and Ebreo, 1990; Vining et al., 1992).
However, those who feel morally obligated to recycle will engage in the act only if they
believe in the positive consequences of recycling and feel personally responsible for these
consequences (Vining and Ebreo, 1992).
Extrinsic motivational factors, on the other hand, refer to motivation that comes from outside
the individual. These drivers are present in the environment where the individual is located
and can take the form of tangible rewards or social influence. For instance, social influence is
manifested through social support (e.g. from family, friends or neighbors) for recycling within
one’s household or community (Vining and Ebreo, 1990; Oskamp et al., 1991), the presence
of block leaders (Hopper and Nielsen, 1991) or trained staff (Burn and Oskamp, 1986). Social
support may also occur when friends or family encourage a recycling behavior. In the study of
Thomas et al. (2004), those with low recycling rates expressed that seeing others doing
recycling would encourage them to recycle. Conversely, lack of support from members of
one’s household may induce one not to perform recycling behavior (Vining et al., 1992).
Administrative measures are also extrinsic motivational factors as in the case of instructions,
norms and laws combined with some type of sanctions (Lindén and Carlsson-Kanyama, 2003;
Pieters, 1991). Other extrinsic motivational factors are rewards or monetary payment with
information and prompts, which are proven to influence recycling behavior as well (Diamond
and Loewy, 1991). However, scholars noted that although extrinsic motivational factors have
an influence on recycling behavior, these are not always able to exert long lasting effects. In
most empirical studies behavior returns to baseline levels after “reinforcement” come to an
end or the reward was removed (De Young, 1986; Dwyer et al., 1993).
Research found that intrinsic motivational factors are an extremely strong drive in comparison
to extrinsic motivational factors (Hornik et al., 1995). Vining and Ebreo (1990) reported that
behavior can shift from being initiated and maintained by extrinsic motives toward being
influenced by intrinsic motives. The assessment of various motivational factors is important
because it can contribute to the design of communitywide strategies to promote recycling and
other conservation behavior (Vining et al., 1992; McDonald and Ball, 1998).

7
Environmental concerns
Environmental concerns are defined as a set of feelings regarding environmental issues that
are perceived to have a negative influence on health and on the environment. For instance, in
the study of Baldassare and Katz (1992), individuals perceived their own health and personal
well-being as directly threatened by environmental problems (e.g. waste, air, water pollution).
They found that environmental concern is a significant factor in adopting environmental
practices (e.g. recycling at home, conserving water). In other words, those who believe that
environmental problems (e.g. full capacity or inadequate conditions of landfills) are a very
serious threat to their health and well being are more likely to engage in environmental
practices (e.g. recycling). Similar findings have been found in a further study that shows how
individuals, who are environmentally concerned, tend to perform a set of environmentally
friendly behaviors such as recycling (Lindén and Carlsson-Kanyama, 2003).
Also the research on environmental concern can be divided in two groups of literature. One
concentrated on identification of the socio-demographic factors associated with environmental
concern while the other focused on purely psychological determinants (i.e. values, attitudes,
beliefs). The first group looked at the influence of gender, age, educational level or political
ideology on environmental concern. The second group focused on psychological determinants
such as attitudes or values orientation (e.g. egoistic, humanistic and biospheric defined by
concerns), and their influence on concerns (e.g. Stern, 1992). These environmental concerns
can be complementary, in that different orientations toward the environment are represented.
Studies which measured concerns did so in two different ways. These focused on a specific
attitude directly determining intentions (i.e. to act in certain way) (Vining and Ebreo, 1992;
Fransson and Gärling, 1999; Berenguer et al., 2005); or to a more general attitude (Oskamp, et
al. 1991; Fransson and Gärling, 1999; Minton and Rose, 1997; Berenguer et al., 2005).
Further to this research it was found that environmental concern is often a significant
determinant for recycling behavior (Gonzalez-Torre and Adenso-Diaz 2005; Do Valle et al.,
2004; Derksen and Gartell, 1993). Derksen and Gartell (1993) report that it could occur when
respondents express concern on aspects of convenience e.g. presence of equipment and
information, meaning that if recycling containers and regular pick up are provided, individuals
will be less concerned and will recycle more because the effort required on their part would
decrease. Hence, research suggests that recycling behavior is affected indirectly by
environmental concerns.

8
On the other hand, inconvenience (e.g. lack of storage and time) also seems to affect
recycling. Nixon and Saphores (2009) reported that in their study respondents who had
difficulties in finding space to store recyclables, had safety concerns, as well as difficulties to
find the time to recycle, thus were less likely to recycle.
Hadden (1991) suggests that there are three possible strategies to handle environmental
concerns: to ignore them, try to change them, or work with them. In terms of recycling
behavior the last one is most relevant and can be addressed by public communication
campaigns (Banerjee, 2002). To this end it is important to identify who is concerned and who
is not, and the type of concern involved, as this knowledge can help to design messages to
inform, persuade and remind people to be more environmentally friendly (Minton and Rose,
1997).
Environmental attitudes
The literature advances a number of models for the study of environmental attitudes by using
models such as is the “Theory of Reasoned Action (TRA)” developed by Fishbein and Ajzen
(1975) or the “New Environmental Paradigm (NEP)” developed by Dunlap and Van Liere
(1978) which are based on cognitive theories of how individuals develop their attitudes and
perform a behavior. These models are largely used in environmental research (e.g. recycling)
and are helpful in understanding behavioral change. However, a more detailed review of this
work is beyond the scope of this thesis, since neither of the two will be used, nor it is an aim
to study behavioral change. In the following we will introduce what attitudes are and how
attitudes are related to recycling behavior.
Attitudes are explained as a learned, relatively stable tendency to respond towards an attitude
object, in other words attitudes inform us on what people think of something and how they
feel about it (e.g. people, concerns or events) (Arul, 2001). Furthermore, Fahy (2005) sees
attitudes as a psychological tendency that is expressed by evaluating a particular entity with
some degree of favor or disfavor. Individuals tend to express their own attitudes based upon
concerns, values, feelings or opinions raised toward an issue or an object. For instance, people
who hold positive attitudes towards recycling are more likely to recycle (De Young, 1986;
Oskamp et al., 1991; Gamba and Oskamp, 1994). An individual can have a positive attitude
towards recycling (ethical values) but at the same time have a negative attitude towards waste
separation (values about welfare and modern lifestyle) (Lindén and Carlsson-Kanyama, 2003)
which according to Carrus et al., (2008) is a case of bipolar attitude toward an issue:
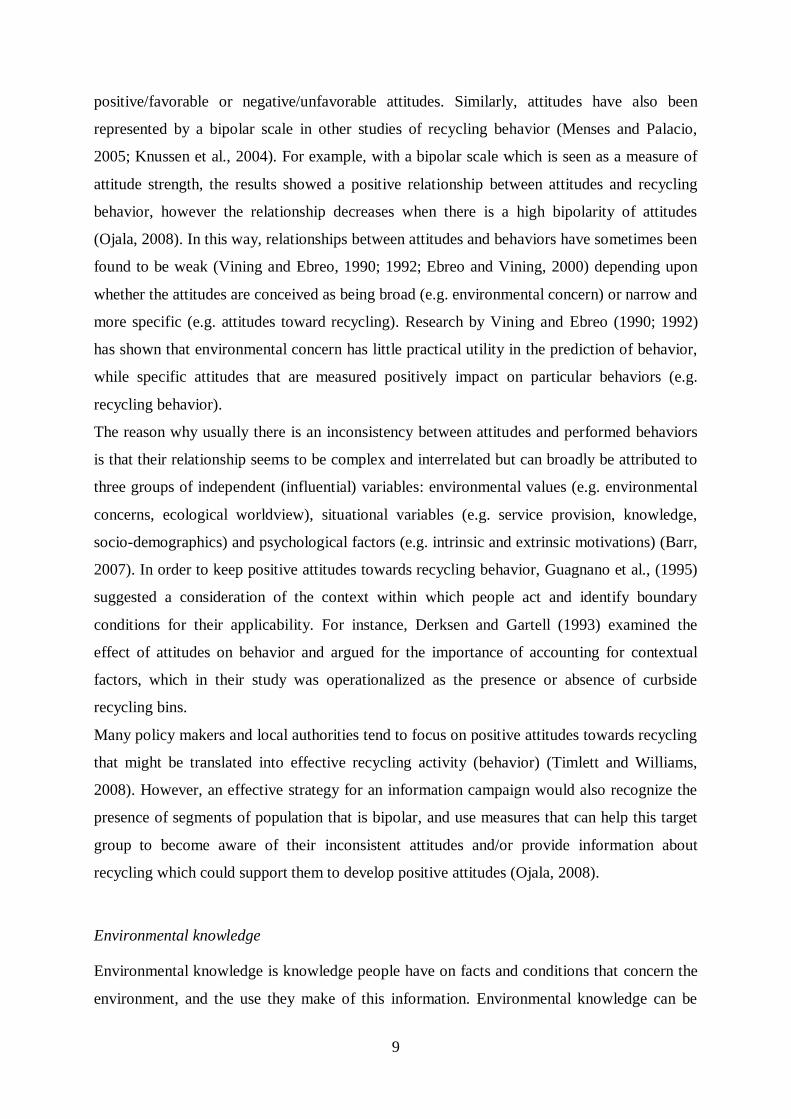
9
positive/favorable or negative/unfavorable attitudes. Similarly, attitudes have also been
represented by a bipolar scale in other studies of recycling behavior (Menses and Palacio,
2005; Knussen et al., 2004). For example, with a bipolar scale which is seen as a measure of
attitude strength, the results showed a positive relationship between attitudes and recycling
behavior, however the relationship decreases when there is a high bipolarity of attitudes
(Ojala, 2008). In this way, relationships between attitudes and behaviors have sometimes been
found to be weak (Vining and Ebreo, 1990; 1992; Ebreo and Vining, 2000) depending upon
whether the attitudes are conceived as being broad (e.g. environmental concern) or narrow and
more specific (e.g. attitudes toward recycling). Research by Vining and Ebreo (1990; 1992)
has shown that environmental concern has little practical utility in the prediction of behavior,
while specific attitudes that are measured positively impact on particular behaviors (e.g.
recycling behavior).
The reason why usually there is an inconsistency between attitudes and performed behaviors
is that their relationship seems to be complex and interrelated but can broadly be attributed to
three groups of independent (influential) variables: environmental values (e.g. environmental
concerns, ecological worldview), situational variables (e.g. service provision, knowledge,
socio-demographics) and psychological factors (e.g. intrinsic and extrinsic motivations) (Barr,
2007). In order to keep positive attitudes towards recycling behavior, Guagnano et al., (1995)
suggested a consideration of the context within which people act and identify boundary
conditions for their applicability. For instance, Derksen and Gartell (1993) examined the
effect of attitudes on behavior and argued for the importance of accounting for contextual
factors, which in their study was operationalized as the presence or absence of curbside
recycling bins.
Many policy makers and local authorities tend to focus on positive attitudes towards recycling
that might be translated into effective recycling activity (behavior) (Timlett and Williams,
2008). However, an effective strategy for an information campaign would also recognize the
presence of segments of population that is bipolar, and use measures that can help this target
group to become aware of their inconsistent attitudes and/or provide information about
recycling which could support them to develop positive attitudes (Ojala, 2008).
Environmental knowledge
Environmental knowledge is knowledge people have on facts and conditions that concern the
environment, and the use they make of this information. Environmental knowledge can be
10
gained through social influence, experiences, education or public communication campaigns.
Research suggests that purposeful knowledge about the environmental consequences different
waste management systems have, as well as knowledge about solutions, is an important
influencing factor in recycling behavior (Refsgaard and Magnussen, 2009). Barr et al. (2001)
argue that a main aspect influencing recycling behavior is knowledge about recycling. Even
though Hungerford and Volk (1990) commented that if people are more knowledgeable they
will in turn become more aware of the environment and its problems, and thus be more
motivated to act toward the environment. Grob (1995) had similar thoughts in his structured
model however, no effects on behavior were found. Furthermore, Oskamp et al. (1991)
suggested that recycling behavior may be less related to knowledge about environmental
problems in general than to knowledge of the specifics of recycling. For instance, specific
knowledge about how and where to recycle increases the frequency and volume of waste
recovery by citizens (Luyben and Bailey, 1979; Hornik et al., 1995; Howenstine, 1993).
In order to maintain recycling behavior over time, individuals require a considerable amount
of information in order to appropriately and effectively be engaged in recycling e.g. local
curbside recycling schedules, methods of appropriate preparation of recyclable products,
knowledge about products that may be recycled and how collected materials are processed.
Thomas et al., (2004), report on a study where they found an increase in awareness levels
about recyclable materials. However, in their study, many respondents were not aware of what
can be recycled and whether some materials are included in collections or not. On the other
hand, incorrect information can lead to wrong beliefs that products set out for recycling are
actually disposed at landfills; to recycle on wrong schedules and to mixing of non-recyclable
with recyclable products in same containers. Pieters (1991) reminds us that a person who
intends to participate in a waste separation program but does not have correct information will
not participate properly.
Previous studies that investigated knowledge differences across recyclers and non-recyclers
found that recyclers are more aware about the recycling program, are more knowledgeable
about materials recyclable in the local area, and are more aware of the means for recycling
compared to non-recyclers (Vining and Ebreo, 1990; Vining et al., 1992). When compared to
non-recyclers, recyclers score higher on intrinsic motives and seem to be more knowledgeable
about specific recycling programs available (De Young, 1986). These findings suggest that
enhancing the knowledge base of citizens, through educational programs and communication
campaigns, can benefit the recycling practice.

11
Public communication campaigns
In everyday’s life people are under the influence of various public communication campaigns
(PCCs) which aim to communicate, to educate, and inform on a given topic. The type of tools
usually used in PCCs include: media sources (e.g. television, radio station, newspapers,
magazines, internet), other written formats of information (e.g. brochures, posters, flyers,
leaflets, feedback), events (e.g. workshops, seminars, conferences), educational institutions
(e.g. school, university, waste company) or even role models that can serve as a source of
information (e.g. friends, family members, neighbors). The kind of information provided by
PPCs can range from good examples, to highlighting negative environmental impacts with
instructions on how to avoid negative consequences. There seems to be a consensus within the
literature that recycling rates are positively correlated with PPCs (Martinez and Scicchitano,
1998; McDonald and Ball, 1998; Thomas, 2001). PPCs are seen to have an influence on
knowledge levels and attitudes that the public has toward a given issue.
Research has shown that PCCs may influence knowledge levels depending on how people
perceive it. For instance Smith et al. (2002) assessed the influence of different media (e.g.
television, radio, print media) on the use of sun protection measures (e.g. cream, hat) and
found that these campaigns had little influence on knowledge. On the other hand, McDonald
and Ball (1998) found that house leafleting had an influence on knowledge on the
recyclability of plastic materials. A positive and statistically significant relationship was found
between communication and specific knowledge also in the study of Do Valle (2005) where
consumers who were more informed about recycling and selective-collection were those who
possessed more knowledge on these issues.
Sudarmadi, et al. (2001) found that mass media play a major role in shaping public opinion
through radio, and the press and television, the last in particular seems to be a powerful
instrument for changing public attitudes. On the other hand, Hopper and Nielsen (1991)
demonstrated that interventions involving prompts and information increased recycling
behavior i.e. number of recyclers over a seven month period; however, in their study they also
found that these approaches did not affect perceptions of social norms and attitudes toward
recycling.
Some of the considerations as suggested by Read (1997b) can be taken into account when
designing and implementing a campaign that includes the formulation of clear messages and
usage of a range of different tools. Information about recycling shall be clear, easily
accessible and comprehensible.
12
2.2 Conclusion
Nowadays research that investigates recycling systems recognizes that recycling behavior has
an important role and as a consequence it tries to further understand what elements can
influence it. There is interest for the underlying processes that lead people to adopt recycling
behavior and the assumption is that the factors listed above that can together offer a useful
means for the investigation of recycling behavior.
These factors have a social and psychological root and were empirically investigated in
several European and North American countries. However, to date no research on the social
and psychological factors influencing recycling behavior has been conducted in the Federation
of Bosnia and Herzegovina where waste management is still facing several issues and
recycling is poorly implemented.
It is suggested that an understanding of the social and psychological factors would help to
further understand recycling behavior in the Federation of Bosnia and Herzegovina. This
knowledge can contribute to policy recycling programs and the design of pubic
communication campaigns.

13
3 METHODOLOGICAL FRAMEWORK
This chapter introduces the methodology used for the empirical aspects of this research. It
presents the research design (Section 3.1); the data collection methods (Section 3.2); and
gives some background information about the two cases (Section 3.3).
3.1 Research design
The methodology used for this research is a case study. A case study provides adequate means
of exploring the detail of the recycling practice and gives the opportunity to develop an
understanding of factors that influence recycling behavior. Furthermore, it offers the
opportunity to integrate qualitative and quantitative methods (Yin, 2003).
The empirical part of this study was undertaken in the FBiH where two municipalities were
selected: the Novi Grad municipality and the Mostar municipality. The first case was chosen
on the basis of having already introduced a recycling program at the household level inclusive
of public communication campaigns. The second case was chosen for not having a recycling
program or a public communication campaign.
As recommended by the literature (Yin, 2003), a Case Study Protocol was designed prior to
the entry into the field. There were two phases of data collection: the first was conducted with
qualitative methods (i.e. interviews) and a second with quantitative (i.e. questionnaire)
methods. First, interviews were administrated in order to explore and understand the current
situation regarding recycling. This was followed by a second step, where a questionnaire was
used in order to assess quantitatively the chosen variables and verify relationships. Also, a
combination of literature review and secondary data (e.g. legal documents, statistical
databases, reports, newspapers, bulletins) was used to obtain the necessary background
information to the cases.
Thus, it is relevant to point out that this thesis does not aim for a comparison of the two cases
against selected criteria. These differ from one another in substantial ways for which a
comparison of one against the other would be, methodologically speaking, problematic.
Rather the aim here is to develop an understanding of the current situation for each case, gain
insight into present issues and opportunities for recycling practice.

14
3.2 Methods of data collection
Data were collected by means of qualitative methods i.e. interviews and quantitative methods
i.e. questionnaire.
Interviews were semi-structured and conducted during two weeks in April 2009. Respondents
were clustered in six major groups (e.g. international, national and local institutions, private
companies, NGOs and residents) as indicated in Table 1. Each group consisted from 2 to 7
respondents for a total of 43 respondents. The chosen sampling method was snowballing1 and
the selection criteria included: a direct stake, interest or role in the recycling system (e.g.
residents, private companies, NGOs). Semi-structured face-to-face interviews had an
exploratory nature, aimed at an understanding of the local situation and institutional contexts.
No incentives were used to engage respondents.
Table 1: List of respondent groups interviewed
# GROUPS RESPONDENTS # OF
RESPONDENTS
INTERVIEWED
1 International
institutions
European Commission, International Finance
Cooperation, World Bank and United Nations
Development Program
4 respondents
2 National
Institutions
Federal Ministry of Environment and Tourism 2 respondents
3
Local
institutions
Utility company KJKP Rad, Cantonal Ministry of
Physical Planning and Environment in Novi Grad
3 respondents
City Council, Utility company JP Deponija, Cantonal
Ministry of Physical Planning and Environmental
Protection in Mostar
3 respondents
4
Private
companies
ENOVA, EuroBiro, Alem Sistem, 5D CADD
in Novi Grad
4 respondents
Eco Plan, Papir Servis, Katarina and Kamen-Dent in
Mostar
4 respondents
5
NGOs
Center for Environmentally Sustainable Development,
Eco Action, International Multireligous Intercultural Centre, Regional Environmental Centre and Association
“Education builds FBiH” in Novi Grad
5 respondents
Eko Jasenica, Izvor Mostar, Center for local development
Mostar, Regional Environmental Centre and Club of
divers “Mostari” in Mostar
5 respondents
6 Residents Residents from Novi Grad 7 respondents
Residents from Mostar 6 respondents
During the pre-field work period, a draft interview guide was prepared consisting of 19
questions. Piloting data collection tools is an important step that helps to improve research
quality (Yin, 2003). To this end, the interview guide was tested with two native speakers,
1 Snowballing is a method for respondent selection used for identification of individuals whom to conduct interviews on the basis of asking
the question “Would you recommend somebody who has interests or knows more about the field of recycling?” (Gray, 2004).

15
which led to the rephrasing of questions number 2, 8 and 11 (Appendix Ia). These two
respondents were not included in the final sample used for the analysis. Questions were sorted
into main categories that included attitudes, concerns, motivational factors and related issues
of interest. In order to allow for more contextual information respondents were given the
opportunity to raise additional issues that they considered to be important in relation to
recycling practice. An adjusted set of questions was prepared for one respondent group (i.e.
residents) that aims to better capture their role in the recycling system. The final version of the
interview guide is given in Appendix Ia and b. After the interview, a cover letter, detailing the
research objectives and acknowledging respondent’s contribution to the study, was handed to
the respondent. Interview data were handled according to good research practice in order to
assure confidentiality and respondents’ anonymity. Then, within a period of two months
interviews were transcribed verbatim and analyzed by the author.
Questionnaires were administered during a three week period in July 2009 with local
respondents who were not contacted for interviews. The chosen sampling method was random
sampling2 and the respondent selection criteria included: residency for more than 5 years in
the study area and being at least 18 years old. The questionnaire consists of 23 close-ended
questions divided into six parts: i) waste related issues, ii) concerns, iii) motivational factors,
iv) knowledge, v) attitudes, vi) PCCs and vii) demographic data. Answers format involved a
standard Likert scale, ranging from strongly disagree (1) to strongly agree (5) (Gray, 2004).
Some questions involved a “yes/no/do not know” or a descriptive answer. Questionnaires
entailed paper-pencil method. No incentives were used to engage respondents. The
questionnaire was administrated to the 220 respondents, the 110 in each municipality.
However, in the Mostar sample, 4 of our respondents reported that they “don’t know” whether
waste is separated or not at their home. It can be assumed this sub-group of our respondents
might not be engaged in recycling and empting out garbage in the collection bins, as these
may be handled by someone else within the household (e.g. parents). In noting this, we
recognize that answers given by this small portion of the sample may not serve well in the
later analyses. Given that it involves only 4 respondents, a decision was made to not include
these respondents in part of the later analysis giving the 116 respondents in Mostar.
During the pre-field work period, a draft questionnaire was piloted with two native speakers,
which led to a modification in the wording of question 11 (Appendix II). These two
questionnaires were not included in the final sample. The fieldwork was carried out by a team
of four volunteers coordinated and supervised by the author of this research. Volunteers were
2 Random sampling is a method where each respondent of the population has an equal chance of being selected at each draw (Gray, 2004).

16
trained how to administrate the questionnaire. After data collection, data were typed into an
excel database, then analyzed with the Statistical Package for the Social Sciences (SPSS)
version 18.0. The analysis included: descriptive statistics (e.g. mean values, standard
deviation and standard error of mean), bivariate correlation (Pearson’s correlation),
independent t-tests and reliability test (e.g. Cronbach alpha). Further detail on the results is
given in Chapter 5.
The above-mentioned data collection i.e. interviews and questionnaires were conducted in the
Bosnian language. It is also worth to mention that site visits were made to the landfills and
local communities in both municipalities.
3.3 Background to the cases
In this section, the brief background information to the cases is given. The state of BiH was
part of the former Yugoslav Federation (Socijalistička Federativna Republika Jugoslavija)
from which gained independence in 1992. Since then, BiH has been through civil war that
lasted for 3.5 years and caused severe political, social, and economic instability. In 1995, as a
result of Dayton Peace Agreement (DPA) chaired by international and domestic organizations
the Constitution of BiH was formulated. In this negotiation process BiH was divided into
three administrative levels: entities (Federation of FBiH (FBiH); Republika Srpska (RS)),
cantons and municipalities (see: Figure 1 and Table 2).
Figure 1: Map of Bosnia and Herzegovina
Source: Regional Environmental Center of BiH, 2006

17
Table 2: Current territorial division of BiH
Within the FBiH territory the entity is empowered to transfer responsibilities to cantons and in
turn cantons to municipalities. Within the RS territory the entity is empowered to transfer
responsibilities to municipalities. In 2000, the International Arbitral Tribunal ruled in decision
for a new and independent territorial unit (entity) and the District of Brčko (DB) was formed
(Jeffrey, 2006).
Due to the civil war, BiH inherited a destroyed infrastructure (e.g. electric energy, water
supply, sewerage, transport etc.), ruined industry and collapsed economy (National
Environmental Action Plan - NEAP, 2003). Since then, the process of devastation within the
environment has continued (e.g. intensive exploitation of natural resources, existence of
highly polluted technology). Among various environmental issues, waste management has
been recognized as one of critical concern for BiH (European Bank, 2007). For instance, BiH
has issues with inadequate waste management practices (e.g. illegal dumping at roadsides,
rivers, lakes and parks) that might threat public health and the natural environment; treatment
facilities for medical and hazardous waste do not exist; data collection, monitoring and
reporting on waste largely lags behind (United Nations Economic Commission For Europe,
2011).
In FBiH, the average generation of municipal waste is 356 kg/person/year, with a total amount
of 893.318 tons/year (Federal ministry of environment and tourism, 2011). The evaluation for
the level of recycling in FBiH is based on the estimates of the Recycling Association of FBiH,
and data of the Foreign Trade Chamber on import-export of these raw materials according to
which the percentage of collected paper is 20-25 %, of plastic less than 1 %, aluminum over
60 %, and glass less than 1.5 % (Federal ministry of environment and tourism, 2010).
In FBiH the Ministry of Environment and Tourism is in charge of waste management issues,
while cantonal ministries for physical planning and the environment are responsible for the
development of cantonal waste management strategies, laws and regulations, issuing permits
to business companies for handling waste and monitoring. Municipalities are responsible for
STATE LEVEL BOSNIA AND HERZEGOVINA
Entity level Federation of Bosnia and
Herzegovina
(FBiH)
Republika Srpska
(RS)
District of Brčko
(DB)
Canton level 10 cantons No cantons No cantons
Municipality
level
84 municipalities
(Case 1 - Novi Grad municipality)
(Case 2 - Mostar municipality)
64
municipalities
No municipalities

18
the development of waste management plans and the organization of waste collection through
the establishment of municipal utility companies (private, public or private-public). Municipal
utility companies also set the fees and charges for waste collection and the municipalities
approve these rates. The average charge for waste collection for a household is €3.58 - €3.68
per month for a family living in a flat of 60 m2 (United Nations Economic Commission For
Europe, 2011). There is only one bill covering the full range of services (water supply,
wastewater disposal, heating and waste collection), which may not be itemized. Most landfills
operated by municipal utility companies, besides household waste, also accept old tires, waste
from demolition and construction, hazardous household waste, medical and animal waste.
Over the past years significant effort went into regulatory and legal aspects. Waste
management has benefited from international assistance and support e.g. the European Union
(EU), United Nations Development Program (UNDP), World Bank (WB) and some
individual countries. For instance, in 2003, a National Environmental Action Plan (NEAP)
was developed with the support of the WB’s, ministry officials, REC, scientists and NGOs
that covered ten thematic areas among which the waste aspect is described (National
Environmental Action Plan - NEAP, 2003) providing short and long term recommendations.
Along this line, similar action plans have been prepared for the cantons (Cantonal
Environmental Action Plan - KEAP) and municipalities (Local Environmental Action Plan -
LEAP). Another important document is the Solid Waste Management Strategy designed and
financed by the Government of FBiH and the WB in 2001. The Strategy aims to improve
solid waste management especially household waste in terms of: a) rehabilitation of existing
landfills; b) public awareness programs; c) introduction of waste collection into areas where it
does not yet exist; d) set-up approximately 16 regional landfills serving multiple
municipalities with transfer stations and e) recycling to be undertaken in the short term (3-7
years) and longer term (10-15 years). Later in 2003, the Law on Waste Management was put
into force with financial and technical support from the EU (European Bank, 2007). This law
gives general provisions for the management of municipal and other waste including
recycling. The objective of this law is ”to encourage and provide basic conditions for the
prevention of production, recycling and processing of waste for re-use, extraction of
secondary raw materials and possibly of energy and safe disposal”. The most recent and
important document at the Federal level is the Federal plan of waste management for 2011-
2016 which aims to establish an integral system of waste management, increase collection of
sorted waste, reuse and recycling practice, reduce amount of disposed waste, reduce negative
impacts on the environment and the human health.
19
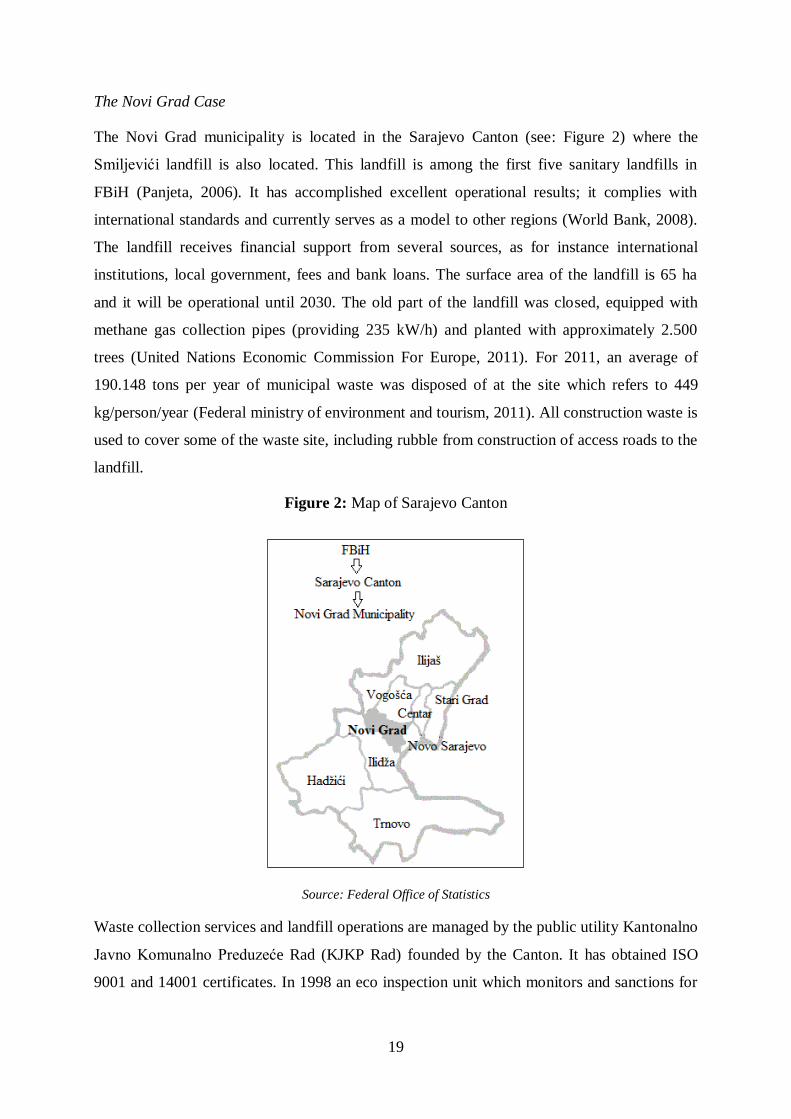
The Novi Grad Case
The Novi Grad municipality is located in the Sarajevo Canton (see: Figure 2) where the
Smiljevići landfill is also located. This landfill is among the first five sanitary landfills in
FBiH (Panjeta, 2006). It has accomplished excellent operational results; it complies with
international standards and currently serves as a model to other regions (World Bank, 2008).
The landfill receives financial support from several sources, as for instance international
institutions, local government, fees and bank loans. The surface area of the landfill is 65 ha
and it will be operational until 2030. The old part of the landfill was closed, equipped with
methane gas collection pipes (providing 235 kW/h) and planted with approximately 2.500
trees (United Nations Economic Commission For Europe, 2011). For 2011, an average of
190.148 tons per year of municipal waste was disposed of at the site which refers to 449
kg/person/year (Federal ministry of environment and tourism, 2011). All construction waste is
used to cover some of the waste site, including rubble from construction of access roads to the
landfill.
Figure 2: Map of Sarajevo Canton
Source: Federal Office of Statistics
Waste collection services and landfill operations are managed by the public utility Kantonalno
Javno Komunalno Preduzeće Rad (KJKP Rad) founded by the Canton. It has obtained ISO
9001 and 14001 certificates. In 1998 an eco inspection unit which monitors and sanctions for

20
illegal waste disposal was established within the KJKP Rad. Currently, there are about 35 eco-
inspectors working in 2 to 3 shifts covering the entire Sarajevo Canton (Đipa, 2005a).
In 2004 KJKP Rad commenced with the introduction of household recycling with a series of
recycling projects that still run. These are coordinated by the KJKP Rad and co-funded by
domestic organizations, e.g. Federal and Cantonal ministries, international institutions, e.g.
European Commission (EC), United States Agency for International Development (USAID),
United Nations Development Program (UNDP), Swedish International Development
Cooperation Agency (SIDA), and others. The first recycling projects were implemented in
Ilidža municipality and later extended to other locations such as Novi Grad, Novo Sarajevo,
Stari Grad, and others. There were 41 locations with 123 separated containers, with 240 liters
of volume (Cantonal Environmental Action Plan - KEAP, 2010). These projects entailed the
introduction of recycling infrastructure as are containers for paper and cardboard, for
polyethylene terephthalate (PET) packaging and for cans, but also specialized vehicles for
collecting recyclable materials and a waste sorting station for the landfill (Kantonalno
ministarstvo prostornog uređenja i zaštita okoliša, 2009). The KJKP Rad chose a recycling
method that involves a two step-procedure. In a first step sorting is done at the source and
includes households, schools, institutions and companies who are asked to of dispose waste
into different containers. Then, in a second step, further sorting is done at the landfill e.g.
paper and cardboard, hard plastics (PET, HDPE - high density polyethylene) and PP
(polypropylene) packaging, metals and other types of waste (Panjeta, 2006). During an
interview with the head of the Smiljevići landfill we were informed that the annual amount of
waste sorted within the Novi Grad and in other Sarajevo’s municipalities (e.g. Novo Sarajevo,
Stari Grad etc.) is approximately 1000 tons of paper and cardboard, 15 tons of PET
packaging, 60 tons of polyvinyl chloride (PVC) plastic. Glass is not sorted. After sorting,
bailing and pressing in cubes, sorted materials are sent to the recycling companies located
within BiH (European Commission, 2004).
In Novi Grad, in addition to the recycling infrastructural projects, there were further activities
as are public awareness campaigns as summarized in Table 3. These aimed to inform and to
motivate residents and students to participate in the recycling activities.
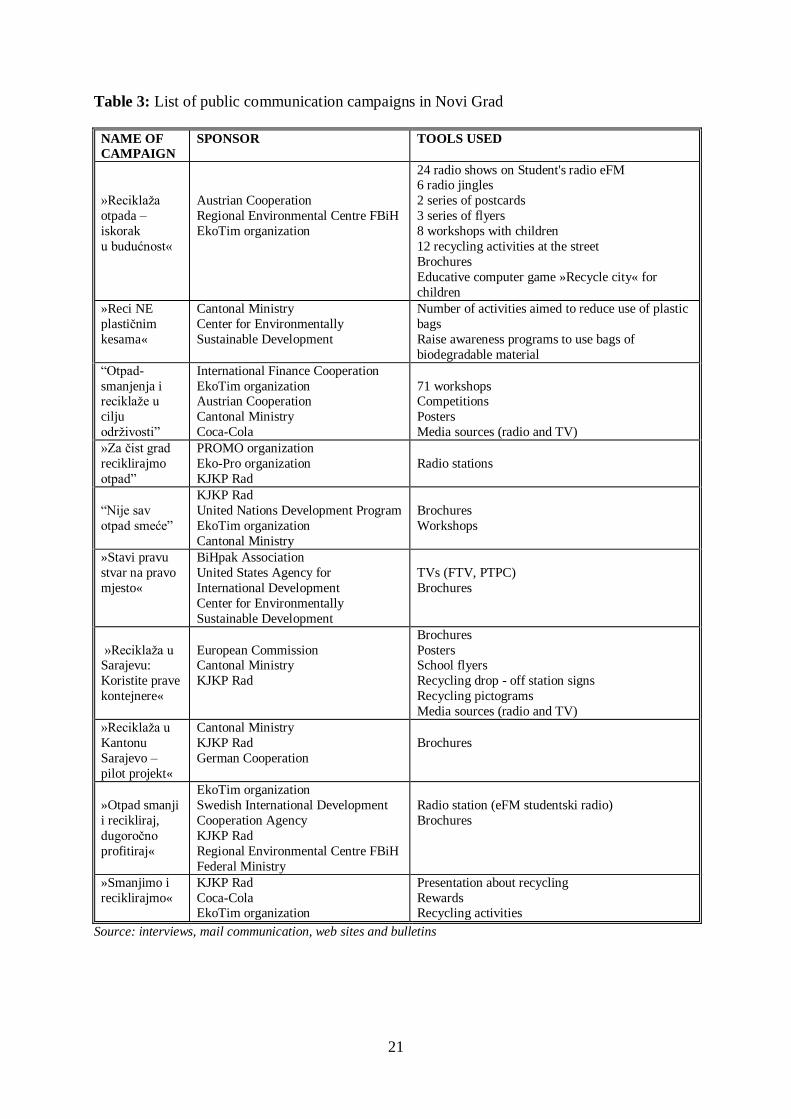
21
Table 3: List of public communication campaigns in Novi Grad
NAME OF
CAMPAIGN
SPONSOR TOOLS USED
»Reciklaža
otpada –
iskorak
u budućnost«
Austrian Cooperation
Regional Environmental Centre FBiH
EkoTim organization
24 radio shows on Student's radio eFM 6 radio jingles
2 series of postcards
3 series of flyers
8 workshops with children
12 recycling activities at the street
Brochures
Educative computer game »Recycle city« for
children
»Reci NE
plastičnim
kesama«
Cantonal Ministry
Center for Environmentally
Sustainable Development
Number of activities aimed to reduce use of plastic
bags
Raise awareness programs to use bags of
biodegradable material
“Otpad-
smanjenja i reciklaže u
cilju
održivosti”
International Finance Cooperation
EkoTim organization Austrian Cooperation
Cantonal Ministry
Coca-Cola
71 workshops Competitions
Posters
Media sources (radio and TV)
»Za čist grad
reciklirajmo
otpad”
PROMO organization
Eko-Pro organization
KJKP Rad
Radio stations
“Nije sav
otpad smeće”
KJKP Rad
United Nations Development Program
EkoTim organization
Cantonal Ministry
Brochures
Workshops
»Stavi pravu
stvar na pravo
mjesto«
BiHpak Association
United States Agency for
International Development
Center for Environmentally
Sustainable Development
TVs (FTV, PTPC)
Brochures
»Reciklaža u Sarajevu:
Koristite prave
kontejnere«
European Commission Cantonal Ministry
KJKP Rad
Brochures
Posters School flyers
Recycling drop - off station signs
Recycling pictograms
Media sources (radio and TV)
»Reciklaža u
Kantonu
Sarajevo –
pilot projekt«
Cantonal Ministry
KJKP Rad
German Cooperation
Brochures
»Otpad smanji
i recikliraj,
dugoročno
profitiraj«
EkoTim organization
Swedish International Development
Cooperation Agency
KJKP Rad
Regional Environmental Centre FBiH
Federal Ministry
Radio station (eFM studentski radio)
Brochures
»Smanjimo i
reciklirajmo«
KJKP Rad
Coca-Cola EkoTim organization
Presentation about recycling
Rewards Recycling activities
Source: interviews, mail communication, web sites and bulletins

22
The Mostar Case
The second case is the Mostar municipality which is located in the Herzegovina - Neretva
Canton (HNK) (see: Figure 3). Similarly to what occurred at the state level Mostar was also
sliced down into territorial units, each containing an ethnic group. The DPA confirmed the
Interim Statute of the City of Mostar (1996) and gave legal grounds for the establishment of
public institutions, in the attempt to normalize living conditions and relationships between
Croats and Bosniacs and upon ethnic criteria divided Mostar in seven city units (see: Figure
4). The Interim Statute foresees that six city units (three Bosniacs on the East side and three
Croats on the West side) act solely and administer natural, economic, social and other
resources serving “their own people” (Commission for Reforming the City of Mostar, 2003),
while the seventh unit also known as the “Central Zone” is administration by a council with
representatives from both ethnic groups (Klemencic and Schofield, 1996). The reasons for
having the Central Zone are essentially economic since it is the traditional economic core of
the city, where local government was located and tourism was flourishing.
Figure 3: Map of Herzegovina – Neretva Canton
Source: Federal Office for Statistics

23
At present the city has only one landfill which shall be upgraded to a sanitary landfill. The
Uborak landfill has 20 ha and will operate for next 1 to 2 years. It receives 84.400 tons of
municipal waste annually which refers to 374 kg/person/year (Federal ministry of
environment and tourism, 2011). The landfill accepts different types of waste such as hospital,
animal and industrial. Since the 1996, the landfill includes a disposal site, incinerators and a
small sorting station (with hydraulic press) where materials are manually sorted. During an
interview with the head of the Uborak landfill we were informed that the amount of collected
materials is approximately 260 tons of cardboard, 13 tons of hard plastics, 8.5 tons of other
plastics, 60 tons of metal, 60 tons of rubber and 360 tons of other industrial waste.
Figure 4: Map of seven units in Mostar
Source: Commission for Reforming the City of Mostar
Tensions that have divided the city, and the country, have implications also in regard to
municipal solid waste (MSW) management. At present waste collection and transportation are
managed by two utility companies (75% of Mostar): Javno Preduzeće (JP) Parkovi and Javno
Preduzeće (JP) Komos. JP Parkovi covers the West – Croat side where there is no sanitary
landfill. On the other hand, JP Komos, which is the owner of the Uborak landfill, operates on
the East – Bosniac side (World Bank, 2008). The presence of two utility companies that run
activities in parallel is ineffective and creates additional fractures. For this reason there are
efforts by public authorities to form a new waste management company, JP Deponija, under
which the two can be unified and work more efficiently covering the entire Mostar territory.
These efforts include negotiation for access to financial support from international
institutions, setting up one budget for waste service and improvement of landfill maintenance.
Currently neither of the two companies is involved in an official recycling program. There are
neither public communication campaigns nor efforts to educate and inform the residents about
24
the social and the environmental aspects of recycling. However, due to space constrains that
the Uborak landfill is facing some sorting takes place on-site with the aim to reduce waste
volume.
3.4 Conclusions
This chapter provides a brief review of the methodology used. It also gives a short description
of our two cases needed to better understand the situations regarding waste management.
These two cases are further analyzed in the following two chapters with the support of
qualitative and quantitative data.

25
4 RESULTS AND DISCUSSION OF QUALITATIVE DATA
This chapter presents and discusses interview data collected in the two cases. The aim here is
to map out opinions different respondents’ groups have towards waste management in general
and recycling in particular. Interview data served for the identification of motivational factors
(research objective 1) and concerns (research objective 2), and for a preliminary overview of
attitudes (research objective 3) that were further explored with a second quantitative step
reported in Chapter 5. Information on qualitative data collection procedures was already given
in Chapter 3.
In the following respondents’ attitudes toward recycling are presented (Section 4.1.), then
respondents’ concerns with regards to recycling are introduced (Section 4.2.) followed by the
motivational factors that respondents regard to be supporting their recycling practice (Section
4.3.). Section 4.4 gives concluding remarks.
4.1 Respondents’ attitudes towards recycling
The Novi Grad case
Since 1995, domestic organizations (e.g. utility company, ministries) have been engaged in
the reconstruction of the waste management system benefiting from technical and financial
support provided by international organizations. Most of our respondents had a positive
opinion about this type of joint engagement in waste management and have referred to the
recycling projects implemented by the KJKP Rad. Several responders identified that these
recycling projects served well and succeed in introducing recycling practices at the household
level in Novi Grad. Projects were backed up by communication campaigns that informed the
public and began to raise awareness about the topic. “Within the recycling projects,
campaigns were conducted as well. These included the introduction of containers for waste
separation, posters and brochures with instructions to the public. Also there were several
specialized vehicles with promotional labels “My clean Sarajevo” and “Separate and collect
waste”. Few NGOs and the utility company had done several activities achieving the good
results“ (Local resident).
Respondents frequently pointed to the utility company as having a dynamic role, which was
also noticeable from the detailed information on the many activities given in their annual
reports (accessible in print and digital form). The KJKP Rad collaborates successfully with
the canton and the municipality in the implementation of the regional and local decrees. It
26
provides easy access to information on waste management and recycling for the residents
through the media sources. Respondents from the group NGOs, emphasized that KJKP Rad is
involved in educational activities where children are invited to participate in competitions on
recycling (Đipa, 2005b). KJKP Rad offers training to their own employees on environmental
standards, on solid waste treatment, on waste recycling and other issues (Đipa, 2006a; 2006b
and 2006c). For instance, they publish two to three bulletins annually and provide a free
phone number (eco phone) where citizens can call eco-inspection in order to report improper
waste disposal practices. “Eco inspection intervenes quickly when somebody disposes waste
inappropriately. For example, in the community where I live, someone disposed a bulky
waste. One person called the eco-inspection and they came fast, found the responsible and
gave him a sanction” (Local resident).
Respondents from the group national institutions commented that the landfill “Smiljevići” has
high technical standards and is effective in waste treatment capacity. The landfill was
frequently mentioned as a good practice case to be replicated across other regions in FBiH.
However, this is not shared by all of our respondents since some have pointed that it does not
have sufficient capacity for managing all the different types of waste entering it, as at current
is struggling with industrial (e.g. from different factories, mills, mines), medical (e.g. body
parts, pharmaceuticals, chemicals, radioactive materials) and animal waste (e.g. animal
manure, body parts). These respondents indicated that more expert knowledge and technical
support is needed. “Currently, all wastes are collected and disposed at the landfill by the
KJKP Rad. When we find the company, location and people to manage certain waste and
perform adequate treatments, it will be much easier for us” (Local institution). There are four
solutions to this: 1) to establish disposal sites for mentioned types of waste; 2) to introduce
mechanisms for their adequate treatment (e.g. recycling, composting facility, and facility with
incinerators); 3) to require support from the Fund of the Environmental Protection (public
institution established in 2003) whose goal is to incitement and finance such activities that
improve the current state of environment, but also require support from the ministries (Federal
and Cantonal), the municipality, the EU and the UN funds; and 4) to develop network of all
existing small and big companies/institutions that generate these types of waste and
companies that can provide proper waste collection, transportation and treatment.

27
The Mostar case
Since the war, Mostar has been characterized by a territorial division between two ethnical
groups and many of our respondents commented on the influence this division has, e.g. on the
organizational structure of public institutions, inclusive of the utility company (ethnical
division is detailed in: International Crisis Group, 2009). Respondents commented on the
difficulties the two companies have in waste management, which hinders the possibility of
introducing recycling. Both utility companies perform poorly in keeping the public areas
clean and in maintaining the landfill in good condition. Respondents, from the group
residents, commented that waste collection and transportation is irregular; areas around
containers are left filthy; containers are insufficient for the current needs; and most of the
public green areas are littered. This last emerged as of a particular concern as frequently there
are long periods when waste is not collected (e.g. within 15 to 20 days). When this occurs in
summer it generates odor and attracts animals, while when it occurs in autumn waste gets
propelled across the city by the wind. Both situations have been identified as problematic
since are bringing further negativity to the city image and creating a loss in the tourist sector,
which was once at the core of the local economy.
One of the reasons for infrequent waste collection is a lack of financial resources needed to
support the service function. Financial shortcomings are an issue for both companies which
experience infrequent payments from the City Council (Gakovic, 2010; Smajkic, 2010) and
irregular fee payments from residents and business. For instance, in 2001 there were 1800
cases of notification for lack of payment against households and business enterprises and only
21% of the total expected amount was paid in 2003 (Calò and Parise, 2009). Financial
shortcomings have implications for waste equipment (e.g. vehicles and containers), for
landfill maintenance, but also are pressing on the working conditions which resulted in
protests and strikes by the employees (Medic, 2010; Becic, 2010). Respondents pointed out
that the Uborak landfill does not have proper infrastructure or adequate waste management
methods: it is a temporary disposal facility with poor disposal conditions (e.g. access of birds,
fences full of plastic waste). The landfill has already fulfilled its space capacity and this
seemed to be a source of concern to our respondents. However, respondents were mostly
unaware about the current plans to develop the second landfill site Deponija. There are five
possibilities in terms of improving the current situation: 1) to notify citizens about the old and
new landfill through media sources in order to overcome their concerns and give them some
kind of happiness; 2) to engage all stakeholders (e.g. City Council, both utility companies and

28
other institutions) in solving the financial shortcomings for the utility companies; 3) to
provide training and workshops on proper waste management for the employees in the utility
companies (e.g. waste collection and transportation); 4) to properly close landfill Uborak,
when necessary, make plans for its future monitoring and maintenance and propose the end
use of property after closure and 5) to clarify and make decision regarding ownership of the
regional landfill.
Mostar does not have a formal recycling program; however, some tentative attempts were
noticed at the landfill where waste is manually sorted by the personnel and sold. Yet,
interview data revealed that there is a lively informal sector of waste collectors and waste
pickers in Mostar as well as private companies placing their own paper containers.
Respondents informed us that waste picking is done by the Roma people who are settled in
the area but also by other local residents. In contrast to other geographical regions, where the
Roma communities are engaged in the collection of metal (Stoykova, 2006), in Mostar they
collect plastic waste. Also, the local residents collect plastic waste, which is brought to the
recycling pay-back centers in the neighboring Croatia and redeemed for monetary
compensation. Both groups have recognized the economic potential for recycling and took the
advantage of being able to commute to Croatia and redeem plastic waste. “The most positive
step in recycling is the engagement of Roma people, only environmentalists who collect
plastic bottles and in return get some money back. They pick plastic bottles from containers
and place them on their small vehicles every day. Even some individuals collect their own
plastic bottles at home and take them to the pay-back centers in Croatia” (Private company).
Wilson et al. (2009) gave an account of issues that surround the informal sector in developing
countries where waste pickers are often marginalized and stigmatized despite that they
contribute substantial to waste management cost reduction. This is, to a certain extent, valid
also in our case. The Roma are a marginalized community with integration problems. Their
contribution is not recognized and some would look with suspicion at the activities Roma
undertake. Respondents complained that in searching for plastic bottles inside containers the
Roma would frequently leave the area around containers filthy and might not be attentive
towards the public good. Hence, the way they are currently engaged in waste collection
contributes to reinforce pre-existing stereotypes about this community. It follows from this
that given a lack of organized formal recycling programs the informal sector may hold some
valuable potential and, under adequate guidance in how to best engage in waste-picking, could
more substantially contribute to recycling in Mostar.
29
4.2 Current issues with recycling
The Novi Grad case
Several of our respondents indicated that an issue here is a poor understanding of the
economic opportunities a recycling system could offer by the service providers. This type of
awareness respondents show is the result of seeing the neighboring Croat experience with
pay-back centers, as most of the respondents were aware of the Croat system and regard it as
being a positive example for plastic waste management. For instance respondents from the
group, NGOs, indicated that the KJKP Rad could form an ambient for plastic waste recycling.
Secondary data inform us that in Croatia since 2005 about 90% packaging waste was
collected, separated and reused (Rujnić-Sokele et al., 2008), which suggests that pay-back
centers are serving their purpose well. This is a measure that works well in Croatia and could
be further explored for implementation in FBiH; to integrate adequate incentives such as taxes
on products purchased (e.g. plastic bags) and subsidies for customers and
companies/institutions who return packages to the store (e.g. plastic bottles) or pay-back
centers. To establish pay-back centers, the Fund for Environmental Protection might provide
financial support together with ministries (Federal or Cantonal), several municipalities, the
EU and the UN funds. Also, environmental, social and economic aspects i.e. benefits from
developing such institutions, should be taken into consideration. Some respondents from the
group residents expressed the opinion that pay-back centers could boost motivation for a more
scrupulous recycling in this community. Certainly there are challenges with the introduction
of this method which among others include the uncertainty of having regular public
participation, but to this end collaboration with NGOs could be valuable as these are already
doing information campaigns and awareness raising programs.
A second issue that emerged from our interviews was that some respondents from the group
local residents claimed that the utility company occasionally does inappropriate waste
collection as waste, disposed in different containers, and is then collected entirely into one
truck. These respondents reported of having seen it occurring and commented that this upsets
them since all the effort invested in separating waste at their homes was lost when waste is
mixed up again. Interview data suggest that when respondents witness inappropriate
collection practices, heard about this procedure from family or friends, or suspect that this
occurs, it strongly challenges their motivation to maintain the recycling practice. Also, it
decreases trust levels toward the recycling system and lowers reliability of KJKP Rad in the
eyes of the local inhabits. When asked about this circumstance a respondent from the group

30
local institutions, replied that such a practice does not occur and clarified: “Our workers
employed at the landfill are trained. They wear uniforms and work from 7am until 2pm every
day and in this period separated waste is brought by the specialized vehicles to the landfill.
Our employees don’t mix sorted and regular wastes. We have blue, yellow and classic
containers. Materials sorted in blue containers are picked once in 10 days, for yellow once in
15 days and for classic containers even more frequent. Aluminum cans, plastic bottles, bags,
newspapers, cardboards and other wastes are sorted. Based on the waste amount, we decide
where to transport and whom to sell it” (Local institution).
Unfortunately, due to time and resource constrains we were not in a position to undertake
triangulation with observational data and obtain additional detail on this particular aspect for
which reason cannot give further comment on waste collection practices in Novi Grad. Here
we can only report on the influence this has on respondents’ perception of recycling and in
our case respondents with such a position seem to have developed a negative perception of the
recycling system. Research has already commented how negative experience/opinion
influences household recycling performance and suggested that awareness raising and
communication campaigns can offer some valuable help (De Feo and De Gisi, 2010). Studies
that commented on similar instances highlight the importance of feedback mechanisms.
Timlett and Williams (2008; p. 632) suggests that “a two way communication could do well;
let people know how they are doing, where they are going wrong and ensure that their efforts
are appreciated”. However, for feedback to be effective it needs to be regular, incremental,
well communicated, monitored and reinforced.
The Mostar case
A main issue in Mostar appears to be poor collaboration and communication between the two
utility companies, which results in an ineffective and inefficient public service. This tension is
of concern also to international institutions which in 1995 have documented a specific set of
conditions the two utility companies need to fulfill in order to obtain a loan. One of the
conditions was to merge under a third utility company, JP Komunalno which would operate
across the entire municipality. However, Komos and Parkovi encountered financial
difficulties due to insufficient financial support from the City Council and irregular payment
of fees and were not able to fulfill the condition. Over the last six years the two companies
have been under bankruptcy and operated poorly with negative implications for the local
population. Respondents indicated that after this poor collaboration between the two resulted
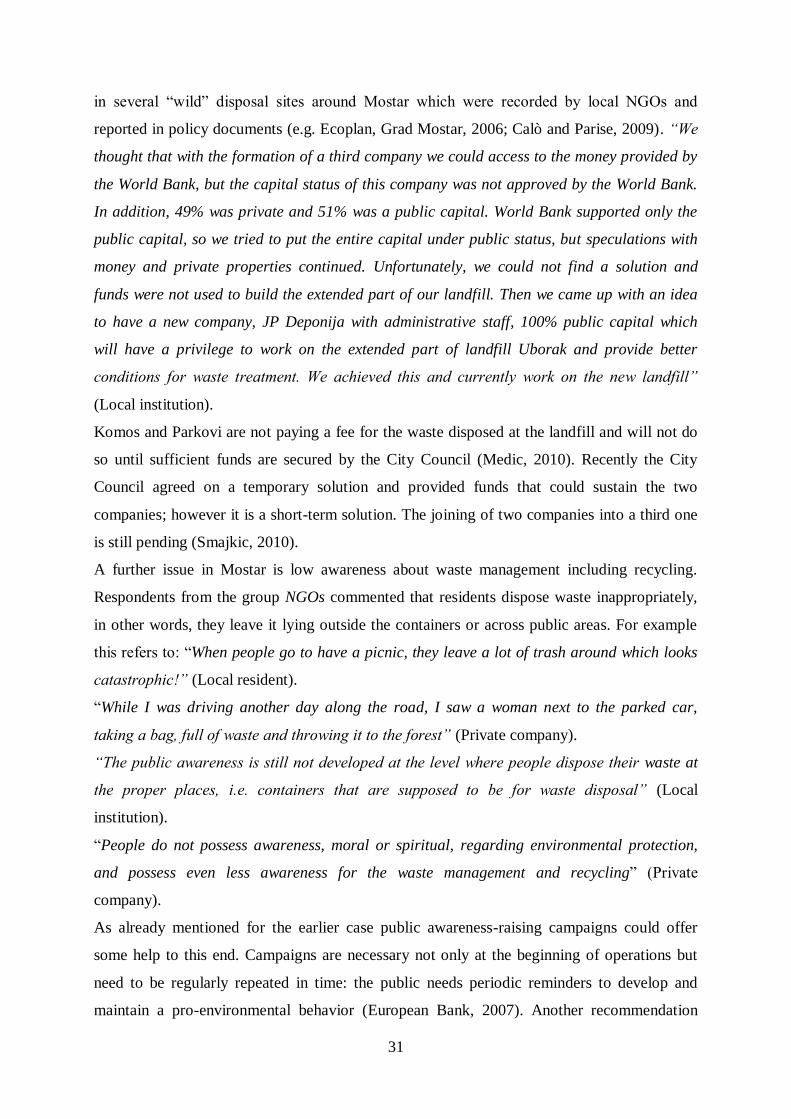
31
in several “wild” disposal sites around Mostar which were recorded by local NGOs and
reported in policy documents (e.g. Ecoplan, Grad Mostar, 2006; Calò and Parise, 2009). “We
thought that with the formation of a third company we could access to the money provided by
the World Bank, but the capital status of this company was not approved by the World Bank.
In addition, 49% was private and 51% was a public capital. World Bank supported only the
public capital, so we tried to put the entire capital under public status, but speculations with
money and private properties continued. Unfortunately, we could not find a solution and
funds were not used to build the extended part of our landfill. Then we came up with an idea
to have a new company, JP Deponija with administrative staff, 100% public capital which
will have a privilege to work on the extended part of landfill Uborak and provide better
conditions for waste treatment. We achieved this and currently work on the new landfill”
(Local institution).
Komos and Parkovi are not paying a fee for the waste disposed at the landfill and will not do
so until sufficient funds are secured by the City Council (Medic, 2010). Recently the City
Council agreed on a temporary solution and provided funds that could sustain the two
companies; however it is a short-term solution. The joining of two companies into a third one
is still pending (Smajkic, 2010).
A further issue in Mostar is low awareness about waste management including recycling.
Respondents from the group NGOs commented that residents dispose waste inappropriately,
in other words, they leave it lying outside the containers or across public areas. For example
this refers to: “When people go to have a picnic, they leave a lot of trash around which looks
catastrophic!” (Local resident).
“While I was driving another day along the road, I saw a woman next to the parked car,
taking a bag, full of waste and throwing it to the forest” (Private company).
“The public awareness is still not developed at the level where people dispose their waste at
the proper places, i.e. containers that are supposed to be for waste disposal” (Local
institution).
“People do not possess awareness, moral or spiritual, regarding environmental protection,
and possess even less awareness for the waste management and recycling” (Private
company).
As already mentioned for the earlier case public awareness-raising campaigns could offer
some help to this end. Campaigns are necessary not only at the beginning of operations but
need to be regularly repeated in time: the public needs periodic reminders to develop and
maintain a pro-environmental behavior (European Bank, 2007). Another recommendation

32
could be a set of sanctions for improper behavior and functional eco-inspection as was done in
Novi Grad municipality.
4.3 Identification of motivational factors
The Novi Grad case
As introduced in Chapter 2, the literature recognizes intrinsic and extrinsic motivational
factors. Interview data indicate for the presence of both. In this, respondents have most
frequently mentioned general satisfaction (i.e. participating in a program that seems to help
the community and the nation) and least frequently mentioned personal satisfaction (i.e.
feeling that actions count and are worthwhile) as intrinsic factors. Respondents from the group
residents reported that they are motivated to recycle in order to contribute to environmental
protection (example: reduces the waste amount and saves natural resources). This is very
much in line with the studies by Hopper and Nielson (1991) and by McDonald and Ball
(1998). However, some respondents reported on inadequate practices and told to feel
“betrayed” by the utility company. Respondents reported of having witnessed inappropriate
waste collection practices and commented that after all, sorting waste in their homes does not
make sense since it all ends up mixed. This has an influence on their personal satisfaction and
also it seems to discourage them from waste separation and recycling. As mentioned
previously in Section 4.2, no further observational data were undertaken however, feedback
on waste collection and landfill operations from utility company should be provided to the
residents in order to encourage them to continue recycling.
On the other hand, interview data suggest that in Novi Grad respondents are motivated also by
several extrinsic factors, for instance:
a) PCCs; “Watching, reading or listening about recycling motivate me to be informed, to gain
a feedback and be a part of recycling practice in my community” (Local resident). As
McDonald and Ball (1998) mentioned PCCs are important in providing motivation and
reinforcing positive recycling behavior.
b) Rewards and sanctions; “If you provide people some kind of reward for what they do, they
start to appreciate it more to do such thing again. On the other hand, having sanctions always
help to decrease improper recycling behavior” (Local resident).
c) Establishment of pay-back centers; “For returning the recyclables to the pay-back centers
would certainly motivates me in order to earn some cash” (Local resident).
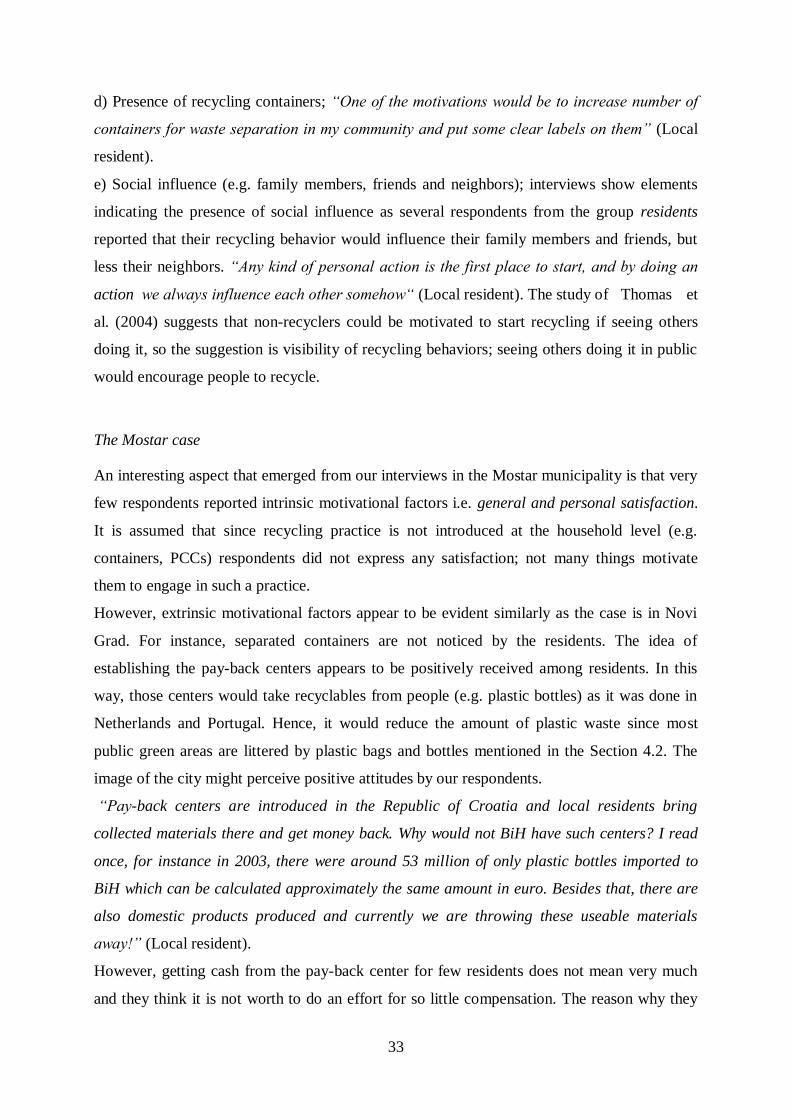
33
d) Presence of recycling containers; “One of the motivations would be to increase number of
containers for waste separation in my community and put some clear labels on them” (Local
resident).
e) Social influence (e.g. family members, friends and neighbors); interviews show elements
indicating the presence of social influence as several respondents from the group residents
reported that their recycling behavior would influence their family members and friends, but
less their neighbors. “Any kind of personal action is the first place to start, and by doing an
action we always influence each other somehow“ (Local resident). The study of Thomas et
al. (2004) suggests that non-recyclers could be motivated to start recycling if seeing others
doing it, so the suggestion is visibility of recycling behaviors; seeing others doing it in public
would encourage people to recycle.
The Mostar case
An interesting aspect that emerged from our interviews in the Mostar municipality is that very
few respondents reported intrinsic motivational factors i.e. general and personal satisfaction.
It is assumed that since recycling practice is not introduced at the household level (e.g.
containers, PCCs) respondents did not express any satisfaction; not many things motivate
them to engage in such a practice.
However, extrinsic motivational factors appear to be evident similarly as the case is in Novi
Grad. For instance, separated containers are not noticed by the residents. The idea of
establishing the pay-back centers appears to be positively received among residents. In this
way, those centers would take recyclables from people (e.g. plastic bottles) as it was done in
Netherlands and Portugal. Hence, it would reduce the amount of plastic waste since most
public green areas are littered by plastic bags and bottles mentioned in the Section 4.2. The
image of the city might perceive positive attitudes by our respondents.
“Pay-back centers are introduced in the Republic of Croatia and local residents bring
collected materials there and get money back. Why would not BiH have such centers? I read
once, for instance in 2003, there were around 53 million of only plastic bottles imported to
BiH which can be calculated approximately the same amount in euro. Besides that, there are
also domestic products produced and currently we are throwing these useable materials
away!” (Local resident).
However, getting cash from the pay-back center for few residents does not mean very much
and they think it is not worth to do an effort for so little compensation. The reason why they
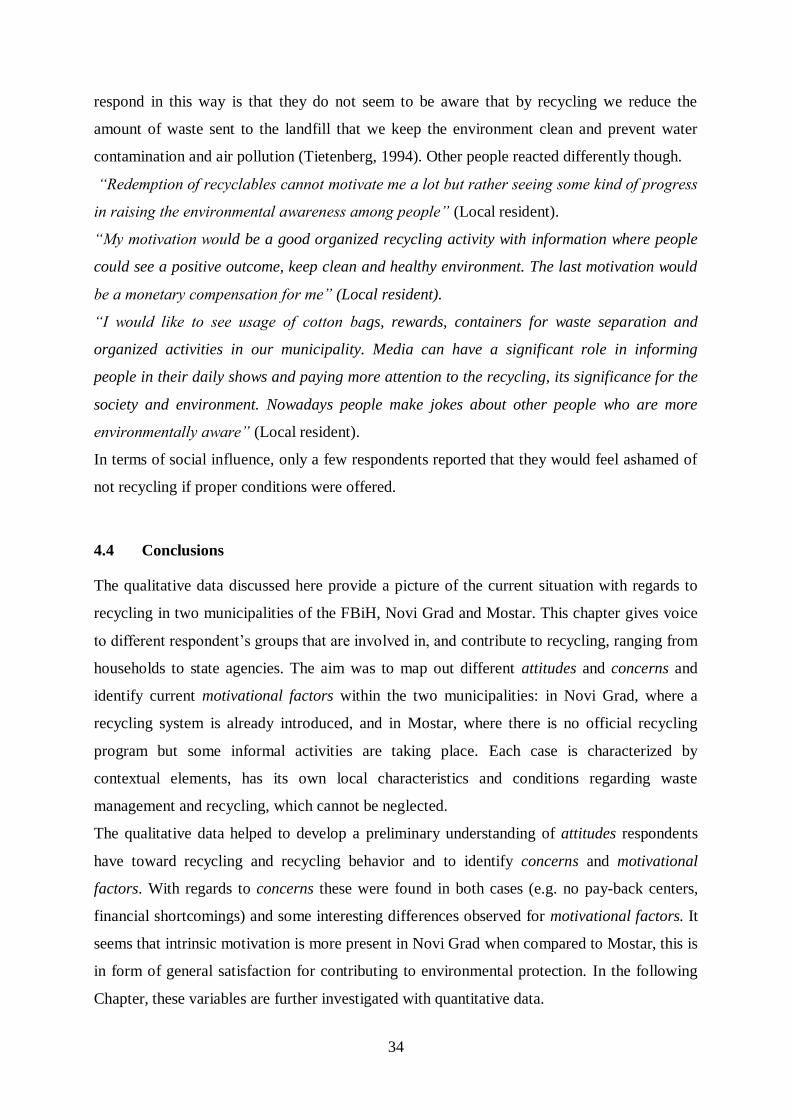
34
respond in this way is that they do not seem to be aware that by recycling we reduce the
amount of waste sent to the landfill that we keep the environment clean and prevent water
contamination and air pollution (Tietenberg, 1994). Other people reacted differently though.
“Redemption of recyclables cannot motivate me a lot but rather seeing some kind of progress
in raising the environmental awareness among people” (Local resident).
“My motivation would be a good organized recycling activity with information where people
could see a positive outcome, keep clean and healthy environment. The last motivation would
be a monetary compensation for me” (Local resident).
“I would like to see usage of cotton bags, rewards, containers for waste separation and
organized activities in our municipality. Media can have a significant role in informing
people in their daily shows and paying more attention to the recycling, its significance for the
society and environment. Nowadays people make jokes about other people who are more
environmentally aware” (Local resident).
In terms of social influence, only a few respondents reported that they would feel ashamed of
not recycling if proper conditions were offered.
4.4 Conclusions
The qualitative data discussed here provide a picture of the current situation with regards to
recycling in two municipalities of the FBiH, Novi Grad and Mostar. This chapter gives voice
to different respondent’s groups that are involved in, and contribute to recycling, ranging from
households to state agencies. The aim was to map out different attitudes and concerns and
identify current motivational factors within the two municipalities: in Novi Grad, where a
recycling system is already introduced, and in Mostar, where there is no official recycling
program but some informal activities are taking place. Each case is characterized by
contextual elements, has its own local characteristics and conditions regarding waste
management and recycling, which cannot be neglected.
The qualitative data helped to develop a preliminary understanding of attitudes respondents
have toward recycling and recycling behavior and to identify concerns and motivational
factors. With regards to concerns these were found in both cases (e.g. no pay-back centers,
financial shortcomings) and some interesting differences observed for motivational factors. It
seems that intrinsic motivation is more present in Novi Grad when compared to Mostar, this is
in form of general satisfaction for contributing to environmental protection. In the following
Chapter, these variables are further investigated with quantitative data.

35
5 RESULTS AND DISCUSSION FROM QUANTITATIVE DATA
This chapter discusses quantitative data collected with a questionnaire. First, the demographic
characteristics of the sample are presented (Section 5.1.), then waste disposal and separation
data are discussed (Section 5.2.), followed by data on motivational factors (Section 5.3.), on
concerns (Section 5.4.), on attitudes (Section 5.5.), on knowledge (Section 5.6.), and PCCs in
relation to knowledge and attitudes (Section 5.7.). The part of the questionnaire addressing
questions on concerns, motivations and attitudes, consists of close-ended questions with
answers ranging on a Likert scale (1 for ‘do not agree at all’ and 5 for ‘agree very much’)
while answers for knowledge and PCCs questions were “yes”, “no” and “do not know”. Data
analyses include descriptive analysis, Pearson’s correlation, reliability and independent t-test.
5.1 Demographic data of the sample
Gender. In Mostar sample, there are 48 males (45.5%) and 58 females (54.5%) while in Novi
Grad sample, there are 59 males (53.6%) and 51 females (46.4%) in the sample giving the
total of 216 respondents in both cases. It is observed that Mostar sample has higher percent of
females and lower percent of males than Novi Grad sample.
Age. Figure 5 shows each case with age range (18-29; 29-39; 40-50; 51-61 and 62+)
expressed in percentages (%). Novi Grad has a larger percentages of respondents aged
between 18 and 28 (22.73%) and those aged 62+ (20%) as compared to Mostar (18-28=20%
and 62+=19.09%). However, a difference in ages between the two cases does not vary much.
Figure 5: Age range expressed in percentages
Residence. Figure 6 shows residency status. In the Mostar sample, few respondents moved
from rural areas e.g. Rodoč, Selo and Domanovići to Mostar while respondents in Novi Grad
did not report any. In addition, reported urban places from which respondents moved to
Mostar are Gornji Vakuf, Sarajevo, Prozor, Bugojno, Tuzla, Čapljina and Jablanica while
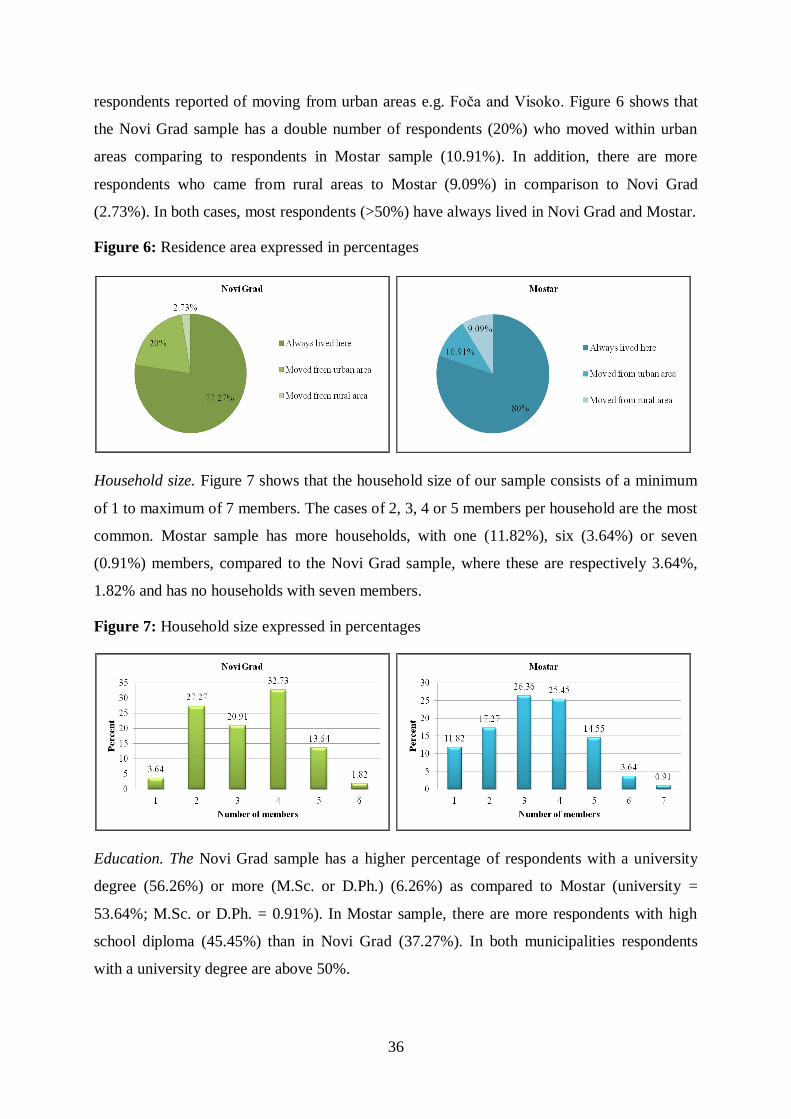
36
respondents reported of moving from urban areas e.g. Foča and Visoko. Figure 6 shows that
the Novi Grad sample has a double number of respondents (20%) who moved within urban
areas comparing to respondents in Mostar sample (10.91%). In addition, there are more
respondents who came from rural areas to Mostar (9.09%) in comparison to Novi Grad
(2.73%). In both cases, most respondents (>50%) have always lived in Novi Grad and Mostar.
Figure 6: Residence area expressed in percentages
Household size. Figure 7 shows that the household size of our sample consists of a minimum
of 1 to maximum of 7 members. The cases of 2, 3, 4 or 5 members per household are the most
common. Mostar sample has more households, with one (11.82%), six (3.64%) or seven
(0.91%) members, compared to the Novi Grad sample, where these are respectively 3.64%,
1.82% and has no households with seven members.
Figure 7: Household size expressed in percentages
Education. The Novi Grad sample has a higher percentage of respondents with a university
degree (56.26%) or more (M.Sc. or D.Ph.) (6.26%) as compared to Mostar (university =
53.64%; M.Sc. or D.Ph. = 0.91%). In Mostar sample, there are more respondents with high
school diploma (45.45%) than in Novi Grad (37.27%). In both municipalities respondents
with a university degree are above 50%.
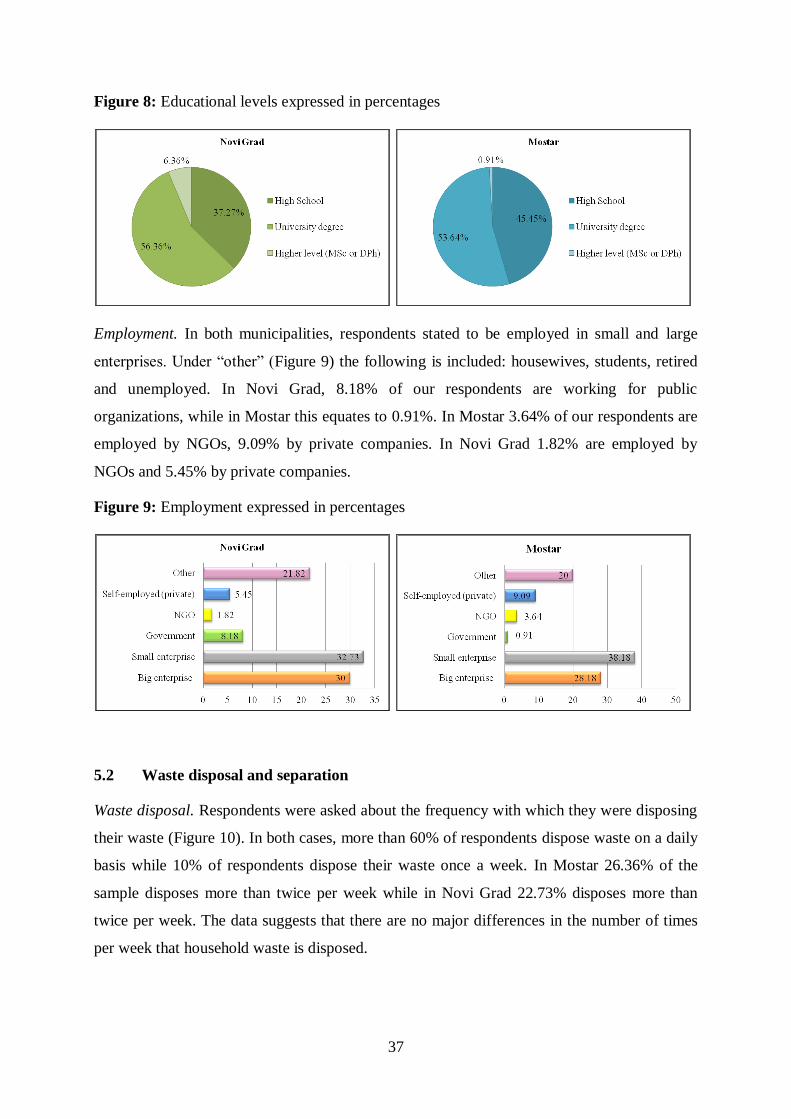
37
Figure 8: Educational levels expressed in percentages
Employment. In both municipalities, respondents stated to be employed in small and large
enterprises. Under “other” (Figure 9) the following is included: housewives, students, retired
and unemployed. In Novi Grad, 8.18% of our respondents are working for public
organizations, while in Mostar this equates to 0.91%. In Mostar 3.64% of our respondents are
employed by NGOs, 9.09% by private companies. In Novi Grad 1.82% are employed by
NGOs and 5.45% by private companies.
Figure 9: Employment expressed in percentages
5.2 Waste disposal and separation
Waste disposal. Respondents were asked about the frequency with which they were disposing
their waste (Figure 10). In both cases, more than 60% of respondents dispose waste on a daily
basis while 10% of respondents dispose their waste once a week. In Mostar 26.36% of the
sample disposes more than twice per week while in Novi Grad 22.73% disposes more than
twice per week. The data suggests that there are no major differences in the number of times
per week that household waste is disposed.
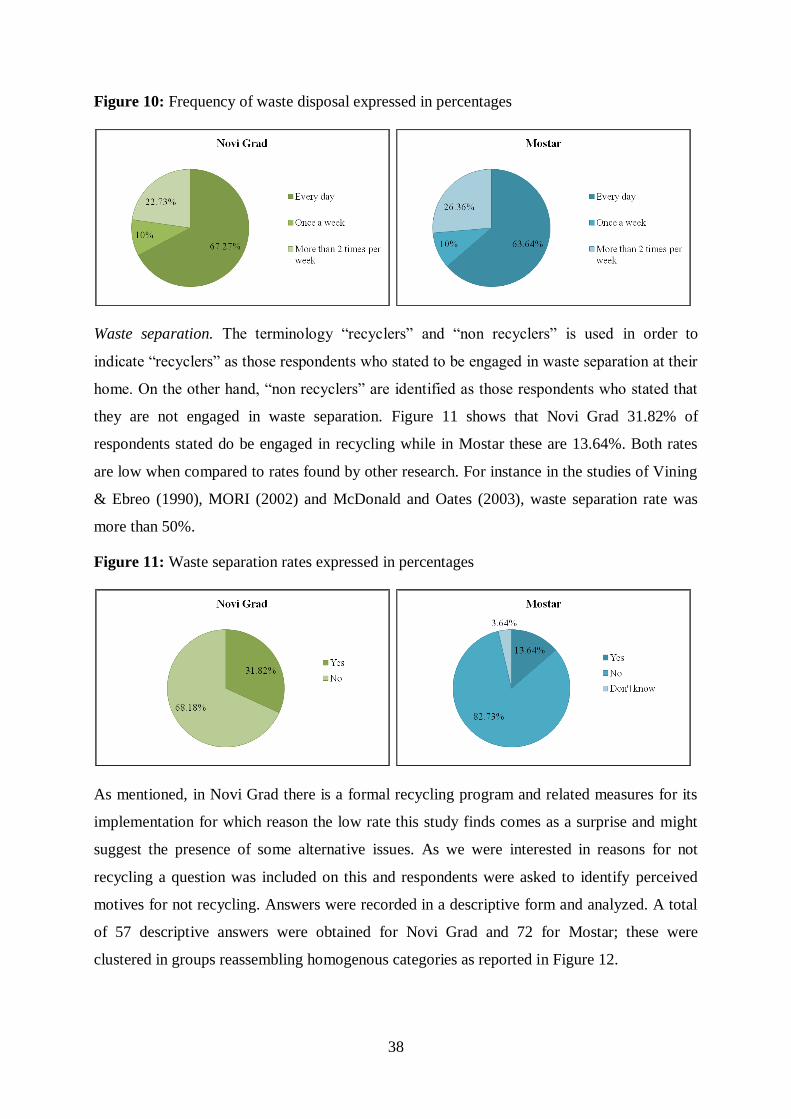
38
Figure 10: Frequency of waste disposal expressed in percentages
Waste separation. The terminology “recyclers” and “non recyclers” is used in order to
indicate “recyclers” as those respondents who stated to be engaged in waste separation at their
home. On the other hand, “non recyclers” are identified as those respondents who stated that
they are not engaged in waste separation. Figure 11 shows that Novi Grad 31.82% of
respondents stated do be engaged in recycling while in Mostar these are 13.64%. Both rates
are low when compared to rates found by other research. For instance in the studies of Vining
& Ebreo (1990), MORI (2002) and McDonald and Oates (2003), waste separation rate was
more than 50%.
Figure 11: Waste separation rates expressed in percentages
As mentioned, in Novi Grad there is a formal recycling program and related measures for its
implementation for which reason the low rate this study finds comes as a surprise and might
suggest the presence of some alternative issues. As we were interested in reasons for not
recycling a question was included on this and respondents were asked to identify perceived
motives for not recycling. Answers were recorded in a descriptive form and analyzed. A total
of 57 descriptive answers were obtained for Novi Grad and 72 for Mostar; these were
clustered in groups reassembling homogenous categories as reported in Figure 12.

39
Figure 12: Stated reasons for non-separation in Novi Grad and Mostar
The answers respondents provided can help to understand low recycling rates and the motives
for not being engaged in waste separation at the household level. The literature has already
highlighted that usually a main reason for non separation is the absence of containers. In
Mostar 73.61% respondents indicated this as a reason for not recycling, while in Novi Grad
49.12% agreed. This suggests that residents’ needs might not be fully covered by current
services and the local authorities could consider the introduction of additional services
offering householders a variety of recycling containers to suit their circumstances. Other
reasons for non-separation were also recorded i.e. no time, no space, it is not obligatory. As
stated by authors (Vining and Ebreo, 1990; Grodzinska-Jurczak et al., 2003; Martin et al.,
2006), recycling is an activity that demands time, space and resources of the family member
who undertakes it.
“Having no time” to recycle was expressed in both cases (5.26% in Novi Grad and 4.16% in
Mostar). Recycling is connected with a large amount of practical nuisance (e.g. to rinse out
and sort the waste), respondents in the study by Ojala (2008) perceived recycling to be time-
consuming. Similarly, this is reported by Fahy (2005) and identified as a key constraint on
action which is “imposed by the everyday world” and dynamic lifestyle. Many respondents
claimed that that they were in a stage of life where they had a lot to do, they stated they do not
have space in their house to sort in an efficient manner. To rinse out and sort waste is
perceived as time consuming (Ojala, 2008).
In terms of “having no space” was only reported by respondents from Novi Grad (5.26%) and
this has been found also in other studies (Grodzinska-Jurczak et al., 2003; Martin et al, 2006).
This might suggest that a commingled system (in which several materials are collected in the
same container) could be a way to address some of the raised issues. Also using stacking bins,

40
compacting devices, closet organizers and so on could be helpful. We need to be aware, as
noted by Howenstine (1993), that the space problem may be overestimated by respondents;
recycling does nothing to increase the volume of materials that have to be discarded anyway.
In both cases (8.77% in Novi Grad and 4.16% in Mostar), respondents believed that they
should not separate waste since it is not obligatory. In this it is interesting to notice that in
Novi Grad, data suggest for a small percentage of respondents who indicate resistance to
recycling. Refsgaard and Magnussen (2009) reported that rules, norms and obligations setup
by authorities can be a guarantee for an efficient process to promote recycling and suppress
those barriers which can be a hindrance to such a change of behavior.
“No sense to separate waste” was also reported by respondents (14.04% in Novi Grad and
4.16% in Mostar). This statement indicates that respondents might feel that recycling practice
is negligible and not well organized by the local authorities. It also might be that respondents
do not understand why they, rather than the local authority, should separate their waste.
Similar responses are found in the studies by Martin et al. (2006) and Grodzinska-Jurczak et
al. (2003). In order to confront this aspect local authorities should explain the purpose of the
recycling process and the benefits of having uncontaminated recycled materials as well as
providing regular publicity about waste-related services, and regular feedback on recycling
performance.
5.3 Assessment of perceived motivational factors
Interview data, as described in Section 4.3, allowed for the emergence of contextual
information and helped to identify perceived motivational factors (intrinsic and extrinsic) that
seem to facilitate recycling behavior in the two cases. These data served as a starting point for
which a variable, motivation (list of seven items) was developed and tested with a
questionnaire. The seven motivational items are: 1) establishment of pay-back centers, 2)
presence of containers for separation and information labels, 3) presence of PCCs (brochures),
4) presence of eco inspection, 5) presence of financial rewards, 6) presence of non-financial
rewards (discount in food shopping) and 7) monetary penalty. Respondents were asked to
which degree, on a scale from 1 to 5, they were motivated to separate waste at home and to
which degree non recyclers would be motivated to separate waste. No case of missing data on
the above variable was found.
Table 4 summarizes mean values for answers given by recyclers and non recyclers in Novi
Grad and differences between the two are very small. Recyclers reported that they would be

41
most motivated by pay-back centers (M=4.31; SD=0.963). They see the Croat experience with
pay-back centers for the plastic waste but also the unstable economic situation might be a
contributing factor. On the other hand, non recyclers reported that containers and labels
(M=4.36; SD=0.981) would motivate them the most. Providing more containers might
increase the rate of recycling, similar results was found by Reid et al. (1976) and Nixon and
Saphore (2009). Overall, it can be concluded that both recyclers and non recyclers perceive to
be motivated by the provision of good infrastructure (pay-back centers, containers). Recycling
infrastructure has a significant role in motivating both groups to continue or start with
recycling.
Table 4: Values for questions on motivation for recyclers and non-recyclers in Novi Grad
MOTIVATIONAL
FACTROS
(EXTRINSIC)
RECYCLERS NON-RECYCLERS
N Mean* Std. Deviation
Std. Error Mean
N Mean* Std. Deviation
Std. Error Mean
Pay-back centers (would
be motivated by)
35 4.31 0.963 0.163 75 4.16 1.220 0.141
Containers & labels 35 4.17 1.175 0.199 75 4.36 0.981 0.113
Brochure 35 4.20 1.106 0.187 75 3.84 1.139 0.132
Eco inspection 35 4.09 1.095 0.185 75 4.05 1.229 0.142
Financial reward 35 4.00 1.372 0.232 75 4.04 1.224 0.141
Non-financial reward 35 3.91 1.422 0.240 75 4.01 1.180 0.136
Monetary penalty 35 4.20 1.279 0.216 75 4.23 1.110 0.128
*Scale: from a min of 1(don’t agree at all) to a max of 5 (very much agree) answers
**PCCs – public communication campaigns
In the Mostar case, recyclers (M=4.67; SD=0.617) and non recyclers (M=4.47; SD=0.976)
reported that they were/would be motivated the most by having containers and labels (Table
5). Similar to Novi Grad, more containers might encourage those currently already recycling
and might increase participation of those not recycling. On this specific aspect Thomas et al.
(2004) comment that in their study an improvement of the facilities was the main reason for
an increase in recycling rates. Their study suggests for a link between improved recycling
infrastructure and reported recycling behavior. Similar results have been found by Katzev et
al., (1993) who report that containers, visibility and appearance of system, information labels
are important determinants of recycling behavior.
It is also interesting to point that even though recycling is not formally introduced in this city,
as described in the Chapter 4, there is a lively informal sector of waste collectors and waste
pickers i.e. the Roma people as well as private companies who situate their own containers.
This suggests that there is some good potential for the introduction of recycling practice.

42
Table 5: Values for questions on motivation for recyclers and non-recyclers in Mostar
MOTIVATIONAL
FACTORS
(EXTRINSIC)
RECYCLERS NON-RECYCLERS
N Mean* Std.
Deviation Std. Error
Mean N Mean*
Std. Deviation
Std. Error Mean
Pay-back centers (would be motivated by)
15 4.27 0.799 0.206 91 4.20 1.123 0.125
Containers & labels 15 4.67 0.617 0.187 91 4.47 0.976 0.108
Brochure 15 4.20 0.862 0.223 91 4.01 1.031 0.115
Eco inspection 15 4.53 0.834 0.215 91 3.97 1.303 0.137
Financial reward 15 4.13 1.187 0.307 91 3.89 1.387 0.154
Non-financial reward
15 4.20 0.862 0.223 91 3.89 1.313 0.146
Monetary penalty 15 4.67 0.724 0.159 91 4.12 1.218 0.135
*Scale: from a min of 1(don’t agree at all) to a max of 5 (very much agree) answers **PCCs – public communication campaigns
To conclude, respondents (recyclers and non-recyclers) in the Novi Grad and Mostar
were/would be motivated the most by having better recycling infrastructure (pay-back centers
and containers). Linking back to the Section 4.3, it can be noted here that it is important to
account for intrinsic as well as extrinsic motivational factors, since both, as suggested by
Ebreo and Vining (2000), can help to increase the acceptability of recycling programs. Policy-
makers are aware that extrinsic factors are visible to people and these influence recycling
practices, but usually less attention is paid to the intrinsic factors. Intrinsic and extrinsic
factors are strongly linked, these shall be activated simultaneously. For instance, intrinsic
motives (e.g. keeping environment clean, conserve natural resources) could be activated by
information campaigns and recycling practices and reinforced by an extrinsic factor e.g.,
rewards, community recognitions.
5.4 Assessment of concerns
Interview data, as discussed in Section 4.2, allowed the identification of some of the current
issues with recycling practice and of the concerns that the local community has in terms of
adopting recycling behavior. These data served as a base for which a variable concern (list of
seven items) was developed and tested with a questionnaire. The seven items are: a) full
containers for waste separation, b) presence of odor, birds and insects, c) no containers, d) no
labels and information on containers, e) no space in the kitchen, f) no eco inspection and g) no
monetary penalty. Respondents were asked to which degree, on a Likert scale from 1 to 5,
they are concerned with these. No cases of missing data on the above were found. The goal of
this section is to identify what locals are most concerned with.

43
Table 6 gives results for recyclers and non recyclers for the Novi Grad sample. Both recyclers
(M=4.17; SD=1.224) and non recyclers (M=4.16; SD=1.220) reported to be most concerned
about the lack of containers for waste separation. This is consistent with the results reported in
Section 4.3 and in Section 5.2 where it is mentioned that one of the reasons for not separating
waste is the absence of containers. The second concern which respondents reported on is not
having a monetary penalty.
It has to be noted above, even though KJKP Rad has around 35 inspectors, the capacity of
inspectors is limited and these might not be able to cover the whole area 24 hours a day. For
this reason, the improper actions respondents reported might not always get fined. During
interviews this aspect came forward frequently and respondents insisted that it is the only
measure for people to become responsible for their own actions.
Table 6: Values for questions on concerns for recyclers and non-recyclers in Novi Grad
CONCERNS
RECYCLERS NON-RECYCLERS
N Mean* Std.
Deviation Std. Error
Mean N Mean*
Std. Deviation
Std. Error Mean
Full containers 35 3.60 1.397 0.236 75 2.99 1.428 0.173
Presence of odor 35 3.94 1.211 0.205 75 3.92 1.205 0.139
No containers 35 4.17 1.224 0.207 75 4.16 1.220 0.141
No labels and info 35 3.94 1.305 0.221 75 3.80 1.263 0.146
No space in kitchen 35 3.03 1.465 0.248 75 2.95 1.497 0.165
No eco inspection 35 3.71 1.202 0.203 75 4.00 1.185 0.137
No monetary penalty 35 4.03 1.248 0.211 75 4.15 1.171 0.135
Scale: from a min of 1(don’t agree at all) to a max of 5 (very much agree) answers
In Mostar, recyclers reported of being most concerned with not having labels and information
(M=4.60; SD=0.828). Recycling is not formally introduced into this city and the fact there are
no labels on containers and information comes with no surprise. There are a few containers
placed by private companies but these might not have adequate information i.e. which
recyclables are disposed in which container and in which way. On the other hand, non
recyclers are most concerned about not having containers (M=4.28; SD=1.277) which has
been already commented in Section 4.3 and 5.2.
Table 7: Values for questions on concerns for recyclers and non-recyclers in Mostar
CONCERNS
RECYCLERS NON-RECYCLERS
N Mean* Std.
Deviation Std. Error
Mean N Mean*
Std. Deviation
Std. Error Mean
Full containers 15 4.20 1.320 0.341 91 3.56 1.549 0.172
Presence of odor 15 4.33 0.816 0.211 91 4.19 1.314 0.146
No containers 15 4.53 0.743 0.192 91 4.28 1.277 0.142
No labels and info 15 4.60 0.828 0.214 91 3.93 1.473 0.164
No space in kitchen 15 3.27 1.580 0.408 91 2.86 1.481 0.165
No eco inspection 15 4.53 0.834 0.215 91 4.11 1.332 0.148
No monetary penalty 15 4.40 0.910 0.235 91 4.04 1.355 0.151
Scale: from a min of 1(don’t agree at all) to a max of 5 (very much agree) answers
44
To conclude, this section reports on the scores regarding the concern scale. Most of our
respondents reported to be concerned the most about not having containers, and not having
labels and information. These results can offer some useful information to utility companies
and local authorities i.e. ministries in drafting recycling programs within the two cases. For
instance, local authorities could provide additional training for utility companies on collection
and transportation of recyclables. Also, it is important to plan the number of containers and
identify a suitable place for the location of containers. PCCs could contribute to this and help
to increase environmental awareness among people. While the financial shortcomings for
recycling infrastructure (vehicles, containers) and organizing campaigns might be overcome
with the support of funds from UN and EU programs and regional Environmental Fund in
FBiH.
5.5 Assessment of attitudes toward recycling behavior
Interview data discussed in Section 4.1, offered insight on the respondents’ perception toward
the recycling system and helped in the identification of attitudes (toward recycling behavior)
in both cases. These data provided background information used for the development of a
variable, list of four statements, meant to further appraise respondent’s attitudes. This variable
was used in a questionnaire in order to collect quantitative data. These four statements cover
question 6 (see: Appendix I). Question 6 was not directed to the non-recyclers since they are
not engaged in waste separation and current statements cannot be evaluated properly.
Respondents answered how much they agree or disagree on a Likert scale from 1 to 5. No
cases of missing data on the above variable were found. The goal of this section is to report on
the results for attitudes recyclers and non recyclers reported towards recycling behavior.
In Table 8, results are given for Novi Grad and Mostar. Recyclers agree the most that they
separate waste because it keeps the environment clean (Novi Grad - M=4.43; SD=1.008;
Mostar - M=4.80; SD=0.561). The results can be linked to the intrinsic motivational factors
mentioned in Section 4.3, where respondents expressed that they are involved in separation
because of feelings of satisfaction in terms for contributing towards environmental protection.
It needs to be noted that in the Mostar sample, the number of recyclers is small (only 15
recyclers out of 106 respondents) and formal recycling practice is not introduced at the
household level, yet they have expressed an interest for environmental protection. A Pearson’s
correlation was used for the investigation of relationships between a dependent variable
(recycling behavior) and an independent variable, attitude (statement: “I separate waste
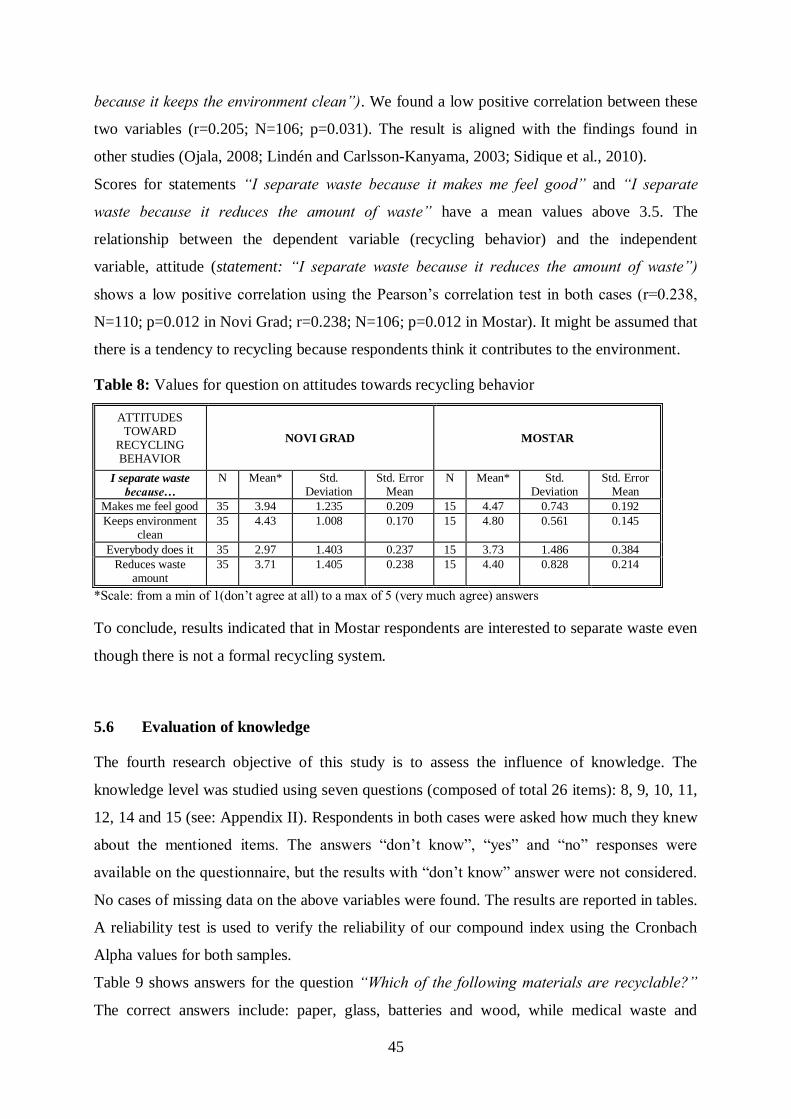
45
because it keeps the environment clean”). We found a low positive correlation between these
two variables (r=0.205; N=106; p=0.031). The result is aligned with the findings found in
other studies (Ojala, 2008; Lindén and Carlsson-Kanyama, 2003; Sidique et al., 2010).
Scores for statements “I separate waste because it makes me feel good” and “I separate
waste because it reduces the amount of waste” have a mean values above 3.5. The
relationship between the dependent variable (recycling behavior) and the independent
variable, attitude (statement: “I separate waste because it reduces the amount of waste”)
shows a low positive correlation using the Pearson’s correlation test in both cases (r=0.238,
N=110; p=0.012 in Novi Grad; r=0.238; N=106; p=0.012 in Mostar). It might be assumed that
there is a tendency to recycling because respondents think it contributes to the environment.
Table 8: Values for question on attitudes towards recycling behavior
ATTITUDES TOWARD
RECYCLING BEHAVIOR
NOVI GRAD MOSTAR
I separate waste
because…
N Mean* Std. Deviation
Std. Error Mean
N Mean* Std. Deviation
Std. Error Mean
Makes me feel good 35 3.94 1.235 0.209 15 4.47 0.743 0.192
Keeps environment clean
35 4.43 1.008 0.170 15 4.80 0.561 0.145
Everybody does it 35 2.97 1.403 0.237 15 3.73 1.486 0.384
Reduces waste amount
35 3.71 1.405 0.238 15 4.40 0.828 0.214
*Scale: from a min of 1(don’t agree at all) to a max of 5 (very much agree) answers
To conclude, results indicated that in Mostar respondents are interested to separate waste even
though there is not a formal recycling system.
5.6 Evaluation of knowledge
The fourth research objective of this study is to assess the influence of knowledge. The
knowledge level was studied using seven questions (composed of total 26 items): 8, 9, 10, 11,
12, 14 and 15 (see: Appendix II). Respondents in both cases were asked how much they knew
about the mentioned items. The answers “don’t know”, “yes” and “no” responses were
available on the questionnaire, but the results with “don’t know” answer were not considered.
No cases of missing data on the above variables were found. The results are reported in tables.
A reliability test is used to verify the reliability of our compound index using the Cronbach
Alpha values for both samples.
Table 9 shows answers for the question “Which of the following materials are recyclable?”
The correct answers include: paper, glass, batteries and wood, while medical waste and
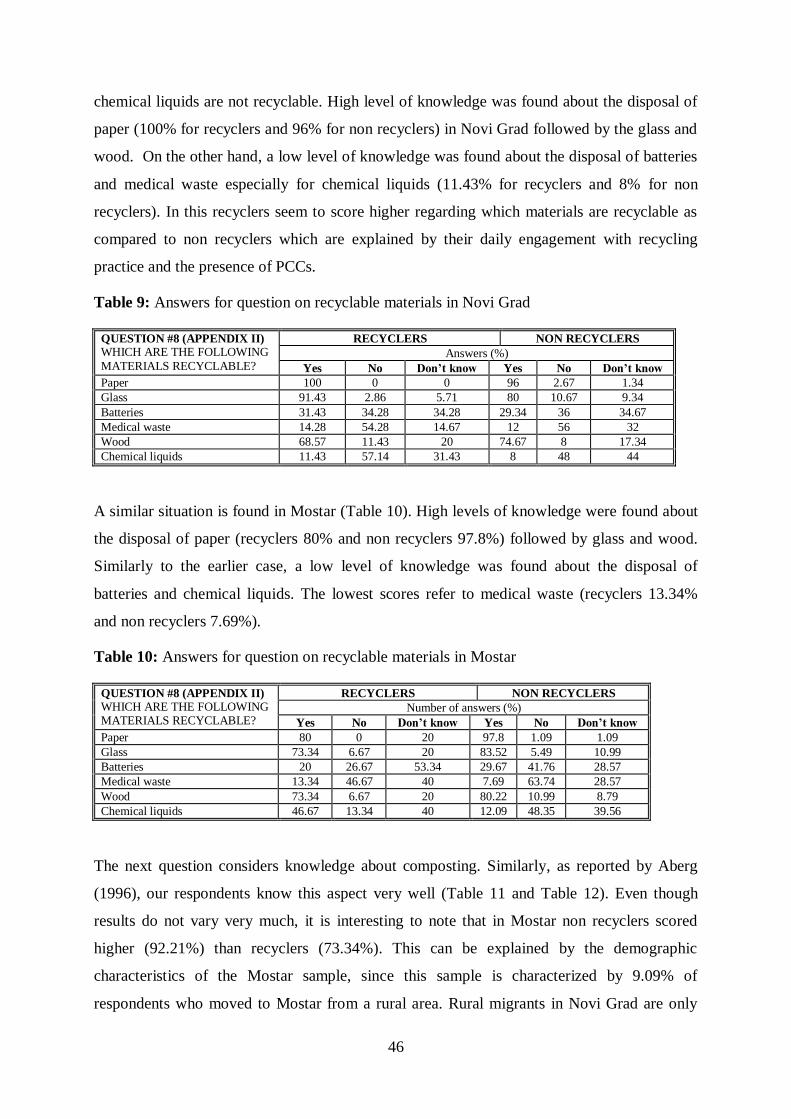
46
chemical liquids are not recyclable. High level of knowledge was found about the disposal of
paper (100% for recyclers and 96% for non recyclers) in Novi Grad followed by the glass and
wood. On the other hand, a low level of knowledge was found about the disposal of batteries
and medical waste especially for chemical liquids (11.43% for recyclers and 8% for non
recyclers). In this recyclers seem to score higher regarding which materials are recyclable as
compared to non recyclers which are explained by their daily engagement with recycling
practice and the presence of PCCs.
Table 9: Answers for question on recyclable materials in Novi Grad
QUESTION #8 (APPENDIX II) WHICH ARE THE FOLLOWING
MATERIALS RECYCLABLE?
RECYCLERS NON RECYCLERS
Answers (%)
Yes No Don’t know Yes No Don’t know
Paper 100 0 0 96 2.67 1.34
Glass 91.43 2.86 5.71 80 10.67 9.34
Batteries 31.43 34.28 34.28 29.34 36 34.67
Medical waste 14.28 54.28 14.67 12 56 32
Wood 68.57 11.43 20 74.67 8 17.34
Chemical liquids 11.43 57.14 31.43 8 48 44
A similar situation is found in Mostar (Table 10). High levels of knowledge were found about
the disposal of paper (recyclers 80% and non recyclers 97.8%) followed by glass and wood.
Similarly to the earlier case, a low level of knowledge was found about the disposal of
batteries and chemical liquids. The lowest scores refer to medical waste (recyclers 13.34%
and non recyclers 7.69%).
Table 10: Answers for question on recyclable materials in Mostar
QUESTION #8 (APPENDIX II) WHICH ARE THE FOLLOWING MATERIALS RECYCLABLE?
RECYCLERS NON RECYCLERS
Number of answers (%)
Yes No Don’t know Yes No Don’t know
Paper 80 0 20 97.8 1.09 1.09
Glass 73.34 6.67 20 83.52 5.49 10.99
Batteries 20 26.67 53.34 29.67 41.76 28.57
Medical waste 13.34 46.67 40 7.69 63.74 28.57
Wood 73.34 6.67 20 80.22 10.99 8.79
Chemical liquids 46.67 13.34 40 12.09 48.35 39.56
The next question considers knowledge about composting. Similarly, as reported by Aberg
(1996), our respondents know this aspect very well (Table 11 and Table 12). Even though
results do not vary very much, it is interesting to note that in Mostar non recyclers scored
higher (92.21%) than recyclers (73.34%). This can be explained by the demographic
characteristics of the Mostar sample, since this sample is characterized by 9.09% of
respondents who moved to Mostar from a rural area. Rural migrants in Novi Grad are only
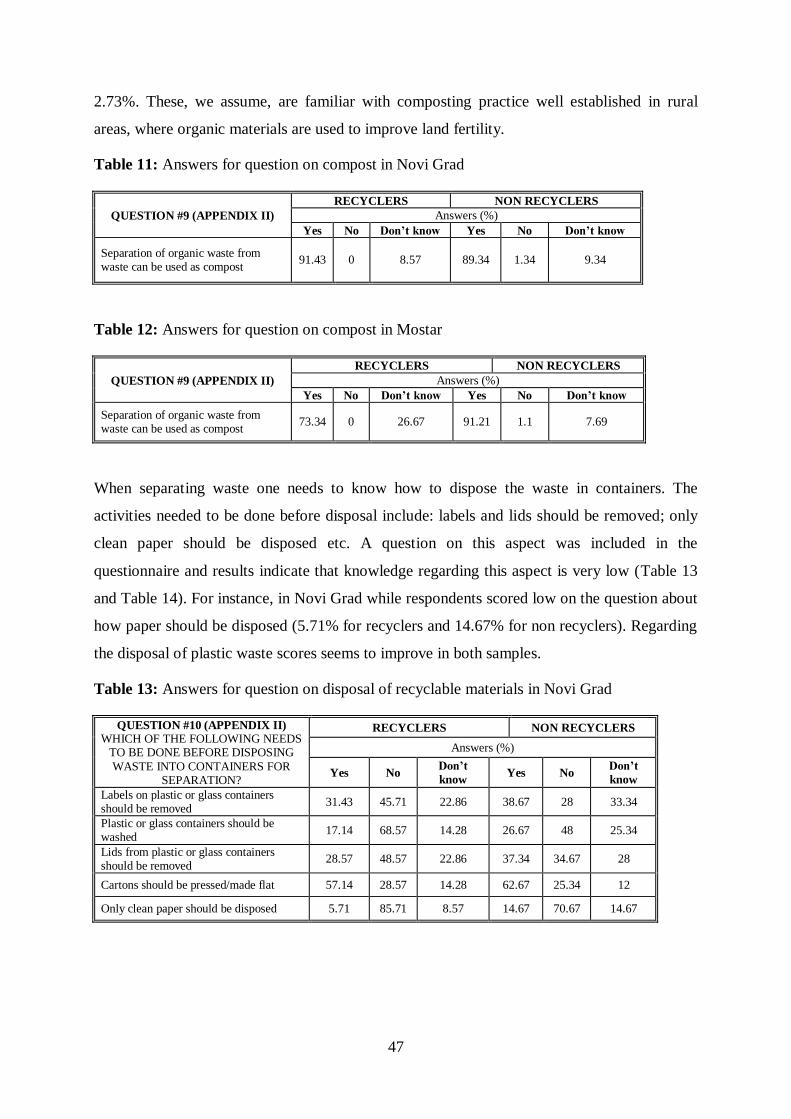
47
2.73%. These, we assume, are familiar with composting practice well established in rural
areas, where organic materials are used to improve land fertility.
Table 11: Answers for question on compost in Novi Grad
QUESTION #9 (APPENDIX II)
RECYCLERS NON RECYCLERS
Answers (%)
Yes No Don’t know Yes No Don’t know
Separation of organic waste from waste can be used as compost
91.43 0 8.57 89.34 1.34 9.34
Table 12: Answers for question on compost in Mostar
QUESTION #9 (APPENDIX II)
RECYCLERS NON RECYCLERS
Answers (%)
Yes No Don’t know Yes No Don’t know
Separation of organic waste from waste can be used as compost
73.34 0 26.67 91.21 1.1 7.69
When separating waste one needs to know how to dispose the waste in containers. The
activities needed to be done before disposal include: labels and lids should be removed; only
clean paper should be disposed etc. A question on this aspect was included in the
questionnaire and results indicate that knowledge regarding this aspect is very low (Table 13
and Table 14). For instance, in Novi Grad while respondents scored low on the question about
how paper should be disposed (5.71% for recyclers and 14.67% for non recyclers). Regarding
the disposal of plastic waste scores seems to improve in both samples.
Table 13: Answers for question on disposal of recyclable materials in Novi Grad
QUESTION #10 (APPENDIX II) WHICH OF THE FOLLOWING NEEDS
TO BE DONE BEFORE DISPOSING
WASTE INTO CONTAINERS FOR SEPARATION?
RECYCLERS NON RECYCLERS
Answers (%)
Yes No Don’t
know Yes No
Don’t
know
Labels on plastic or glass containers should be removed
31.43 45.71 22.86 38.67 28 33.34
Plastic or glass containers should be washed
17.14 68.57 14.28 26.67 48 25.34
Lids from plastic or glass containers should be removed
28.57 48.57 22.86 37.34 34.67 28
Cartons should be pressed/made flat 57.14 28.57 14.28 62.67 25.34 12
Only clean paper should be disposed 5.71 85.71 8.57 14.67 70.67 14.67

48
Table 14: Answers for question on disposal of recyclable materials in Mostar
QUESTION #10 (APPENDIX II) WHICH OF THE FOLLOWING NEEDS
TO BE DONE BEFORE DISPOSING WASTE INTO CONTAINERS FOR
SEPARATION?
RECYCLERS NON RECYCLERS
Answers (%)
Yes No Don’t
know Yes No
Don’t
know
Labels on plastic or glass containers should be removed
40 33.34 26.67 42.86 28.57 28.57
Plastic or glass containers should be washed
33.34 26.67 40 60.44 21.98 17.58
Lids from plastic or glass containers should be removed
60 6.67 33.34 40.66 34.06 25.27
Cartons should be pressed/made flat 80 6.67 13.34 63.74 20.88 15.38
Only clean paper should be disposed 26.67 60 13.34 15.38 70.33 14.28
Within the recycling system there are several places where waste separation takes place and
steps needed for the recycling of waste materials are undertaken. Respondents seem to have a
good knowledge about the recycling system; in Novi Grad answers above 62% and in Mostar
above 70%. However, in Mostar, non recyclers know less (23.08%) that waste separation at
home is part of the recycling system. Respondents did not consider that households have a
significant role within the recycling system and it seems they do not feel to have an important
role in recycling but rather seem to shift the responsibility to others.
Table 15: Answers for question on processes of recycling system in Novi Grad
QUESTION #11 (APPENDIX II)
THE RECYCLING SYSTEM INCLUDES:
RECYCLERS NON RECYCLERS
Answers (%)
Yes No Don’t know Yes No Don’t know
Waste separation at home 74.28 5.71 20 80 12 8
Waste separation at landfill 80 0 20 93.34 1.34 5.34
Manufacturing and producing new materials
62.86 14.28 22.86 68 17.34 14.67
Reusing and producing new materials 82.86 5.71 11.43 78.67 5.34 16
Table 16: Answers for question on processes of recycling system in Mostar
QUESTION #11 (APPENDIX II) THE RECYCLING SYSTEM INCLUDES:
RECYCLERS NON RECYCLERS
Answers (%)
Yes No Don’t know Yes No Don’t know
Waste separation at home 73.34 13.34 13.34 23.08 67.03 9.89
Waste separation at landfill 80 6.67 13.34 83.52 3.3 13.19
Manufacturing and producing new materials 80 6.67 13.34 70.33 16.48 13.19
Reusing and producing new materials 80 0 20 86.81 4.39 8.79

49
We asked our respondents whether they know what the benefits of the recycling system for
the environment are. The scores for these questions are summarized in Table 17 and Table 18.
In both cases, respondents gave positive answers: above 77% in Novi Grad and above 84% in
Mostar. In both cases, non recyclers seem to know more than recyclers. This will be
investigated closely in Section 5.7.
Table 17: Answers for question on benefits of the recycling system in Novi Grad
QUESTION #12 (APPENDIX II) THE RECYCLING SYSTEM HELPS
TO:
RECYCLERS NON RECYCLERS
Answers (%)
Yes No Don’t know Yes No Don’t know
Conserve natural resources 97.14 0 2.86 93.34 1.34 5.34
Reduce waste 85.71 0 14.28 92 2.67 5.34
Save energy 77.14 8.57 14.28 89.34 2.67 8
Reduce use of landfill 77.14 5.71 17.14 89.34 2.67 8
Table 18: Answers for question on benefits of the recycling system in Mostar
QUESTION #12 (APPENDIX II) THE RECYCLING SYSTEM HELPS
TO:
RECYCLERS NON RECYCLERS
Answers (%)
Yes No Don’t know Yes No Don’t know
Conserve natural resources 100 0 0 93.41 1.1 4.39
Reduce waste 93.34 0 6.67 96.7 3.3 0
Save energy 86.67 0 13.34 84.61 3.3 1.1
Reduce use of landfill 80 0 20 92.31 1.1 6.59
Since respondents scored high about paper recycling, we were interested to look at this more
closely. Table 19 and Table 20 summarize answers for a number of questions. Respondents
are most aware that recycling helps to save natural timber resources (above 85%), while know
less that recycling paper saves gasoline, electricity and water.
Table 19: Answers for question on benefits of the recycling paper in Novi Grad
QUESTION #14 (APPENDIX II) RECYCLING PAPER HELPS TO:
RECYLERS NON RECYCLERS
Answers (%)
Yes No Don’t know Yes No Don’t know
Pollute less water and air 68.57 2.86 28.57 75.34 6.67 20
Save natural timber resources 97.14 0 2.86 97.34 0 2.67
Save gasoline, electricity and water 48.57 5.71 45.71 57.34 16 26.67
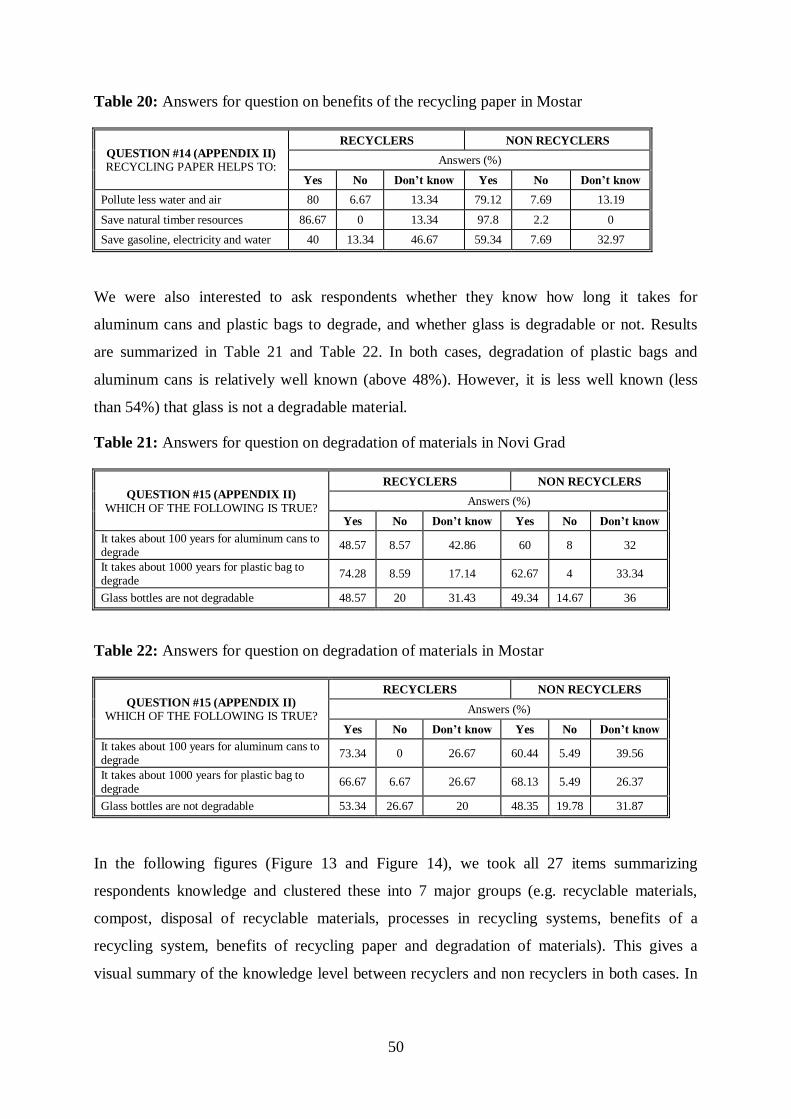
50
Table 20: Answers for question on benefits of the recycling paper in Mostar
QUESTION #14 (APPENDIX II) RECYCLING PAPER HELPS TO:
RECYCLERS NON RECYCLERS
Answers (%)
Yes No Don’t know Yes No Don’t know
Pollute less water and air 80 6.67 13.34 79.12 7.69 13.19
Save natural timber resources 86.67 0 13.34 97.8 2.2 0
Save gasoline, electricity and water 40 13.34 46.67 59.34 7.69 32.97
We were also interested to ask respondents whether they know how long it takes for
aluminum cans and plastic bags to degrade, and whether glass is degradable or not. Results
are summarized in Table 21 and Table 22. In both cases, degradation of plastic bags and
aluminum cans is relatively well known (above 48%). However, it is less well known (less
than 54%) that glass is not a degradable material.
Table 21: Answers for question on degradation of materials in Novi Grad
QUESTION #15 (APPENDIX II)
WHICH OF THE FOLLOWING IS TRUE?
RECYCLERS NON RECYCLERS
Answers (%)
Yes No Don’t know Yes No Don’t know
It takes about 100 years for aluminum cans to degrade
48.57 8.57 42.86 60 8 32
It takes about 1000 years for plastic bag to degrade
74.28 8.59 17.14 62.67 4 33.34
Glass bottles are not degradable 48.57 20 31.43 49.34 14.67 36
Table 22: Answers for question on degradation of materials in Mostar
QUESTION #15 (APPENDIX II) WHICH OF THE FOLLOWING IS TRUE?
RECYCLERS NON RECYCLERS
Answers (%)
Yes No Don’t know Yes No Don’t know
It takes about 100 years for aluminum cans to degrade
73.34 0 26.67 60.44 5.49 39.56
It takes about 1000 years for plastic bag to degrade
66.67 6.67 26.67 68.13 5.49 26.37
Glass bottles are not degradable 53.34 26.67 20 48.35 19.78 31.87
In the following figures (Figure 13 and Figure 14), we took all 27 items summarizing
respondents knowledge and clustered these into 7 major groups (e.g. recyclable materials,
compost, disposal of recyclable materials, processes in recycling systems, benefits of a
recycling system, benefits of recycling paper and degradation of materials). This gives a
visual summary of the knowledge level between recyclers and non recyclers in both cases. In

51
some instances, as mentioned previously, it can be seen that non recyclers possess better
knowledge than recyclers.
Figure 13: Knowledge level between recyclers and non recyclers in Novi Grad
Figure 14: Knowledge level between recyclers and non recyclers in Mostar
Further to this, we wanted to determine how many correct answers were reported by recyclers
and non recyclers in both cases.
Table 23 shows answers regarding the question on recyclable materials; there were 5 to 4
correct answers in Novi Grad whose number gradually decreases along with those who
reported 6 correct answers and those who did not answer any. In Mostar, the distribution of
answers is different, and most respondents scored 5 and 3 correct answers. Generally
speaking, it can be said that respondents in Novi Grad possess better knowledge about
recyclable materials than in Mostar which can be explained by the fact that recycling practice
is formally introduced and there are several PCCs.
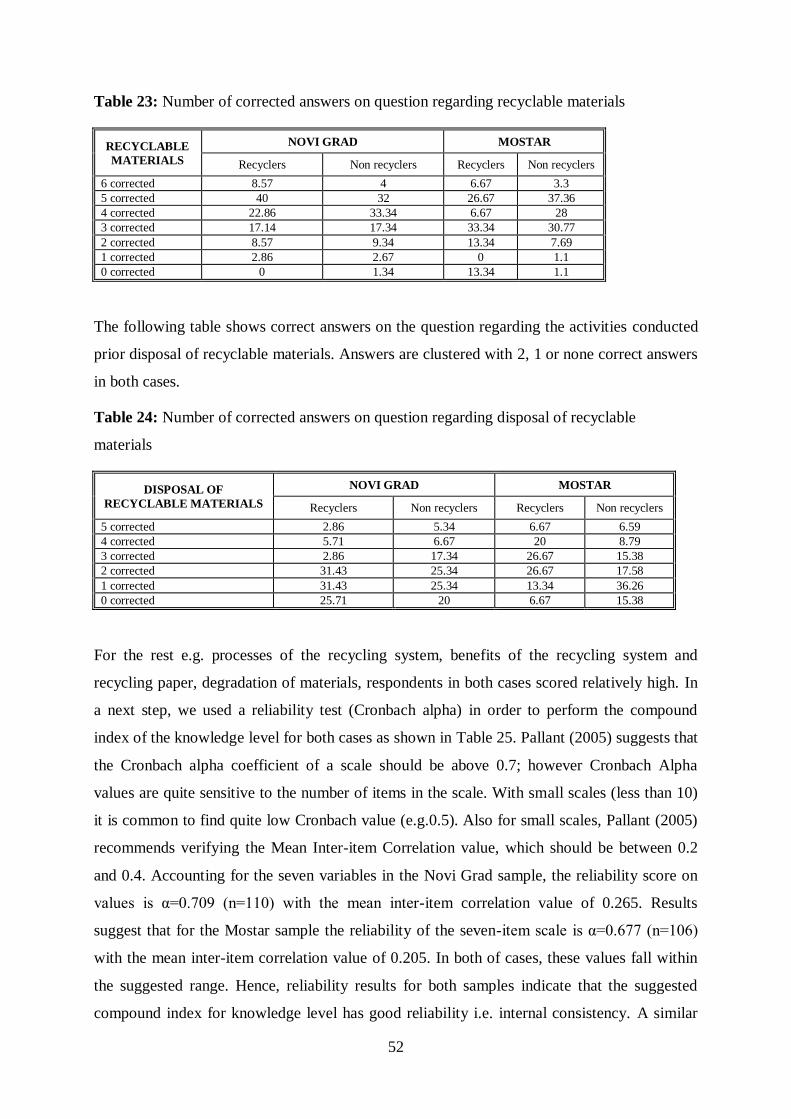
52
Table 23: Number of corrected answers on question regarding recyclable materials
RECYCLABLE
MATERIALS
NOVI GRAD MOSTAR
Recyclers Non recyclers Recyclers Non recyclers
6 corrected 8.57 4 6.67 3.3
5 corrected 40 32 26.67 37.36
4 corrected 22.86 33.34 6.67 28
3 corrected 17.14 17.34 33.34 30.77
2 corrected 8.57 9.34 13.34 7.69
1 corrected 2.86 2.67 0 1.1
0 corrected 0 1.34 13.34 1.1
The following table shows correct answers on the question regarding the activities conducted
prior disposal of recyclable materials. Answers are clustered with 2, 1 or none correct answers
in both cases.
Table 24: Number of corrected answers on question regarding disposal of recyclable
materials
DISPOSAL OF
RECYCLABLE MATERIALS
NOVI GRAD MOSTAR
Recyclers Non recyclers Recyclers Non recyclers
5 corrected 2.86 5.34 6.67 6.59
4 corrected 5.71 6.67 20 8.79
3 corrected 2.86 17.34 26.67 15.38
2 corrected 31.43 25.34 26.67 17.58
1 corrected 31.43 25.34 13.34 36.26
0 corrected 25.71 20 6.67 15.38
For the rest e.g. processes of the recycling system, benefits of the recycling system and
recycling paper, degradation of materials, respondents in both cases scored relatively high. In
a next step, we used a reliability test (Cronbach alpha) in order to perform the compound
index of the knowledge level for both cases as shown in Table 25. Pallant (2005) suggests that
the Cronbach alpha coefficient of a scale should be above 0.7; however Cronbach Alpha
values are quite sensitive to the number of items in the scale. With small scales (less than 10)
it is common to find quite low Cronbach value (e.g.0.5). Also for small scales, Pallant (2005)
recommends verifying the Mean Inter-item Correlation value, which should be between 0.2
and 0.4. Accounting for the seven variables in the Novi Grad sample, the reliability score on
values is α=0.709 (n=110) with the mean inter-item correlation value of 0.265. Results
suggest that for the Mostar sample the reliability of the seven-item scale is α=0.677 (n=106)
with the mean inter-item correlation value of 0.205. In both of cases, these values fall within
the suggested range. Hence, reliability results for both samples indicate that the suggested
compound index for knowledge level has good reliability i.e. internal consistency. A similar

53
finding was reported in the study by Oom do Valle et al. (2005) where the Cronbach’s alpha
exceeds 0.641.
Table 25: Reliability of the knowledge compound index
GROUPS OF
KNOWLEDGE
LEVEL
SCALE MEAN IF
ITEM DELETED
SCALE
VARIANCE IF
ITEM DELETED
CORRECTED
ITEM-TOTAL
CORRELATION
CRONBACH’S
ALPHA IF ITEM
DELETED
NOVI GRAD
Recyclable materials 8.73 3.997 0.269 0.708
Compost 8.57 3.675 0.369 0.689
Disposal of materials 9.25 3.506 0.331 0.704
Processes in recycling system
9.08 3.575 0.476 0.665
Benefits of recycling system
9.25 3.351 0.604 0.633
Benefits of recycling paper
9.09 3.547 0.460 0.667
Degradation of materials
8.69 2.975 0.488 0.662
Alpha = 0.709 Inter-Item
Correlations =0.265
MOSTAR
Recyclable materials 8.63 3.251 0.367 0.649
Compost 9.15 2.999 0.259 0.690
Disposal of materials 8.53 2.997 0.433 0.629
Processes in recycling system
9.00 2.804 0.582 0.587
Benefits of recycling system
9.18 3.363 0.339 0.656
Benefits of recycling paper
9.07 2.952 0.574 0.598
Degradation of materials
8.59 2.840 0.304 0.680
Alpha = 0.677 Inter-Item Correlations =0.205
Since our objective was to see weather knowledge levels have an influence on recycling
behavior we used the Pearson’s correlation test. It helped us to identify possible relationships
between a dependent variable (recycling behavior) and the independent variable (knowledge
level). However, no significant results were found.
To conclude, the set of questions for testing the knowledge level showed good reliability.
Generally speaking, this study finds a low knowledge level for both recyclers and non
recyclers in the two cases. Respondents know very little about what materials are recyclable
and also know little about disposal activities. This finding can be triangulated with interview
data, discussed in Section 5.5, and an assumption advanced that current awareness campaigns
might not reach across the entire community. Barr et al. (2001) reported that knowledge of
what can be recycled and how to do is has to be included in communication campaigns. A

54
further finding is that knowledge about the recyclability of paper waste was found to be higher
when compared to other materials (100% in Novi Grad and 96% in Mostar). Yet, again
respondents obtained low scores regarding its disposal (e.g. only clean paper is disposed) and
its benefits (e.g. it saves gasoline, water and electricity). From this we can conclude that
respondents tend to have very shallow knowledge i.e. the lack of specific or detailed
knowledge about recyclable materials. In terms of plastic waste, qualitative data from Chapter
4 indicates for the presence of several issues in Mostar; untidy public areas, poor hygiene of
bins. Several of our respondents expressed an interest for the establishment of pay-back
centers. In this, the negative view respondents have of plastic waste and the high level of
knowledge about its degradation, found within the questionnaire, could be a basis upon which
communication campaigns could be built for an increase in recycling rates of plastics. Also,
this study finds that in Mostar respondents did not consider waste separation at home as part
of the recycling system.
5.7 Public communication campaigns
The fifth research objective of this study is to identify whether locally available public
communication campaigns (PCCs) have an influence on: a) knowledge and b) on attitudes
people have towards the recycling in the two cases. The PCCs were studied with question #13
(see: Appendix II) made of two compound variables: media sources (i.e. television,
newspapers, radio stations, magazines, internet and brochures) and social influence (i.e.
friends and family members, neighbors, school, university and utility company). Recyclers
and non recyclers were asked from which sources they watched/heard/read and obtained
information about the recycling system. An additional question, #17 (see: Appendix II), was
used in order to inquire about the content of brochures and similar information tools.
Although a “don’t know”, “yes” and “no” response were also available on the questionnaire,
the results with “don’t know” answer were not considered. No cases of missing data on the
above variables were found. The results are reported in the following tables and include
percentages.
Table 26 shows the results obtained in Novi Grad about each of the identified media sources
which respondents indicated they have gained information about the recycling system. The
television (TV) scored the highest percentage of “yes” answers reported by recyclers (80%)
and non recyclers (77.34%), this is followed by newspapers for recyclers (71.43%) and
internet for non recyclers (61.34%). This suggests that TV currently is the media source that

55
provides information on recycling system most widely. Chan (1998) found that TV news
programs were effective at increasing level of environmental knowledge among those who
watched it.
Table 26: Answers for question on media sources in Novi Grad
QUESTION #8 (APPENDIX II) FROM WHICH OF THE FOLLOWING
SOURCES HAVE YOU WATCHED/HEARD/READ AND
OBTAINED INFORMATION ABOUT THE RECYCLING SYSTEM?
RECYCLERS NON RECYCLERS
Answers (%)
Yes No Don’t
know Yes No Don’t know
Television 80 14.28 5.71 77.34 21.34 1.34
Newspapers 71.43 14.28 14.28 58.67 36 5.34
Radio stations 42.86 25.71 31.43 24 58.67 17.34
Magazines 31.43 42.86 25.71 34.67 49.34 16
Internet 42.86 28.57 28.57 61.34 24 14.67
Brochures 50.86 49.14 0 52.34 47.66 0
In Mostar a similar situation can be found (Table 27). Here, TV scored the highest percentage
of “yes” answers reported by recyclers (93.34%) while for non recyclers this is newspaper
(73.63%). TV is a widely used media where people can obtain various information inclusive
of recycling practices (Do Valle, 2005).
Table 27: Answers for question on media sources in Mostar
QUESTION #8 (APPENDIX II) FROM WHICH OF THE FOLLOWING
SOURCES HAVE YOU WATCHED/HEARD/READ AND
OBTAINED INFORMATION ABOUT
THE RECYCLING SYSTEM?
RECYCLERS NON RECYCLERS
Answers (%)
Yes No Don’t
know Yes No Don’t know
Television 93.34 0 6.67 71.43 6.59 4.39
Newspapers 86.67 0 13.34 73.63 21.98 4.39
Radio stations 53.34 13.34 33.34 48.35 38.46 13.19
Magazines 46.67 20 33.34 41.76 43.96 14.28
Internet 60 20 20 59.34 31.87 8.79
Brochures 40 60 0 23.08 76.92 0
Considering both cases, respondents from Novi Grad reported of having acquired information
from brochures (around 50%) more frequently than in Mostar (30%). However, in general,
brochures scored low in both cases. This tells us that in Novi Grad, brochures on recycling
have not reached out to residents much more in comparison to other media sources.
The next question aimed to consider types of social influence. Table 28 summarizes results
for Novi Grad, and there it is indicated that recyclers gained information about recycling most
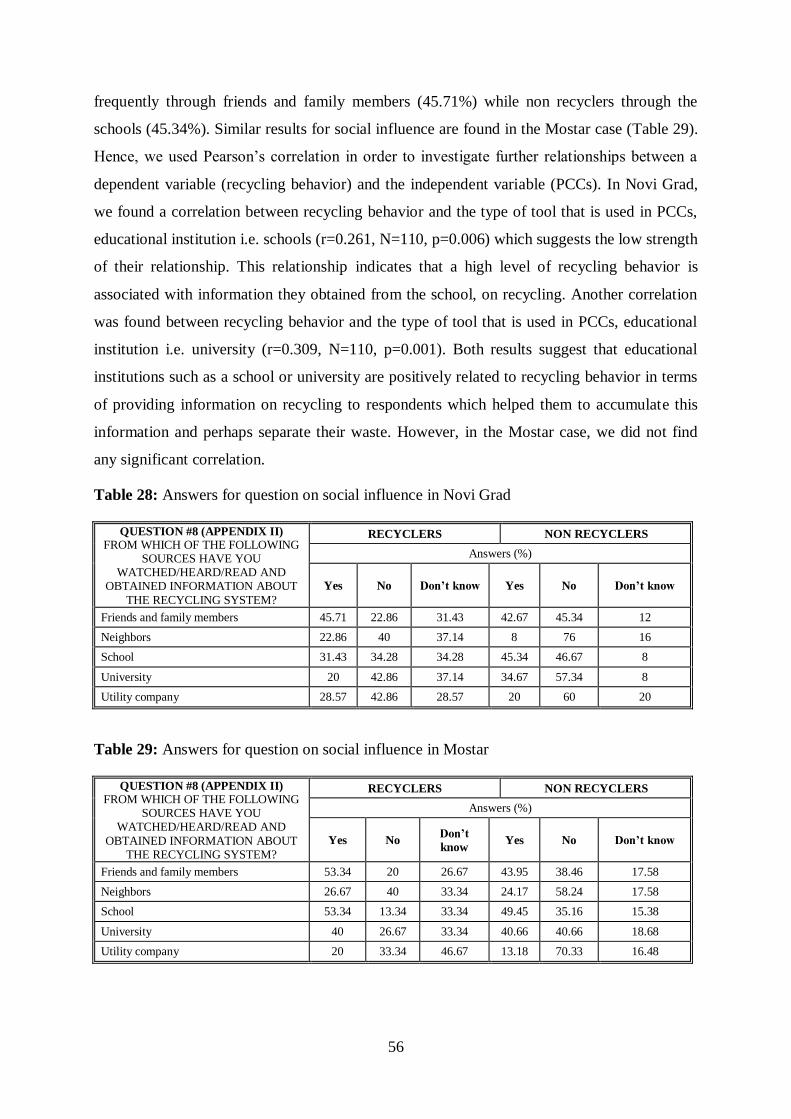
56
frequently through friends and family members (45.71%) while non recyclers through the
schools (45.34%). Similar results for social influence are found in the Mostar case (Table 29).
Hence, we used Pearson’s correlation in order to investigate further relationships between a
dependent variable (recycling behavior) and the independent variable (PCCs). In Novi Grad,
we found a correlation between recycling behavior and the type of tool that is used in PCCs,
educational institution i.e. schools (r=0.261, N=110, p=0.006) which suggests the low strength
of their relationship. This relationship indicates that a high level of recycling behavior is
associated with information they obtained from the school, on recycling. Another correlation
was found between recycling behavior and the type of tool that is used in PCCs, educational
institution i.e. university (r=0.309, N=110, p=0.001). Both results suggest that educational
institutions such as a school or university are positively related to recycling behavior in terms
of providing information on recycling to respondents which helped them to accumulate this
information and perhaps separate their waste. However, in the Mostar case, we did not find
any significant correlation.
Table 28: Answers for question on social influence in Novi Grad
QUESTION #8 (APPENDIX II) FROM WHICH OF THE FOLLOWING
SOURCES HAVE YOU WATCHED/HEARD/READ AND
OBTAINED INFORMATION ABOUT
THE RECYCLING SYSTEM?
RECYCLERS NON RECYCLERS
Answers (%)
Yes No Don’t know Yes No Don’t know
Friends and family members 45.71 22.86 31.43 42.67 45.34 12
Neighbors 22.86 40 37.14 8 76 16
School 31.43 34.28 34.28 45.34 46.67 8
University 20 42.86 37.14 34.67 57.34 8
Utility company 28.57 42.86 28.57 20 60 20
Table 29: Answers for question on social influence in Mostar
QUESTION #8 (APPENDIX II) FROM WHICH OF THE FOLLOWING
SOURCES HAVE YOU WATCHED/HEARD/READ AND
OBTAINED INFORMATION ABOUT THE RECYCLING SYSTEM?
RECYCLERS NON RECYCLERS
Answers (%)
Yes No Don’t
know Yes No Don’t know
Friends and family members 53.34 20 26.67 43.95 38.46 17.58
Neighbors 26.67 40 33.34 24.17 58.24 17.58
School 53.34 13.34 33.34 49.45 35.16 15.38
University 40 26.67 33.34 40.66 40.66 18.68
Utility company 20 33.34 46.67 13.18 70.33 16.48

57
A further aspect that comes forward from these results is that respondents reported that the
utility company in Novi Grad (around 24%) provides more information as compared to
Mostar (around 16%). This, we assume, can be linked to the dynamic role it has as already as
discussed in Section 4.1. On the other hand, it is interesting to notice that social influence i.e.
friends, family members and neighbors, is perceived more strongly by respondents in Mostar
(around 25%) than in Novi Grad (around 15%). The reason for this might be found in the fact
that Mostar is a smaller municipality (111.364 residents - Federal Office of Statistics, 2011)
than Novi Grad (124.742 residents Federal Office of Statistics, 2011); in Mostar there are
closer ties between residents who exchange information more frequently about their neighbors
while in Novi Grad, as a part of a capital city, ties between residents are looser and neighbors
might not even know each other. Generally, media sources provided more information to
respondents than social influence in both cases.
We were interested to see what kind of content was provided in the brochures accessible to
the residents. In Novi Grad, several PCCs on recycling were delivered while in Mostar none.
Respondents were asked which of the following items: recycling system, waste separation and
recycling law were contained in the brochures they have read. Results for the Novi Grad
sample (Table 30) on this question have low mean values (range of values: 2.00 – 2.40 for
recyclers and 1.56 – 1.77 for non recyclers). These data suggest that brochures did not offer
sufficient information on recycling system, waste separation and recycling law to the
respondents.
Table 30: Values for question on brochures across the recycling behavior in Novi Grad
CONTENT OF
BROCHURE
RECYCLERS NON-RECYCLERS
N Mean* Std.
Deviation Std. Error
Mean N Mean*
Std. Deviation
Std. Error Mean
Recycling system 35 2.26 1.120 0.189 75 1.77 1.021 0.118
Waste separation 35 2.40 1.193 0.202 75 1.76 0.998 0.115
Recycling law and its implementation
35 2.00 1.260 0.213 75 1.56 0.904 0.104
*Scale: from a min of 1(don’t agree at all) to a max of 5 (very much agree) answers
Table 31 indicates for a similar circumstance also for Mostar (range of values: 1.73 – 1.87 for
recyclers and 1.23 – 1.27 for non recyclers). Even though there were no campaigns on
recycling, it might be assumed that respondents obtained information through 100 posters set
out and 200 brochures distributed to the local community through the Local Environmental
Action Plan (LEAP) project (EcoPlan, Grad Mostar, 2006). The project covered several
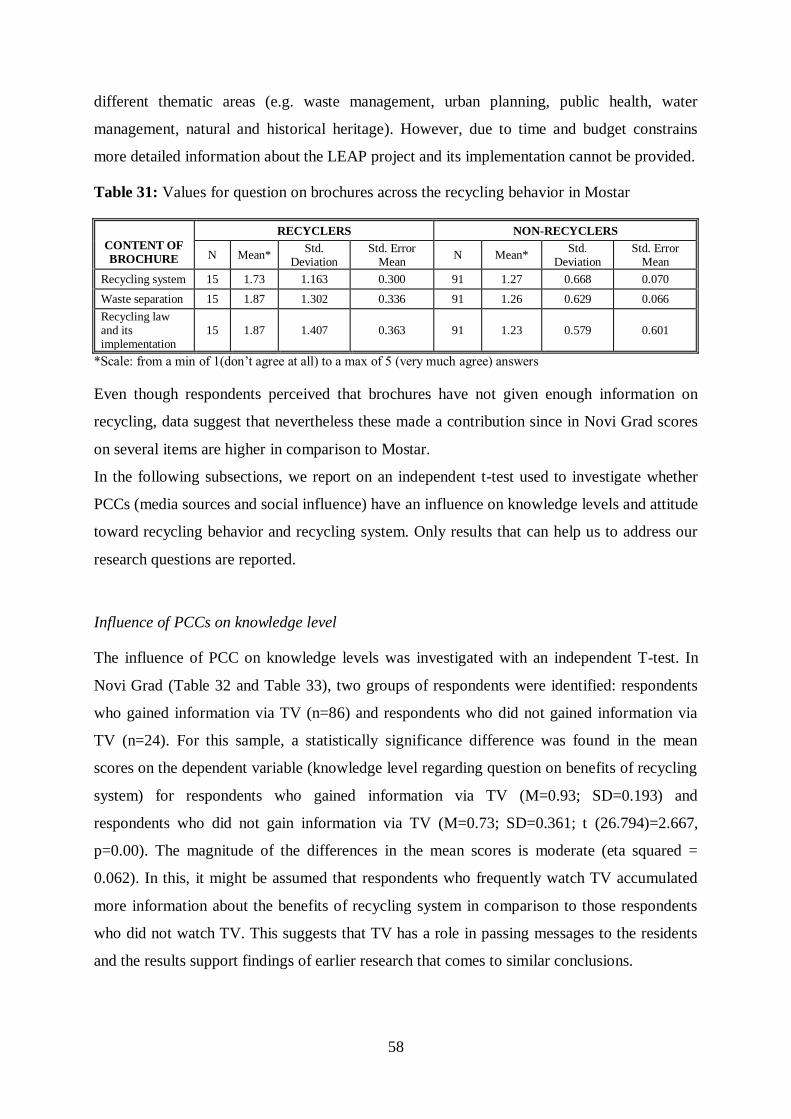
58
different thematic areas (e.g. waste management, urban planning, public health, water
management, natural and historical heritage). However, due to time and budget constrains
more detailed information about the LEAP project and its implementation cannot be provided.
Table 31: Values for question on brochures across the recycling behavior in Mostar
CONTENT OF
BROCHURE
RECYCLERS NON-RECYCLERS
N Mean* Std.
Deviation Std. Error
Mean N Mean*
Std. Deviation
Std. Error Mean
Recycling system 15 1.73 1.163 0.300 91 1.27 0.668 0.070
Waste separation 15 1.87 1.302 0.336 91 1.26 0.629 0.066
Recycling law and its implementation
15 1.87 1.407 0.363 91 1.23 0.579 0.601
*Scale: from a min of 1(don’t agree at all) to a max of 5 (very much agree) answers
Even though respondents perceived that brochures have not given enough information on
recycling, data suggest that nevertheless these made a contribution since in Novi Grad scores
on several items are higher in comparison to Mostar.
In the following subsections, we report on an independent t-test used to investigate whether
PCCs (media sources and social influence) have an influence on knowledge levels and attitude
toward recycling behavior and recycling system. Only results that can help us to address our
research questions are reported.
Influence of PCCs on knowledge level
The influence of PCC on knowledge levels was investigated with an independent T-test. In
Novi Grad (Table 32 and Table 33), two groups of respondents were identified: respondents
who gained information via TV (n=86) and respondents who did not gained information via
TV (n=24). For this sample, a statistically significance difference was found in the mean
scores on the dependent variable (knowledge level regarding question on benefits of recycling
system) for respondents who gained information via TV (M=0.93; SD=0.193) and
respondents who did not gain information via TV (M=0.73; SD=0.361; t (26.794)=2.667,
p=0.00). The magnitude of the differences in the mean scores is moderate (eta squared =
0.062). In this, it might be assumed that respondents who frequently watch TV accumulated
more information about the benefits of recycling system in comparison to those respondents
who did not watch TV. This suggests that TV has a role in passing messages to the residents
and the results support findings of earlier research that comes to similar conclusions.

59
Table 32: Mean value on knowledge through media source (TV) in Novi Grad
Knowledge about
benefits of
recycling system
Information gained via
TV N Mean* Std. Deviation Std. Error Mean
Those who gained info 86 0.93 0.193 0.021
Those who did not gain info
24 0.73 0.361 0.074
Table 33: T-test for knowledge on benefits of recycling system through TV in Novi Grad
Levene's Test
for Equality
of Variances
t-test for Equality of Means
F. Sig. t Df
Sig.
(2-tailed)
Mean Difference
Std.Error Difference
95% Confidence Interval of the
Difference
Lower Upper
Equal variances
assumed 23.63 0.00 3.697 108 0.000 0.204 0.055 0.095 0.313
Equal variance not assumed
2 0 2.667 26.794 0.013 0.204 0.076 0.047 0.361
However, in the Mostar sample, no statistically difference was found in the mean scores of the
dependent variable (knowledge level) and independent variable (PCCs in terms of media
sources and social influence).
In relation to attitudes
An independent t-test is used to verify the influence that independent variable (PCCs
including media sources and social influence) had on the dependent variable (attitudes
towards recycling) in both cases. In Novi Grad, no statistically difference was found in the
mean scores of these two variables.
In Mostar (Table 34 and Table 35), a statistically significance difference is found in the mean
scores on the dependent variable (attitude toward statement “waste separation keeps the
environment clean”) for respondents who gained this information via internet (M=4.48;
SD=0.840) and respondents who did not gain this information via internet (M=4.04;
SD=1.122; t(81.864)=2.225, p=0.00). The magnitude of the differences in the means was
small (eta squared = 0.045). The finding from qualitative data suggest that respondents
expressed their personal interest in environmental protection and it might be assumed that
they developed attitudes by reading materials on waste separation and contribution to
environmental protection through web sites on the internet.

60
Table 34: Mean value on attitude through media source (internet) in Mostar
Attitude toward
waste separation
which keeps the
environment clean
Information gained
via internet N Mean* Std. Deviation Std. Error Mean
Those who gained info 63 4.48 0.840 0.106
Those who did not gain info
43 4.04 1.122 0.164
*Scale: from a min of 1(don’t agree at all) to a max of 5 (very much agree) answers
Table 35: T-test for attitude on waste separation via internet in Mostar
Levene's Test for Equality
of Variances
t-test for Equality of Means
F. Sig. t Df
Sig.
(2-tailed)
Mean Difference
Std.
Error Difference
95% Confidence Interval of the
Difference
Lower Upper
Equal variances
assumed 8.200
0.00 2.319 104 0.022 0.434 0.187 0.063 0.804
Equal variance not assumed
5 2.225 81.864 0.029 0.434 0.195 0.046 0.821
To conclude, we found that TV and newspapers followed by Internet are the media sources
from which respondents gain information most frequently. On the other hand it seems that the
content of brochures has not been picked up very much by the Novi Grad respondents.
When we talk about social influence, this study finds that friends and family members as well
as school had an influence. For instance, in Novi Grad, a relationship was found between the
following compound variables: recycling behavior and social influence while in Mostar
respondents report of having obtained information from neighbors. Similarly, also Vining and
Ebreo (1990) reported that respondents turn to friends for obtaining information on
environmental protection. Generally speaking we can conclude that in both cases media
sources contributed more to disseminate information about the recycling system in
comparison to social influence.
In terms of knowledge levels we found that some media sources i.e. TV has an influence in
Novi Grad, while in Mostar no significant results were found. These results suggest that
television programs should continue and effectively inform the public about recycling. Along
with this, education is also needed for ordinary people in developing countries such as BiH in
order to engage in environmental actions and to develop environmental ethics. De Feo and De
Gisi (2010) found that knowledge levels are improved by TV, by reading newspapers and
using the Internet.
61
In terms of attitudes, results suggest that PCCs’ had an influence on respondents’ attitudes
toward recycling behavior. In Mostar this is in regard to the Internet while in Novi Grad no
significant results were found.
Sudarmadi et al. (2001) suggest that environmental education and qualitative promotion and
publicity, i.e. public communication campaigns, are important aspects to be considered with
regard to environmental protection and the promotion of recycling. Environmental education
is an effective strategy that could help to increase the environmental knowledge the public has
and can contribute to the formation of specific attitudes towards recycling. Education and
PCCs are essential for the success of any recycling scheme (Evison and Read, 2001).
62
6 CONCLUSION
6.1 Introduction
The research reported in this thesis centered on recycling behavior. This thesis has aimed to
investigate positive and negative factors that influence recycling behavior at the household
level and has focused on two cases (municipalities) located in FBiH, Novi Grad and Mostar.
In the following a summary of the research outcomes for each of the initially stated objectives
is provided as well as general conclusions and remarks of recycling behavior’s significance.
Research objective #1: To identify what motivational factors support recycling behavior.
Based on qualitative data, two groups of motivational factors were identified in both cases:
intrinsic (general and personal satisfaction toward waste separation in contribution to
environmental protection) and extrinsic (presence of PCCs, rewards, sanctions, recycling
infrastructure – containers and pay-back centers and social influence). In this, this study finds
a stronger presence of intrinsic motivational factors in the Novi Grad sample when compared
to the Mostar sample. Extrinsic motivational factors are present in both cases. Motivational
factors were further investigated with a questionnaire and results suggest that recyclers and
non recyclers were/would be motivated the most by having better recycling infrastructure (e.g.
containers and pay-back centers).
Research objective #2: To identify concerns that the local community has in terms of
adopting recycling behavior. Interview data helped to identify that in Novi Grad there is a
poor understanding of economic opportunities for recycling among local authorities; that
respondents are concerned about plastic waste and about the insufficient number of
containers. In Mostar respondents expressed concerns regarding poor collaboration and
communication between the two utility companies, and regarding improper behavior i.e.
actions among residents which littered public green areas.
Research objective #3: To assess current attitudes toward recycling behavior. Quantitative
data helped to map out the positive and negative attitudes toward recycling system. In Novi
Grad respondents reported a positive attitude toward KJKP Rad and its dynamic role, its very
good performance in introducing the recycling practice and good collaboration with the
canton and municipality. In Mostar, respondents pointed to the ethnically based division
between the two utility companies which, according to the collected evidence, seems to hinder
proper waste management and the introduction of recycling practice. Quantitative data
allowed a further investigation of attitudes and a significant correlation between recycling
behavior and attitudes was found in both samples. Quantitative data helped to identify that

63
respondents in both cases have a personal satisfaction for waste separation which is aligned to
environmental protection.
Research objective #4: To assess the influence of knowledge levels, respondents have, on the
recycling behavior. Quantitative data indicates that respondents have good knowledge levels
about the recyclability of paper, glass and wood (recyclable materials), but also they are less
knowledgeable about the recyclability of batteries, medical waste and chemical liquids (not
recyclable). Aspects about disposal and degradation of recycling materials are also less known
among respondents. Knowledge about other aspects e.g. benefits of the recycling system and
composting is present in both cases. However, quantitative data collected for this thesis does
not support the assumption that knowledge influences recycling behavior and this applies to
both empirical cases.
Research objective #5: To identify whether locally available public communication
campaigns have an influence on knowledge, and on attitudes people have towards recycling.
First we looked at PCCs, specifically at media sources and social influence. Regarding media
sources, TV and newspapers, along with Internet, scored the highest and are reported to be the
main source of information about recycling. Regarding social influence, respondents indicate
that friends and family members as well as schools are the main sources of information.
Quantitative data collected for this thesis suggest that PCCs have an influence on knowledge.
A significant correlation between PCCs (TV) and knowledge (regarding benefits of recycling
system) was found for the Novi Grad sample. In other words, it seems that the TV had an
influence on the level of knowledge respondents have about the benefits of the recycling
system. In Mostar no significant correlation was found. In terms of attitudes, no significant
correlation was found between PCCs and attitude in Novi Grad; however in Mostar we found
a significant correlation between PCCs (Internet) and attitude (i.e. “waste separation keeps
the environment clean”).
To conclude, two cases are differentiated from each other in several segments. For instance,
there was a consequence from civil war (Mostar, left as an ethnically divided municipality
while Novi Grad as not divided). This also reflected the performance of utility companies in
both cases which have different approaches toward waste management including recycling.
The ethnical division hindered proper waste management and introduction of recycling
practice in Mostar while Novi Grad did not have this connotation but rather a poor
understanding towards the economic opportunities of recycling. It is clear that TV is among
the most influential media source which can be useful when designing public campaigns and
delivering important messages to the residents. Also, the engagement of friends and family

64
members in recycling can provide a significant support to others. The common aspect for both
cases is respondents’ care for environmental protection and a good will to start/continue
recycling in their communities. Also, continuous educational programs can be beneficial in
order to enhance respondents’ recycling behavior.
This research provides several significant outcomes. First, recycling behavior has one of the
major roles in recycling and should be considered in contextualized policy measures. Second,
factors assessed in this thesis that influence recycling behavior should incorporated when
developing recycling programs. Third, results got from qualitative and quantitative analysis of
data are encouraging. The last, there is a potential, in both cases, to start with recycling and
reduce the amount of waste sent to the landfill. Along with recycling, public communication
campaigns can have a role in educating residents and giving them an opportunity to be
engaged in recycling. This can have a positive outcome for the community but also for their
environment.
6.2 Limitations of the thesis
Limitations of this thesis can be found in the empirical sections of this research. The research
relied on respondents’ self-reported answers to a questionnaire (e.g. knowledge, PCCs,
concerns, attitudes and motivations). Self-reported questionnaires might not provide a precise
representation of the variable, which on the other hand could be achieved by integrating other
research methods (i.e. observation, taking pictures, and other statistical tests). Due to resource
limitations (budget and time) both samples are of a small size and hence generalization to the
whole population is not possible. Also, resource limitation did not allow the integration of
other data collection methods e.g. focus groups. The empirical part of this research took place
in a complex geographical context and the choice was to focus on some aspects. It is
recognized that for instance, attitude is a multifaceted phenomena influenced by a number of
factors, yet this thesis could not consider the social, economic, psychological and cultural
elements in greater detail. Waste managment at the houshold level in FBiH turned out to be a
complex issue about which little research has been conducted. This thesis could focus on
some aspects of interest. However, the research conducted for this thesis could secure all
answers, because of time and resource constrains. Yet this thesis point to a number of issues
and areas of interest that future research may explore.
65
REFERENCES
Aberg, H., Dahlmann, S., Shanahan, H., Säljö, R . 1996. Towards Sound Environmental
Behavior: Exploring Household Participation in Waste Management. Journal of Consumer
Policy 19 (1). 45-67.
Arul, M.J. 2001. Teaching notes. Attitude: Its Nature, Development and Change. Teaching
notes. Web site: http://www.geocities.com/Athens/5503/intro.html , accessed Jan 27th, 2009.
Baldassare, M., Katz, C. 1992. The Personal Threat of Environmental Problems as Predictor
of Environmental Practices. Environment and Behavior 24 (5). 602-616.
Banerjee, S.B. 2002. Corporate environmentalism the construct and its measurement. Journal
of Business Reserach 55. 177-191.
Barr, S. 2007. Factors Influencing Environmental Attitudes and Behaviors: A U.K. Case
Study of Household Waste Management. Environment and Behavior 39 (4). 435-473.
Barr, S., Gilg A.W., Ford, N.J. 2001. Differences Between Household Waste Reduction,
Reuse and Recycling Behaviour: a Study of Reported Behaviours, Intentions and Explanatory
Variables. Environmental & Waste Management 4 (2). 69-82.
Barr, S., Gilg, A. 2006. Sustainable lifestyles: Framing environmental action in and around
the home. Geoforum 37 (6). 906-920.
Becic, A. 2010. Grad osigurao dvije plaće za djelatnike. Dnevni list, 2010. Website:
http://www.dnevni-list.ba/index.php?option=com_content&view=article&id=14182:grad-
osigurao-dvije-plae-za-djelatnike&catid=2:mostar&Itemid=3, accessed Dec 18th
, 2010.
Berenguer, J., Corraliza, J.A., Martín, R. 2005. Rural-Urban Differences in Environmental
Concern, Attitudes, and Actions. European Journal of Psychological Assessment 21 (2). 128–
138.
Burn, S.M., Oskamp, S. 1986. Increasing Community Recycling with Persuasive
Communication and Public Commitment. Journal of Applied Social Psychology 16 (1). 29-
41.
Calò, F, Parise, M. 2009. Waste management and problems of groundwater pollution in karst
environments in the context of a post-conflict scenario: The case of Mostar (Bosnia
Herzegovina). Habitat International 33 (1). 63-72.
Carrus, G., Passafaro, P., Bonnes, M. 2008. Emotions, habits and rational choices in
ecological behaviors: The case of recycling and use of public transportation. Journal of
Environmental Psychology 28. 51–62.
66
Chan, K. 1998. Mass communication and pro-environmental behavior: waste recycling in
Hong Kong. Journal of Environmental Management 52 (4). 317-325.
Commission for Reforming the City of Mostar. 2003. Recommendations of the Commission
Report of the Chairman. Official Gazette of the City of Mostar.
Commission of the European Communities. Bosnia and Herzegovina 2009 Progress Report.
Brussels 2009.
De Feo G, De Gisi D. 2010. Public opinion and awareness towards MSW and separate
collection programs: A sociological procedure for selecting areas and citizens with a low level
of knowledge. Waste Management 30(6). 958 – 976.
De Young, R. 1986. Some Psychological Aspects of Recycling: The Structure of
Conservation – Satisfactions. Environment and Behavior 18 (4). 435-449.
De Young, R. 2000. Expanding and Evaluating Motives for Environmentally Responsible
Behavior. Journal of Social Issues 56 (3). 509–526.
DEFRA. 2001. Survey of Public Attitudes to Quality of Life and to the Environment. London,
UK.
Derksen, L., Gartrell, J. 1993. The Social Context of Recycling. American Sociological
Review 58 (3). 434-442.
Diamond, W.D., Loewy, B.Z. 1991. Effects of Probabilistic Rewards on Recycling Attitudes
and Behavior. Journal of Applied Social Psychology 21 (19). 1590-1607.
Đipa, A. 2005a. Dokazali na djelu da se bez njih ne može. Bilten Informativni glasnik KJKP
Rad 1. 8.
Đipa, A. 2005b. Realizovan projekt ekološke edukacije »Smanjimo i reciklirajmo«. Bilten
Informativni glasnik KJKP Rad 2. 8-9.
Đipa, A. 2006a. Međunarodna obuka o upravljanju krutim otpadom za zemlje Jugoistočne
Evrope. Bilten Informativni glasnik KJKP Rad 4. 5-7.
Đipa, A. 2006b. Počela edukacija za ISO 14000. Bilten Informativni glasnik KJKP Rad 5. 11.
Đipa, A. 2006c. Program obuke prodavača javnih nabavki u Bosni i Hercegovini. Bilten
Informativni glasnik KJKP Rad 5. 10.
Do Valle, O.P., Reis, E., Menezes, J., Rebelo, E. 2004. Behavioral determinants of household
recycling participation: The Portuguese Case. Environment and Behavior 36 (4). 505-540.
Dunlap, R., Van Liere, K. 1978. The New Environmental Paradigm. Journal of Environmental
Education 9. 10–19.

67
Dwyer, W.O., Leeming, F.C., Cobern, M.K., Porter, B.E., Jackson, J.M. 1993. Critical
Review of Behavioral Interventions to Preserve the Environment: Research Since 1980.
Environment and Behavior 25 (3). 275 – 321.
Ebreo, A., Vining, J. 2000. Motives as predictors of the public's attitudes toward solid waste
issues. Environmental Management 25 (2). 153-168.
Ecoplan, Grad Mostar. 2006. Izrada lokalno ekološkog akcionog plana (LEAP) grada
Mostara. 1-87.
European Bank. 2007. Strategy for Bosnia and Herzegovina. Document of the European Bank
for reconstruction and development.
European Commission. 2004. Waste Recycling Pilot Project in Bosnia and Herzegovina
Waste Recycling Handbook. 1-80.
European Environmental Agency. Municipal waste generation per capita. Website:
http://www.eea.europa.eu/data-and-maps/figures/municipal-waste-generation-per-capita-in-
western-europe-eu-15-new-member-states-eu-12-eu-countries-eu-27-and-total-in-europe-eu-
27-turkey-croatia-norway-iceland-switzerland-3, accessed 10th August, 2011.
Evison, T., Read, A.D. 2001. Local Authority recycling and waste – awareness
publicity/promotion. Resources, Conservation and Recycling 32. 275-291.
Fahy, F. (2005). The right to refuse: Public attitudes and behavior towards waste in the west
of Ireland. Local Environment 10 (6). 551–569.
Federal ministry of environment and tourism. 2010. State of Environment in the Federation of
Bosnia and Herzegovina. ISBN 978-9958-9089-9-6.
Federal ministry of environment and tourism. 2011. Fedral Plan for Waste Management 2011
- 2016.
Federalno ministarstvo okoliša i turizma. 2010. Strategija Zaštite Okoliša Federacije Bosne i
Hercegovine 2008-2018.
Federal Office of Statistics. 2011. Kanton Sarajevo u brojakama. Website:
http://www.fzs.ba/Podaci/09.pdf , accessed 19th November, 2011.
Federal Office of Statistics, 2011. Hercegovačko-neretvanski kanton u brojkama. Website:
http://www.fzs.ba/Podaci/07.pdf , accessed 19th November, 2011.
Field, A. 2005. Discovering Statistics Using SPSS. Sage Publications: London.
Fishbein, M., Ajzen, I. 1975. Belief, Attitude, Intention and Behavior: An Introduction to
Theory and Research (Reading: Addison-Wesley).
Fransson, N., Gärling, T. 1999. Environmental concern: Conceptual definitions, measurement
methods, and research findings. Journal of Environmental Psychology 19. 369-382.
68
Friends of the Earth. 2008. Recycling: why it’s important and how to do it. 1-14.
Gakovic, S. Ništa od zajedničkog komunalnog preduzeća u Mostaru. Irib World Service,
2010.Website:http://bosnian.irib.ir/analize/izvietaji/item/90885-sanela-gakovi%C4%87-
ni%C5%A1ta-od-zajedni%C4%8Dkog-komunalnog-preduze%C4%87a-u- mostaru, accessed
Dec 20th, 2010.
Gamba, R.J., Oskamp, S. 1994. Factors Influencing Community Residents' Participation in
Commingled Curbside Recycling Programs. Environment and Behavior 26 (5). 587-612.
Gonzalez-Torre, P.L., Adenso-Dıaz, B. 2005. Influence of distance on the motivation and
frequency of household recycling. Waste Management 25. 15–23.
Gray, D.E. 2004. Doing research in the real world. 1st edition. Sage Publication: London.
Grob, A. 1995. A Structural model of environmental attitudes and behaviors. Journal of
Environmental Psychology 15. 209-220.
Grodzinska-Jurczak, M., Tarabula, M., Read, A.D. 2003. Increasing participation in rational
municipal waste management:/a case study analysis in Jaslo City (Poland). Resources,
Conservation and Recycling 38. 67-/88.
Guagnano, G.A., Stern, P.C., Dietz, T. 1995. Influences on Attitude-Behavior Relationships:
A Natural Experiment with Curbside Recycling. Environment and Behavior 27 (5). 699-718.
Hadden, S.G. 1991. Public perception of hazardous waste. Risk Analysis 11 (1). 47-57.
Hopper, J.R., Nielsen, J.M. 1991. Recycling as Altruistic Behavior: Normative and
Behavioral Strategies to Expand Participation in a Community Recycling Program.
Environment and Behavior 23 (2). 195-220.
Hornik, J., Cherian, J. 1995. Determinants of Recycling Behavior: A Synthesis of Research
Results. Journal of Socio-Economics 24 (1). 1-24.
Howenstine, E. 1993. Market Segmentation for Recycling. Environment and Behavior 25 (1).
86-102.
Hungerford, H.R., Volk, T.L. 1990. Changing Learner Behavior Through Environmental
Education. Journal of Environmental Education. 8 – 21.
International Crisis Group. 2009. Bosnia: A Test of Political Maturity in Mostar. Crisis Group
Europe Briefing 54. 1-14.
Jeffrey, A. 2006. Building state capacity in post-conflict Bosnia and Herzegovina: The case of
Brcko District. Political Geography 25 (2). 203-227.
Kantonalno ministarstvo prostornog uređenja i zaštite okoliša. Informacija o upravljanju
otpadom u Kantonu Sarajevo. 2009. 1-25.
69
Katzev, R., Blake, G., Messer, B. 1993. Determinants of Participation in Multi-Family
Recycling Programs. Journal of Applied Social Psychology 23 (5). 374-385.
Cantonal Environmental Action Plan - KEAP (Kantonalni Okolišni Akcioni Plan). 2010.
Kanton Sarajevo. 1-132.
Klemencic M., Schofield C. 1996. Mostar: make or break for the federation? Boundary and
Security Bulletin 4 (2). 72-76.
Knussen, C., Yule, F., MacKenzie, J., Well, M. 2004. An analysis of intentions to recycle
household waste: The roles of past behavior, perceived habit, and perceived lack of facilities.
Journal of Environmental Psychology 24. 237–246.
Lee, Y-J., De Young, R., Marans, R.W. 1995. Factors influencing individual recycling
behavior in office settings: A Study of Office Workers in Taiwan. Environment and Behavior
27 (3). 380-403.
Li, S. (2003). Recycling Behavior Under China’s Social and Economic Transition: The Case
of Metropolitan Wuhan. Environment and Behavior 35 (6). 784-801.
Lindén, A. L., Carlsson-Kanyama, A. 2003. Environmentally Friendly Disposal Behavior and
Local Support Systems: lessons from a metropolitan area. Local Environment 8 (3). 291-301.
Luyben, P.D., Bailey, J.S. 1979. Newspaper Recycling: The Effects of Rewards and
Proximity of Containers. Environment and Behavior 11 (4). 539 – 557.
Martin, M., Williams, I.D., Clark, M. 2006. Social, cultural and structural influences on
household waste recycling: A case study. Resources, Conservation and Recycling 48. 357–
395.
Martinez, M.D., Scicchitano, M.J. 1998. Who Listens to Trash Talk? Education and Public
Media Effect on Recycling Behavior. Social Science Quaterly 79 (2). 288-300.
McDonald, S., Ball, R. 1998. Public participation in plastics recycling schemes. Resources,
Conservation and Recycling 22. 123–141.
McDonald, S., Oates, C. 2003. Reasons for non-participation in a kerbside recycling scheme.
Resources, Conservation and Recycling 39. 369-385.
Medic, M. Mostar se ponovo gusi u smecu, Parkovi i dalje u strajku. Vecernji, 2010. Website:
http://www.vecernji.ba/vijesti/mostar-se-ponovo-gusi-smecu-parkovi-dalje-strajku-clanak-
233792, accessed Dec 19th, 2010.
Meneses, G.D., Palacio, A.B. 2005. Recycling Behavior: A Multidimensional Approach.
Environment and Behavior 37 (6). 837-860.
Ministarstvo trgovine, turizma i zaštite okoliša. 2010. Plan upravljanja otpadom
Hercegovačko-neretvanskog kantona/županije 2011-2021.
70
Minton, A.P., Rose, R.L. 1997. The Effect of Environmental Concern on Environmentally
Friendly Consumer Behavior: An Exploratory Study. Journal of Business Research 40. 37-48.
MORI. 2002. Public Attitudes Towards Recycling and Waste Management Quantitative and
Qualitative Review. The Strategy Unit, Cabinet Office, London, UK.
National Environmental Action Plan – NEAP. Bosnia and Herzegovina. 2003. 1-131.
Nixon, H., Saphores, J-D.M. 2009. Information and the decision to recycle: results from a
survey of US households. Journal of Environmental Planning and Management 52 (2). 257–
277.
Ojala, M. 2008. Recycling and Ambivalence: Quantitative and Qualitative Analyses of
Household Recycling Among Young Adults. Environment and Behavior 40. 777-797.
Oom Do Valle, P., Rebelo, E., Reis, E., Menezes, J. 2005. Combining Behavioral Theories to
Predict Recycling Involvement. Environment and Behavior 37 (3). 364-396.
Oskamp, S., Harrington, M.J., Edwards, T.C., Sherwood, D.L., Okuda, S.M., Swanson, D.C.
1991. Factors influencing household recycling behavior. Environment and Behavior 23 (4).
494-519.
Pallant, J. 2005. SPSS Survival Manual. Open University Press, Berkshire.
Palmer, J.A., Suggate, J. 1996. Infleunces and Experiances Affecting the Pro-environmental
Behavior of Educators. Environmental Education Research 2 (1). 109-121.
Panjeta, A. 2006. Od napasti do koristi. Fondeko 20. 54-55.
Parliamentary Office of Science and Technology. 2005. Recycling household waste. Postnote
252. 1-4.
Perrin, D., Barton, J. 2001. Issues associated with transforming household attitudes and
opinions into materials recovery: a review of two kerbside recycling schemes. Resources,
Conservation and Recycling 33. 61–74.
Pieters, R.G.M. 1991. Changing Garbage Disposal Patterns of Consumers: Motivation,
Ability, and Performance. Journal of Public Policy & Marketing 10 (2). 59-76.
Read, A.D. 1997b. Knocking on doors to boost recycling, Recycling World, 21. Website:
http://www.wastewatch.org.uk, accessed June 10th, 2010.
Refsgaard, K., Magnussen, K. 2009. Household behavior and attitudes with respect to
recycling food waste - experiences from focus groups. Journal of Environmental Management
90. 760-771.
Reid, D.H., Luyben, P.D., Rawers, R.J., Bailey, J.S. 1976. Newspaper Recycling Behavior:
The Effects of Prompting and Proximity of Containers. Environment and Behavior 8 (3). 471-
482.

71
Rujnić-Sokele, M., Šercer, M., Pilipović, A. 2008. PET bottles recycling waste – utilization
and properties. Archives of Materials Science 29 (1-2). 68-72.
Seacat, J.D., Northrup, D. 2010. An information-motivation-behavioral skills assessment of
curbside recycling behavior. Journal of Environmental Psychology. 1-9.
Shekdar, A.V. 1999. Municipal solid waste management – the Indian perspective. Journal of
Indian association for environmental management 26(2). 100-108.
Sidique, S.F., Lupi, F., Joshi, S.V. 2010. The effects of behavior and attitudes on drop-off
recycling activities. Resources, Conservation and Recycling 54. 163-170.
Smajkic M. 2010. U Mostaru nadlezno pet preduzeca, a haos u odvozu smeca. Dnevni avaz.
European Banksite:
http://www.dnevni-avaz.ba/feed/dogadjaji/panorame/18652-mostar_nadlezni_smece_haos.txt,
accessed Dec 19th, 2010.
Smith, B.J., Ferguson, C., McKenzie, J., Bauman, A., Vita, P. 2002. Impacts from repeated
mass media campaigns to promote sun protection in Australia. Health Promotion
International. 51 – 60.
Stern, P.C. 1992. Psychological Dimensions of Global Environmental Change. Annual
Review Psychology 43. 269-302.
Stern, P.C., Dietz, T., Kalof, L. 1993. Value Orientations, Gender and Environmental
Concern. Environment and Behavior 25 (23). 322-348.
Stoykova, I. 2006. Zero waste as a Best Environmental Practice to address the POPs issues
created by waste incineration and/or landfilling of waste - Case Study from Sofia, Bulgaria.
International POPs Elimination Project, Romani Baht Foundation. 1-20.
Sudarmadi, S., Suzuki, S., Kawada, T., Netti, H., Soemantri, S., Tugaswati, A.T. 2001. A
Survey of Perception, Knowledge. Awareness, and Attitude in Regard to Environmental
Problems in a Sample of Two Different Social Groups in Jakarta, Indonesia. Environment,
development and sustainability 3(2). 169-183.
Thomas, C. 2001. Public understanding and its effect on recycling performance in Hampshire
and Milton Keynes. Resources, Conservation and Recycling 32. 259–274.
Thomas, C., Yoxon, M., Slater R., Leaman, J. 2004. Changing Recycling Behavior: An
Evaluation of Attitudes and Behavior to Recycling in the Western Riverside Area of London.
Waste 2004 Integrated Waste Management and Pollution Control Conference, London, UK.
Tietenberg, T. H. 1994. Environmental economics and policy. New York: Harper Collins.

72
Timlett, R.E., Williams, I.D. 2008. Public participation and recycling performance in
England: A comparison of tools for behavior change. Resources, Conservation and Recycling
52 (4). 622-634.
Tucker, P. 2003. Understanding Recycling Behavior Volume 2: A Technical Monograph.
ISBN 1-903978-16-5.
United Nations Economic Commission for Europe. 2011. Environmental performance
reviews, Second review. ECE/CEP/162, ISSN: 1020-4563.
Vining, J., Ebreo, A. 1990. What Makes a Recycler? A Comparison of Recyclers and
Nonrecyclers. Environment and Behavior 22 (1). 55-73.
Vining, J., Ebreo, A. 1992. Predicting Recycling Behavior from Global and Specific
Environmental Attitudes and Changes in Recycling Opportunities. Journal of Applied Social
Psychology 22 (20). 1580-1607.
Vining, J., Linn, N., Burdge, R.J. 1992. Why Recycle? A Comparison of Recycling
Motivations in Four Communities. Environmental Management 16 (6). 785-797.
Williams, I.D., Kelly, J. 2003. Green waste collection and the public’s recycling behavior in
the Borough of Wyre, England. Resources, Conservation and Recycling 38. 139-159.
Wilson DC, Araba AO, Chinwah K, Cheeseman CR. 2009. Building recycling rates through
the informal sector. Waste Manage 29. 629 – 635.
Wilson, C.D.H., Williams, I.D. 2007. Kerbside collection: A case study from the north-west
of England. Resources, Conservation and Recycling 52. 381–394.
World Bank. 2008. Bosnia and Herzegovina Solid Waste Management Project II
Environmental Framework and Management Plan. E1839.
Yin, R. K. 2003. Case Study Research: design and methods. Sage Publications, London.

73
ACKNOWLEDGMENT
I would like to thank my advisor Dr. Romina Rodela and reviewers for their guidance,
comments and suggestions for this thesis.
I would like to thank the Laboratory of Environmental Research at the University of Nova
Gorica, Slovenia from which this thesis has been benefited and supported.
Particular thanks are extended to all respondents in two case studies of Federation of Bosnia
and Herzegovina who kindly agreed to participate in the interviews and the questionnaires.
And finally, special thanks to my family and friends for all their patience, help and support.


75
APPENDIX Ia
List of questions for all respondent groups except for respondent group, residents
1. What is the major environmental issue that municipality has?
2. How much is necessary for the municipality to adopt recycling and try to minimize the waste?
3. Do you think that schools, universities and institutions pay sufficient attention to this issue?
4. In your opinion which are the structural barriers for recycling to succeed in this municipality?
5. Do you think that rural emigrants have a different approach to waste as compared to the urban residents?
6. Do you think that before the civil war, people were recycling more and were more concerned about the environment?
7. Which institutional factors are needed in order to influence people's behavior to recycle?
8. What are the institutional barriers for recycling?
9. Do you think that many activities and campaigns have been done and exposed to people that it is now expected from them to start
recycling? Can you name some, or direct me to the organizers or promoters?
10. Do you think that the quota of recycled waste is high in this municipality? If yes, do you have some data on this? If not, why?
11. Do you think there is a miscommunication between people who separate waste and collectors who put the garbage to the truck, and
between collectors and workers at the landfill?
12. Which incentives should be set up for people to improve recycling?
13. What is the current waste management policy of FBiH?
14. How are responsibilities in waste management distributed in FBiH? And in this canton?
15. What methods are used for processing waste?
16. Is there a sufficient storage place on current landfill for the following years?
17. Do the waste management authorities have the necessary infrastructure and specialized personnel for carrying out this activity?
18. In order to have a successful recycling, do you think it necessary to have a separate and unique law on recycling? Would it make any
difference? Why yes, why not?
19. Do you think recycling should be optional or required by the institutions?


77
APPENDIX Ib
List of questions for the respondent group, residents
1. What are your major concerns about waste in your community?
2. Does it bother you when you see litter on the street or in the park? Why?
3. Are you concerned when you see mix of recyclable materials in containers that are supposed to be separated such as paper, glass or
plastic?
4. Do you recycle? If not, what is your reason for not recycling? If yes, what materials do you recycle and what do you do with them?
5. Would you feel bad if your neighbor recycles and you don't? Or maybe if you would read or hear by campaigns?
6. Do you think if you start recycling it would influence others to start recycling?
7. Do you think people should recycle? Why?
8. Do you think that people should be punished (by monetary penalty) for not recycling or throwing the litter on the street or in the park?
9. Do you think recycling should be optional, or required by the law?
10. Do you ever think about these things, for instance: that 1 plastic bag can be reused few times when you go for a shopping or that 1 glass
jar can be reused for filling it with other ingredients in the kitchen?
11. Do you ever think about where does all waste we produce and throw in the containers go and how long will landfill accept our waste? Are
there going to be any other options for landfilling or minimizing the waste?
12. What would be the first initiator or motivation for you to start recycling?
13. Do you think you have all necessary things to start recycling (e.g. place/storage, separated containers, practice...)?
14. Did you notice any new containers in your community for recycling?
15. In most countries, people are getting money back for some plastic and glass bottles, do you think FBiH should introduce a similar
approach/practice?
16. Do you have enough knowledge about recycling that you can start doing it now? If yes, where did you gain this knowledge?
17. Are you aware which materials are recyclable and which are not?
18. Who should be responsible for people's behavior in terms of recycling?
19. Have you ever heard, seen or read about waste management and recycling? If so, where have you heard, seen or read about?


79
APPENDIX II
Questionnaire
University of Nova Gorica, Slovenia www.ung.si
Please read carefully the following questions, circle your best response (1 to 5) or write down as indicated. The information will be
confidential and only used for the thesis research.
1. Do you separate your waste at home? (circle one option)
Yes No Don’t know
2. If not, can you please tell us why you don’t separate?
_______________________________________________
3. In my household, I dispose my waste:
Every day Once a week More than 2 times per week
4. How much the following motivates/would motivate you to separate your waste at home? (1 – not at all…5 – very much):
Establishment of pay-back centers 1 2 3 4 5
Presence of public campaigns (e.g. brochure) informing the population how to separate waste 1 2 3 4 5
Presence of sufficient containers and information labels for waste separation 1 2 3 4 5
Presence of eco inspection 1 2 3 4 5
Providence of financial economic rewards 1 2 3 4 5
Providence of non - financial economic rewards (e.g. discount in food shopping) 1 2 3 4 5
Presence of monetary penalty 1 2 3 4 5

80
5. .How much do the following issues concern you?
(1 – not at all…5 – very much):
Full (or overloaded) waste separated containers 1 2 3 4 5
Presence of odor, birds and insects in containers for waste separation 1 2 3 4 5
No containers for waste separation 1 2 3 4 5
No labels and info for waste separation 1 2 3 4 5
No place in my kitchen for waste separation 1 2 3 4 5
No eco inspection 1 2 3 4 5
No monetary penalty 1 2 3 4 5
6. How much do you agree with the following:
(1 – strongly disagree…5 – strongly agree)
I separate waste because it makes me feel good to do the right thing 1 2 3 4 5
I separate waste because it keeps the environment where I live clean 1 2 3 4 5
I separate waste because everybody else does it as well 1 2 3 4 5
I separate waste because it allows a reduction of the amount of mixed waste in my kitchen 1 2 3 4 5
7. How much do you agree with the following: (1 – strongly disagree…5 – strongly agree):
Waste separation takes a lot of time, effort and space 1 2 3 4 5
Waste separation causes messiness in my kitchen 1 2 3 4 5
For waste separation, one must know which waste goes to which container 1 2 3 4 5
8. Which are the following materials recyclable? Paper Yes No Don’t know
Glass Yes No Don’t know
Batteries Yes No Don’t know
Medical waste (tablets, drugs) Yes No Don’t know
Wood Yes No Don’t know
Chemical liquids Yes No Don’t know

81
9. Separation of organic waste (e.g. leaves, peelings from fruits and vegetables) from my mixed waste can be used as compost (e.g. a
fertilizer) at the farmland for gardens.
Yes No Don’t know
10. Which of the following needs to be done before disposing waste into separated containers:
Labels on plastic or glass containers should be removed Yes No Don’t know
Plastic or glass containers should be washed Yes No Don’t know
Lids from plastic or glass containers should be removed Yes No Don’t know
Cartons should be pressed/made flat Yes No Don’t know
Only clean paper should be disposed Yes No Don’t know
11. The recycling system includes:
(circle one option):
Waste separation at home Yes No Don’t know
Waste separation at landfill Yes No Don’t know
Manufacturing and producing new materials Yes No Don’t know
Reusing and producing new materials Yes No Don’t know
12. The recycling system helps to (circle one option): Conserve natural resources Yes No Don’t know
Reduce waste Yes No Don’t know
Save energy Yes No Don’t know
Reduce use of landfill Yes No Don’t know
13. From which of the following sources have you watched/heard/read and obtained information about the recycling system?
Television Yes No Don’t know
Newspapers Yes No Don’t know
Radio stations Yes No Don’t know
Magazines Yes No Don’t know
Internet Yes No Don’t know
Brochures Yes No Don’t know
Friends and family members Yes No Don’t know

82
Neighbors Yes No Don’t know
School Yes No Don’t know
University Yes No Don’t know
Waste company Yes No Don’t know
Other (which?) ______________________________________
*Please answer also question 17
14. Recycling paper helps to:
Pollute less water and air Yes No Don’t know
Save natural timber resources Yes No Don’t know
Save gasoline, electricity and water Yes No Don’t know
15. Which of the following is true?
It takes about 100 years for aluminum cans to degrade Yes No Don’t know
It takes about 1000 years for plastic bag to degrade Yes No Don’t know
Glass bottles are not degradable Yes No Don’t know
16. How much do you agree that the following actors have a key role in making the recycling system work?
Communal company for waste management 1 2 3 4 5
Retailers 1 2 3 4 5
Recycling facility 1 2 3 4 5
Households 1 2 3 4 5
Manufactures 1 2 3 4 5
17. How much do you agree with the following statements about brochures provided by the public campaigns?
(1 – strongly disagree…5 – strongly agree):
These have given enough information about the recycling system 1 2 3 4 5
These have given enough information about instructions how to separate waste 1 2 3 4 5
They have given enough information about the recycling system law and its implementation 1 2 3 4 5

83
Demographic data
Status of residency:
1. Always lived here
2. Moved from rural area ____________
3. Moved from urban area ___________
4. Other__________
Gender: 1. Male 2. Female
Year of birth:
Number of members in household:
Current work:
1. Small enterprise
2. Big enterprise
3. Government
4. NGO
2. Self-employed (private)
3. Other
Highest education level:
1. Secondary school
2. High school
3. Universi
ty degree
4. Higher level (M.Sc. or D.Ph.)